1. Introduction
Infections causing localized lesions in the body, e.g., osteomyelitis, cannot always be successfully treated by the systemic administration of antibiotics; instead, surgical intervention may be necessary, which requires knowledge of the site(s) of infection. Assuming the availability of a suitable tracer, positron emission tomography (PET) is well suited for the task. However, it has proven difficult to find a tracer with both high and specific uptake in infected tissue.
The current standard tracer used for PET imaging of infectious and inflammatory diseases is the fluorine-18 labelled glucose analogue 2-deoxy-2-[
18F]-fluoro-
d-glucose ([
18F]FDG) [
1]. Generally, [
18F]FDG shows high uptake in sites of infection and inflammation, but the uptake is not specific: [
18F]FDG accumulates in all cells that use glucose as an energy source, including not only activated immune cells but also rapidly proliferating cancer cells, brain tissue and working muscle tissue.
Leukocytes (white blood cells, WBC) are natural seekers of infection. Leukocytes labelled with
111In or
99mTc have been widely used for scintigraphy imaging of infection, but the labelling procedure is time consuming and requires withdrawing 30–40 mL of blood from the patient [
2]. A simpler alternative is anti-granulocyte monoclonal antibodies (anti-G-mAbs) labelled with
99mTc. However, while the isotopes
111In and
99mTc are suitable for gamma camera imaging, they cannot be used for PET imaging. This is a technical disadvantage, as the counting efficiency is typically an order of magnitude higher for the PET scanner than for the gamma camera, and the spatial resolution is superior. Labelling of leukocytes with [
18F]FDG for PET imaging has been investigated, but the labelling efficiency is lower, and [
18F]FDG elutes from the leukocytes over time [
3]. Furthermore, the molar activity of labelled leukocytes will be many orders of magnitude higher than in the patient as a whole, for which reason the short-range β
+ radiation (positrons before annihilation) can result in damaging self-irradiation to [
18F]FDG-labelled leukocytes [
4].
The relationship between time and physical decay must also be noted. Injected leukocytes take hours or more to accumulate at the infection site, and imaging can be performed 3–4 h after injection at the earliest [
2]. These delays are acceptable with
111In (T
½ = 2.8 days) and
99mTc (T
½ = 6 h), but in relation to PET imaging, the shorter physical half-lives of the two most widely used isotopes,
18F (T
½ = 110 min) and
68Ga (T
½ = 68 min), make long uptake times problematic.
Instead of labelled leukocytes, a tracer directly related to the processes causing leukocyte accumulation in infected tissues is being sought. Such a tracer would potentially enable faster imaging, and at the same time, the handling of blood products from the patient would be avoided. A relevant target molecule is vascular adhesion protein 1 (VAP-1), currently known as a primary amine oxidase (AOC3, EC 1.4.3.21), which is acting both as an adhesion molecule and as a regulatory enzyme in the process of leukocyte binding to the endothelium of blood vessels in infected and inflamed tissue [
5,
6]. Under normal conditions, VAP-1 is stored in intracellular granules. Upon an inflammatory stimulus, VAP-1 is rapidly translocated to the endothelial cell surface, where it is readily accessible to intravenously administered PET ligands.
As reviewed in [
7],
68Ga-labelled synthetic peptides that bind to VAP-1 have been investigated in different experimental infection and inflammation models, and some have shown a better distinction than [
18F]FDG between cancer and inflammation. Overall, the review considers VAP-1 to be an optimal target for imaging of inflammation. One of the reviewed tracers, [
68Ga]Ga-DOTA-Siglec-9, is currently in a phase I clinical trial (trial no. NCT03755245).
It may be noted that VAP-1 imaging will not distinguish between infection and inflammation, but because VAP-1 is involved in leukocyte extravasation, it is directly linked to the body’s natural response to infection. Imaging of VAP-1 expression may even be used to study this process, especially if the kinetics of the VAP-1 imaging tracer are known.
Sialic acid-binding immunoglobulin-like lectin 9 (Siglec-9) is a natural ligand for VAP-1 and is expressed on monocytes and neutrophils [
8,
9]. The PET tracer [
68Ga]Ga-DOTA-Siglec-9 contains a modified fraction of the full Siglec-9 protein and has been found to accumulate in infected tissues [
10,
11] as well as inflammation sites [
8,
11,
12,
13] and certain tumours [
8]. However, the kinetics of [
68Ga]Ga-DOTA-Siglec-9 have been investigated only in a single study that addressed inflammation [
12]; thus studies on the kinetics of this tracer in infections are lacking.
In earlier studies, we investigated the PET imaging of infection in a porcine osteomyelitis model. In this model,
Staphylococcus aureus (
S. aureus) bacteria were injected into the right femoral artery of juvenile pigs to haematogenously induce osteomyelitis in the right hind limb without trauma to the bone [
14,
15,
16]. In a number of animals, both osteomyelitis and soft tissue infections were induced in the limb, allowing us to compare the uptake in these two types of tissues. Each animal was scanned with a series of radioactive tracers within the same day, with planned delays to allow one tracer to physically decay before the next was injected [
17].
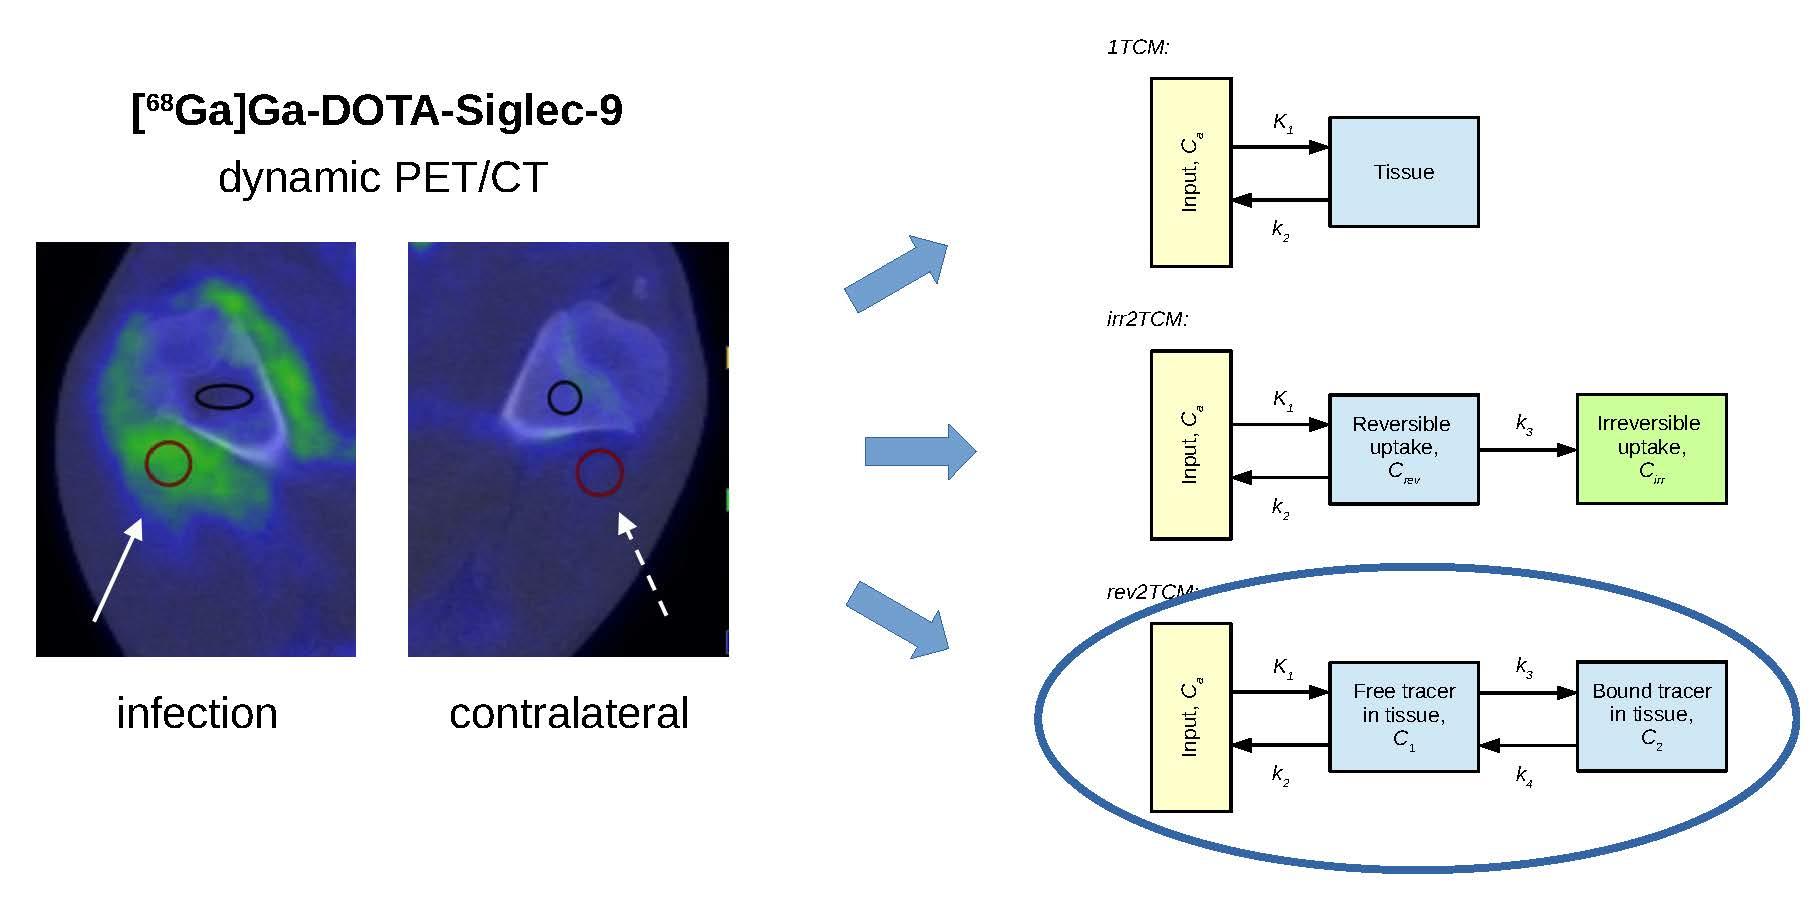
The present study investigates the kinetics of [68Ga]Ga-DOTA-Siglec-9 in this porcine osteomyelitis model, including a comparison of the uptake in osteomyelitis and in soft tissue infections.
3. Discussion
In this study, we investigated the uptake of [68Ga]Ga-DOTA-Siglec-9 in juvenile pigs with localized S. aureus infections, including both bone infection (osteomyelitis) and soft tissue infection.
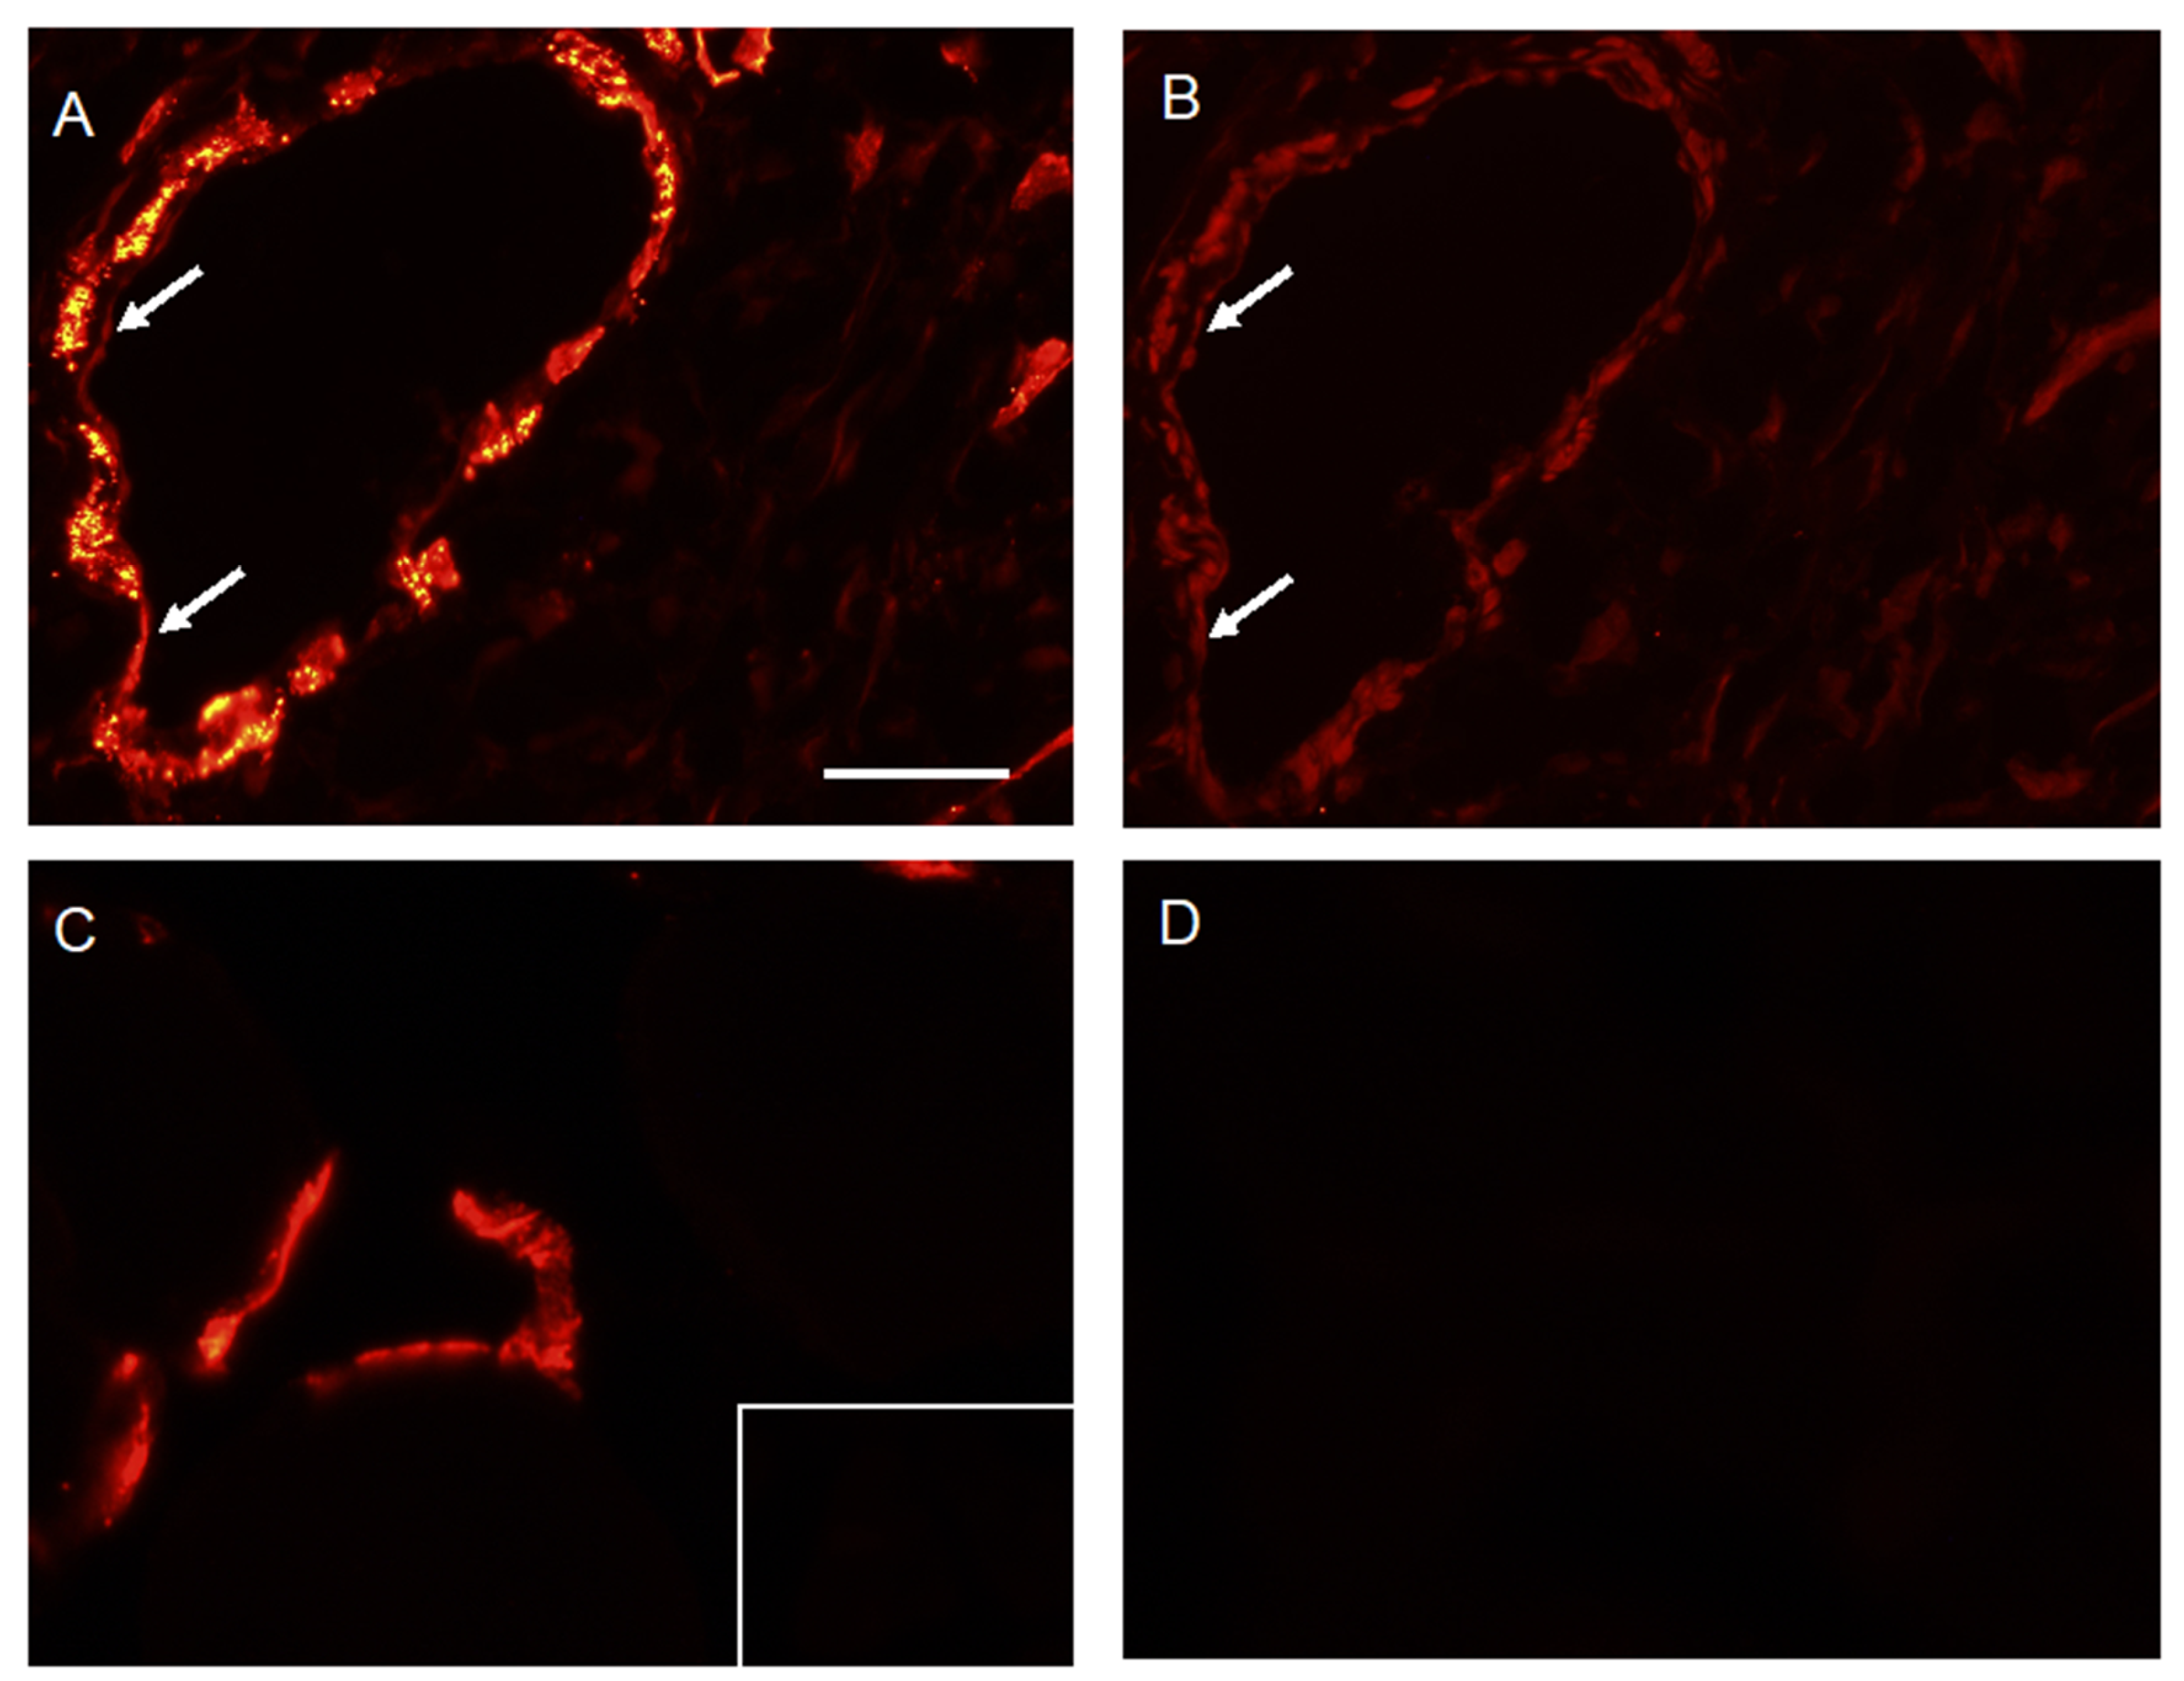
As in previous studies [
10,
13], the tracer was found to have an affinity for infected tissues. Siglec-9 is known to bind to VAP-1, and IF staining was consistent with the expression of VAP-1 on cell surfaces in the infected soft tissue.
Kinetic modelling showed that [
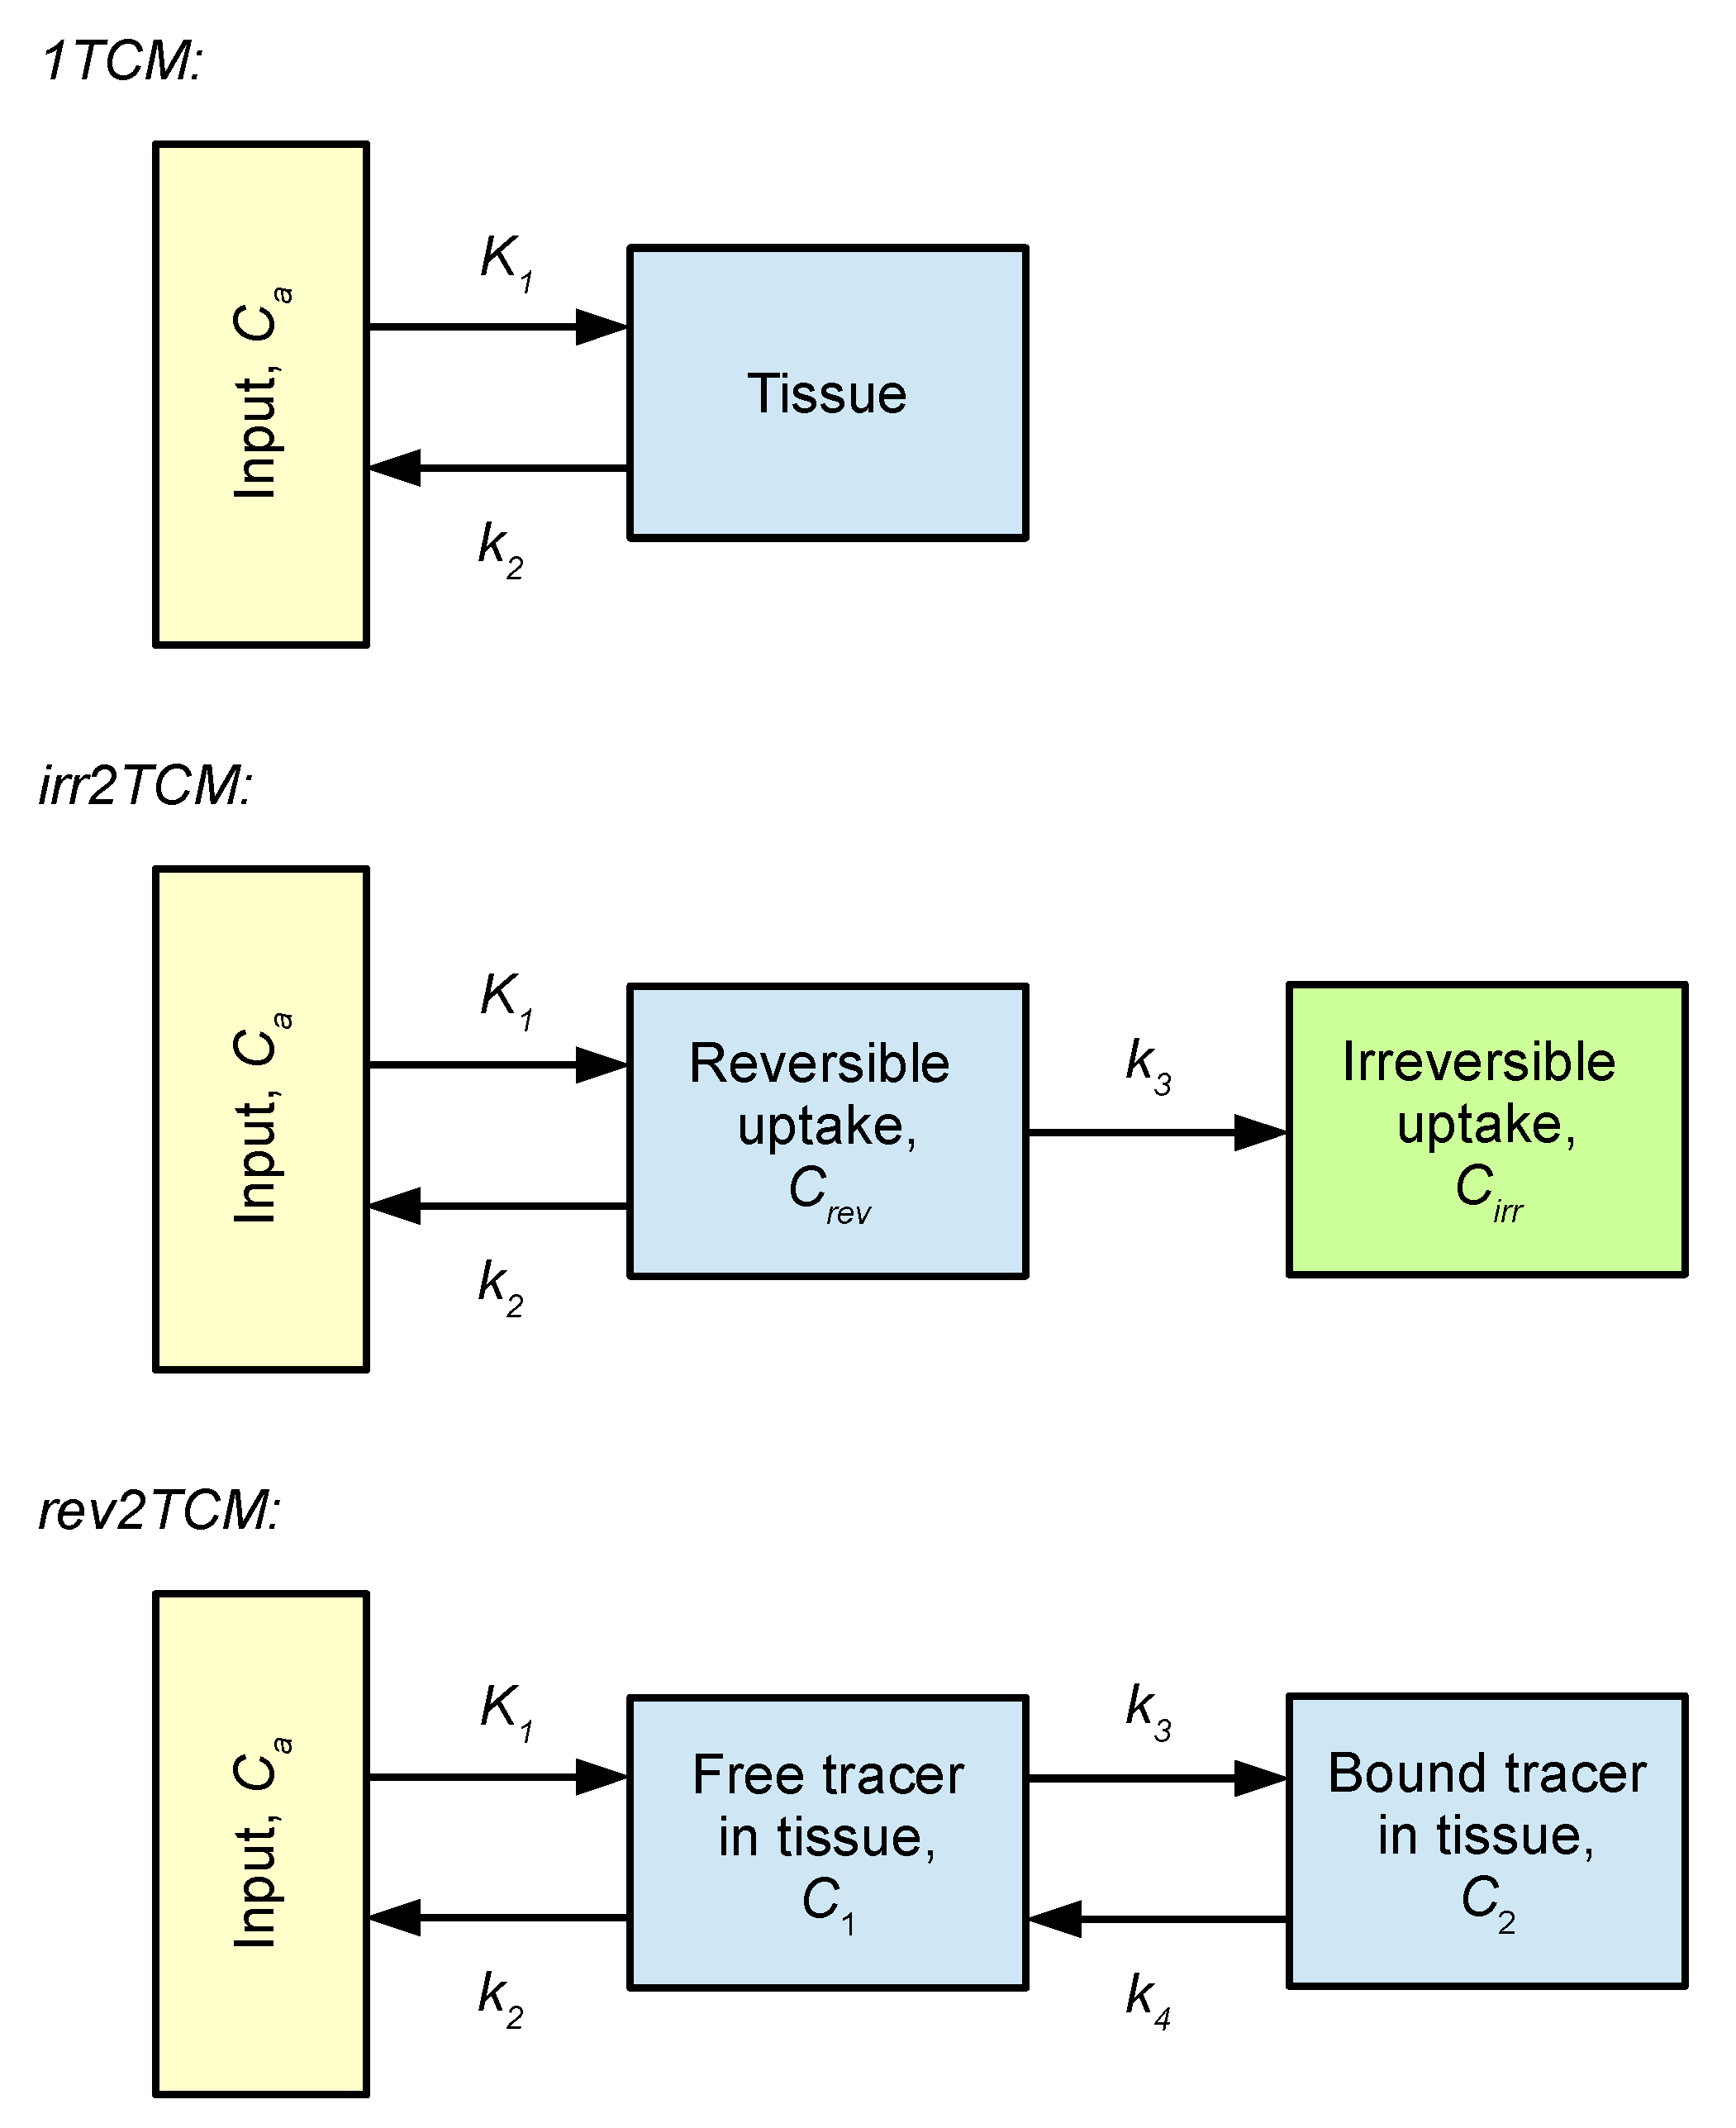
68Ga]Ga-DOTA-Siglec-9 had reversible uptake kinetics, which could be described with a two-tissue compartment model (i.e., rev2TCM from
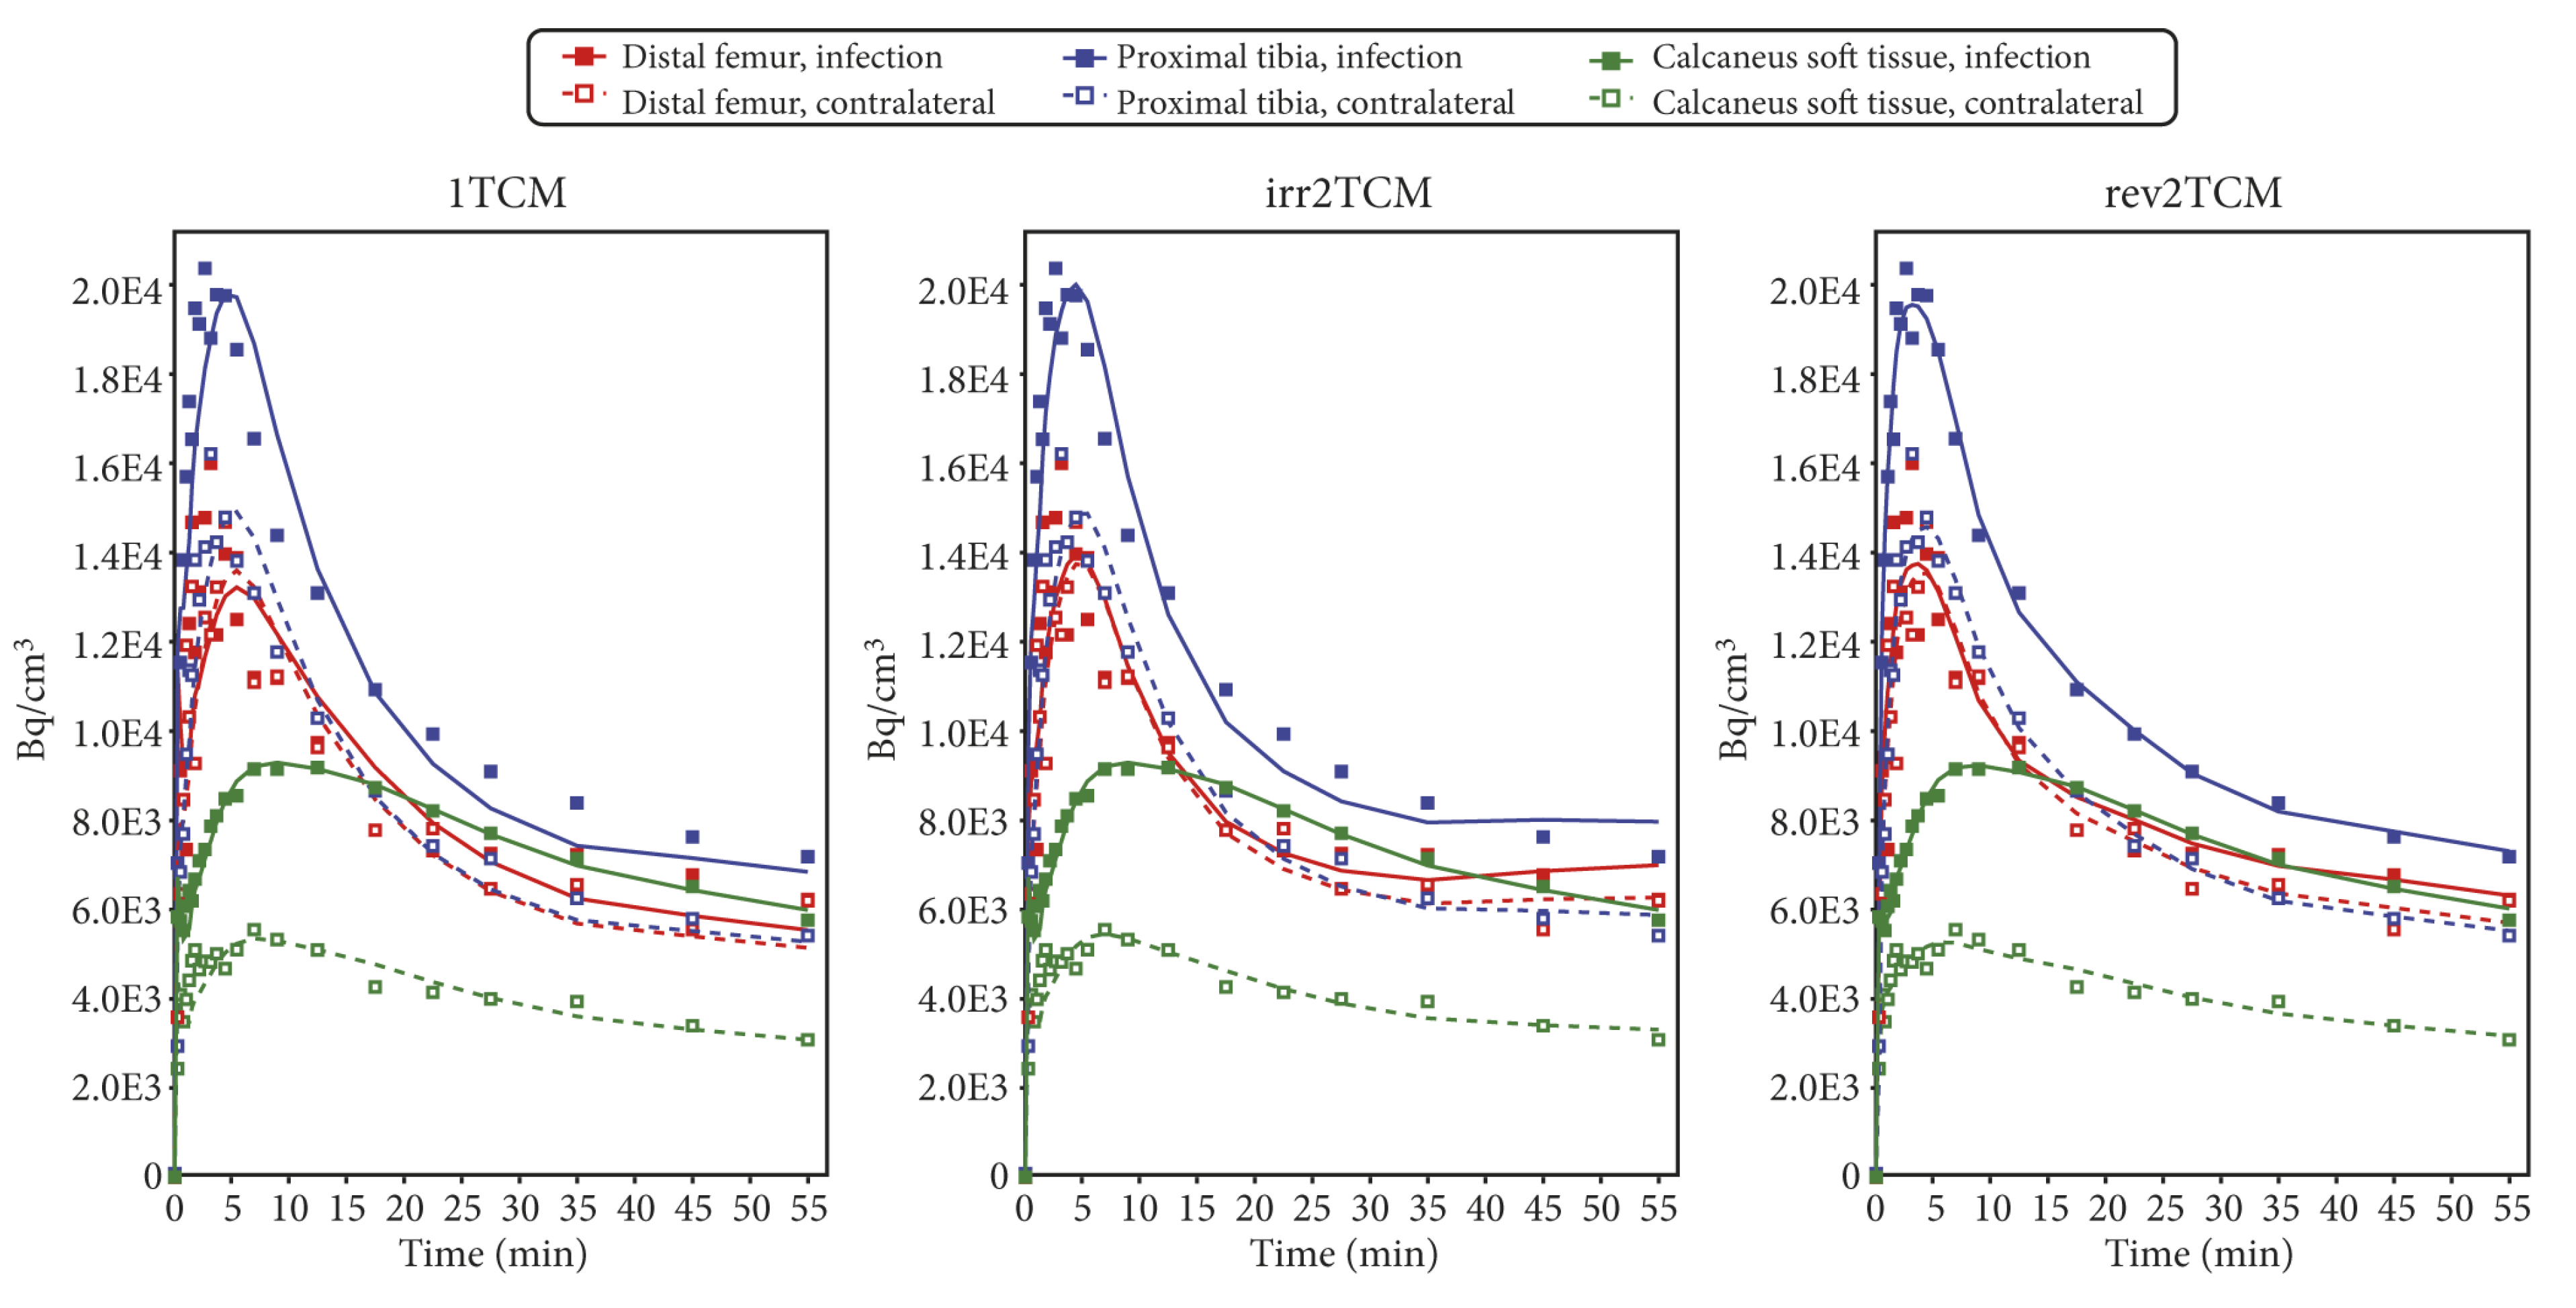
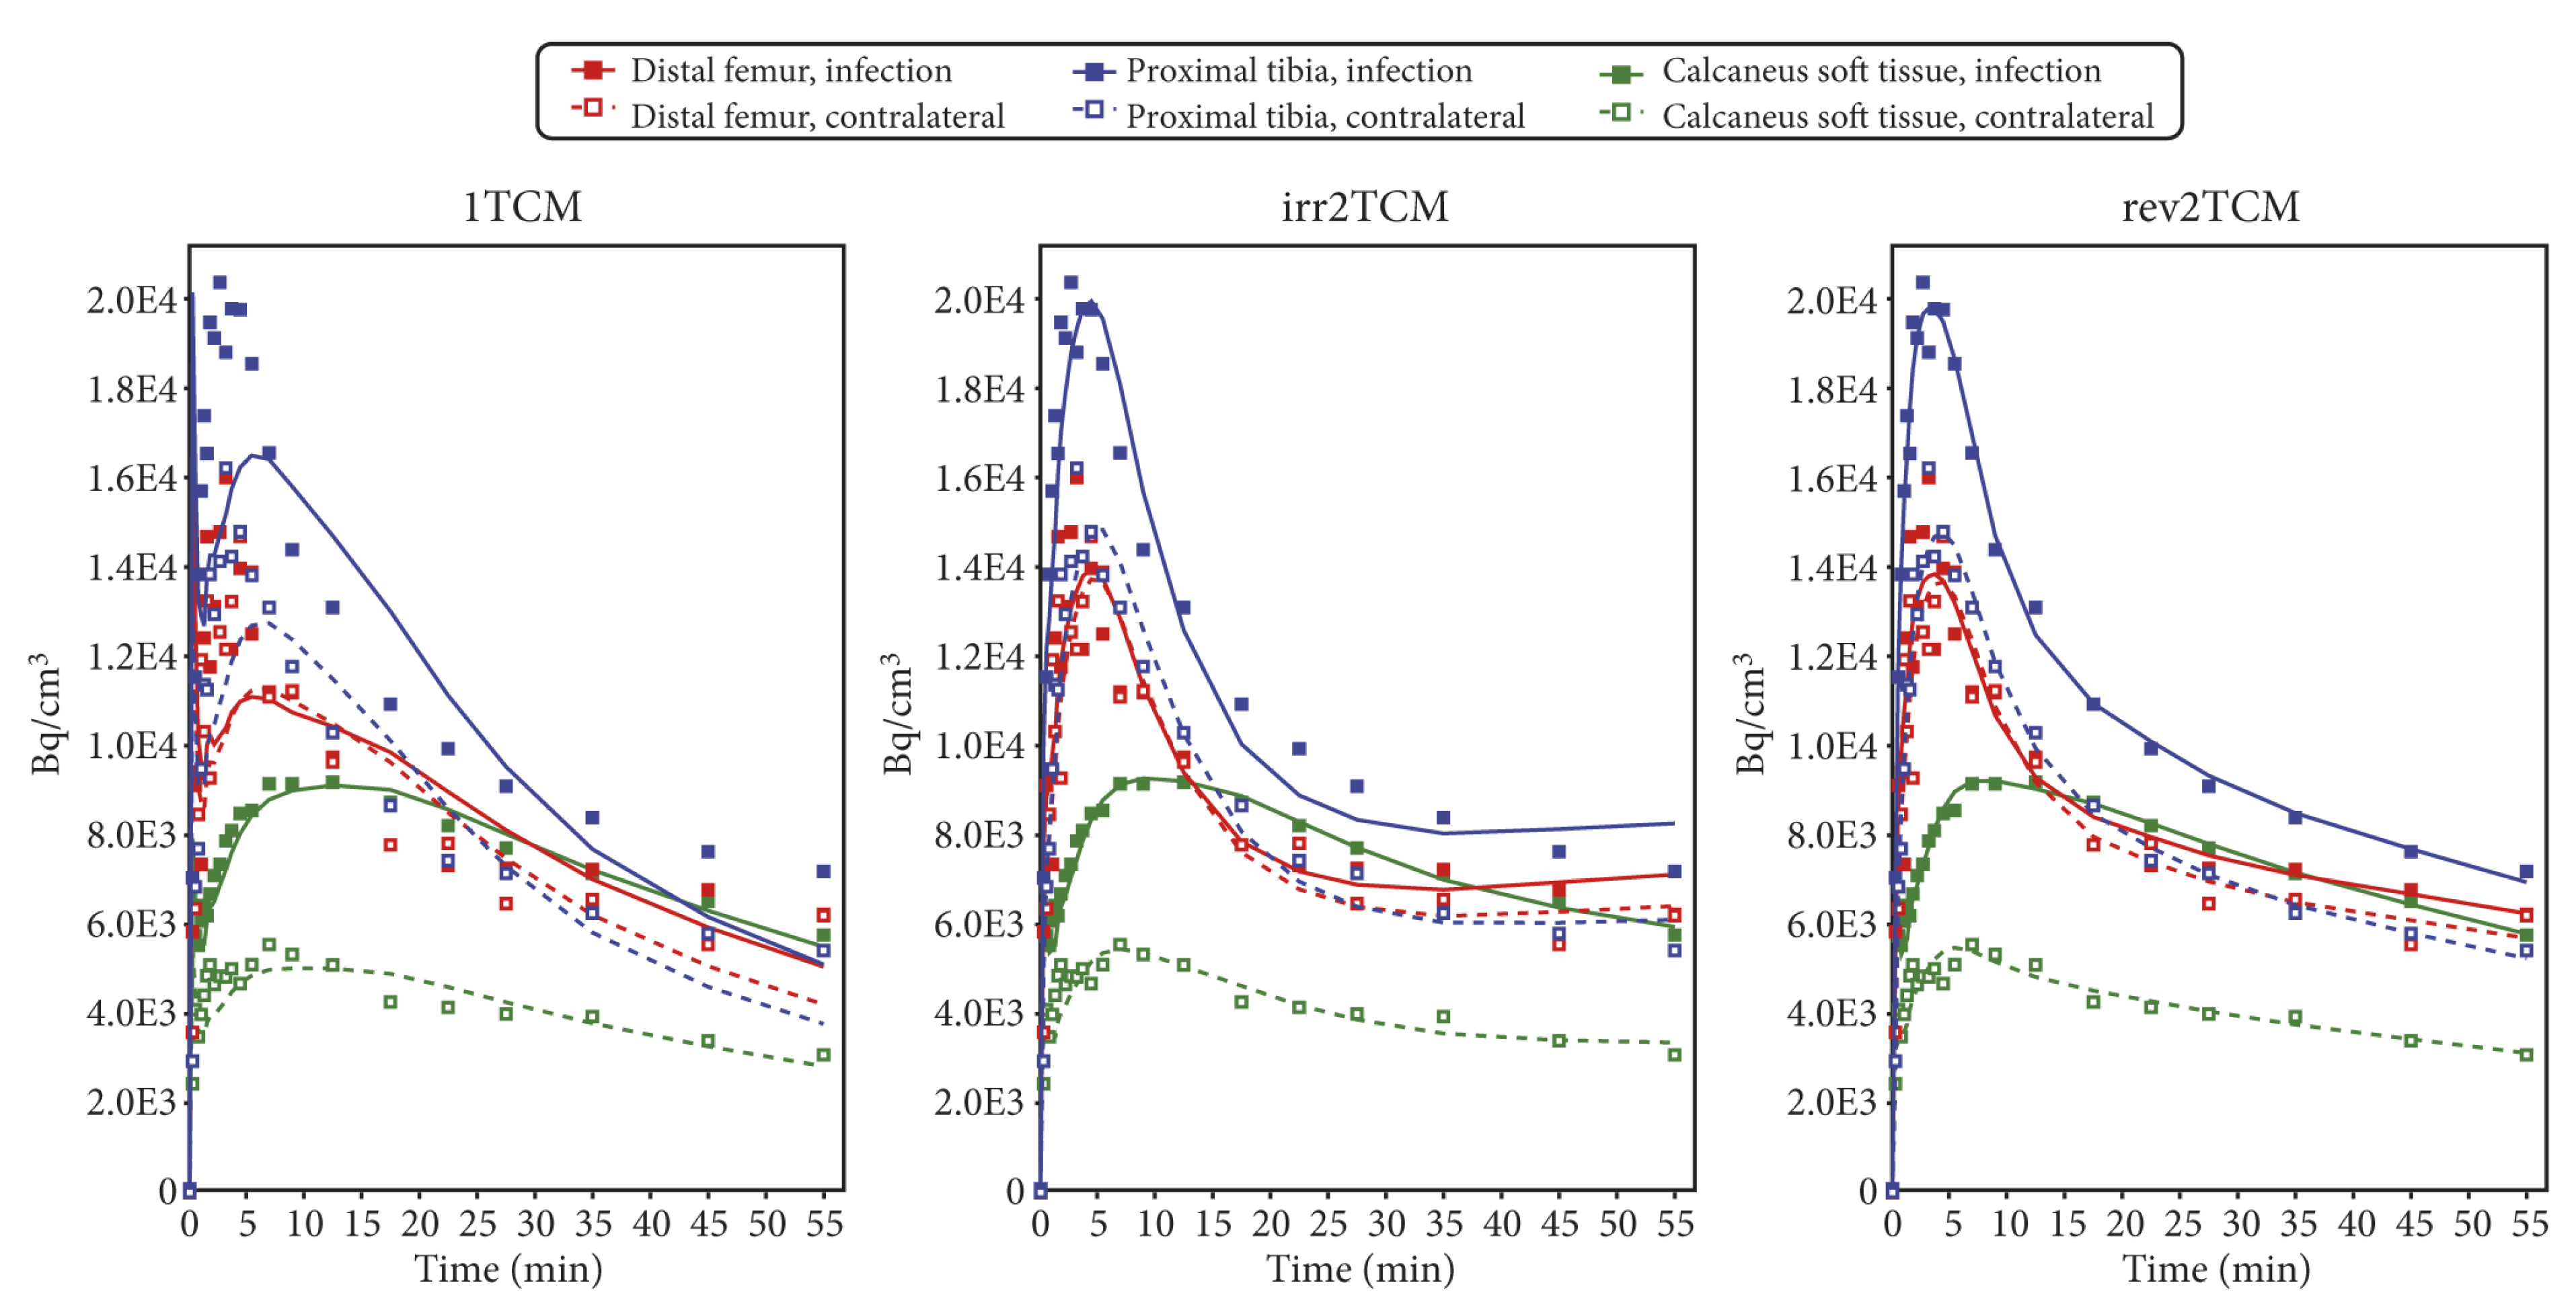
Figure 6). Visually, the models with fewer parameters provided good fits in many cases (see the 1TCM and irr2TCM curves in
Figure 7 and
Figure 8); however, the 1TCM curves provided poor fits for the initial part of many curves, and the Patlak plots revealed that models with irreversible uptake such as irr2TCM could not be generally applied (cf.
Figure 9). Likewise, the analysis by the AIC
c values (cf.
Supplementary Tables S2 and S3) favoured rev2TCM in the large majority of cases.
Based on these results, the following discussion will assume rev2TCM as the chosen model. Physiologically, rev2TCM indicates that the tracer is taken up by the tissue (first compartment), and then the tracer binds to receptors or otherwise changes status in the tissue (second compartment), but with the possibility of unbinding/changing back (reversible model).
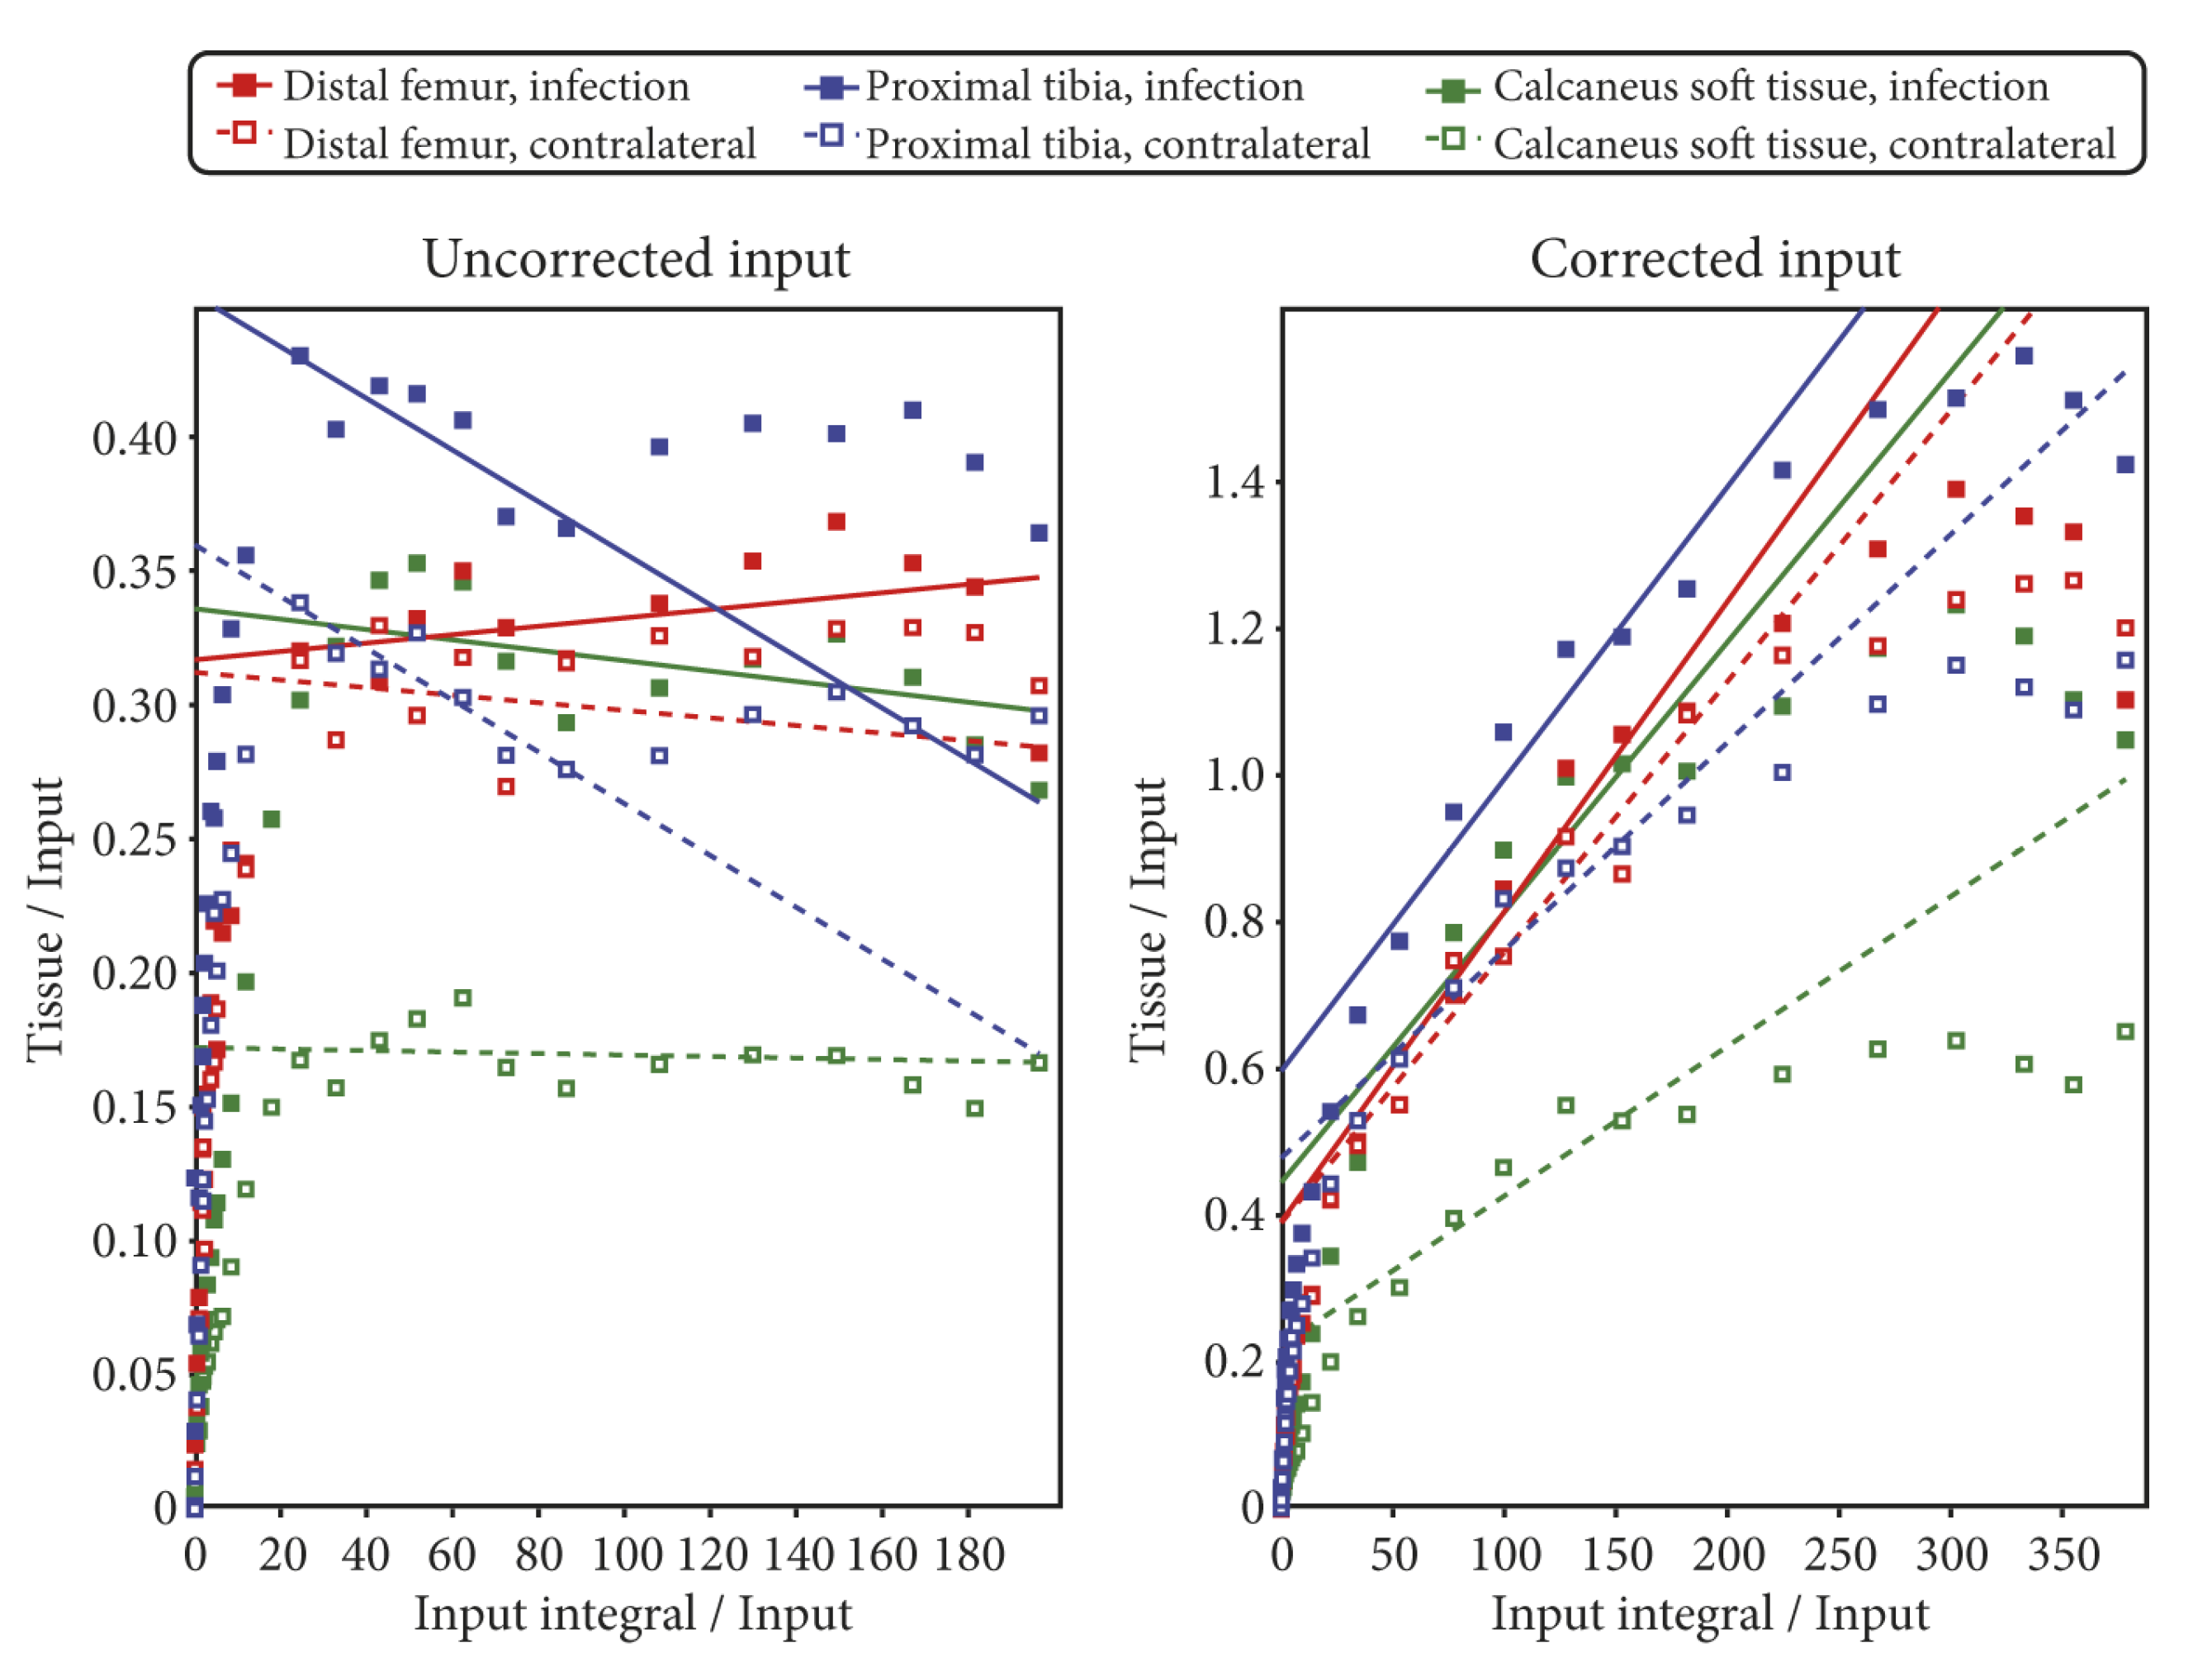
3.1. Using the Corrected or the Uncorrected Input Function
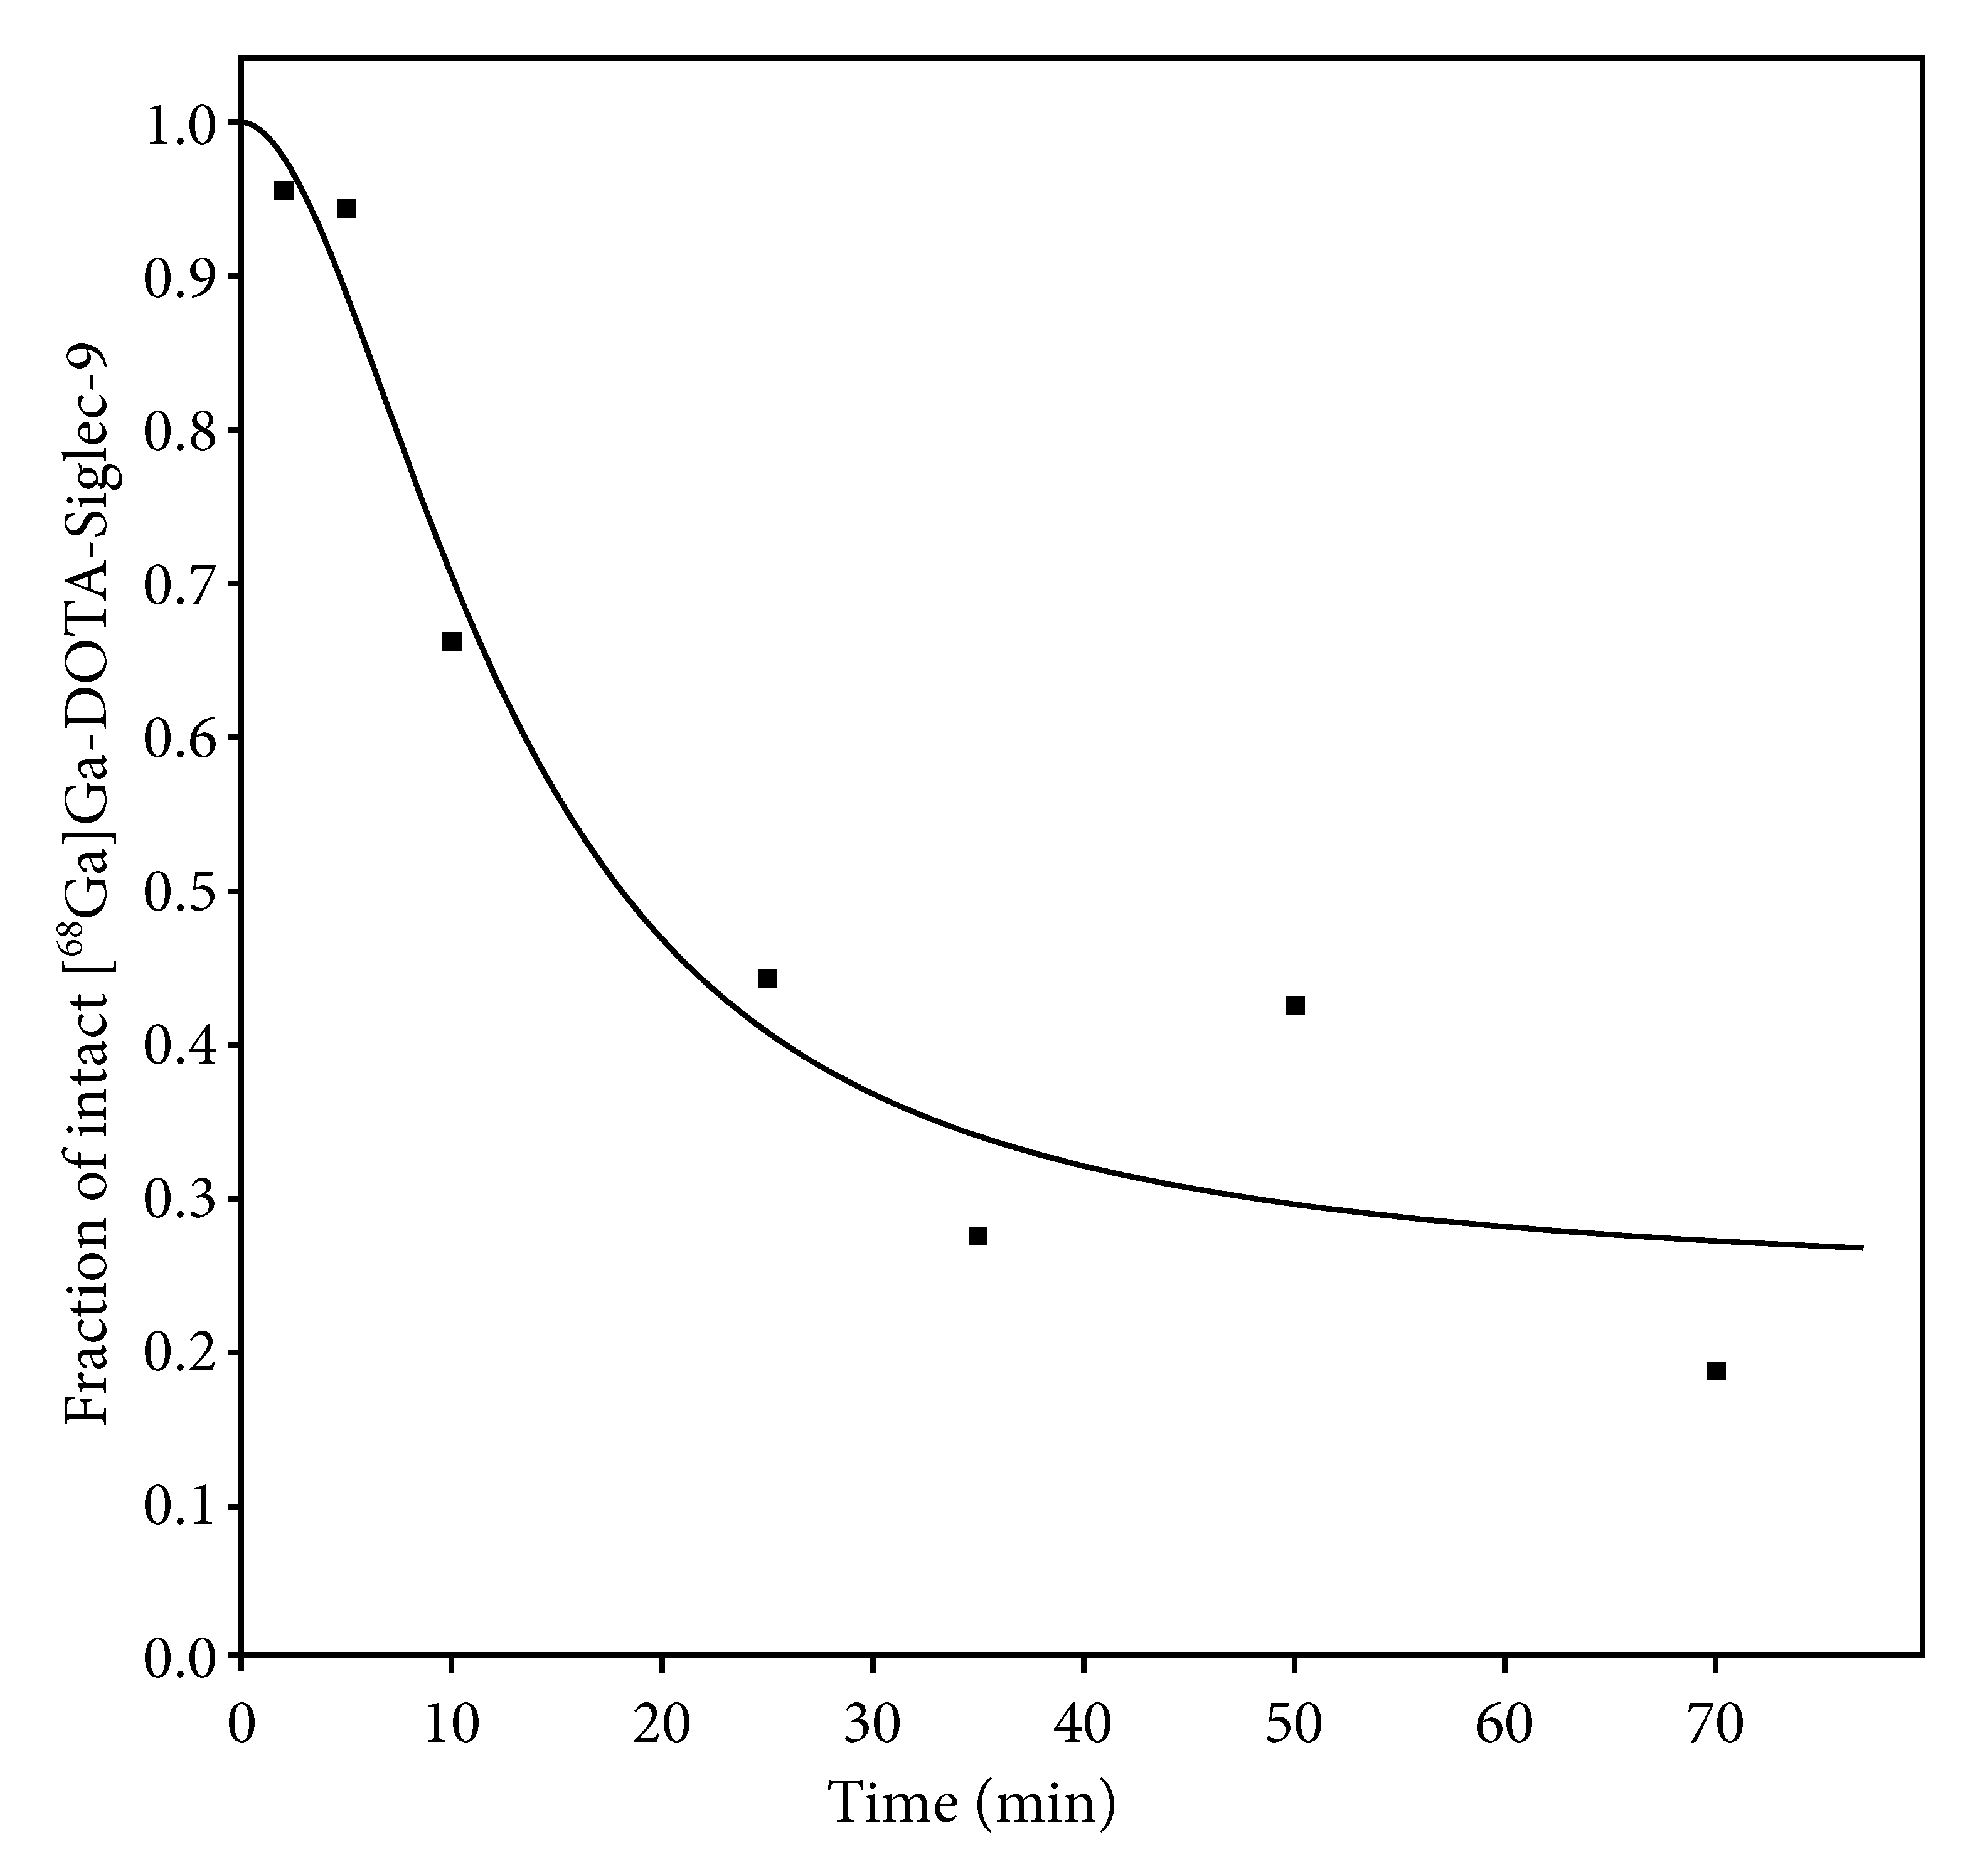
The radio-HPLC analysis of blood samples revealed a rapid decrease in the parent tracer fraction (
Figure 5). However, modelling showed no clear advantage of using a corrected input function. In most fits, the visual difference between using the uncorrected or corrected input function was only minor (compare
Figure 7 and
Figure 8).
Physiologically, fitting with the uncorrected input function assumes that any radioactive metabolites have the same uptake kinetics as the parent tracer. In contrast, fitting with the corrected input function assumes that the radioactive metabolites have no uptake at all. The real situation is probably somewhere in between.
Mathematically, the inclusion of such a correction has the disadvantage of including a source of uncertainty, which becomes especially important in a case such as the present where the correction in the late part of the scans was considerable (cf.
Figure 5).
The volume of distribution (
VT) measures how concentrated the tracer is in tissue relative to plasma (input), cf. Equation (4) in the Material and Methods section. As shown by comparing the scales in
Figure 10, the calculated values of
VT depend markedly on the selection of the uncorrected or corrected input function. This dependency is a simple consequence of the math. The corrected input function is by definition only some fraction of the total, uncorrected input function (cf.
Figure 5). A given radioactivity concentration in the tissue will be relatively higher when compared to a low number (the corrected input function) than when compared to a higher number (the uncorrected input function).
In summary, our data showed a rapid decrease in the parent tracer (cf.
Figure 5), but unfortunately the modelling did not allow us to distinguish between the PET signal from the parent tracer (i.e., [
68Ga]Ga-DOTA-Siglec-9) and the PET signal from other radioactive species formed in vivo (i.e., all metabolites containing the
68Ga isotope, possibly including free
68Ga).
Consequently we reason that use of the corrected input function will lead to increased uncertainty of VT due to possible errors in the measurement of parent tracer fraction. When the uncorrected input function is used, this pitfall is avoided, although at the cost of risking over-simplification. Pragmatically, the following discussion will therefore focus on the results found with the uncorrected input functions, bearing in mind that the physiological reality is likely more complicated than the model. Further studies investigating the nature of the radioactive products of [68Ga]Ga-DOTA-Siglec-9 formed in vivo are warranted.
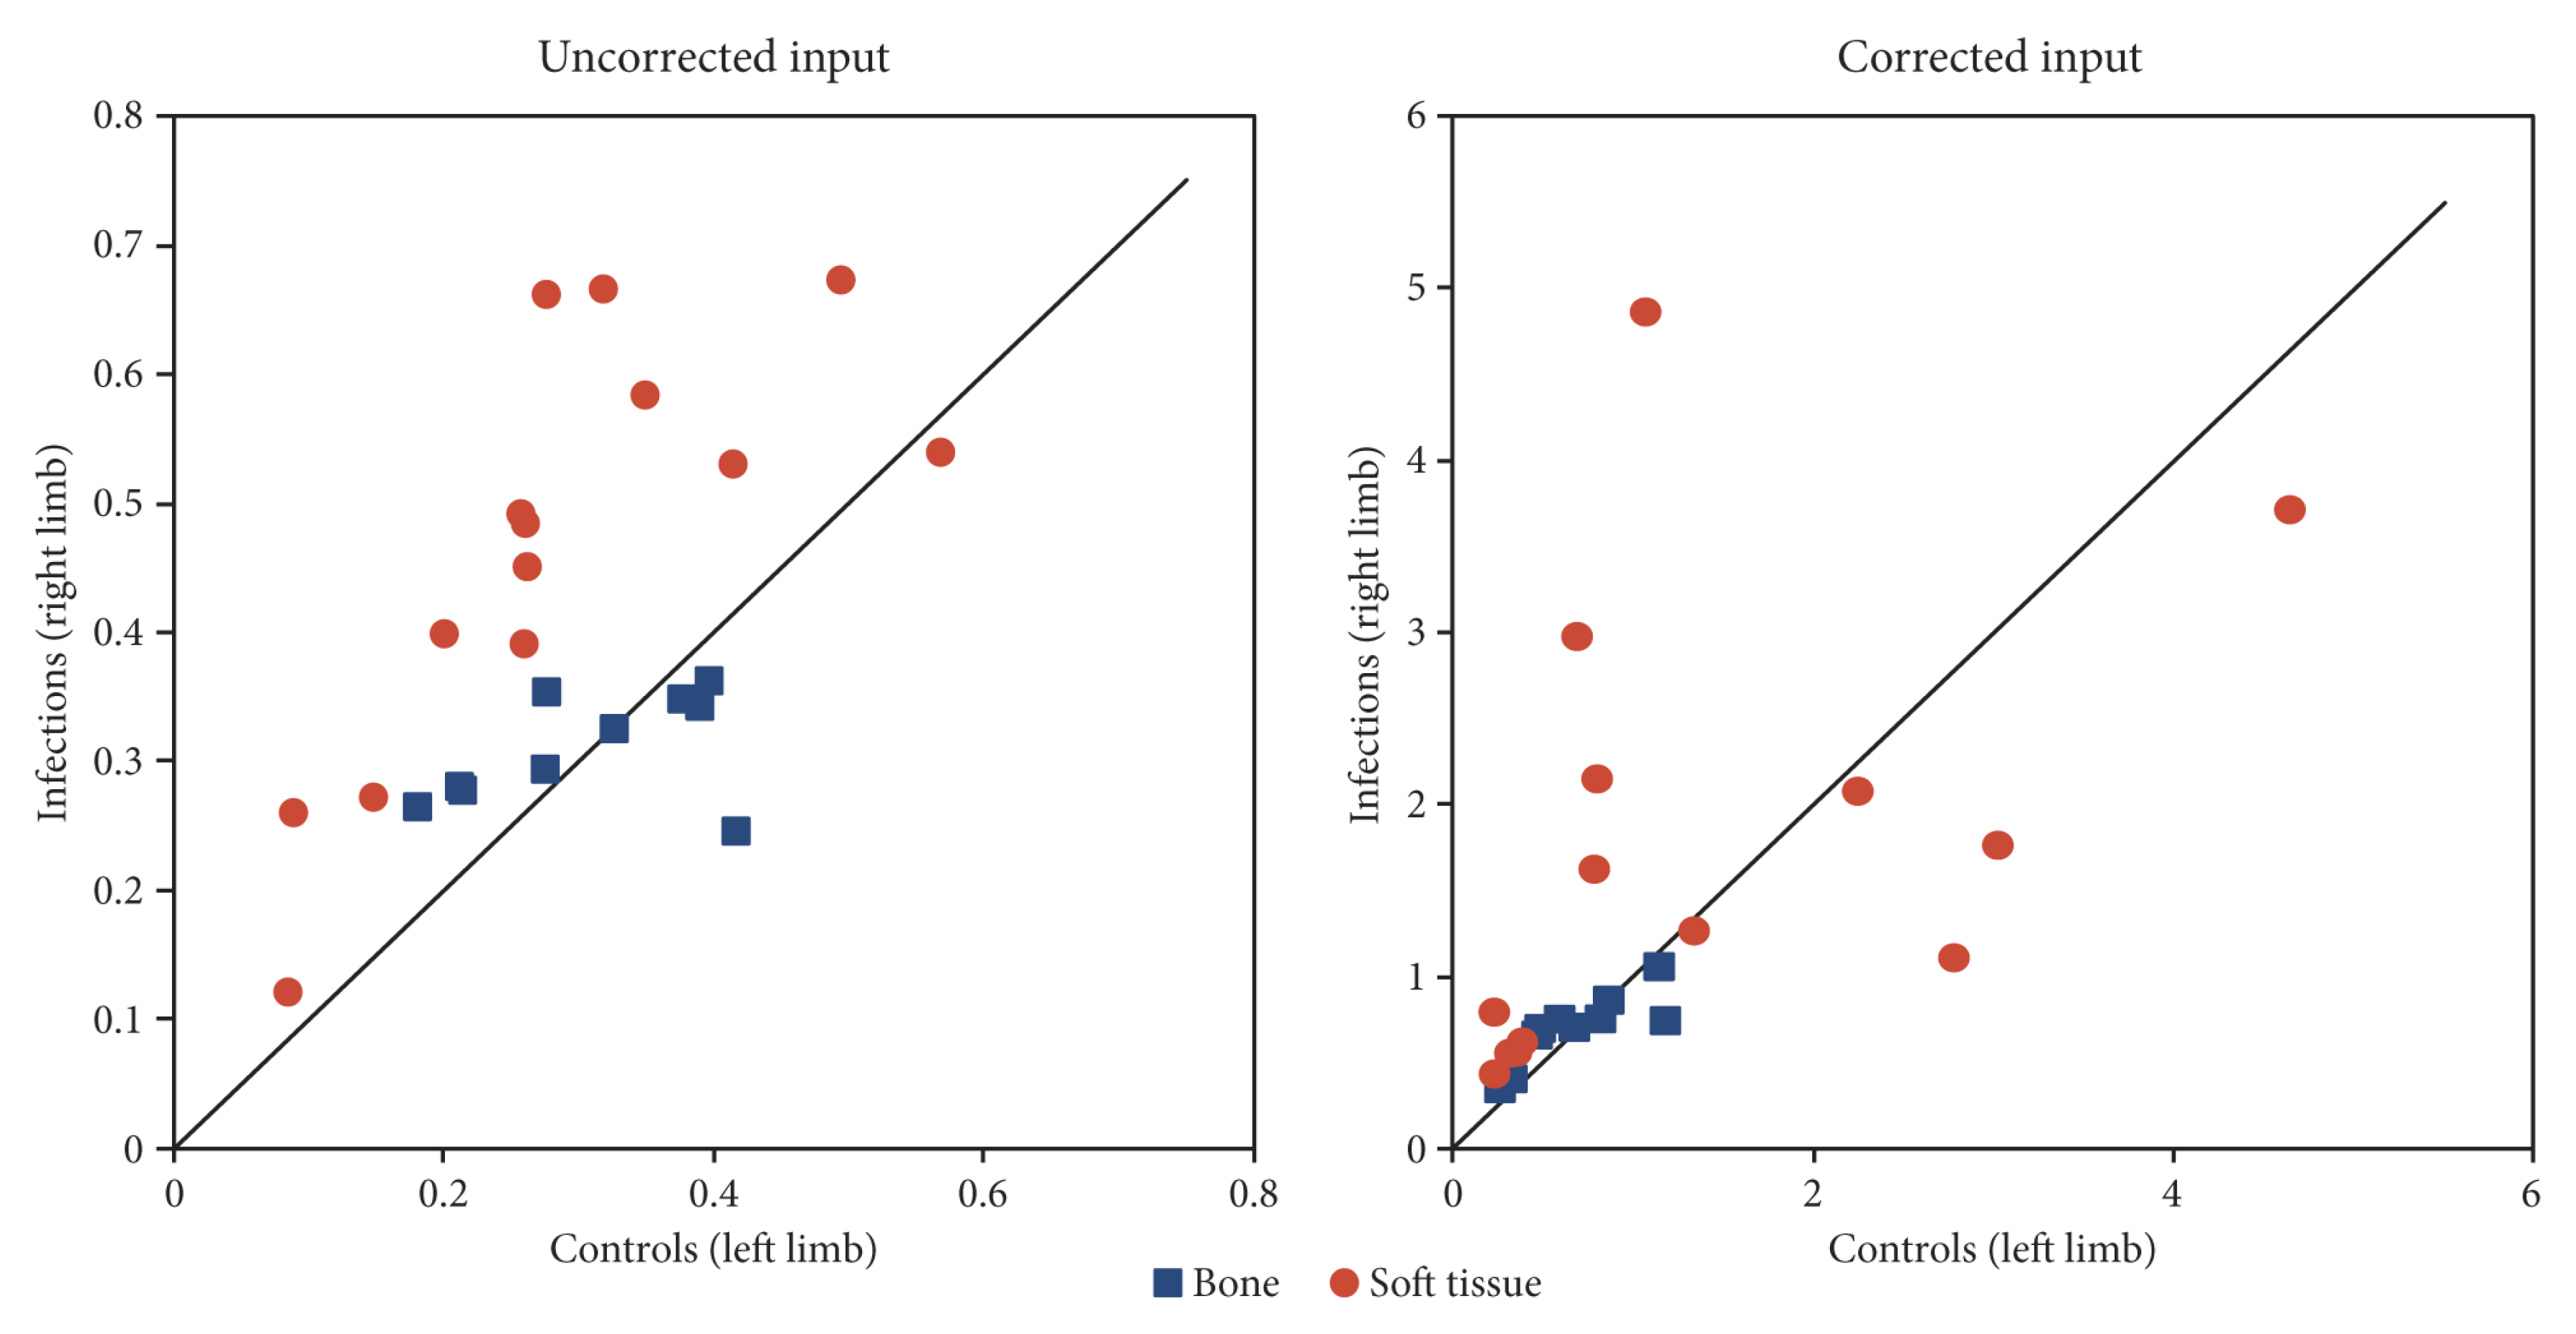
3.2. The Volume of Distribution VT
The
VT for [
68Ga]Ga-DOTA-Siglec-9 in soft tissue infections was found to be higher than that of the corresponding control sites, (red circles in
Figure 10, left part). In bone infections (osteomyelitis), however,
VT was not significantly different between the infection and control sites (blue squares in
Figure 10, left part).
Retamal et al. [
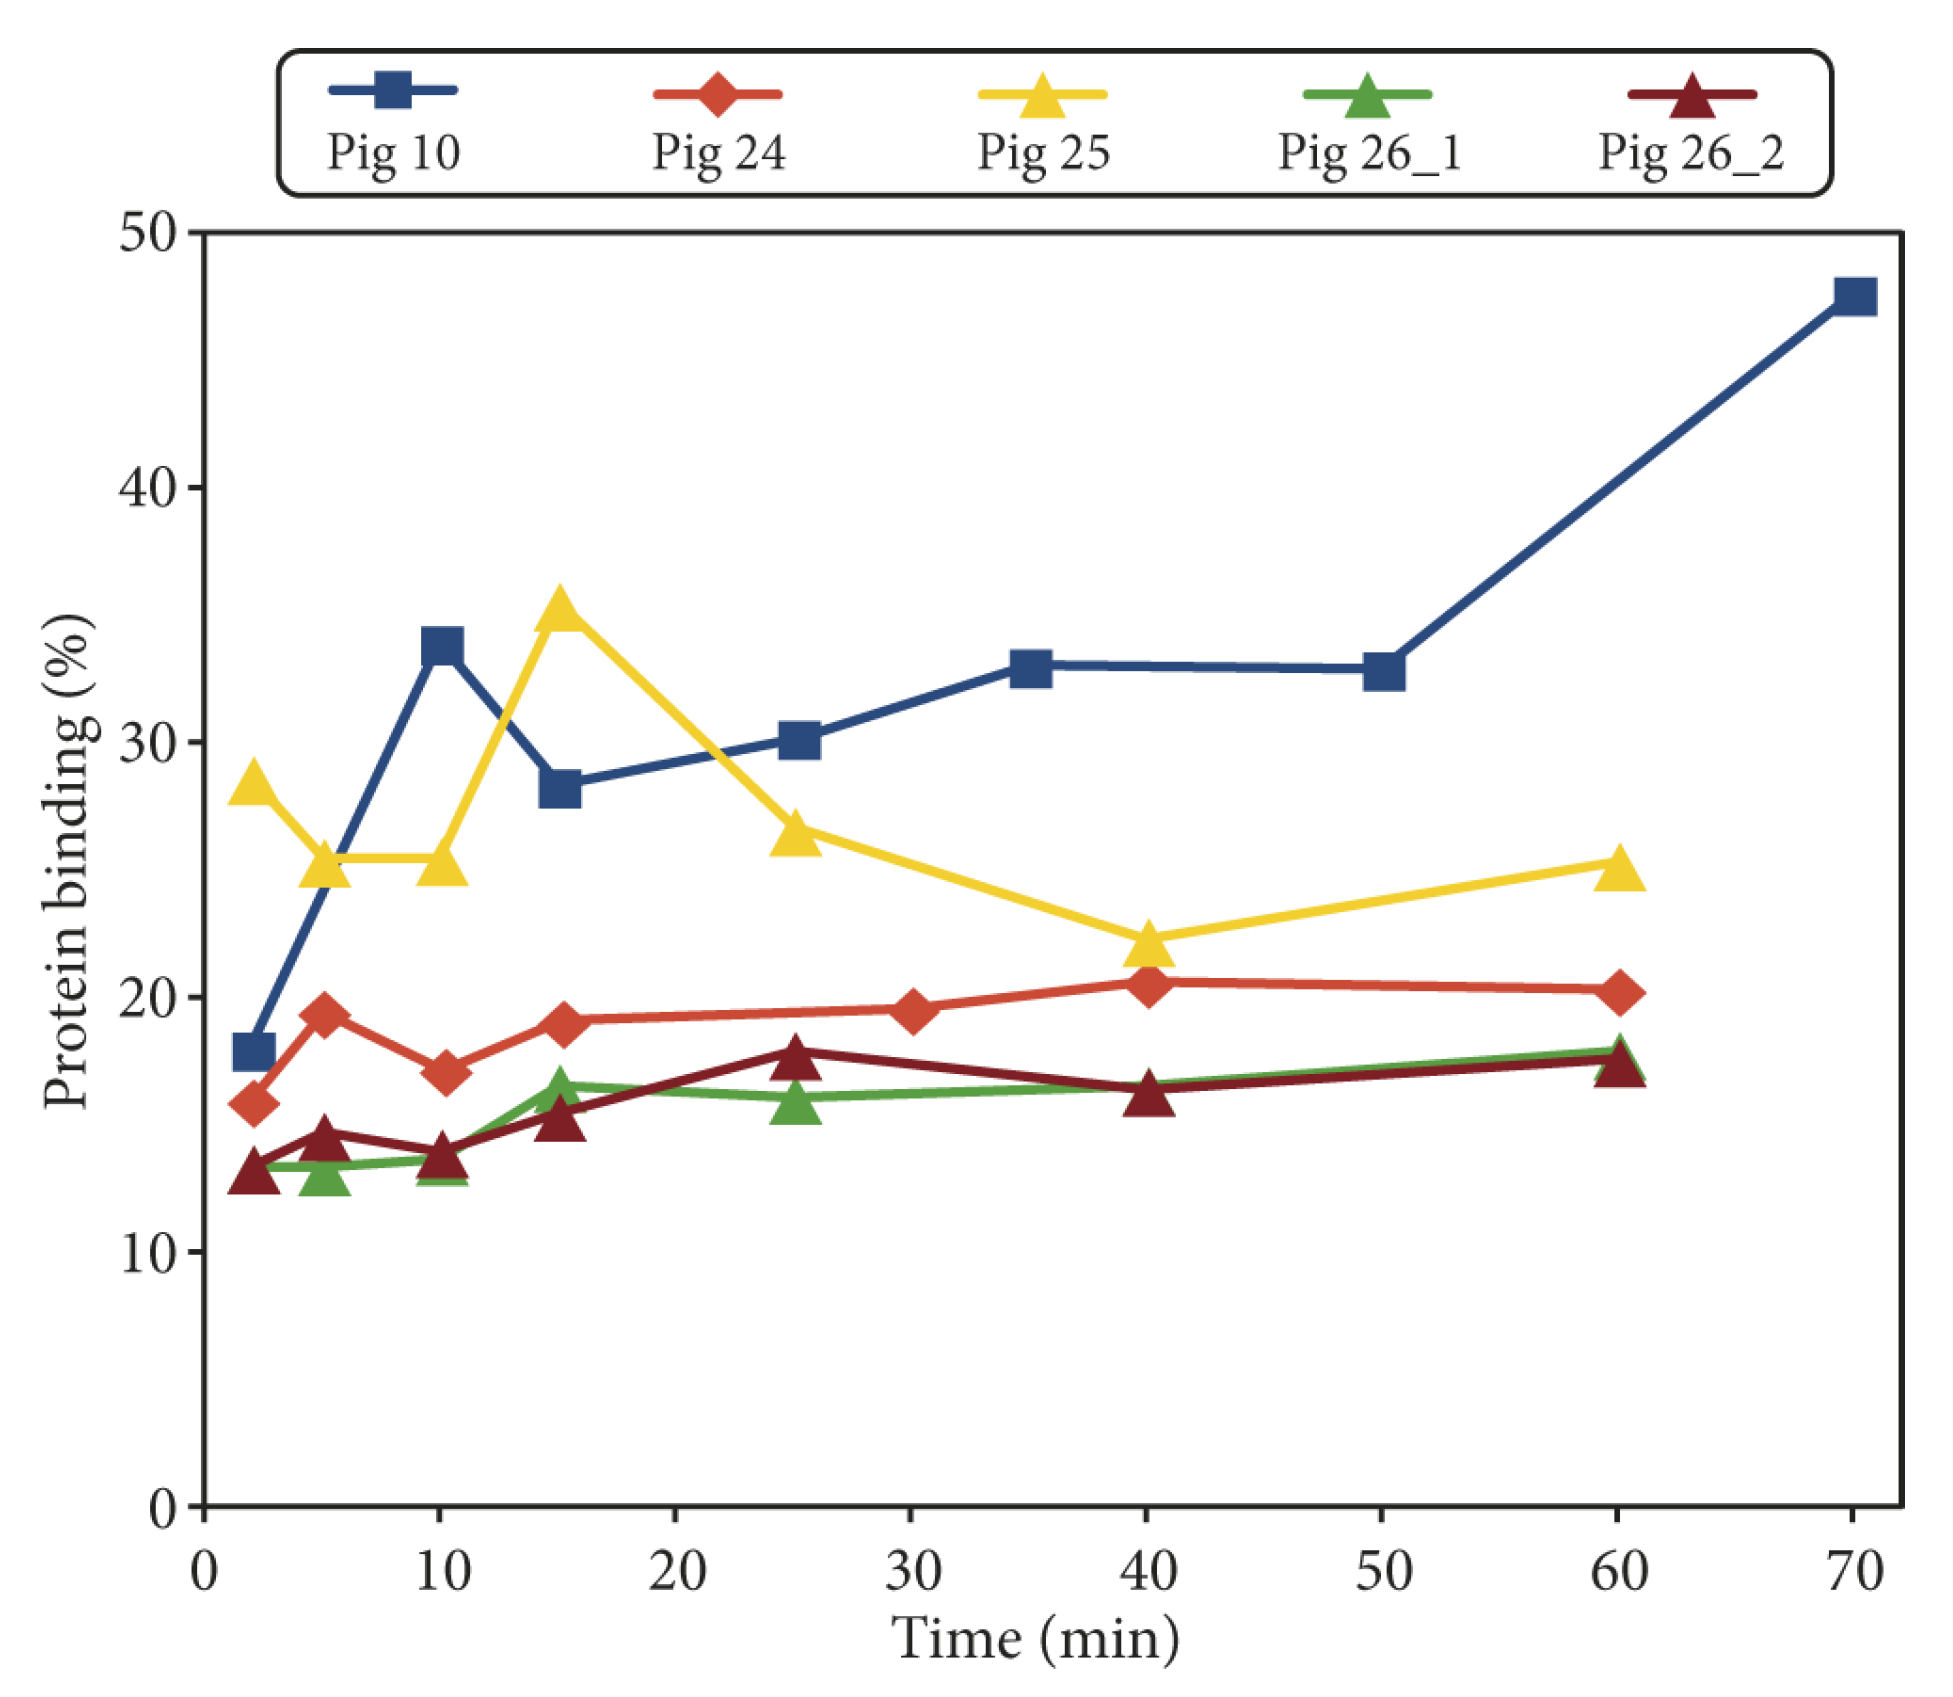
12] used the same tracer to study lung inflammation, also performing kinetic modelling with the model called rev2TCM in our terminology (with no mention of correction for parent tracer fraction), and found that the model described the time–activity curves well. The study also included protein binding, which was found to be constant over time, at a level of approximately 20% in healthy pigs and approximately 50% in the inflamed pigs. Our results (cf.
Figure 4) are mostly in accordance with the first of these numbers, which could reflect that from a systemic perspective, a local infection in a single limb is more similar to a healthy pig than to a pig with severe inflammation in both lungs. Retamal et al. found increased uptake of [
68Ga]Ga-DOTA-Siglec-9 in inflamed lungs, which is consistent with our results on uptake in soft tissue infection.
In summary, [
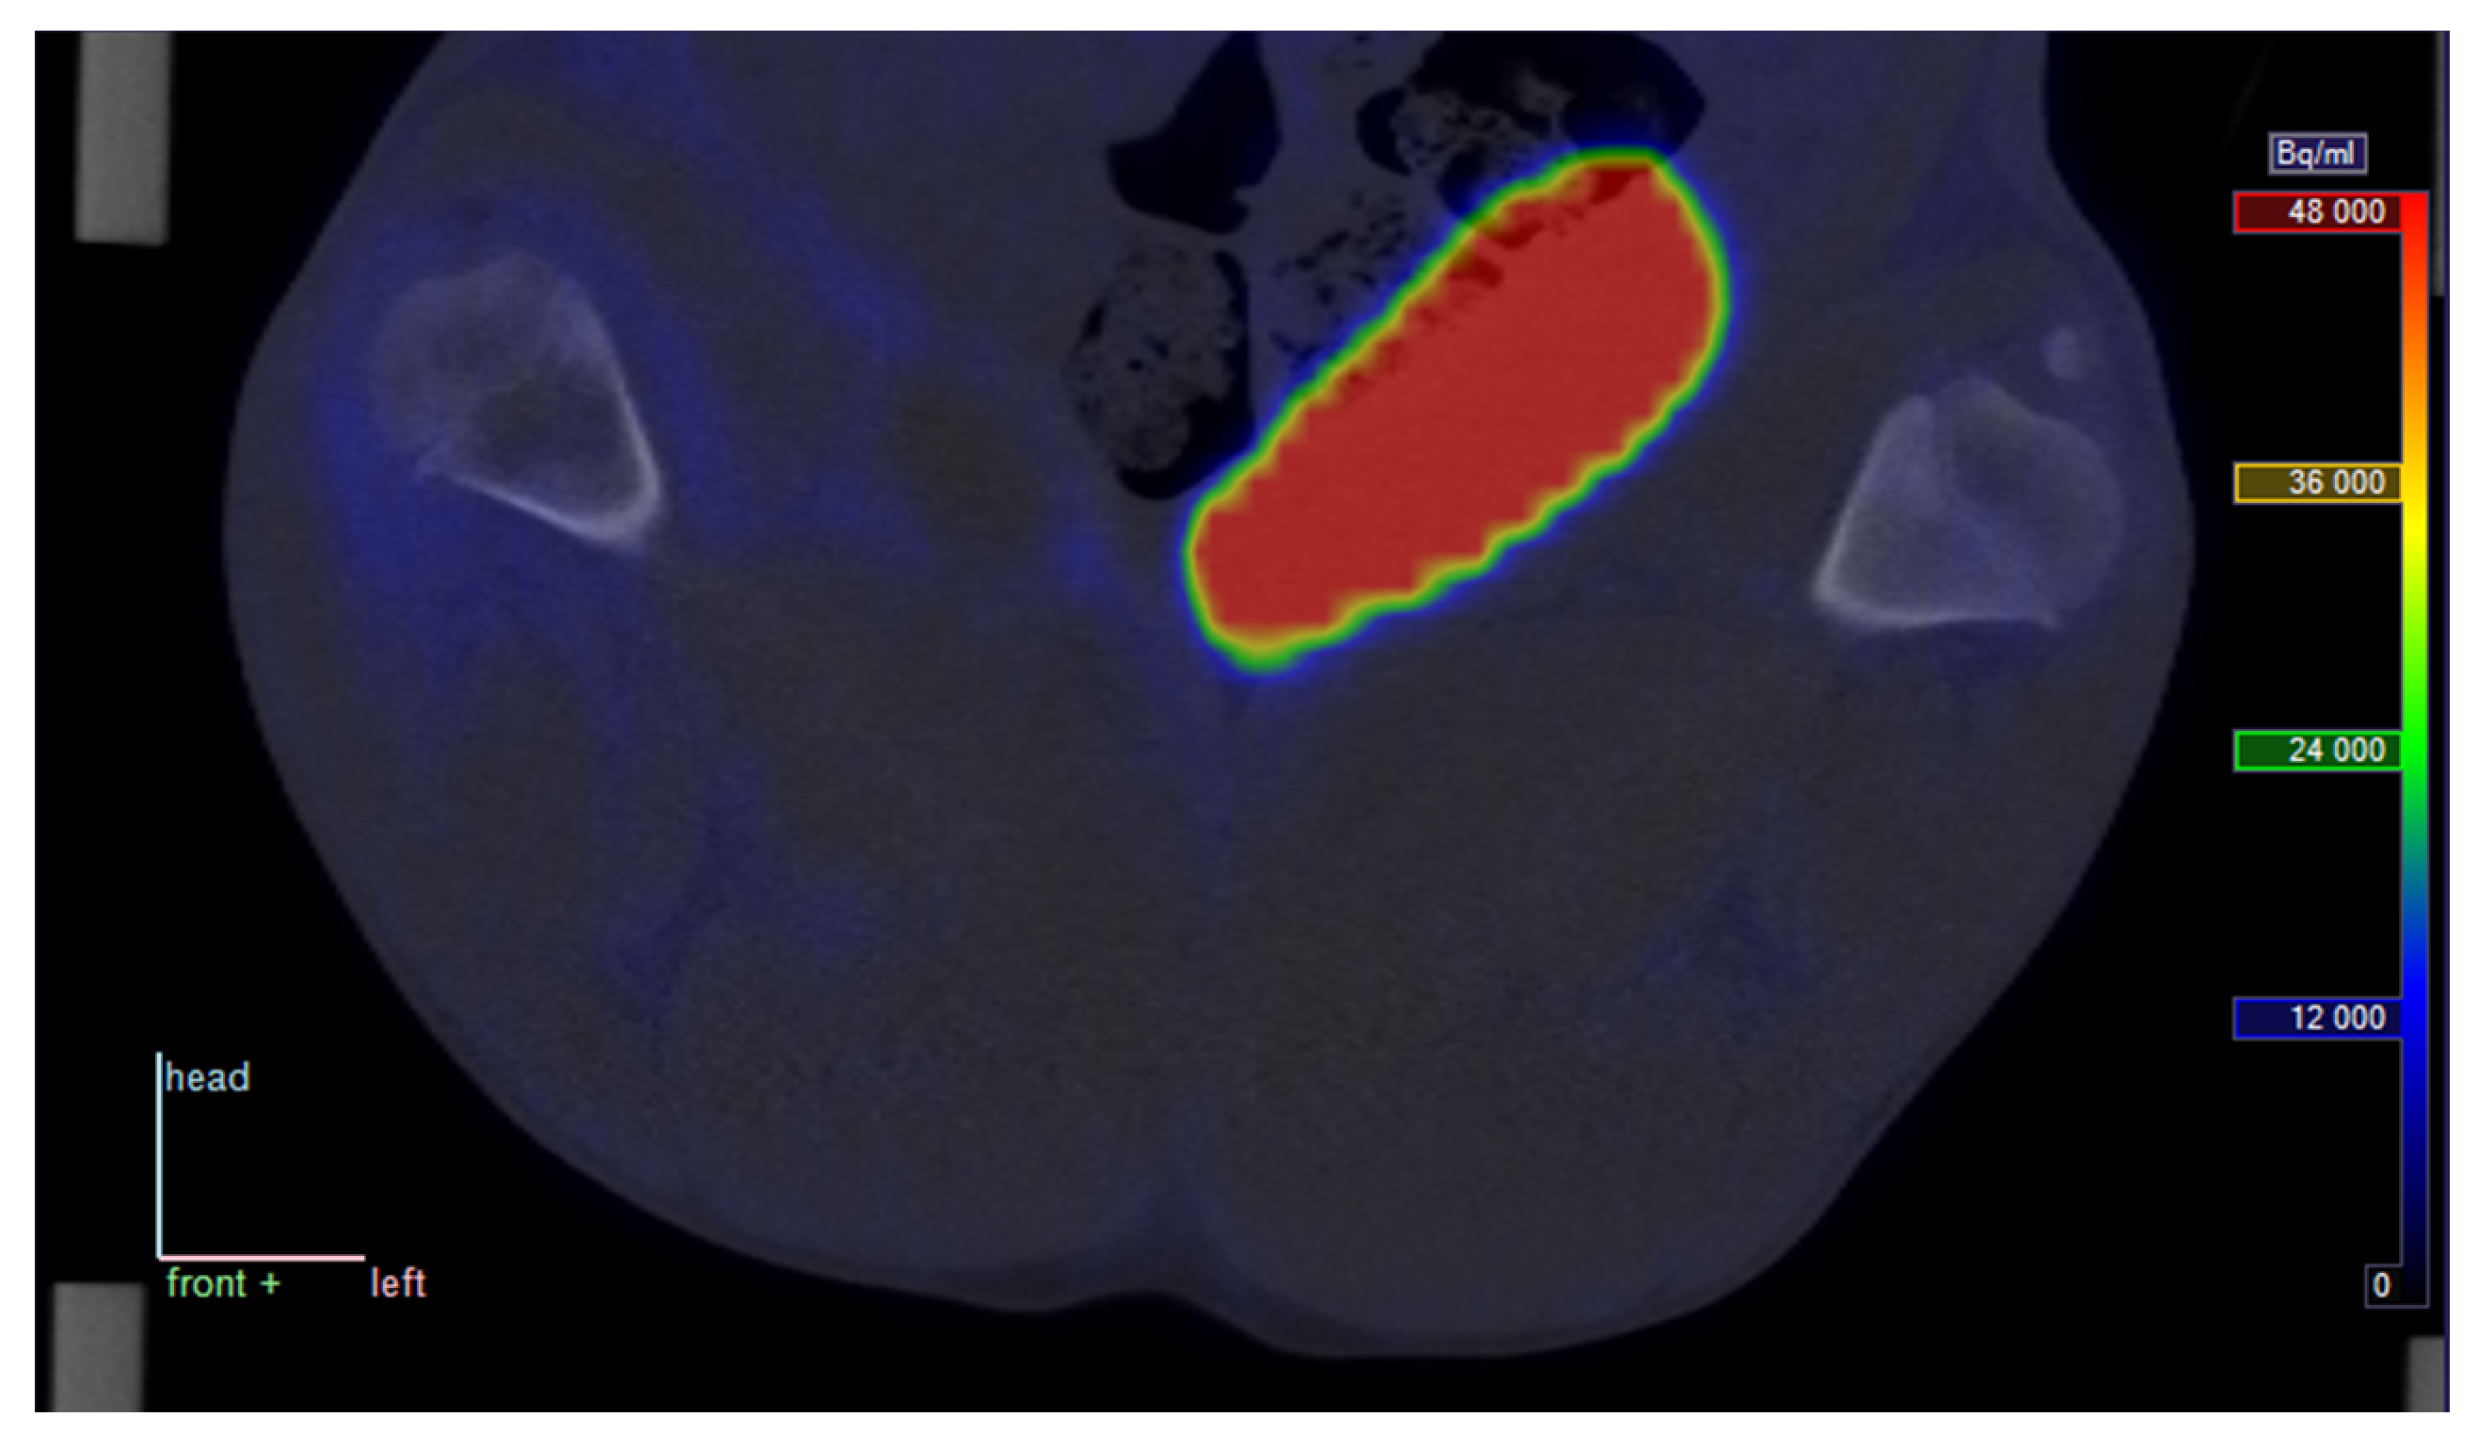
68Ga]Ga-DOTA-Siglec-9 shows increased uptake in infected (and inflamed) soft tissue compared with control tissue; however, this study fails to demonstrate elevated uptake in infected bone (osteomyelitis). These quantitative results correspond to the visual impression of the sample image in
Figure 1, where increased uptake is clear in infected soft tissue but not in the infected bone (cf. with pig no. 25 in
Table 2 and
Table 3). Note, however, that this comparison is partly qualitative. The determination of
VT on a reliable absolute scale will depend on improved knowledge on the nature of the radioactive metabolite products of [
68Ga]Ga-DOTA-Siglec-9. The moderate correlation between SUV and
VT indicates that the volume of distribution gives information that is not just a complicated version of the SUV.
In a previous study [
18] (in part performed on the same animals), we found only a small increase of blood perfusion in osteomyelitis lesions, while blood perfusion was considerably increased in soft tissue infections. As speculated in that study, an ineffective vascular response to infection may lead to too few leukocytes reaching the infected bone, in part explaining why osteomyelitis is difficult for the body to fight. Similarly, despite the uptake of [
68Ga]Ga-DOTA-Siglec-9 in infected tissue, imperfect perfusion can impair effective uptake, which may explain the difference in results for soft tissue infections and osteomyelitis.
3.3. Scan after the Injection of “Cold” DOTA-Siglec-9
Pig no. 26 was scanned twice, and the second scan was performed after the injection of 5 mg of unlabelled DOTA-Siglec-9 peptide, which was intended to block the VAP-1 receptors. The uptake curves for both scans are shown in
Supplementary Figures S8 and S9. For the infected lymph node, the bolus passage and initial uptake show differences between the first and the second scan, but otherwise the two sets of curves are very similar. Quantitative distribution volumes are listed in
Supplementary Table S4. Rather than the expected decrease from receptor blocking, both lesions in pig no. 26 show an approximately 20% increase in
VT from the first scan to the second when the uncorrected input function is used. With only two lesions in one pig, however, it is difficult to draw conclusions.
Using the corrected input function,
Supplementary Table S4 shows pronounced
VT differences (still increases) for the two lesions in pig no. 26, but we are hesitant to draw conclusions from these results, as they may reflect the sensitivity of
VT to the correction (cf.
Section 3.1). In addition, pig no. 26 unfortunately showed the lowest parent tracer fractions (cf.
Supplementary Figure S1) and therefore had the largest sensitivity to possible errors in the correction of the input function.
3.4. Limitations
A porcine model has the advantage over, e.g., a murine model that the physical sizes involved in both surgery and scans are larger, but the disadvantage is that the cost per animal is higher. Accordingly, this study is limited by a relatively small number of animals.
The non-traumatic osteomyelitis protocol has the advantage that it is a very realistic model of haematogenous osteomyelitis (in humans and animals) and infections were reasonably limited to the right hind limb, but the numbers and locations of infections varied among the animals. However, within the individual pig, the other hind limb could be used as a control, and for soft tissue, the uptake measured as the volume of distribution (
VT) in infected versus control sites showed quite clear differences (
Figure 10). As already noted, the study does not claim to report
VT on a robust absolute scale, which would also require data on protein binding in all animals.
A scanner replacement resulted in the last three pigs (no. 24–26) being scanned on a PET/CT scanner of a different brand and a newer generation than the initial scanner, enhancing the spatial resolution of the PET images. This allowed refined VOI drawing in these pigs, as reflected in the generally smaller VOI sizes for these animals (cf.
Supplementary Table S1). More precisely drawn VOIs could reduce a possible partial volume effect, in which case uptake would be expected to be more pronounced in pigs no. 24–26 than in the pigs scanned on the initial scanner. However, the results for
VT based on the uncorrected input function (cf.
Supplementary Table S4) do not indicate any pronounced effect. Using the corrected input function, pigs no. 25 and 26 do have high
VT values, but these values reflect the pronounced correction for the (possibly artificially low) parent tracer fractions in these pigs (cf.
Supplementary Figure S1), while an effect of voxel size should also be reflected in
VT calculated using the uncorrected input function.
Another potential source of error may be that the scans were performed on anaesthetized pigs, as the anaesthetic may affect blood flow and hence the kinetics of the tracer. However, it was not practically feasible to scan awake pigs. Propofol was chosen because it provides relatively uniform and safe anaesthesia over many hours.
The use of penicillin in the animals may have reduced the extent of the studied infections, but has previously been found to provide a better balance between the successful development of osteomyelitis and the avoidance of systemic infections requiring euthanasia of the animal [
23]. The use of opioids can have immunosuppressant effects, but so can pain reactions, which are reduced by the pain-killer effect; buprenorphine was chosen because it has shown weaker immune effects than morphine and fentanyl [
24]. As the target molecule VAP-1 for the tracer is not related to the infecting agent but is instead part of the natural immune system response, there is no reason to expect direct interference between [
68Ga]Ga-DOTA-Siglec-9 and the antibiotic pharmaceuticals (penicillin and buprenorphine).
4. Materials and Methods
4.1. Porcine Infection Protocol
The animal protocol was approved by the Danish Animal Experimental Board, journals no. 2012-15-2934-00123 (original approval) and 2017-15-0201-01239 (renewed approval, no substantial changes to the protocol), and all procedures followed the European Directive 2010/63/EU on the protection of animals used for scientific purposes. The protocol for the haematogenous induction of osteomyelitis in domestic pigs has been detailed elsewhere [
23]; for general background, see [
14,
15,
16].
Briefly,
S. aureus was inoculated into the right hind limb of juvenile (19–25 kg) Danish Landrace–Yorkshire crossbred female pigs. The pigs were pre-acclimated for at least one week, during which they were housed in groups in boxes with restricted access to food (Dia plus FI, DLG, Copenhagen, Denmark) and
ad libitum access to tap water. The temperature was 20–24 °C, the humidity was 45–65%, and there were 12 h of darkness and 12 h of light in the stables. The pigs came from a specific pathogen free (SPF) herd and were clinically examined by a veterinarian before inoculation. The pigs were fasted for approximately 16 h before premedication with midazolam and Stresnil and propofol anaesthesia. After inoculation, the pigs were individually housed. The
S. aureus used was the porcine strain S54F9 [
25], and 8000 to 30,000 CFU/kg (colony forming units per kg body weight) were inoculated. To selectively infect the right hind limb, bacteria were injected into the right femoral artery. To further reduce the possibility of systemic infection, the pigs were administered penicillin (10,000 EI/kg) at the onset of the first clinical signs of disease; for such juvenile pigs this dosage has previously been shown to allow the development of osteomyelitis while minimizing cases of systemic infection [
23]. To reduce pain in the days until euthanasia, the animals were treated every 8 h with buprenorphine (Temgesic; 0.3 to 0.9 mg intramuscularly, depending on clinical symptoms). Osteomyelitis was allowed to develop for approximately one week, after which the pig was scanned with PET and computed tomography (PET/CT, see below) and euthanized. If a pig reached predefined humane endpoints [
23] before this time, it was euthanized (and not scanned).
Although the protocol was originally designed for inducing osteomyelitis [
17], several pigs also developed soft tissue infections in the inoculated hind limb, typically related to bone infection or the site of inoculation. This turned out to be an advantage, as it allowed us to compare osteomyelitis and soft tissue infections. Some of the pigs also developed lung abscesses. However, these abscesses were outside the field-of-view of the dynamic PET scans and are therefore not included in this kinetics study.
4.2. Animals and Lesions
This study includes eight pigs dynamically scanned with PET/CT using [
68Ga]Ga-DOTA-Siglec-9 (details below). The characteristics of these pigs are summarized in
Table 1. These eight pigs are a subset of the animals from the overall osteomyelitis project but represent all pigs in the project scanned with this tracer.
Before euthanasia, each pig was also PET/CT scanned with [
18F]FDG; these scans have been reported earlier and found [
18F]FDG to be a sensitive (but unspecific) marker of
S. aureus infection [
17,
19,
26]. Infectious lesions were identified on [
18F]FDG PET/CT scans. As part of the post-euthanasia analysis, selected lesions were verified by necropsy to be suppurative and to be caused by the inoculated
S. aureus strain, S54F9.
For the identified lesions, volumes of interest (VOIs) for PET data analysis were drawn on the [
68Ga]Ga-DOTA-Siglec-9 PET/CT scans using Carimas 2.9 software (Turku PET Centre,
www.turkupetcentre.fi/carimas). For osteomyelitis lesions, the VOI drawing was based on the CT part of the scan, while for soft tissue lesions the VOI drawing was guided by the PET scan.
For each lesion, a reference VOI was drawn in the anatomically corresponding position in the left, non-infected limb.
4.3. Radiochemistry
The radioactive labelling of DOTA-Siglec-9 has previously been discussed and described in detail [
22]. The [
68Ga]Ga-DOTA-Siglec-9 radiosynthesis method called method 3 in the reference was applied in this study.
In summary, 68Ga was eluted from a 68Ge/68Ga generator (GalliaPharm, Eckert & Ziegler, Berlin, Germany), trapped on a cation-exchange cartridge (Strata-XC 33 u Polymeric Strong, Phenomenex, Værløse, Denmark), and eluted from the cartridge with an acidified acetone solution. The pH was adjusted using HCl (0.1 M in metal-free water), and acetone was removed by heating. A solution of DOTA-Siglec-9 peptide in metal-free water was added, and 68Ga incorporation took place. Water was added to the mixture, which was then run through a preconditioned C-18 Sep-Pak cartridge to trap [68Ga]Ga-DOTA-Siglec-9. The product [68Ga]Ga-DOTA-Siglec-9 was released from the cartridge with ethanol and diluted with saline. After this process, the product was ready for injection.
After 25 min, a 62% non-decay-corrected (ndc) yield of the product was obtained. The [
68Ga]Ga-DOTA-Siglec-9 was found by a radio HPLC system to be more than 98% radiochemically pure, and the specific radioactivity was approximately 35 MBq/nmol. Representative radio-HPLC chromatographs are shown in
Supplementary Figure S11.
4.4. Dynamic PET Scans
Before scanning, each pig was anaesthetized with propofol, and catheters were implanted in the jugular vein and carotid artery [
17]. After an initial CT scan, the pig was dynamically PET scanned for 60 min in 23 time frames: 8 × 15 s, 4 × 30 s, 2 × 60 s, 2 × 120 s, 4 × 300 s, and 3 × 600 s. The [
68Ga]Ga-DOTA-Siglec-9 tracer was injected into the jugular vein at the start of the PET scan. The tracer activities are shown in
Table 1. All of these scans were performed at the Department of Nuclear Medicine, Aalborg University Hospital.
Pigs no. 6–23 were scanned on a GE VCT Discovery 64 PET/CT scanner (GE Healthcare, Chicago, IL, USA). The scan field covered 15 cm in the axial direction and was positioned over the pelvis and the hind limbs. The images were reconstructed with an ordered subset expectation maximization (OSEM) algorithm (3D Vue Point, GE). The reconstruction parameters were 2 iterations, 28 subsets, a 128 × 128 matrix in 47 slices, a 5.5 × 5.5 × 3.3 mm3 voxel size, and a 6 mm Gaussian filter.
Due to scanner replacement, pigs no. 24–26 were scanned on a different scanner than the previous pigs. Pigs no. 24–26 were scanned on a Siemens Biograph mCT (Siemens, Erlangen, Germany) with time-of-flight (TOF) detection. The scan field covered 22 cm in the axial direction, positioned over the pelvis and the hind limbs. The images were reconstructed with an OSEM algorithm without using the resolution recovery option (setting “Iterative + TOF”). The reconstruction parameters were 3 iterations, 21 subsets, a 400 × 400 matrix in 1.02 × 1.02 × 2.03 mm3 voxels, and a 3 mm Gaussian filter.
On both scanners, image reconstruction included decay-correction to the start of scanning and attenuation-correction based on the CT scan.
4.5. Blood Samples
An arterial blood sample was drawn before the tracer was injected (zero-sample). During the dynamic PET scan, 27 blood samples were drawn. All blood samples were drawn manually from the carotid artery, and the precise time (seconds) of each sample was recorded. Time zero was the time of injection, which was also the scan start time.
In pigs no. 6–10, the blood samples were drawn every 5 s for 50 s (10 samples), at 60, 80, 100, 120, and 150 s post-injection (p.i., 5 samples), and at 3, 4, 5, 6, 8, 10, 15, 20, 30, 40, 55, and 70 min p.i. (12 samples), i.e., 27 blood samples. Samples for analysis of the fraction of radioactivity originating from the parent tracer (rather than from radioactive metabolite products or free gallium) were drawn at 2, 5, 10, 15, 25, 35, 50, and 70 min p.i.
In pigs no. 22–26, the blood sample timing was slightly optimized. Blood samples were drawn every 5 s for 40 s (8 samples), at 50, 60, 80, 100, 120, and 150 s p.i. (6 samples), and at 3, 4, 5, 6, 8, 10, 15, 20, 25, 30, 40, 50, and 60 min p.i. (13 samples), i.e., 27 blood samples. Blood samples for analysis of the parent tracer fraction were drawn at 2, 5, 10, 15, 25, 40, and 60 min p.i.
As noted in
Table 1, pig no. 26 was scanned twice, and 5 mg of “cold” (unlabelled) DOTA-Siglec-9 was injected before the second scan. Blood sampling was independently performed for the two scans.
Plasma samples were obtained by collecting the supernatant after the centrifugation of whole blood samples. Aliquots of the samples were counted in a calibrated Wizard 2480 gamma counter (PerkinElmer, Turku, Finland) with an energy window from 450 to 1200 keV. The counting results were converted to decay-corrected radioactivity concentrations (Bq/mL at the time of injection).
The plasma samples for analyses of the parent tracer fraction were denatured by thoroughly mixing 0.5 mL plasma with 0.5 mL acetonitrile, after which the mix was centrifuged (approximately 1 min, 10,000 rpm) to accelerate the precipitation of the plasma proteins. An aliquot was collected for HPLC analysis (see below). The radioactivity of the precipitate was determined with the Wizard 2480 gamma counter. Protein binding was calculated as
using decay-corrected activities.
For the determination of parent tracer fractions in a sample, 0.2 mL of the supernatant was diluted with 0.8 mm water; this dilution was run through an HPLC with a fractionation collector. The fraction collector was set up with a 20 s delay to compensate for delays in the system. Twenty fractions of 45 s each were collected and counted in the Wizard 2480 gamma counter.
4.6. Tissue Samples and Immunofluorescence (IF)
As a proof of concept, the surface expression of VAP-1 in infected tissue was tested by an augmented protocol in one pig.
Approximately 10 min before euthanasia, pig no. 25 was administered 10 mg of VAP-1-binding antibody as an intravenous (i.v.) injection (10 mL injected liquid). The antibody was 1B2, a mouse IgM against human VAP-1 that also recognizes porcine VAP-1 [
27]. The i.v. injection allowed 1B2 to bind to the VAP-1 expressed on cell surfaces, but not to the VAP-1 within intact cells.
After euthanasia of the pig, soft tissue samples were collected from acutely inflamed areas (phlegmon/early abscess) located peripheral to the osteomyelitis in the distal right femur and from similarly positioned non-inflamed areas in the left hind limb. All samples were embedded in a cryo-compound and frozen in petroleum spirit (VWR, Søborg, Denmark, cat. no. 87125.320) cooled with dry ice. The tissues were stored at −80 °C until use.
Immunofluorescence (IF) analysis was performed on 5 µm thick frozen sections of these samples. The first of two serial sections from the inflamed area (right limb) were stained with anti-VAP-1 mAb (1B2) or a class-matched negative control antibody, 7C7 (10 µg/mL; 1 h at room temperature) and then with a secondary antibody (Alexa 555-goat-anti-mouse IgM 1:100, Southern Biotech 1020-32; 30 min at room temperature), followed by nuclear staining with Hoechst 1:10,000 in PBS for 5 min, Thermo Scientific 6249, Waltham, MA, USA). The combined IF signal thus represented the VAP-1 within the cytoplasm as well as the VAP-1 expressed on cell surfaces. The second section was stained only with the secondary antibody; thus, the IF signal represented only the VAP-1 accessible to the i.v. injected antibody. A pair of sections from the left limb was similarly stained to represent the corresponding signals from non-infected tissue.
4.7. Input Function and Metabolite Correction
For each dynamic PET/CT scan, the decay-corrected plasma samples were used as a basic input function.
For metabolite correction, the parent tracer fraction data were fitted with a Hill-type function:
where
t is the sampling time (seconds since injection). The function starts at
f(0) = 1 (thus assuming no metabolism before injection) and has an asymptotic value f(∞) =
a. The parameters
a,
b and
c were fitted for each injection of [
68Ga]Ga-DOTA-Siglec-9.
In the following text, the uncorrected input function denotes the total radioactivity concentration (decay-corrected Bq/mL) from plasma samples, and the corrected input function denotes the fraction f(t) multiplied by the uncorrected input function.
As blood samples were taken from the carotid artery (a short distance from the heart), while the PET data were acquired over the hind end of the pig (a longer distance from the heart), the PET data were delayed by some seconds relative to the blood plasma data. To correct for these delays, an offset to the plasma time stamps was determined for each pig using the method described in [
19]. The largest of these corrections was 8 s.
4.8. Kinetic Modelling
Data were modelled using the three kinetic models shown in
Figure 6. This was performed twice for each model: once with the uncorrected input function and once with the corrected input function. The modelling was performed using software available on the Turku PET Centre website (fit2k for 1TCM, fit3k for irr2TCM, fit4k for rev2TCM) [
28].
Data points were weighted based on time frame length (
L) and decay:
This weighting scheme mirrors the overall count statistics of the decay-corrected PET data. Unlike weights based on counts in a VOI, the weights from Equation (3) do not in themselves contain noise. See reference [
19] for a more detailed discussion of this weighting scheme.
For in vivo imaging, the volume of distribution in tissue (
VT) is defined as the ratio of tissue concentration to input concentration at a time when a steady-state has been reached [
29], i.e.,
The measurement of tissue concentration in Bq/cm3 (from the PET scan) and input concentration in Bq/mL (from plasma samples in the gamma counter) results in mL/cm3 as the unit of VT.
For a given model with reversible uptake, the relationship between
VT and the model parameters can be theoretically calculated. In the cases of the 1TCM and the rev2TCM models, these relationships are [
29]:
For models with irreversible uptake, such as irr2TCM, a steady-state is never reached and VT is not defined. Mathematically, the tracer input concentration will be continually decreasing, while the uptake in the irreversible compartment will monotonically increase, and over time, the fraction in Equation (4) will diverge instead of converging.
The parent tracer fraction appeared to decrease faster in pig no. 26 (both scans) than in the other pigs, and was close to zero after approximately 30 min post-injection (see
Supplementary Figure S1). The corrected input function in this case would therefore be close to zero (expectedly with high percentage errors) at late time points, which could lead to unreliable estimation of
VT = tissue concentration/input concentration. For these reasons, modelling of pig no. 26 with the corrected input function was performed using only the data within the interval 0–30 min rather than the full interval 0–60 min.
4.9. Evaluation
In addition to visual inspections of the fits, the three models were compared using the corrected Akaike information criterion (AIC
c), which favours a good fit, but penalizes the use of excessive fitting parameters [
30,
31]. The absolute value of AIC
c depends on both the data and the model, but for a given data set, the lowest value of AIC
c indicates the most favourable model.
Furthermore, Patlak plots [
32,
33] were calculated to help determine whether uptake was reversible or irreversible. A linear Patlak plot (after an equilibration time) is a sign of irreversible uptake, while a system with only reversible uptake will result in a non-linear Patlak plot that eventually approaches a constant value. The Patlak plot is directly calculated from the data, without the assumption of any specific uptake model. The Patlak plots were based on the data from 10 to 60 min (10–30 min in pig no. 26 with corrected input function).
As a measure not requiring modelling, standardized uptake values (SUV) were also calculated, and the correlation between SUV and the volume of distribution VT was determined. The SUV calculation was based on the time interval 10 to 30 min, chosen as a time interval after the passage of the bolus peak, but not so late that a considerable part of the tracer with reversible binding (i.e., tracer not remaining in the tissue indefinitely) would have left the tissue yet.
4.10. Statistics
To compare the infected and control VOIs (i.e., right vs. left), a two-tailed paired
t-test was used, with a significance level of
p < 0.05. The normality of the differences was tested with the Shapiro–Wilk W test. The correlation between the volume of distribution
VT and SUV was defined using Pearson analysis. Statistics were calculated with StatsDirect version 3.1.14 (
www.statsdirect.com).
5. Conclusions
Using the VAP-1-targeted leukocyte ligand Siglec-9, the immunofluorescence analysis of infected tissue samples indicated that VAP-1 was expressed on the cell surfaces in infected tissue, while surface VAP-1 was not observed in non-infected tissue.
The uptake kinetics of [
68Ga]Ga-DOTA-Siglec-9 with localized infection in pigs were found to be well described with a reversible 2-tissue compartment model, similar to the model used by Retamal et al. [
12] in a study of severe lung inflammation, also in anaesthetized pigs.
We found that the parent tracer fraction decreased relatively rapidly, but despite this finding, we were unable to demonstrate an advantage of taking tracer metabolism into account in the analysis. More detailed analyses of the radioactive species occurring after the i.v. injection of [68Ga]Ga-DOTA-Siglec-9 in the body are warranted.
The [68Ga]Ga-DOTA-Siglec-9 uptake, evaluated as the volume of distribution, showed affinity to infection in soft tissue; however, no increased uptake in bone infections (osteomyelitis) could be demonstrated. This difference may be related to a previous report that found infected soft tissue to be more highly perfused than infected bone tissue (osteomyelitis).


 ,
, 


