
Phytochemical Characterization of Five Edible Purple-Reddish Vegetables: Anthocyanins, Flavonoids, and Phenolic Acid Derivatives

 ,
, 

Abstract
: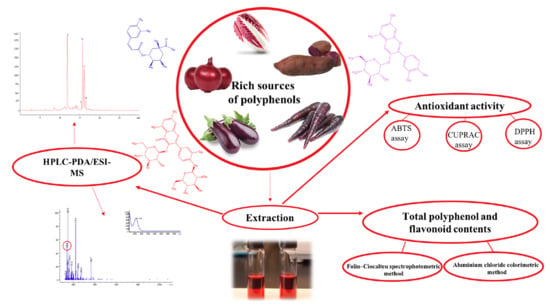
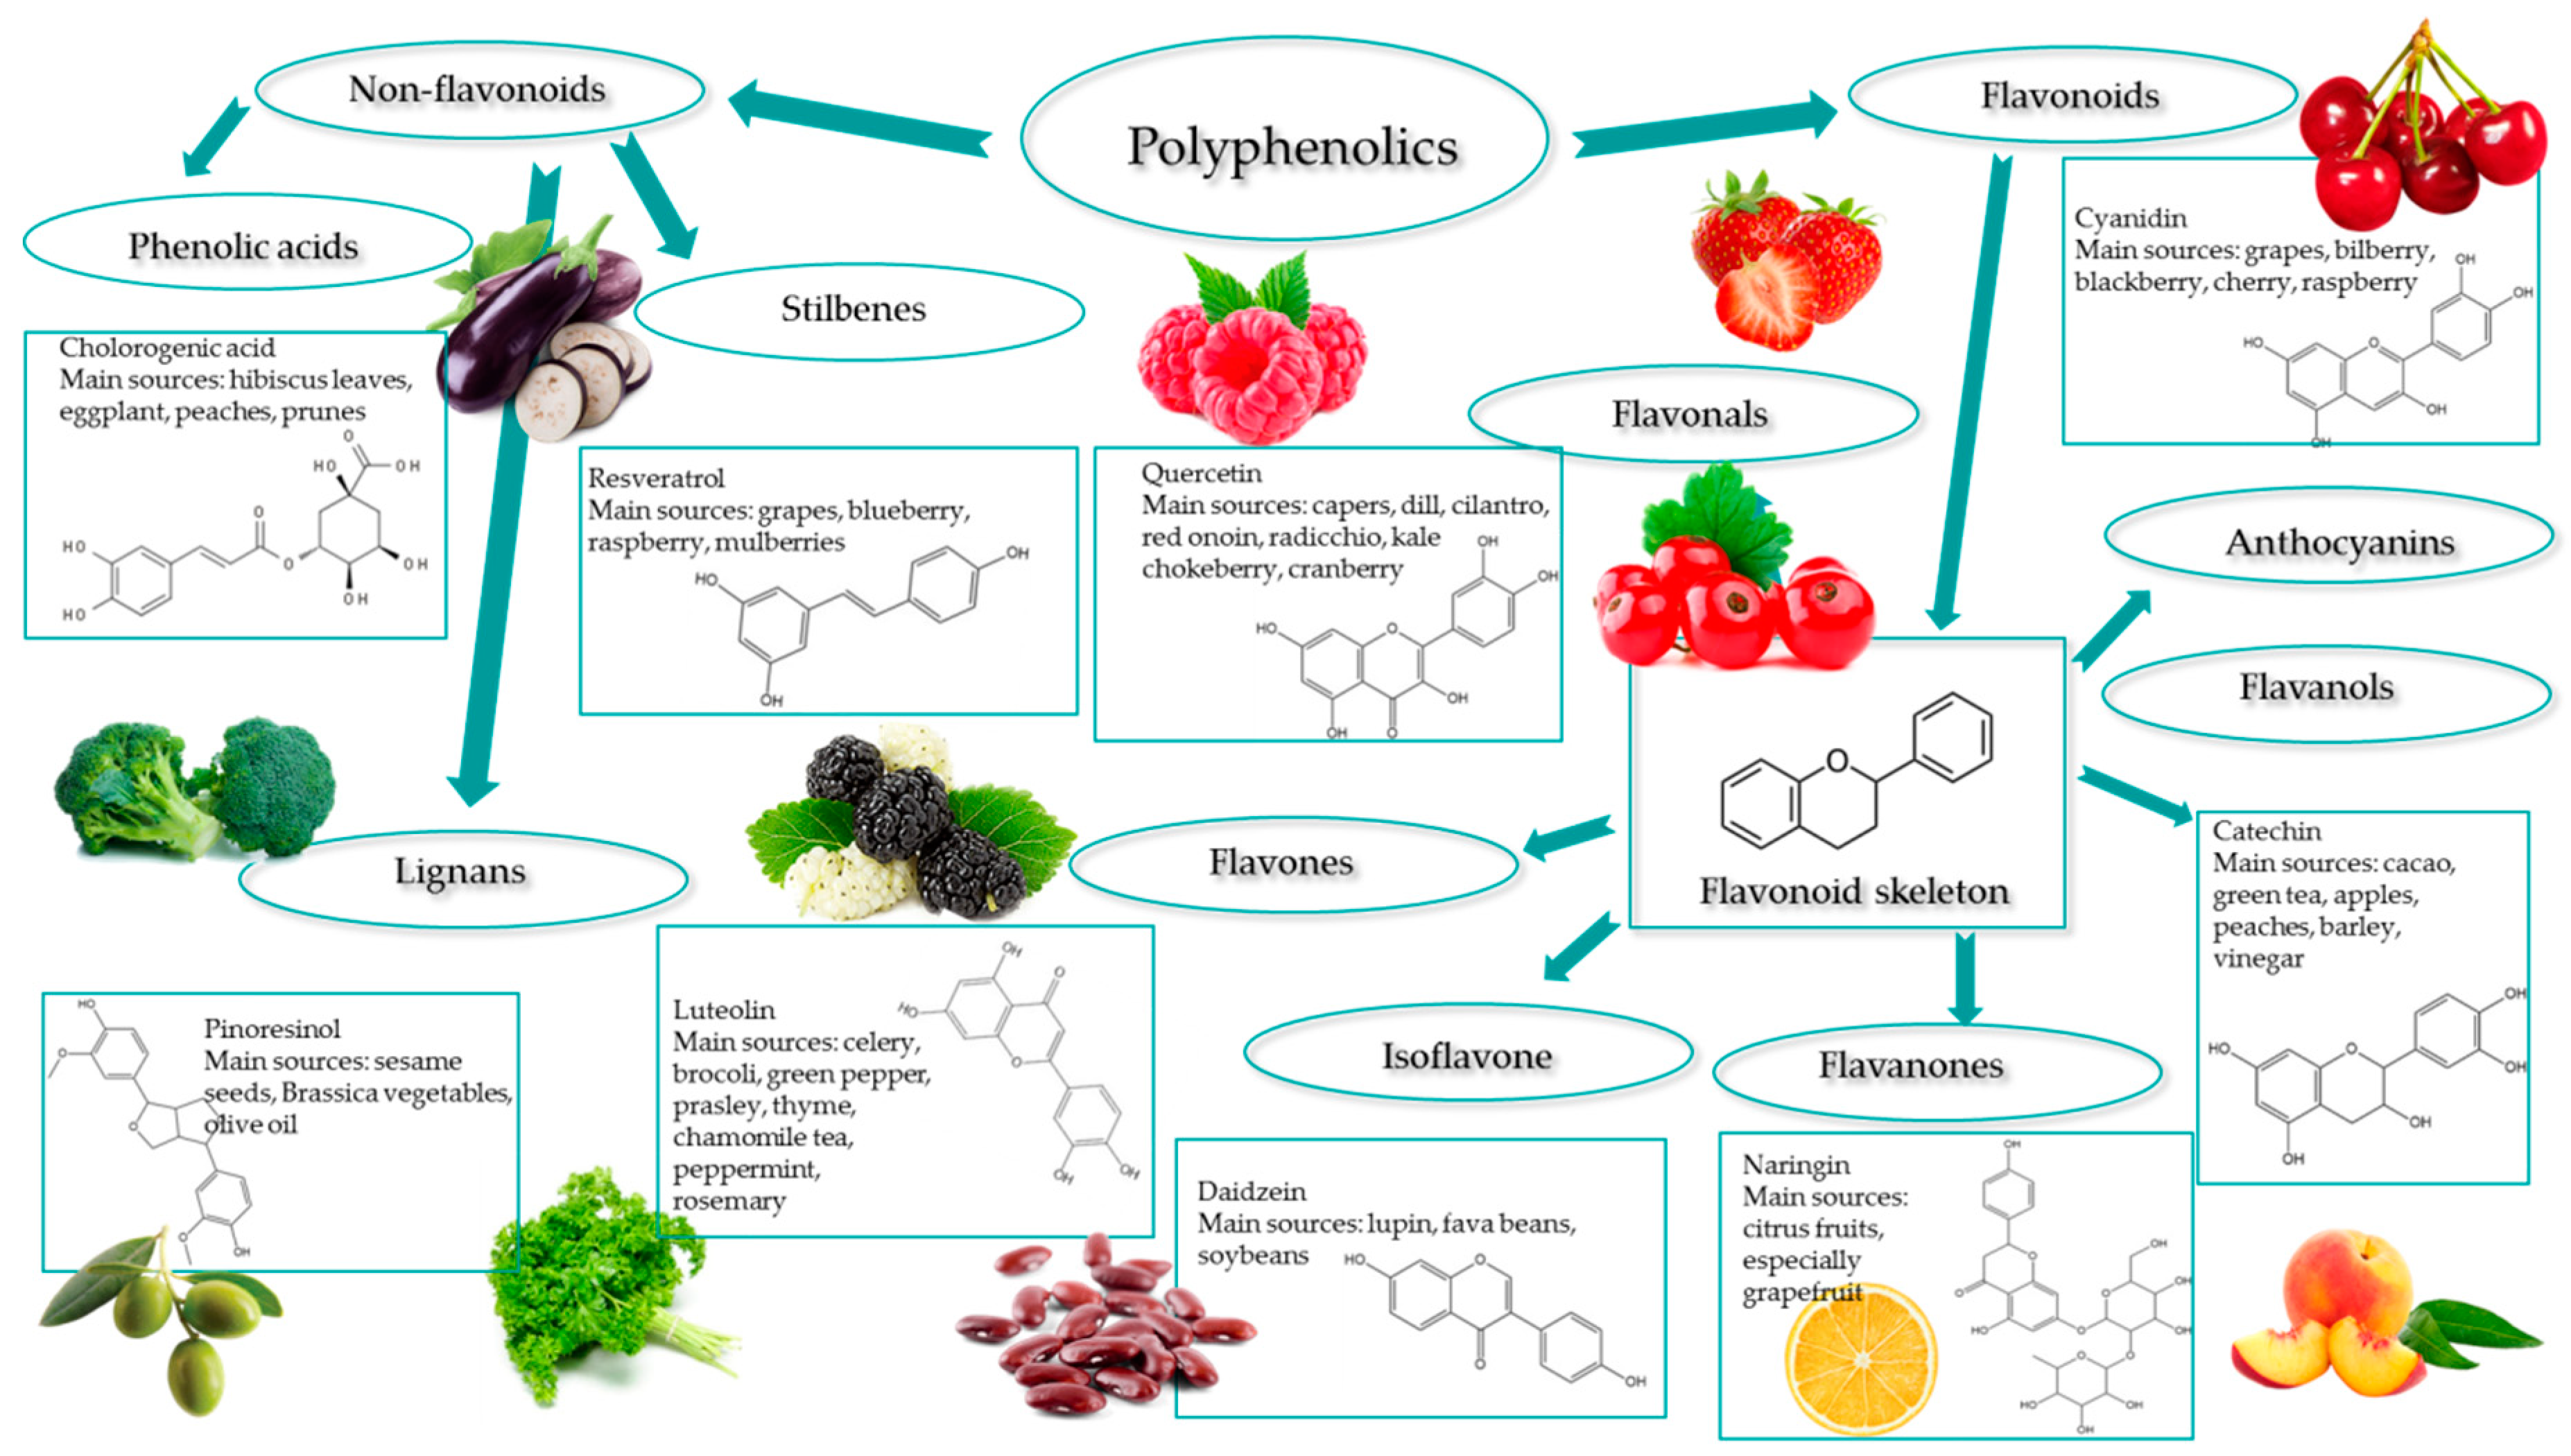
1. Introduction
2. Results and Discussions
2.1. Total Polyphenol and Flavonoid Contents
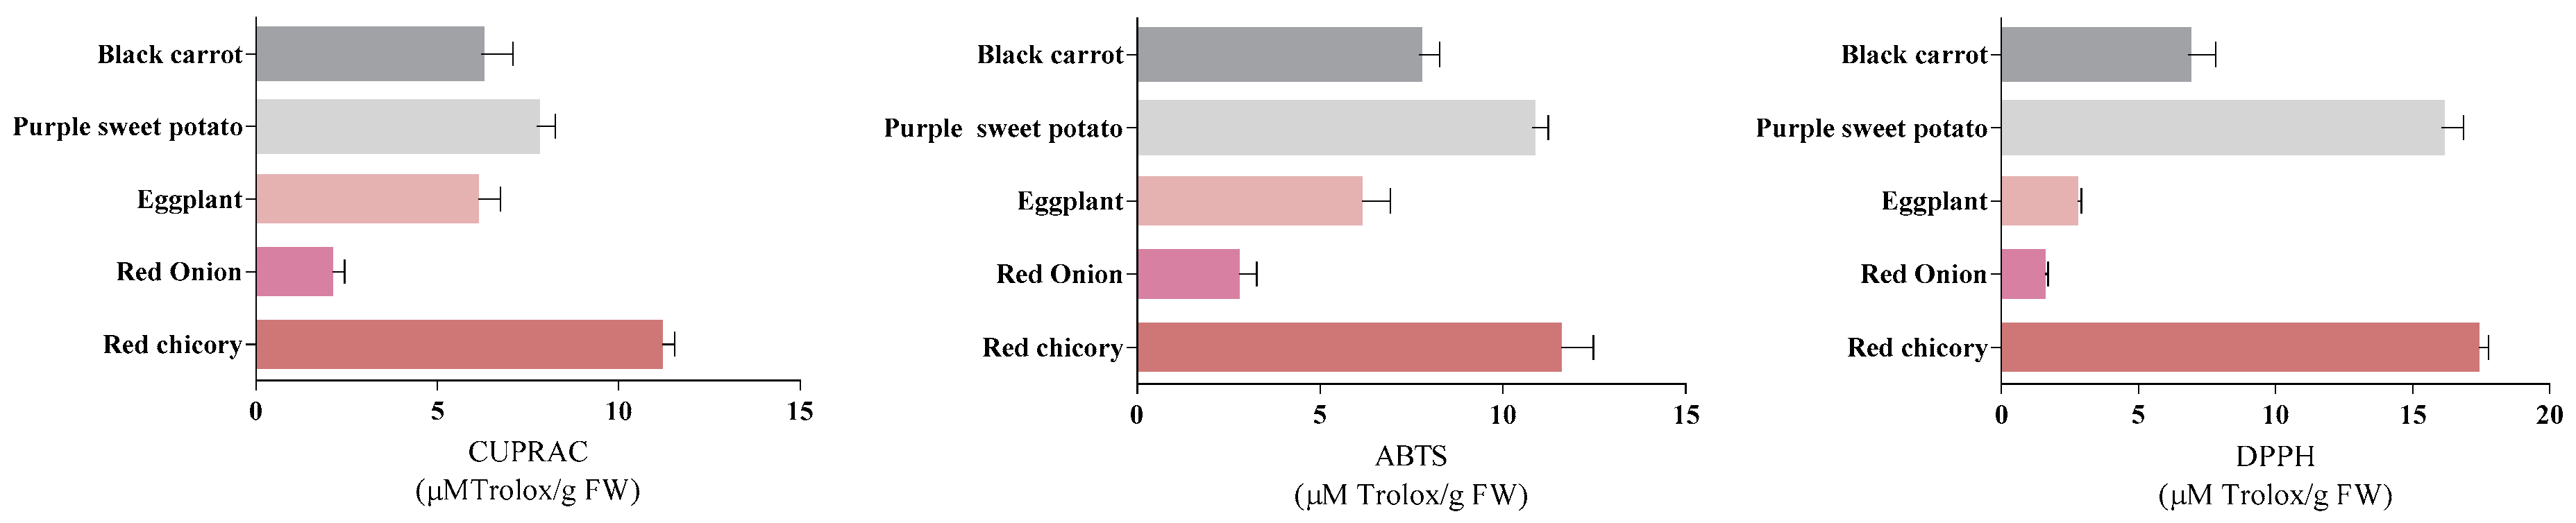
2.2. Antioxidant Activity
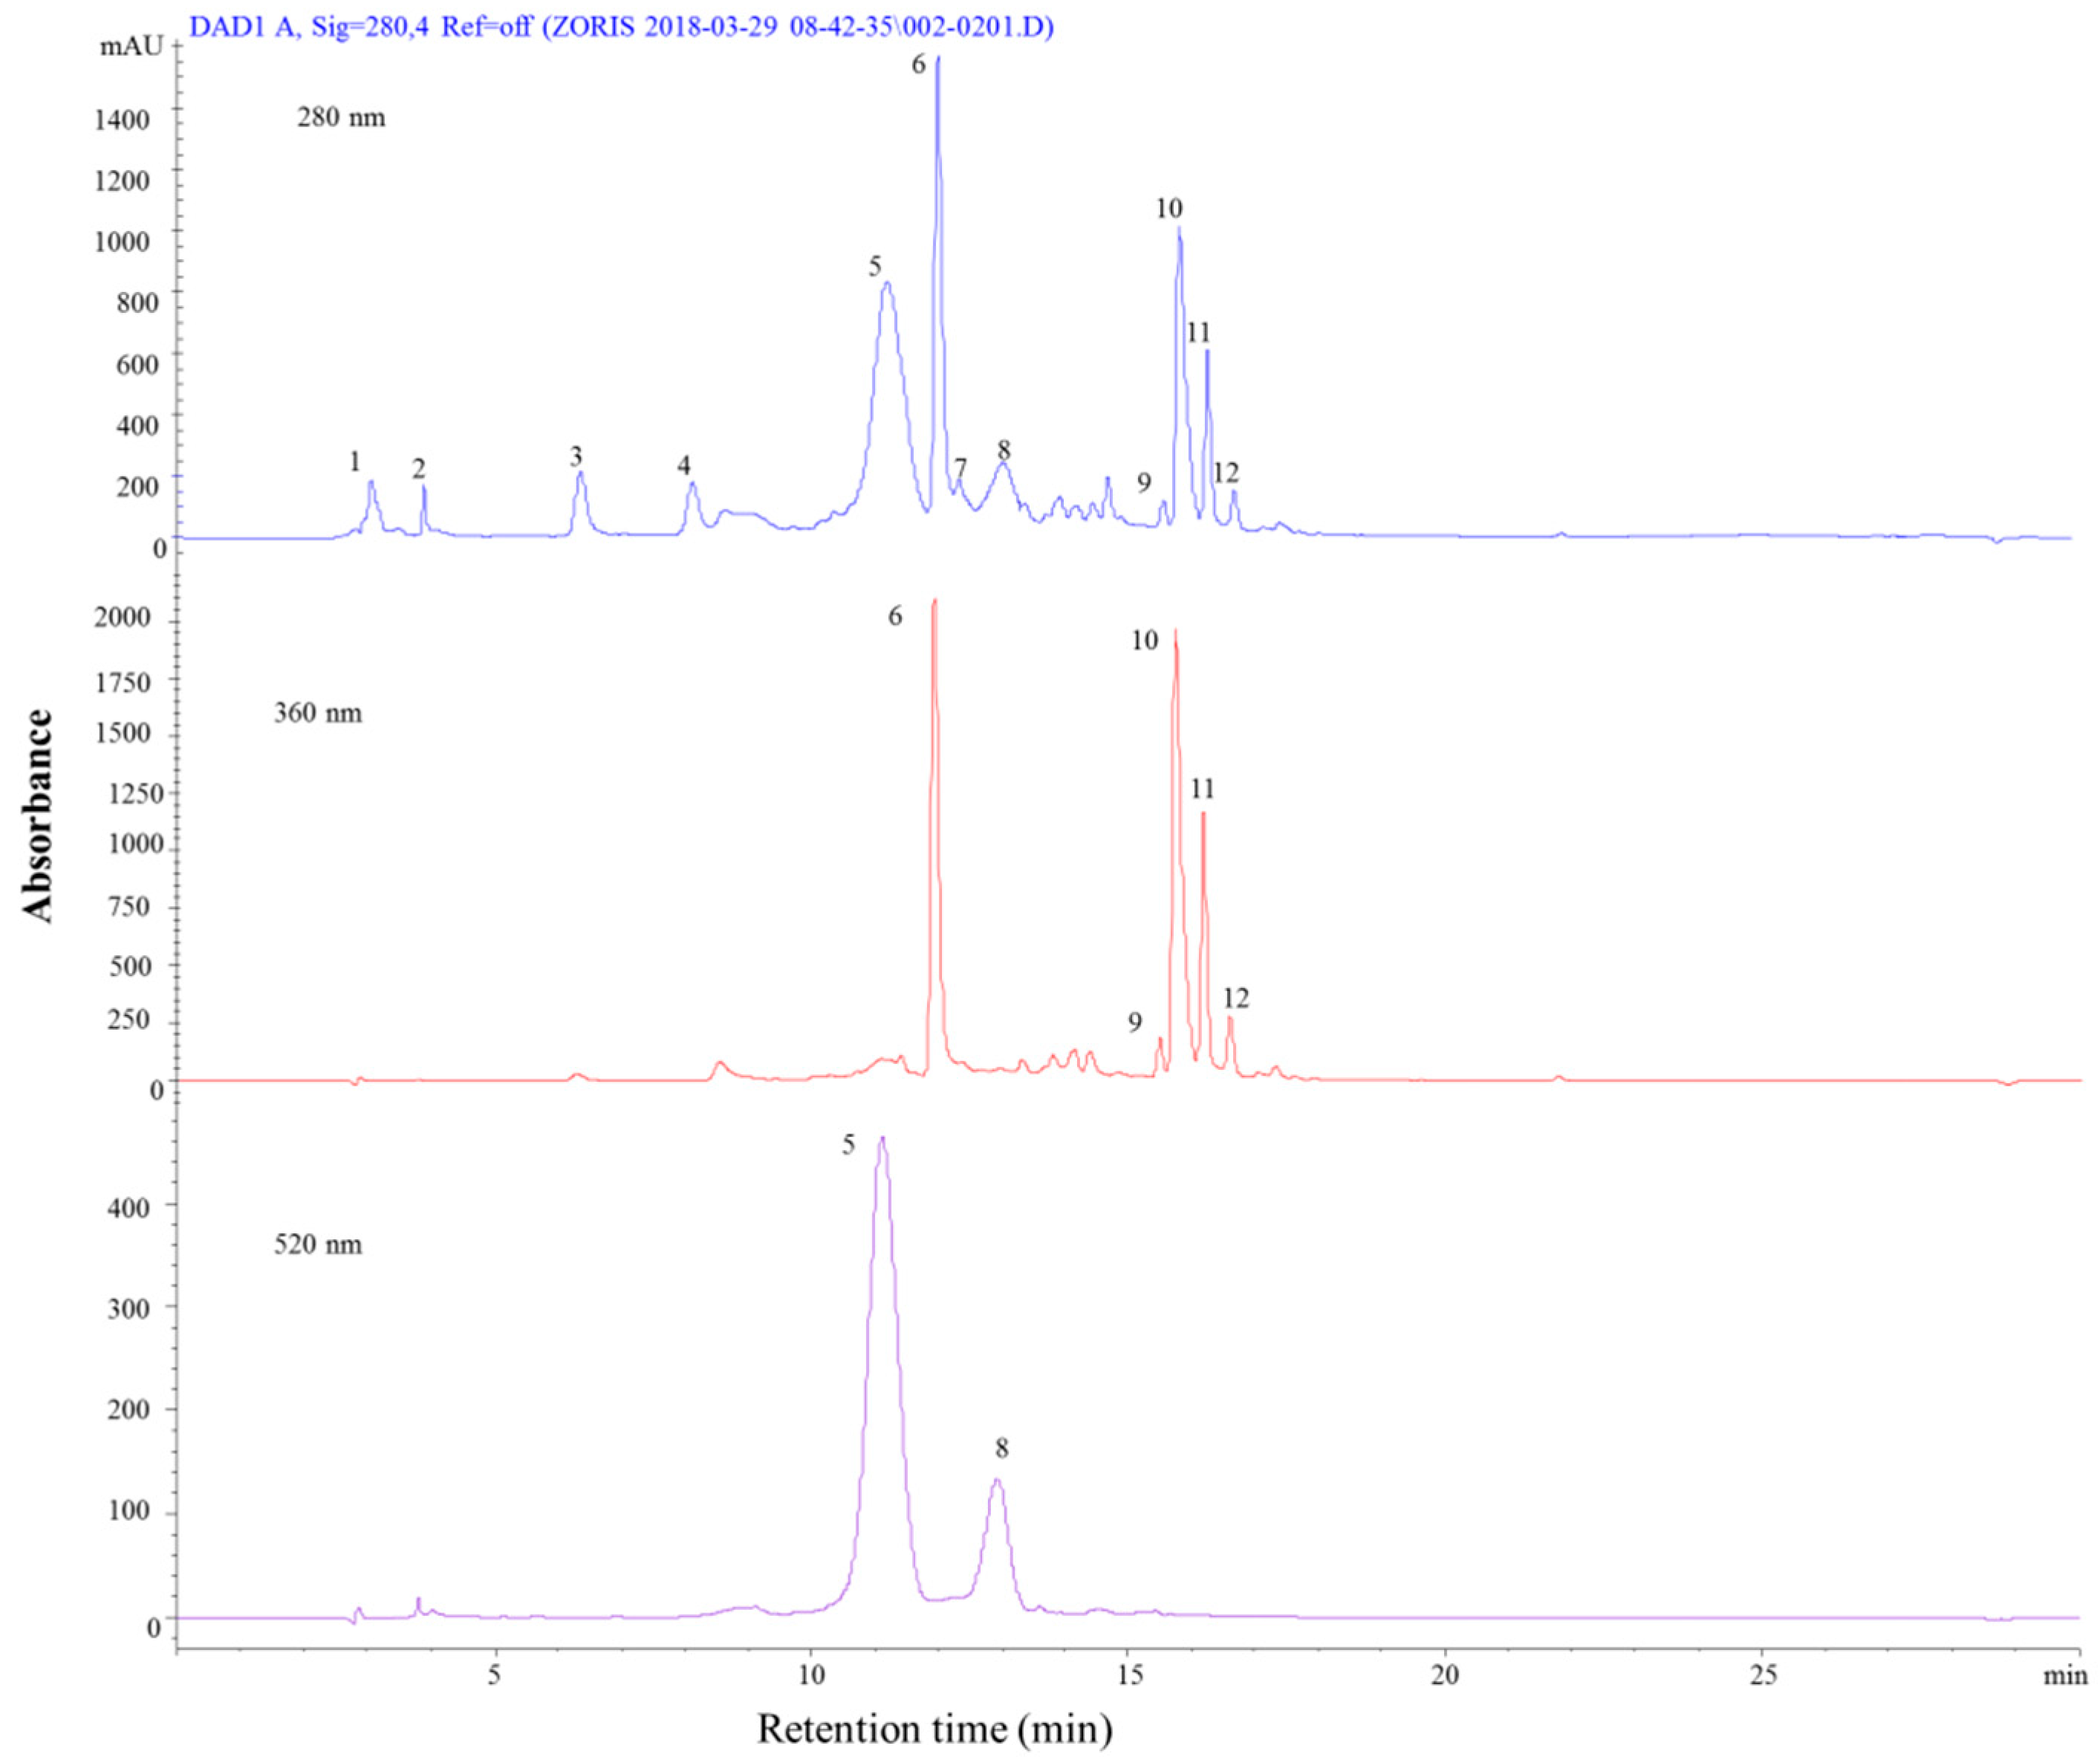
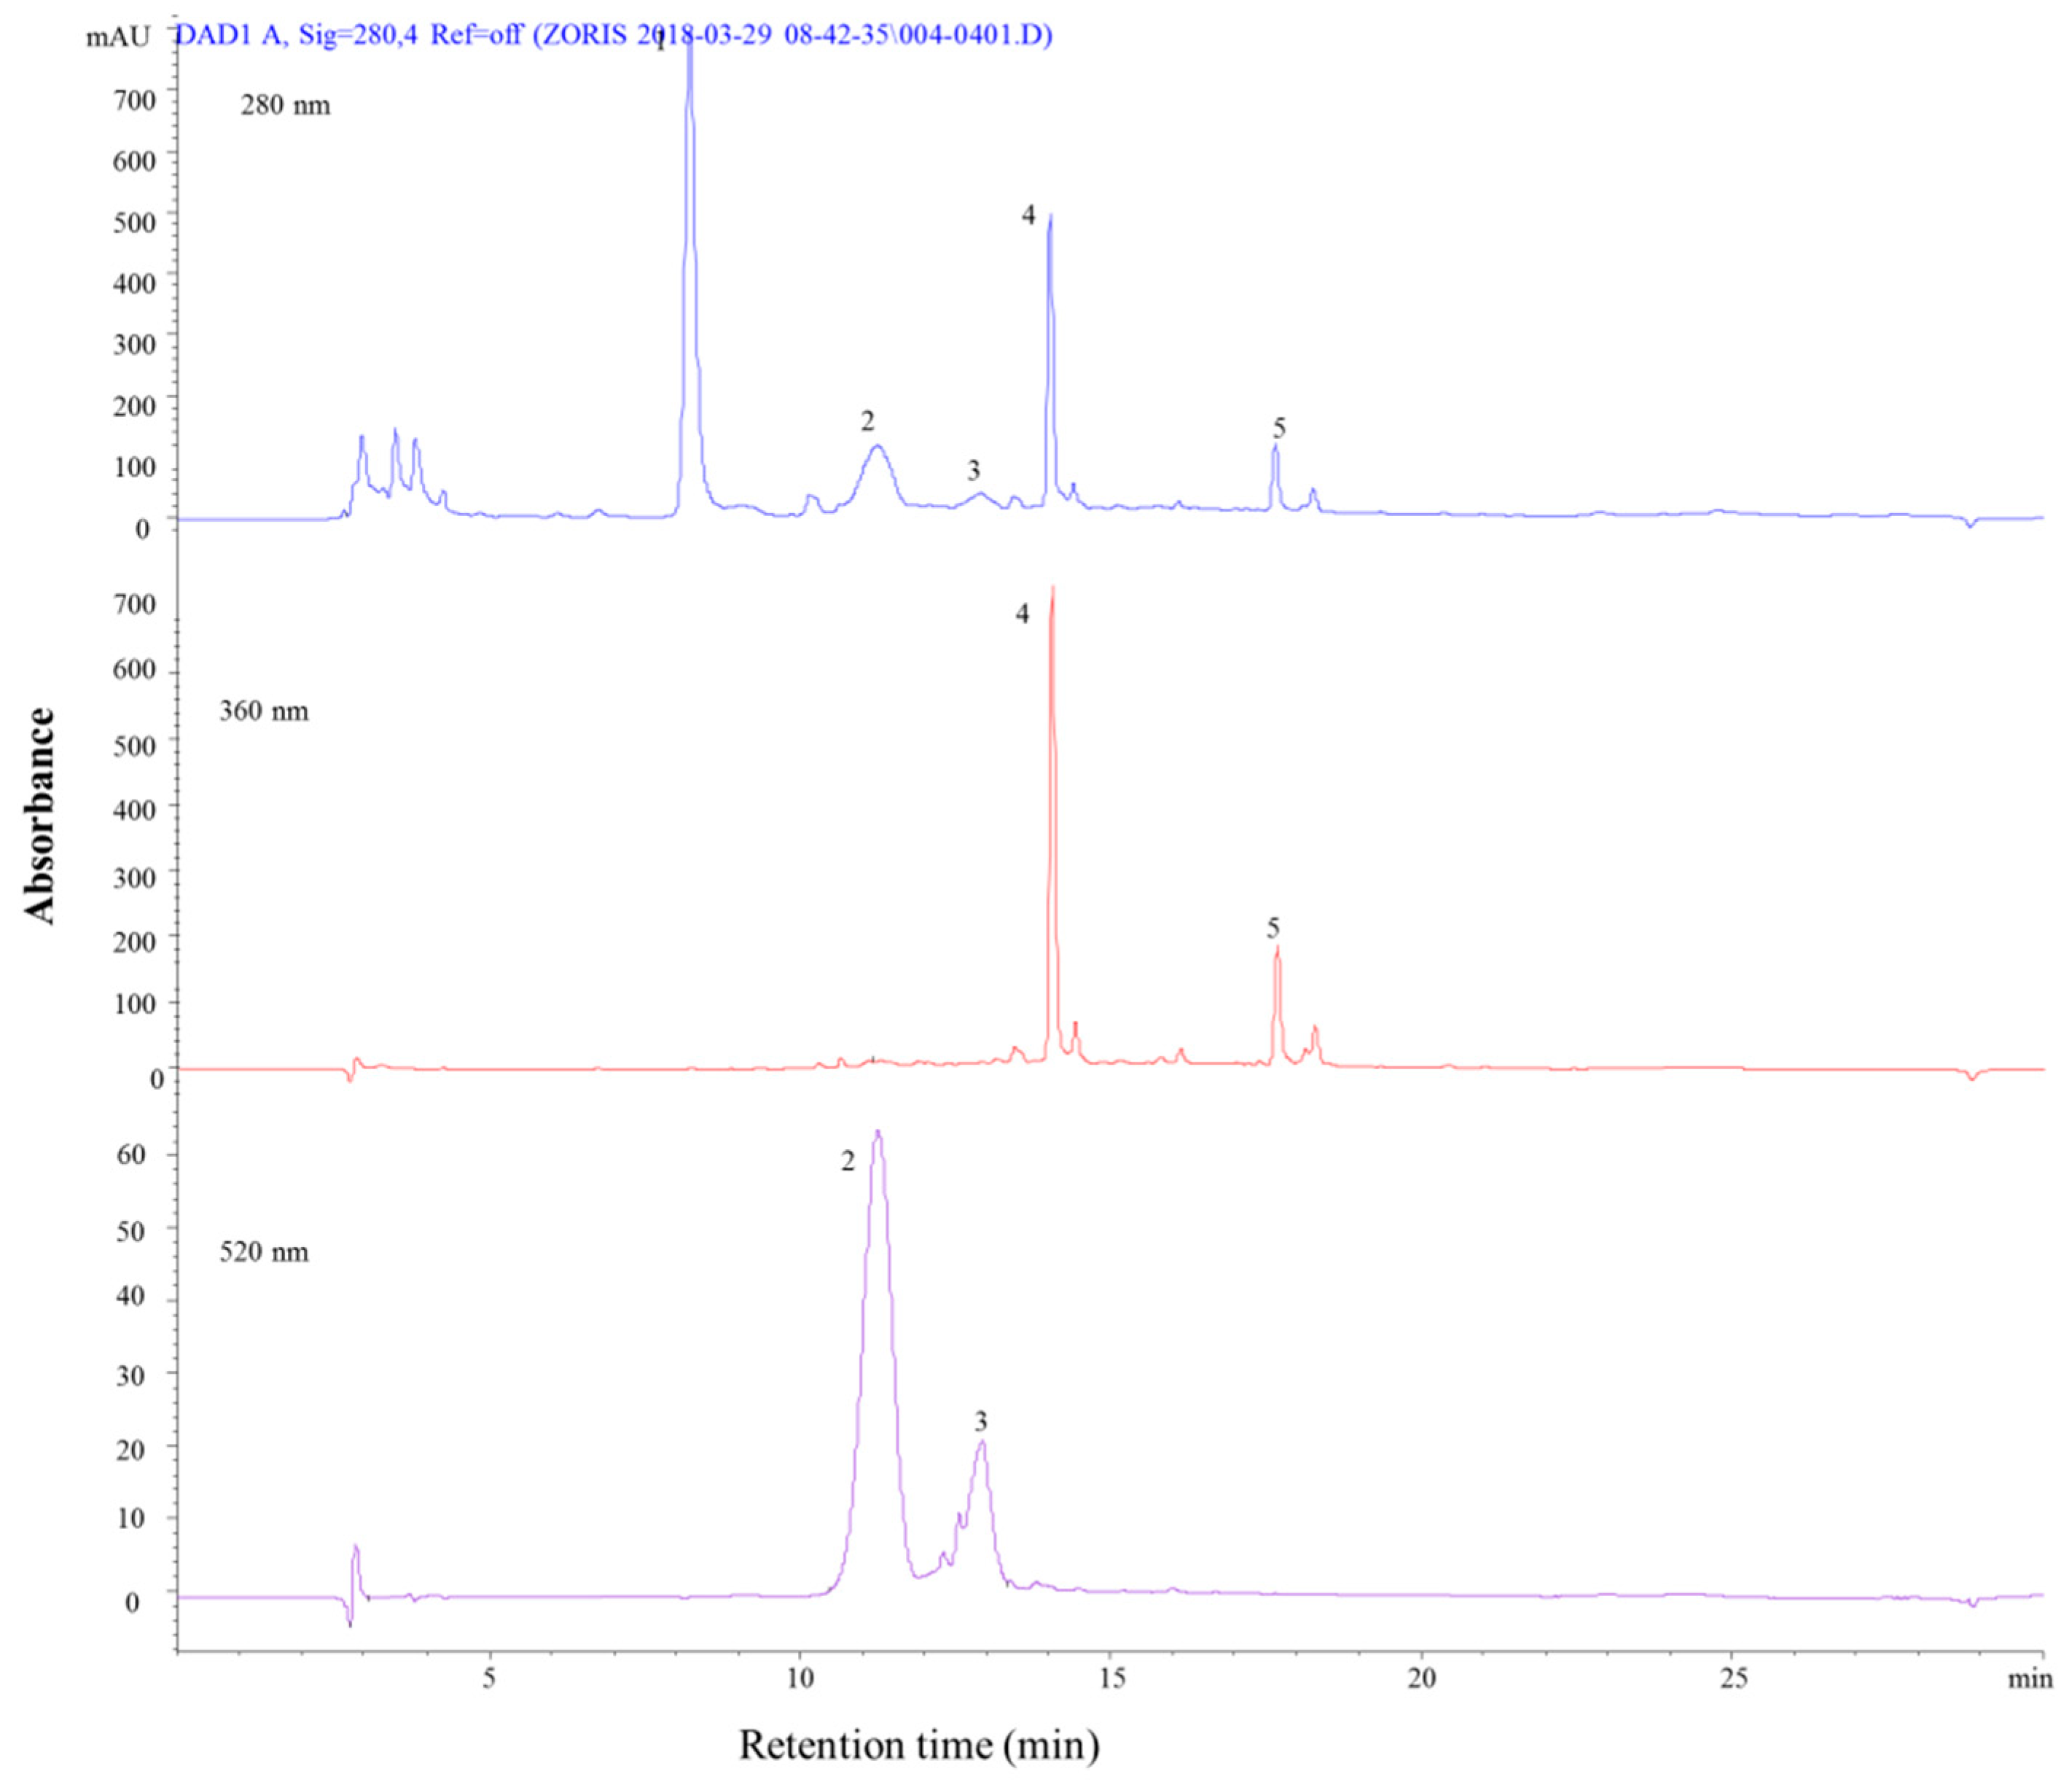
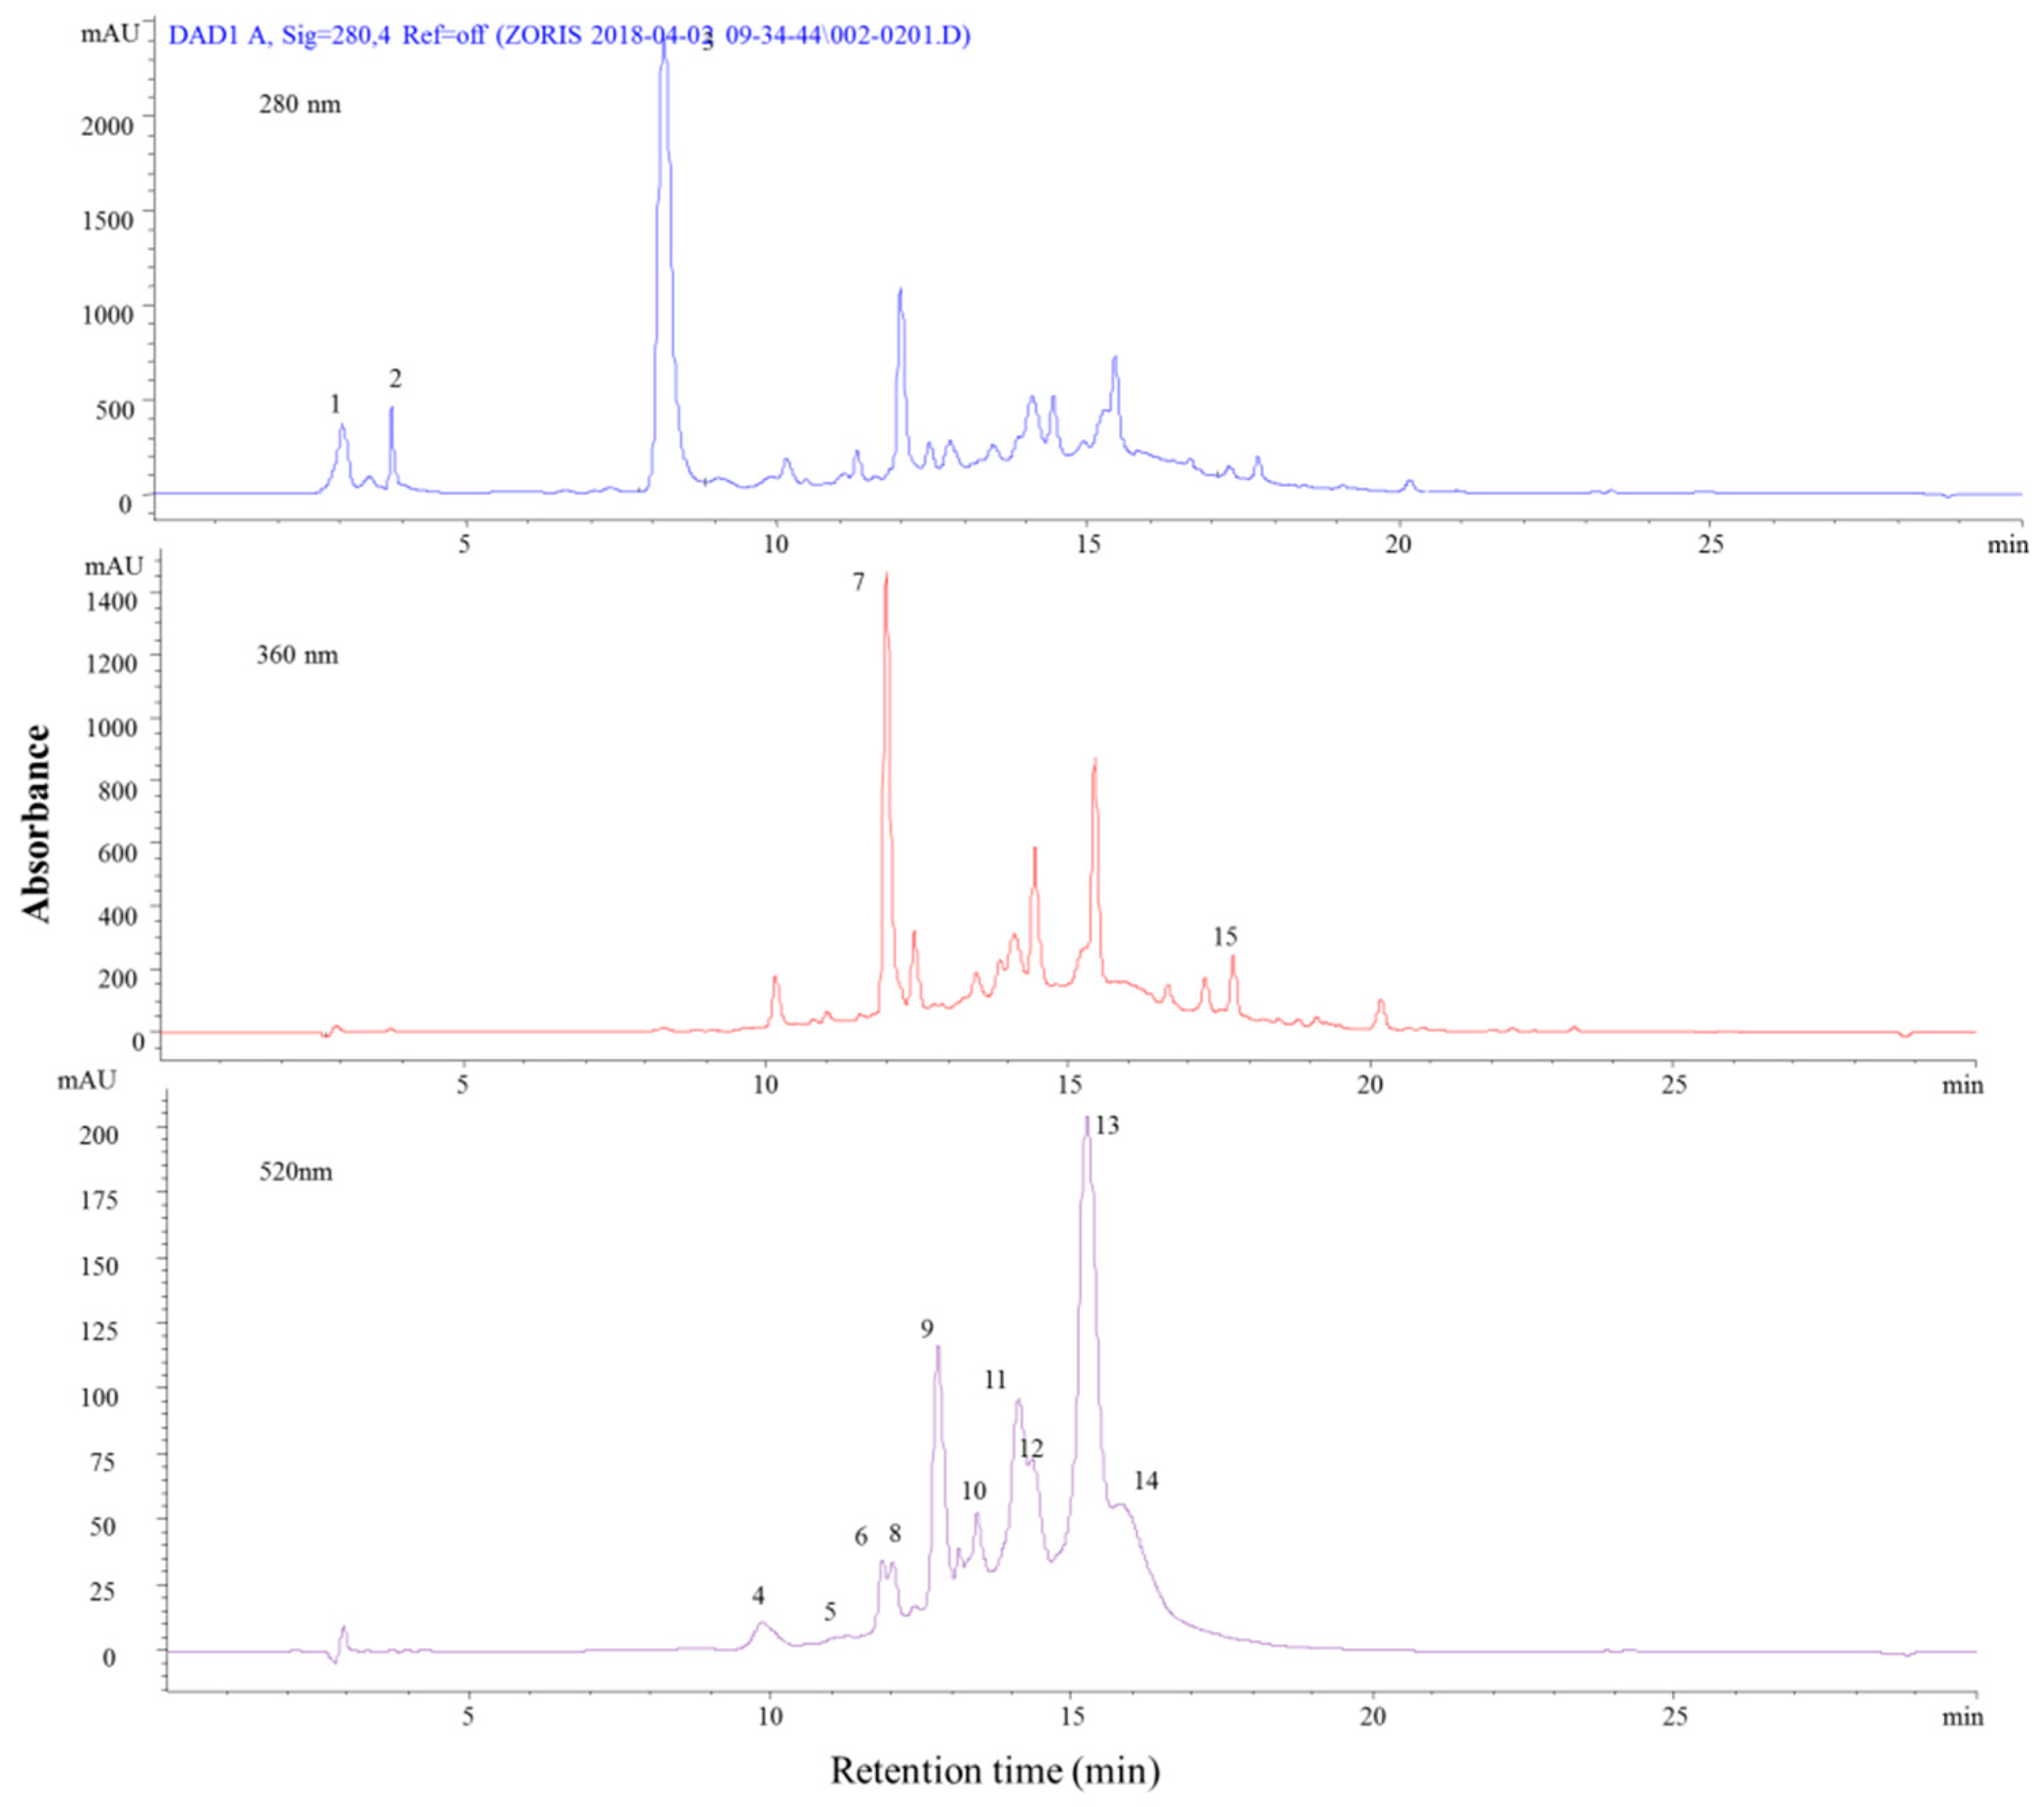
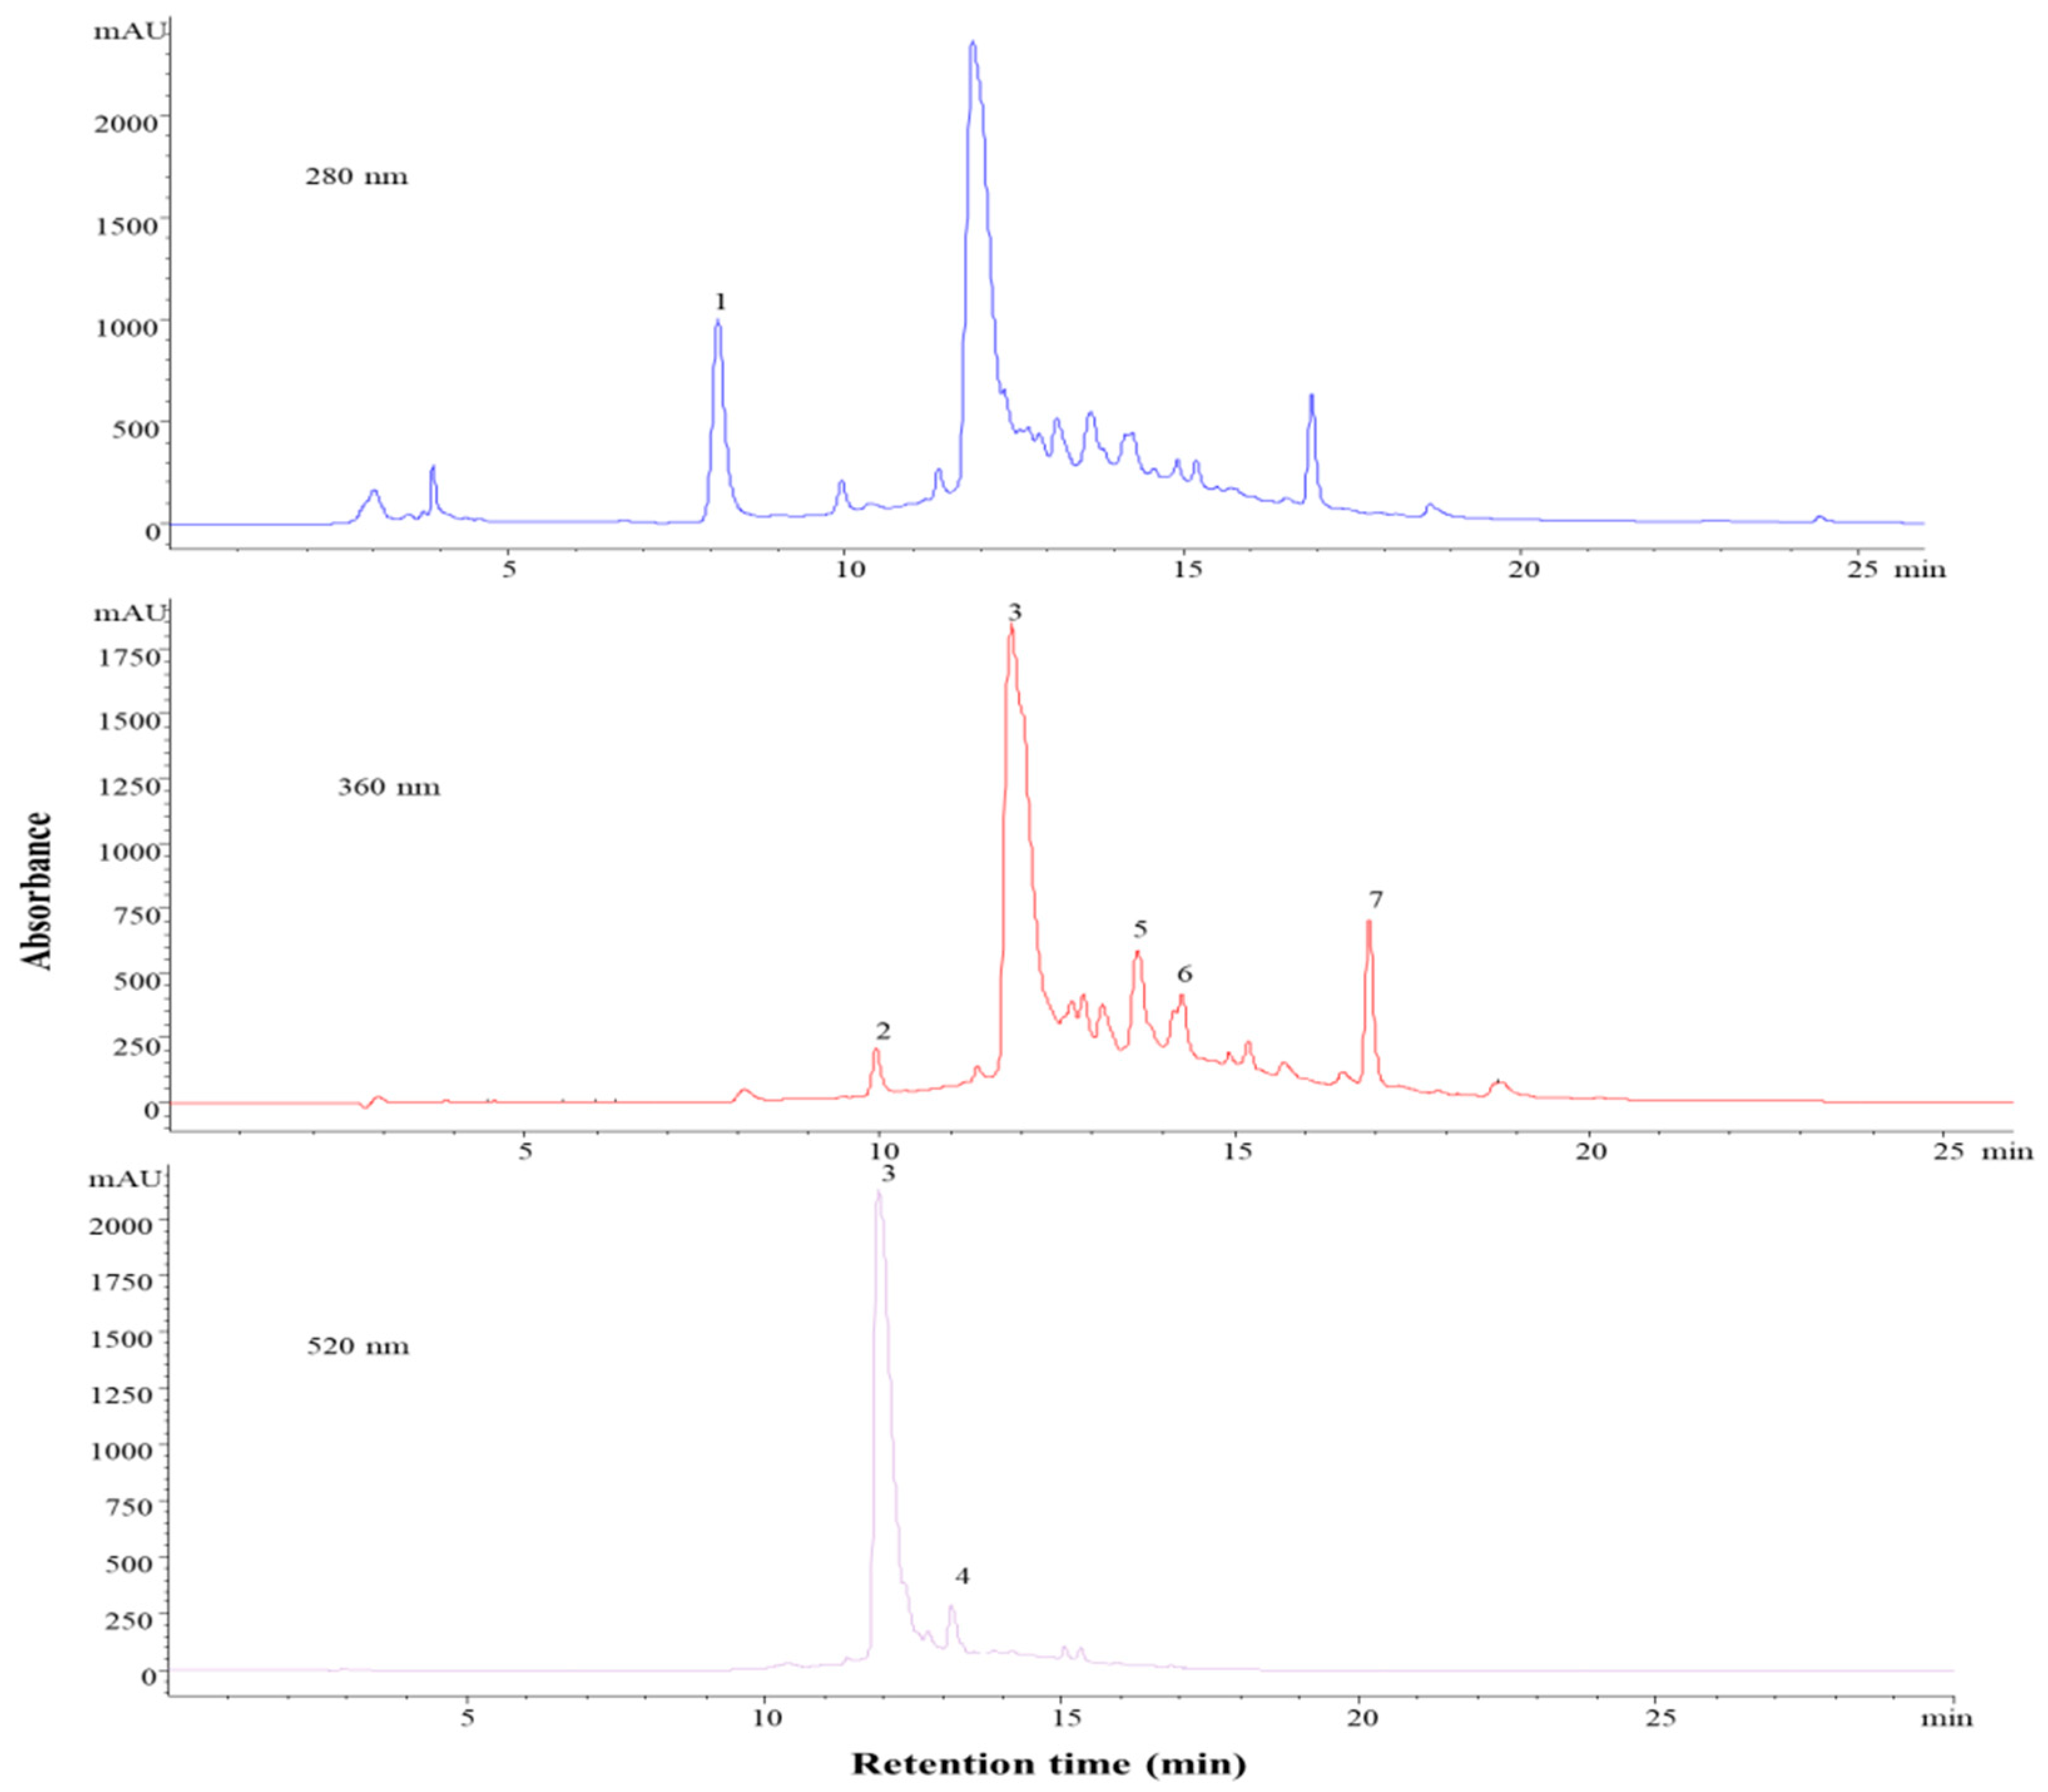
2.3. Liquid Chromatography/Electrospray Ionisation Mass Spectrometry (LC-ESI+-MS) Identification Analysis
2.4. LC-MS Quantification Analysis
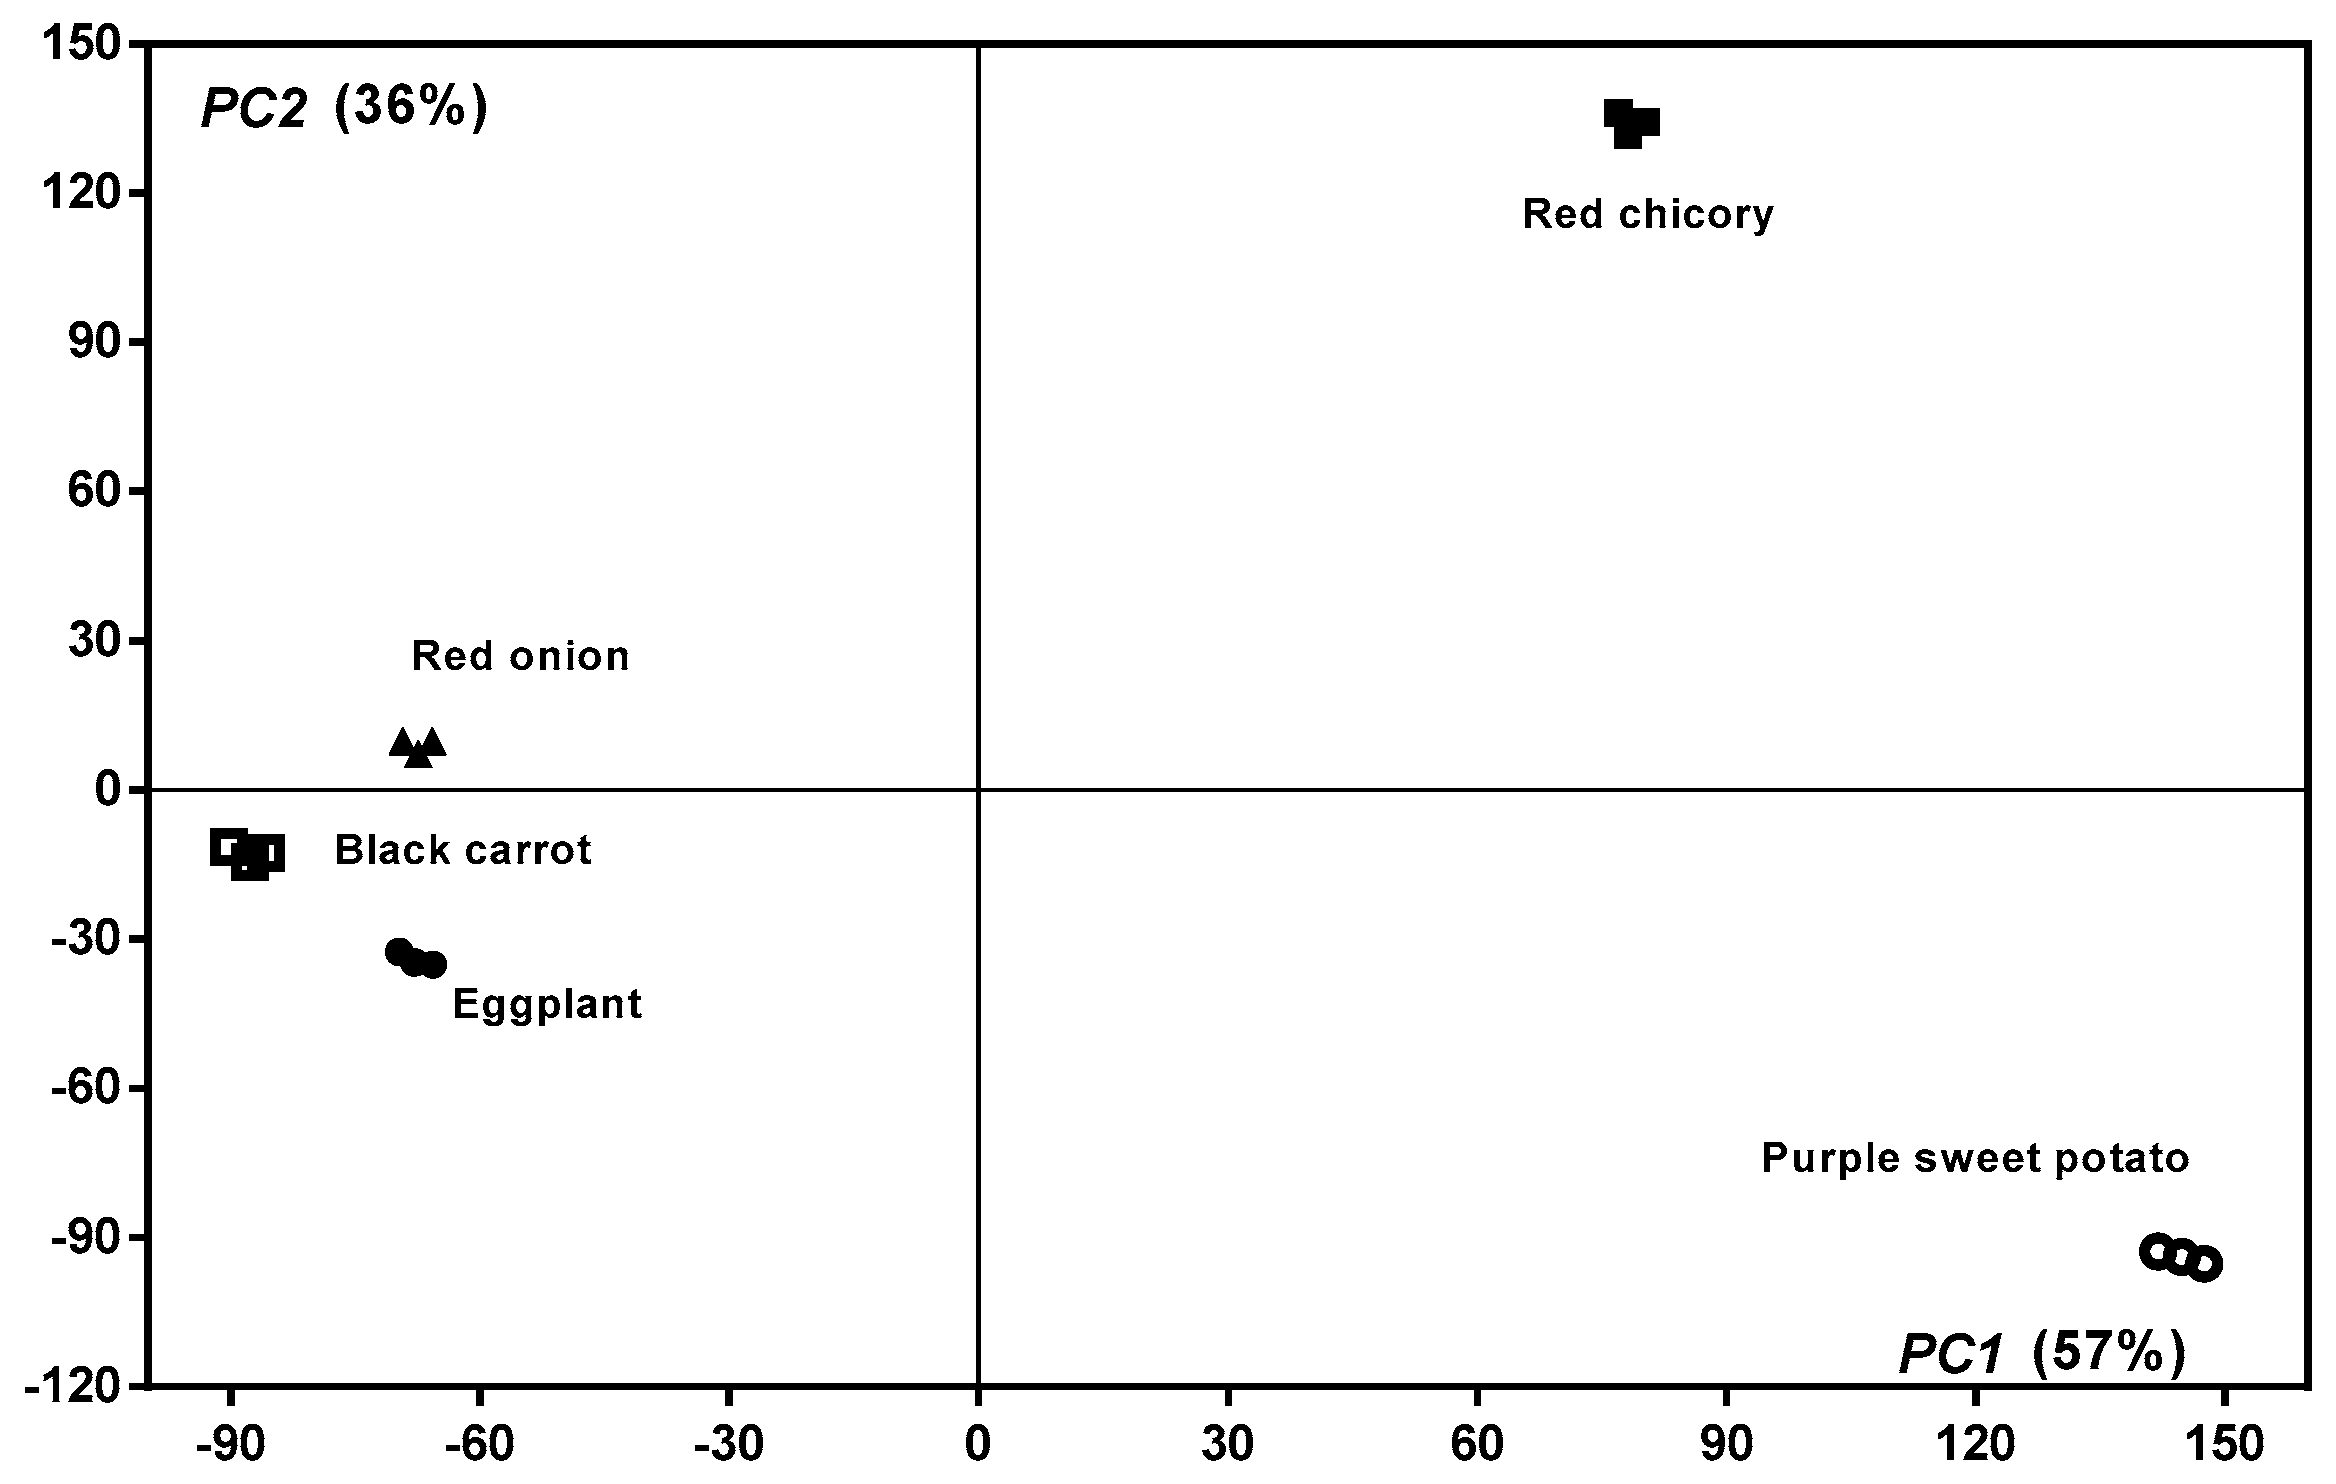
2.5. Statistical Analysis
3. Discussion
4. Materials and Methods
4.1. Chemicals and Reagents
4.2. Plant Material and Extract Preparation
4.3. Determination of Total Phenolic Content
4.4. Determination of Total Flavonoid Content
4.5. ABTS (ABTS Radical Cation Decolorization Assay) Radical Scavenging Assay
4.6. Cupric Ion Reducing Antioxidant Capacity (CUPRAC) Assay
4.7. DPPH Assay Scavenging Activity Assay
4.8. HPLC-PDA/-ESI+-MS Identification and Quantification of Phenolic Compounds
4.9. Statistical Analysis
5. Conclusions
Supplementary Materials
Author Contributions
Funding
Acknowledgments
Conflicts of Interest
References
- Cheynier, V.; Tomas-Barberan, F.A.; Yoshida, K. Polyphenols: From plants to a variety of food and nonfood uses. J. Agric. Food Chem. 2015, 63, 7589–7594. [Google Scholar] [CrossRef] [PubMed]
- Mata, R. Flavonoids, chemistry, biochemistry and applications by ø. M. Andersen (university of bergen) and k. R. Markham (industrial research ltd.). Crc press/taylor & francis, boca raton. 2006. Xiv + 1237 pp. 7 × 101/4 in. $249.95. Isbn 0-8493-2021-6. J. Nat. Prod. 2007, 70, 140. [Google Scholar]
- George, B.; Liaaen-Jensen, S.; Pfander, H. Carotenoids Volume 5: Nutrition and Health; Springer Science & Business Media: Berlin, Germany, 2009. [Google Scholar]
- Wu, S.B.; Meyer, R.S.; Whitaker, B.D.; Litt, A.; Kennelly, E.J. A new liquid chromatography-mass spectrometry-based strategy to integrate chemistry, morphology, and evolution of eggplant (solanum) species. J. Chromatogr. A 2013, 1314, 154–172. [Google Scholar] [CrossRef] [PubMed]
- Goszcz, K.; Deakin, S.J.; Duthie, G.G.; Stewart, D.; Leslie, S.J.; Megson, I.L. Antioxidants in cardiovascular therapy: Panacea or false hope? Front. Cardiovasc. Med. 2015, 2, 29. [Google Scholar] [CrossRef] [PubMed]
- Lisanti, A.; Formica, V.; Ianni, F.; Albertini, B.; Marinozzi, M.; Sardella, R.; Natalini, B. Antioxidant activity of phenolic extracts from different cultivars of italian onion (allium cepa) and relative human immune cell proliferative induction. Pharm. Biol. 2016, 54, 799–806. [Google Scholar] [CrossRef]
- Belwal, T.; Nabavi, S.F.; Nabavi, S.M.; Habtemariam, S. Dietary anthocyanins and insulin resistance: When food becomes a medicine. Nutrients 2017, 9, 1111. [Google Scholar] [CrossRef]
- Yang, L.; Ling, W.; Yang, Y.; Chen, Y.; Tian, Z.; Du, Z.; Chen, J.; Xie, Y.; Liu, Z.; Yang, L. Role of purified anthocyanins in improving cardiometabolic risk factors in chinese men and women with prediabetes or early untreated diabetes-a randomized controlled trial. Nutrients 2017, 9, 1104. [Google Scholar] [CrossRef]
- Mittal, M.; Siddiqui, M.R.; Tran, K.; Reddy, S.P.; Malik, A.B. Reactive oxygen species in inflammation and tissue injury. Antioxid. Redox Signal. 2014, 20, 1126–1167. [Google Scholar] [CrossRef]
- Hussain, T.; Tan, B.; Yin, Y.; Blachier, F.; Tossou, M.C.B.; Rahu, N. Oxidative stress and inflammation: What polyphenols can do for us? Oxid. Med. Cell. Longev. 2016, 2016, 7432797. [Google Scholar] [CrossRef]
- Zamora-Ros, R.; Knaze, V.; Rothwell, J.A.; Hémon, B.; Moskal, A.; Overvad, K.; Tjønneland, A.; Kyrø, C.; Fagherazzi, G.; Boutron-Ruault, M.-C.; et al. Dietary polyphenol intake in europe: The european prospective investigation into cancer and nutrition (epic) study. Eur. J. Nutr. 2016, 55, 1359–1375. [Google Scholar] [CrossRef]
- van Duynhoven, J.; Vaughan, E.E.; Jacobs, D.M.; A. Kemperman, R.; van Velzen, E.J.J.; Gross, G.; Roger, L.C.; Possemiers, S.; Smilde, A.K.; Doré, J.; et al. Metabolic fate of polyphenols in the human superorganism. Proc. Natl. Acad. Sci. USA 2011, 108, 4531–4538. [Google Scholar] [CrossRef] [PubMed]
- Nicholson, J.K.; Holmes, E.; Kinross, J.; Burcelin, R.; Gibson, G.; Jia, W.; Pettersson, S. Host-gut microbiota metabolic interactions. Science 2012, 336, 1262–1267. [Google Scholar] [CrossRef] [PubMed]
- Hall, R.D.; Brouwer, I.D.; Fitzgerald, M.A. Plant metabolomics and its potential application for human nutrition. Physiol. Plant. 2008, 132, 162–175. [Google Scholar] [CrossRef] [PubMed]
- Abbas, Z.K.; Saggu, S.; Sakeran, M.I.; Zidan, N.; Rehman, H.; Ansari, A.A. Phytochemical, antioxidant and mineral composition of hydroalcoholic extract of chicory (cichorium intybus l.) leaves. Saudi J. Biol. Sci. 2015, 22, 322–326. [Google Scholar] [CrossRef] [PubMed]
- Akanitapichat, P.; Phraibung, K.; Nuchklang, K.; Prompitakkul, S. Antioxidant and hepatoprotective activities of five eggplant varieties. Food Chem. Toxicol. 2010, 48, 3017–3021. [Google Scholar] [CrossRef] [PubMed]
- Han, K.H.; Sekikawa, M.; Shimada, K.; Hashimoto, M.; Hashimoto, N.; Noda, T.; Tanaka, H.; Fukushima, M. Anthocyanin-rich purple potato flake extract has antioxidant capacity and improves antioxidant potential in rats. Br. J. Nutr. 2006, 96, 1125–1133. [Google Scholar] [CrossRef]
- Toktas, B.; Bildik, F.; Ozcelik, B. Effect of fermentation on anthocyanin stability and in vitro bioaccessibility during shalgam (salgam) beverage production. J. Sci. Food Agric. 2018, 98, 3066–3075. [Google Scholar] [CrossRef]
- Zhang, S.-L.; Deng, P.; Xu, Y.-C.; LÜ, S.-W.; Wang, J.-J. Quantification and analysis of anthocyanin and flavonoids compositions, and antioxidant activities in onions with three different colors. J. Integr. Agric. 2016, 15, 2175–2181. [Google Scholar] [CrossRef]
- Shahidi, F.; Ambigaipalan, P. Phenolics and polyphenolics in foods, beverages and spices: Antioxidant activity and health effects—A review. J. Funct. Foods 2015, 18, 820–897. [Google Scholar] [CrossRef]
- Zhang, H.; Tsao, R. Dietary polyphenols, oxidative stress and antioxidant and anti-inflammatory effects. Curr. Opin. Food Sci. 2016, 8, 33–42. [Google Scholar] [CrossRef]
- Prior, R.L.; Wu, X.; Schaich, K. Standardized methods for the determination of antioxidant capacity and phenolics in foods and dietary supplements. J. Agric. Food Chem. 2005, 53, 4290–4302. [Google Scholar] [CrossRef] [PubMed]
- Garcia, E.J.; Oldoni, T.L.; Alencar, S.M.; Reis, A.; Loguercio, A.D.; Grande, R.H. Antioxidant activity by dpph assay of potential solutions to be applied on bleached teeth. Braz. Dent. J. 2012, 23, 22–27. [Google Scholar] [CrossRef]
- Re, R.; Pellegrini, N.; Proteggente, A.; Pannala, A.; Yang, M.; Rice-Evans, C. Antioxidant activity applying an improved abts radical cation decolorization assay. Free Radic. Biol. Med. 1999, 26, 1231–1237. [Google Scholar] [CrossRef]
- Özyürek, M.; Güçlü, K.; Tütem, E.; Başkan, K.S.; Erçağ, E.; Esin Çelik, S.; Baki, S.; Yıldız, L.; Karaman, Ş.; Apak, R. A comprehensive review of cuprac methodology. Anal. Methods 2011, 3, 2439–2453. [Google Scholar]
- D’evoli, L.; Morroni, F.; Lombardi-Boccia, G.; Lucarini, M.; Hrelia, P.; Cantelli-Forti, G.; Tarozzi, A. Red chicory (cichorium intybus l. Cultivar) as a potential source of antioxidant anthocyanins for intestinal health. Oxidative Med. Cell. Longev. 2013, 2013, 8. [Google Scholar] [CrossRef]
- Zhu, F.; Cai, Y.Z.; Yang, X.; Ke, J.; Corke, H. Anthocyanins, hydroxycinnamic acid derivatives, and antioxidant activity in roots of different chinese purple-fleshed sweetpotato genotypes. J. Agric. Food Chem. 2010, 58, 7588–7596. [Google Scholar] [CrossRef] [PubMed]
- Carazzone, C.; Mascherpa, D.; Gazzani, G.; Papetti, A. Identification of phenolic constituents in red chicory salads (cichorium intybus) by high-performance liquid chromatography with diode array detection and electrospray ionisation tandem mass spectrometry. Food Chem. 2013, 138, 1062–1071. [Google Scholar] [CrossRef]
- Sahan, Y.; Gurbuz, O.; Guldas, M.; Degirmencioglu, N.; Begenirbas, A. Phenolics, antioxidant capacity and bioaccessibility of chicory varieties (cichorium spp.) grown in turkey. Food Chem. 2017, 217, 483–489. [Google Scholar] [CrossRef]
- Petersson, E.V.; Liu, J.; Sjoberg, P.J.; Danielsson, R.; Turner, C. Pressurized hot water extraction of anthocyanins from red onion: A study on extraction and degradation rates. Anal. Chim. Acta 2010, 663, 27–32. [Google Scholar] [CrossRef]
- D’Evoli, L.; Lucarini, M.; Potenza, A.; Ritota, M.; Sequi, P.; Lombardi-Boccia, G. Anthocyanin profile of two italian cichorium intybus l. Cultivars. Acta Hortic. 2012, 939, 337–340. [Google Scholar] [CrossRef]
- Innocenti, M.; Gallori, S.; Giaccherini, C.; Ieri, F.; Vincieri, F.F.; Mulinacci, N. Evaluation of the Phenolic Content in the Aerial Parts of Different Varieties of Cichorium Intybus L. J. Agric. Food Chem. 2005, 53, 6497–6502. [Google Scholar] [CrossRef] [PubMed]
- Gennaro, L.; Leonardi, C.; Esposito, F.; Salucci, M.; Maiani, G.; Quaglia, G.; Fogliano, V. Flavonoid and carbohydrate contents in tropea red onions: Effects of homelike peeling and storage. J. Agric. Food Chem. 2002, 50, 1904–1910. [Google Scholar] [CrossRef] [PubMed]
- Tedesco, I.; Carbone, V.; Spagnuolo, C.; Minasi, P.; Russo, G.L. Identification and quantification of flavonoids from two southern italian cultivars of allium cepa l., tropea (red onion) and montoro (copper onion), and their capacity to protect human erythrocytes from oxidative stress. J. Agric. Food Chem. 2015, 63, 5229–5238. [Google Scholar] [CrossRef]
- García-Salas, P.; Gómez-Caravaca, A.M.; Morales-Soto, A.; Segura-Carretero, A.; Fernández-Gutiérrez, A. Identification and quantification of phenolic compounds in diverse cultivars of eggplant grown in different seasons by high-performance liquid chromatography coupled to diode array detector and electrospray-quadrupole-time of flight-mass spectrometry. Food Res. Int. 2014, 57, 114–122. [Google Scholar]
- Niño-Medina, G.; Urías-Orona, V.; Muy-Rangel, M.D.; Heredia, J.B. Structure and content of phenolics in eggplant (solanum melongena)—A review. S. Afr. J. Bot. 2017, 111, 161–169. [Google Scholar]
- Sadilova, E.; Stintzing, F.C.; Carle, R. Anthocyanins, colour and antioxidant properties of eggplant (solanum melongena l.) and violet pepper (capsicum annuum l.) peel extracts. Z. Nat. C 2006, 61, 527–535. [Google Scholar] [CrossRef]
- Azuma, K.; Ohyama, A.; Ippoushi, K.; Ichiyanagi, T.; Takeuchi, A.; Saito, T.; Fukuoka, H. Structures and antioxidant activity of anthocyanins in many accessions of eggplant and its related species. J. Agric. Food Chem. 2008, 56, 10154–10159. [Google Scholar] [CrossRef]
- Ferrara, L.; Naviglio, D. Nasunin, an antioxidant anthocyanin from eggplant peels, as natural dye to avoid food allergies and intolerances. Eur. Sci. J. 2014, 10, 1–11. [Google Scholar]
- Lee, M.J.; Park, J.S.; Choi, D.S.; Jung, M.Y. Characterization and quantitation of anthocyanins in purple-fleshed sweet potatoes cultivated in korea by hplc-dad and hplc-esi-qtof-ms/ms. J. Agric. Food Chem. 2013, 61, 3148–3158. [Google Scholar] [CrossRef]
- Tian, Q.; Konczak, I.; Schwartz, S.J. Probing anthocyanin profiles in purple sweet potato cell line (ipomoea batatas l. Cv. Ayamurasaki) by high-performance liquid chromatography and electrospray ionization tandem mass spectrometry. J. Agric. Food Chem. 2005, 53, 6503–6509. [Google Scholar] [CrossRef]
- Truong, V.D.; Deighton, N.; Thompson, R.T.; McFeeters, R.F.; Dean, L.O.; Pecota, K.V.; Yencho, G.C. Characterization of anthocyanins and anthocyanidins in purple-fleshed sweetpotatoes by hplc-dad/esi-ms/ms. J. Agric. Food Chem. 2010, 58, 404–410. [Google Scholar] [CrossRef]
- Garcia-Herrera, P.; Pérez-Rodríguez, M.-L.; Aguilera-Delgado, T.; Labari-Reyes, M.-J.; Olmedilla-Alonso, B.; Camara, M.; Pascual-Teresa, S. Anthocyanin profile of red fruits and black carrot juices, purees and concentrates by hplc-dad-esi/ms-qtof. Int. J. Food Sci. Technol. 2016, 51, 2290–2300. [Google Scholar] [CrossRef]
- Kamiloglu, S.; Ozkan, G.; Isik, H.; Horoz, O.; Van Camp, J.; Capanoglu, E. Black carrot pomace as a source of polyphenols for enhancing the nutritional value of cake: An in vitro digestion study with a standardized static model. LWT 2017, 77, 475–481. [Google Scholar] [CrossRef]
- Kammerer, D.; Carle, R.; Schieber, A. Quantification of anthocyanins in black carrot extracts (daucus carota ssp. Sativus var. Atrorubens alef.) and evaluation of their color properties. Eur. Food Res. Technol. 2004, 219, 479–486. [Google Scholar] [CrossRef]
- Montilla, E.C.; Arzaba, M.R.; Hillebrand, S.; Winterhalter, P. Anthocyanin composition of black carrot (daucus carota ssp. Sativus var. Atrorubens alef.) cultivars antonina, beta sweet, deep purple, and purple haze. J. Agric. Food Chem. 2011, 59, 3385–3390. [Google Scholar] [CrossRef] [PubMed]
- Sinkovič, L.; Demšar, L.; Žnidarčič, D.; Vidrih, R.; Hribar, J.; Treutter, D. Phenolic profiles in leaves of chicory cultivars (cichorium intybus l.) as influenced by organic and mineral fertilizers. Food Chem. 2015, 166, 507–513. [Google Scholar]
- Sellappan, S.; Akoh, C.C. Flavonoids and antioxidant capacity of georgia-grown vidalia onions. J. Agric. Food Chem. 2002, 50, 5338–5342. [Google Scholar] [CrossRef]
- Singleton, V.L.; Orthofer, R.; Lamuela-Raventós, R.M. [14] analysis of total phenols and other oxidation substrates and antioxidants by means of folin-ciocalteu reagent. In Methods in Enzymology; Academic Press: Cambridge, MA, USA, 1999; Volume 299, pp. 152–178. [Google Scholar]
- Zhishen, J.; Mengcheng, T.; Jianming, W. The determination of flavonoid contents in mulberry and their scavenging effects on superoxide radicals. Food Chem. 1999, 64, 555–559. [Google Scholar] [CrossRef]
- Arnao, M.B.; Cano, A.; Alcolea, J.F.; Acosta, M. Estimation of free radical-quenching activity of leaf pigment extracts. Phytochem. Anal. 2001, 12, 138–143. [Google Scholar] [CrossRef]
- Apak, R.; Güçlü, K.; Özyürek, M.; Esin Karademir, S.; Erçağ, E. The cupric ion reducing antioxidant capacity and polyphenolic content of some herbal teas. Int. J. Food Sci. Nutr. 2006, 57, 292–304. [Google Scholar] [CrossRef]
- Brand-Williams, W.; Cuvelier, M.E.; Berset, C. Use of a free radical method to evaluate antioxidant activity. LWT-Food Sci. Technol. 1995, 28, 25–30. [Google Scholar] [CrossRef]
Sample Availability: Samples of the compounds are available from the authors. |


| Analysi | Total Phenolics mg GAE/100 g FW * | Total Flavonoids mg QUE/100 g FW ** | |
|---|---|---|---|
| Sample | |||
| Red chicory | 216.15 ± 2.4 | 95.48 ± 0.9 | |
| Red onion | 141.14 ± 1.7 | 61.95 ± 0.6 | |
| Eggplant | 134.23 ± 1.3 | 101.79 ± 3.4 | |
| Purple sweet potato | 167.47 ± 1.04 | 72.24 ± 2.2 | |
| Black carrot | 189.50 ± 1.5 | 22.14 ± 1.3 | |
| Methods | (CUPRAC) | ABTS | DPPH | ||
|---|---|---|---|---|---|
| Spearman’s rho | CUPRAC | Correlation Coefficient | 1.000 | 0.914 ** | 0.918 ** |
| Sig. (2-tailed) | . | 0.000 | 0.000 | ||
| N | 15 | 15 | 15 | ||
| ABTS | Correlation Coefficient | 0.914 ** | 1.000 | 0.946 ** | |
| Sig. (2-tailed) | 0.000 | . | 0.000 | ||
| N | 15 | 15 | 15 | ||
| DPPH | Correlation Coefficient | 0.918 ** | 0.946 ** | 1.000 | |
| Sig. (2-tailed) | 0.000 | 0.000 | . | ||
| N | 15 | 15 | 15 | ||
| Peak No. | Rt (min) | [M + H]+ (m/z) | UV λmax (nm) | Tentatively Identified Compound |
|---|---|---|---|---|
| 1 | 2.95 | 139 | 265 | Hydroxybenzoic acid |
| 2 | 3.79 | 156 | 260 | Dihydroxybenzoic acid |
| 3 | 6.26 | 167 | 270 | Dihydroxy p-coumaric acid |
| 4 | 8.03 | 155 | 290 | Protocatechuic acid |
| 5 | 11.10 | 449, 207 | 280, 517 | Cyanidin-3-O-glucoside |
| 6 | 11.90 | 355 | 320 | Chlorogenic acid |
| 7 | 12.23 | 291 | 279 | Catechin |
| 8 | 12.93 | 535, 287 | 280, 516 | Cyanidin-3-O-(6″-malonyl-glucoside) |
| 9 | 15.45 | 611, 303 | 250, 350 | Quercetin-3-O-rutinoside (Rutin) |
| 10 | 15.71 | 625,463,303 | 250, 350 | Quercetin-3,4-O-diglucoside |
| 11 | 16.15 | 465, 303 | 250, 360 | Quercetin-3-O-glucoside |
| 12 | 16.57 | 551, 303 | 255, 360 | Quercetin-3-O-(6″-malonyl-glucoside) |
| Peak No. | Rt (min) | [M+H]+ (m/z) | UV λmax (nm) | Tentatively Identified Compound |
|---|---|---|---|---|
| 1 | 8.23 | 198 | 290 | Syringic acid (Dimethoxy-4-hydroxybenzoic acid) |
| 2 | 11.23 | 449, 611 | 280, 519 | Cyanidin-3-O-glucoside & Cyanidin-3-O-laminaribioside |
| 3 | 12.91 | 535, 697 | 280, 519 | Cyanidin-3-(6″-malonyl-glucoside) & Cyanidin-3-(6″-malonyl-laminaribioside) |
| 4 | 14.03 | 627, 465, 303 | 250, 360 | Quercetin-3,4-O-diglucoside |
| 5 | 17.65 | 465, 303 | 250, 360 | Quercetin-3-O-glucoside |
| Peak No. | Rt (min) | [M+H]+ (m/z) | UV λmax (nm) | Tentatively Identified Compound |
|---|---|---|---|---|
| 1 | 2.95 | 139 | 265 | Hydroxybenzoic acid |
| 2 | 10.26 | 611, 303 | 280, 524 | Delphinidin-3-O-rutinoside |
| 3 | 11.89 | 355 | 320 | 5-Caffeoylquinic acid (Chlorogenic acid) |
| Peak No. | Rt (min) | [M+H]+ (m/z) | UV λmax (nm) | Tentative Identified Compound |
|---|---|---|---|---|
| 1 | 2.95 | 139 | 265 | Hydroxybenzoic acid |
| 2 | 3.86 | 156 | 260 | Dihydroxybenzoic acid |
| 3 | 8.16 | 198 | 290 | Dimethoxy-4-hydroxybenzoic acid (Syringic acid) |
| 4 | 10.15 | 787 | 278, 516 | Peonidin-3-O-sophoroside-5-O-glucoside |
| 5 | 11.28 | 463 | 276, 520 | Peonidin-3-O-glucoside |
| 6 | 11.98 | 893 | 320, 512 | Cyanidin-3-p-hydroxybenzoylsophoroside-5-glucoside |
| 7 | 11.98 | 355 | 320 | Chlorogenic acid |
| 8 | 12.78 | 907 | 276, 518 | Peonidin-3-p-hydroxybenzoylsophoroside-5-glucoside |
| 9 | 13.47 | 935 | 287, 521 | Cyanidin-3-caffeoylsophoroside-5-glucoside |
| 10 | 14.11 | 949 | 281, 521 | Peonidin-3-caffeoylsophoroside-5-glucoside |
| 11 | 14.44 | 1055 | 280, 522 | Cyanidin-3-caffeoyl-p-hydroxybenzoylsophoroside-5-glucoside |
| 12 | 15.28 | 1111 | 281, 522 | Peonidin-3-dicaffeoylsophoroside-5-glucoside |
| 13 | 15.44 | 1069 | 324, 520 | Peonidin-3-caffeoyl-p-hydroxybenzoylsophoroside-5-glucoside |
| 14 | 15.81 | 1125 | 301, 519 | Peonidin-3-caffeoy-feruloylsophoroside-5-glucoside |
| 15 | 16.75 | 195 | 328 | Ferulic acid |
| Peak No. | Rt (min) | [M + H]+ (m/z) | UV λmax (nm) | Compound |
|---|---|---|---|---|
| 1 | 8.11 | 198 | 290 | Syringic acid (Dimethoxy-4-hydroxybenzoic acid) |
| 2 | 9.95 | 355 | 320 | 3-Caffeoylquinic acid (Neochlorogenic acid) |
| 3 | 11.89 | 355, 919 | 320, 520 280, 520 | 5-Caffeoylquinic acid (Chlorogenic acid) Cyanidin-3-(p-coumaroyl)-diglucoside-5-glucoside |
| 4 | 13.14 | 787 | 287, 520 | Cyanidin-3-(feruloyl)-glucoside-5-glucoside |
| 5 | 13.64 | 181, 163 | 320 | Caffeic acid |
| 6 | 14.25 | 369, 195 | 330 | Feruloylquinic acid |
| 7 | 16.91 | 517 | 328 | Ferulic acid |
| Red Chicory | ||
|---|---|---|
| Class of Compounds | Compound | mg/100 g FW |
| Anthocyanins | Cyanidin-3-O-glucoside Cyanidin-3-O-(6″-malonyl-glucoside) | 30.91 8.289 |
| Total Anthocyanins | 39.20 1 | |
| Flavonols | Catechin Quercetin-3-O-rutinoside (Rutin) Quercetin-3,4-O-diglucoside Quercetin-3-O-glucoside Quercetin-3-O-(6″-malonyl-glucoside) | 4.71 5.69 82.55 32.59 9.86 |
| Total Flavonols | 135.41 2 | |
| Hydroxybenzoic acid (HBA) | Protocatechuic acid Hydroxybenzoic acid Dihydroxybenzoic acid | 6.63 5.75 2.42 |
| Total HBA | 14.81 3 | |
| Hydroxycinnamic acid (HCA) | Dihydroxy p-coumaric acid Chlorogenic acid | 7.65 4.71 |
| Total HCA | 12.36 3 | |
| Total phenolic compound | 201.77 | |
| Red Onion | ||
|---|---|---|
| Class of Compounds | Compound | mg/100 g FW |
| Anthocyanins | Cyanidin-3-O-glucoside+ Cyanidin-3-O-laminaribioside Cyanidin-3-(6″-malonyl-glucoside)+ Cyanidin-3-(6″-malonyl- laminaribioside) | 4.38 1.18 |
| Total Anthocyanins | 5.56 1 | |
| Flavonol | Quercetin-3,4-O-diglucoside Quercetin-3-O-glucoside | 19.51 5.59 |
| Total Flavonol | 25.11 2 | |
| Hydroxybenzoic acid (HBA) | Syringic acid | 25.90 |
| Total HBA | 25.90 3 | |
| Total phenolic compound | 56.58 | |
| Eggplant | ||
|---|---|---|
| Class of Compounds | Compound | mg/100 g FW |
| Anthocyanins | Delphinidin-3-O-(6″-p-coumaroyl-glucoside) | 8.72 |
| Total Anthocyanins | 8.72 1 | |
| Hydroxybenzoic acid (HBA) | Hydroxybenzoic acid | 5.89 |
| Total HBA | 5.89 3 | |
| Hydroxycinnamic acid (HCA) | 5-Caffeoylquinic acid (Chlorogenic acid) | 62.15 |
| Total HCA | 62.15 | |
| Total phenolic compound | 76.77 3 | |
| Purple Sweet Potato | ||
|---|---|---|
| Class of Compounds | Compound | mg/100 g FW |
| Anthocyanins | Peonidin-3-O-sophoroside-5-O-glucoside Peonidin-3-O-glucoside Cyanidin-3-p-hydroxybenzoylsophoroside-5-glucoside Peonidin-3-p-hydroxybenzoylsophoroside-5-glucoside Cyanidin-3-caffeoylsophoroside-5-glucoside Peonidin-3-caffeoylsophoroside-5-glucoside Cyanidin-3-caffeoyl-p-hydroxybenzoylsophoroside-5-glucoside Peonidin-3-dicaffeoylsophoroside-5-glucoside Peonidin-3-caffeoyl-p-hydroxybenzoylsophoroside-5-glucoside Peonidin-3-caffeoy-feruloylsophoroside-5-glucoside | 0.75 0.48 0.99 3.40 0.43 3.94 2.43 10.20 15.24 4.48 |
| Total Anthocyanins | 42.37 1 | |
| Hydroxybenzoic acids (HBA) | Hydroxybenzoic acid Dihydroxybenzoic acid Dimethoxy-4-hydroxybenzoic acid (Syringic acid) | 13.34 9.02 97.02 |
| Total HBA | 119.39 3 | |
| Hydroxycinnamic acids (HCA) | Chlorogenic acid Ferulic acid | 60.92 12.19 |
| Total HCA | 73.11 3 | |
| Total phenolic compound | 234.88 | |
| Black Carrot | ||
|---|---|---|
| Class of Compounds | Compound | mg/100 g FW |
| Anthocyanins | Cyanidin-3-(p-coumaroyl)-diglucoside-5-glucoside Cyanidin-3-(p-coumaroyl)-diglucoside-5-glucoside | 21.72 0.72 |
| Total Anthocyanins | 22.45 1 | |
| Hydroxybenzoic acids (HBA) | Syringic acid (Dimethoxy-4-hydroxybenzoic acid) | 0.035 |
| Total HBA | 0.035 3 | |
| Hydroxycinnamic acids (HCA) | (5-Caffeoylquinic acid) Chlorogenic acid Feruloylquinic acid 3-Caffeoylquinic acid (Neochlorogenic acid) Caffeic acid Ferulic acid | 21.73 3.043 1.283 5.346 2.937 |
| Total HCA | 34.33 3 | |
| Total phenolic compounds | 56.82 | |
| Phenolic Compounds | Assays | ||
|---|---|---|---|
| CUPRAC | ABTS | DPPH | |
| Anthocyanins | 0.819 | 0.952 | 0.984 |
| Flavonols | 0.646 | 0.459 | 0.556 |
| HBA | 0.113 | 0.390 | 0.515 |
| HCA | 0.204 | 0.356 | 0.184 |
© 2019 by the authors. Licensee MDPI, Basel, Switzerland. This article is an open access article distributed under the terms and conditions of the Creative Commons Attribution (CC BY) license (http://creativecommons.org/licenses/by/4.0/).
Share and Cite
Frond, A.D.; Iuhas, C.I.; Stirbu, I.; Leopold, L.; Socaci, S.; Andreea, S.; Ayvaz, H.; Andreea, S.; Mihai, S.; Diaconeasa, Z.; et al. Phytochemical Characterization of Five Edible Purple-Reddish Vegetables: Anthocyanins, Flavonoids, and Phenolic Acid Derivatives. Molecules 2019, 24, 1536. https://doi.org/10.3390/molecules24081536
Frond AD, Iuhas CI, Stirbu I, Leopold L, Socaci S, Andreea S, Ayvaz H, Andreea S, Mihai S, Diaconeasa Z, et al. Phytochemical Characterization of Five Edible Purple-Reddish Vegetables: Anthocyanins, Flavonoids, and Phenolic Acid Derivatives. Molecules. 2019; 24(8):1536. https://doi.org/10.3390/molecules24081536
Chicago/Turabian StyleFrond, Alexandra D., Cristian I. Iuhas, Ioana Stirbu, Loredana Leopold, Sonia Socaci, Stǎnilǎ Andreea, Huseyin Ayvaz, Socaciu Andreea, Socaciu Mihai, Zorița Diaconeasa, and et al. 2019. "Phytochemical Characterization of Five Edible Purple-Reddish Vegetables: Anthocyanins, Flavonoids, and Phenolic Acid Derivatives" Molecules 24, no. 8: 1536. https://doi.org/10.3390/molecules24081536