Analysis of Non-Ionic Surfactant Triton X-100 Using Hydrophilic Interaction Liquid Chromatography and Mass Spectrometry


Abstract
:1. Introduction
2. Theory
3. Experimental
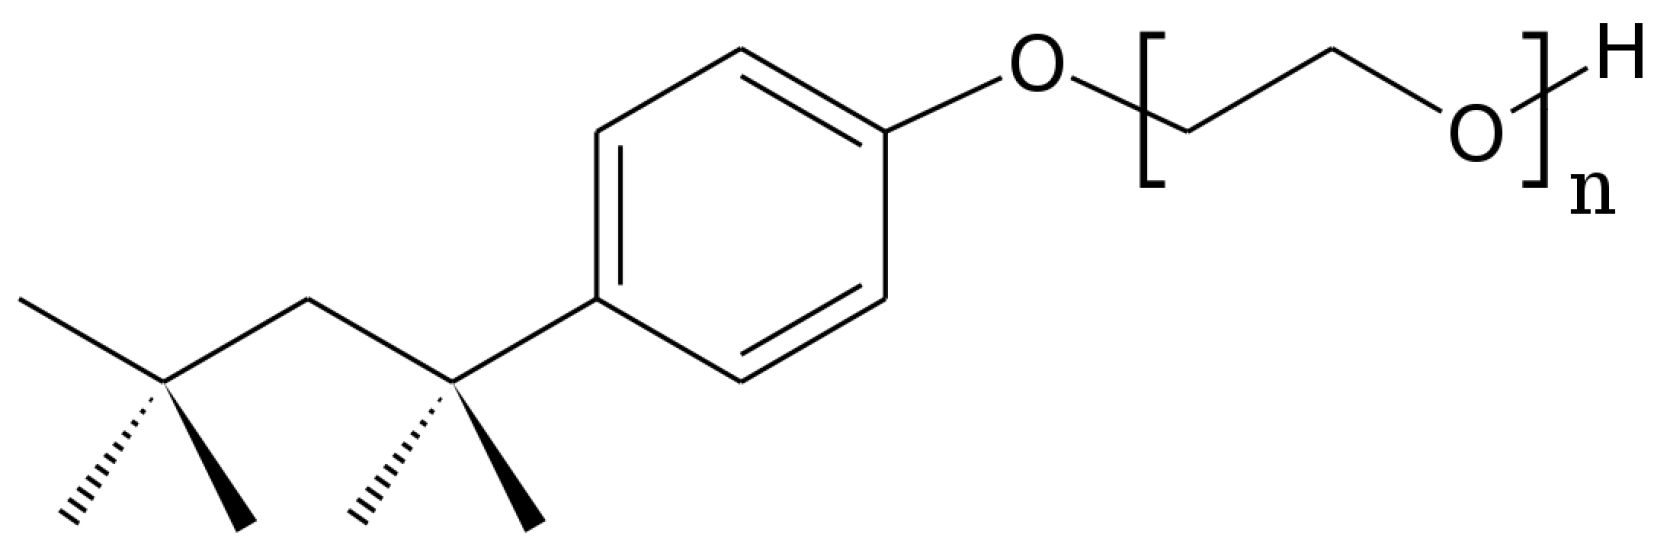
3.1. Materials
3.2. UPLC System Instrumentation
3.3. LC-MS System Instrumentation
3.4. Computation
4. Results and Discussion
4.1. Peak Identification Using the LC-MS Method
4.2. Retention Behavior of Triton X-100 Components
4.3. Optimization of Gradient Separations
5. Conclusions
Author Contributions
Funding
Conflicts of Interest
Abbreviations
| TX | Triton X-100 |
| HILIC | Hydrophilic Interaction Liquid Chromatography |
| LC MS | Liquid Chromatography Mass Spectometry |
| APEO | Alkylphenol Ethoxylate |
| OPEO | Octylphenol Ethoxylate |
| NPEO | Nonylphenol Ethoxylate |
| GC | Gas Chromatography |
| FID | Flame Ionization Detection |
| ECD | Electron Capture Detection |
| EI | Electron Ionization |
| CI | Chemical Oonization |
| HPLC | High Pressure Liquid Chromatography |
| FD | Fluorescence Detection |
| NPLC | Normal Phase Liquid Chromatography |
| LSS | Linear Solvent Strength |
References
- Talmage, S. Environmental and Human Safety of Major Surfactants: Alcohol Ethoxylates and Alkylphenol Ethoxylates; Taylor & Francis: Abingdon-on-Thames, UK, 1994. [Google Scholar]
- Naylor, C.; Mieure, J.; Ada, W.; Weeks, J.; Castaldi, F.; Ogle, L.; Romano, R. Alkylphenol ethoxylates in the environment. J. Am. Oil Chem. Soc. 1992, 69, 695–703. [Google Scholar] [CrossRef]
- Ahel, M.; Ahel, G.; Koch, M. Behaviour of alkylphenol polyethoxylate surfactants in the aquatic environment I. Occurrence and transformation in sewage treatment. Water Res. 1994, 28, 1131–1142. [Google Scholar] [CrossRef]
- Birkett, J.; Lester, J. Endocrine Disrupters in Wastewater and Sludge Treatment Processes; CRC Press: Boca Raton, FL, USA, 2002. [Google Scholar]
- Ma, Q.; Xi, G.C.; Wang, C.; Bai, H.; Zhang, Q.; Xi, H.W.; Wang, Z.M.; Guo, L.H. Comprehensive two-dimensional separation for the analysis of alkylphenol ethoxylates employing hydrophilic interaction chromatography coupled with ion mobility-mass spectrometry. Int. J. Mass Spectrom. 2012, 315, 31–39. [Google Scholar] [CrossRef] [Green Version]
- White, R.; Jobling, S.; Hoare, S.; Sumpter, J.; Parker, M. Environmentally persistent alkylphenolic compounds are estrogenic. Endocrinology 1994, 135, 175–182. [Google Scholar] [CrossRef] [PubMed]
- Servos, M. Review of the aquatic toxicity, estrogenic responses and bioaccumulation of alkylphenols and alkylphenol polyethoxylates. Water Qual. Res. J. Can. 1999, 34, 123–177. [Google Scholar] [CrossRef]
- Laws, S.; Carey, S.; Ferrell, J.; Bodman, G.; Cooper, R. Estrogenic Activity of Octylphenol, Nonylphenol, Bisphenol A and Methoxychlor in Rats. Toxicol. Sci. 2000, 54, 154–167. [Google Scholar] [CrossRef] [Green Version]
- Dussault, E.; Sherry, S.; Lee, H.B.; Burnison, B.; Bennie, D.; Servos, M. In Vivo Estrogenicity of Nonylphenol and Its Ethoxylates in the Canadian Environment. Hum. Ecol. Risk Assess. 2005, 11, 353–364. [Google Scholar] [CrossRef]
- Giger, W.; Brunner, P.; Schaffner, C. 4-Nonylphenol in sewage sludge: Accumulation of toxic metabolites from nonionic surfactants. Science 1984, 225, 623–625. [Google Scholar] [CrossRef]
- Langford, K.; Scrimshaw, M.; Birkett, J.; Lester, J. Degradation of nonylphenolic surfactants in activated sludge batch tests. Water Res. 2005, 39, 870–876. [Google Scholar] [CrossRef] [PubMed]
- Lu, J.; Jin, Q.; He, Y.; Wu, J.; Zhang, W.; Zhao, J. Anaerobic degradation behavior of nonylphenol polyethoxylates in sludge. Chemosphere 2008, 71, 345–351. [Google Scholar] [CrossRef] [PubMed]
- Sandra, P.; Favid, F. Microcolumn chromatography for the analysis of detergents and lubricants. Part 1: High temperature capillary GC and capillary SFC. High Resolut. Chromatogr. 1990, 13, 414–417. [Google Scholar] [CrossRef]
- Zhang, S.X.; Chai, X.S.; Huang, B.X.; Mai, X.X. A robust method for determining water-extractable alkylphenol polyethoxylates in textile products by reaction-based headspace gas chromatography. J. Chromatogr. A 2015, 1406, 94–98. [Google Scholar] [CrossRef]
- Wahlberg, C.; Renberg, L.; Wideqvist, U. Determination of nonylphenol and nonylphenol ethoxylates as their pentafluorobenzoates in water, sewage sludge and biota. Chemosphere 1990, 20, 179–195. [Google Scholar] [CrossRef]
- Gatidou, G.; Thomaidis, N.; Stasinakis, A.; Lekkas, T. Simultaneous determination of the endocrine disrupting compounds nonylphenol, nonylphenol ethoxylates, triclosan and bisphenol A in wastewater and sewage sludge by gas chromatography-mass spectrometry. J. Chromatogr. A 2007, 1138, 32–41. [Google Scholar] [CrossRef] [PubMed]
- Stephanou, E. Identification of nonionic detergents by GC/CI-MS: I. A complementary method or an attractive alternative to GC/EI-MS and other methods? Chemosphere 1984, 13, 43–51. [Google Scholar] [CrossRef]
- Pernica, M.; Poloucká, P.; Seifertová, M.; Šimek, Z. Determination of alkylphenols in water samples using liquid chromatography–tandem mass spectrometry after pre-column derivatization with dansyl chloride. J. Chromatogr. A 2015, 1417, 49–56. [Google Scholar] [CrossRef] [PubMed]
- Vega Morales, T.; Torres Padrón, M.; Sosa Ferrera, Z.; Santana Rodríguez, J. Determination of alkylphenol ethoxylates and their degradation products in liquid and solid samples. Trends Anal. Chem. 2009, 28, 1186–1200. [Google Scholar] [CrossRef]
- Petrovic, M.; Barceló, D. Analysis of ethoxylated nonionic surfactants and their metabolites by liquid chromatography/atmospheric pressure ionization mass spectrometry. J. Mass Spectrom. 2001, 36, 1173–1185. [Google Scholar] [CrossRef] [PubMed]
- Núñez, L.; Turiel, E.; Tadeo, J. Determination of nonylphenol and nonylphenol ethoxylates in environmental solid samples by ultrasonic-assisted extraction and high performance liquid chromatography-fluorescence detection. J. Chromatogr. A 2007, 1146, 157–163. [Google Scholar] [CrossRef]
- Alpert, A. Hydrophilic-interaction chromatography for the separation of peptides, nucleic acids and other polar compounds. J. Chromatogr. A 1990, 499, 177–196. [Google Scholar] [CrossRef]
- McCalley, D.V. Understanding and manipulating the separation in hydrophilic interaction liquid chromatography. J. Chromatogr. A 2017, 1523, 49–71. [Google Scholar] [CrossRef] [Green Version]
- Qiao, L.; Shi, X.; Xu, G. Recent advances in development and characterization of stationary phases for hydrophilic interaction chromatography. Trends Anal. Chem. 2016, 81, 23–33. [Google Scholar] [CrossRef]
- Iverson, C.D.; Gu, X.; Lucy, C.A. The hydrophilicity vs. ion interaction selectivity plot revisited: The effect of mobile phase pH and buffer concentration on hydrophilic interaction liquid chromatography selectivity behavior. J. Chromatogr. A 2016, 1458, 82–89. [Google Scholar] [CrossRef]
- Hemström, P.; Irgum, K. Hydrophilic interaction chromatography. J. Sep. Sci. 2006, 29, 1784–1821. [Google Scholar] [CrossRef] [Green Version]
- Neue, U. HPLC Columns: Theory, Technology, and Practice; Wiley: Hoboken, NJ, USA, 1997. [Google Scholar]
- Liu, X.; Pohl, C. New hydrophilic interaction/reversed-phase mixed-mode stationary phase and its application for analysis of nonionic ethoxylated surfactants. J. Chromatogr. A 2008, 1191, 83–89. [Google Scholar] [CrossRef] [PubMed]
- Poppe, H.; Paanakker, J.; Bronckhorst, M. Peak width in solvent-programmed chromatography 1. General description of peak boadening in solvent-programmed elution. J. Chromatogr. A 1981, 204, 77–84. [Google Scholar] [CrossRef]
- Gritti, F.; Guiochon, G. Exact peak compression factor in linear gradient elution: I. Theory. J. Chromatogr. A 2008, 1212, 35–40. [Google Scholar] [CrossRef] [PubMed]
- Jandera, P.; Churáček, J. Gradient Elution in Column Liquid Chromatography-Theory and Practice; Elsevier: Amsterdam, The Netherlands, 1985. [Google Scholar]
- Snyder, L.R.; Dolan, J.W. High-Performance Gradient Elution; Wiley-Interscience: Hoboken, NJ, USA, 2007. [Google Scholar]
- Pellett, J.; Lukulay, P.; Mao, Y.; Bowen, W.; Reed, R.; Ma, M.; Munger, R.; Dolan, J.; Wrisley, L.; Medwid, K.; et al. “Orthogonal” separations for reversed-phase liquid chromatography. J. Chromatogr. A 2006, 1101, 122–135. [Google Scholar] [CrossRef] [PubMed]
- Jaoudé, M.; Randon, J. Chromatographic behavior of xanthines in aqueous normal phase chromatography using titania stationary phase. J. Chromatogr. A 2011, 1218, 721–725. [Google Scholar] [CrossRef] [PubMed]
- Le Rouzo, G.; Lamouroux, C.; Bresson, C.; Guichard, A.; Moisy, P.; Moutiers, G. Hydrophilic interaction liquid chromatography for separation and quantification of selected room-temperature ionic liquids. J. Chromatogr. A 2007, 1164, 139–144. [Google Scholar] [CrossRef]
- Dos Santos Pereira, A.; David, F.; Vanhoenacker, G.; Sandra, P. The acetonitrile shortage: Is reversed HILIC with water an alternative for the analysis of highly polar ionizable solutes? J. Sep. Sci. 2009, 32, 2001–2007. [Google Scholar] [CrossRef] [PubMed] [Green Version]
Sample Availability: Samples of the compounds are not available from the authors. |


| m/z | Formula | No. EO Units |
|---|---|---|
| 361.27 | CHONa | 3 |
| 405.34 | CHONa | 4 |
| 449.34 | CHONa | 5 |
| 493.38 | CHONa | 6 |
| 537.44 | CHONa | 7 |
| 581.49 | CHONa | 8 |
| 625.53 | CHONa | 9 |
| 669.58 | CHONa | 10 |
| 713.59 | CHONa | 11 |
| 757.65 | CHONa | 12 |
| 801.69 | CHONa | 13 |
| 845.72 | CHONa | 14 |
| 889.76 | CHONa | 15 |
| 933.76 | CHONa | 16 |
© 2019 by the authors. Licensee MDPI, Basel, Switzerland. This article is an open access article distributed under the terms and conditions of the Creative Commons Attribution (CC BY) license (http://creativecommons.org/licenses/by/4.0/).
Share and Cite
Farsang, E.; Gaál, V.; Horváth, O.; Bárdos, E.; Horváth, K. Analysis of Non-Ionic Surfactant Triton X-100 Using Hydrophilic Interaction Liquid Chromatography and Mass Spectrometry. Molecules 2019, 24, 1223. https://doi.org/10.3390/molecules24071223
Farsang E, Gaál V, Horváth O, Bárdos E, Horváth K. Analysis of Non-Ionic Surfactant Triton X-100 Using Hydrophilic Interaction Liquid Chromatography and Mass Spectrometry. Molecules. 2019; 24(7):1223. https://doi.org/10.3390/molecules24071223
Chicago/Turabian StyleFarsang, Evelin, Violetta Gaál, Ottó Horváth, Erzsébet Bárdos, and Krisztián Horváth. 2019. "Analysis of Non-Ionic Surfactant Triton X-100 Using Hydrophilic Interaction Liquid Chromatography and Mass Spectrometry" Molecules 24, no. 7: 1223. https://doi.org/10.3390/molecules24071223