Half-Sandwich Ru(II) and Os(II) Bathophenanthroline Complexes Containing a Releasable Dichloroacetato Ligand


1
Department of Inorganic Chemistry & Regional Centre of Advanced Technologies and Materials, Faculty of Science, Palacký University in Olomouc, 17. listopadu 12, 771 46 Olomouc, Czech Republic
2
Department of Cell Biology and Genetics & Regional Centre of Advanced Technologies and Materials, Faculty of Science, Palacký University in Olomouc, Šlechtitelů 27, 783 71 Olomouc, Czech Republic
*
Author to whom correspondence should be addressed.
Molecules 2018, 23(2), 420; https://doi.org/10.3390/molecules23020420
Submission received: 15 January 2018
/
Revised: 8 February 2018
/
Accepted: 12 February 2018
/
Published: 14 February 2018
(This article belongs to the Collection Efficient Pharmaceutical and Chemical Approaches for Anticancer Therapy: Design, Preliminary Evaluations, and Further Developments)
Abstract
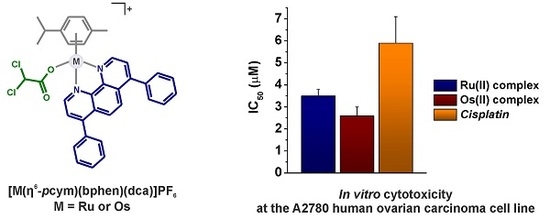
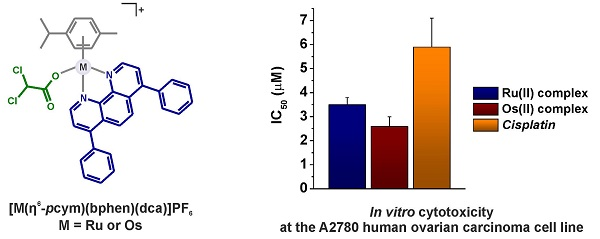
:We report on the preparation and thorough characterization of cytotoxic half-sandwich complexes [Ru(η6-pcym)(bphen)(dca)]PF6 (Ru-dca) and [Os(η6-pcym)(bphen)(dca)]PF6 (Os-dca) containing dichloroacetate(1–) (dca) as the releasable O-donor ligand bearing its own cytotoxicity; pcym = 1-methyl-4-(propan-2-yl)benzene (p-cymene), bphen = 4,7-diphenyl-1,10-phenanthroline (bathophenanthroline). Complexes Ru-dca and Os-dca hydrolyzed in the water-containing media, which led to the dca ligand release (supported by 1H NMR and electrospray ionization mass spectra). Mass spectrometry studies revealed that complexes Ru-dca and Os-dca do not interact covalently with the model proteins cytochrome c and lysozyme. Both complexes exhibited slightly higher in vitro cytotoxicity (IC50 = 3.5 μM for Ru-dca, and 2.6 μM for Os-dca) against the A2780 human ovarian carcinoma cells than cisplatin (IC50 = 5.9 μM), while their toxicity on the healthy human hepatocytes was found to be IC50 = 19.1 μM for Ru-dca and IC50 = 19.7 μM for Os-dca. Despite comparable cytotoxicity of complexes Ru-dca and Os-dca, both the complexes modified the cell cycle, mitochondrial membrane potential, and mitochondrial cytochrome c release by a different way, as revealed by flow cytometry experiments. The obtained results point out the different mechanisms of action between the complexes.
1. Introduction
Platinum(II) complexes cisplatin, carboplatin, and oxaliplatin represent the worldwide used metal-based anticancer chemotherapeutics [1]. It is well known that their application in clinics is connected with multiple drawbacks including nephrotoxicity, myelosuppression, and resistance of many tumors. Various strategies can be employed to improve the potency of the conventional platinum-based drugs and to circumvent the mentioned drawbacks [2,3]. One of them is based on the chemical modification of platinum(II) drugs, using their oxidation to Pt(IV) and coordination of bioactive ligands to the axial sites [4,5,6,7]. The first Pt(IV) complex of this type, cis,cis,trans-[Pt(NH3)2Cl2(dca)2] (mitaplatin) contains the orphan drug dichloroacetate (dca) coordinated to cisplatin [4]. The biological impact of mitaplatin is dual and affects both nuclear DNA (cisplatin) and mitochondria (dca) [4].
Osmium and especially ruthenium complexes have been intensively studied for their anticancer activity [8,9]. They act through different mechanisms of action than platinum-based drugs, resulting in different cytotoxicity profiles and ability to overcome both the intrinsic and acquired resistance of various tumors against platinum-based drugs. Importantly, several ruthenium complexes have entered the clinical trials as prospective non-platinum anticancer drugs [8,10]. Among the numerous types of anticancer ruthenium and osmium complexes, the half-sandwich complexes of the general formula [M(η6-ar)(XY)Z]0/+ represent a structural type showing the encouraging biological properties [11,12]; ar = six-membered arene ligand (e.g., p-cymene, pcym), XY = bidentate-coordinated ligand, Z = monodentate (typically halogenido) ligand. The mechanism of action is most likely based on a modulation of the redox status of the treated cancer cells [13,14]. Based on the extensive literature research, it is quite surprising that to date only one work has been dealing with the studies of cytotoxicity of half-sandwich Ru(II) or Os(II) complex containing the monodentate releasable bioactive ligand (in particular deprotonated ethacrynic acid, a known inhibitor of glutathione S-transferase isoenzymes [15], instead of the chlorido one [16]. By adopting the same premise, that it might be of great interest to investigate an impact of another type of simple bioactive carboxylate on cytotoxicity of half-sandwich non-platinum complexes, and having in mind the considerable anticancer effect of above-mentioned mitaplatin [4], we chose dichloroacetate as a suitable monodentate bioactive ligand for this research. Sodium dichloroacetate is an approved drug for the treatment of lactic acidosis, with promising cytotoxic properties [17]. The cytotoxic action of dichloroacetate is connected with an inhibition of pyruvate dehydrogenase kinase (PDK) resulting in a Warburg effect reversion, damage to the mitochondria and induction of apoptosis [18,19].
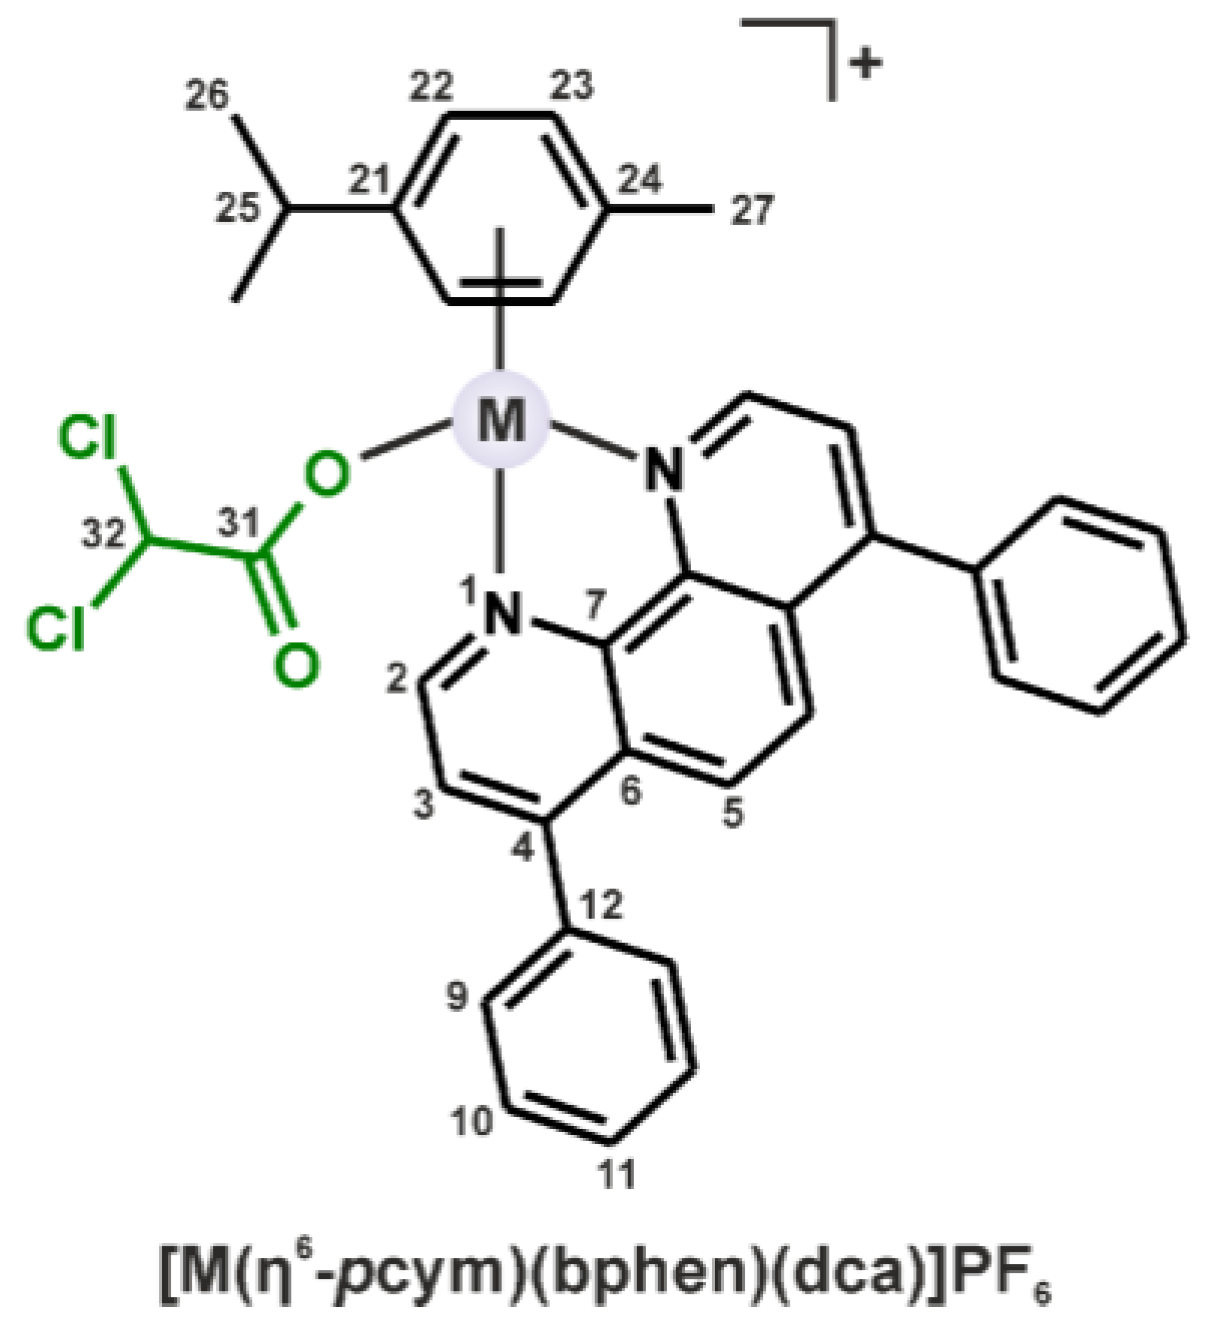
Concerning the metal species used in this work, we utilized the formerly reported anticancer Ru(II) chlorido complex [Ru(η6-pcym)(bphen)Cl]PF6 (Ru-Cl) whose in vitro cytotoxicity against the A2780 cells (IC50 = 0.5 μM) was ca. 2-fold higher as compared with cisplatin (IC50 = 1.1 μM); bphen = 4,7-diphenyl-1,10-phenanthroline (bathophenanthroline) [20]. Herein, its new Os(II) analogue, [Os(η6-pcym)(bphen)Cl]PF6 (Os-Cl), was prepared and both Ru(II) and Os(II) chlorido complexes were modified by the replacement of the chlorido ligand by dichloroacetato ligand, providing complexes of the composition [Ru(η6-pcym)(bphen)(dca)]PF6 (Ru-dca) and [Os(η6-pcym)(bphen)(dca)]PF6 (Os-dca) (Figure 1). Complexes Ru-dca and Os-dca represent the first examples of the half-sandwich Ru(II) and Os(II) complexes containing dca.
2. Results and Discussion
2.1. Synthesis and Characterization
The chlorido complexes Ru-Cl (known from the literature [20]) and Os-Cl (newly prepared) were synthesized in the microwave reactor and subsequently used for the syntheses of the dichloroacetato complexes Ru-dca and Os-dca (Figure 1), representing the first examples of half-sandwich Ru(II) and Os(II) complexes containing the dca ligand. The complexes were characterized by elemental analysis (C, H, N), electrospray ionization (ESI+) mass spectrometry, and 1H and 13C NMR, and IR spectroscopies.
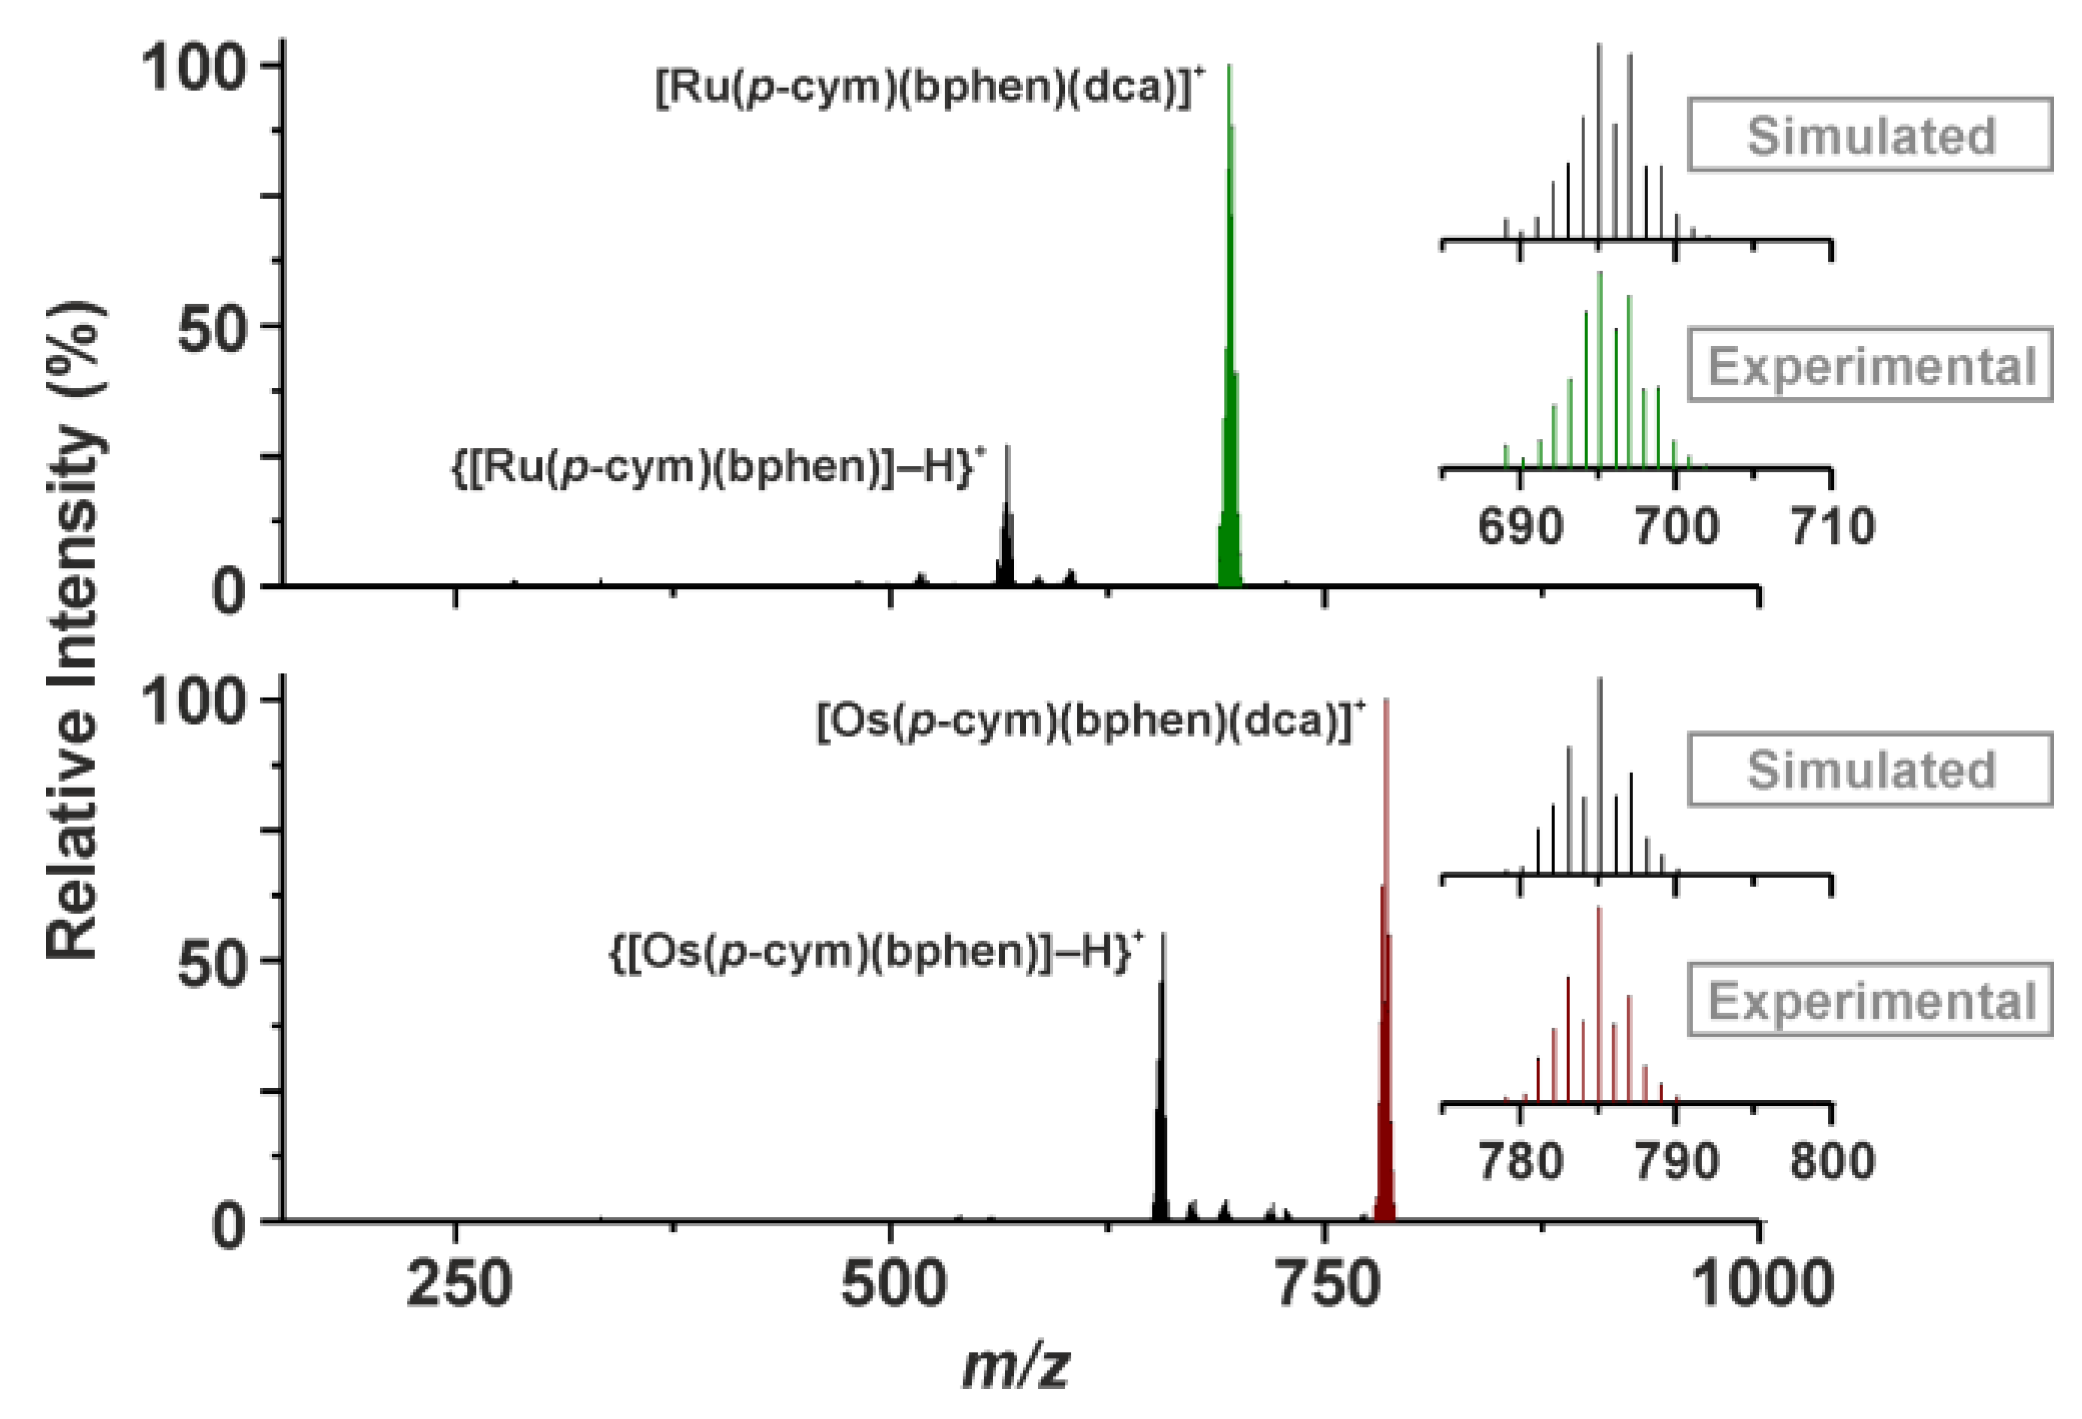
The ESI+ mass spectra of complexes Ru-dca and Os-dca contained the peaks of 100% relative intensity, belonging to the complex [M(pcym)(bphen)(dca)]+ cations (Figure 2), which directly proved the formation of complexes Ru-dca and Os-dca from the Ru-Cl and Os-Cl starting compounds. Further, the peaks, assignable according their m/z values and isotopic distribution to the {[M(pcym)(bphen)]–H}+ species, were detected in the mass spectra of both complexes Ru-dca and Os-dca (Figure 2).
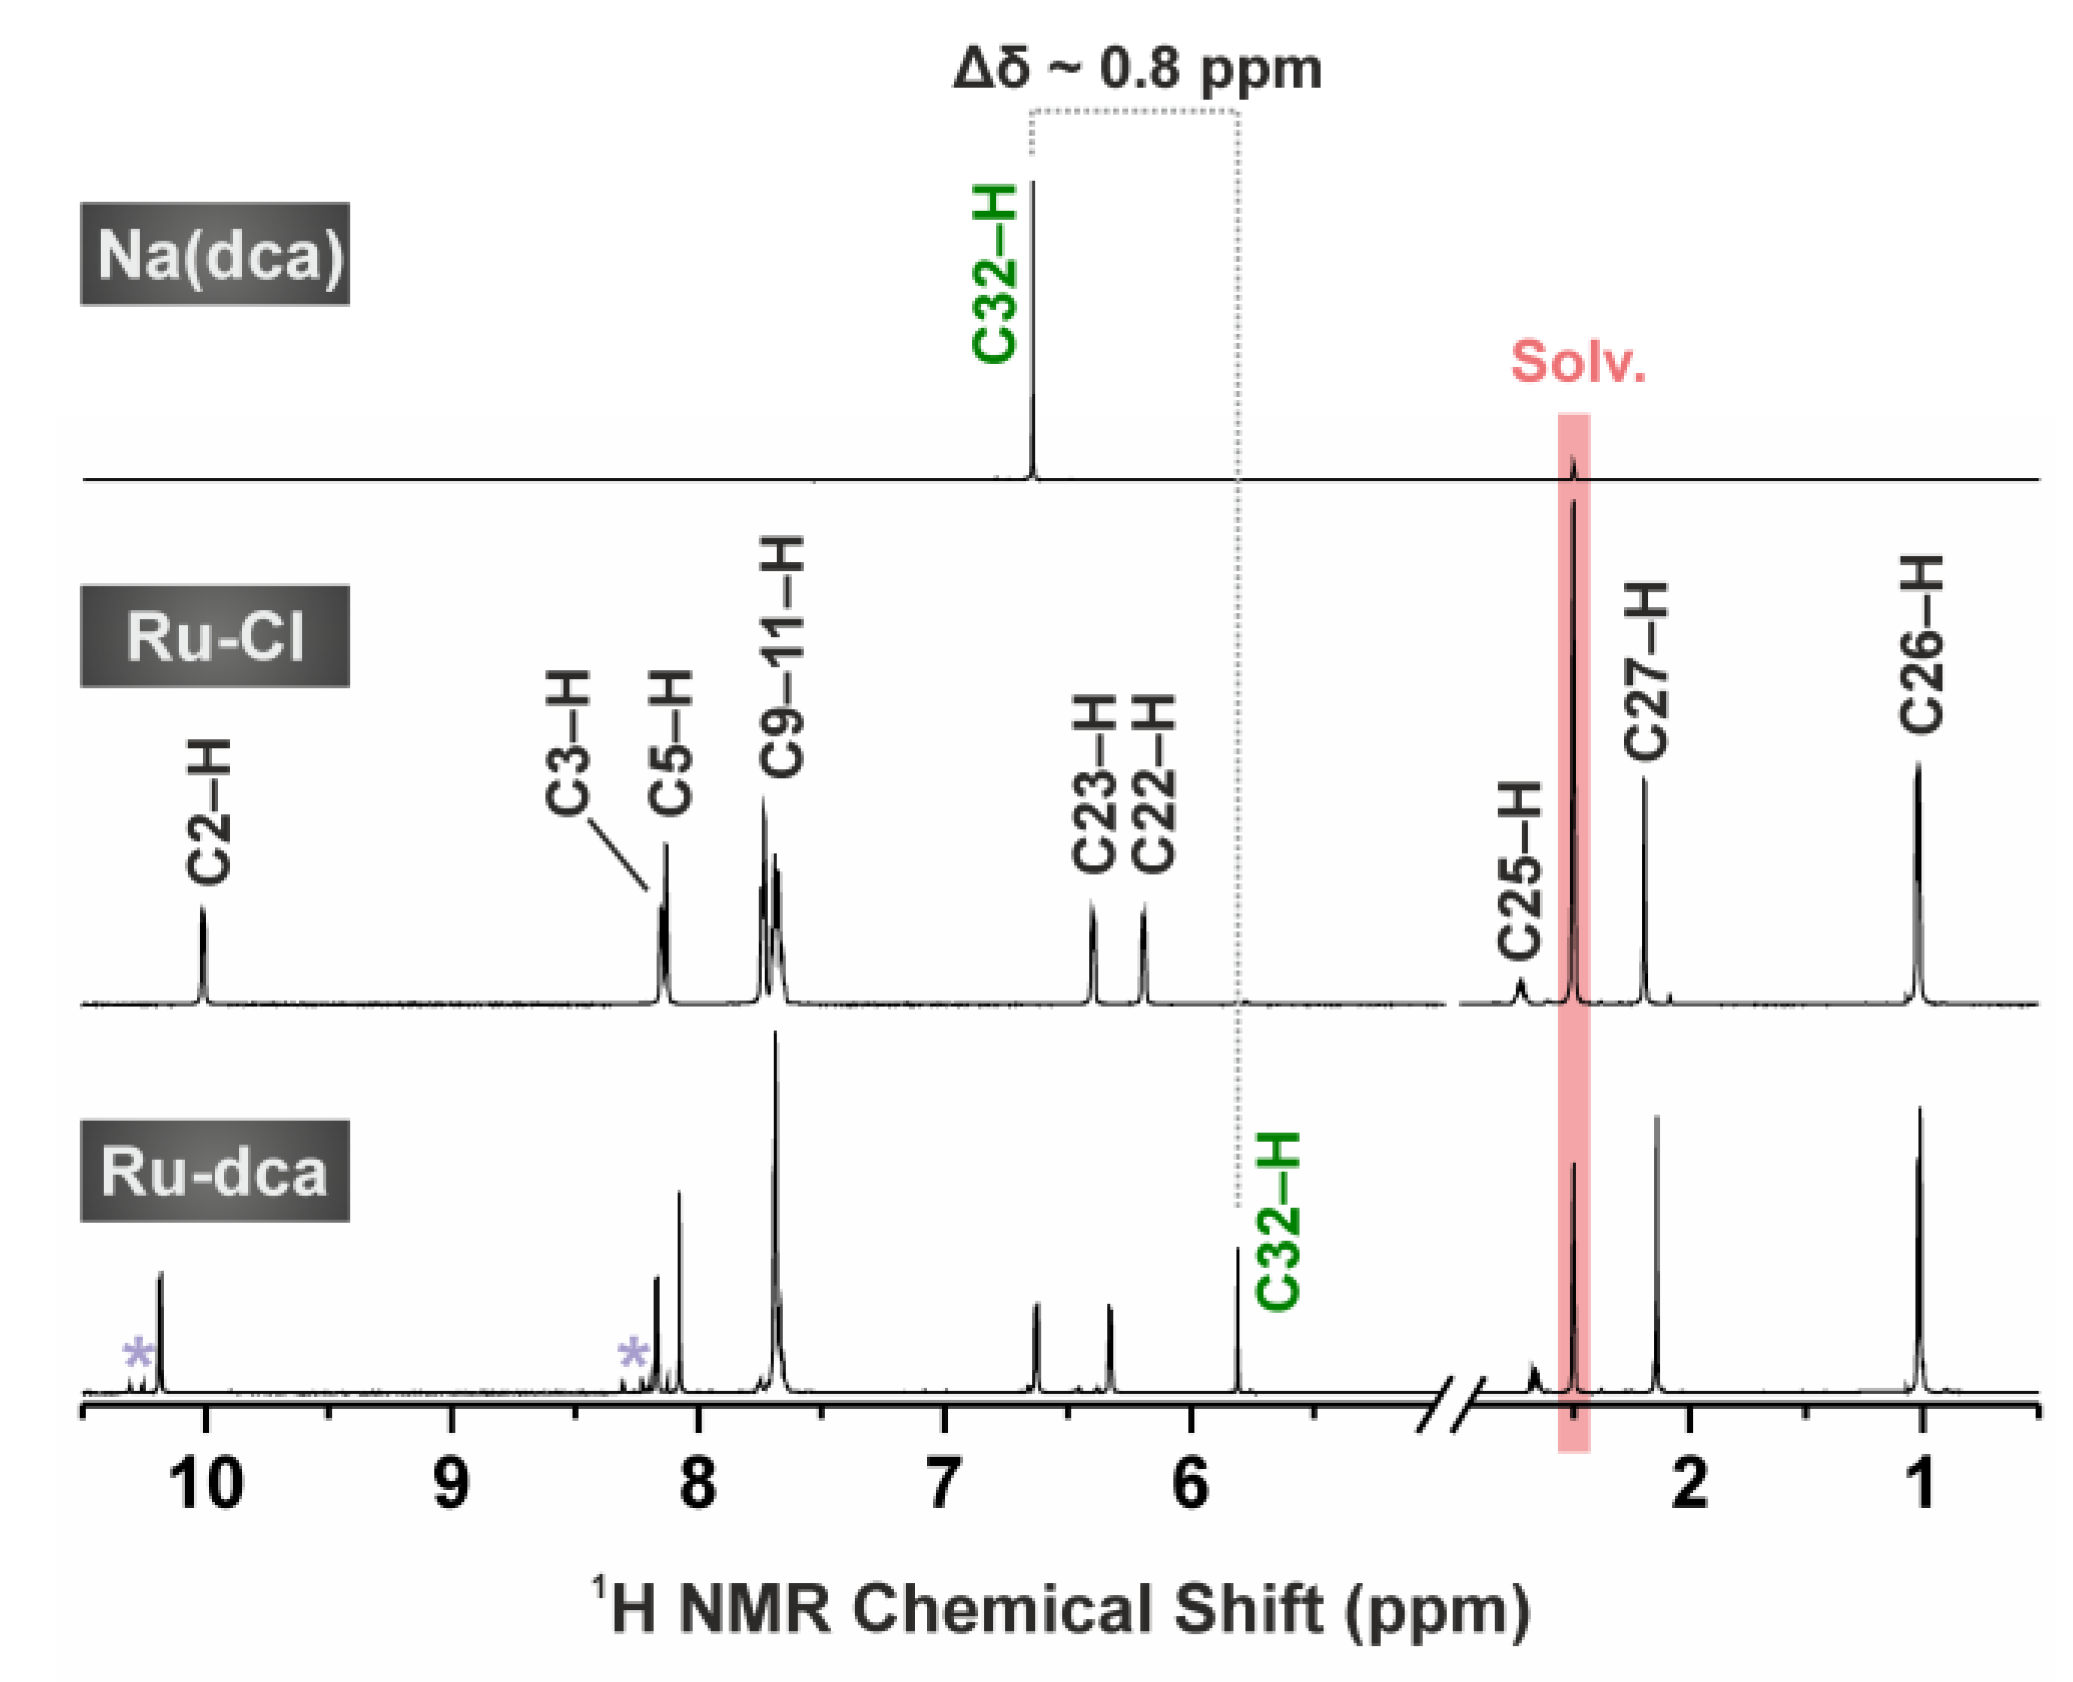
Although measured in different solvents, 1H NMR results of complex Ru-Cl (dissolved in DMSO-d6 or CDCl3 in this work; Figure 3 and Figure S1) were consistent with those previously reported for this complex (dissolved in acetone-d6) [20]. Complex Os-Cl had a similar pattern on the 1H NMR spectrum as the Ru-Cl complex, with the characteristic signals of the pcym aromatic hydrogens (C22–H and C23–H) shifted to the lower fields by ca. 0.2 ppm than for the Ru-Cl analogue. The replacement of the chlorido ligand of the precursors Ru-Cl and Os-Cl by the dca one became evident by a new 1H NMR signal (DMSO-d6 solutions) of the C32–H hydrogen atom of dca, detected at 5.81 ppm (for Ru-dca; Figure 3) and 5.86 ppm (for Os-dca). The C32–H signal of Na(dca) (measured in DMSO-d6) was found at 6.65 ppm, proving a coordination shift Δδ~0.8 ppm. Concerning the 13C NMR spectroscopy, the obtained spectra of the dca-complexes contained two new signals as compared with their chlorido analogues. These signals were detected at 168.3 ppm and 67.4 ppm (for Ru-dca), and at 168.1 ppm and 66.8 ppm (for Os-dca), and can be unambiguously assigned to the C31 and C32 atoms of the dca ligand. These signals were shifted by 2.4 ppm (for C31) and 1.5 ppm (for C32) for Ru-dca, and by 2.2 ppm (for C31) and 0.9 ppm (for C32) for Os-dca, as compared with Na(dca) (measured in the same solvent; δ (ppm) = 65.9 (C31), 165.9 (C32)).
The purity of complexes Ru-dca and Os-dca was >97% and >99%, respectively, based on the results of elemental analysis and 1H NMR spectroscopy (Figure 3). Regarding the stability in the used solvent (DMSO-d6), no new signals or chemical shift changes were observed in the 1H NMR spectra of the studied complexes Ru-dca and Os-dca even after 72 h of standing at ambient temperature.
2.2. 1H NMR Spectroscopy and ESI+ Mass Spectrometry Studies of Hydrolytic Stability
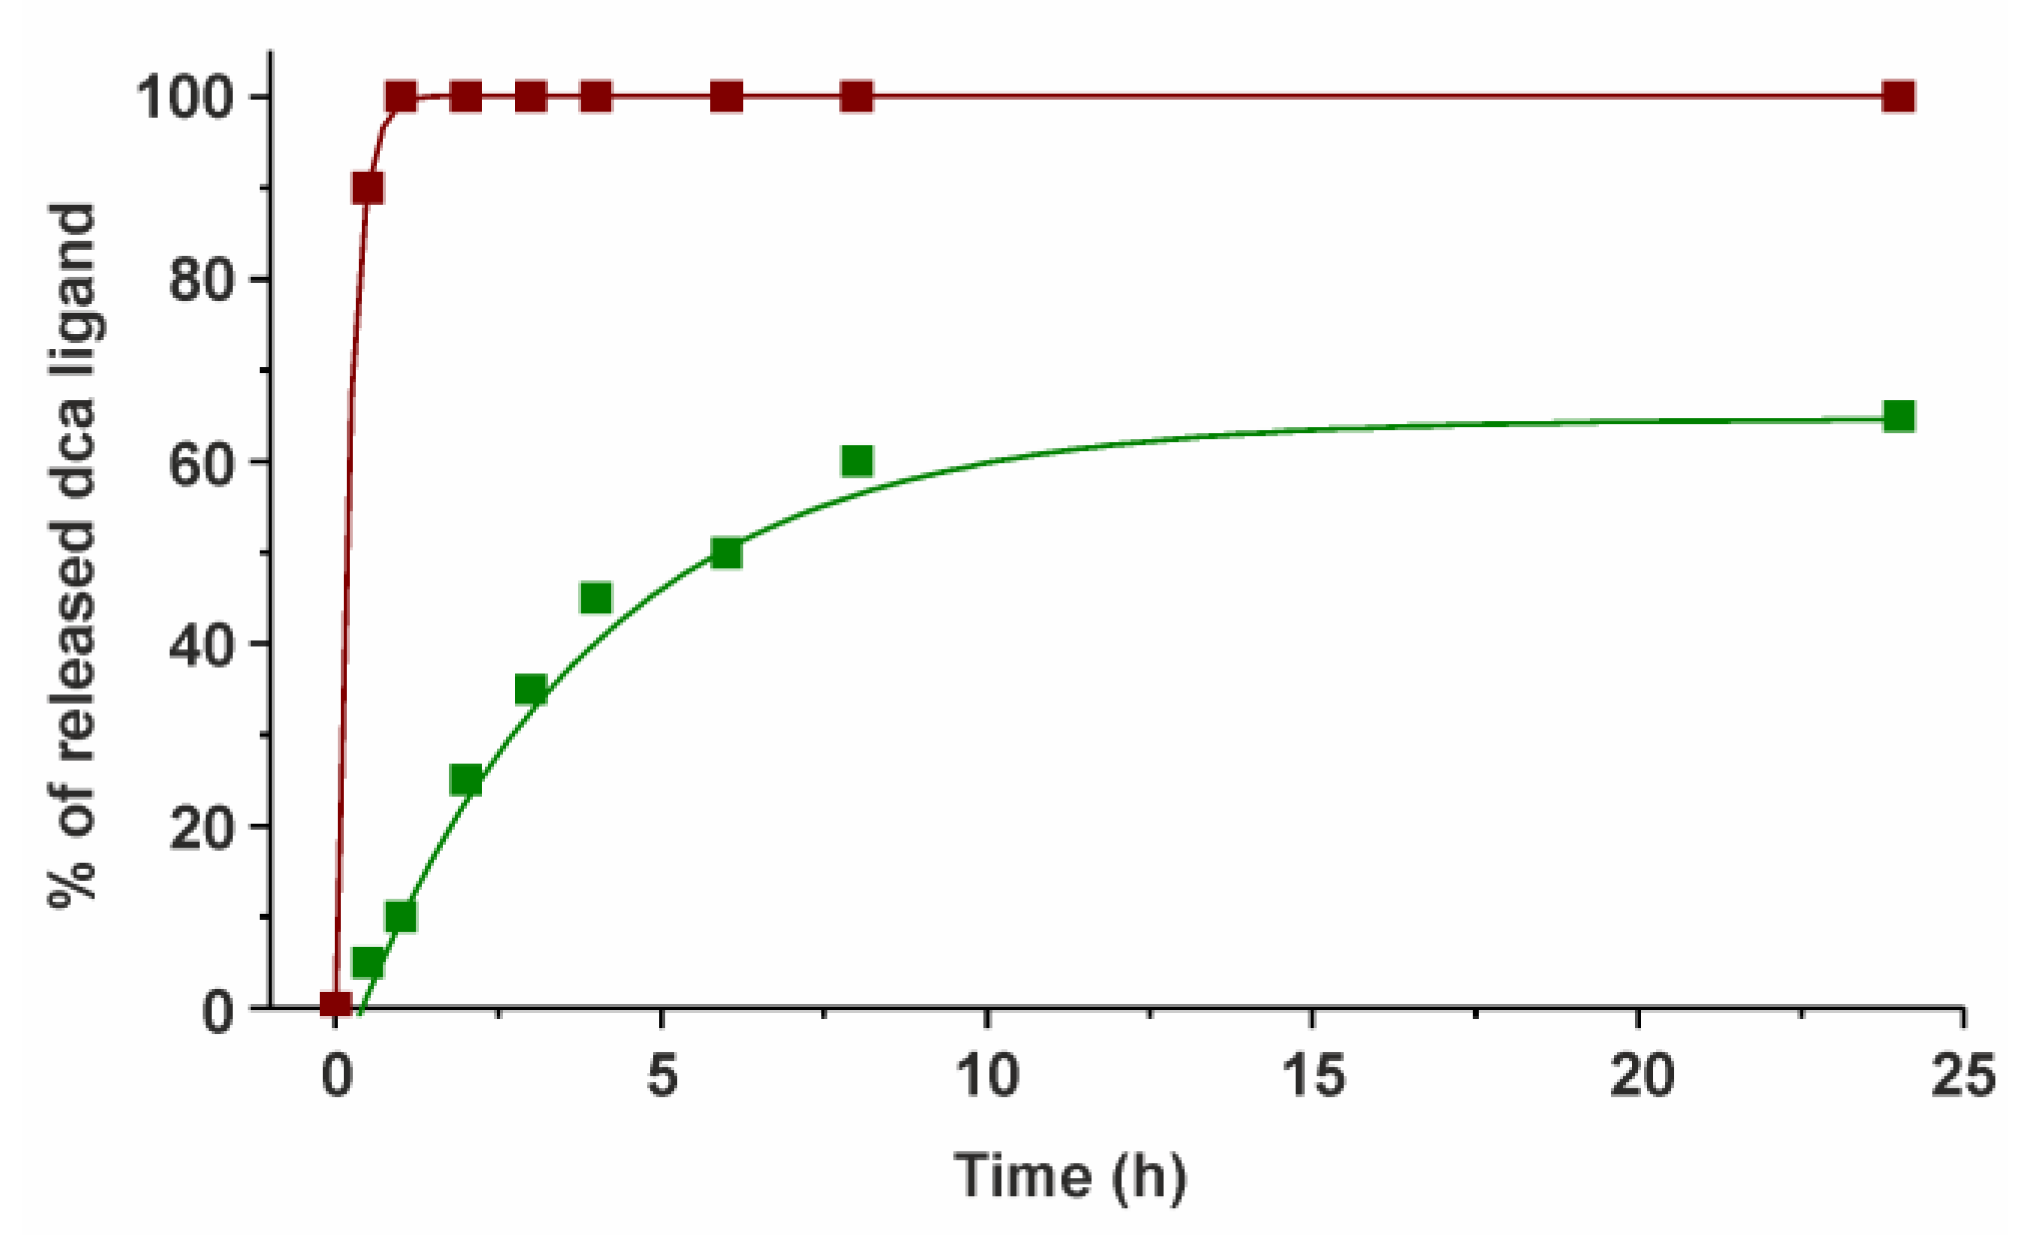
Since the studied complexes Ru-dca and Os-dca were designed as prodrugs of two mechanistically independent cytotoxic species (i.e., metal-based species and released dca), the solution behavior in water-containing medium was studied by relevant techniques (NMR, ESI-MS) to show, whether the dca ligand releases under the used conditions. Both the complexes Ru-dca and Os-dca (1 mM concentration) hydrolyzed in the used water-containing mixture of solvents (20% MeOD-d4/80% D2O), where methanol ensured the sufficient solubility to reach relevant concentration (1 mM in this work) for 1H NMR experiments. Hydrolysis of the studied complexes is connected with the release of the dca ligand (Figure 4). A 1H NMR signal of C32–H of the coordinated dca ligand showed at 5.47 ppm for Ru-dca and at 5.48 ppm for Os-dca, while the released dca anion showed at 5.91 ppm in the 1H NMR spectra of both complexes (Figure S2). A position of this signal correlated well for the released dca and free dca (measured for Na(dca) in the same mixture of solvents) detected at 5.93 ppm. Complex Ru-dca hydrolyzed completely, while the hydrolysis rate was only ca. 65% for its Os(II) analogue after standing at room temperature for next 24 h (Figure 4).
The ESI+ mass spectra of both complexes Ru-dca and Os-dca (10 µM concentration) contained the peaks assignable to the hydrolytic products of the parent complexes of the composition [M(pcym)(bphen)(OH)]+. As for Ru-dca, a ratio of intensities between the [Ru(pcym)(bphen)(dca)]+ (695.1 m/z) and hydrolyzed [Ru(pcym)(bphen)(OH)]+ (584.8 m/z) species equaled ca. 3:2 after standing at room temperature for 1 h, while a peak of the parent [Ru(pcym)(bphen)(dca)]+ species almost disappeared (<5% relative intensity) with ongoing hydrolysis after 24 h (Figure S3). In the case of complex Os-dca, the change of the ratio of intensities between the [Os(pcym)(bphen)(dca)]+ (785.3 m/z) and [Os(pcym)(bphen)(OH)]+ (675.3 m/z) species detected after 1 h (ca. 6:1) and 24 h (ca. 5:1) was negligible (Figure S3). Thus, the ESI+ mass spectrometry results, consistently with 1H NMR spectra (see above), provided proofs revealing a higher hydrolytic stability of the Os-dca complex as compared to its Ru(II) analogue.
2.3. Mass Spectrometry Studies of Interactions with Sulfur-Containing Biomolecules
To investigate better the behavior of the studied complexes in the presence of selected biomolecules, we performed the ESI+ MS experiments for the mixtures of complexes Ru-dca and Os-dca (10 µM final concentration) with the sulfur-containing biomolecules l–cysteine (CySH) and reduced glutathione (GSH) at their average levels in human plasma [21,22,23]. No peaks assignable to the covalent adducts with CySH or GSH were detected in the ESI+ mass spectra of the samples containing complex Ru-dca and the mixture of CySH and GSH after 24 h of incubation. However, the peaks assignable to the adducts of {[Ru(pcym)(bphen)]–H}+ with either two CyS (or one cystine (CySSCy); 807.2 m/z) or with CyS and GS (or their disulfide CySSG; 993.2 m/z) appeared in the ESI+ mass spectrum of the reaction system after 24 h of incubation (Figure S4). Moreover, a peak whose mass-to-charge ratio and isotopic pattern suggests the formation of adduct of {[Ru(pcym)(bphen)]+(HL1)–H}+ with deaminated cysteine (i.e., 3-sulfanylpropanoic acid; HL1), showed at 673.0 m/z in the ESI+ mass spectrum recorded after 24 h (Figure S4). Although the deamination reaction is not very common in connection with the electrospray ionization process, similar processes, such as the deamination of various anilines by the Ru-based catalyst [24] or cysteine deamination to β-mercaptopyruvate [25] were already described in the literature.
As for the Os-dca complex, the peaks of similar adducts described above for the the Ru-dca complex were also detected by ESI+ mass spectrometry in the mixture containing Os-dca complexes (i.e., {[Os(pcym)(bphen)]–H}+ with either two CyS or one CySSCy at 897.2 m/z, or with CyS and GS or disulfide CySSG at 1083.3 m/z), however their assignability is uncertain due to very low intensity. On the other hand, the ESI+ mass spectrometry experiments confirmed higher stability of the Os-dca complex in the presence of GSH. Specifically, the intensity ratio of [Os(pcym)(bphen)(dca)]+ and [Os(pcym)(bphen)(OH)]+ was ca. 8:1 after 1 h and ca. 6:1 after 24 h. Contrary to complex Ru-dca, no peak indicating the cysteine deamination was detected in the ESI+ mass spectra recorded on the mixture containing complex Os-dca.
2.4. Mass Spectrometry Studies of Interactions with Model Proteins
The affinity of the complexes Ru-dca and Os-dca towards the model proteins cytochrome c (Cytc) and lysozyme (HEWL) was studied by ESI+ mass spectrometry. Both proteins were formerly reported as interacting with platinum-based drugs [26,27,28] as well as with similar half-sandwich Ru(II) [28,29,30,31,32,33] and Os(II) [34] complexes, thus they represent the suitable models to shed a light on whether the interactions with proteins should be taken into account as a possible aspect of mechanism of action/transportation/activation of the Ru-dca and Os-dca complexes. However, any peaks assignable to the adducts of the [M(pcym)(bphen)(dca)]+ complex cations or their fragments were not detected in the deconvoluted mass spectra of the mixtures of the studied dca-complexes with neither Cytc nor HEWL, even after 120 h after preparation of the reaction systems. The only adduct, visible after 24 h of incubation of Cytc with the studied complexes Ru-dca or Os-dca corresponded to the mass difference of 145 Da, assignable to the adduct of Cytc with the PF6– ion (Figure S5). Such adducts appear commonly in the protein-metal complex systems containing the PF6– anions studied by electrospray-ionization mass spectrometry as minor adducts, accompanying the major metalated ones [35,36]. However, in our case, we did not observe formation of such products.
2.5. In Vitro Cytotoxicity
The in vitro cytotoxicity of complexes Ru-dca and Os-dca was screened at the A2780 human ovarian carcinoma cell line. The dca-complexes were slightly more cytotoxic (IC50 = 3.5 ± 0.3 μM and 2.6 ± 0.4 μM for Ru-dca, and Os-dca, respectively) against the used A2780 cells than the clinically used platinum-based drug cisplatin (IC50 = 5.9 ± 1.2 μM); note: IC50 of Hdca equaled 5.0 mM with the same experimental conditions used. The relative activity (RA = IC50(cisplatin)/IC50(complex)) equaled ca. 1.7 and 2.3 for complexes Ru-dca, and Os-dca, respectively, which implied approximately 2-fold higher potency than determined for conventional cisplatin. Even if no direct comparison should be made between the IC50 values obtained by our experiments and the published results of cytotoxicity, it is important to note that the well-known Ru(II) complex KP1019, which have entered into the clinical trials, showed lower potency (IC50 = 77.8 μM) as compared to cisplatin (IC50 = 9.5 μM) at the A2780 cells (24 h exposure with no recovery, MTT assay), thus showing the RA value of ca. 0.1 [37]. Similarly, mitaplatin, a Pt(IV) complex containing the dca ligand (see Introduction), is also less effective (IC50 = 1.1 μM) than the reference drug cisplatin (IC50 = 0.6 μM) at the same A2780 cell line (72 h exposure with no recovery, MTT assay), resulting in the RA value of ca. 0.5 [4].
The cellular accumulation of the Ru-dca and Os-dca complexes equaled 366.1 ± 14.0, and 273.1 ± 6.4 fmol/106 cells, respectively, indicating that the Os-dca complex was less accumulated within the cancer cells than its Ru(II) analogue. Taking into account the similar results of cytotoxicity of both complexes and on the other hand the differences in their cellular accumulation, these findings may indicate dissimilarity in molecular mechanisms of cytotoxicity of both complexes. In addition, both the dca-complexes exceeded the cell uptake level of their chlorido precursors (see Table 1).
In vitro toxicity of the Ru-dca and Os-dca complexes was studied on the primary culture of human hepatocytes. The obtained results indicated that the toxic effect of complexes Ru-dca (IC50 = 19.1 μM) and Os-dca (IC50 = 19.7 μM) is lower than their cytotoxicity against the A2780 ovarian carcinoma cells.
2.6. Cell Cycle Analysis
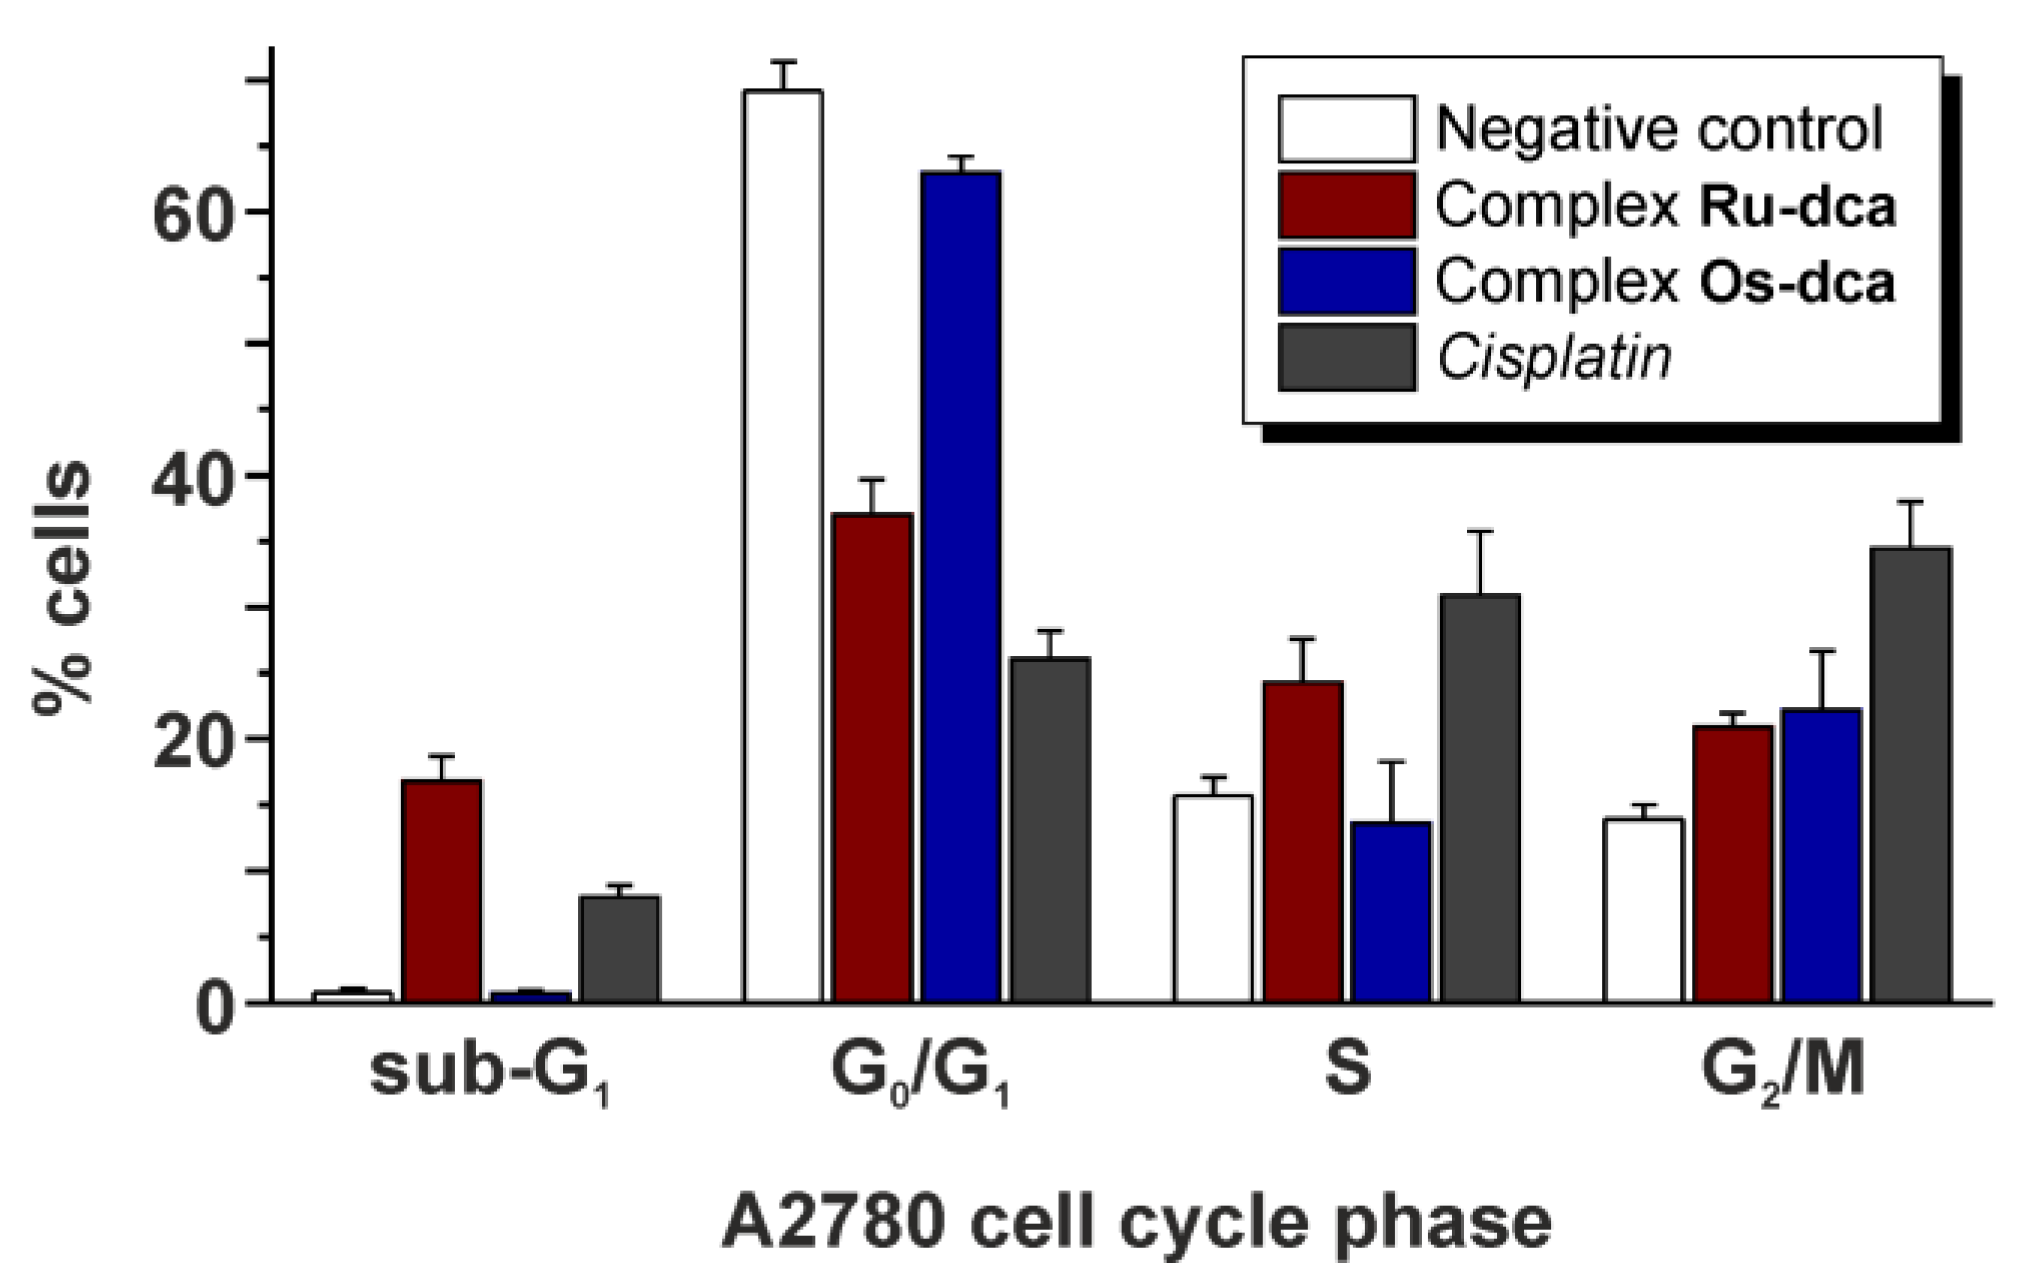
The Ru-dca and Os-dca complexes modified the cell cycle of the A2780 human ovarian carcinoma cells differently, when applied at equipotent (IC50) concentration (Figure 5, Table 2). In particular, the Ru-dca complex strongly increased the sub-G1 cell population (16.8% of cells) as comparted to the Os-dca complex (0.7% of cells). The increase in the sub-G1 population is often connected with the appearance of late-apoptotic and necrotic cells. Simultaneously, the Ru-dca complex caused the decline in the G0/G1 cell cycle phase population (37.0% of cells) as compared with the negative control (69.2% of cells) as well as with complex the Os-dca complex (62.9% of cells). In the S-phase, the effect of the Ru-dca complex is much closer to that of cisplatin (24.3% vs. 30.9% of cells) as compared with the Os-dca complex (13.6% of cells). In the G2/M cell phase, both the complexes showed the similar effect (20.9% vs. 22.2% of cells). Overall, the results of cell cycle modifications revealed that the cellular effects of the Ru-dca complex are much more similar to the effects of cisplatin, while the Os-dca complex showed only a small effect on the cell cycle in the A2780 cells as compared to the negative control. Just for the comparative purposes we may show that similar human cancer cell cycle perturbations were recently reported for half-sandwich complexes [Ru(η6-pcym)(L2)Cl] and [Os(η6-pcym)(L2)Cl] containing 1-(4-methoxybenzyl)-4-phenyl-1H-1,2,3-triazole (HL2) [38].
2.7. Induction of Mitochondrial Membrane Potential Changes and Cytochrome c Release
In general, the cytotoxic effect of anticancer agents is often connected with the mitochondrial membrane potential alternation [39,40], as formerly described for various cytotoxic agents including the dca-containing Pt(IV) complex mitaplatin [4] or half-sandwich complexes similar to the herein reported complexes [13]. Further, it is generally accepted that the depolarization of mitochondrial membrane is usually connected with the Cytc release [39,41]. The released Cytc subsequently activates various proapoptotic signals in the cytosol (like formation of apoptosome), making Cytc an ultimate factor in the programmed cell death regulation. The Cytc release also most likely plays a crucial role in the mechanism of cancer cell resistance against the therapeutic action of anticancer drugs such as cisplatin [39,40]. Additionally, sodium dichloroacetate is well-known clinically studied mitochondria-targeting anticancer active small molecule [19]. This implied a possibility of the synergistic effect of the metal-based species and the dca ligand, both released from the studied complexes Ru-dca and Os-dca.
Concerning the Ru-dca and Os-dca complexes, these compounds induced only low mitochondrial membrane depolarization while 89.3% of cells, and 93.2% of cells, respectively, stayed intact. This result is also comparable with the conventional platinum-based drug cisplatin (88.8% of intact cells) (Table 3).
Although the above-mentioned results revealed that both the complexes caused only slight depolarization of mitochondrial membranes, the further flow-cytometry studies of cytochrome c (Cytc) cytosolic release [39,41], which is a causal pre-condition of apoptosome activation, were performed. The Ru-dca complex showed considerable induction of Cytc release from the mitochondria (94.6% of all cells were positive), while only the moderate Cytc release was induced by the Os-dca complex (39.9% of all cells were positive), as compared with the negative control (only 12.3% of all cells were Cytc positive) (see Figure 6). The effect of the Ru-dca complex almost reached the level of the positive control (Figure 6 and Table 4) and significantly exceeded both reference drugs staurosporine (47.1% of positive cells) and cisplatin (53.0% of positive cells). Furthermore, the induction of the Cytc release from the mitochondria in the A2780 cells was significantly higher for both dca-complexes as compared with their chlorido-analogues (see Table 4).
The studies of the ability of half-sandwich Ru(II) or Os(II) complexes to induce the Cytc release are quite rare in the literature. In particular, it has been reported that complexes RAPTA-C (Western blot analysis) [42] and [Os(η6-pcym)(L2)I]PF6 (flow cytometry studies) [43] induced the Cytc release in the treated human cancer cells; L2 = N,N-dimethyl-4-[(E)-pyridin-2-yl-diazenyl]-aniline.
A lack of correlation between the flow cytometry studies of the mitochondria membrane potential depletion and Cytc release induced by the studied complexes (Table 3 and Table 4) could be connected with various aspects of the Cytc release from mitochondria [44,45]. In other words, the Cytc release does not have to be necessarily a consequence of a Δψm loss, because it was reported that (a) the Cytc release occurs independently from the mitochondria membrane status [44], and (b) Cytc releases mitochondria through the multiple pathways [45].
3. Materials and Methods
3.1. Materials
The starting salts RuCl3∙xH2O and OsCl3∙xH2O were supplied by Precious Metals Online (University of Wollongong, Wollongong, Australia) and Sigma-Aldrich (Prague, Czech Republic), respectively. The chemicals 1-methyl-4-(propan-2-yl)cyclohexa-1,3-diene (α-terpinene), 4,7-diphenyl-1,10-phenanthroline (bathophenanthroline, bphen), dichloroacetic acid (Hdca), sodium hydroxide, silver(I) trifluoromethanesulfonate (AgOTf), ammonium hexafluorophosphate, l–cysteine (CySH), reduced glutathione (GSH), cytochrome c from bovine heart (Cytc) and hen egg-white lysozyme (HEWL) were purchased from VWR International (Stříbrná Skalice, Czech Republic) and Sigma-Aldrich (Prague, Czech Republic), while the solvents (methanol, diethyl ether, n-hexane, dichloromethane) were supplied by Litolab (Chudobín, Czech Republic). The deuterated solvents for the NMR experiments (DMSO-d6, CDCl3, MeOD-d4, D2O, DClO4 and KOD) were purchased from Sigma-Aldrich (Prague, Czech Republic).
[Ru(µ-Cl)(η6-pcym)Cl]2 and [Os(µ-Cl)(η6-pcym)Cl]2 were prepared in a microwave reactor Monowave 300 (Anton PaarGmbH, Graz, Austria), according to the reported protocols [46,47]. Silver(I) dichloroacetate, Ag(dca), was prepared as white solid from Hdca, which was neutralized by stoichiometric amount of 1 M NaOH (in methanol) providing Na(dca), which subsequently interacted in situ (15 min of stirring at ambient temperature in the dark) with 1 molar equiv. of AgOTf.
3.2. Synthesis
The formerly reported protocol for the preparation of complex Ru-Cl [20] was modified, as described in Supplementary Materials, and this modification was used also for new Os(II) analogue Os-Cl. Complexes Ru-Cl and Os-Cl (0.05 mmol) were dissolved in MeOH (15 mL) and an excess of Ag(dca) (0.25 mmol) was added to both solutions. The mixtures were stirred overnight without heating under the aluminum foil. Thereafter, the formed AgCl and unreacted Ag(dca) was removed, and NH4PF6 (0.5 mmol) was added to the filtrates, followed by the solvent evaporation combined with the addition of excess diethyl ether, until the solid formed. The crude products were recrystallized from the mixture of dichloromethane and n-hexane to give complexes [Ru(η6-pcym)(bphen)(dca)]PF6 (Ru-dca) and [Os(η6-pcym)(bphen)(dca)]PF6 (Os-dca) (Figure 1). The products were collected by filtration, washed (1 × 0.5 mL of MeOH and 3 × 1 mL of diethyl ether) and dried under vacuum. The yields were 45% (for Ru-dca) and 35% (for Os-dca), related to the starting Ru(II) and Os(II) dimers.
Anal. Calcd. for C36H31N2O2Cl2RuPF6 (Ru-dca): C, 51.44; H, 3.72; N, 3.33%; found: C, 51.06; H, 3.63; N, 3.14%. 1H NMR (DMSO-d6, ppm): δ 10.19 (d, J = 5.5 Hz, C2–H, 2H), 8.17 (d, J = 5.5 Hz, C3–H, 2H), 8.08 (s, C5–H, 2H), 7.67 (m, C9–H, C10–H, C11–H, 10H), 6.63 (d, J = 6.4 Hz, C23–H, 2H), 6.33 (d, J = 6.4 Hz, C22–H, 2H), 5.81 (s, C32–H, 1H), 2.66 (sep, J = 7.3 Hz, C25–H, 1H), 2.14 (s, C27–H, 3H), 1.01 (d, J = 7.3 Hz, C26–H, 6H). 1H NMR (CDCl3, ppm): δ 9.90 (d, J = 5.5 Hz, C2–H, 2H), 8.03 (s, C5–H, 2H), 7.98 (d, J = 5.5 Hz, C3–H, 2H), 7.59 (m, C9–H, C10–H, C11–H, 10H), 6.31 (d, J = 6.4 Hz, C23–H, 2H), 6.07 (d, J = 6.4 Hz, C22–H, 2H), 5.36 (s, C32–H, 1H), 2.70 (sep, J = 6.6 Hz, C25–H, 1H), 2.19 (s, C27–H, 3H), 1.16 (d, J = 6.4 Hz, C26–H, 6H). 13C NMR (DMSO-d6, ppm): δ 168.3 (C31), 156.4 (C2), 150.4 (C4), 146.2 (C7), 134.9 (C12), 130.0–127.5 (C6, C9, C10, C11), 125.4 (C5), 102.6 (C24), 102.4 (C21), 86.3 (C23), 83.3 (C22), 67.4 (C32), 30.6 (C25), 22.0 (C26), 18.1 (C27). ESI+ MS (methanol, m/z): 567.2 (calc. 567.1; 30%; {[Ru(pcym)(bphen)]–H}+), 695.1 (calc. 695.1; 100%; [Ru(pcym)(bphen)(dca)]+). IR (ATR, cm–1): 401, 489, 556, 636, 669, 702, 736, 765, 834, 927, 1000, 1020, 1029, 1055, 1077, 1191, 1231, 1325, 1403, 1420, 1426, 1445, 1470, 1494, 1518, 1537, 1562, 1598, 1659, 2846, 2923, 2965, 3057.
Anal. Calcd. for C36H31N2O2Cl2OsPF6 (Os-dca): C, 46.51; H, 3.36; N, 3.01%; found: C, 46.60; H, 3.20; N, 3.16%. 1H NMR (DMSO-d6, ppm): δ 10.12 (d, J = 5.5 Hz, C2–H, 2H), 8.15 (s, C5–H, 2H), 8.13 (d, J = 5.5 Hz, C3–H, 2H), 7.70 (m, C9–H, C10–H, C11–H, 10H), 6.88 (d, J = 5.5 Hz, C23–H, 2H), 6.53 (d, J = 5.5 Hz, C22–H, 2H), 5.86 (s, C32–H, 1H), 2.56 (sep, J = 6.4 Hz, C25–H, 1H), 2.23 (s, C27–H, 3H), 0.97 (d, J = 6.4 Hz, C26–H, 6H). 1H NMR (CDCl3, ppm): δ 9.84 (d, J = 5.5 Hz, C2–H, 2H), 8.08 (s, C5–H, 2H), 7.95 (d, J = 5.5 Hz, C3–H, 2H), 7.59 (m, C9–H, C10–H, C11–H, 10H), 6.56 (d, J = 5.8 Hz, C23–H, 2H), 6.28 (d, J = 5.8 Hz, C22–H, 2H), 5.33 (s, C32–H, 1H), 2.57 (sep, J = 6.8 Hz, C25–H, 1H), 2.26 (s, C27–H, 3H), 1.08 (d, J = 6.8 Hz, C26–H, 6H). 13C NMR (DMSO-d6, ppm): δ 168.1 (C31), 156.4 (C2), 150.8 (C4), 147.5 (C7), 134.7 (C12), 130.0–127.8 (C6, C9, C10, C11), 126.5 (C5), 101.6 (C21), 92.8 (C24), 85.1 (C23), 77.4 (C22), 66.8 (C32), 30.8 (C25), 22.4 (C26), 18.2 (C27). ESI+ MS (methanol, m/z): 657.3 (calc. 657.2; 45%; {[Os(pcym)(bphen)]–H}+), 785.1 (calc. 785.1; 100%; [Os(pcym)(bphen)(dca)]+). IR (ATR, cm–1): 401, 491, 557, 638, 669, 702, 735, 766, 835, 928, 971, 1000, 1021, 1028, 1054, 1134, 1232, 1268, 1322, 1407, 1420, 1427, 1445, 1470, 1495, 1519, 1558, 1601, 1628, 1660, 2871, 2927, 2967, 3065.
3.3. Methods
The 1H, 13C and 1H–1H gs-COSY spectra were recorded using a JEOL JNM-ECA 600II spectrometer (JEOL USA, Inc., Peabody, MA, USA) at 600.00 MHz (for 1H) and 150.86 MHz (for 13C) in the DMSO-d6 or CDCl3 solutions. The obtained 1H and 13C NMR spectra were calibrated against the residual signals (2.50 ppm for 1H NMR, 39.52 ppm for 13C NMR) of the used solvent [48]. The splitting of the 1H NMR signals is defined as s = singlet, d = doublet, sep = septet and m = multiplet. Mass spectrometry experiments were performed using a LCQ Fleet Ion Trap spectrometer (Thermo Scientific; Qual Browser software, version 2.0.7; Waltham, MA, USA) in the positive electrospray ionization mode (ESI+) in the methanolic solutions, and methanol/water (1:1, v/v) for interaction experiments, respectively. The protein mass spectra, measured in ESI+ mode, were deconvoluted by Promass for Xcalibur ver. 3.0, rev. 10 software (Novatia LLC, Newtown, PA, USA) to obtain the neutral mass spectra. Infrared spectra (400–4000 cm–1, ATR technique) were acquired by a Nexus 670 FT-IR (Thermo Nicolet; Waltham, MA, USA). Elemental analyses (C, H, N) were carried out by a Flash 2000 CHNS Elemental Analyzer (Thermo Scientific; Waltham, MA, USA).
3.4. 1H NMR and ESI+ MS Studies of Hydrolytic Stability
The appropriate amount (for 600 µL of 1 mM solutions) of complexes Ru-dca and Os-dca were dissolved in MeOD-d4 (120 µL) and diluted by 480 µL of D2O. 1H NMR spectra were recorded on the fresh solutions (t = 0 h), and after 0.5, 1, 2, 3, 4, 6, 8 and 24 h of standing at ambient temperature. The obtained 1H NMR spectra were calibrated against the residual signal of D2O (4.85 ppm) [48]. For comparative purposes, the 1H NMR spectrum was also recorded for sodium dichloroacetate (Na(dca)) in 20% MeOD-d4/80% D2O.
Similar experiments were performed by ESI+ mass spectrometry for complexes Ru-dca and Os-dca (10 µM concentration) dissolved in the MeOH/H2O mixture (1:1, v/v). The spectra were recorded immediately after the sample preparation, and then after 1 h and after 24 h of standing at ambient temperature.
3.5. Studies of Interactions with Biomolecules
The ESI+ MS studies of interactions of complexes Ru-dca and Os-dca with relevant biomolecules GSH and CySH were performed as follows: complexes (either Ru-dca or Os-dca) were dissolved in MeOH (500 µL, 10 µM final concentration) and 500 µL of the mixture of GSH (6 µM final concentration) and CySH (290 µM final concentration) in H2O was added. The obtained solutions were mixed properly and the ESI+ mass spectra were recorded immediately after preparation and after 1 and 24 h of standing at laboratory temperature.
Similarly, the interactions of complexes Ru-dca and Os-dca with the model protein lysozyme and cytochrome c were studied by means of ESI+ mass spectrometry. The samples contained the mixtures of either complex Ru-dca or Os-dca (at the 10 µM final concentration) with HEWL or Cytc (at the 3 µM final concentration) in the mixture of MeOH/H2O (1:1, v/v). The ESI+ mass spectra were recorded immediately after preparation and then after 1 and 24 h of standing of the mixtures at laboratory temperature. The specific experimental conditions were as follows: the sample solutions were introduced by HPLC (Dionex UltiMate 3000; Thermo Scientific; Waltham, MA, USA) in 50 µL spikes into the continual flow of methanol (0.2 mL/min flow rate), 5.3 kV spray voltage, 110 V and 275 °C capillary voltage and temperature. The obtained spectra were acquired in the range of 150–2000 m/z and the raw ESI+ spectra of proteins were deconvoluted by Promass for Xcalibur ver. 3.0, rev 10 software (Novatia LLC, Newtown, PA, USA) using the 0.1 Da mass step size.
3.6. Cell Culture
The A2780 human ovarian carcinoma cell line (European Collection of Cell Cultures; Salisbury, UK) and primary culture of human hepatocytes (Hep, Biopredic Intl., Saint-Grégoire, France) were cultured according to the suppliers’ instructions, using RPMI-1640 medium supplemented with 10% of fetal calf serum, 1% of 2 mM glutamine and 1% penicillin/streptomycin (for the A2780 cells) and chemically defined medium consisting of a mixture of William’s E and Ham’s F-12 (1:1, v/v) (for the Hep cells), respectively. All cell lines were grown as adherent monolayers at 37 °C and 5% CO2 in a humidified atmosphere.
3.6.1. In Vitro Cytotoxicity
The 100 mM stock solutions of complexes Ru-dca and Os-dca were prepared by dissolving of appropriate amounts of these agents in 500 µL of DMF. Cisplatin and Hdca were involved in the testing for comparative purposes, and their stock solutions were of 80 mM and 10 M concentrations, respectively.
The cultured A2780 cells were seeded to the 96-well culture plates, while the 96-well culture plates with the Hep cells were received from the supplier. The A2780 and Hep cells were pre-incubated in drug-free media at 37 °C for 24 h and then treated for the next 24 h at 37 °C with different concentrations of Ru-dca, Os-dca, cisplatin, and Hdca prepared from their stock solutions by dilution with RPMI-1640 medium (note: Hdca was studied only at the A2780 cells). After 24 h drug exposure, the supernatants were removed and the cells were washed with drug-free PBS followed by 72 h recovery in drug-free medium at 37 °C. The MTT assay (MTT = 3-(4,5-dimethylthiazol-2-yl)-2,5-diphenyltetrazolium bromide) was used to determine the cell viability. A concentration of the formazan formed from MTT was determined spectrophotometrically at 540 nm using an Infinite 200 PRO microplate reader (Tecan Group Ltd., Männedorf, Switzerland).
The data were expressed as the percentage of viability, where 100% and 0% represents the treatments with negative (0.1% DMF in medium) and positive (1% Triton X-100) controls, respectively. The data from the cancer cells were acquired from three independent experiments (conducted in triplicate) using cells from different passages. The resulting IC50 values (µM) were calculated from the viability curves and the results are presented as arithmetic mean ± standard deviation (SD).
3.6.2. Cellular Accumulation
The A2780 cells were seeded in 6-well culture plates (1 × 10⁶ cells per well) and incubated overnight (37 °C and 5% CO2 in a humidified incubator). Then the solutions, containing complexes Ru-Cl, Os-Cl, Ru-dca and Os-dca at the concentrations corresponding to IC50 from cytotoxicity testing, were added for the 24 h treatment, followed by washing with PBS (2 × 2 mL). The cells were harvested by trypsin, resuspended in PBS and centrifuged. The cell pellets were, immediately after the supernatant suction, digested in 500 µL of nitric acid (70 °C, overnight) to give the fully homogenized solutions. Then 4.5 mL of water was added and the final Ru and Os contents were determined by inductively coupled plasma mass spectrometry (ICP-MS; 7700× ICP-MS device, Agilent Technologies; Santa Clara, CA, USA) by external calibration using the 100 mg/L TraceCERT® Transition metal mix 3 for ICP (Sigma Aldrich, Prague, Czech Republic). The obtained values were corrected for adsorption effects. The experiments were conducted in triplicate and the results are presented as arithmetic mean ± SD.
3.7. Flow Cytometry Studies
For all the performed flow cytometry studies (cell cycle analysis, mitochondrial membrane potential assay and cytochrome c release), the A2780 cells were pre-incubated in the 6-well plates (1.0 × 10⁶ cells per well) for 24 h at 37 °C and 5% CO2 atmosphere. Complexes Ru-Cl, Os-Cl, Ru-dca and Os-dca (cisplatin was involved for comparative purposes) were added at the equipotent concentrations (equal to their IC50 concentrations from cytotoxicity testing). After 24 h exposure time, the cells were harvested using trypsin, washed twice with PBS and isolated by centrifugation. After that, the cells were stained as described below, and analyzed by a CytoFLEX Flow Cytometer (Beckman Coulter, Brea, CA, USA). In all cases, the untreated cells were used as a negative control, the experiments were conducted in triplicate (ca. 3 × 10⁵ cells per sample) and the obtained data were analyzed using CytExpert Software (Beckman Coulter, Brea, CA, USA).
3.7.1. Cell Cycle Analysis
The washed cells were resuspended, stained by a propidium iodide (PI) solution supplemented with RNase A (25 °C, in the dark, 30 min) and analyzed by flow cytometry (excitation at 535 nm, emission detected at 617 nm).
3.7.2. Mitochondrial Membrane Potential Assay
The A2780 cells were processed using the MITO-ID® Membrane potential detection kit (Enzo Life Sciences, Farmingdale, NY, USA), with the emission maxima detected at 525 nm (green dye) and 590 nm (orange dye). The positive control included the A2780 cells exposed to carbonyl cyanide 3-chlorophenylhydrazone (CCCP; 2 μM final concentration).
3.7.3. Cytochrome c Release
The cell staining procedure was performed according to the instructions supplied in the FlowCellect™ Cytochrome c Kit (Millipore, Burlington, MA, USA; Catalog No. FCCH100110) containing the Anti-IgG1-FITC Isotype Control (positive control) and Anti-Cytochrome c-FITC Antibody dye. For this experiment, the apoptosis inducer staurosporine (1 μg/mL concentration) was involved for comparative purposes as well.
3.8. Statistical Analysis
An ANOVA test was used for statistical analysis with the values of p < 0.05 (*), 0.01 (**) and 0.005 (***) considered to be statistically significant. QC Expert 3.2 Statistical software (TriloByte Ltd.; Pardubice—Staré Hradiště, Czech Republic) was used to perform the analyses.
4. Conclusions
Half-sandwich complexes [Ru(η6-pcym)(bphen)(dca)]PF6 (Ru-dca) and [Os(η6-pcym)(bphen)(dca)]PF6 (Os-dca) showed good in vitro cytotoxicity (IC50 = 3.5 μM, and 2.6 μM, respectively) against the A2780 human ovarian carcinoma cells, slightly exceeding the clinically-used platinum-based drug cisplatin (IC50 = 5.9 μM). Hydrolysis of the Ru-dca and Os-dca complexes is connected with the release of dichloroacetate (dca). The Ru-dca and Os-dca complexes do not interact with the model proteins cytochrome c (Cytc) and lysozyme. The results of the detailed flow cytometry studies (cell cycle perturbation, depolarization of mitochondrial membrane, Cytc release) were indicative for considerable differences in biological effects of the Ru-dca and Os-dca complexes at the used A2780 cells. The results point out the fact that the structural optimization of half-sandwich Ru(II) and Os(II) complexes represents a promising approach for the development of highly potent anticancer agents.
Supplementary Materials
Supplementary materials are available online: synthesis of Ru-Cl and Os-Cl, 1H NMR spectra of Ru-dca and Os-dca dissolved in CDCl3 Figure S1), 1H NMR (Figure S2) and ESI+ MS (Figure S3) studies of solution behavior in water-containing media, ESI+ MS (Figure S4) studies of the interaction of Ru-dca and Os-dca with GSH and CySH and mass spectra of cytochrome c and its mixture with Ru-dca (Figure S5).
Acknowledgments
The authors gratefully thank the Ministry of Education, Youth and Sports of the Czech Republic (projects LO1305 and CZ.1.05/2.1.00/19.0377), the Czech Science Foundation (a Grant No. 17-08512Y) and Palacký University in Olomouc (a Grant No. PrF_2017_018) for the financial support. The authors also thank Přemysl Lexa for his help with syntheses of complexes Ru-Cl, Os-Cl, Ru-dca and Os-dca, Kateřina Kubešová for performing the in vitro cytotoxicity experiments and preparing the cell pellets, Peter Antal for recording the NMR spectra, Bohuslav Drahoš for performing ESI+ MS experiments and Pavla Richterová for performing elemental analysis.
Author Contributions
P.S., Z.T., J.V. and Z.D. conceived and designed the experiments; P.S. and J.V. performed the experiments; P.S., Z.T., J.V. and Z.D. analyzed the data; Z.T. and Z.D. contributed reagents/materials/analysis tools; P.S., J.V. and Z.T. wrote the paper.
Conflicts of Interest
The authors declare no conflict of interest.
References
- Kelland, L. The resurgence of platinum-based cancer chemotherapy. Nat. Rev. Cancer 2007, 7, 573–584. [Google Scholar] [CrossRef] [PubMed]
- Wang, J.; Wang, X.; Song, Y.; Wang, J.; Zhang, C.; Chang, C.; Yan, J.; Qiu, L.; Wua, M.; Guo, Z. A platinum anticancer theranostic agent with magnetic targeting potential derived from maghemite nanoparticles. Chem. Sci. 2013, 4, 2605–2612. [Google Scholar] [CrossRef]
- Boulikas, T. Clinical overview on Lipoplatin: A successful liposomal formulation of cisplatin. Expert Opin. Investig. Drugs 2009, 18, 1197–1218. [Google Scholar] [CrossRef] [PubMed]
- Dhar, S.; Lippard, S.J. Mitaplatin, a potent fusion of cisplatin and the orphan drug dichloroacetate. Proc. Natl. Acad. Sci. USA 2009, 106, 22199–22204. [Google Scholar] [CrossRef] [PubMed]
- Yang, J.; Sun, X.; Mao, W.; Sui, M.; Tang, J.; Shen, Y. Conjugate of Pt(IV)–histone deacetylase inhibitor as a prodrug for cancer chemotherapy. Mol. Pharm. 2012, 9, 2793–2800. [Google Scholar] [CrossRef] [PubMed]
- Raveendran, R.; Braude, J.P.; Wexselblatt, E.; Novohradsky, V.; Stuchlikova, O.; Brabec, V.; Gandin, V.; Gibson, D. Pt(IV) derivatives of cisplatin and oxaliplatin with phenylbutyrate axial ligands are potent cytotoxic agents that act by several mechanisms of action. Chem. Sci. 2016, 7, 2381–2391. [Google Scholar] [CrossRef]
- Awuah, S.G.; Zheng, Y.R.; Bruno, P.M.; Hemann, M.T.; Lippard, S.J. A Pt(IV) pro-drug preferentially targets indoleamine-2,3-dioxygenase, providing enhanced ovarian cancer immuno-chemotherapy. J. Am. Chem. Soc. 2015, 137, 14854–14857. [Google Scholar] [CrossRef] [PubMed]
- Zeng, L.; Gupta, P.; Chen, Y.; Wang, E.; Ji, L.; Chao, H.; Chen, Z.-S. The development of anticancer ruthenium(II) complexes: From single molecule compounds to nanomaterials. Chem. Soc. Rev. 2017, 46, 5771–5804. [Google Scholar] [CrossRef] [PubMed]
- Hanif, M.; Babak, M.V.; Hartinger, C.G. Development of anticancer agents: Wizardry with osmium. Drug Discov. Today 2014, 19, 1640–1648. [Google Scholar] [CrossRef] [PubMed]
- Trondl, R.; Heffeter, P.; Kowol, C.R.; Jakupec, M.A.; Berger, W.; Keppler, B.K. NKP-1339, the first ruthenium-based anticancer drug on the edge to clinical application. Chem. Sci. 2014, 5, 2925–2932. [Google Scholar] [CrossRef]
- Morris, R.E.; Aird, R.E.; del Socorro Murdoch, P.; Chen, H.; Cummings, J.; Hughes, N.D.; Parsons, S.; Parkin, A.; Boyd, G.; Jodrell, D.I.; et al. Inhibition of cancer cell growth by ruthenium(II) arene complexes. J. Med. Chem. 2001, 44, 3616–3621. [Google Scholar] [CrossRef] [PubMed]
- Peacock, A.F.A.; Habtemariam, A.; Fernández, R.; Walland, V.; Fabbiani, F.P.A.; Parsons, S.; Aird, R.E.; Jodrell, D.I.; Sadler, P.J. Tuning the reactivity of osmium(II) and ruthenium(II) arene complexes under physiological conditions. J. Am. Chem. Soc. 2006, 128, 1739–1748. [Google Scholar] [CrossRef] [PubMed]
- Romero-Canelón, I.; Mos, M.; Sadler, P.J. Enhancement of selectivity of an organometallic anticancer agent by redox modulation. J. Med. Chem. 2015, 58, 7874–7880. [Google Scholar] [CrossRef] [PubMed]
- Soldevila-Barreda, J.J.; Romero-Canelón, I.; Habtemariam, A.; Sadler, P.J. Transfer hydrogenation catalysis in cells as a new approach to anticancer drug design. Nat. Commun. 2015, 6, 6582. [Google Scholar] [CrossRef] [PubMed]
- Rhodes, T.; Twentyman, P.R. A study of ethacrynic acid as a potential modifier of melphalan and cisplatin sensitivity in human lung cancer parental and drug-resistant cell lines. Br. J. Cancer 1992, 65, 684–690. [Google Scholar] [CrossRef] [PubMed]
- Agonigi, G.; Riedel, T.; Gay, M.P.; Biancalana, L.; Oñate, E.; Dyson, P.J.; Pampaloni, G.; Păunescu, E.; Esteruelas, M.A.; Marchetti, F. Arene osmium complexes with ethacrynic acid-modified ligands: Synthesis, characterization, and evaluation of intracellular glutathione S-transferase inhibition and antiproliferative activity. Organometallics 2016, 35, 1046–1056. [Google Scholar] [CrossRef]
- Madhok, B.M.; Yeluri, S.; Perry, S.L.; Hughes, T.A.; Jayne, D.G. Dichloroacetate induces apoptosis and cell-cycle arrest in colorectal cancer cells. Br. J. Cancer 2010, 102, 1746–1752. [Google Scholar] [CrossRef] [PubMed]
- Bonnet, S.; Archer, S.L.; Allalunis-Turner, J.; Haromy, A.; Beaulieu, C.; Thompson, R.; Lee, T.C.; Lopaschuk, G.D.; Puttagunta, L.; Bonnet, S.; et al. A mitochondria-K+ channel axis is suppressed in cancer and its normalization promotes apoptosis and inhibits cancer growth. Cancer Cell 2007, 11, 37–51. [Google Scholar] [CrossRef] [PubMed]
- Michelakis, E.D.; Webster, L.; Mackey, J.R. Dichloroacetate (DCA) as a potential metabolic-targeting therapy for cancer. Br. J. Cancer 2008, 99, 989–994. [Google Scholar] [CrossRef] [PubMed]
- Betanzos-Lara, S.; Novakova, O.; Deeth, R.J.; Pizarro, A.M.; Clarkson, G.J.; Liskova, B.; Brabec, V.; Sadler, P.J.; Habtemariam, A. Bipyrimidine ruthenium(II) arene complexes: Structure, reactivity and cytotoxicity. J. Biol. Inorg. Chem. 2012, 17, 1033–1051. [Google Scholar] [CrossRef] [PubMed]
- Ortega, A.L.; Mena, S.; Estrela, J.M. Glutathione in cancer cell death. Cancers 2011, 3, 1285–1310. [Google Scholar] [CrossRef] [PubMed]
- Balendiran, G.K.; Dabur, R.; Fraser, D. The role of glutathione in cancer. Cell Biochem. Funct. 2004, 22, 343–352. [Google Scholar] [CrossRef] [PubMed]
- Salemi, G.; Gueli, M.C.; D’Amelio, M.; Saia, V.; Mangiapane, P.; Aridon, P.; Ragonese, P.; Lupo, I. Blood levels of homocysteine, cysteine, glutathione, folic acid, and vitamin B12 in the acute phase of atherothrombotic stroke. Neurol. Sci. 2009, 30, 361–363. [Google Scholar] [CrossRef] [PubMed]
- Koreeda, T.; Kochi, T.; Kakiuchi, F. Ruthenium-catalyzed reductive deamination and tandem alkylation of aniline derivatives. J. Organomet. Chem. 2013, 741–742, 148–152. [Google Scholar] [CrossRef]
- Toohey, J.I.; Cooper, A.J.L. Thiosulfoxide (Sulfane) sulfur: New chemistry and new regulatory roles in biology. Molecules 2014, 19, 12789–12813. [Google Scholar] [CrossRef] [PubMed]
- Ferraro, G.; Messori, L.; Merlino, A. The X-ray structure of the primary adducts formed in the reaction between cisplatin and cytochrome c. Chem. Commun. 2015, 51, 2559–2561. [Google Scholar] [CrossRef] [PubMed]
- Zhang, N.; Du, Y.; Cui, M.; Xing, J.; Liu, Z.; Liu, S. Probing the interaction of cisplatin with cytochrome c by electrospray ionization fourier transform ion cyclotron resonance mass spectrometry. Anal. Chem. 2012, 84, 6206–6212. [Google Scholar] [CrossRef] [PubMed]
- Casini, A.; Gabbiani, C.; Michelucci, E.; Pieraccini, G.; Moneti, G.; Dyson, P.J.; Messori, L. Exploring metallodrug-protein interactions by mass spectrometry: Comparisons between platinum coordination complexes and an organometallic ruthenium compound. J. Biol. Inorg. Chem. 2009, 14, 761–770. [Google Scholar] [CrossRef] [PubMed]
- Wang, F.; Bella, J.; Parkinson, J.A.; Sadler, P.J. Competitive reactions of a ruthenium arene anticancer complex with histidine, cytochrome c and an oligonucleotide. J. Biol. Inorg. Chem. 2005, 10, 147–155. [Google Scholar] [CrossRef] [PubMed]
- Scolaro, C.; Chaplin, A.B.; Hartinger, C.G.; Bergamo, A.; Cocchietto, M.; Keppler, B.K.; Sava, G.; Dyson, P.J. Tuning the hydrophobicity of ruthenium(II)–arene (RAPTA) drugs to modify uptake, biomolecular interactions and efficacy. Dalton Trans. 2007, 5065–5072. [Google Scholar] [CrossRef] [PubMed]
- Morais, T.S.; Santos, F.C.; Jorge, T.F.; Côrte-Real, L.; Madeira, P.J.A.; Marques, F.; Robalo, M.P.; Matos, A.; Santos, I.; Garcia, M.H. New water-soluble ruthenium(II) cytotoxic complex: Biological activity and cellular distribution. J. Inorg. Biochem. 2014, 130, 1–14. [Google Scholar] [CrossRef] [PubMed]
- Battistin, F.; Scaletti, F.; Balducci, G.; Pillozzi, S.; Arcangeli, A.; Messori, L.; Alessio, E. Water-soluble Ru(II)- and Ru(III)-halide-PTA complexes (PTA = 1,3,5-triaza-7-phosphaadamantane): Chemical and biological properties. J. Inorg. Biochem. 2016, 160, 180–188. [Google Scholar] [CrossRef] [PubMed]
- Casini, A.; Mastrobuoni, G.; Ang, W.H.; Gabbiani, C.; Pieraccini, G.; Moneti, G.; Dyson, P.J.; Messori, L. ESI–MS characterisation of protein adducts of anticancer ruthenium(II)-arene PTA (RAPTA) complexes. ChemMedChem 2007, 2, 631–635. [Google Scholar] [CrossRef] [PubMed]
- Sullivan, M.P.; Groessl, M.; Meier, S.M.; Kingston, R.L.; Goldstone, D.C.; Hartinger, C.G. The metalation of hen egg white lysozyme impacts protein stability as shown by ion mobility mass spectrometry, differential scanning calorimetry, and X-ray crystallography. Chem. Commun. 2017, 53, 4246–4249. [Google Scholar] [CrossRef] [PubMed]
- Cinellu, M.A.; Maiore, L.; Manassero, M.; Casini, A.; Arca, M.; Fiebig, H.H.; Kelter, G.; Michelucci, E.; Pieraccini, G.; Gabbiani, C.; et al. [Au2(phen2Me)2(μ-O)2](PF6)2, a novel dinuclear gold(III) complex showing excellent antiproliferative properties. ACS Med. Chem. Lett. 2010, 1, 336–339. [Google Scholar] [CrossRef] [PubMed]
- Serratrice, M.; Maiore, L.; Zucca, A.; Stoccoro, S.; Landini, I.; Mini, E.; Massai, L.; Ferraro, G.; Merlino, A.; Messori, L.; et al. Cytotoxic properties of a new organometallic platinum(II) complex and its gold(I) heterobimetallic derivatives. Dalton Trans. 2016, 45, 579–590. [Google Scholar] [CrossRef] [PubMed]
- Groessl, M.; Zava, O.; Dyson, P.J. Cellular uptake and subcellular distribution of ruthenium-based metallodrugs under clinical investigation versus cisplatin. Metallomics 2011, 3, 591–599. [Google Scholar] [CrossRef] [PubMed]
- Riedl, C.A.; Flocke, L.S.; Hejl, M.; Roller, A.; Klose, M.H.M.; Jakupec, M.A.; Kandioller, W.; Keppler, B.K. Introducing the 4-phenyl-1,2,3-triazole moiety as a versatile scaffold for the development of cytotoxic ruthenium(II) and osmium(II) arene cyclometalates. Inorg. Chem. 2017, 56, 528–541. [Google Scholar] [CrossRef] [PubMed]
- Garrido, C.; Galluzi, L.; Brunet, M.; Puig, P.E.; Didelot, C.; Kroemer, G. Mechanisms of cytochrome c release from mitochondria. Cell Death Differ. 2006, 13, 1423–1433. [Google Scholar] [CrossRef] [PubMed]
- Ribas, V.; García-Ruiz, C.; Fernández-Checa, J.C. Glutathione and mitochondria. Front. Pharmacol. 2014, 5, 151. [Google Scholar] [CrossRef] [PubMed]
- Kojima, H.; Endo, K.; Moriyama, H.; Tanaka, Y.; Alnemrii, E.S.; Slapak, C.A.; Teicher, B.; Kufe, D.; Datta, R. Abrogation of mitochondrial cytochrome c release and caspase-3 activation in acquired multidrug resistance. J. Biol. Chem. 1998, 273, 16647–16650. [Google Scholar] [CrossRef] [PubMed]
- Chatterjee, S.; Kundu, S.; Bhattacharyya, A.; Hartinger, C.G.; Dyson, P.J. The ruthenium(II)-arene compound RAPTA-C induces apoptosis in EAC cells through mitochondrial and p53-JNK pathways. J. Biol. Inorg. Chem. 2008, 13, 1149–1155. [Google Scholar] [CrossRef] [PubMed]
- Van Rijt, S.H.; Romero-Canelón, I.; Fu, Y.; Shnyder, S.D.; Sadler, P.J. Potent organometallic osmium compounds induce mitochondria-mediated apoptosis and S-phase cell cycle arrest in A549 non-small cell lung cancer cells. Metallomics 2014, 6, 1014–1022. [Google Scholar] [CrossRef] [PubMed]
- Rego, A.C.; Vesce, S.; Nicholls, D.G. The mechanism of mitochondrial membrane potential retention following release of cytochrome c in apoptotic GT1-7 neural cells. Cell Death Differ. 2001, 8, 995–1003. [Google Scholar] [CrossRef] [PubMed]
- Gogvadze, V.; Orrenius, S.; Zhivotovsky, B. Multiple pathways of cytochrome c release from mitochondria in apoptosis. Biochim. Biophys. Acta 2006, 1757, 639–647. [Google Scholar] [CrossRef] [PubMed]
- Tönnemann, J.; Risse, J.; Grote, Z.; Scopelliti, R.; Severin, K. Efficient and rapid synthesis of chlorido-bridged half-sandwich complexes of ruthenium, rhodium, and iridium by microwave heating. Eur. J. Inorg. Chem. 2013, 4558–4562. [Google Scholar] [CrossRef]
- Coverdale, J.P.C.; Sanchez-Cano, C.; Clarkson, G.J.; Soni, R.; Wills, M.; Sadler, P.J. Easy to synthesize, robust organo-osmium asymmetric transfer hydrogenation catalysts. Chem. Eur. J. 2015, 21, 8043–8046. [Google Scholar] [CrossRef] [PubMed]
- Gottlieb, H.E.; Kotlyar, V.; Nudelman, A. NMR chemical shifts of common laboratory solvents as trace impurities. J. Org. Chem. 1997, 62, 7512–7515. [Google Scholar] [CrossRef] [PubMed]
Sample Availability: Samples of the compounds Ru-Cl, Os-Cl, Ru-dca and Os-dca are available from the authors. |
Figure 1.
General structural formula of the [M(η6-pcym)(bphen)(dca)]PF6 complexes, where dca = dichloroacetate M = Ru for Ru-dca and Os for Os-dca), given with the atom numbering scheme.
Figure 1.
General structural formula of the [M(η6-pcym)(bphen)(dca)]PF6 complexes, where dca = dichloroacetate M = Ru for Ru-dca and Os for Os-dca), given with the atom numbering scheme.

Figure 2.
Electrospray ionization (ESI+) mass spectra of complexes Ru-dca (top) and Os-dca (bottom) given together with the details of the experimental and simulated peaks of the [M(pcym)(bphen)(dca)]+ species (M = Ru or Os).
Figure 2.
Electrospray ionization (ESI+) mass spectra of complexes Ru-dca (top) and Os-dca (bottom) given together with the details of the experimental and simulated peaks of the [M(pcym)(bphen)(dca)]+ species (M = Ru or Os).

Figure 3.
1H NMR spectra (DMSO-d6 solutions) of Na(dca) (top), complexes Ru-Cl (middle) and Ru-dca (bottom) given together with the assignment of the detected signals (see Figure 1 for the atom numbering scheme). Note: the impurity visible in the 1H NMR spectrum of complex Ru-dca can be assigned to the [Ru(η6-pcym)(bphen)(OH)]+ species (violet asterisks).

Figure 4.
The results of the time-dependent 1H NMR studies showing the progress of the dca ligand release for complexes Ru-dca (brown solid squares) and Os-dca (green solid squares). Note: The lines are only guides for eyes.
Figure 4.
The results of the time-dependent 1H NMR studies showing the progress of the dca ligand release for complexes Ru-dca (brown solid squares) and Os-dca (green solid squares). Note: The lines are only guides for eyes.

Figure 5.
The A2780 cell cycle phase populations (%) after the 24 h treatment by the IC50 concentrations of complexes Ru-dca and Os-dca, given together with untreated cells (negative control) and the cells treated with platinum-based drug cisplatin. The data are given as arithmetic mean from three independent experiments.

Figure 6.
(Left) The results of the flow cytometry studies of cytochrome c release at the A2780 cells treated for 24 h by the IC50 concentrations of complexes Ru-Cl (dashed blue), Ru-dca (blue), Os-Cl (dashed red) and Os-dca (red); white = negative control (−Ctrl), grey = positive control (+Ctrl), p < 0.005 (***). (Right) The representative histogram of the flow cytometry studies of cytochrome c release, showing the fluorescence intensities in FITC-H channel in the A2780 cells treated by complexes Ru-dca (pink) and Os-dca (blue), given together with the negative (green) and positive (red) controls. Orange line segments show the edge between low and high fluorescence populations.


Table 1.
Cellular accumulation of complexes Ru-Cl, Ru-dca, Os-Cl and Os-dca (calculated as the metal content) at the A2780 cells after the treatment for 24 h by the equipotent (IC50) concentrations. The data are given as arithmetic means from three independent experiments.
Table 1.
Cellular accumulation of complexes Ru-Cl, Ru-dca, Os-Cl and Os-dca (calculated as the metal content) at the A2780 cells after the treatment for 24 h by the equipotent (IC50) concentrations. The data are given as arithmetic means from three independent experiments.
| ng/106 Cells | fmol/106 Cells | |
|---|---|---|
| Ru-Cl | 26.5 ± 0.7 | 262.2 ± 7.0 |
| Ru-dca | 37.0 ± 1.4 | 366.1 ± 14.0 |
| Os-Cl | 33.5 ± 1.4 | 174.3 ± 7.4 |
| Os-dca | 52.5 ± 1.2 | 273.1 ± 6.4 |
Table 2.
The A2780 cell populations (%) in the cell cycle phases after the treatment for 24 h by the IC50 concentrations of complexes Ru-Cl, Ru-dca, Os-Cl and Os-dca, given together with negative control (untreated cells) and cisplatin (for comparative purposes). The data are given as arithmetic means from three independent experiments.
| Sub-G1 | G0/G1 | S | G2/M | |
|---|---|---|---|---|
| Ru-Cl | 0.7 ± 0.2 | 62.4 ± 1.8 | 13.1 ± 2.8 | 23.2 ± 2.9 |
| Ru-dca | 16.8 ± 1.9 | 37.0 ± 2.7 | 24.3 ± 3.3 | 20.9 ± 1.1 |
| Os-Cl | 0.8 ± 0.3 | 59.0 ± 2.3 | 14.5 ± 0.9 | 25.1 ± 1.5 |
| Os-dca | 0.7 ± 0.2 | 62.9 ± 1.3 | 13.6 ± 4.7 | 22.2 ± 4.5 |
| Cisplatin | 8.0 ± 0.9 | 26.1 ± 2.1 | 30.9 ± 4.9 | 34.5 ± 3.5 |
| Control | 0.8 ± 0.3 | 69.2 ± 2.2 | 15.7 ± 1.4 | 13.9 ± 1.1 |
Table 3.
The results (given as % cell populations) of flow cytometry studies of the mitochondrial membrane potential changes, studied at the A2780 cells using the 24 h treatment by the IC50 concentrations of complexes Ru-Cl, Ru-dca, Os-Cl and Os-dca (and cisplatin for comparative purposes). The untreated A2780 cells were employed as the negative control, while the CCCP-treated cells represent the positive control. The data are given as arithmetic means ± SD from three independent experiments.
| % of Cells Showing High PE-Channel Fluorescence | |
|---|---|
| Ru-Cl | 94.0 ± 1.4 |
| Ru-dca | 89.3 ± 1.4 |
| Os-Cl | 95.2 ± 0.7 |
| Os-dca | 93.2 ± 2.3 |
| Cisplatin | 88.8 ± 2.6 |
| Positive control | 38.6 ± 1.7 |
| Negative control | 99.1 ± 0.3 |
Table 4.
The results (given as % cell populations) of the cytochrome c release studied by flow cytometry at the A2780 cells treated for 24 h by the IC50 concentrations of complexes Ru-Cl, Ru-dca, Os-Cl and Os-dca (cisplatin and staurosporine were used for comparative purposes). The untreated A2780 cells were employed as the negative control, while the cells applied with the Anti-IgG1-FITC Isotype represented the positive control. The data are given as arithmetic means ± SD from three independent experiments.
| % of Cells Showing Shift in FITC-Channel Fluorescence | |
|---|---|
| Ru-Cl | 53.0 ± 5.7 |
| Ru-dca | 94.6 ± 0.6 |
| Os-Cl | 16.5 ± 4.1 |
| Os-dca | 39.9 ± 4.6 |
| Staurosporine | 47.1 ± 6.1 |
| Cisplatin | 53.0 ± 6.0 |
| Positive control | 99.3 ± 0.1 |
| Negative control | 12.3 ± 2.3 |
© 2018 by the authors. Licensee MDPI, Basel, Switzerland. This article is an open access article distributed under the terms and conditions of the Creative Commons Attribution (CC BY) license (http://creativecommons.org/licenses/by/4.0/).
Share and Cite
MDPI and ACS Style
Štarha, P.; Trávníček, Z.; Vančo, J.; Dvořák, Z. Half-Sandwich Ru(II) and Os(II) Bathophenanthroline Complexes Containing a Releasable Dichloroacetato Ligand. Molecules 2018, 23, 420. https://doi.org/10.3390/molecules23020420
AMA Style
Štarha P, Trávníček Z, Vančo J, Dvořák Z. Half-Sandwich Ru(II) and Os(II) Bathophenanthroline Complexes Containing a Releasable Dichloroacetato Ligand. Molecules. 2018; 23(2):420. https://doi.org/10.3390/molecules23020420
Chicago/Turabian StyleŠtarha, Pavel, Zdeněk Trávníček, Ján Vančo, and Zdeněk Dvořák. 2018. "Half-Sandwich Ru(II) and Os(II) Bathophenanthroline Complexes Containing a Releasable Dichloroacetato Ligand" Molecules 23, no. 2: 420. https://doi.org/10.3390/molecules23020420