Article

Chemical Structure and Immunomodulating Activities of an α-Glucan Purified from Lobelia chinensis Lour

1
Institute of Chinese Materia Medica, Shanghai University of Traditional Chinese Medicine, Shanghai 201203, China
2
School of Chinese Medicine, Hong Kong Baptist University, Hong Kong 999077, China
3
State Key Laboratory of Quality Research in Chinese Medicine, Institute of Chinese Medical Sciences, University of Macau, Macao 999078, China
4
Department of Chemistry, Hong Kong Baptist University, Hong Kong 999077, China
*
Authors to whom correspondence should be addressed.
These authors contributed equally to this work.
Molecules 2016, 21(6), 779; https://doi.org/10.3390/molecules21060779
Submission received: 3 May 2016 / Revised: 3 June 2016 / Accepted: 7 June 2016 / Published: 15 June 2016
(This article belongs to the Special Issue Natural Polysaccharides)

Abstract

:
A neutral α-glucan, named BP1, with a molecular mass of approximately 9.45 kDa, was isolated from Lobelia chinensis by hot-water extraction, a Q-Sepharose Fast Flow column and Superdex-75 column chromatography. Its chemical structure was characterized by monosaccharide analysis, methylation analysis and analysis of its FT-IR, high performance gel permeation chromatography (HPGPC) and 1D/2D-NMR spectra data. The backbone of BP1 consists of →6α-d-Glcp16,3α-d-Glcp1→(6α-d-Glcp1)x-6,3α-d-Glcp1-(6α-d-Glcp1)y→. The side chains were terminal α-d-Glcp1→ and α-d-Glcp1→ (6α-d-Glcp1)z→4α-d-Glcp13α-d-Glcp14α-d-Glcp1→ (x + y + z = 5), which are attached to the backbone at O-3 of 3,6α-d-Glcp1. The results of the effect of BP1 on mouse macrophage cell line RAW 264.7 indicate that BP1 enhances the cell proliferation, phagocytosis, nitric oxide production and cytokine secretion in a dose-dependent manner. Because the inhibitor of Toll-like receptor 4 blocks the BP1-induced secretion of TNF-α and IL-6, we hypothesize that α-glucan BP1 activates TLR4, which mediates the above-mentioned immunomodulating effects.

1. Introduction

Lobelia chinensis, commonly known as Chinese lobelia, Herba Lobellae Chinensis, aze mushiro and mizo kakushi, grows wild throughout East Asia. It is one of the most used anti-cancer herbs in Chinese Medicine [1]. Its chemical profile is very complex. The current phytochemical studies have found various types of chemical components, including piperidine alkaloids, coumarins, terpenoids and saponins [2,3]. These chemicals show various biological activities, including anti-bacterial, anti-venom, anticancer, anti-viral and anti-inflammatory activities [4,5,6,7,8]. In addition to these small molecules, this herb has a large amount of polysaccharides, the content of which can reach 25% by weight of the dry herb [9]. Little is known about the chemistry and bioactivity of the polysaccharides of this herb.
Plant polysaccharides have shown many bioactivities [10,11], whose ability to modulate immune function is popularly considered a major aspect. Many polysaccharides have been reported to be able to activate macrophages [12,13,14], and this activation plays an important role in the immune response. The present study aims to analyze the chemistry of polysaccharides purified from the water extract of Lobelia chinensis and to explore their immune modulating effects on the RAW 264.7 cell line. A neutral α-glucan named BP1, with a molecular mass of approximately 9.45 kDa is isolated from Lobelia chinensis, and its chemical structure was characterized by chemical and spectral analyses. BP1 was able to enhance the cell proliferation, phagocytosis, nitric oxide production and cytokine secretion in a dose-dependent manner.

2. Results and Discussion

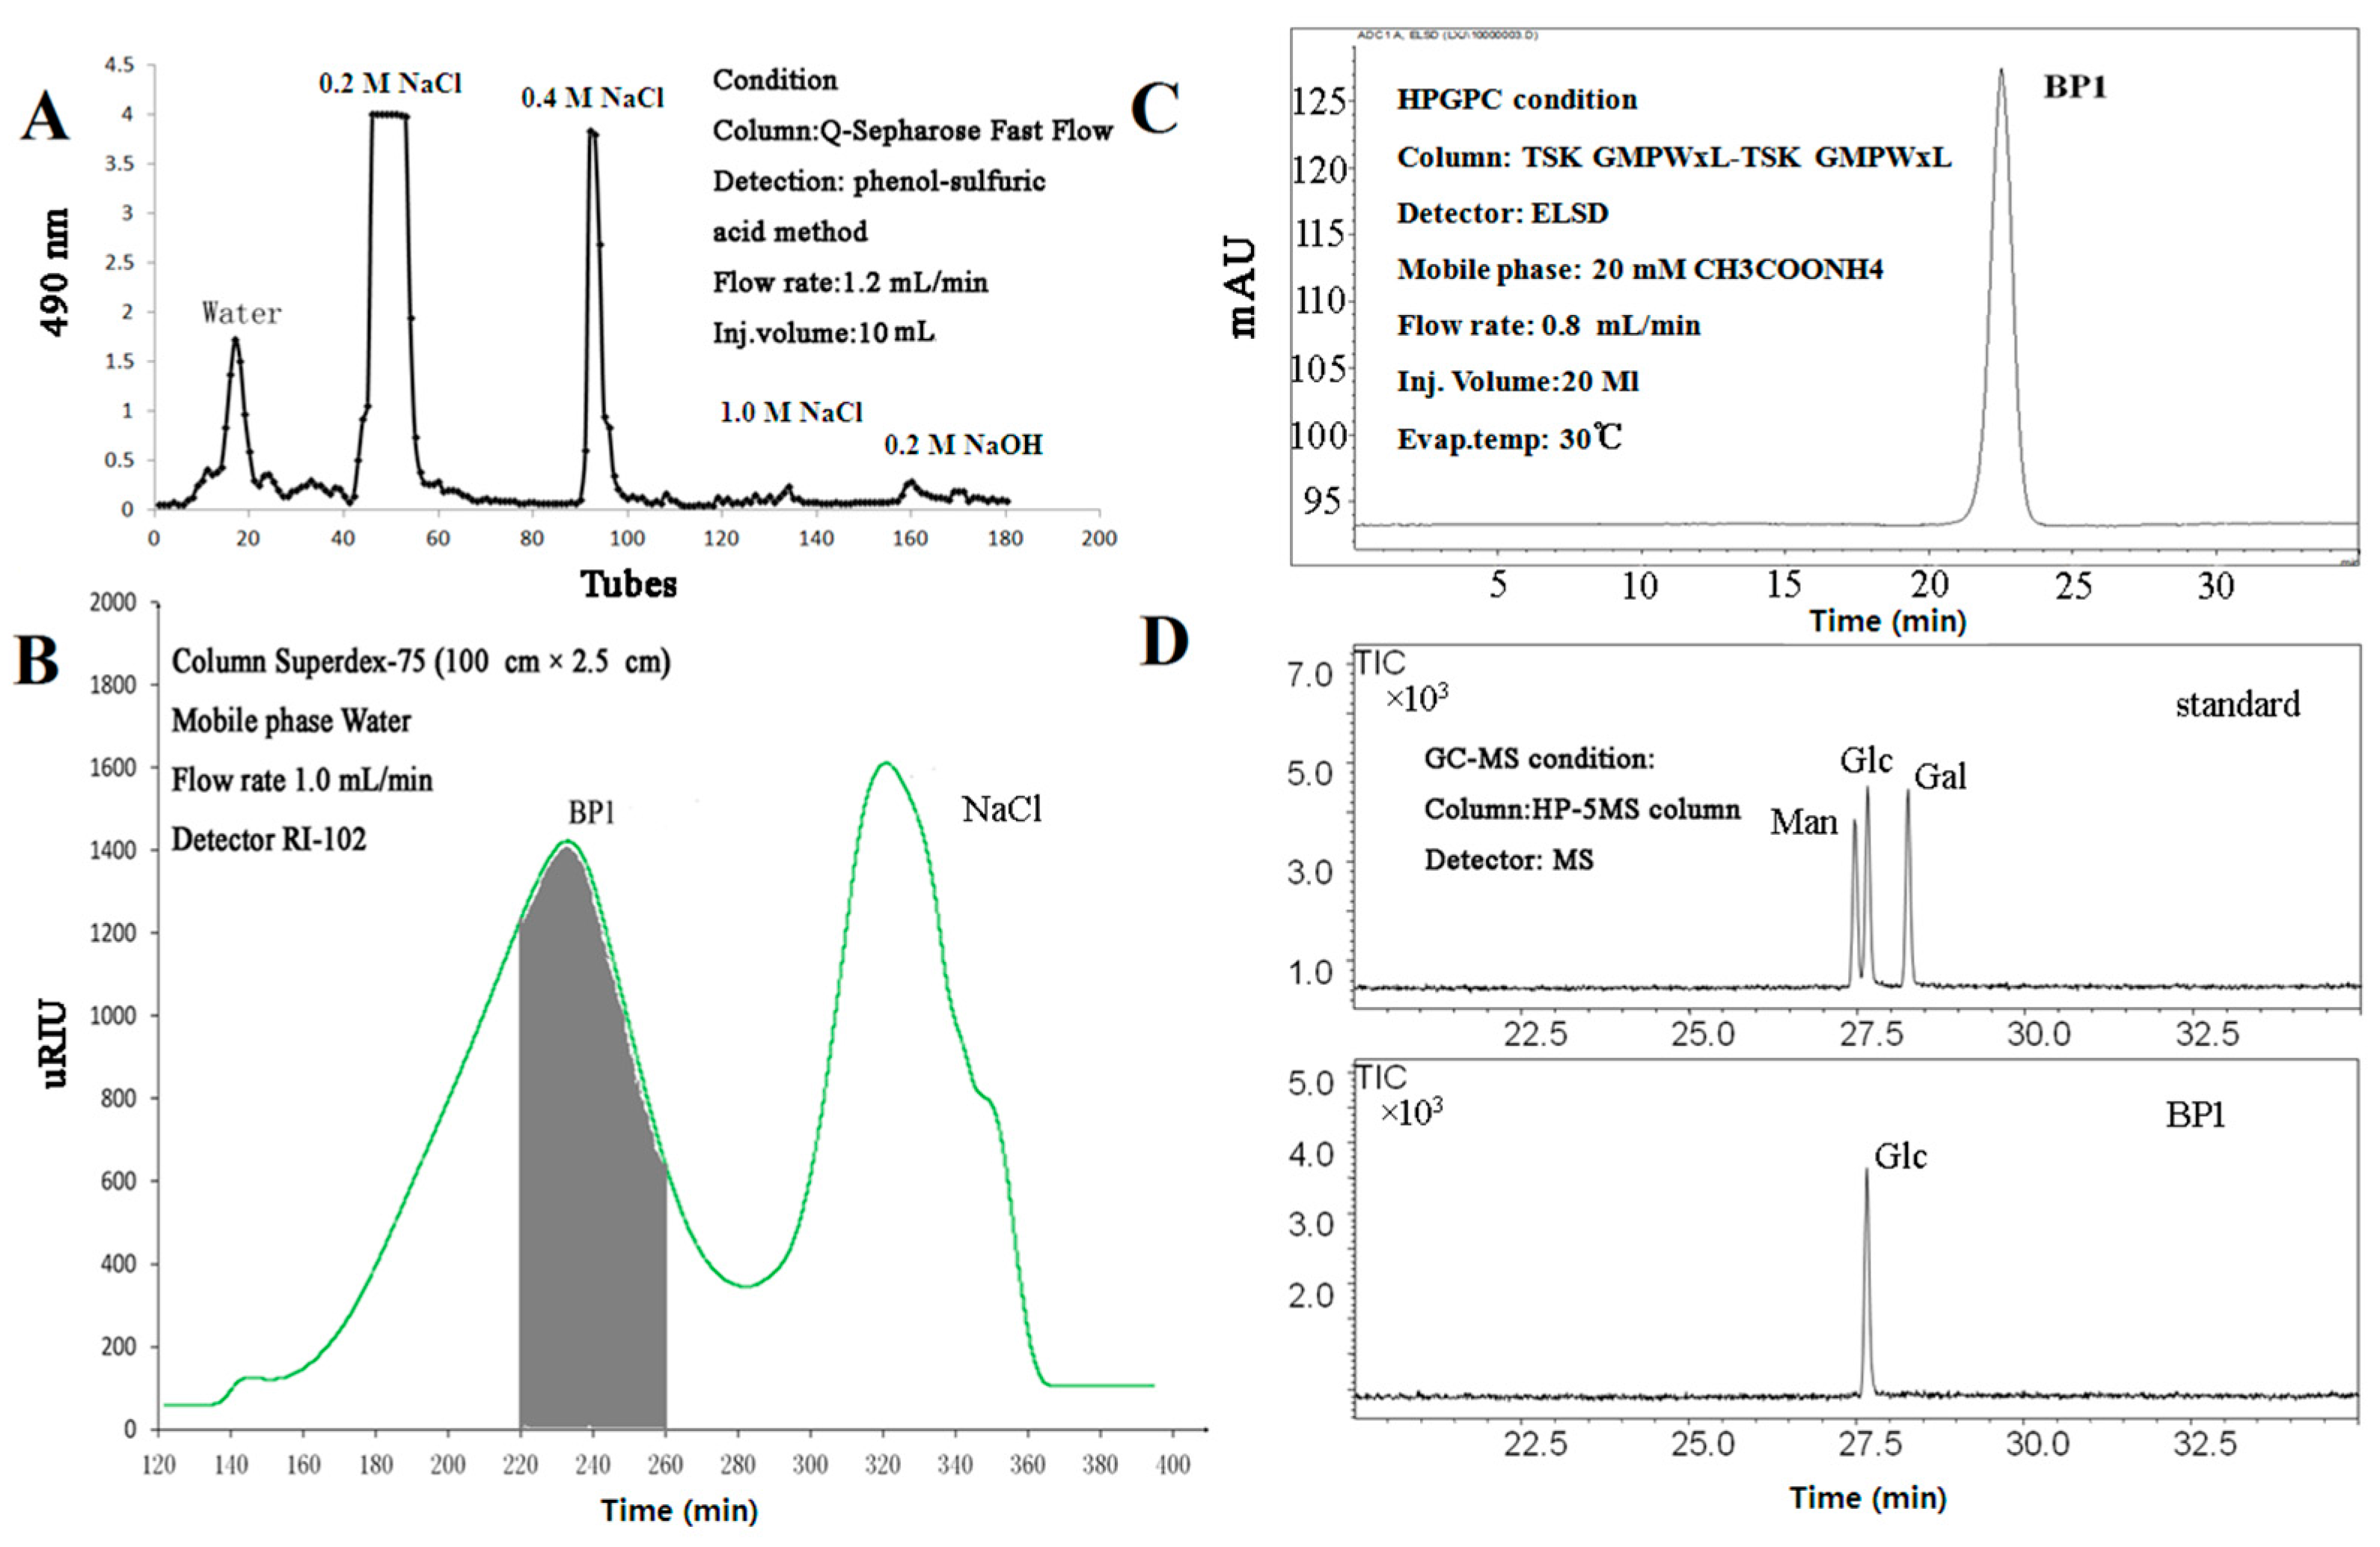
2.1. Isolation and Purification of BP1

Separation of the crude polysaccharide from Lobelia chinensis using fast-flow chromatography on Q-Sepharose generated five fractions: water, 0.2 M NaCl, 0.4 M NaCl, 1.0 M NaCl and 0.2 M NaOH fractions (Figure 1A). Further purification of the major fraction (0.2 M NaCl, 598 mg) using gel filtration chromatography on Superdex 75 (Figure 1B) yielded a purified polysaccharide, which was shown to be homogeneous in high performance gel permeation chromatography (HPGPC) (Figure 1C). We named this polysaccharide BP1. Its average molecular weight was determined to be approximately 9450 Da.

2.2. FT-IR Spectral Analysis

The FT-IR spectra of BP1 (Figure S1) were analyzed as follows [15]: a strong and broad peak at around 3367 cm−1 was attributed to the vibration of the O-H bond; a weak absorption peak at approximately 2932 cm−1 was attributed to the stretching vibration of C-H bond; these two signals characterized the absorption spectra of polysaccharides. Furthermore, the band at 1639 cm−1 can be attributed to the H-O-H bond, while the signals from 1453 cm−1 to 1332 cm−1 were attributable to –CH (O–CH2) flexural vibrations, according to [16,17]. The band at 1131 cm−1 ws due to the C-O-C bond and glycosidic bridge, and the band at 1200 cm−1 and 1020 cm−1 might be given by the C–O stretching vibrations. The band at 846 cm−1 was ascribed to α-configuration of the polysaccharide. Absorption at 920 cm−1 indicated the existence of pyranose sugars [18].

2.3. Protein Assay and Monosaccharide Composition Analysis

BP1 was determined to be protein-free as measured via the Quick Start Bradford Protein Assay. The monosaccharide composition analysis using GC-MS indicated that BP1 was composed of glucose (Figure 1D).

2.4. Methylation Analysis

BP1 was subjected to methylation analysis to determine the linkage types [19,20]. According to the methylated derivatives, as shown in Table 1, the sugar residues of BP1 were determined to be 2,3,4,6-Me4-Glcp, 2,4,6-Me3-Glcp, 2,3,6-Me3-Glcp, 2,3,4-Me3-Glcp, 2,3-Me2-Glcp, 2,4-Me2-Glcp and 2-Me1-Glcp, indicating the existence of t-, 1,6-, 1,4-, 1,3-, 1,3,6-Glc, respectively.

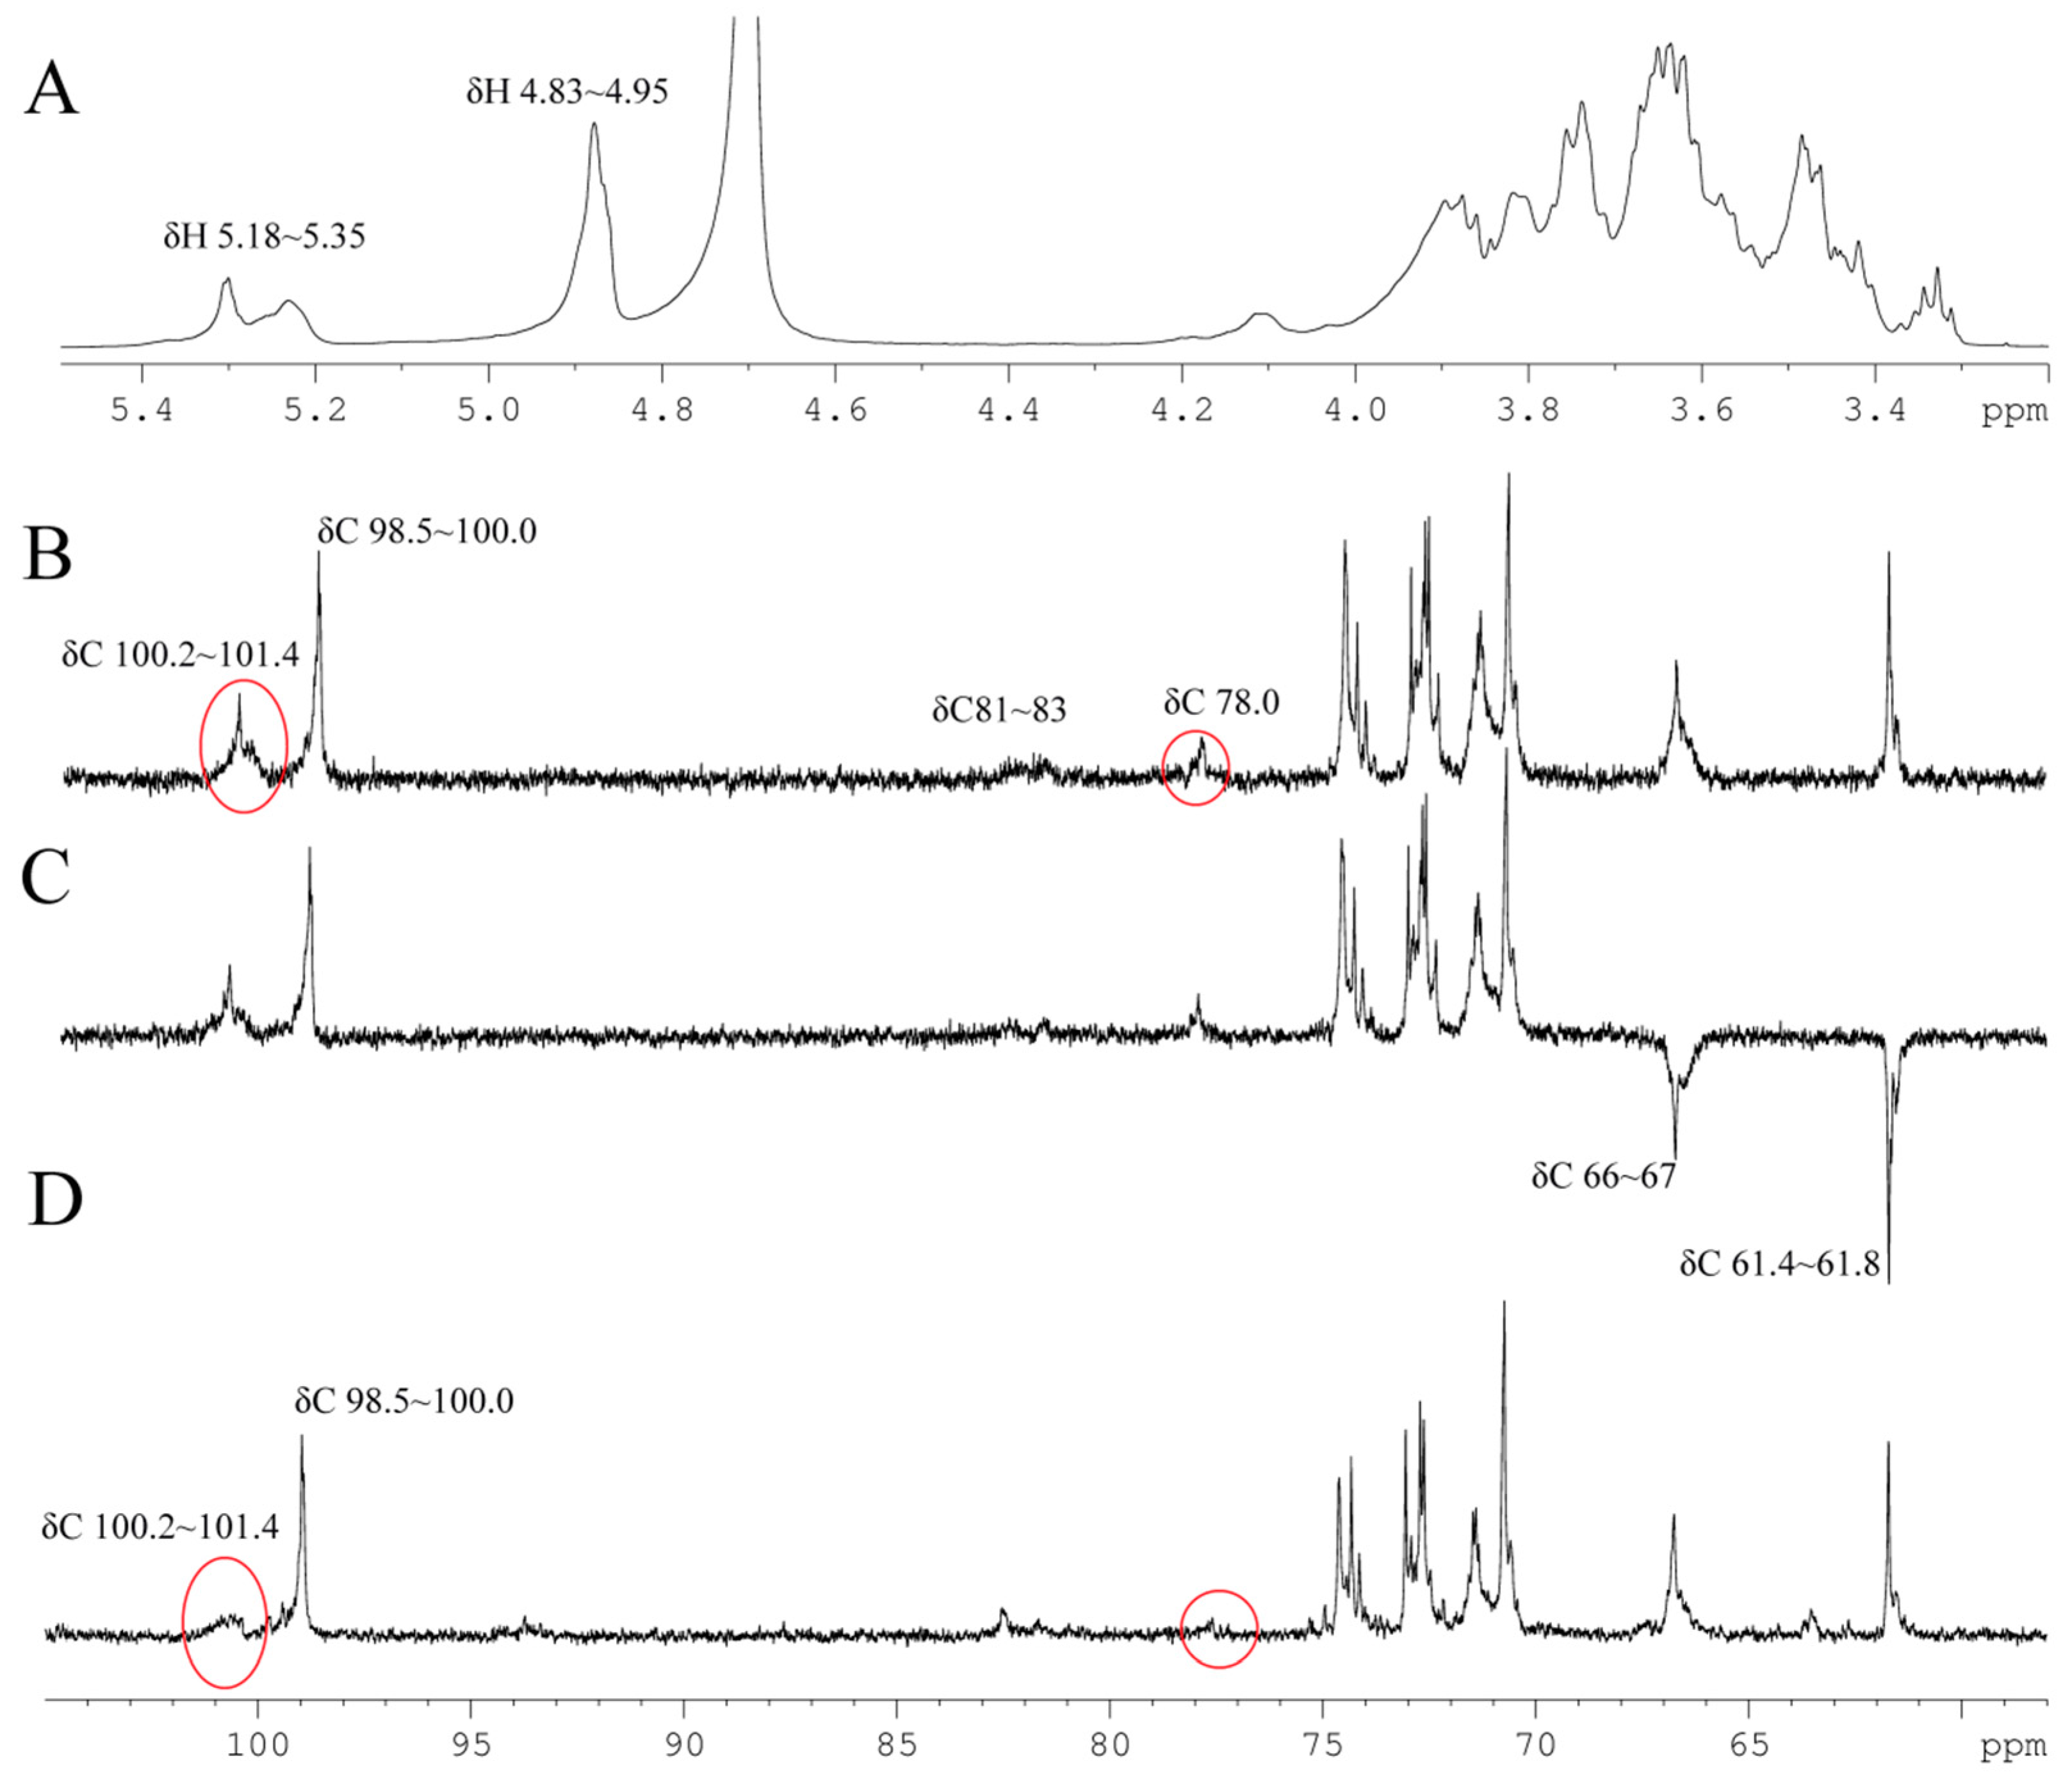
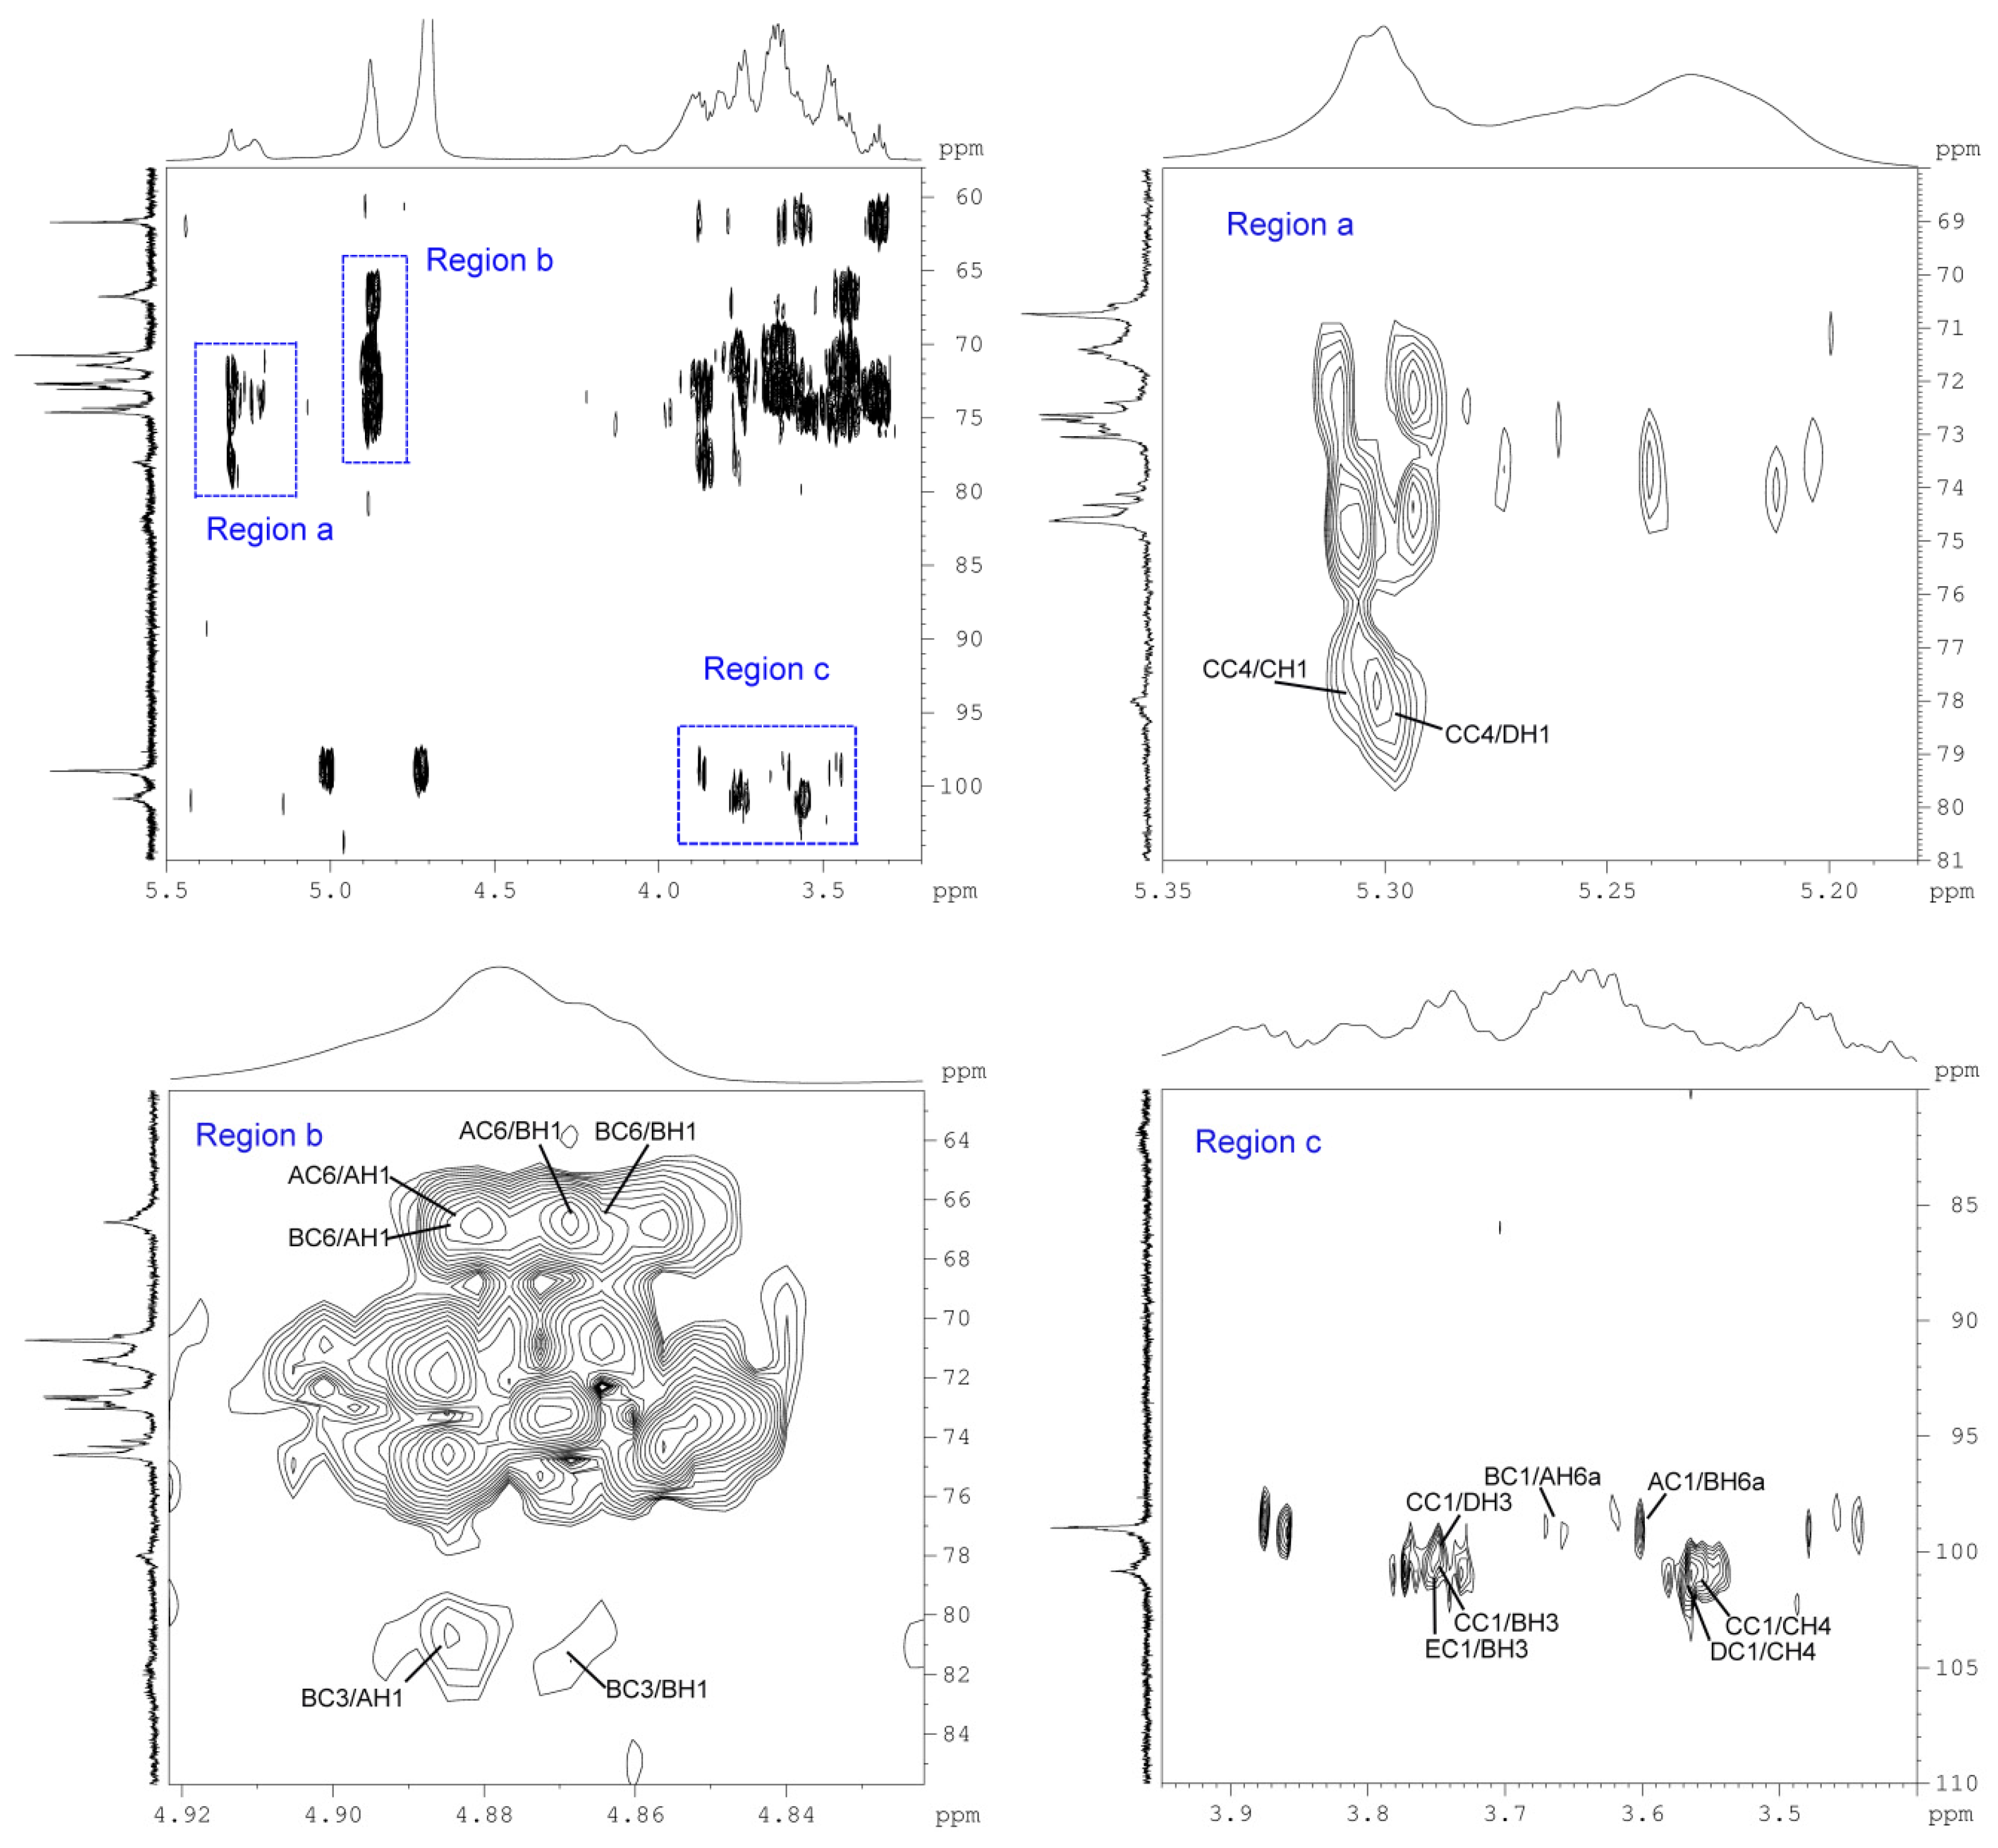
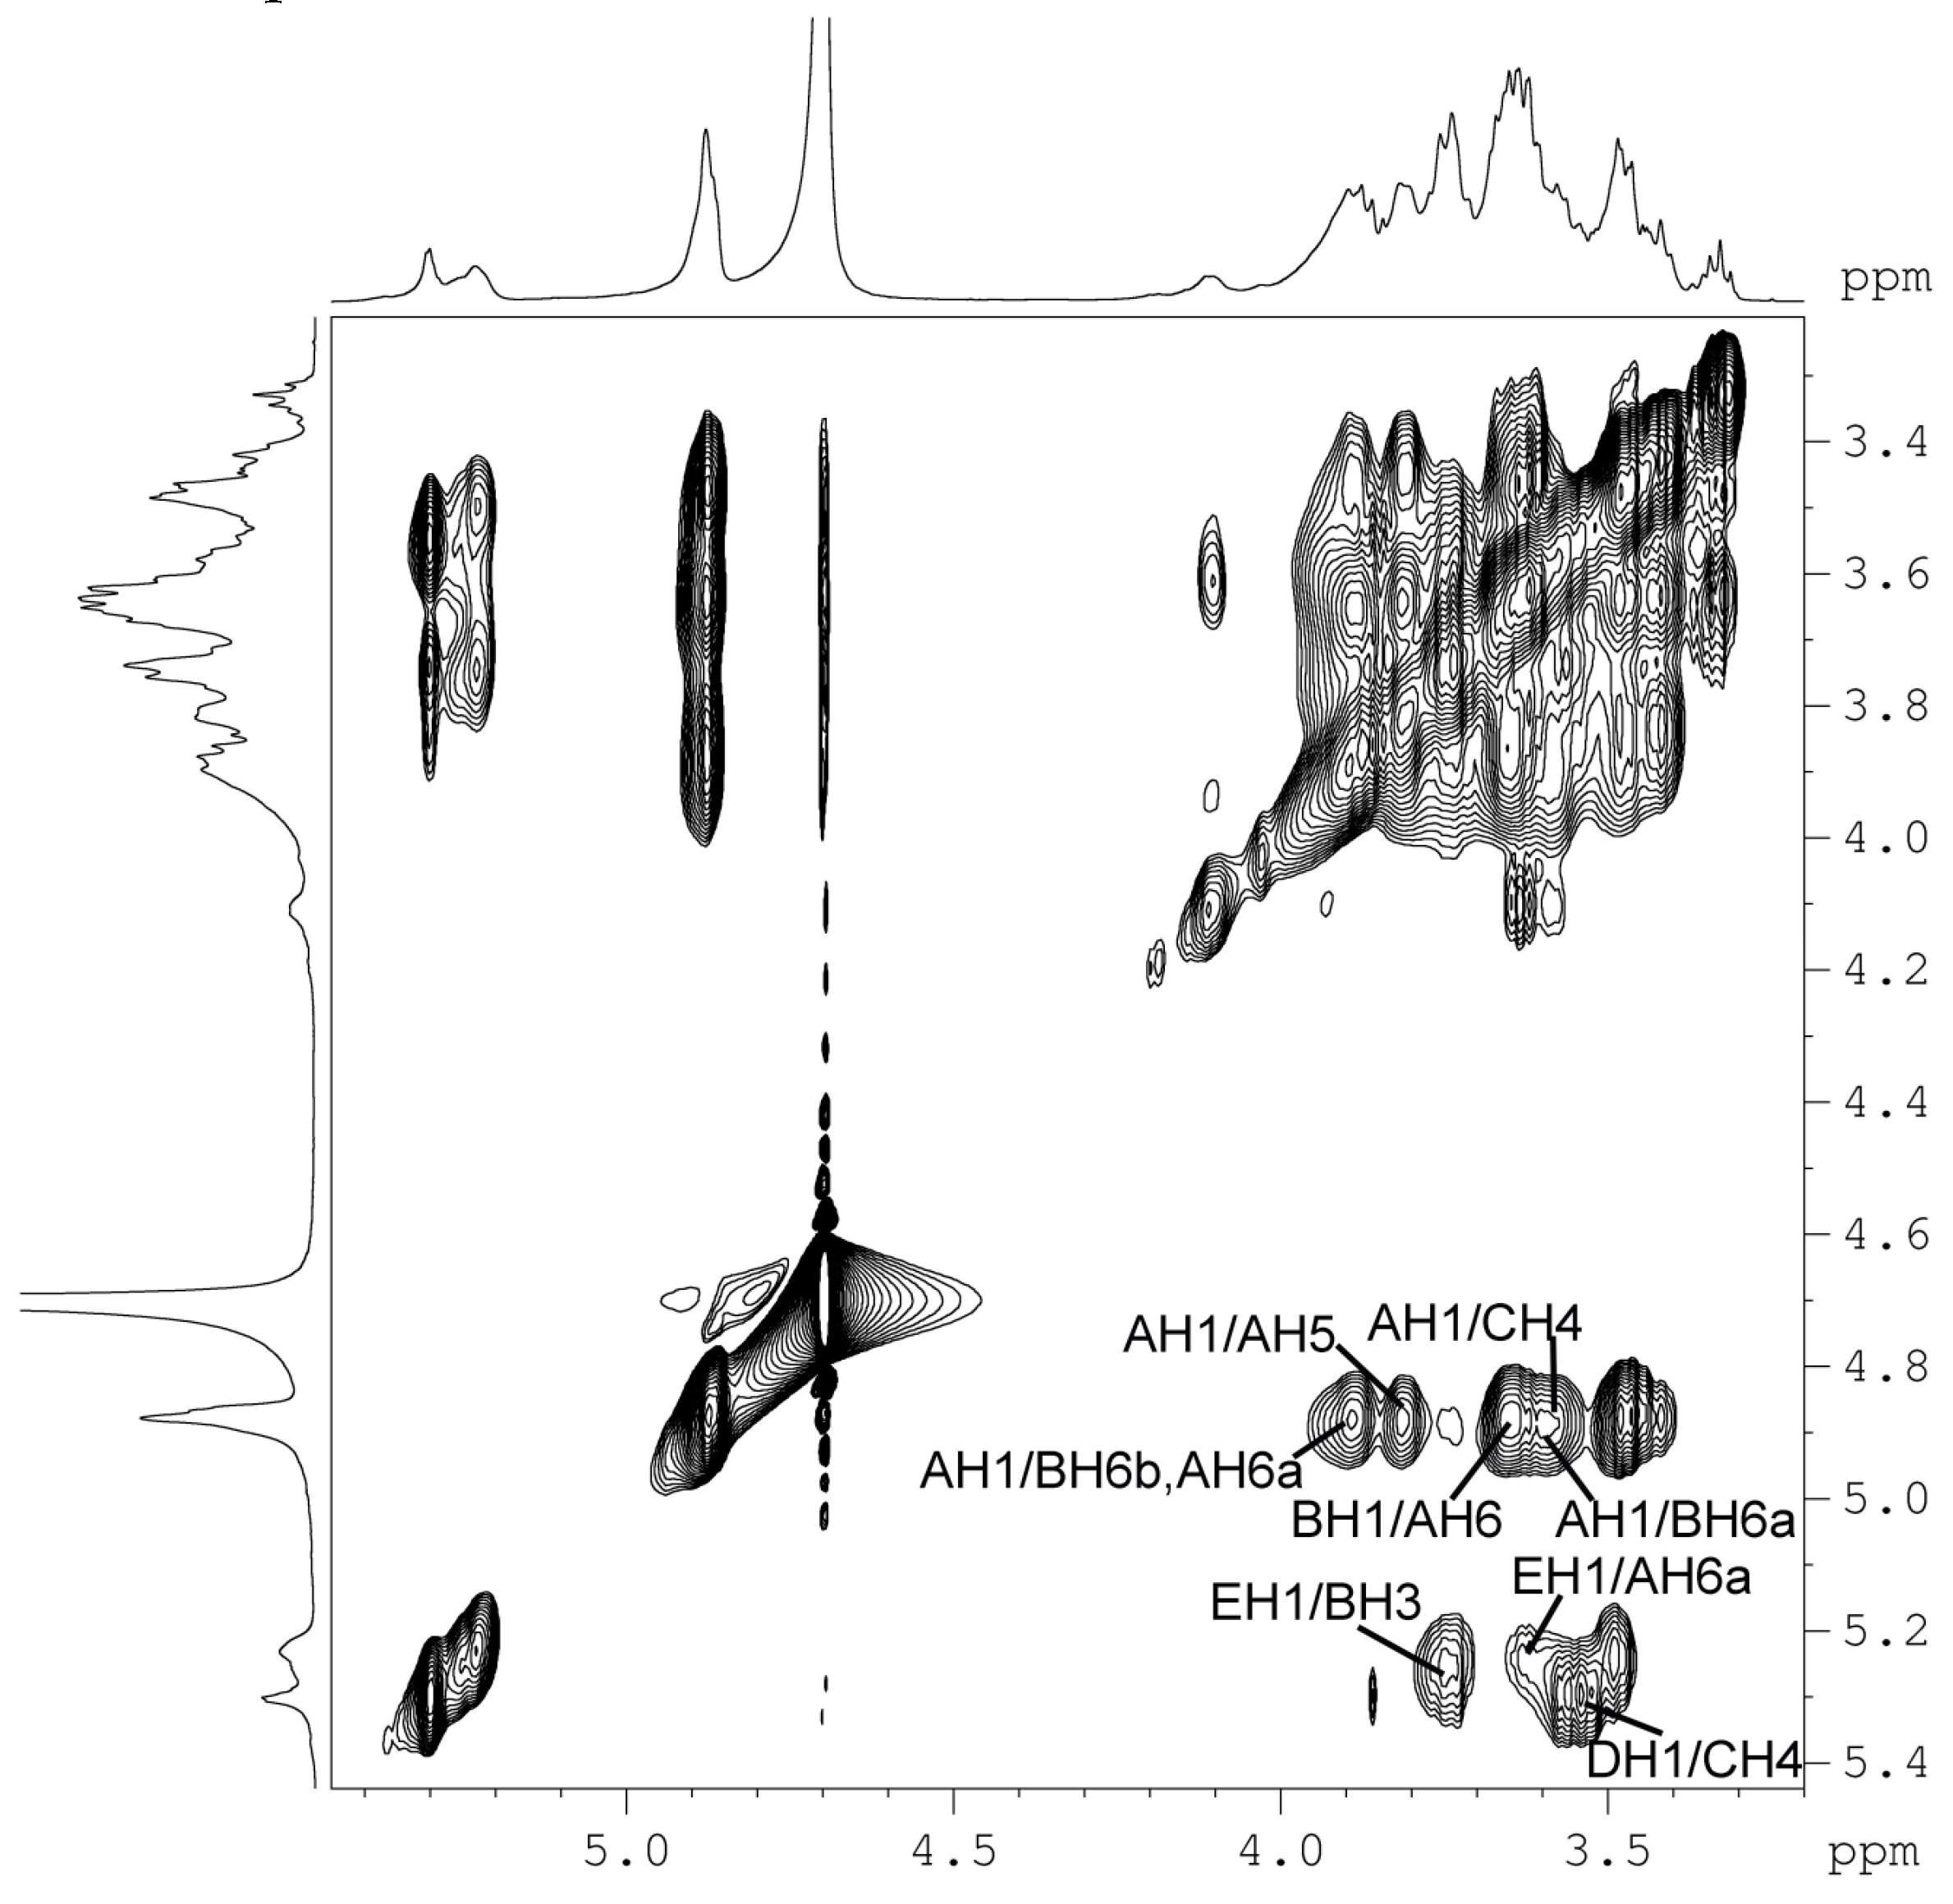
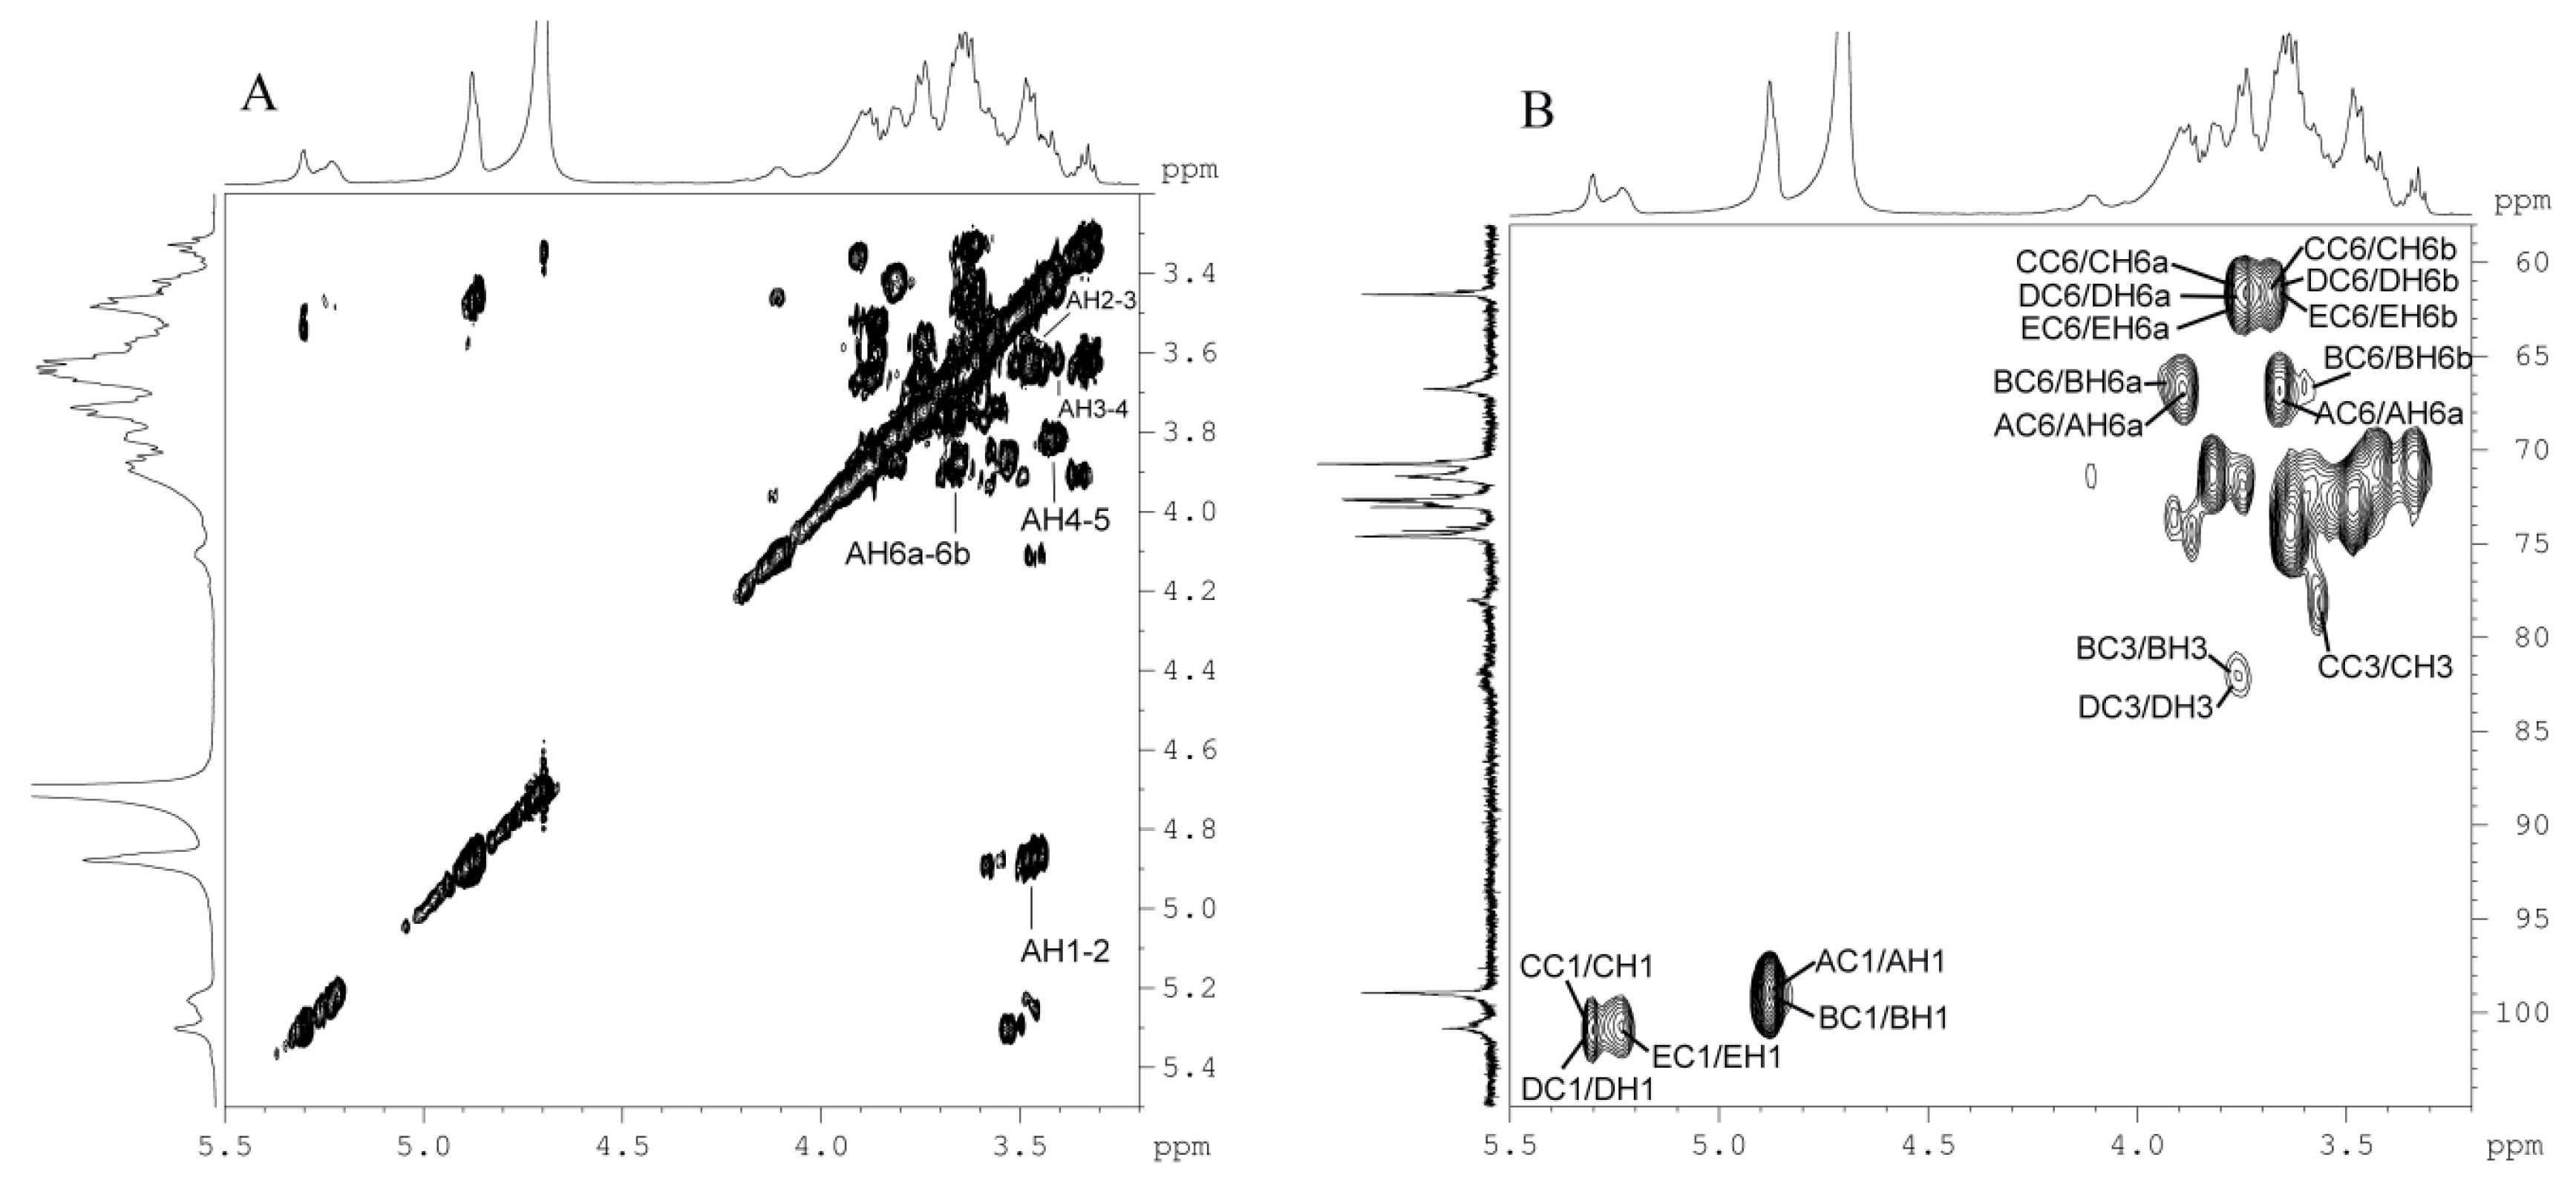
2.5. NMR and Structure Analysis
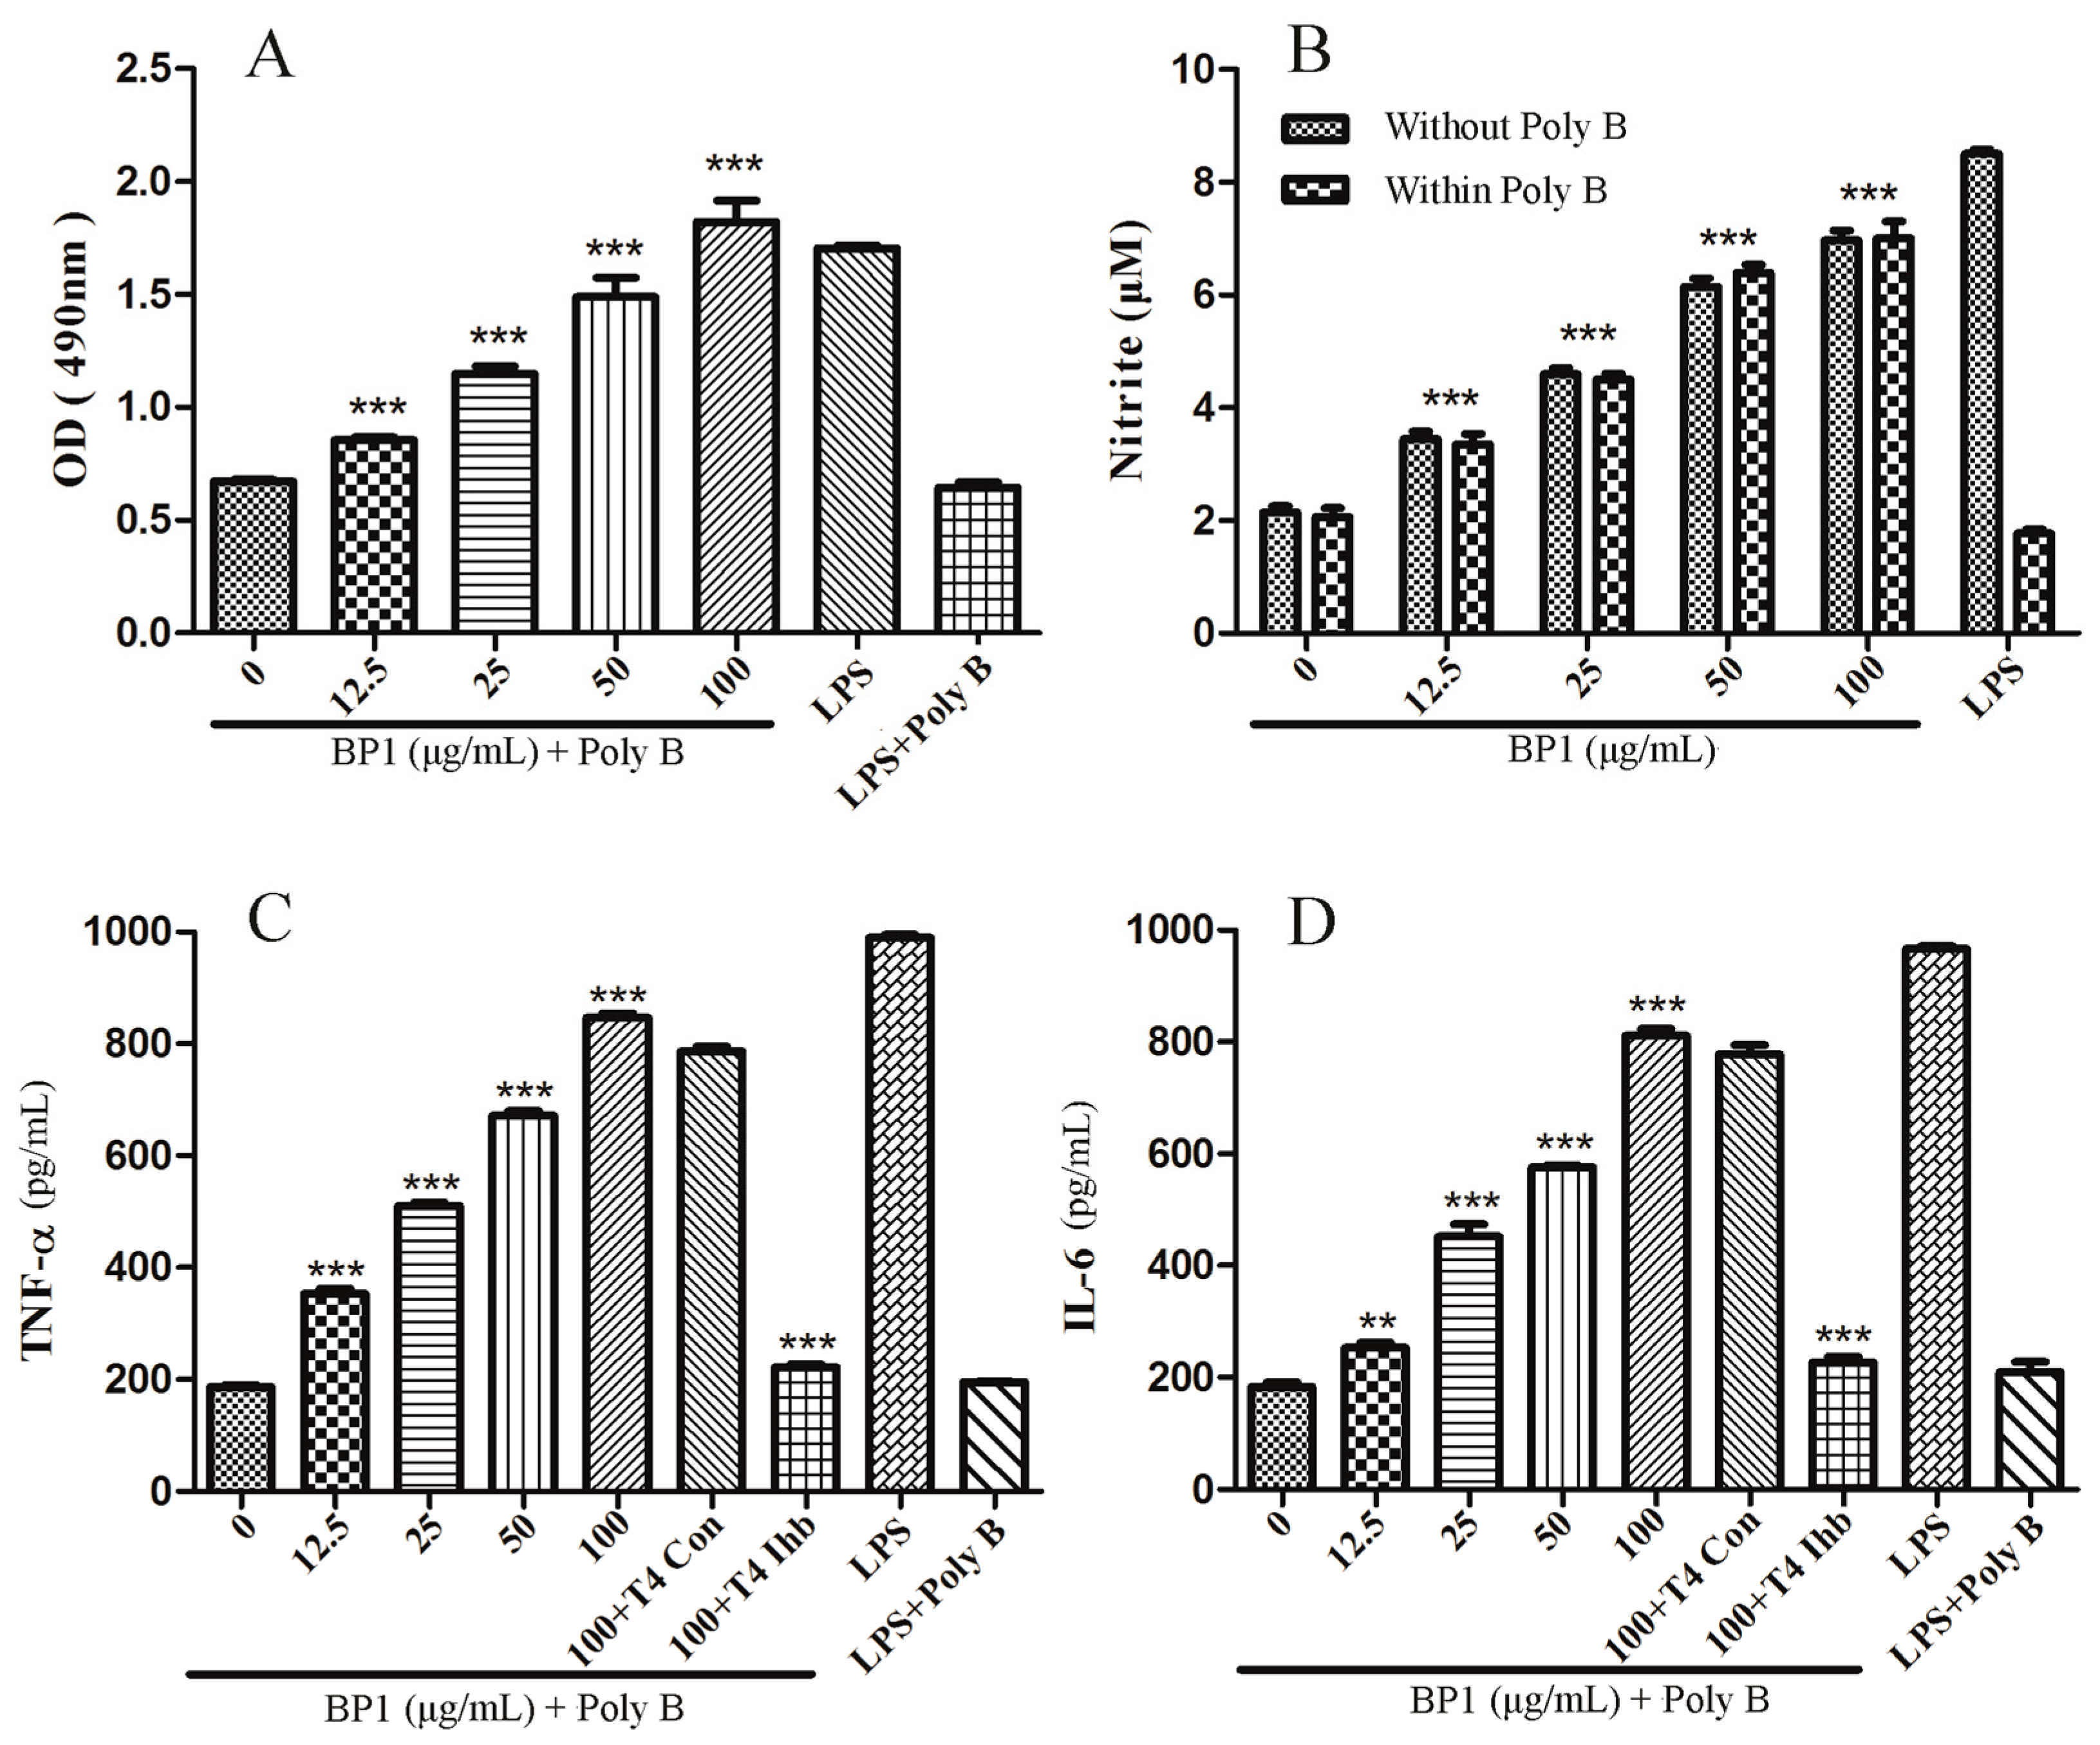
The 1H- and 13C-NMR spectra of BP1 were carefully assigned after an integrative consideration of the above-mentioned results, the 1D/2D-NMR spectra of BP1. The results are shown in Table 2.
The anomeric signals were analyzed firstly. The proton signals around δH 4.83~4.95 ppm and δH 5.18~5.35 ppm in the 1H-NMR spectrum (Figure 2A) exhibited a peak area ratio of about 1.9:1; therefore the signals at δH 4.83~4.95 ppm were considered to represent the main linkages of BP1. The anomeric carbon signals at δC 98.5~100.0 ppm and δC 100.2~101.4 ppm from 13C-NMR (Figure 2B) showed a peak area ratio of about 1.76:1, so the signals at δC 98.5~100 ppm were attributed to the main anomeric carbon signals of BP1. It seems likely that the signals of δC 98.5~100.0/δH 4.83~4.95 were generated by 1,6-/1,3,6-linked Glc [21,22,24], which were some of the major linkage types according to methylation analysis (Table 1). This deduction was confirmed by the coupling of 98.5~100.0/4.83~4.95 in the HSQC spectrum (Figure 3B). The signals of δC 100.2~101.4/δH 5.18~5.35 were assigned to 1,3-/1,4-linked Glc and terminal Glc. In addition, compared to the published data of β-d-glucopyranose [20,25], the anomeric signals of BP1 were significantly shifted up field, which indicated that BP1 has an α-configuration [26]. This deduction was confirmed by the NOE interactions between H1 and H2 of residues 1,6-, 1,3,6- and 1,4-linked Glc.
In the DEPT-135 spectrum (Figure 2C), the signals at δC 66~67 ppm were most likely due to the C6 of 1,6-/1,3,6-linked Glc, and the signals at δC 61.4~61.8 ppm could be attributed to the C6 of 1,3-/1,4-linked Glc and terminal Glc. The signals at δC 78.0 may belong to the C4 of 1,4-linked Glc [23], while the two peaks at δC 81 and δC 83 could be attributed to the C3 of 1,3-linked Glc and 1,3,6-linked Glc, because they were significantly shifted up field compared to the chemical shift of carbon with a free hydroxyl [27,28].
The sequence of the monosaccharides in the sugar chain of BP1 was established by the analysis of the heteronuclear multiple bond correlation (HMBC) spectrum (Figure 3, Table 3). For residue 6α-d-Glcp1, the anomeric proton showed a strong cross peak with the C6 of residue 3,6α-d-Glcp1, and the anomeric carbon of residue 6α-d-Glcp1 also had a strong coupling with H6b of residue 3,6α-d-Glcp1, which confirmed the presence of 6α-d-Glcp16,3α-d-Glcp1. The correlation between C1 of residue 3,6α-d-Glcp1 and H6a of residue 6α-d-Glcp1 and that between the anomeric proton of residue 3,6α-d-Glcp1 with C6a of residue 6α-d-Glcp1 further indicated the existence of 6,3α-d-Glcp16α-d-Glcp1. These results suggest that the backbone of BP1 was composed of a 6,3α-d-Glcp1 linkage and a 6α-d-Glcp1 linkage.
Further, the interactions between C1 of residue 4α-d-Glcp1 with H3 of residue 3,6α-d-Glcp1 and between H1 of residue 4α-d-Glcp1 with C3 of residue 3,6α-d-Glcp1 indicated the presence of of 4α-d-Glcp13,6α-d-Glcp1, suggesting that the side chain 4α-d-Glcp1 was linked to the backbone at O-3 of the residue 3,6α-d-Glcp1. In addition, C1 of residue 4α-d-Glcp1 also exhibited a strong coupling with H3 of residue 3α-d-Glcp1, which indicated the presence of 4α-d-Glcp13α-d-Glcp1. The trans-glycosidic correlation between C1 of residue 3α-d-Glcp1 and H4 of residue 4α-d-Glcp1, together with that between H1 of residue 3α-d-Glcp1 and C4 of residue 4α-d-Glcp1 proved the presence of 3α-d-Glcp14α-d-Glcp1. Since the ratio of the main residues 4α-d-Glcp1:3α-d-Glcp1 is about 2:1, a fragment of →4α-d-Glcp13α-d-Glcp14α-d-Glcp1 may exist. Furthermore, the peak of 4α-d-Glcp13,6α-d-Glcp1 was shown in HMBC, which allows one to infer that a side chain of →4α-d-Glcp13α-d-Glcp14α-d-Glcp1 might be connected to the backbone through the O-3 site of 3,6α-d-Glcp1. Finally, the presence of α-d-Glcp13,6α-d-Glcp1 was deduced from the correlation between C1 of residue α-d-Glcp1 and H3 of residue 3,6α-d-Glcp1. Another side chain was composed by α-d-Glcp1, which joined the backbone through the O-3 site of 3,6α-d-Glcp1.
More evidence regarding the precise structure of the sugar chain of BP1 was found in the NOESY (nuclear Overhauser effect spectroscopy) (Figure 4, Table 4). The NOEs between AH1/BH6ab, DH1/CH4 and EH1/BH3 confirmed the deductions of 6α-d-Glcp16,3α-d-Glcp1, 3α-d-Glcp14α-d-Glcp1, and α-d-Glcp13,6α-d-Glcp1, and NOEs between EH1/AH6ab and AH1/CH4 further confirmed the linkage of α-d-Glcp16α-d-Glcp1, and 6α-d-Glcp14α-d-Glcp1. Based on the above evidence, the sequence of the residues of α-d-Glcp16α-d-Glcp14α-d-Glcp1→ was proposed.
Taking all the NOE and HMBC evidence together, a side chain of α-d-Glcp16α-d-Glcp14α-d-Glcp13α-d-Glcp14α-d-Glcp1→ could be proposed, which was confirmed by the analysis of the partial acid hydrolysis of BP1. The anomeric signals at δC 100.2~101.4 and 98.5~100.0 ppm showed a peak area ratio of about 1:1.76 in the 13C-NMR spectrum of BP1 (Figure 2B), and the ratio significantly decreased to 1:3.7 after partial acid hydrolysis (Figure 2D). These results suggest that 4α-d-Glcp1 and 3α-d-Glcp1 could be cut off from the main chain by partial acid hydrolysis, indicating that they might exist as side chains. This deduction was confirmed by the decreased signal around δC 78.0 ppm due to C4 of 4α-d-Glcp1.
Finally, with the aid of the 1H-1H COSY spectrum (Figure 5A) and the HSQC spectrum (Figure 5B), the 1D-NMR data were successfully assigned, and the results are presented in Table 2. The methylation analysis indicated that BP1 mainly consists of residues 6α-d-Glcp1, 3,6α-d-Glcp1, 4α-d-Glcp1, 3α-d-Glcp1 and α-d-Glcp1. Based on methylation analysis, we concluded that the ratio of the main residues 6α-d-Glcp1:3,6α-d-Glcp1:4α-d-Glcp1:3α-d-Glcp1 is about 6:2:2:1. Therefore, we may infer that the backbone consists of residues following this order: →6α-d-Glcp16,3α-d-Glcp16α-d-Glcp1-6,3α-d-Glcp1-6α-d-Glcp1→. A side chain is attached to the backbone through O-3 of residue B. There are two branches that were α-d-Glcp16α-d-Glcp14α-d-Glcp13α-d-Glcp14α-d-Glcp1→ and terminal α-d-Glcp1→, which were located at the O-3 site of residue B (3,6α-d-Glcp1).
In summary, we conclude that the backbone consists of →6α-d-Glcp16,3α-d-Glcp1→(6α-d-Glcp1)x-6,3α-d-Glcp1-(6α-d-Glcp1)y→. The side chains were α-d-Glcp1→(6α-d-Glcp1)z→4α-d-Glcp13α-d-Glcp14α-d-Glcp1→ and α-d-Glcp1→, being attached to the backbone at O-3 of 3,6α-d-Glcp1. According to the linkage ratio, as revealed by the methylation analysis, the total sum of x, y and z should be five. Additionally, the molecular weight of BP1 suggested that n should be 3–4. The proposed structure is shown in Figure 6. A literature research indicated that the α-glucan BP1 is the first purified polysaccharide obtained and identified from Lobelia, even though this genus includes more than 415 species [29].

2.6. MTT Assay

The results of the MTT assay of BP1’s effect on the cell proliferation of RAW 264.7 cells are shown in Figure 7A. The positive control LPS induced cell proliferation, and polymyxin B (PolyB) stopped it. Like LPS, BP1 showed significant induction of the proliferation of RAW 264.7 cells, in a dose-dependent manner at concentrations of 12.5, 25, 50, 100 µg/mL, when administered together with PolyB in order to suppress the effect of LPS. The results suggest that LPS’s impact could be excluded in the case of BP1.

2.7. Effect of BP1 on NO Release by RAW 264.7 Cells

In this study, the release of NO by RAW 264.7 cells after incubation with different concentrations of BP1 was determined (Figure 7B). As happens with LPS, BP1 also induced a strong NO release in a dose-dependent manner within the varied concentrations of 12.5, 25, 50, 100 µg/mL. PolyB inhibited the effect of LPS, but did not affect that of BP1.

2.8. Cytokine Production and the Role of TLR 4

Similar results were obtained in the determination of the effects of LPS and BP1 on the secretion of TNF-α and IL-6 by RAW 264.7 cells. LPS and LPS plus PolyB served as positive and endotoxin-excluded controls, respectively. The levels of TNF-α and IL-6 increased after LPS treatment and after BP1 + PolyB treatment (Figure 7C,D). When administrated with PolyB in order to suppress the effect of LPS, BP1 induced dose-dependent increases over the concentration range of 12.5, 25, 50, 100 μg/mL. Furthermore, when Toll-like receptor TLR 4 inhibitor (T4 Ihb) was added to the high-dose BP1 group (100 µg/mL), the production of both TNF-α and IL-6 was significantly suppressed, but the TLR 4 control (100 + T4 Con) did not show such significant difference. These results suggested that TLR 4 may play an important role in the signal transduction.

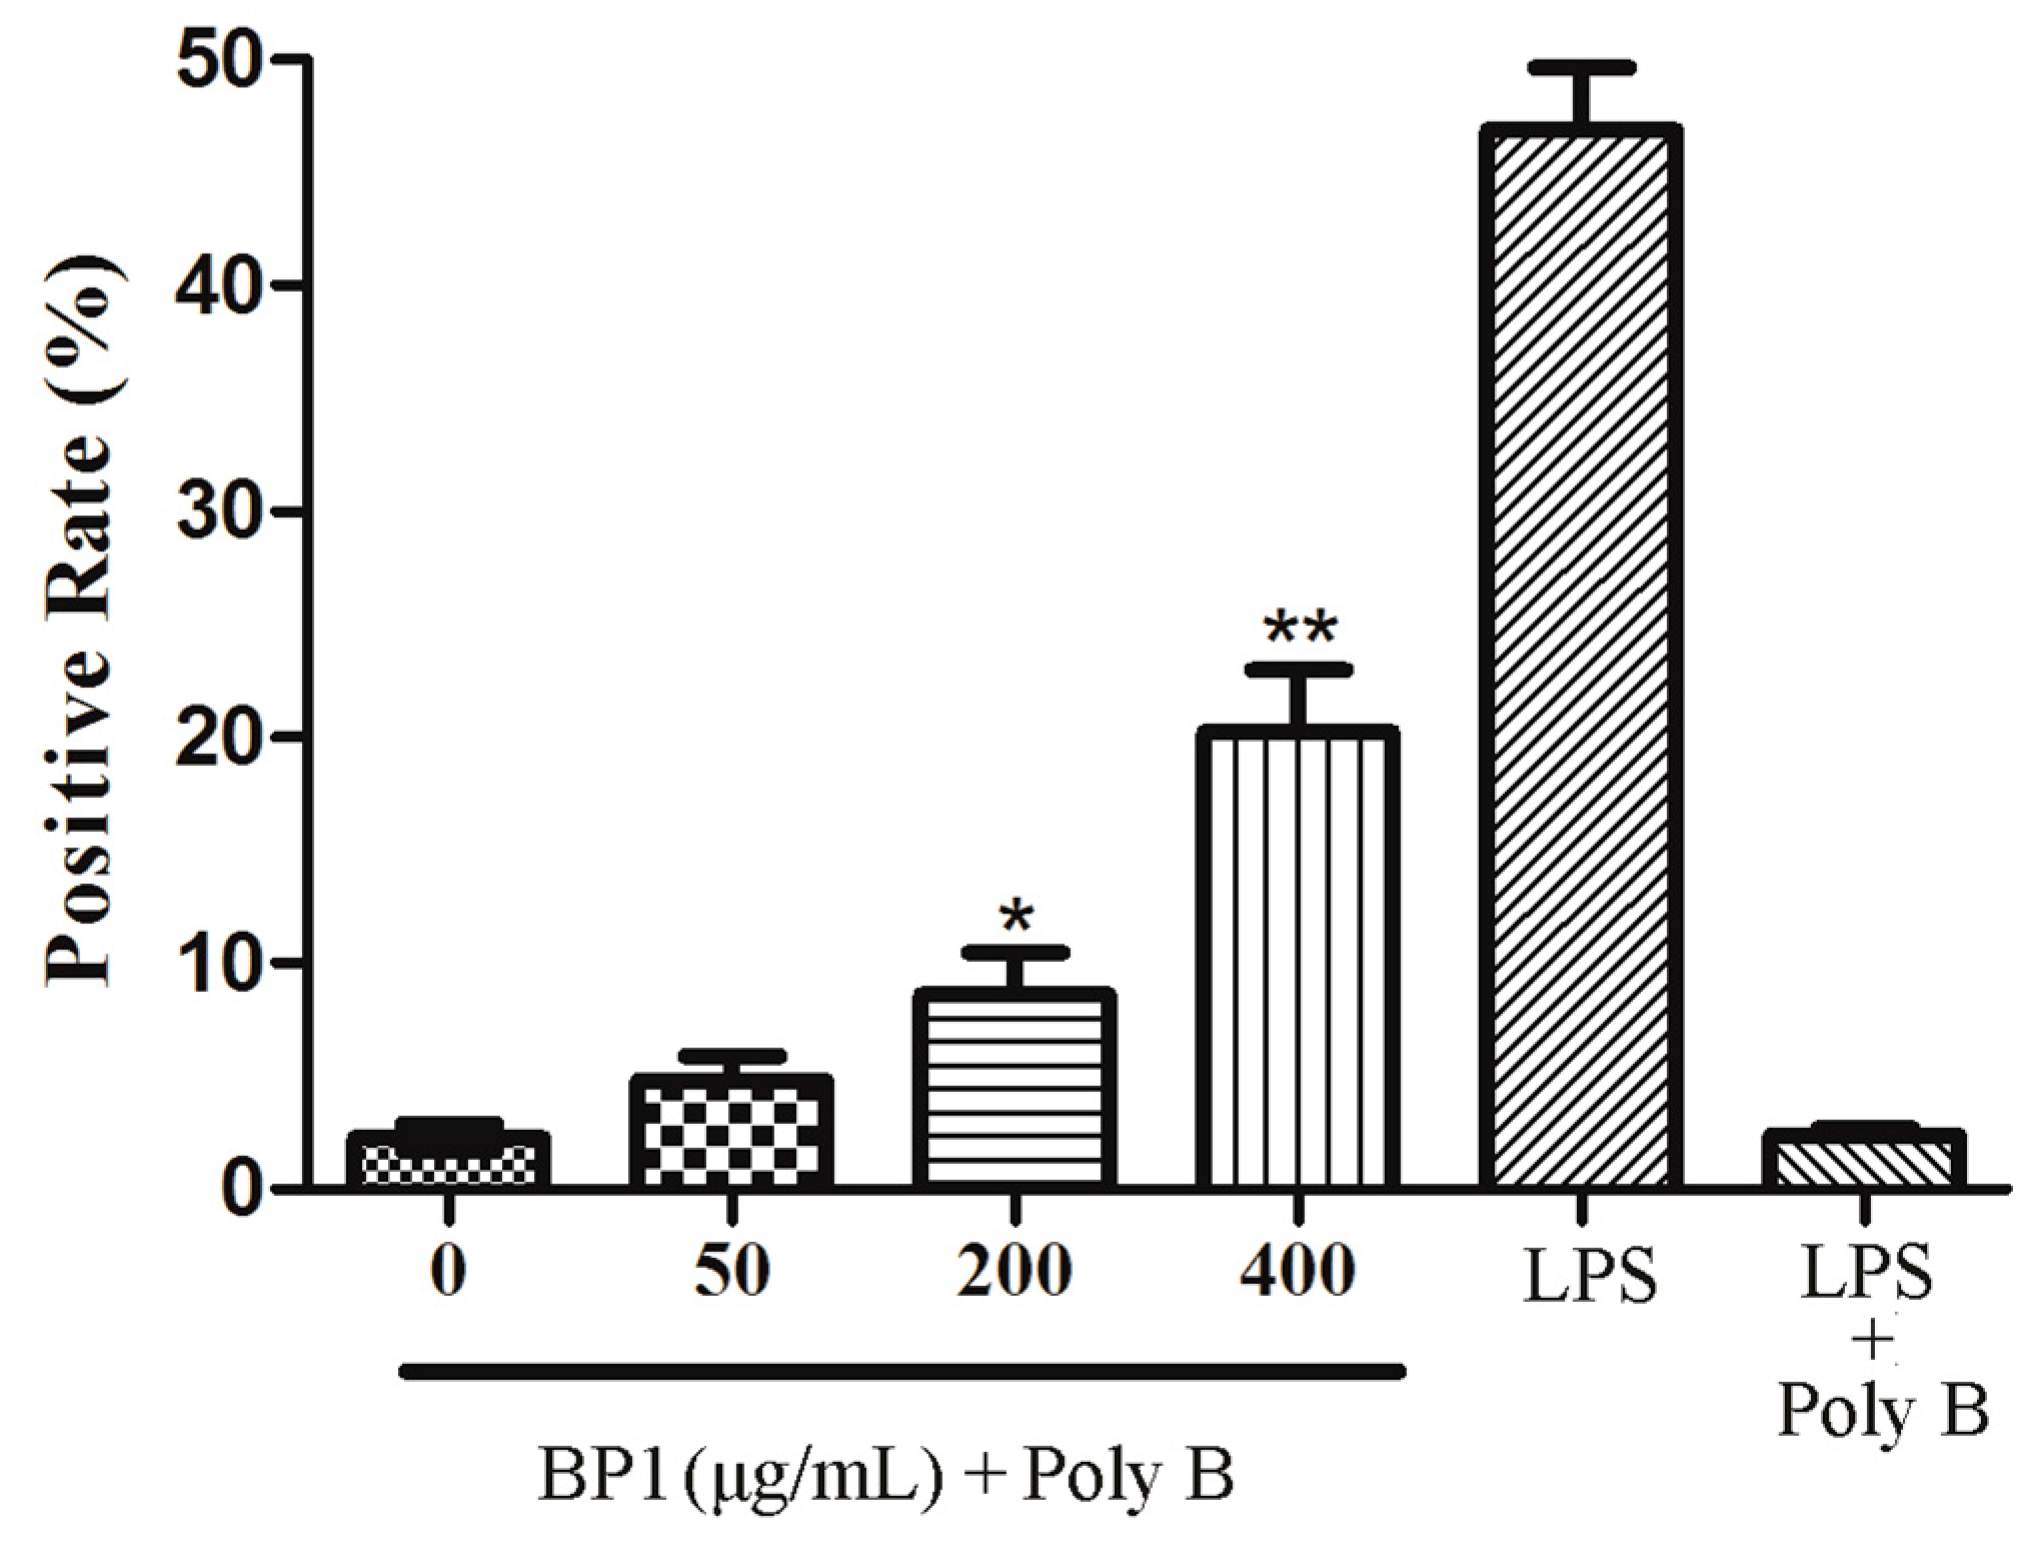
2.9. Assay of Phagocytosis

The effect of BP1 on the phagocytosis to FITC-dextran by RAW 264.7 cells is shown in Figure 8. LPS and LPS plus PolyB served as positive and endotoxin-excluded controls, respectively. LPS at 2 µg/mL significantly induced the phagocytosis, and PolyB stopped it. BP1 at concentrations of 200 and 400 μg/mL, when administrated with PolyB in order to suppress the impact of LPS, induced the phagocytosis to FITC-dextran by RAW 264.7 cells.
Generally speaking, the bioactivities of polysaccharides are closely dependent on their structures, including monosaccharide composition and sequence, glucosidic bonds, configuration and chain conformation [30,31,32]. However, it has not been clear if the pattern-recognition receptors of the cell membrane might be specific to the α,β-configuration of polysaccharides. It has been known that Dectin-1 is the receptor responsible for the recognition of both β-(1,3) glucans [33] and α-(1,3) glucans [34]. TLR2 is the receptor responsible for the recognition of both β-(1,3) glucans [35] and α-(1,4) glucans [36]. TLR4 is the receptor responsible for the recognition of α-(1,4,6)-glucan [37]. In this study, TLR4 was found to be a potential receptor for the α-glucan BP1. Because it is not known whether TLR4 functions as a receptor for β-glucan, we cannot say whether TLR4 is configuration-specific. Therefore, some more research is still needed to determine the role of TLR4 in the immuno-modulating effects of β-glucans.

3. Materials and Methods

3.1. Materials

Samples of Herba Lobellae Chinensis, i.e., dried Lobelia chinensis, were provided by the Kang Qiao Traditional Chinese Medicine Decoction Pieces Co. Ltd. (Shanghai, China), China, and were identified by Prof. Zhili Zhao (Shanghai University of Traditional Chinese Medicine, Shanghai, China 131120). Monosaccharide standards were all from Fluka, USA. Dextran standards and trifluoroacetic acid (TFA) and dimethyl sulfoxide (DMSO) were from Sigma-Aldrich (St. Louis, MO, USA). Other reagents were analytical grade and obtained from China Chemical Reagent Industry (Shanghai, China), unless otherwise specified.

3.2. Isolation and Purification of BP1

The dried herbs of L. chinensis, samples of approximately 1.0 kg, were weighed accurately, crushed and then refluxed in absolute ethanol at 80 °C for 2 h. The residues were extracted twice with 5 L of distilled water at 100 °C for 3 h. After centrifuging at 4000 rpm for 10 min, the supernatant was collected and condensed to 100 mL by rotary evaporation at 60 °C. The concentrated solution was precipitated overnight with four volumes of 95% EtOH in a refrigerator (4 °C). After centrifuging at 4000 rpm for 10 min, the precipitate was collected and freeze-dried, yielding crude polysaccharides (126 g).
A part of the crude polysaccharide (10 g) was dissolved in distilled water (50 mL) in a water bath at 60 °C and the solution was centrifuged at 12,000 rpm for 10 min. The above operation was repeated again. The supernatant (10 mL) was loaded onto a Q-Sepharose Fast Flow column (50 cm × 5 cm), which was eluted stepwise with distilled water, followed by 0.2 M and 0.4 M NaCl solution and the eluate was monitored using the phenol-sulfuric acid method [38,39,40]. The major fraction (the part of 0.2 M NaCl) was dialyzed with flowing tap-water and freeze-dried using a lyophilizer (Labconco, Kansas City, MO, USA). This fraction was further separated using a Superdex-75 column (100 cm × 2.5 cm), eluted with 0.2 M NaCl solution and monitored using an RI-102 refractive index detector (Lihui Biological Technology Co., Ltd., Suzhou, China). The fractions obtained (220–260 min) were combined, concentrated, dialyzed against flowing tap-water and lyophilized to obtain the major fraction BP1 (1.25 g).

3.3. Determination of the Molecular Weight

The molecular weight of the BP1 was estimated through high performance gel permeation chromatography (HPGPC) (Tosoh Bioscience, King of Prussia, PA, USA) by using combined columns of Shodex KS-802 and KS-804, which were eluted with a mobile phase of 0.2 M NaCl at a flow rate of 0.8 mL/min. The eluate was monitored by RI detector (RI-101 refractive index detector). To estimate the molecular weight, Shodex-packed columns were calibrated using a standard P-series of dextrans (P-5, P-10, P-20, P-50, P-100, P-200, P-400 and P-800). The molecular weight was calculated according to the method of Fan et al. and Liu et al. [41,42].

3.4. Determination of the Protein Content

The protein contents of the polysaccharide samples were determined using Quick start Bradford 1× Dye Reagent (Bio-Rad, Hong Kong, China). A standard curve was prepared with bovine serum albumin (BSA, 0–2.0 mg/mL). BP1 polysaccharide was dissolved in deionized water at a concentration of 2.0 mg/mL. The sample was mixed with diluted dye reagent and incubated at room temperature for 5 min. Then, the absorbance was measured at 595 nm using a microtiter plate reader.

3.5. Monosaccharide Composition Analysis

BP1 (2 mg) was hydrolyzed in 2 M TFA (2 mL) at 120 °C for 2 h in a sealed glass tube. The acid was removed under reduced pressure through repeated evaporation with MeOH. The hydrolysate was successively reduced with sodium borohydride, acetylated with acid anhydride (Ac2O) at 105 °C for 1 h, and the resulting alditol acetates were examined via GC-MS.
The gas chromatography-mass spectrometry (GC-MS) was performed on a Shimadzu QP-2010 instrument equipped with a Shimadzu AOC-20i auto sampler system and interfaced with a Shimadzu QP 2010S mass spectrometer (Shimadzu Corporation, Tokyo, Japan). Samples were injected in splitless mode on a DB-5 MS analytical column (30 m × 0.25-mm ID with a film thickness of 0.25-μm J & W Scientific, Folsom, CA, USA). Helium (purity, 99.999%) was used as a carrier gas at a constant flow rate of 1 mL/min. The gas chromatograph was operated in split mode with the split/splitless injector at the ratio of 1:5. The injector temperature was set at 250 °C. The temperature program was set at 140 °C, maintained for 5 min and increased to 250 °C for 5 min at an increment of 3 °C/min. The mass spectra were taken in SCAN mode at 300 eV from m/z 40 to 400, and the scan speed was 769 while the detector delayed for 5 min. The MS progress started at 5 min and ended at 44 min. Standard monosaccharides were carried out following the same procedure.

3.6. Methylation Analysis

Methylation analysis was carried out according to the modified Hakomori method [43]. Briefly, BP1 (10 mg) was accurately weighed and dissolved in 1.0 mL of DMSO, to which 1.0 mL of dimsyl sodium (SMSM, 0.25 g/mL) solution was added under water-free conditions. After incubation under stirring for 12 h at room temperature, 1 mL of iodomethane was added slowly into the above polysaccharide solution; the solution was kept under incubation in the dark for 5 h at room temperature. After that, it was dialyzed against flowing tap-water in a dialysis tube (with a molecular size cutoff at 1000 Da) for 24 h. The methylated polysaccharide was extracted three times with chloroform (2 mL each time); the chloroform extract was combined and dried using a reduced-pressure rotary evaporator. The above procedure was repeated three times, and the completeness of methylation was confirmed when the detection of the hydroxyl absorption in the IR spectrum failed. The methylated polysaccharide was hydrolyzed within 2 M TFA (2 mL); then, the generated methylated alditol acetates were analyzed by GC-MS. The temperature programming condition of GC was as follows: the column temperature of the column was initially 140 °C and was increased to 180 °C at 2 °C/min, then to 190 °C at 1 °C/min and to 280 °C at 10 °C/min and held for 5 min. The gas chromatograph was operated in split mode with the split/splitless injector at the ratio of 1:5. The injector temperature was set at 250 °C. The MS progress started at 5 min and ended at 44 min. Standard monosaccharide were carried out following the same procedure.

3.7. Partial Acid Hydrolysis

BP1 (50 mg) was dissolved in 5 mL of TFA (0.1 M) at 60 °C for 1 h. The hydrolysate solution was evaporated under reduced pressure, and MeOH was added into the residue to remove TFA. The product was lyophilized and dissolved in ultra-pure water. The degraded polysaccharide was isolated from the hydrolysis products by ethanol precipitation and was named BP1a, which was examined using HPGPC before the NMR test [44].

3.8. NMR Analysis

The 1H-NMR (400 MHz), 13C-NMR (100 MHz), 2D-NMR, including 1H-1H correlation spectroscopy (COSY), heteronuclear single-quantum coherence (HSQC) and heteronuclear multiple bond correlation (HMBC) spectra of BP1, were obtained on a Bruker Avance 400 spectrometer (Bruker BioSpin, Rheinstetten, Germany). BP1 (40 mg) was dissolved in 1 mL of D2O (99.9% D) and freeze-dried to complete deuterium exchange. The treated sample was dissolved again in 400 μL of D2O (99.9% D) to make the sample solution. Acetone was used as the internal standard (δH 2.225 ppm, δC 31.45 ppm). The Bruker TopSpin program was used to acquire and process the NMR data.

3.9. MTT Assay

The effect of BP1 on the proliferation of RAW 264.7 cells was measured using the MTT (3-[4,5-dimethylthiazol]-2,5-diphenyltetrazolium bromide, Sigma-Aldrich stain assay. Cells (1 × 10⁴ cells/well) were seeded in 96-well plates (Corning Inc., Corning, New York, NY, USA) and cultured overnight; they were then incubated with different concentrations of BP1 plus polymyxin B (PolyB 10 μg/mL, used to suppress the effect of LPS) for 24 h. LPS (2 μg/mL) and LPS plus PolyB (10 μg/mL) were used as controls. Following incubation, 30 µL of MTT solution (5 mg/mL in PBS) were added to each well, and the plates were incubated at 37 °C for another 4 h. Then, the medium was discarded, and 150 µL of dimethyl sulfoxide was added to dissolve the formazan crystals. The absorbance of each sample was read at 490 nm using a microplate reader (Thermo, Waltham, MA, USA).

3.10. Nitrite Assay

RAW 264.7 macrophages were seeded on a 24-well plate at the initial concentration of 2 × 10⁵ cells/well overnight. The cells were treated with 12.5, 25, 50 and 100 µg/mL of BP1 for 24 h. PolyB was added to the cells in order to monitor the impact of LPS. LPS (2 μg/mL) and LPS plus PolyB were used as controls. The production of NO was determined by assaying the accumulation of nitrite, in the culture medium having Griess reagent (Sigma-Aldrich). The nitrite concentration was calculated by comparison with standard sodium nitrite solutions by spectrophotometry, at 540 nm.

3.11. Cytokine Determination and the Effect of Toll-Like Receptor 4 Inhibitor

The production of tumor necrosis factor-alpha (TNF-α) and interleukin -6 (IL-6) was measured by using an ELISA kit (eBioscience, San Diego, CA, USA). Briefly, RAW 264.7 macrophages were seeded overnight on a 24-well plate at the initial concentration of 2 × 10⁵ cells/well. In the groups treated with TLR 4 inhibitor or TLR 4 inhibitor control (Novus Biologicals, Littleton, CO, USA), the cells were pretreated with TLR 4 inhibitor or its control and incubated at 37 °C, in an atmosphere of 5% CO2. One hour later, PolyB plus different concentrations of BP1 were added to the medium (system), and the cells were incubated for another 24 h. LPS (2 μg/mL) and LPS plus PolyB were used as controls. Cell-free supernatants were collected for the ELISA assay.

3.12. Phagocytic Assay

Fluorescein isothiocyanate-conjugated dextran (FITC-dextran, Mw 12,000) was prepared for the phagocytic assay according to a published study [45]. RAW 264.7 macrophages (4 × 10⁵ cells/well) were seeded in 12-well plates overnight and were then exposed to the various concentrations of 12.5, 25, 50 and 100 µg/mL of BP1 for 24 h, in which PolyB (10 μg/mL) was added to all of the cells in order to suppress the impact of LPS. LPS (2 μg/mL) and LPS plus PolyB (10 μg/mL) were tested as controls. After that, all of the media were removed, and the cells were treated with FITC-dextran (0.1 mg/mL), which was dissolved in the cell culture medium and incubated for 1 h at 37 °C in an atmosphere of 5% CO2. After incubation, cells were washed four times in cold phosphate-buffered saline (PBS) and were analyzed by flow cytometry (BD Biosciences, San Jose, CA, USA).

3.13. Data Analysis

All of the results were expressed as the mean ± SD/SEM. Statistical analysis was performed using one-way ANOVA. Data analysis was performed using GraphPad PRISM software Version 5.0 (GraphPad Software, San Diego, CA, USA). A value of p < 0.05 was chosen as the criterion of statistical significance.

4. Conclusions

A neutral α-glucan, named BP1, with a molecular mass of approximately 9.45 kDa was isolated from Lobelia chinensis. Its backbone mainly consists a 6α-d-Glcp1 linkage. The side chains are terminal α-d-Glcp1→ and α-d-Glcp1→(6α-d-Glcp1)z4α-d-Glcp13α-d-Glcp14α-d-Glcp1→, which are attached to the backbone at O-3 of 3,6α-d-Glcp1. BP1 is able to enhance the cell proliferation, phagocytosis, nitric oxide production and cytokine secretion of RAW 264.7 cells in a dose-dependent manner. These effects might be mediated via TLR4, as the inhibitor of TLR4 is able to block the BP1-induced secretion of TNF-α and IL-6.

Supplementary Materials

Supplementary materials can be accessed at: https://www.mdpi.com/1420-3049/21/6/779/s1.

Acknowledgments

This study was supported by the National Nature Science Foundation of China (No. 81473341) and the Hong Kong Government General Research Fund (No. 22100014).

Author Contributions

X.-J.L. and Q.-B.H. designed the experiments. X.-J.L. and W.-R.B. performed the experiments. C.-H.L., D.-L.M., G.Z., A.-P.L. and S.-C.W. contributed in data analysis. X.-J.L. and W.-R.B. wrote the manuscript, and Q.-B.H. revised the manuscript.

Conflicts of Interest

The authors declare no conflict of interest.

References

  1. Yong, Z.; Lei, Z. Research progress in Lobelia chinensis. Med. Inform. 2006, 19, 1115–1116. [Google Scholar]
  2. Chen, M.W.; Chen, W.R.; Zhang, J.M.; Long, X.Y.; Wang, Y.T. Lobelia chinensis: Chemical constituents and anticancer activity perspective. Chin. J. Nat. Med. 2014, 12, 103–107. [Google Scholar] [PubMed]
  3. Yang, S.; Shen, T.; Zhao, L.; Li, C.; Zhang, Y.; Lou, H.; Ren, D. Chemical constituents of Lobelia chinensis. Fitoterapia 2014, 93, 168–174. [Google Scholar] [CrossRef] [PubMed]
  4. Shi, L.; Wang, J.X.; Li, Y.Y.; Kang, W.Y. Studies on biological activity of compound recipe of Lobelia chinensis. Chin. J. Exp. Tradit. Med. Form. 2010, 16, 57–61. [Google Scholar]
  5. Kuo, P.C.; Hwang, T.L.; Lin, Y.T.; Kuo, Y.C.; Leu, Y.L. Chemical constituents from Lobelia chinensis and their anti-virus and anti-inflammatory bioactivities. Arch. Pharm. Res. 2011, 34, 715–722. [Google Scholar] [CrossRef] [PubMed]
  6. Kuo, Y.C.; Lee, Y.C.; Leu, Y.L.; Tsai, W.J.; Chang, S.C. Efficacy of orally administered Lobelia chinensis extracts on herpes simplex virus type 1 infection in balb/c mice. Antivir. Res. 2008, 80, 206–212. [Google Scholar] [CrossRef] [PubMed]
  7. Shao, J.H.; Zhang, H. Influence of Lobelia chinensis lour. Decoction on expression of C-erbB-2 and P53 on H22 tumor-bearing mice. Chin. J. Clin. Pharm. 2010, 19, 372–375. [Google Scholar]
  8. Wang, H.Y.; Quan, K.; Jiang, Y.L.; Wu, J.G.; Tang, X.W. Effect of luteolin and its combination with chemotherapeutic drugs on cytotoxicity of cancer cells. J. Zhejiang Univ. Med. Sci. 2010, 39, 30–36. [Google Scholar]
  9. Huang, X.X.; Lai, H.F.; Luo, L.C. Optimization of extraction technology for polysaccharide from Lobelia chinensis by ultrasonic-composite enzyme synergistic method. Chin. J. Exp. Tradit. Med. Form. 2012, 18, 44–46. [Google Scholar]
  10. Yan, J.K.; Wang, W.Q.; Wu, J.Y. Recent advances in Cordyceps sinensis polysaccharides: Mycelial fermentation, isolation, structure, and bioactivities: A review. J. Funct. Foods 2014, 6, 33–47. [Google Scholar] [CrossRef]
  11. Zhu, F.M.; Du, B.; Bian, Z.X.; Xu, B.J. β-glucans from edible and medicinal mushrooms: Characteristics, physicochemical and biological activities. J. Food Compos. Anal. 2015, 41, 165–173. [Google Scholar] [CrossRef]
  12. Xie, S.Z.; Hao, R.; Zha, X.Q.; Pan, L.H.; Liu, J.; Luo, J.P. Polysaccharide of Dendrobium huoshanense activates macrophages via toll-like receptor 4-mediated signaling pathways. Carbohydr. Polym. 2016, 146, 292–300. [Google Scholar] [CrossRef] [PubMed]
  13. Wang, W.; Zou, Y.; Li, Q.; Mao, R.W.; Shao, X.J.; Jin, D.; Zheng, D.H.; Zhao, T.; Zhu, H.F.; Zhang, L.; et al. Immunomodulatory effects of a polysaccharide purified from Lepidium meyenii walp. On macrophages. Process Biochem. 2016, 51, 542–553. [Google Scholar] [CrossRef]
  14. Huang, J.Q.; Nie, Q.X.; Liu, X.Z.; Zhang, S.S.; Nie, S.P.; Huang, D.F.; Wang, S.A.; Zhu, F.; Xie, M.Y. Ganoderma atrum polysaccharide modulates TNF-α secretion and mRNA expression in macrophages of S-180 tumor-bearing mice. Food Hydrocoll. 2016, 53, 24–30. [Google Scholar] [CrossRef]
  15. Goo, B.G.; Baek, G.; Choi, D.J.; Park, Y.I.; Synytsya, A.; Bleha, R.; Seong, D.H.; Lee, C.G.; Park, J.K. Characterization of a renewable extracellular polysaccharide from defatted microalgae Dunaliella tertiolecta. Bioresour. Technol. 2013, 129, 343–350. [Google Scholar] [PubMed]
  16. Wang, L.C.; Zhang, K.; Di, L.Q.; Liu, R.; Wu, H. Isolation and structural elucidation of novel homogenous polysaccharide from Mactra veneriformis. Carbohydr. Polym. 2011, 86, 982–987. [Google Scholar] [CrossRef]
  17. Zhao, T.; Mao, G.H.; Feng, W.W.; Mao, R.W.; Gu, X.Y.; Li, T.; Li, Q.; Bao, Y.T.; Yang, L.Q.; Wu, X.Y. Isolation, characterization and antioxidant activity of polysaccharide from Schisandra sphenanthera. Carbohydr. Polym. 2014, 105, 26–33. [Google Scholar] [CrossRef] [PubMed]
  18. Cui, H.X.; Liu, Q.; Tao, Y.Z.; Zhang, H.F.; Zhang, L.; Ding, K. Structure and chain conformation of a (1→6)-α-d-glucan from the root of Pueraria lobata (willd.) ohwi and the antioxidant activity of its sulfated derivative. Carbohydr. Polym. 2008, 74, 771–778. [Google Scholar] [CrossRef]
  19. Di, H.; Zhang, Y.; Chen, D. An anti-complementary polysaccharide from the roots of Bupleurum chinense. Int. J. Biol. Macromol. 2013, 58, 179–185. [Google Scholar] [CrossRef] [PubMed]
  20. Zhu, H.; Di, H.; Zhang, Y.; Zhang, J.; Chen, D. A protein-bound polysaccharide from the stem bark of Eucommia ulmoides and its anti-complementary effect. Carbohydr. Res. 2009, 344, 1319–1324. [Google Scholar] [CrossRef] [PubMed]
  21. Han, X.Q.; Wu, X.M.; Chai, X.Y.; Chen, D.; Dai, H.; Dong, H.L.; Ma, Z.Z.; Gao, X.M.; Tu, P.F. Isolation, characterization and immunological activity of a polysaccharide from the fruit bodies of an edible mushroom, Sarcodon aspratus (berk.) s. Ito. Food Res. Int. 2011, 44, 489–493. [Google Scholar] [CrossRef]
  22. Villares, A.; García-Lafuente, A.; Guillamón, E.; Mateo-Vivaracho, L. Separation and characterization of the structural features of macromolecular carbohydrates from wild edible mushrooms. Bioact. Carbohydr. Diet. Fibre 2013, 2, 15–21. [Google Scholar] [CrossRef]
  23. Wu, Y.L.; Sun, C.R.; Pan, Y.J. Studies on isolation and structural features of a polysaccharide from the mycelium of an chinese edible fungus (Cordyceps sinensis). Carbohydr. Polym. 2006, 63, 251–256. [Google Scholar]
  24. Zhao, C.; Li, M.; Luo, Y.F.; Wu, W.K. Isolation and structural characterization of an immunostimulating polysaccharide from fuzi, Aconitum carmichaeli. Carbohydr. Res. 2006, 341, 485–491. [Google Scholar] [CrossRef] [PubMed]
  25. Carbonero, E.R.; Ruthes, A.C.; Freitas, C.S.; Utrilla, P.; Gálvez, J.; da Silva, E.V.; Sassaki, G.L.; Gorin, P.A.J.; Iacomini, M. Chemical and biological properties of a highly branched β-glucan from edible mushroom Pleurotus sajor-caju. Carbohydr. Polym. 2012, 90, 814–819. [Google Scholar]
  26. Li, X.J.; Jiang, J.Y.; Shi, S.S.; Li, Y.; Jiang, Y.B.; Ke, Y.; Wang, S.C. Anti-complementary activities of a (1→6) linked glucan from korean mondshood root and its sulfated derivatives. Chem. J. Chin. Univ. Chin. 2014, 35, 1423–1426. [Google Scholar]
  27. Cordeiro, L.M.; Reinhardt Vde, F.; Iacomini, M. Glucomannan and branched (1→3)(1→6) β-glucan from the aposymbiotically grown Physcia kalbii mycobiont. Phytochemistry 2012, 84, 88–93. [Google Scholar] [CrossRef] [PubMed]
  28. Li, B.; Dobruchowska, J.M.; Hoogenkamp, M.A.; Gerwig, G.J. Structural investigation of an extracellular polysaccharide produced by the cariogenic bacterium Streptococcus mutans strain ua159. Carbohydr. Polym. 2012, 90, 675–682. [Google Scholar] [CrossRef] [PubMed]
  29. Lammers, T.G. Revision of the infrageneric classification of Lobelia (Campanulaceae: Lobelioideae). Ann. MO. Bot. Gard. 2011, 98, 37–62. [Google Scholar] [CrossRef]
  30. Chi, A.P.; Chen, J.P.; Wang, Z.Z.; Xiong, Z.Y.; Li, Q.X. Morphological and structural characterization of a polysaccharide from Gynostemma pentaphyllum makino and its anti-exercise fatigue activity. Carbohydr. Polym. 2008, 74, 868–874. [Google Scholar] [CrossRef]
  31. Rudd, T.R.; Skidmore, M.A.; Guerrini, M.; Hricovini, M.; Powell, A.K.; Siligardi, G.; Yates, E.A. The conformation and structure of gags: Recent progress and perspectives. Curr. Opin. Struct. Biol. 2010, 20, 567–574. [Google Scholar] [CrossRef] [PubMed]
  32. Yang, L.Q.; Zhang, L.M. Chemical structural and chain conformational characterization of some bioactive polysaccharides isolated from natural sources. Carbohydr. Polym. 2009, 76, 349–361. [Google Scholar] [CrossRef]
  33. Brown, G.D.; Gordon, S. Immune recognition. A new receptor for β-glucans. Nature 2001, 413, 36–37. [Google Scholar] [CrossRef] [PubMed]
  34. Rappleye, C.A.; Eissenberg, L.G.; Goldman, W.E. Histoplasma capsulatum α-(1,3)-glucan blocks innate immune recognition by the β-glucan receptor. Proc. Natl. Acad. Sci. USA 2007, 104, 1366–1370. [Google Scholar] [CrossRef] [PubMed]
  35. Wang, J.; Yuan, Y.; Yue, T. Immunostimulatory activities of β-d-glucan from Ganoderma lucidum. Carbohydr. Polym. 2014, 102, 47–54. [Google Scholar] [CrossRef] [PubMed]
  36. Bittencourt, V.C.B.; Figueiredo, R.T.; da Silva, R.B.; Mourão-Sá, D.S.; Fernandez, P.L.; Sassaki, G.L.; Mulloy, B.; Bozza, M.T.; Barreto-Bergter, E. An α-glucan of Pseudallescheria boydii is involved in fungal phagocytosis and toll-like receptor activation. Int. J. Biol. Macromol. Chem. 2006, 281, 22614–22623. [Google Scholar] [CrossRef] [PubMed]
  37. Zhu, R.; Zhang, X.; Liu, W.; Zhou, Y.; Ding, R.; Yao, W.; Gao, X. Preparation and immunomodulating activities of a library of low-molecular-weight α-glucans. Carbohydr. Polym. 2014, 111, 744–752. [Google Scholar] [CrossRef] [PubMed]
  38. Dong, Q.; Yao, J.; Fang, J.N.; Ding, K. Structural characterization and immunological activity of two cold-water extractable polysaccharides from Cistanche deserticola y. C. Ma. Carbohydr. Res. 2007, 342, 1343–1349. [Google Scholar] [CrossRef] [PubMed]
  39. Wang, Y.; Shen, X.; Liao, W.; Fang, J.; Chen, X.; Dong, Q.; Ding, K. A heteropolysaccharide, l-fuco-d-manno-1,6-α-d-galactan extracted from Grifola frondosa and antiangiogenic activity of its sulfated derivative. Carbohydr. Polym. 2014, 101, 631–641. [Google Scholar] [CrossRef] [PubMed]
  40. Xing, X.H.; Cui, S.W.; Nie, S.P.; Phillips, G.O.; Goff, D.H.; Wang, Q. Study on Dendrobium officinale O-acetyl-glucomannan (Dendronan®): Part II. Fine structures of O-acetylated residues. Carbohydr. Polym. 2015, 117, 422–433. [Google Scholar] [CrossRef] [PubMed]
  41. Fan, H.W.; Liu, F.; Bligh, S.W.; Shi, S.S.; Wang, S.C. Structure of a homofructosan from Saussurea costus and anti-complementary activity of its sulfated derivatives. Carbohydr. Polym. 2014, 105, 152–160. [Google Scholar] [CrossRef] [PubMed]
  42. Liu, H.; Fan, Y.; Wang, W.; Liu, N.; Zhang, H.; Zhu, Z.; Liu, A. Polysaccharides from Lycium barbarum leaves: Isolation, characterization and splenocyte proliferation activity. Int. J. Biol. Macromol. 2012, 51, 417–422. [Google Scholar] [CrossRef] [PubMed]
  43. Parente, J.P.; Cardon, P.; Leroy, Y.; Montreuil, J.; Fournet, B.; Ricart, G. A convenient method for methylation of glycoprotein glycans in small amounts by using lithium methylsulfinyl carbanion. Carbohydr. Res. 1985, 141, 41–47. [Google Scholar] [CrossRef]
  44. Duan, J.; Chen, V.L.; Dong, Q.; Ding, K.; Fang, J. Chemical structure and immunoinhibitory activity of a pectic polysaccharide containing glucuronic acid from the leaves of Diospyros kaki. Int. J. Biol. Macromol. 2010, 46, 465–470. [Google Scholar] [CrossRef] [PubMed]
  45. Lin, X.; Wang, Z.J.; Sun, G.L.; Shen, L.; Xu, D.S.; Feng, Y. A sensitive and specific hpgpc-fd method for the study of pharmacokinetics and tissue distribution of Radix Ophiopogonis polysaccharide in rats. Biomed. Chromatogr. 2010, 24, 820–825. [Google Scholar] [CrossRef] [PubMed]
  • Sample Availability: Not available.
Figure 1. (A) The Q-Sepharose column chromatography of crude polysaccharide extracted from Lobelia chinensis; (B) gel filtration chromatography of the major fraction (0.2 NaCl elution) on Superdex 75; (C) homogeneity of BP1 as measured by high performance gel permeation chromatography (HPGPC); (D) monosaccharide composition of BP1 (upper: reference standards; lower: BP1).
Molecules 21 00779 g001
Figure 2. 1D-NMR spectra of BP1. (A) 1H-NMR; (B) 13C-NMR; (C) DEPT135-NMR and (D) 13C-NMR of BP1a. The signals highlighted in red indicate the changes of C1, C3 of 3α-d-Glcp1 and C4 of 4α-d-Glcp1 caused by partial acid hydrolysis.
Molecules 21 00779 g002
Figure 3. HMBC spectra of BP1: The inter-residue 1H-13C long-range correlations used for linkage and sequence assignments are listed in Table 3.
Molecules 21 00779 g003
Figure 4. NOESY spectrum of BP1. NOE correlations are labelled with residue and proton/carbon numbers, as listed in Table 4.
Molecules 21 00779 g004
Figure 5. 2D-NMR spectrum of BP1. (A) 1H-1H COSY spectra of BP1; (B) HSQC spectra of BP1. The cross-peaks are labelled with the residue and number; residue names are the same as those in Table 2.
Molecules 21 00779 g005
Figure 6. The proposed chemical structure of BP1. (A) 6α-d-Glcp1; (B) 3,6α-d-Glcp1; (C) 4α-d-Glcp1; (D) 3α-d-Glcp1; (E) α-d-Glcp1. The symbols of x, y and z were used to express the number of 6α-d-Glcp1.
Molecules 21 00779 g006
Figure 7. Immunomodulating effects of BP1. (A) Dose-dependent induction of the proliferation of RAW 264.7 cells; (B) dose-dependent effect on the production of NO by RAW 264.7 cells in vitro; (C) induction of RAW 264.7 cell TNF-α secretion in vitro, and the role of TLR4 in this bioactivity; (D) Induction of RAW 264.7 cell IL-6 secretion in vitro, and the role of TLR4 in this bioactivity. LPS (2 µg/mL) and LPS + polymyxin B (PolyB) served as the positive control and endotoxin-excluded control, respectively. Each value is expressed as the mean ± SD (n = 3). Level of significance: ** p < 0.01; *** p < 0.001 compared to untreated cells (at 0 µg/mL).
Molecules 21 00779 g007
Figure 8. Inducing the effect of BP1 on the phagocytosis to FITC-labeled dextran (12 kDa) by RAW 264.7 cells in a dose-dependent manner. LPS (2 µg/mL) and LPS + polymyxin B served as the positive control and endotoxin-excluded control, respectively. Each value is expressed as the mean ± SD (n = 3). Level of significance: * p < 0.05, ** p < 0.01 compared to untreated cells (at 0 µg/mL).
Molecules 21 00779 g008
Table 1. Linkages and individual molar ratios of BP1 elucidated by methylation analysis.
Methylation SugarsLinkagesRetention Time (min)Molar RatioMain Mass Fragment (m/z *, Intensity %)
2,3,4,6-Me4-GlcpGlc-128.3582.0143 (100), 71 (20), 87 (25), 101 (65), 117 (50), 129 (48), 145 (40), 161 (45), 205 (10)
2,3,4-Me3-GlcpGlc-1,636.0615.9743 (100), 71 (15), 87 (33), 99 (40), 101 (52), 117 (55), 129 (37), 161 (15), 173 (5), 189 (10), 233 (10)
2,3,6-Me3-GlcpGlc-1,434.5392.0343 (100), 71 (5), 87 (18), 99 (15), 101 (20), 113 (15), 117 (45), 129 (5), 161 (3), 233 (20)
2,4,6-Me3-GlcpGlc-1,333.8620.9943 (100), 71 (16), 87 (25), 99 (15), 101 (38), 113 (5), 117 (85), 129 (70), 161 (30), 173 (5), 233 (10)
2,4-Me2-GlcpGlc-1,3,642.2312.0143 (100), 71 (5), 87 (25), 99 (10), 101 (5), 117 (32), 129 (45), 189 (15), 233 (5)
* The symbol m stands for mass and z stands for the charge number of ions. m/z represents mass divided by charge number.
Table 2. Signal assignments of the 1H- and 13C-NMR spectra of BP1 based on the analysis of H-HCOSY, HSQC and HMBC spectra [21,22,23,24].
Glycosyl ResiduesC1C2C3C4C5C6
H1H2H3H4H5H6aH6b
A: 6α-d-Glcp199.073.174.370.8 71.466.8
4.85~4.903.44~3.483.60~3.643.40~3.433.80~3.833.64~3.663.86~3.90
B: 3,6α-d-Glcp198.972.481.774.170.666.6
4.88~4.913.54~3.593.73~3.773.89~3.933.33~3.373.58~3.673.86~3.90
C: 4α-d-Glcp1101.071.474.678.071.661.8
5.29~5.323.52~3.543.84~3.883.55~3.583.73~3.773.67~3.693.73~3.75
D: 3α-d-Glcp1100.872.482.371.474.361.8
5.28~5.303.49~3.503.73~3.773.36~3.383.62~3.663.67~3.693.73~3.75
E: α-d-Glcp1100.672.771.473.971.561.6
5.22~5.263.44~3.484.09~4.123.89~3.923.34~3.383.67~3.693.73~3.75
Table 3. The significant 3JH,C correlations observed in the HMBC spectrum of BP1.
No.Glycosyl ResiduesAtomResidueδCAtomResidueδH
A6α-d-Glcp1AH1AC3 a74.6AC1AH23.44~3.48
4.88AH1AC5 a71.4AC1AH6a3.64~3.66
AH1AC666.8AC1BH6a b3.56~3.61
AH1BC381.7AC1CC33.84~3.88
AH1BC6 b66.6
AH1CC271.4
AH1CC374.6
B3,6α-d-Glcp1BH1AC273.1BC1AH6a c3.64~3.66
4.87BH1AC470.8BC1BH6a3.56~3.61
BH1AC6 c66.8
BH1BC3 a81.7
BH1BC5 a70.6
BH1BC666.6
C4α-d-Glcp1CH1BC272.4CC1DH3 d3.73~3.77
5.31CH1BC3 e74.6CC1BH3 e3.73~3.77
CH1DC272.4CC1CH43.57~3.58
CH1CC478.0
D3α-d-Glcp1DH1BC272.4DC1CH4 f3.57~3.58
5.29DH1CC374.6
DH1DC272.4
DH1CC4 f78.0
Eα-d-Glcp1EH1BC474.1EC1BH3 g3.73~3.77
a For the presence of α-configurations; b For →6α-d-Glcp16,3α-d-Glcp1→; c For →6,3α-d-Glcp16α-d-Glcp1; d For →4α-d-Glcp13α-d-Glcp1→; e For →4α-d-Glcp13,6α-d-Glcp1→; f For →3α-d-Glcp14α-d-Glcp1→; g For α-d-Glcp13,6α-d-Glcp1→.
Table 4. Assignment of the NOESY spectra of BP1.
Anomeric ProtonNOE Contact ProtonδHGlycosyl Residue
AH1AH23.44~3.48
AH53.80~3.83
AH6a3.64~3.66
AH6b3.88~3.90
BH6a3.59~3.616α-d-Glcp16,3α-d-Glcp1
BH6b3.88~3.906α-d-Glcp16,3α-d-Glcp1
CH43.57~3.586α-d-Glcp14α-d-Glcp1
BH1BH23.54~3.59
BH33.73~3.77
CH1CH23.52~3.54
CH33.73~3.77
BH33.73~3.77
DH1CH43.57~3.583α-d-Glcp14α-d-Glcp1
DH1CH33.84~3.88
EH1BH33.73~3.77α-d-Glcp13,6α-d-Glcp1
AH23.44~3.48
AH33.60~3.64
AH6a3.64~3.66α-d-Glcp16α-d-Glcp1
AH6b3.88~3.90α-d-Glcp16α-d-Glcp1

