
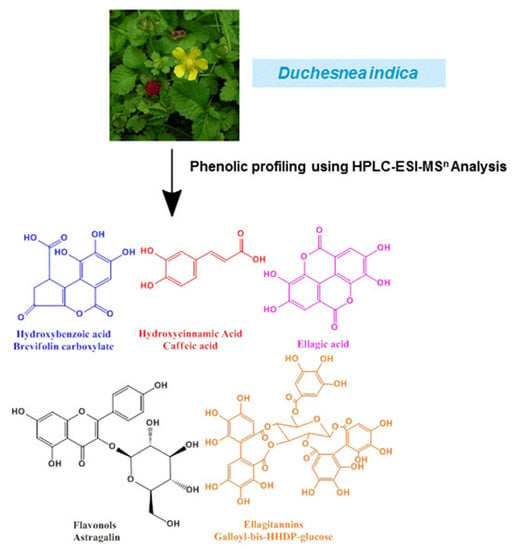
Phenolic Profiling of Duchesnea indica Combining Macroporous Resin Chromatography (MRC) with HPLC-ESI-MS/MS and ESI-IT-MS

Abstract
:
1. Introduction
2. Results and Discussion
2.1. Identification of Phenolic Compounds in D. indica


| Peak | tR (min) a | [M − H]− (m/z) | MS/MS Ions (m/z) | MS3 Ions (m/z) | Compounds | Contents (mg/100 g DW) |
|---|---|---|---|---|---|---|
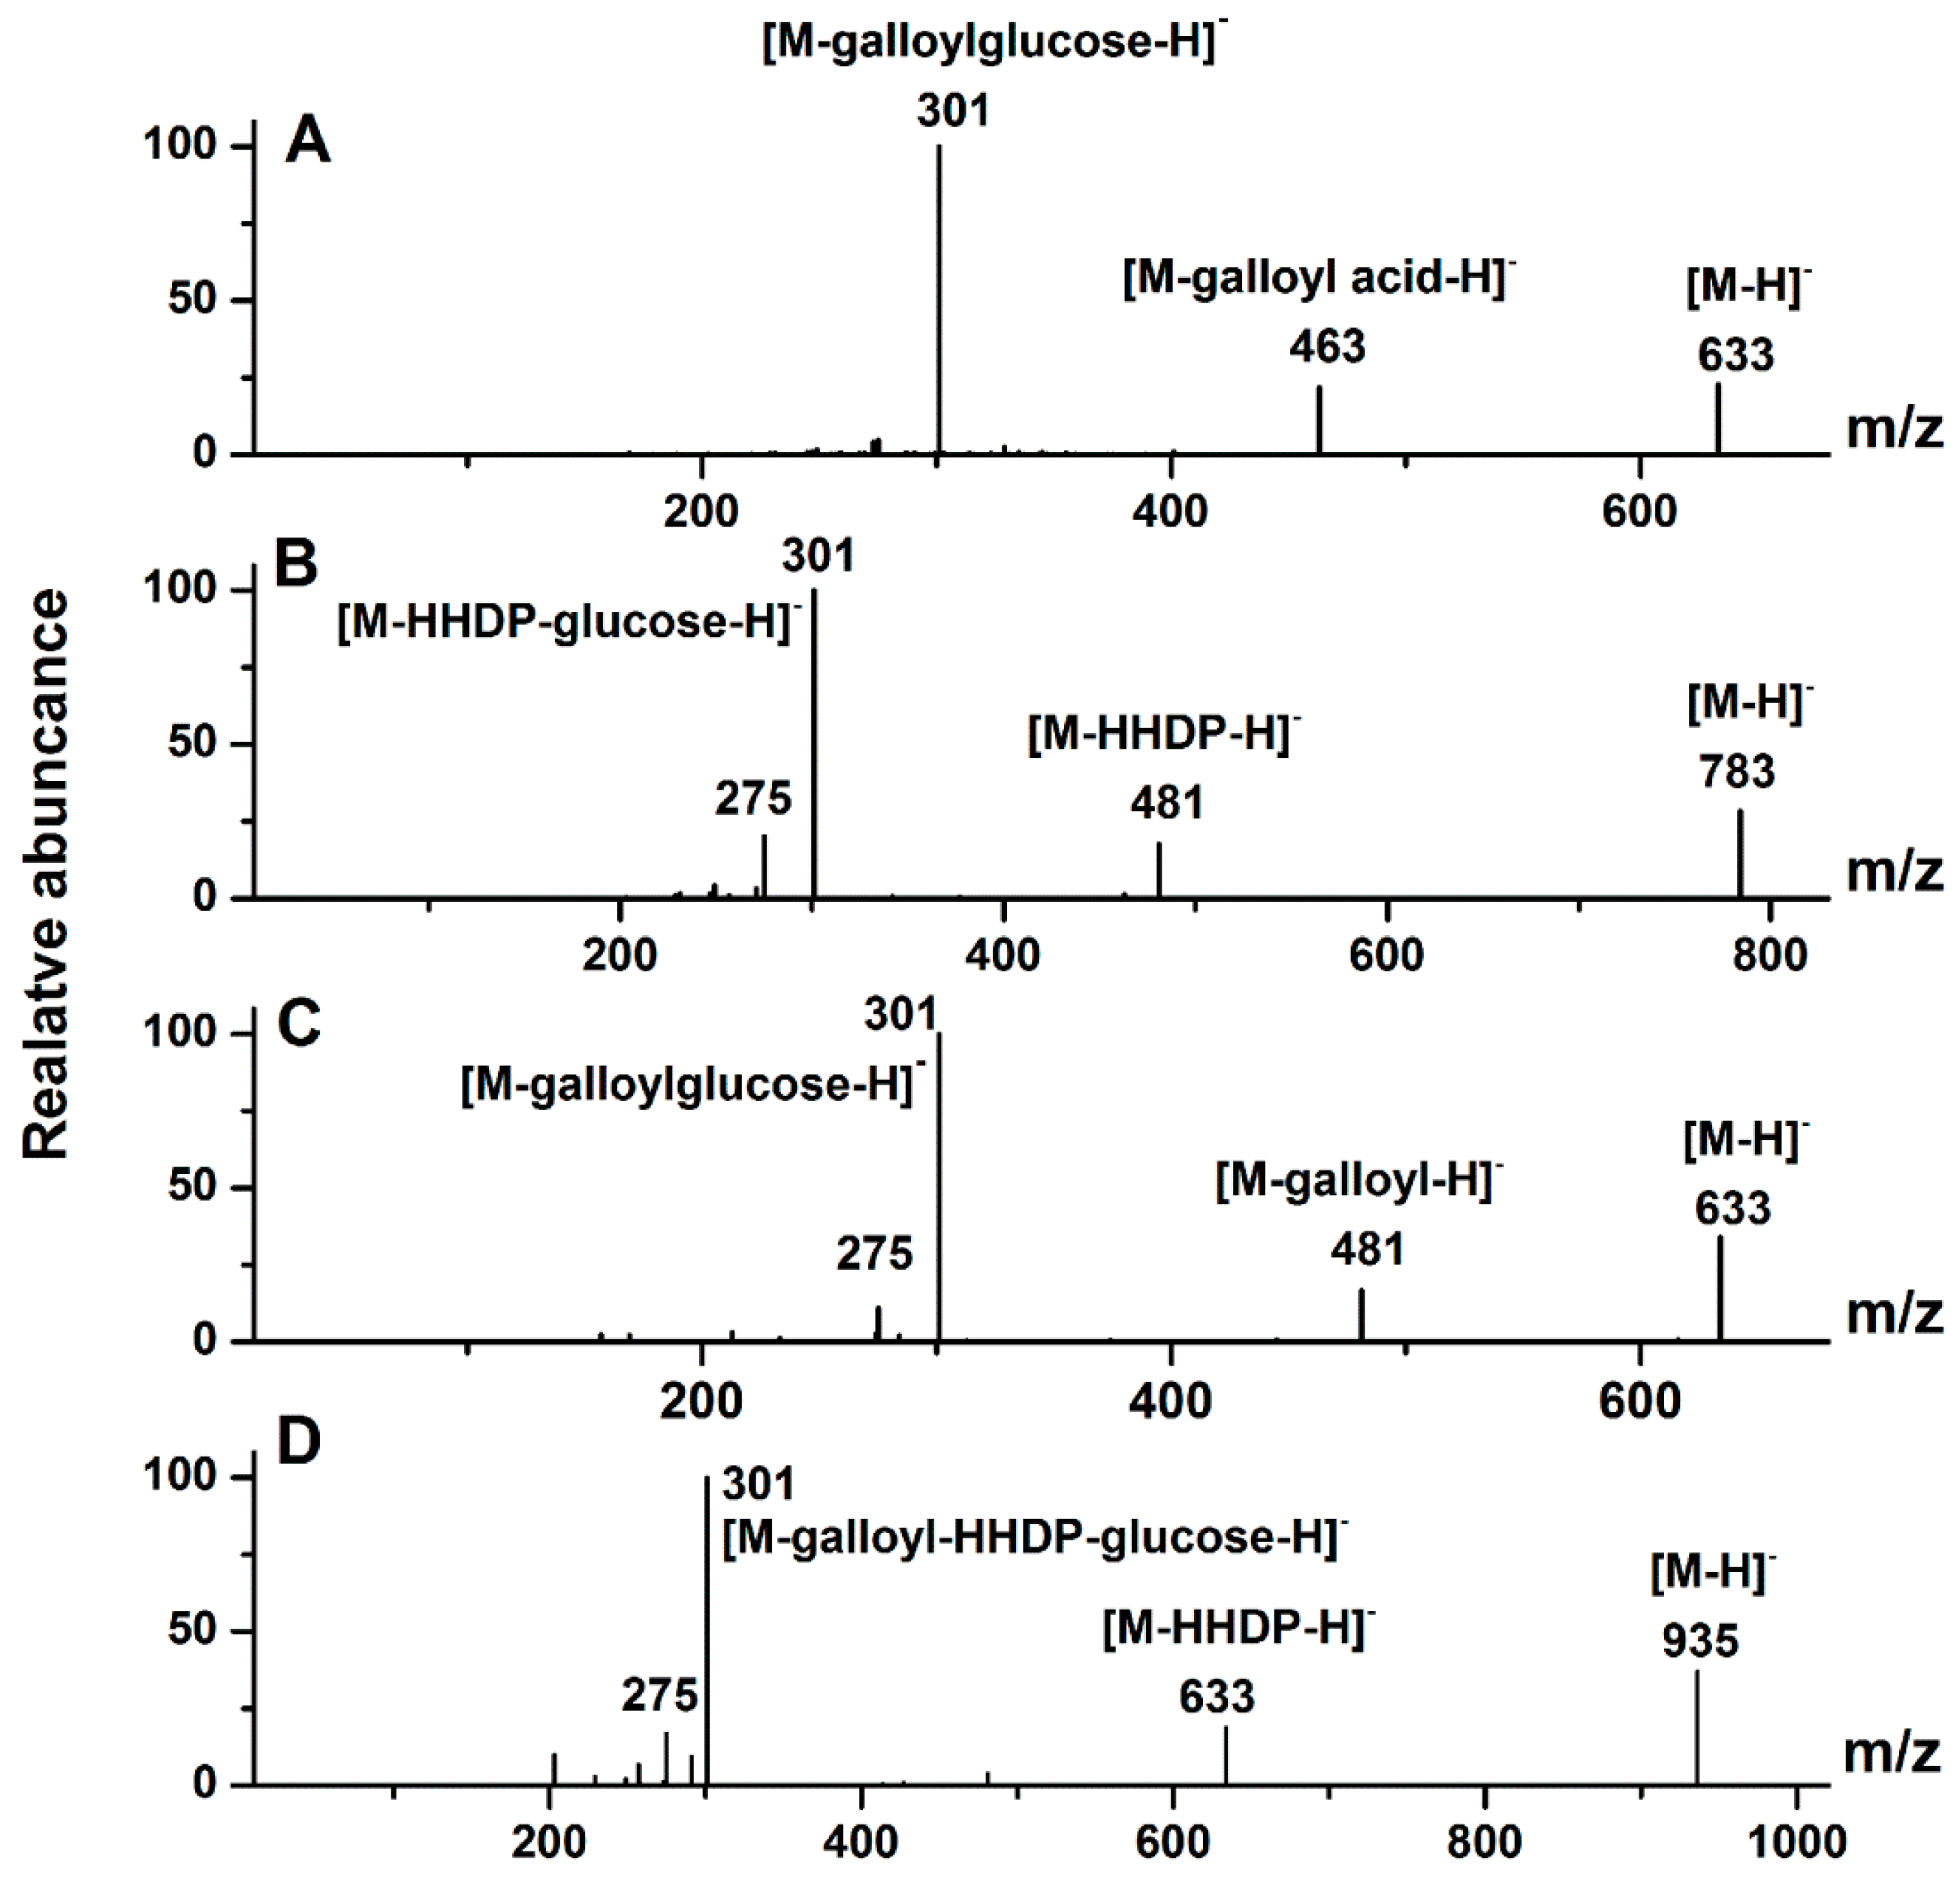
| 1 | 12.1 | 783 | 481, 301 b | 257, 229, 185 | bis-HHDP-glucose c | 29.10 |
| 2 | 15.8 | 783 | 481, 301 b | 257, 229, 185 | bis-HHDP-glucose c | 33.85 |
| 3 | 17.1 | 783 | 481, 301 b | 257, 229, 185 | bis-HHDP-glucose c | 15.90 |
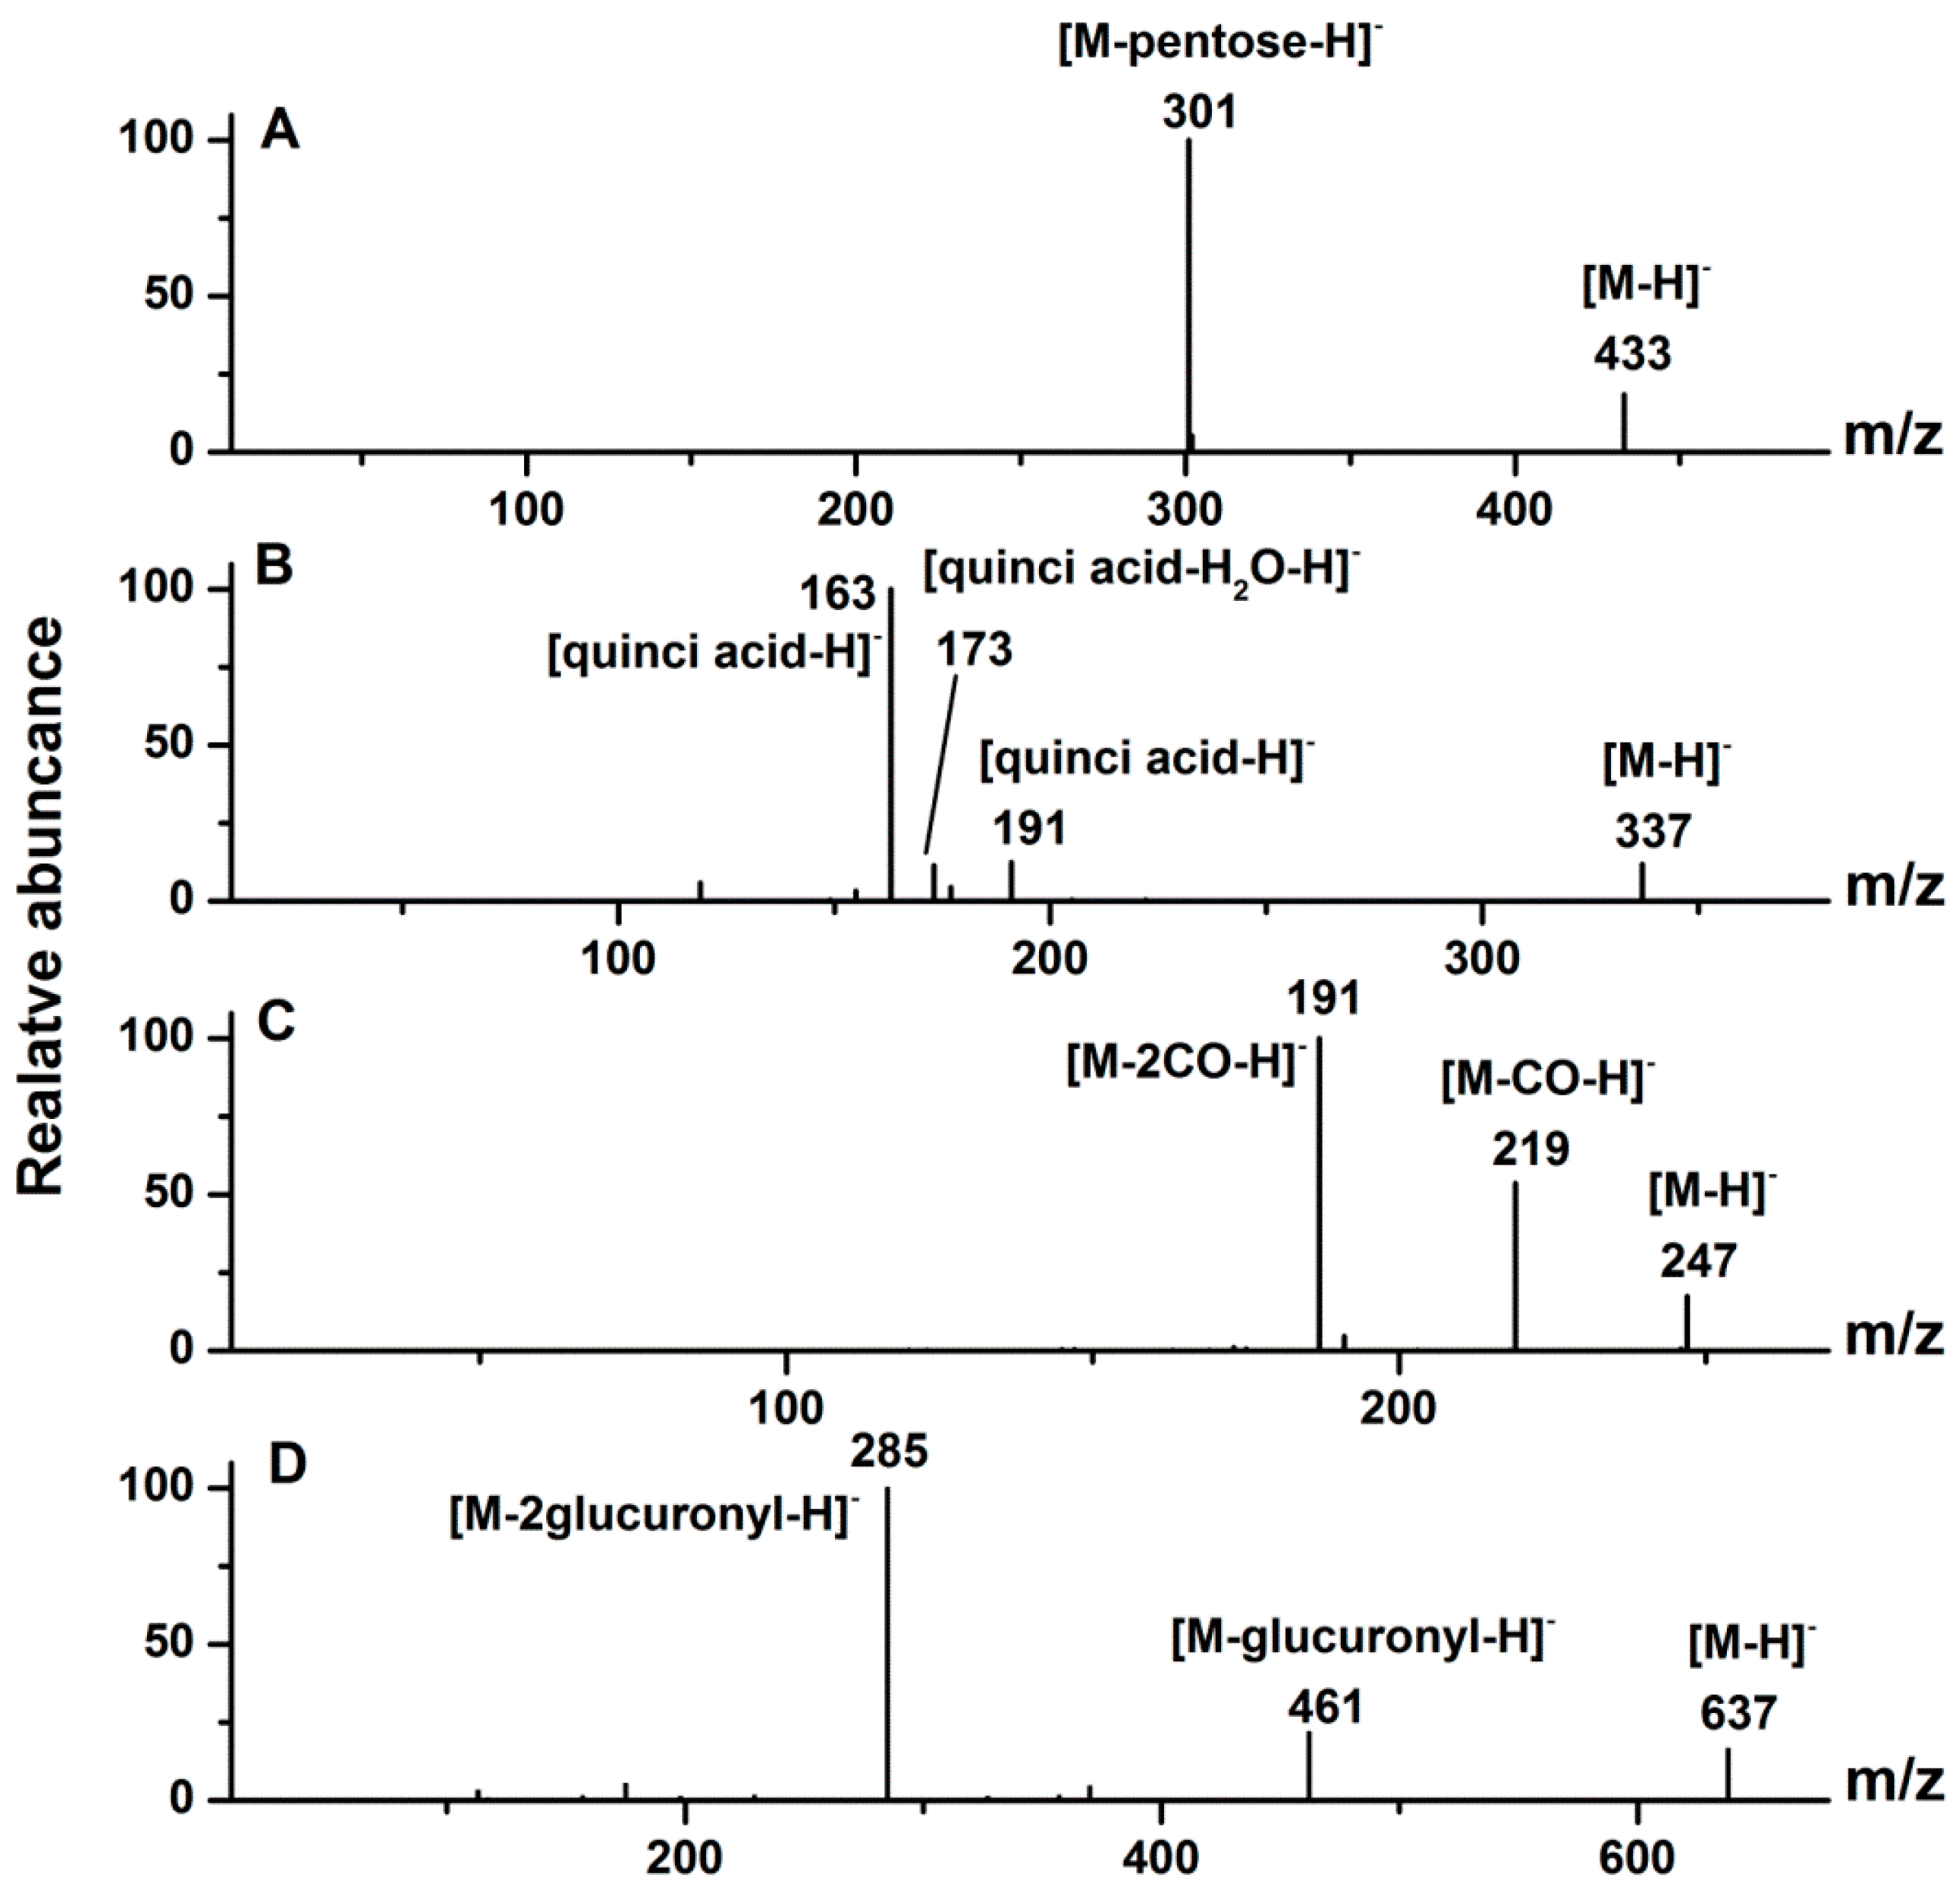
| 4 | 18.8 | 337 | 191, 173, 163, 155 | p-coumaroyl quinic acid c | 15.97 | |
| 5 | 20.8 | 633 | 481, 301 b | 257, 229, 185 | galloyl-HHDP-glucose c | 25.33 |
| 6 | 22.8 | 291 | 247, 219, 191 | brevifolin carboxylate d | 71.36 | |
| 7 | 24.2 | 179 | 135, 134 | caffeic acid d | 14.74 | |
| 8 | 26.2 | 297 | 179, 161, 135, 117 | caffeic acid derivate c | 17.64 | |
| 9 | 26.9 | 637 | 461, 285 b | 93 | kaempferol O-diglucuronide c | 15.04 |
| 10 | 28.2 | 337 | 191, 173, 163, 155 | p-coumaroyl quinic acid c | 14.74 | |
| 11 | 29.7 | 783 | 633, 481, 301 b | 257, 229, 185 | bis-HHDP-glucose c | 13.20 |
| 12 | 30.5 | 783 | 633, 481, 301 b | 257, 229, 185 | bis-HHDP-glucose c | 11.93 |
| 13 | 32.3 | 247 | 219, 191 | Brevifolin c | 21.71 | |
| 14 | 33.6 | 935 | 633, 301 b | 257, 229, 185 | galloyl-bis-HHDP-glucose c | 16.17 |
| 15 | 34.4 | 305 | 273, 245, 229 | methyl brevifolin carboxylate | 43.56 | |
| 16 | 35.5 | 563 | 503, 473, 383, 353 | apigenin 6-C-arabinosyl-8-C-glucoside (isoschaftoside) d | 10.13 | |
| 17 | 36.3 | 783 | 633, 481, 301 b | 257, 229, 185 | bis-HHDP-glucose c | 26.24 |
| 18 | 37.7 | 783 | 633, 481, 301 b | 257, 229, 185 | bis-HHDP-glucose c | 14.87 |
| 19 | 40.6 | 433 | 301 b | 257, 229, 185 | ellagic acid pentoside c | 11.18 |
| 20 | 42.5 | 433 | 301 b | 257, 229, 185 | ellagic acid pentoside c | 12.64 |
| 21 | 43.8 | 301 | 257, 229, 185 | ellagic acid d | 6.69 | |
| 22 | 45.4 | 935 | 633, 301 b | 257, 229, 185 | galloyl-bis-HHDP-glucose c | 48.89 |
| 23 | 47.2 | 935 | 633, 301 b | 257, 229, 185 | galloyl-bis-HHDP-glucose c | 17.50 |
| 24 | 48.6 | 477 | 301 b, 179, 151 | 179 151 | quercetin O-glucuronide c | 10.06 |
| 25 | 53.9 | 593 | 285 b | 93 | kaempferol O-robinobioside c | 12.15 |
| 26 | 56.7 | 447 | 284, 255 b, 227 | 93 | kaempferol 3-O-glucoside (astragalin) d | 17.55 |
| 27 | 57.6 | 461 | 285 b | 93 | kaempferol O-glucuronide c | 25.45 |
| Total ellagitannins | 252.98 | |||||
| Total ellagic acid and ellagic acid glycosides | 30.52 | |||||
| Total hydroxybenzoic acid and hydroxycinnamic acid derivatives | 199.73 | |||||
| Total flavonols | 90.39 | |||||
2.1.1. Ellagitannins

2.1.2. Ellagic Acid and Ellagic Acid Glycosides

2.1.3. Hydroxybenzoic Acid and Hydroxycinnamic Acid Derivatives
2.1.4. Flavonols
2.2. Quantification of Phenolic Compounds in D. indica
| Compounds | Liner Equation (μg/mL) | R2 | Linear Range (μg/mL) | LOD a (μg/mL) | LOQ b (μg/mL) |
|---|---|---|---|---|---|
| Caffeic acid | y = 8.56x − 34.67 | 0.9997 | 0.94–588 | 0.17 | 0.57 |
| Apigenin 6-C-arabinosyl-8-C-glucoside | y = 16.38x − 37.08 | 0.9998 | 0.69–430 | 0.07 | 0.24 |
| Ellagic acid | y = 14.53x − 25.08 | 0.9982 | 0.90–560 | 2.24 | 7.47 |
| Corilagin | y = 17.91x − 59.47 | 0.9997 | 0.82–510 | 0.19 | 0.65 |
| Kaempferol 3-O-glucoside | y = 21.39x − 59.04 | 0.9998 | 0.80–500 | 0.06 | 0.21 |
3. Materials and Methods
3.1. Chemicals and Materials
3.2. Extraction and Fractionation of Extracts from D. indica
3.3. HPLC-UV Analysis of Phenolic Compounds
3.4. Identification of Phenolic Compounds
3.4.1. ESI-MS/MS analysis
3.4.2. ESI-IT-MS analysis
3.5. Quantification of Phenolic Compounds
4. Conclusions
Acknowledgments
Author Contributions
Conflicts of Interest
References
- Littschwager, J.; Lauerer, M.; Blagodatskaya, E.; Kuzyakov, Y. Nitrogen uptake and utilisation as a competition factor between invasive Duchesnea indica and native Fragaria vesca. Plant Soil 2010, 331, 105–114. [Google Scholar] [CrossRef]
- Rossell, C.R.; Patch, S.; Salmons, S. Effects of deer browsing on native and non-native vegetation in a mixed oak-beech forest on the Atlantic coastal plain. Northeast. Nat. 2007, 14, 61–72. [Google Scholar] [CrossRef]
- Peng, B.; Chang, Q.; Wang, L.; Hu, Q.; Wang, Y.; Tang, J.; Liu, X. Suppression of human ovarian SKOV-3 cancer cell growth by Duchesnea phenolic fraction is associated with cell cycle arrest and apoptosis. Gynecol. Oncol. 2008, 108, 173–181. [Google Scholar] [CrossRef] [PubMed]
- Lee, I.R.; Yang, M.Y. Phenolic compounds from Duchesnea chrysantha and their cytotoxic activities in human cancer cell. Arch. Pharm. Res. 1994, 17, 476–479. [Google Scholar] [CrossRef] [PubMed]
- Peng, B.; Hu, Q.; Sun, L.H.; Chen, Y.; Liu, X.M.; Li, J.R.; Chang, Q.; Wang, L.W.; Tang, J.T. Duchesnea phenolic fraction inhibits tumor growth through restoring the Th1/Th2 balance in U14 cervical cancer bearing mice. Chin. Med. 2012, 3, 42–45. [Google Scholar] [CrossRef]
- Kim, J.M.; Jang, D.S.; Lee, Y.M.; Yoo, J.L.; Kim, Y.S.; Kim, J.H.; Kim, J.S. Aldose-reductase- and protein-glycation-inhibitory principles from the whole plant of Duchesnea chrysantha. Chem. Biodivers. 2008, 5, 352–356. [Google Scholar] [CrossRef] [PubMed]
- Peng, B.; Hu, Q.; Liu, X.M.; Wang, L.W.; Chang, Q.; Li, J.R.; Tang, J.T.; Wang, N.; Wang, Y.Q. Duchesnea phenolic fraction inhibits in vitro and in vivo growth of cervical cancer through induction of apoptosis and cell cycle arrest. Exp. Biol. Med. 2009, 234, 74–83. [Google Scholar] [CrossRef] [PubMed]
- Kim, K.C.; Kim, J.K.; Son, J.K.; Kim, I.G. Enhanced induction of mitochondrial damage and apoptosis in human leukemia HL-60 cells by the Ganoderma lucidum and Duchesnea chrysantha extracts. Cancer Lett. 2007, 246, 210–217. [Google Scholar] [CrossRef] [PubMed]
- Hu, W.C.; Han, W.; Huang, C.Q.; Wang, M.H. Protective effect of the methanolic extract from Duchesnea indica against oxidative stress in vitro and in vivo. Environ. Toxicol. Pharmacol. 2011, 31, 42–50. [Google Scholar] [CrossRef] [PubMed]
- Ang, H.Y.; Subramani, T.; Yeap, S.K.; Omar, A.R.; Ho, W.Y.; Abdullah, M.P.; Alitheen, N.B. Immunomodulatory effects of Potentilla indica and Dendrophthoe pentandra on mice splenocytes and thymocytes. Exp. Ther. Med. 2014, 7, 1733–1737. [Google Scholar] [CrossRef] [PubMed]
- Yang, E.J.; Lee, J.S.; Yun, C.Y.; Kim, J.H.; Kim, J.S.; Kim, D.H.; Kim, I.S. Inhibitory effects of Duchesnea chrysantha extract on ovalbumin-induced lung inflammation in a mouse model of asthma. J. Ethnopharmacol. 2008, 118, 102–107. [Google Scholar] [CrossRef] [PubMed]
- Lee, J.S.; Kim, I.S.; Ryu, J.S.; Kim, J.H.; Kim, J.S.; Kim, D.H.; Yun, C.Y. The inhibitory effect of Duchesnea chrysantha extract on the development of atopic dermatitis-like lesions by regulating IgE and cytokine production in Nc/Nga mice. Phytother. Res. 2012, 26, 284–290. [Google Scholar] [CrossRef] [PubMed]
- Martins, S.; Mussatto, S.I.; Martinez-Avila, G.; Montanez-Saenz, J.; Aguilar, C.N.; Teixeira, J.A. Bioactive phenolic compounds: Production and extraction by solid-state fermentation. A review. Biotechnol. Adv. 2011, 29, 365–373. [Google Scholar] [CrossRef] [PubMed] [Green Version]
- Soto-Vaca, A.; Gutierrez, A.; Losso, J.N.; Xu, Z.M.; Finley, J.W. Evolution of phenolic compounds from color and flavor problems to health benefits. J. Agric. Food Chem. 2012, 60, 6658–6677. [Google Scholar] [CrossRef] [PubMed]
- Berdowska, I.; Zielinski, B.; Fecka, I.; Kulbacka, J.; Saczko, J.; Gamian, A. Cytotoxic impact of phenolics from Lamiaceae species on human breast cancer cells. Food Chem. 2013, 141, 1313–1321. [Google Scholar] [CrossRef] [PubMed]
- Asgar, M.A. Anti-diabetic potential of phenolic compounds: A review. Int. J. Food Prop. 2013, 16, 91–103. [Google Scholar] [CrossRef]
- Perez-Jimenez, J.; Serrano, J.; Tabernero, M.; Arranz, S.; Diaz-Rubio, M.E.; Garcia-Diz, L.; Goni, I.; Saura-Calixto, F. Effects of grape antioxidant dietary fiber in cardiovascular disease risk factors. Nutrition 2008, 24, 646–653. [Google Scholar] [CrossRef] [PubMed]
- Balasundram, N.; Sundram, K.; Samman, S. Phenolic compounds in plants and agri-industrial by-products: Antioxidant activity, occurrence, and potential uses. Food Chem. 2006, 99, 191–203. [Google Scholar] [CrossRef]
- Medeiros, K.C.P.; Figueiredo, C.A.V.; Figueredo, T.B.; Freire, K.R.L.; Santos, F.A.R.; Alcantara-Neves, N.M.; Silva, T.M.S.; Piuvezam, M.R. Anti-allergic effect of bee pollen phenolic extract and myricetin in ovalbumin-sensitized mice. J. Ethnopharmacol. 2008, 119, 41–46. [Google Scholar] [CrossRef] [PubMed]
- Hsu, C.L.; Fang, S.C.; Yen, G.C. Anti-inflammatory effects of phenolic compounds isolated from the flowers of Nymphaea mexicana Zucc. Food Funct. 2013, 4, 1216–1222. [Google Scholar] [CrossRef] [PubMed]
- Alves, M.J.; Ferreira, I.C.F.R.; Froufe, H.J.C.; Abreu, R.M.V.; Martins, A.; Pintado, M. Antimicrobial activity of phenolic compounds identified in wild mushrooms, SAR analysis and docking studies. J. Appl. Microbiol. 2013, 115, 346–357. [Google Scholar] [CrossRef] [PubMed]
- Pimenta, L.P.; Kim, H.K.; Verpoorte, R.; Choi, Y.H. NMR-based metabolomics: A probe to utilize biodiversity. Methods Mol. Biol. 2013, 1055, 117–127. [Google Scholar] [PubMed]
- Li, P.; Qi, L.W.; Liu, E.H.; Zhou, J.L.; Wen, X.D. Analysis of Chinese herbal medicines with holistic approaches and integrated evaluation models. TrAc Trend Anal. Chem. 2008, 27, 66–77. [Google Scholar] [CrossRef]
- Zhang, Y.; Guo, L.; Duan, L.; Dong, X.; Zhou, P.; Liu, E.H.; Li, P. Simultaneous determination of 16 phenolic constituents in Spatholobi Caulis by high performance liquid chromatography/electrospray ionization triple quadrupole mass spectrometry. J. Pharm. Biomed. Anal. 2015, 102, 110–118. [Google Scholar] [CrossRef] [PubMed]
- Kajdzanoska, M.; Gjamovski, V.; Stefova, M. HPLC-DAD-ESI-MSn identification of phenolic compounds in cultivated strawberries from Macedonia. Maced. J. Chem. Chem. Eng. 2010, 29, 181–194. [Google Scholar]
- Teixeira, L.D.L.; Bertoldi, F.C.; Lajolo, F.M.; Hassimotto, N.M.A. Identification of ellagitannins and flavonoids from Eugenia brasilienses lam. (Grumixama) by HPLC-ESI-MS/MS. J. Agric. Food Chem. 2015, 63, 5417–5427. [Google Scholar] [CrossRef] [PubMed]
- Engström, M.T.; Pälijärvi, M.; Salminen, J.P. Rapid fingerprint analysis of plant extracts for ellagitannins, gallic acid, and quinic acid derivatives and quercetin-, kaempferol- and myricetin-based flavonol glycosides by UPLC-QqQ-MS/MS. J. Agric. Food Chem. 2015, 63, 4068–4079. [Google Scholar] [CrossRef] [PubMed]
- Aaby, K.; Ekeberg, D.; Skrede, G. Characterization of phenolic compounds in strawberry (Fragaria × ananassa) fruits by different HPLC detectors and contribution of individual compounds to total antioxidant capacity. J. Agric. Food Chem. 2007, 55, 4395–4406. [Google Scholar] [CrossRef] [PubMed]
- Seeram, N.P.; Lee, R.; Scheuller, H.S.; Heber, D. Identification of phenolic compounds in strawberries by liquid chromatography electrospray ionization mass spectroscopy. Food Chem. 2006, 97, 1–11. [Google Scholar] [CrossRef]
- Mullen, W.; Yokota, T.; Lean, M.E.; Crozier, A. Analysis of ellagitannins and conjugates of ellagic acid and quercetin in raspberry fruits by LC-MSn. Phytochemistry 2003, 64, 617–624. [Google Scholar] [CrossRef]
- Simirgiotis, M.J.; Schmeda-Hirschmann, G. Determination of phenolic composition and antioxidant activity in fruits, rhizomes and leaves of the white strawberry (Fragaria chiloensis spp. chiloensis form chiloensis) using HPLC-DAD-ESI-MS and free radical quenching techniques. J. Food Compos. Anal. 2010, 23, 545–553. [Google Scholar] [CrossRef]
- Mena, P.; Calani, L.; Dall’Asta, C.; Galaverna, G.; Garcia-Viguera, C.; Bruni, R.; Crozier, A.; del Rio, D. Rapid and comprehensive evaluation of (poly)phenolic compounds in pomegranate (Punica granatum L.) juice by UHPLC-MSn. Molecules 2012, 17, 14821–14840. [Google Scholar] [CrossRef] [PubMed]
- Regueiro, J.; Sanchez-Gonzalez, C.; Vallverdu-Queralt, A.; Simal-Gandara, J.; Lamuela-Raventos, R.; Izquierdo-Pulido, M. Comprehensive identification of walnut polyphenols by liquid chromatography coupled to linear ion trap-Orbitrap mass spectrometry. Food Chem. 2014, 152, 340–348. [Google Scholar] [CrossRef] [PubMed]
- Salminen, J.P.; Ossipov, V.; Loponen, J.; Haukioja, E.; Pihlaja, K. Characterisation of hydrolysable tannins from leaves of Betula pubescens by high-performance liquid chromatography-mass spectrometry. J. Chromatogr. A 1999, 864, 283–291. [Google Scholar] [CrossRef]
- Maatta-Riihinen, K.R.; Kamal-Eldin, A.; Torronen, A.R. Identification and quantification of phenolic compounds in berries of fragaria and rubus species (family rosaceae). J. Agric. Food Chem. 2004, 52, 6178–6187. [Google Scholar] [CrossRef] [PubMed]
- Lee, J.H.; Johnson, J.V.; Talcottt, S.T. Identification of ellagic acid conjugates and other polyphenolics in muscadine grapes by HPLC-ESI-MS. J. Agric. Food Chem. 2005, 53, 6003–6010. [Google Scholar] [CrossRef] [PubMed]
- Barros, L.; Duenas, M.; Carvalho, A.M.; Ferreira, I.C.; Santos-Buelga, C. Characterization of phenolic compounds in flowers of wild medicinal plants from Northeastern Portugal. Food Chem. Toxicol. 2012, 50, 1576–1582. [Google Scholar] [CrossRef] [PubMed]
- Rodrigues, S.; Calhelha, R.C.; Barreira, J.C.M.; Duenas, M.; Carvalho, A.M.; Abreu, R.M.V.; Santos-Buelga, C.; Ferreira, I.C.F.R. Crataegus monogyna buds and fruits phenolic extracts: Growth inhibitory activity on human tumor cell lines and chemical characterization by HPLC-DAD-ESI/MS. Food Res. Int. 2012, 49, 516–523. [Google Scholar] [CrossRef]
- Li, W.K.; Sun, Y.K.; Liang, W.Z.; Fitzloff, J.F.; van Breemen, R.B. Identification of caffeic acid derivatives in Actea racemosa (Cimicifuga racemosa, black cohosh) by liquid chromatography/tandem mass spectrometry. Rapid Commun. Mass Spectrom. 2003, 17, 978–982. [Google Scholar] [CrossRef] [PubMed]
- Parveen, I.; Winters, A.; Threadgill, M.D.; Hauck, B.; Morris, P. Extraction, structural characterisation and evaluation of hydroxycinnamate esters of orchard grass (Dactylis glomerata) as substrates for polyphenol oxidase. Phytochemistry 2008, 69, 2799–2806. [Google Scholar] [CrossRef] [PubMed]
- Wu, H.Y.; Lin, T.K.; Kuo, H.M.; Huang, Y.L.; Liou, C.W.; Wang, P.W.; Chuang, J.H.; Huang, S.T. Phyllanthus urinaria induces apoptosis in human osteosarcoma 143B cells via activation of fas/fasl- and mitochondria-mediated pathways. Evid. Based Completment. Altern. Med. 2012. [Google Scholar] [CrossRef] [PubMed]
- Xu, W.D.; Lin, H.W.; Qiu, F.; Chen, W.S. Chemical constituents of Duchesnea indica focke. J. Shenyang Pharm. Univ. 2007, 24, 402–406. [Google Scholar]
- Ye, L.H.; He, X.X.; Yan, M.Z.; Chang, Q. Identification of in vivo components in rats after oral administration of lotus leaf flavonoids using ultra fast liquid chromatography with tandem mass spectrometry. Anal. Methods 2014, 6, 6088–6094. [Google Scholar] [CrossRef]
- Chen, S.; Fang, L.C.; Xi, H.F.; Guan, L.; Fang, J.B.; Liu, Y.L.; Wu, B.H.; Li, S.H. Simultaneous qualitative assessment and quantitative analysis of flavonoids in various tissues of lotus (Nelumbo nucifera) using high performance liquid chromatography coupled with triple quad mass spectrometry. Anal. Chim. Acta 2012, 724, 127–135. [Google Scholar] [CrossRef] [PubMed]
- Ferreres, F.; Silva, B.M.; Andrade, P.B.; Seabra, R.M.; Ferreira, M.A. Approach to the study of C-glycosyl flavones by ion trap HPLC-PAD-ESI/MS/MS: Application to seeds of quince (Cydonia oblonga). Phytochem. Anal. 2003, 14, 352–359. [Google Scholar] [CrossRef] [PubMed]
- Sun, J.Q.; Liang, F.; Bin, Y.; Li, P.; Duan, C.Q. Screening non-colored phenolics in red wines using liquid chromatography/ultraviolet and mass spectrometry/mass spectrometry libraries. Molecules 2007, 12, 679–693. [Google Scholar] [CrossRef] [PubMed]
- Ablajan, K.; Abliz, Z.; Shang, X.Y.; He, J.M.; Zhang, R.P.; Shi, J.G. Structural characterization of flavonol 3,7-di-O-glycosides and determination of the glycosylation position by using negative ion electrospray ionization tandem mass spectrometry. J. Mass Spectrom. 2006, 41, 352–360. [Google Scholar] [CrossRef] [PubMed]
- Wan, C.P.; Yu, Y.Y.; Zhou, S.R.; Tian, S.G.; Cao, S.W. Isolation and identification of phenolic compounds from Gynura divaricata leaves. Pharmacogn. Mag. 2011, 7, 101–108. [Google Scholar] [PubMed]
- Sample Availability: Not available.
© 2015 by the authors. Licensee MDPI, Basel, Switzerland. This article is an open access article distributed under the terms and conditions of the Creative Commons by Attribution (CC-BY) license ( http://creativecommons.org/licenses/by/4.0/).
Share and Cite
Zhu, M.; Dong, X.; Guo, M. Phenolic Profiling of Duchesnea indica Combining Macroporous Resin Chromatography (MRC) with HPLC-ESI-MS/MS and ESI-IT-MS. Molecules 2015, 20, 22463-22475. https://doi.org/10.3390/molecules201219859
Zhu M, Dong X, Guo M. Phenolic Profiling of Duchesnea indica Combining Macroporous Resin Chromatography (MRC) with HPLC-ESI-MS/MS and ESI-IT-MS. Molecules. 2015; 20(12):22463-22475. https://doi.org/10.3390/molecules201219859
Chicago/Turabian StyleZhu, Mingzhi, Xia Dong, and Mingquan Guo. 2015. "Phenolic Profiling of Duchesnea indica Combining Macroporous Resin Chromatography (MRC) with HPLC-ESI-MS/MS and ESI-IT-MS" Molecules 20, no. 12: 22463-22475. https://doi.org/10.3390/molecules201219859