Article

Apatite from NWA 10153 and NWA 10645—The Key to Deciphering Magmatic and Fluid Evolution History in Nakhlites

1
Institute of Geological Sciences, Polish Academy of Sciences, Research Centre in Warsaw, Twarda 51/55, 00-818 Warsaw, Poland
2
Department of Geological Sciences, School of Mining and Metallurgical Engineering, National Technical University of Athens, 9 Heroon Polytechneiou, 15780 Zografou, Athens, Greece
3
Helmholtz-Zentrum Potsdam Deutsches GeoForschungsZentrum GFZ, Telegrafenberg, 14473 Potsdam, Germany
4
Faculty of Chemistry, Jagiellonian University, Raman Imaging Group, Gronostajowa 2, 30-387 Cracow, Poland
5
Faculty of Geology, Geophysics and Environmental Protection, AGH University of Science and Technology, Mickiewicza 30, 30-059 Cracow, Poland
6
Institute of Geology Academy of Sciences of the Czech Republic Rozvojová 269, 165 00 Prague Czech Republic
7
Institute of Geological Sciences, Polish Academy of Sciences, Research Centre in Cracow, Senacka 1, 31-002 Cracow, Poland
*
Author to whom correspondence should be addressed.
Minerals 2019, 9(11), 695; https://doi.org/10.3390/min9110695
Submission received: 10 September 2019 / Revised: 6 November 2019 / Accepted: 7 November 2019 / Published: 10 November 2019
(This article belongs to the Special Issue Mineralogy of Meteorites)

Abstract

:
Apatites from Martian nakhlites NWA 10153 and NWA 10645 were used to obtain insight into their crystallization environment and the subsequent postcrystallization evolution path. The research results acquired using multi-tool analyses show distinctive transformation processes that were not fully completed. The crystallization history of three apatite generations (OH-bearing, Cl-rich fluorapatite as well as OH-poor, F-rich chlorapatite and fluorapatite) were reconstructed using transmission electron microscopy and geochemical analyses. Magmatic OH-bearing, Cl-rich fluorapatite changed its primary composition and evolved toward OH-poor, F-rich chlorapatite because of its interaction with fluids. Degassing of restitic magma causes fluorapatite crystallization, which shows a strong structural affinity for the last episode of system evolution. In addition to the three apatite generations, a fourth amorphous phase of calcium phosphate has been identified with Raman spectroscopy. This amorphous phase may be considered a transition phase between magmatic and hydrothermal phases. It may give insight into the dissolution process of magmatic phosphates, help in processing reconstruction, and allow to decipher mineral interactions with hydrothermal fluids.

1. Introduction

Martian meteorites are the only source of material from Mars, so they are crucial for deciphering the magmatic evolution of the planet and the geochemical effects of fluid activity in deep and surface reservoirs [1]. These meteorites are divided into three main groups, shergottites, nakhlites, and chassignites, often denoted as SNC. They can provide information regarding the Martian mantle and volcanism, the geochemical effects of fluid activity on the Martian surface, atmospheric composition, liquid water, and potential environments for life [2,3,4,5,6,7,8,9,10,11,12,13].
The nakhlites were emplaced as multiple flows, dikes, or sills near the surface in a Martian volcanic system at 1.26 and 1.42 Ga [14,15,16,17,18]. Their parental magma had a basaltic composition [5], similar to the Bushveld (South Africa) and Stillwater (Montana) layered mafic intrusions on Earth [19]. Nakhlites were ejected from Mars by a single impact event at 11 ± 1.5 Ma [14,16,20,21], potentially from a crater at 130.799° E, 29.674° N in the Elysium Mons region [18].
Apatite and merrillite are the most frequently occurring Ca-phosphates in extraterrestrial bodies such as Martian basaltic rocks [22,23,24]. Their occurrence is believed to be related to magma differentiation [8,25,26,27,28,29,30,31,32] or postmagmatic transformation processes, which frequently occur due to interactions with Cl-rich fluids [10,24,29,33,34,35,36]. McCubbin et al. [10] proposed a model, where the differences in apatite compositions in nakhlites could be reconciled by adding an exogenous Cl- and light rare earth elements- (LREE) enriched fluid to the chassignite/nakhlite magma body shortly after the cumulate horizon had formed and by subsequently degassing a Cl-rich fluid phase.
NWA 10153 and NWA 10645 are recently found Martian meteorites (nakhlites). NWA 10153 was found in 2014, while NWA 10645 was found in 2016. These samples are believed to be paired with each other. The first studies [13,17] brought information regarding their whole rock geochemistry, main minerals (e.g., pyroxene and olivine), chemical compositions, and age. In the present study, we primarily focused on apatites, which are volatile-bearing minerals of the NWA 10153 and NWA 10645 nakhlites, to understand their crystallization environment and postcrystallization evolution path. This paper is the first study on the apatites from both meteorites.

2. Samples

Both meteorites contain clinopyroxene grains (75%), olivine (5%), plagioclase (15%), and other minerals reported as mesostasis (5%) (see description below) (Figure 1). The clinopyroxene in both meteorites is compositionally zoned augite (Fs23.1-43.5Wo39.6-41.1—NWA 10153; Fs24.1-48.9Wo33.3-40.5—NWA 10645) [37]. The olivine is fayalitic and fairly uniform in composition (cores Fa61.3-63.7, rims Fa76.2-81.8) [37]. The last major component in both meteorites is plagioclase with a composition of An23.4-25.4Ab71.3-73.0Or5.3-3.4 [37]. Mesostasis, which is a multimineral assemblage of small grains, occurs among the large augite and olivine crystals. Mesostasis commonly appears as a brown color under the optical microscope because it hosts much of the aqueous alteration material [13,17,37]. Its abundance widely varies in both meteorites. The most common phase in mesostasis is alkali feldspar (An3.3Ab40.4Or56.2) [37]. Many other minerals are reported in mesostasis (e.g., oxides, FeS, ilmenite, titanomagnetite, and “glass”). The mesostasis in both meteorites is also relatively rich in phosphates. Apatites are euhedral with widths of up to 40 μm and elongated up to 100 μm (Figure 1b,d). No data on the apatites in either meteorite have been previously reported in the literature.
In comparison to other SNC meteorites, the shock effects in nakhlites are minor [5]. The traces of shock-induced textures were visible in augites, which showed undulatory extinction, shock-related mechanical twinning, continuous crystal lattice bending, and a local high frequency of fractures [38,39]. No literature data regarding shock-induced textures have been reported for the NWA 10645 or NWA 10153 meteorites. Preliminary optical microscope and SEM investigations revealed shock textures in both meteorites. Observed minerals (i.e., clinopyroxene, plagioclase, and olivine) have planar and irregular fractures. Shock-induced cracks seem to occur in mesostasis and minerals within, for example, apatite, even more often than in clinopyroxene.

3. Methods

The NWA 10153 and NWA 10645 samples consist of rock slabs measuring approximately 0.7 × 0.2 × 0.1 cm and 0.6 × 0.4 × 0.2 cm, respectively. The samples were embedded in epoxy as round, one-inch disks. All analyses, measurements, and observations were performed on these disks.

3.1. Transmission Electron Microscope (TEM) Observations

TEM analyses were conducted to determine the phosphate structure and possible presence of REE-phosphate, sulfide, and/or other inclusions. Sample preparation was accomplished by using focused ion beam (FIB) milling. The FIB-TEM analyses were performed at the German Research Centre for Geosciences (GFZ) in Potsdam, Germany. The TEM observations were performed using an FEI Tecnai G2 F20 X-Twin TEM with a Schottky field emitter as an electron source. The TEM was equipped with a Fishione high-angle annular dark field detector (HAADF), an EDAX X-ray analyzer, and a Gatan electron energy-loss spectrometer (EELS). Areas of 20 × 20 μm in each sample were selected for analysis. First, the samples were coated with a 1.5 μm protective layer of Pt to prevent sample damage caused by FIB sputtering and Ga-ion implantation. Then, material was sputtered from the frontal and lateral sides of the region with the FIB operating at an accelerating voltage of 30 kV and a beam current of 30 nA. The frontal surface was “polished” with a 3 nA FIB beam current to make the foil surface smooth, even, and ~100 nm thick. The final size of the TEM foils, which were directly cut from the grains in the thin sections, was approximately 20 × 10 × 0.15 µm. The TEM-ready foils were placed on a perforated carbon film on a copper grid. No carbon coating was required to prevent charging under the electron beam. A detailed description of the sample preparation was published by Wirth [41,42]. High-resolution lattice fringe images were used to calculate the diffraction patterns (derived from the fast Fourier transform, FFT) of the host apatites and the solid inclusions within the structure and to subsequently identify them. The observed angles between adjacent planes were compared with the angles calculated from the literature data. The structure of apatite is hexagonal with space group P63/m and unit-cell parameters a = 9.3–9.6 and c = 6.7–6.9 Å [43,44]. The angles between adjacent planes must match within 1° for positive phase identification. The errors in the angular measurements from the FFT were <0.5°.

3.2. Electron Probe Microanalysis (EPMA)

Quantitative chemical analyses and compositional X-ray maps of the apatite grains were performed using a JEOL SuperProbe JXA-8230 electron microprobe at the Laboratory of Critical Elements AGH-KGHM, Faculty of Geology, Geophysics and Environmental Protection, AGH University of Science and Technology (Kraków, Poland). First, the samples were coated with a 20 nm thick carbon film. To minimize the known potential problems associated with the EPMA measurements of F and Cl in apatites [45,46], the samples were analyzed using two different protocols. The first protocol (dedicated to volatiles) consisted of an acceleration voltage of 15 kV, a beam current of 5 nA, and a spot size of 8 µm. The natural and synthetic standards, corresponding spectral lines and peak counting times, were as follows: fluorite (F Kα, 10 s), albite (Na Kα, 20 s), fluorapatite (Ca Kα, 10 s and P Kα, 20 s), YPO4 (Y Lα, 10 s), CePO4 (Ce Lα, 20 s), tugtupite (Cl Kα, 10 s), fayalite (Fe Kα, 10 s), rhodonite (Mn Kα, 10 s), and kyanite (Al Kα, 20 s). The total time of a single analysis was 3 min 30 s. There was no mobilization of F and Cl at 5 nA and beam size of 8 µm. Consequently, there was no need to follow time-dependent intensity (TDI) correction. Moreover, prior to the analytic session, fluoroapatite with known F content (standard) and Durango apatite were measured. Unfortunately, the detection limits (DLs) obtained with this protocol were relatively high (e.g., for Ce it was 2550 ppm, in comparison to 865 ppm using the second protocol) and, consequently, could not track the trace element concentrations in the apatite structure or estimate the mean formula of the apatites. The second protocol (dedicated to trace elements) consisted of an acceleration voltage of 15 kV, a beam current of 20 nA, and a spot size of 5 µm. The natural and synthetic standards, corresponding spectral lines, and peak counting times, were as follows: fluorite (F Kα, 10 s), albite (Si Kα, 20 s and Na Kα, 20 s), SrSO4 (Sr Lα, 20 s), fluorapatite (Ca Kα, 10 s and P Kα, 20 s), anhydrite (S Kα, 20 s), YPO4 (Y Lα, 10 s), CePO4 (Ce Lα, 20 s), barite (Ba Lα, 10 s), tugtupite (Cl Kα, 10 s), fayalite (Fe Kα, 10 s), rhodonite (Mn Kα, 10 s), kyanite (Al Kα, 20 s), diopside (Mg Kα, 20 s), LaPO4 (La Lα, 20 s), NdPO4 (Nd Lα, 20 s), and GdPO4 (Gd Lα, 20 s). The total time of a single analysis was 7 min. In each crystal, at least two measurements were made, one using the protocol dedicated for volatiles and the other for traces. In case of sufficient crystal size, additional measurements were made. The data were corrected to the ZAF (Z—atomic number, A—absorption correction, F—fluorescence correction) procedure using the JEOL software for EPMA. The relative errors were estimated to be less than 1% at the >10 wt. % level, ~1% at the 5–10 wt. % level, 1–5% at the 1–5 wt. %, and 1–15% at the <0.1 wt. % level. The DL (detection limit) for the first protocol was 330–900 ppm for the main and trace elements, except for Fe (1340 ppm), Y (1600 ppm), and Ce (2550 ppm). The DL obtained using the dedicated protocol for trace elements was relatively lower, with values of 150–900 ppm for both the main and trace elements. It was higher only for some trace elements (La—2500 ppm; Pr—1700 ppm; Gd—2000 ppm). The apatite formulae were calculated based on the EMPA data using the method of Ketcham [47] and were normalized based on 25 oxygen equivalents. The concentrations of all components were compared to the DL of each measurement, and only the results above the DL were considered. Moreover, for data obtained using the protocol dedicated for trace elements, additional criteria of the sum corrected total <98% and >102% were applied. Because of the lack of trace elements analyses, this principle cannot be adopted for data obtained using the protocol dedicated for volatiles. The OH content was calculated assuming that the X-site was fully occupied by F, Cl, and OH (F + Cl + OH = 2). Compositional X-ray maps for F, Cl, Si, S, and Fe were collected using a 15 kV accelerating voltage, 100 nA beam current, 100 ms dwell time, 0.2 µm step size, and a focused beam.

3.3. Laser Ablation Inductively Coupled Plasma Mass Spectrometry (LA-ICP-MS) Analysis of Trace Elements

A Thermo Scientific Element 2 high-resolution sector field ICP-MS coupled to a 193 nm ArF excimer laser (Teledyne Cetac Analyte Excite laser) at the Institute of Geology of the Czech Academy of Sciences, Prague, Czech Republic, was used to acquire the trace element (TE) data. The laser was fired at a repetition rate of 3 Hz and a fluence of 3.4 J/cm2 with a 16 micron laser spot size. The He carrier gas was flushed through the two-volume ablation cell at a flow rate of 0.7 L/min and mixed with 0.8 L/min Ar and 0.004 L/min N prior to the introduction into the ICP. An in-house glass signal homogenizer (designed by Tunheng and Hirata [48]) was used to mix all gases and aerosols, which resulted in a smooth, spike-free signal. The signal was tuned for maximum sensitivity while maintaining low oxide levels, which are commonly below 0.1%. Typical acquisitions consisted of 15 s of blank measurement followed by a measurement of TE signals from the ablated materials for another 20 s, with 30 s of wash time between each analysis. This ablation pattern was repeated on each analytical spot, where the first ablation was used to collect data in the low mass resolution mode (m/Δm = 300: 89Y, 90Zr, 93Nb, 139La, 140Ce, 141Pr, 146Nd, 147Sm, 153Eu, 157Gd, 159Tb, 163Dy, 165Ho, 166Er, 169Tm, 172Yb, 175Lu, 208Pb, 232Th, and 238U). The measurement sequence consisted of repeated blocks of 2 analyses of NIST SRM610, one analysis of the BCR-2 standard and 10 unknowns.
Trace element data were calibrated using the NIST SRM610 glass and 43Ca as an internal standard with concentration values of the unknown samples obtained from the EMPA analysis.
The minimum detection limit values were calculated by multiplying the variance of the background by 3.25 for individual elements. The time-resolved signal data were processed using Glitter software [49]. The precision of the analyses (1 RSD) was 5–15% for most elements. The accuracy was monitored by a homogenized basalt reference material, BCR-2 (USGS).

3.4. Raman Imaging

Raman imaging was performed on the polished samples embedded in epoxy using a confocal Raman imaging system (WITec Alpha 300, Ulm, BW, Germany) supplied with a 100× air objective (Olympus MPlanFL N, NA = 0.9). The scattered light was directed to the spectrometer via a 50 µm core diameter multimode fiber, which also acted as the pinhole for the confocal detection. The spectrometer was equipped with a UHTS 300 spectrograph, a CCD detector (Andor, DU401A-BV-352), and 600 grooves/mm grating (Grating Blaze Wavelength (BLZ) = 500 nm). For each measurement, a 532 nm laser was used with a power of approximately 10–15 mW at the sample position. Raman spectroscopic imaging was performed by collecting spectra from samples with a 0.4 s exposure time and a sampling density of 2 µm. The total time to record a single image was 10–20 min and mainly depended on the size of the imaged area. All spectra were acquired in the 0–3600 cm−1 spectral range with a 3 cm−1 spectral resolution. The data acquisition was controlled by the WITec Alpha 300 software package.
Preprocessing, including cosmic ray removal and background subtraction (used if necessary), was performed using the WITec Project Five software. Chemical images were generated using a sum filter. To create Raman images, the signal intensities over a defined wavenumber range, which was representative of the molecular vibrations of interest (marker bands), were integrated. For data exploration, the k-means cluster analysis (KMC) was implemented. The KMC aims to group the analyzed objects (spectra) into clusters; hence, similar spectra are gathered within the same cluster. The analysis was performed for the normalized spectra (vector normalization), and the distance (object-centroid) was calculated according to the Manhattan (city block) method.
The main advantage of Raman imaging is the label-free molecular analysis (based on vibrations) of the sample with indication of the distribution of components. Moreover, the relatively high resolution allows to investigate the composition of the sample in micro-areas. This method was used for deeper analysis of apatite/calcium phosphate areas in the sample to investigate if observed areas were homogenous and if any phases, polymorphs, or components could be found. It was able to indicate the main chemical components with their localization in the sample, as a label-free and nondestructive method may be very informative for unknown samples. KMC as a basic chemometric method was used for data mining. Imaging provides hundreds of spectra from one measurement, and analysis of them would be time consuming and difficult. Based on KMC, spectra with the same spectral profile are averaged as one representative spectrum (signal-to-noise ratio is then significantly decreased compared to one single raw spectrum), and an image with color-coded corresponding spectra is created.

4. Results

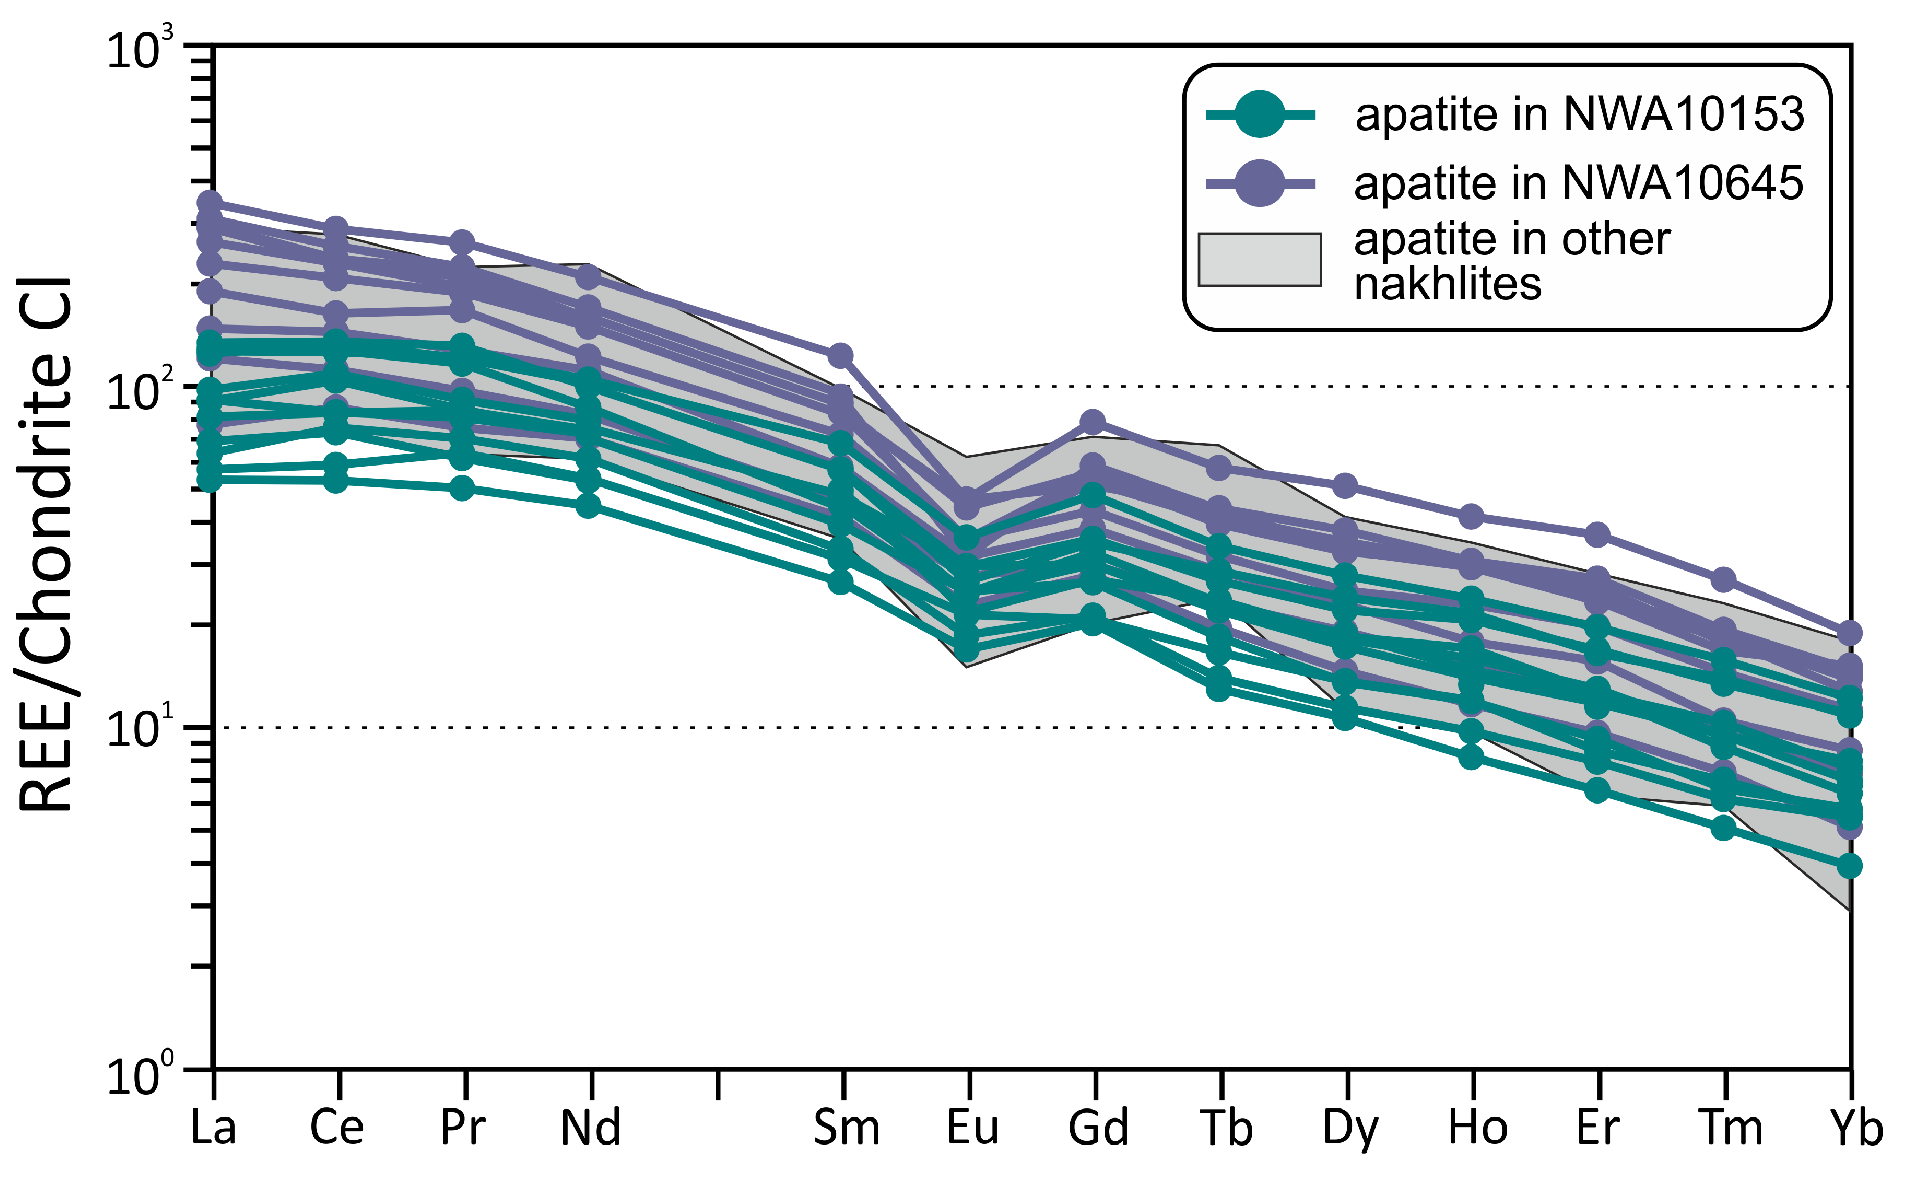
4.1. Phosphate Composition

The EPMA results showed that minerals of the apatite group from both NWA 10645 and NWA 10153 all had volatile groups (Cl, F, and OH); however, the variation of their content was large (Table 1 and Table S1). These variations often occurred within a single crystal. Thus, they could be arbitrarily divided into three populations (Figure 2). Population 1 consisted of apatites that displayed limited variability in F:Cl ratios. They are rich in both F and Cl and have a detectable missing component, which can be attributed to OH. Applying this normalization scheme yielded an OH component in the range of 5–17 mol % at the X-site, which is equal to 0.09–0.29 wt. % H2O. Cl occupied 32–45 mol % of the X-site, whereas F was 45–62 mol %. Populations 2 and 3 predominantly exhibited binary fluorapatite–chlorapatite solid solutions. Population 2 had 31–59 mol % Cl and 35–68 mol % F, whereas in population 3, fluorine occupied 68–90 mol % of the halogen sites, and chlorine occupied 10–30 mol %. Simultaneously, the hydroxyl content of the measured apatite was very low and did not exceed 7 mol %. The predominant apatite in both meteorites can be classified as a Cl-rich fluorapatite. This fluorapatite contains appreciable concentrations of SiO2 and FeO (up to 2.3 and 3.6 wt. %, respectively) and detectable concentrations of MnO (up to 0.2 wt. %) (Table 1 and Table S2). No differences in volatile and trace element compositions were observed between NWA 10645 and NWA 10153. In addition to spot analyses, compositional X-ray mappings (F, Cl, Si, S, and Fe) were carried out to determine some element distributions in the whole crystals (Figure 3 and Figure 4). The F and Cl distributions revealed strong heterogeneity in the volatiles compositions of apatite crystals in both meteorites (Figure 3b,c and Figure 4b,c). The Cl distribution in apatite in meteorite NWA 10153 was relatively more homogeneous and massive (Figure 3b), whereas F was arranged in patchy, small domains (Figure 3c). Differently, in apatite from NWA 10645, both the Cl and F distribution maps indicated heterogeneities and patchy textures (Figure 4b,c).
The REE concentrations in the apatites were near the detection limit of the EPMA; thus, their concentrations were resolved using LA-ICP-MS. The REE patterns of apatites in both meteorites exhibited enrichment in LREEs and negative Eu anomalies (Figure 5). The europium anomaly value was calculated as Eu/Eu* = EuN/((SmN + GdN)/2), where elements were recalculated to chondrite and were in the range of 0.42–0.82. No difference was observed between the REE patterns of apatite crystals from both meteorites or between different populations assigned from the EPMA results (Table 1 and Table S2). In addition, the REE pattern was similar to the characteristic REE patterns of other reported apatites in nakhlites (Figure 5). All collected trace element data are presented in Table S3.

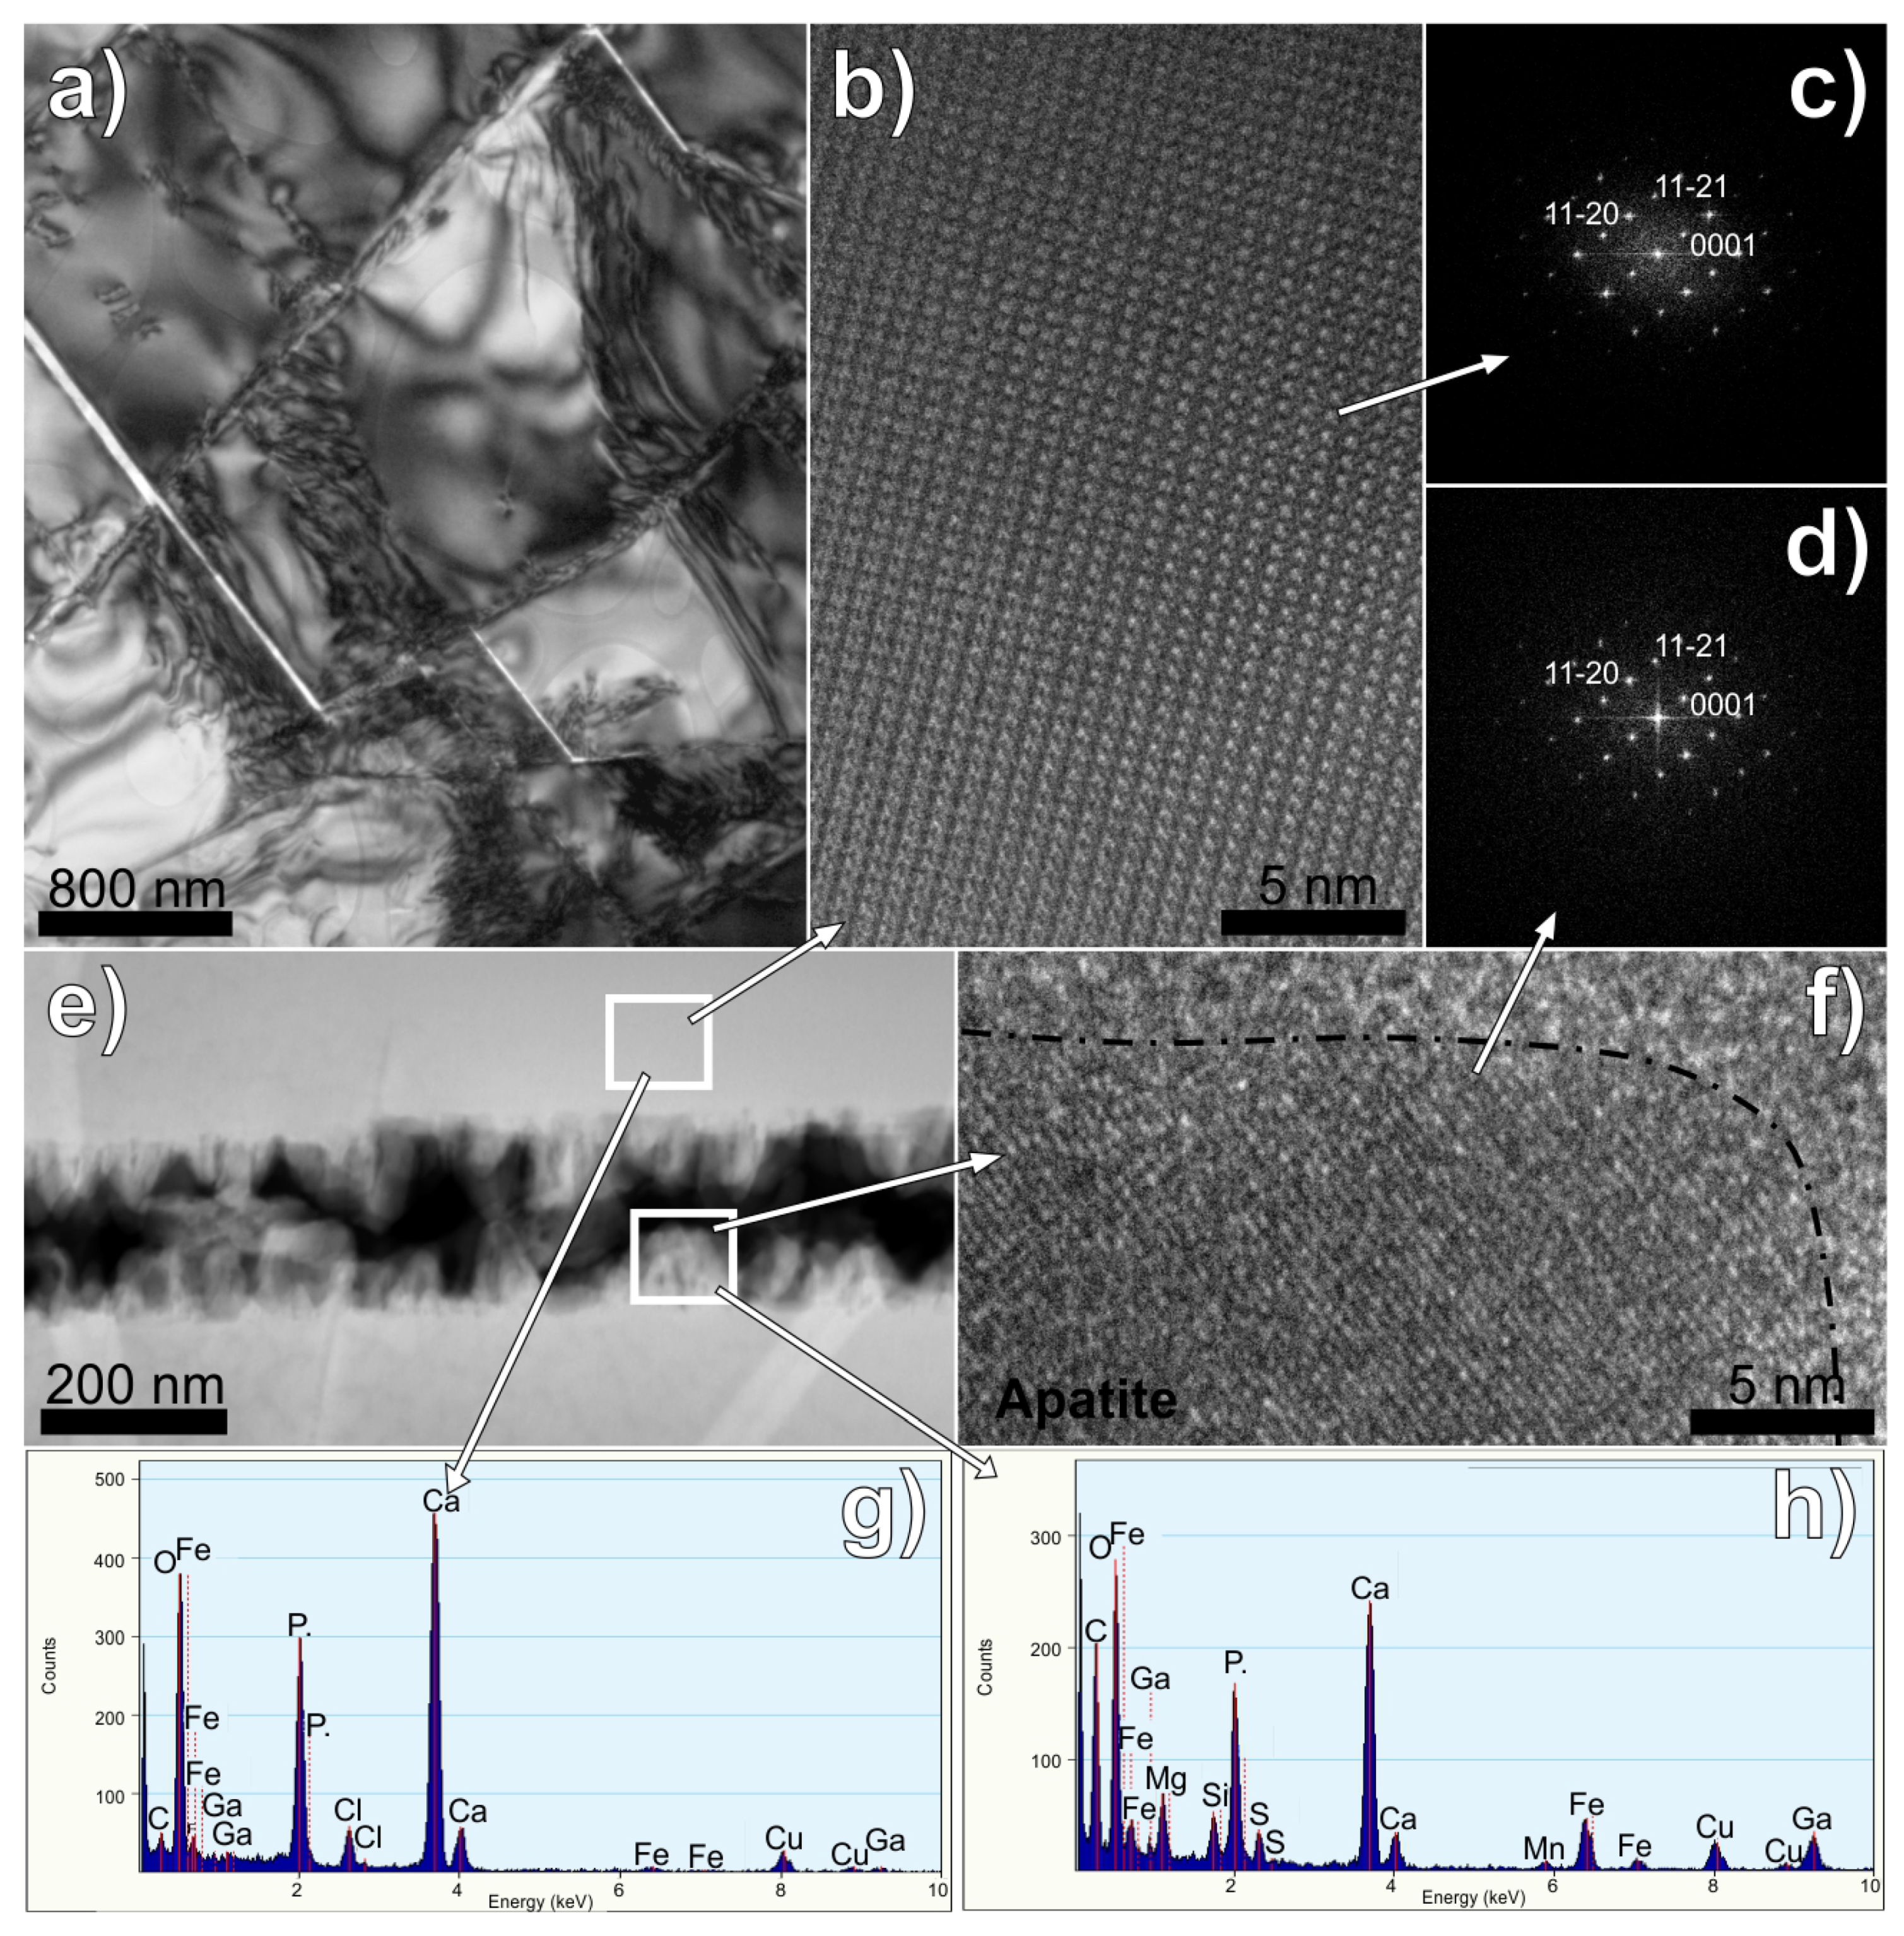
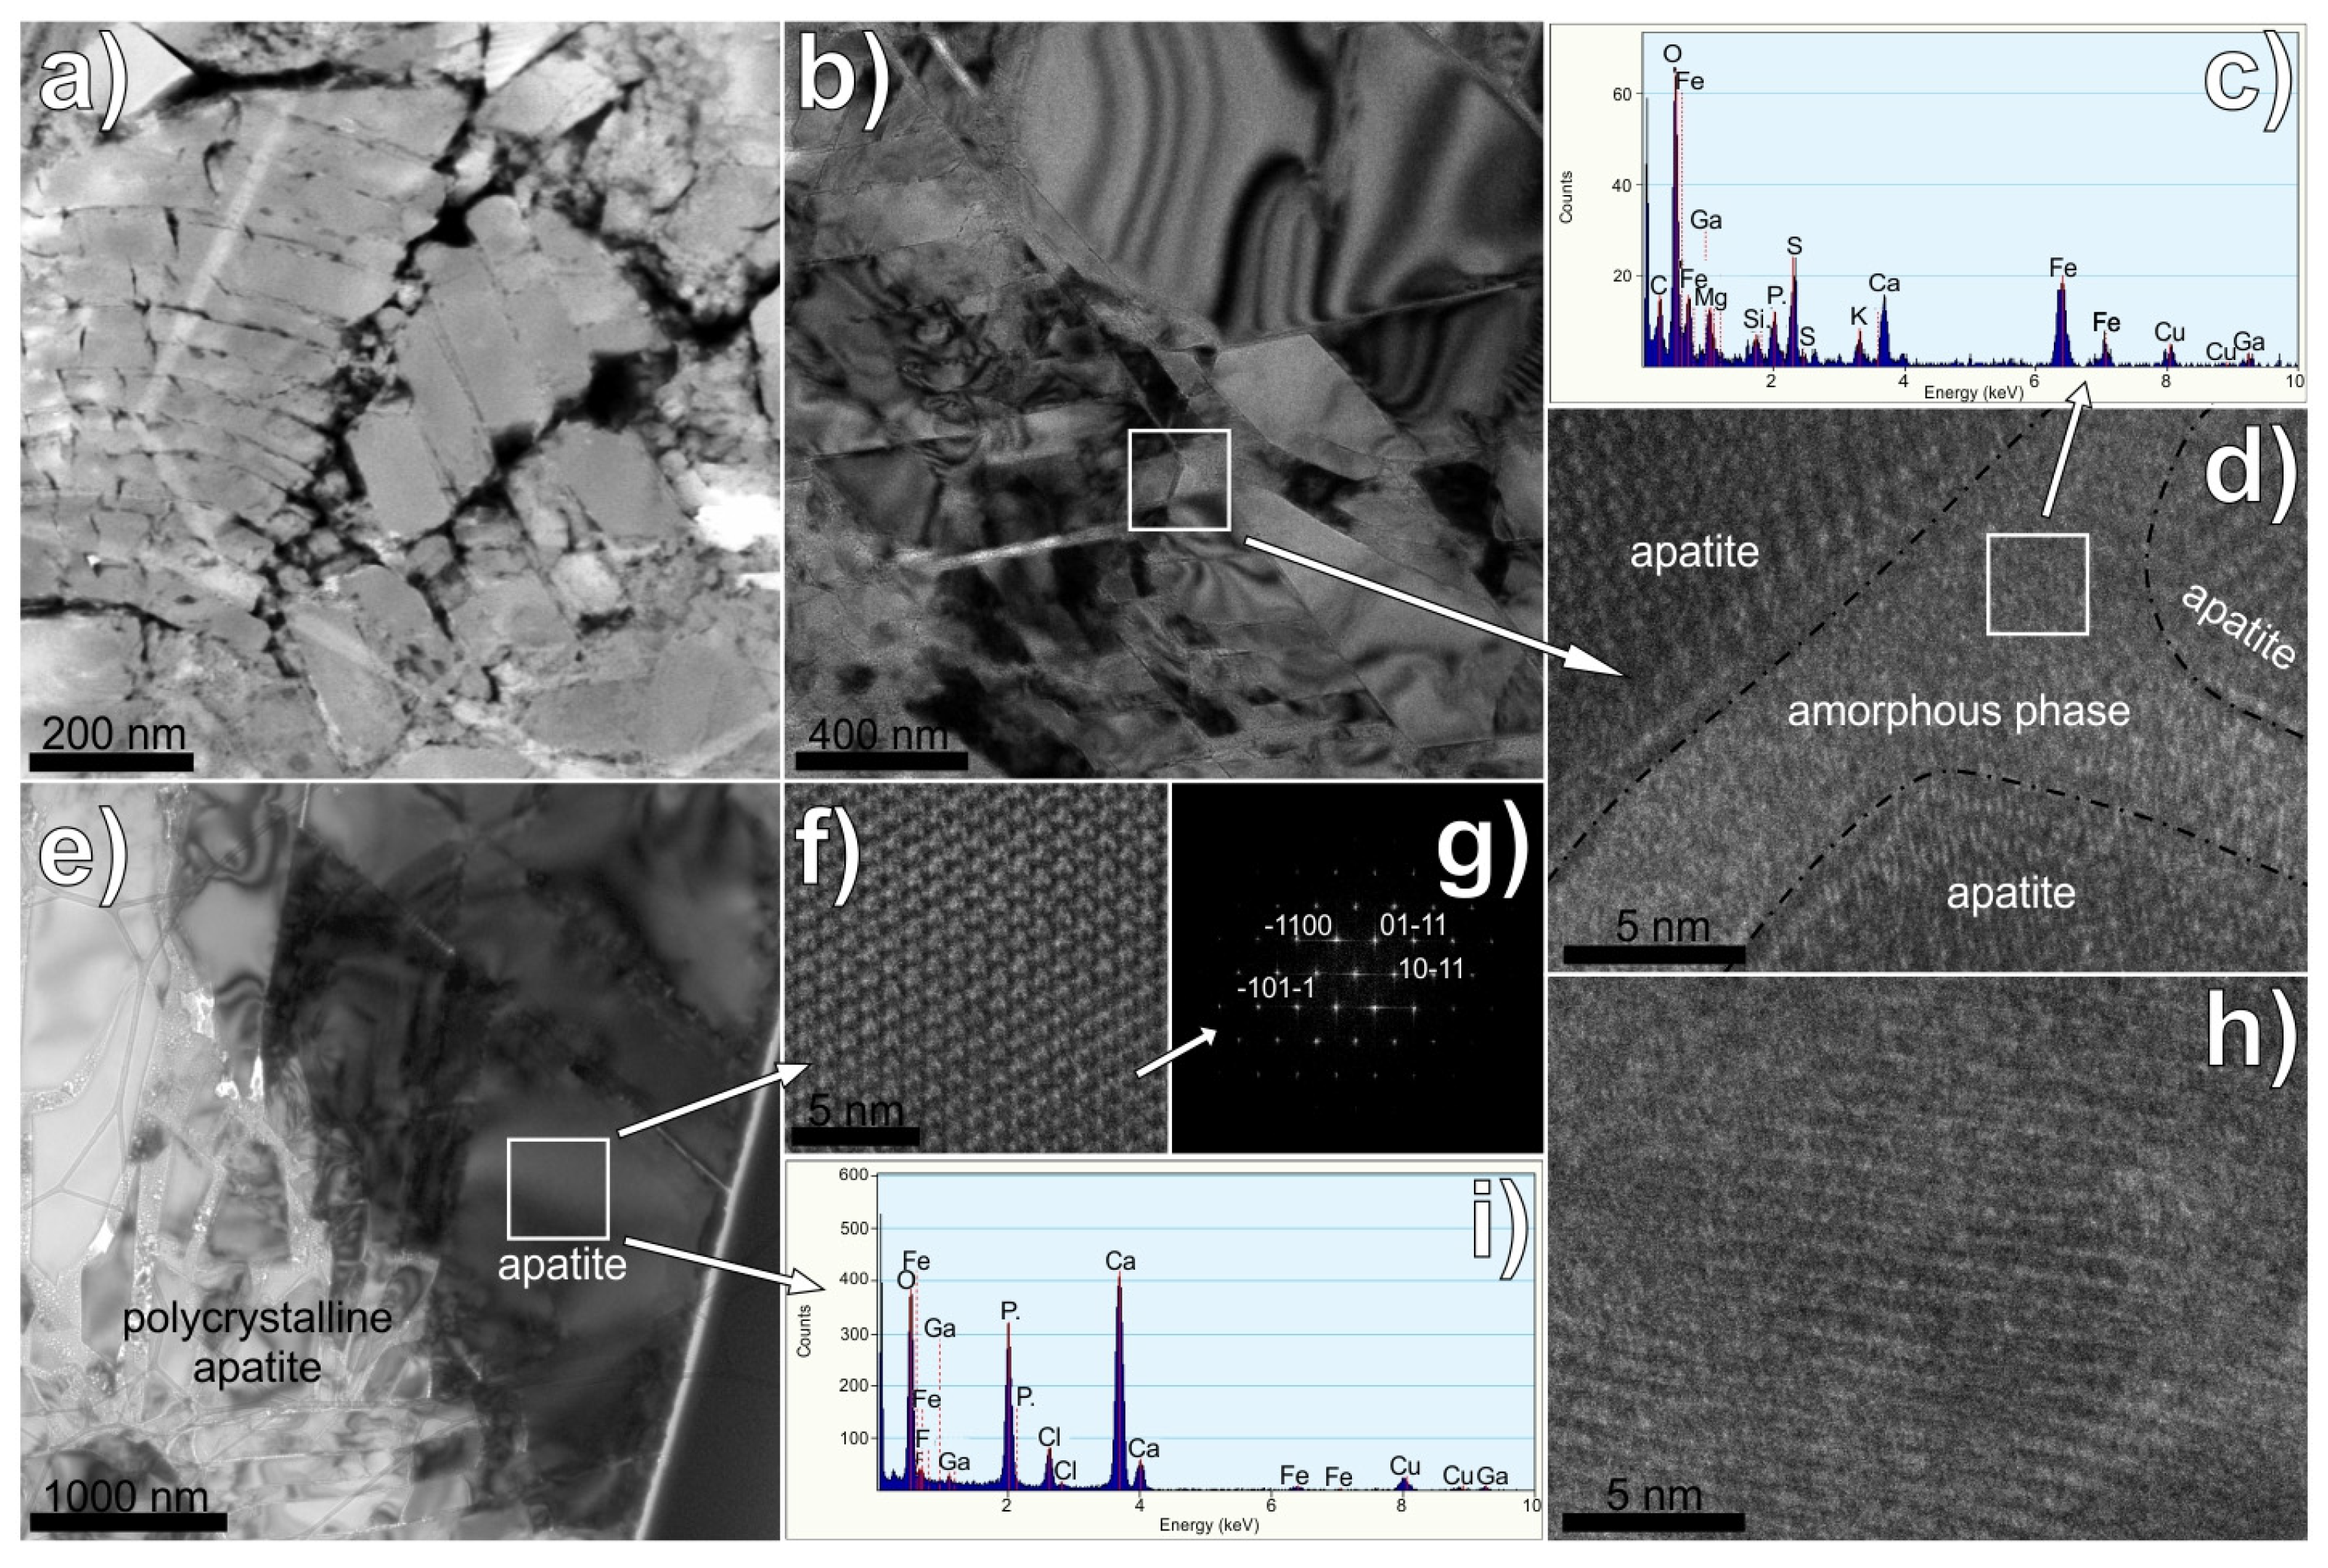
4.2. TEM Observations

Two foils were cut from the meteorites from the positions marked in Figure 1b,d. Bright field, dark field, and lattice fringe imaging modes provided information regarding the formation and transformation pathways of apatite crystals (Figure 6 and Figure 7). The shock-induced planar deformation was visible in the apatites from both meteorites (Figure 6a and Figure 7a,b). Apatites in both meteorites were composed of slightly tilted (due to shock events) and cracked subgrains (Figure 7a,b). Furthermore, the subgrains showed individual diffraction contrast patterns when the foil was tilted in the TEM. The subgrains were separated by arrays of dislocations that formed low-angle grain boundaries (LAGBs) (Figure 6a). The subgrains were free of dislocations, as the lattice dislocations had migrated into the LAGBs by dislocation glide and climb.
The calculated diffraction patterns (FFT) from the high-resolution lattice fringe images were used to determine the dhkl parameters of the phosphates in both meteorites (Figure 6b–d,f and Figure 7f,g). Consequently, we measured the angles between the diffraction vectors, which represent the angles between adjacent lattice planes. They were compared with the calculated angles. The agreement should be within 1.0° to confirm the indexing of the diffraction vectors. The diffraction pattern of phosphate in meteorite NWA 10153 yielded values of 34.4° and 55.6° between adjacent lattice planes (Figure 6c,d). The observed angles correspond to the calculated (0001)/(11-21) angle of 34.27° and a (11-21)/(11-20) angle of 55.37°. The values of the angles between adjacent lattice planes in the diffraction pattern of phosphate in meteorite NWA 10645 were approximately 60°, which are consistent with the calculated angle of 30° in the hexagonal system (Figure 7g). Consequently, the phosphates in both meteorites were identified and indexed as apatites.
The TEM analyses of phosphates in meteorite NWA 10153 revealed that the cracks in the chlorapatite (Figure 6g) were filled with fine-grained, relatively Cl-depleted (Figure 6h) fluorapatite. These crystals piled up on the crack walls toward its centers. The cracks are approximately 200 nm wide. Their growth morphologies and mutual orientations showed that they nucleated on the crack walls and grew in parallel-oriented stacks (Figure 6e). Furthermore, both generations of apatites had identical diffraction patterns (Figure 3c,d). Consequently, chlorapatite and the Cl-depleted variety had identical crystallographic orientations. Furthermore, EDX analyses indicated the presence of S and Fe, which could be associated with the presence of an iron sulfide phase, Si, and carbon-rich material in the cracks (Figure 6h).
The TEM analyses of phosphate in meteorite NWA 10645 revealed cracks in the chlorapatites (Figure 7a,b,d,e) that were filled with a mixture of an amorphous Fe-silica phase, an iron sulfide phase, carbon-rich material, and fragments of broken apatite (Figure 7c). No recrystallization of chlorapatite was observed; however, the TEM images revealed sharp and rough contacts between the apatites and the Fe-rich amorphous silica (Figure 7b), which might indicate dissolution processes.

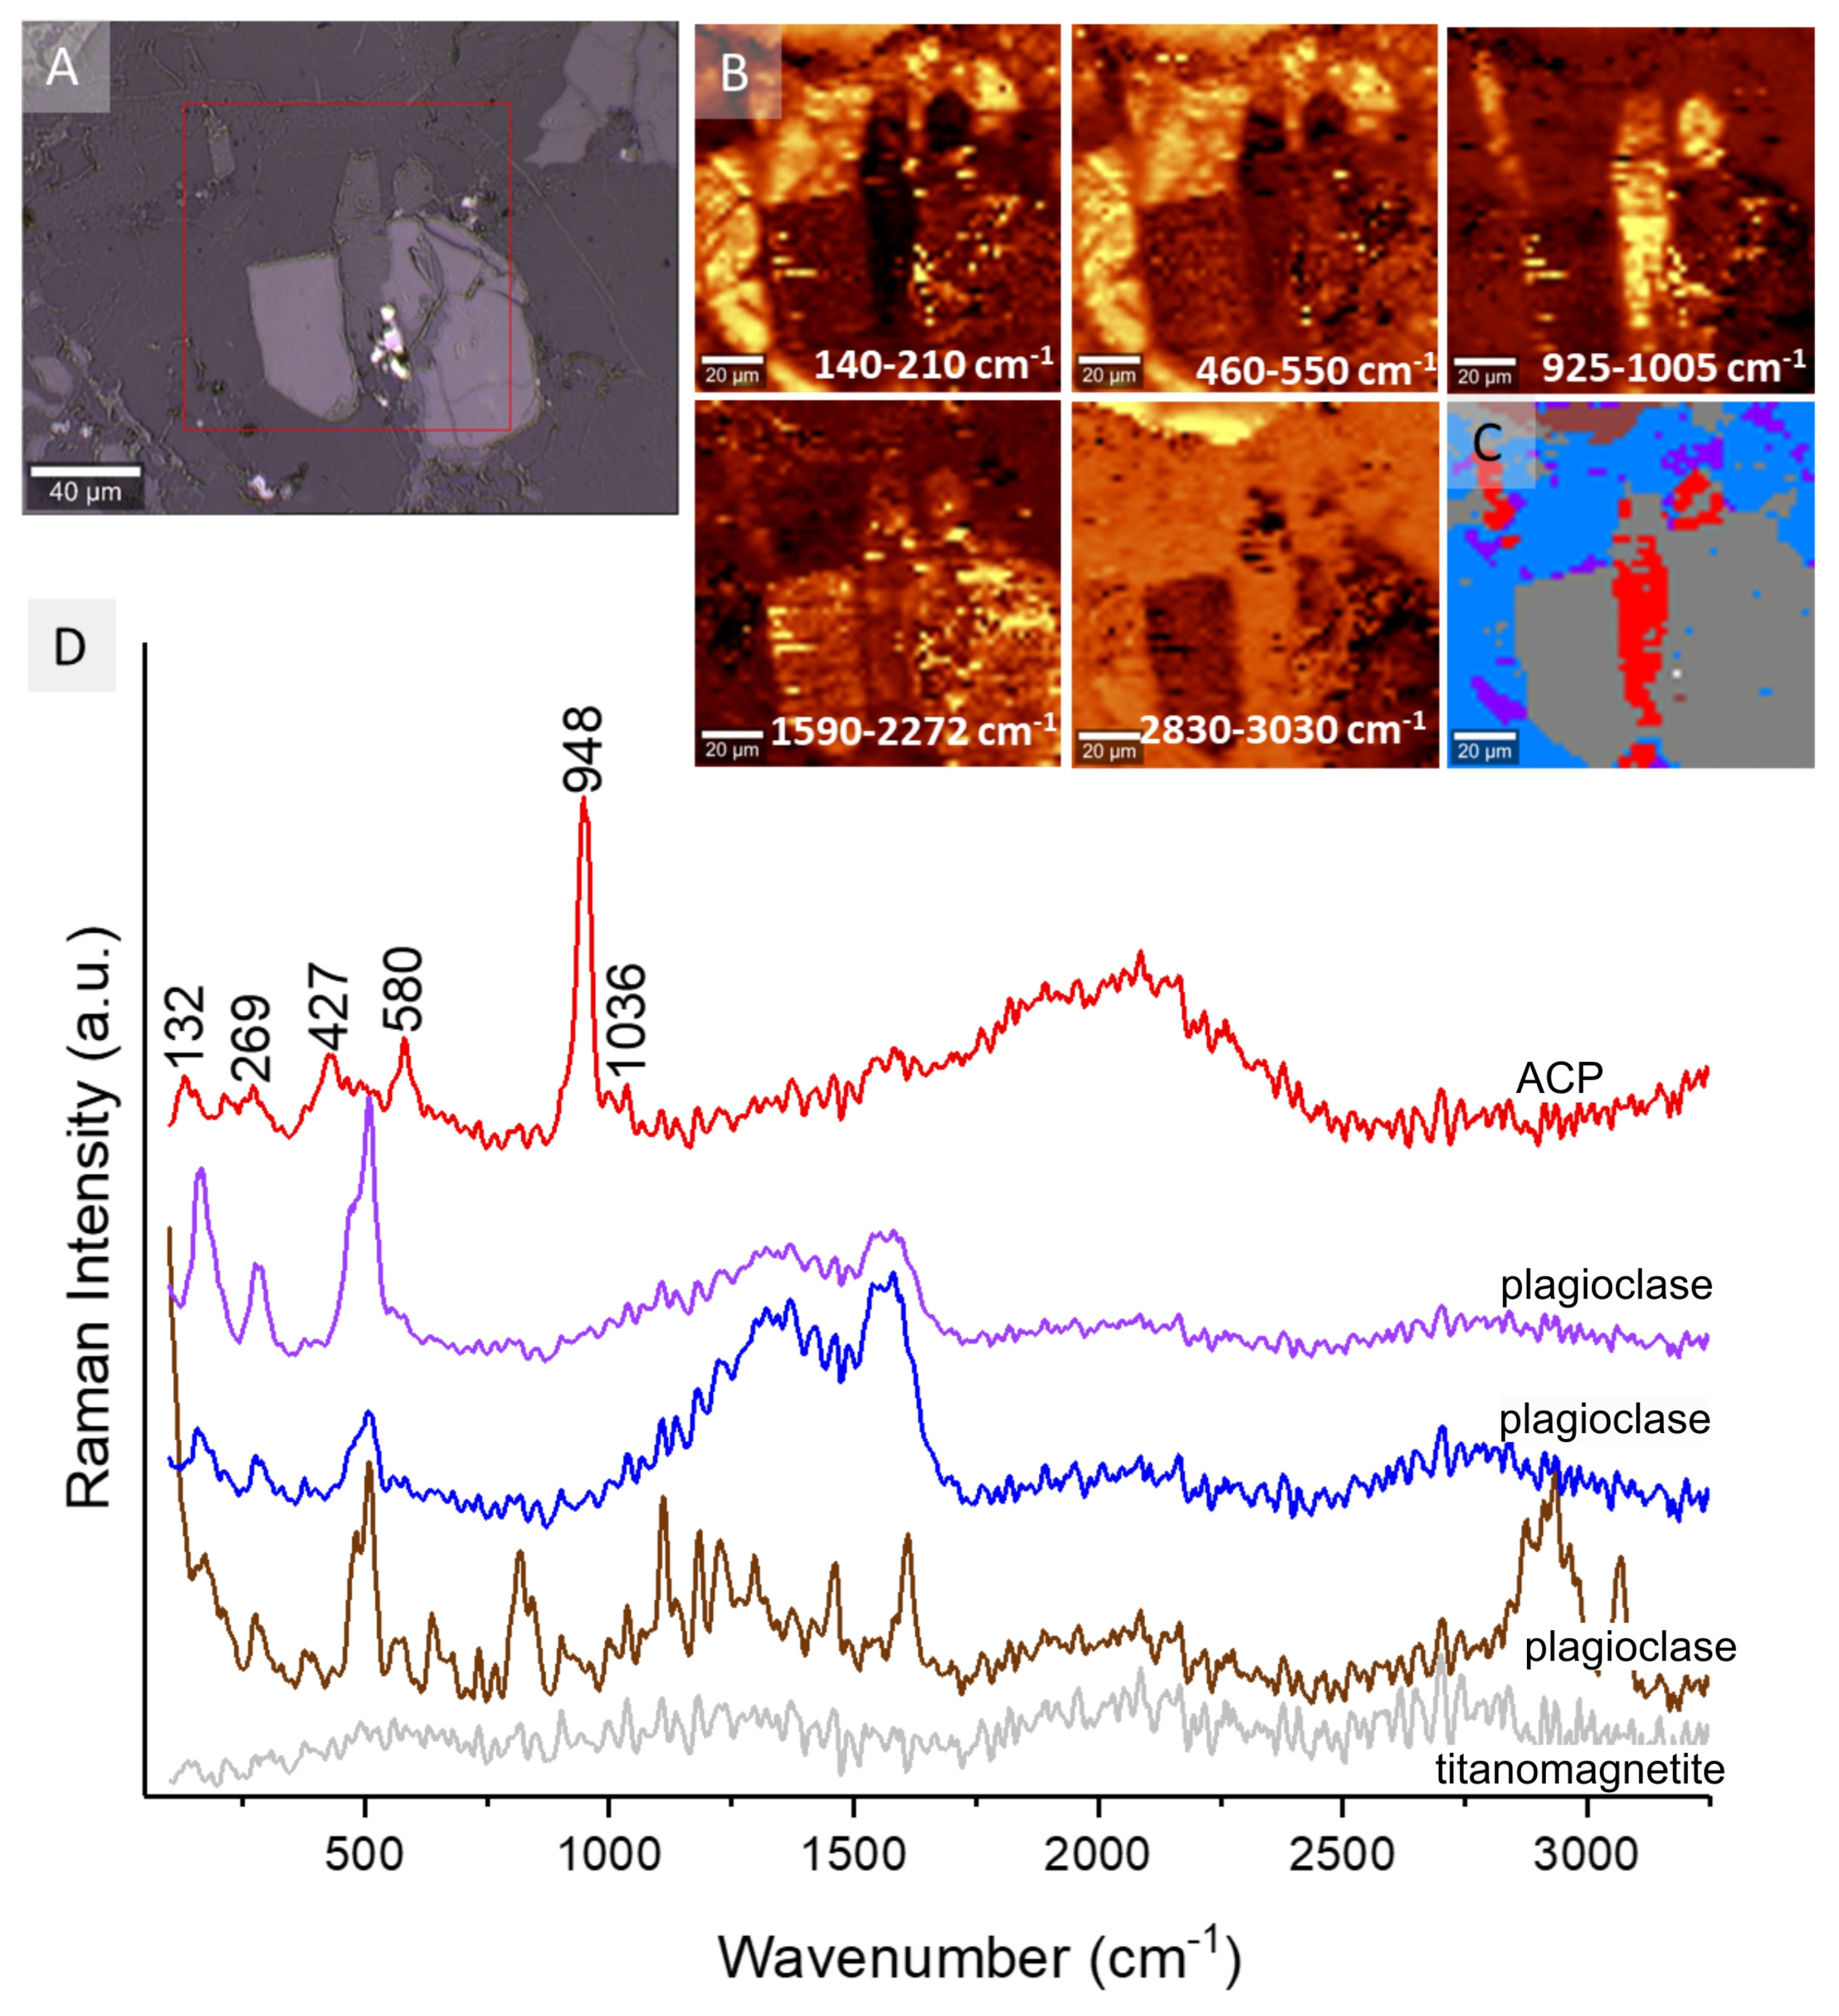
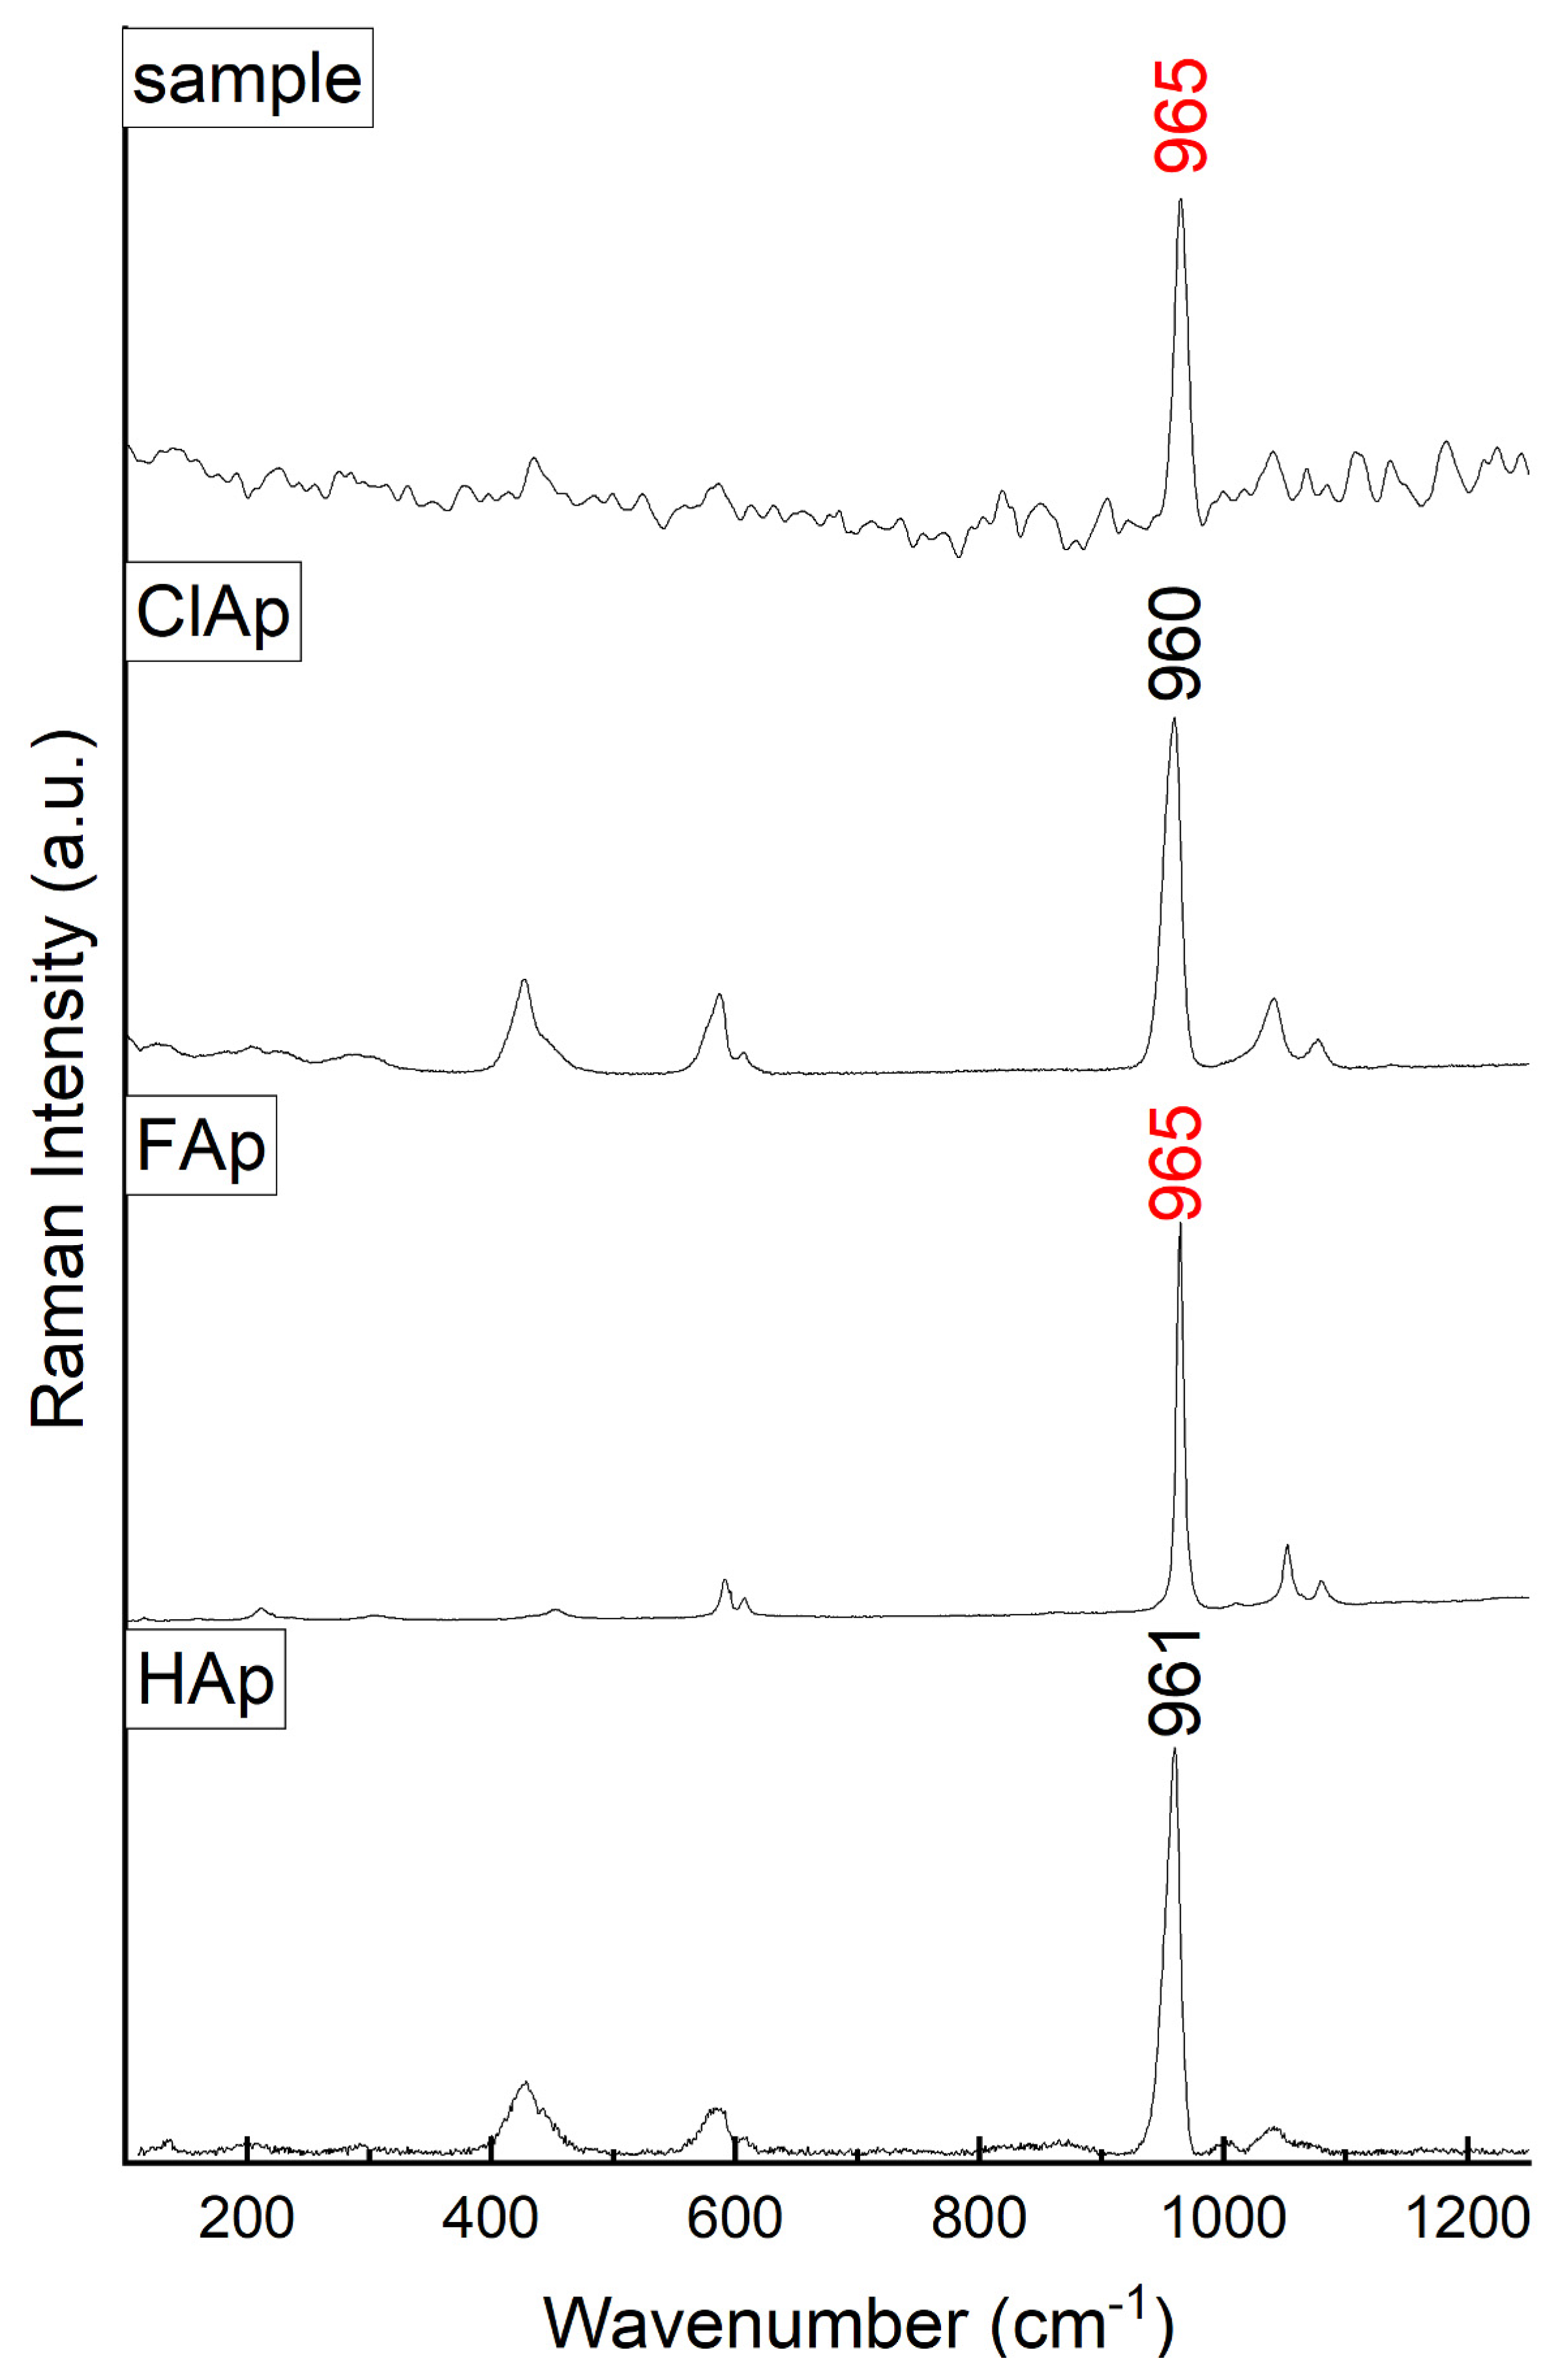
4.3. Raman Spectroscopy Results

The general formula of the apatite supergroup is IXM12VIIM23(IVTO4)3X (Z = 2), where both Ms are large cations such as Na+, Ca2+, Pb2+, or Al3+, T is commonly P5+ or V5+, and the Z site is occupied by halides, OH, or small molecules such as H2O, which provides information about the vibration modes of the molecule [44]. The vibrational spectra of apatite supergroup minerals are dominated by TO43– ions. Apatites in both meteorites showed all three volatile groups in different proportions (hydroxylapatite, fluorapatite, and chlorapatite). For the free form of the PO4 ion, with the symmetry of Td, the υ1 mode is nondegenerate symmetric P-O stretching, the asymmetric P-O stretching mode υ3 is triply degenerate, and the corresponding OPO bending vibrations υ2 and υ4 are doubly degenerate and triply degenerate, respectively [55,56,57]. In the studied meteorite samples, the most intense apatite Raman band was υ1 (the Ag vibration derived from the Al free ion vibration) and was observed at around 960 cm−1. Other Raman features assigned to the phosphate modes were 593 (υ4) and 436 (υ2) cm−1.
Figure 8 shows one of the most interesting subgrains measured with Raman imaging. Since Raman imaging provides hundreds of spectra in one single measurement, to analyze the recorded data, the k-means cluster analysis (KMC) was applied. The chemometric analysis using a clustering approach enables one to divide the recorded spectra into spectrally different classes, which indicates the presence of structurally and/or molecularly different classes in the measured area. In the investigated samples, the υ1 band position varied and was observed at 950, 960 and 965–970 cm−1. Those bands were observed in both NWA 10153 and NWA 10645 meteorites. This shift suggests different phosphate phases (crystalline/amorphous) in the samples or changes in the apatite compositions.
The amorphous apatite (amorphous calcium phosphate—ACP) presented in Figure 8 as a red class (Figure 8c,d) was identified based on the Raman band at approximately 950 cm−1 [58,59]. The NWA 10153 sample exhibited higher amounts for crystal domains with amorphous calcium phosphate domains, and the υ1 band was observed at 950–955 cm−1.
The υ1 band at higher wavenumbers of 960–965 cm−1 (Figure 9) suggests the presence of a crystalline phase, which can be assigned to fluorapatite/chlorapatite. The Cl or OH group substitution in the apatite structure causes the υ1 band to shift toward ~960 cm−1, whereas the presence of F in the X-site leads to the presence of the υ1 band at ~965 cm−1. The comparison of the recorded spectra with the reference spectra of chlorapatite (ClAp, RRUFF ID R060192), fluorapatite (FAp, RRUFF ID R040098). and hydroxyapatite (Hap, RRUFF ID R060180) suggests that the observed apatite exhibited the Raman signature of fluorapatite and was shifted to a higher wavenumber position, which is consistent with literature data [56,57,60].
The other clusters, except those marked as gray, represent populations of plagioclase with slightly different Raman spectra (Figure 8). They exhibited the strongest band at ~500 cm−1 (overlapped from two bands at 486 and 506 cm−1) and much weaker bands at 283 and 170 cm−1. The gray spectrum does not enable one to determine the mineral from which it was collected (Figure 8), which possibly is due to strong fluorescence and, consequently, a high signal/background ratio. Nevertheless, the SEM-EDS analyses identified the phase as titanomagnetite.

5. Discussion

Both meteorites revealed similar apatite groups to those previously recognized in nakhlites [10]. However, in comparison to that data, they showed some transformation processes, which were not fully completed; hence, the process paths may be more precisely determined.
Apatites in nakhlites are known to be enriched in LREEs [52,53,54] because of their interaction with LREE-rich fluids before the apatite saturation [10]. The LREEs-enriched rare earth element distribution patterns of apatite in NWA 10153 and NWA 10645 are identical to those previously reported for nakhlites [52,53,54].
Three types of apatite in nakhlites have been classified by McCubbin et al. [10] based on their volatile compositions. Type 1 is represented by apatites from the NWA 998 meteorite and consists of OH-bearing, Cl-rich fluorapatite (F0.84Cl0.76OH0.40 apfu). This type is considered to be of magmatic origin and crystallized from magmas that interacted with Cl- and REE-rich fluids prior to apatite saturation. Type 2 includes OH-poor, F-rich chlorapatite, which is characterized by the large variability in the F:Cl ratio (F0.90Cl1.00OH0.10 apfu). When the type-2 apatite crystallization occurred, which is represented by the Nakhla, Governador Valadares, and Lafayette meteorites, the magma body had most likely reached chloride saturation due to interactions with exsolved Cl-rich fluids that migrated upward through a partially solidified crystal pile, which caused an upward enrichment in Cl in the interstitial liquid and apatite [6]. Type 3 consists of fluorapatites (F1.50Cl0.40OH0.10 apfu) and apatites from the MIL nakhlites, NWA 817, and NWA 5790. These apatites should be considered products of the crystallization from a residual melt after the exsolution and degassing of Cl-rich fluids. Since the order of volatiles preference in the residual melt is F >> Cl >> OH [31], during degassing, the apatite compositions evolve toward the F-rich member. Three populations of apatite can also be distinguished in both studied meteorites (NWA 10153 and NWA 10645) based on the volatile composition (Figure 2).

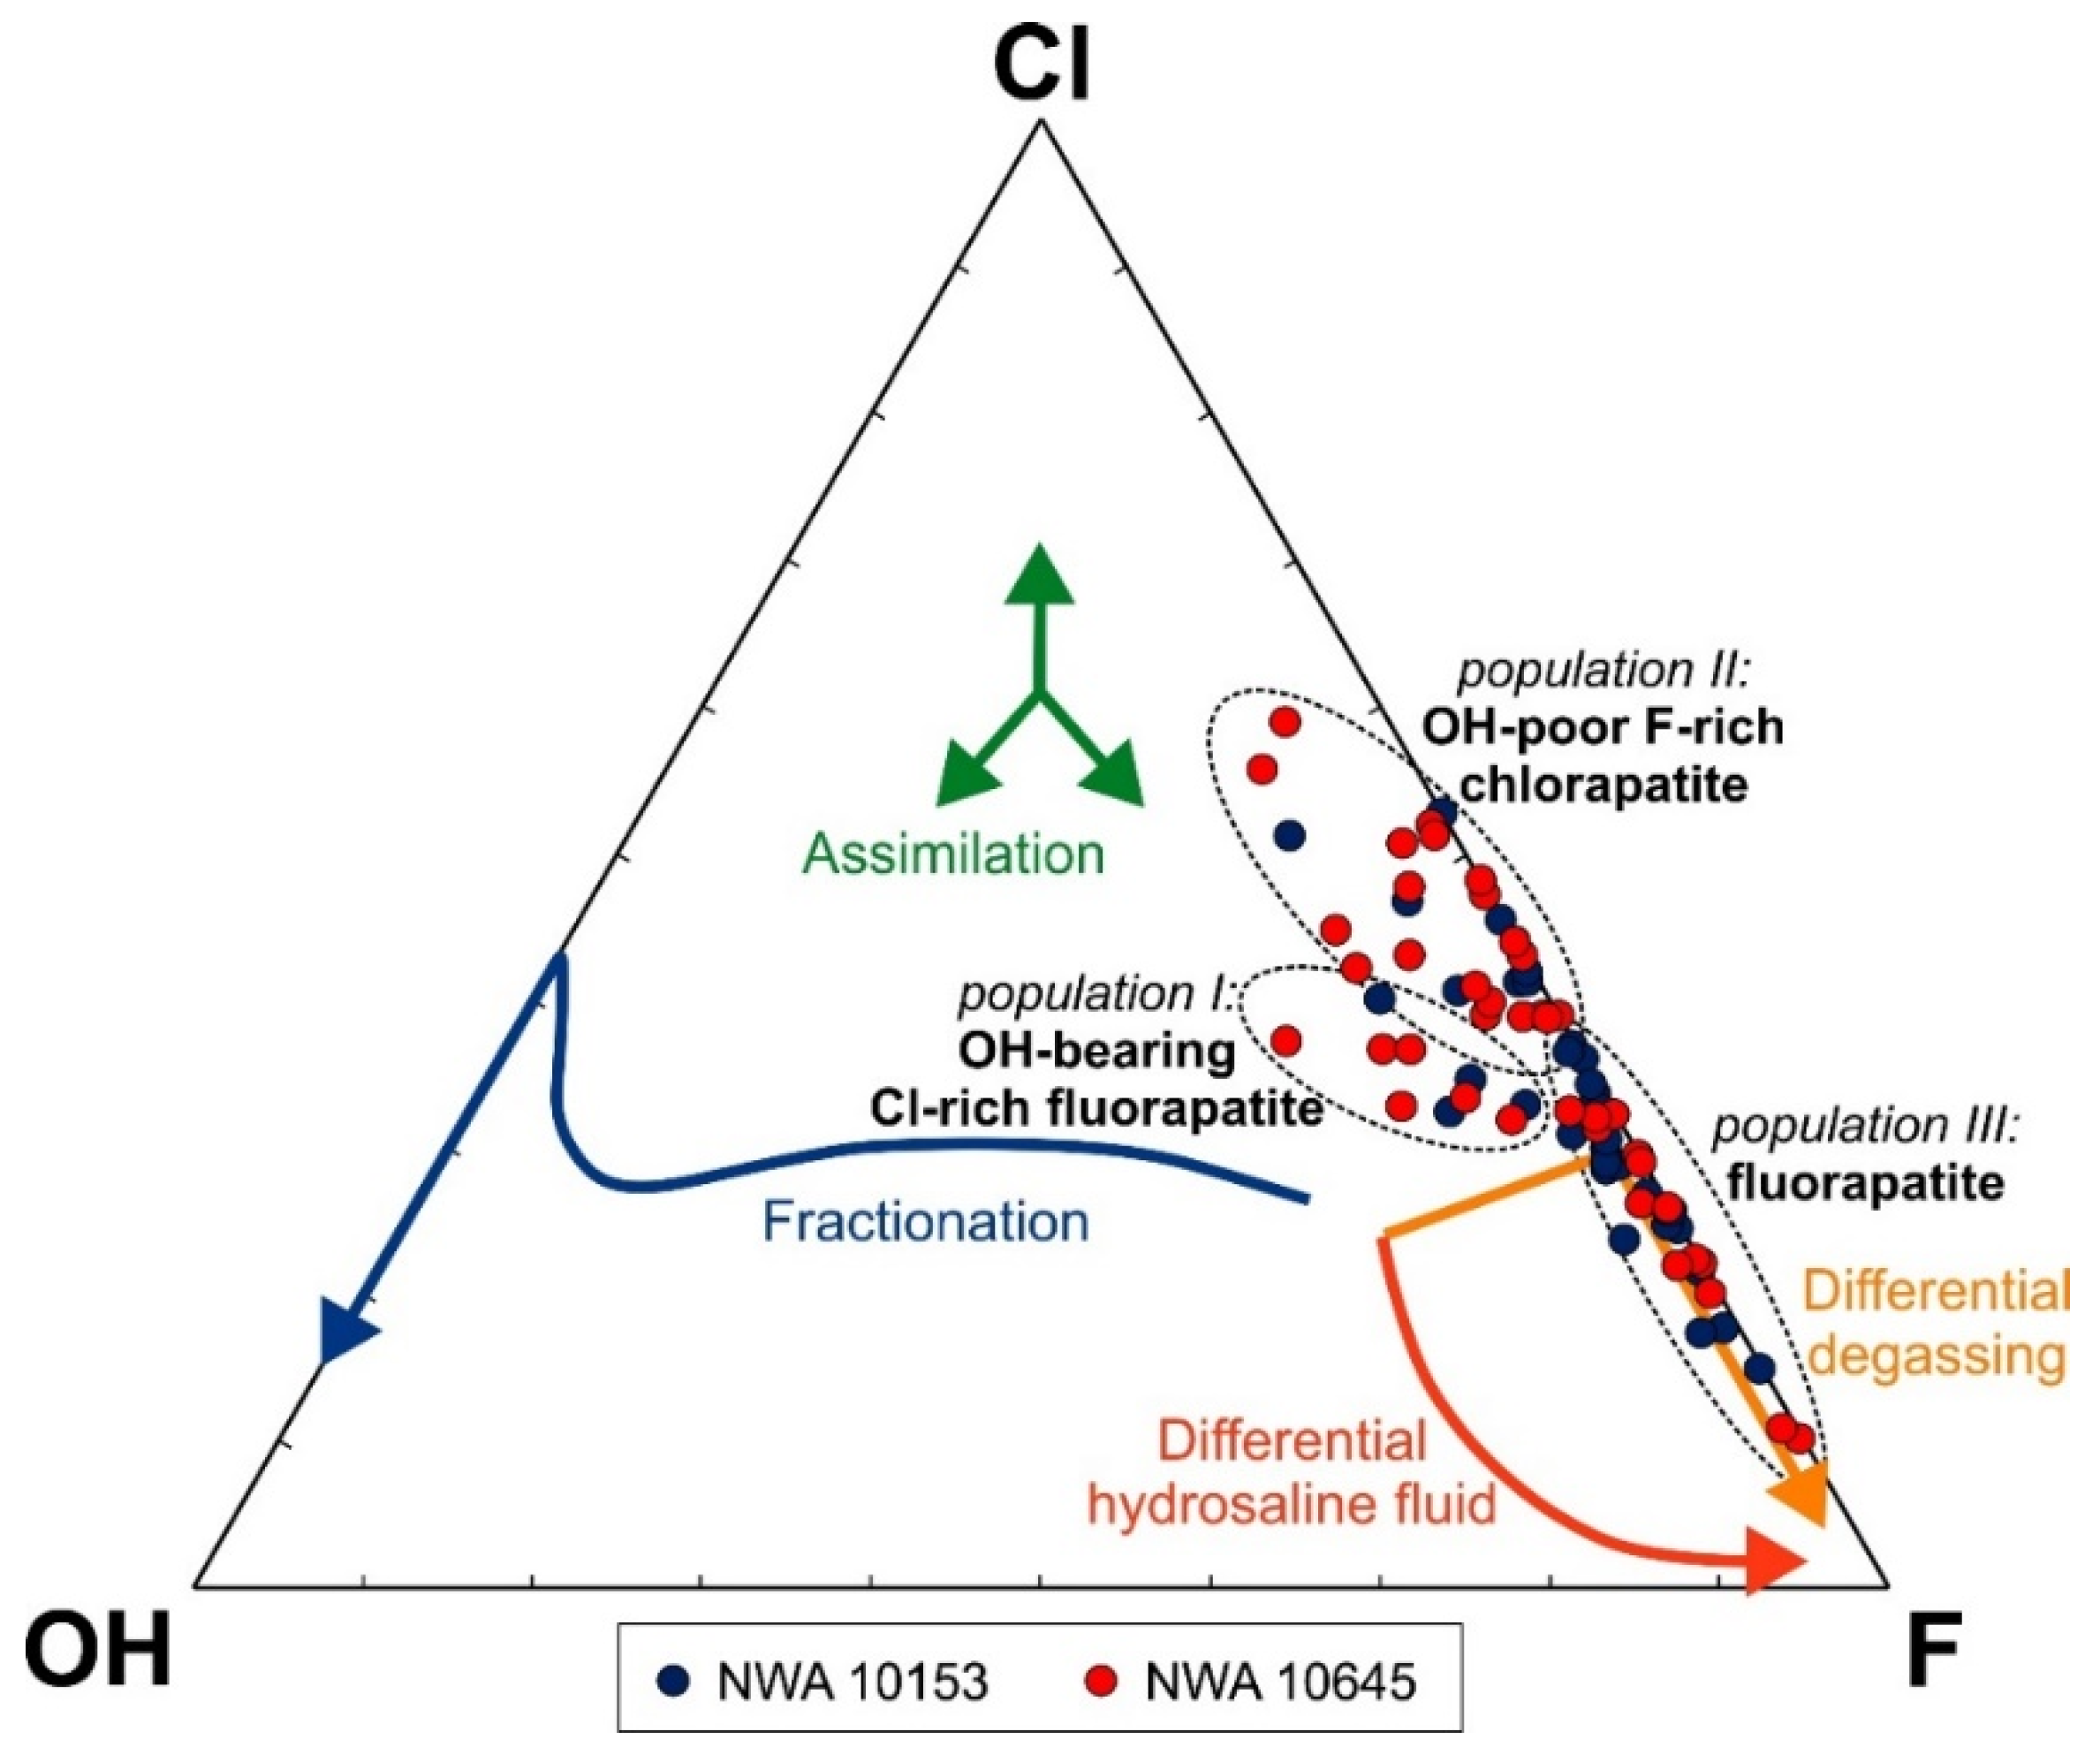
5.1. Population I: OH-Bearing, Cl-Rich Fluorapatite

The first population of apatites observed in NWA 10153 and NWA 10645 is the OH-bearing, Cl-rich fluorapatite (F0.90–1.24Cl0.64–0.90OH0.10–0.34; Table S1, Figure 2). It corresponds to type 1 observed in other nakhlites [10]. Petrographic and TEM observations support a magmatic origin for OH-bearing Cl–F apatites observed in both NWA 10153 and NWA 10645. Postmagmatic alterations were not observed. The TEM studies showed that the individual phosphates crystals were free of dislocations but were separated from each other by dislocation arrays (Figure 6a). Moreover, features such as the fragmented and tilted apatite crystals (Figure 7a,b) and banded lattice fringes (Figure 7h) indicate shock events.

5.2. Population II: OH-Poor, F-Rich Chlorapatite

The second population is OH-poor, F-rich chlorapatite (F0.70–1.36Cl0.61–1.18OH0.00–0.10; Table S1, Figure 2). This group can be correlated with type 2 in McCubbin et al. [10]. It is believed that the OH-poor, F-rich chlorapatite crystallized from a melt that reached chloride saturation. TEM and compositional X-ray maps provided further information. The apatite of this population is composed of slightly tilted polycrystalline apatite (Figure 7e) possibly because of shock events and possibly comparable with a low-shock plastic deformation (stages S1–S3) observed in shergottites [62]. No recrystallization of chlorapatite was observed in NWA 10645, but high-resolution TEM images revealed that the contacts between apatites and the Fe-rich amorphous silica were sharp and abrupt (Figure 7d). This feature indicates the dissolution–reprecipitation processes in the F-rich chlorapatite and, consequently, the presence of fluids. The homogenous and massive enrichment in Cl with subordinate F is associated with an absence of cracks that is visibly enriched in Si, S, and Fe in the compositional X-ray maps (Figure 3). All of these observations suggest a possible magmatic origin for these apatite domains, which is similar to OH-bearing, Cl-rich fluorapatites but from a melt saturated in Cl.

5.3. Population III: Fluorapatite

The third type of apatites observed in nakhlites [10] correlates with fluorapatite (F1.37–1.79Cl0.20–0.60OH0.00−0.08; Table S1, Figure 2) in this study. This group can be considered a product of crystallization after the exsolution and degassing of Cl-rich fluids. The TEM observations and compositional X-ray maps support this idea (Figure 3b,c, Figure 4b,c and Figure 6e). The cracks in the NWA 10153 apatite-host (population II: OH-poor, F-rich chlorapatite) were filled with fine-grained apatite (population III: fluorapatite) of secondary origin (Figure 6e). Their growth morphologies and mutual orientations showed that they nucleated on the crack walls and grew toward the crack centers. The stacks show a common orientation with the apatite host. The diffraction patterns of both generations were identical (Figure 6c,d). However, the composition of the second generation differed from the host apatite. Originating in the secondary processes, apatite (population III) is Cl-free fluorapatite (Figure 6h). Similar parallel-oriented stacks of fluorapatite in cracks were found in the shergottites of NWA 2975 [63]. This indicates the lack of Cl in the last crystallization stage and can be considered a strong argument for the crystallization of secondary fluorapatite because of the exsolution and degassing of Cl-rich fluids [63].

5.4. Composition of Secondary Fluids

The interstitial, second-generation fluorapatites in NWA 10153 and cracks in NWA 10645 are accompanied by a mixture of an amorphous phase containing C, Fe, Mg, S, Si, and K (Figure 6h and Figure 7c,d). The composition of late-stage fluids in nakhlites has been discussed in many papers [9,64,65,66,67,68]. One school of thought holds that the hydrothermal activity occurred at low temperatures (100–200 °C), close to neutral pH, well after the magmatic activity and in the presence of CO2-rich fluids [9,64,66,67]. Another group argues that the fluids were Cl-, S-, Fe-, and LREE-rich, the pH was acidic, and the temperature was approximately 700 °C [6,65,68]. The data obtained in this work seemed to connect both statements. The occurrence of fluorapatite and amorphous material together indicates that both phases simultaneously precipitated (Figure 6f and Figure 7d). The presence of S and Fe bands can be related to the existence of hydrothermal jarosite, hematite, and pyrite assemblage as proposed by McCubbin [68]. The formation of jarosite–hematite assemblages requires the presence of a highly acidic (pH < 4), S- and Fe- rich brine [69]. Additionally, the occurrence of the C, Si, and Mg bands can be explained by the precipitation of a secondary siderite–phyllosilicates amorphous gel in a CO2-rich environment [9]. Finally, the K peak may be associated with potassic-chlorohastingsite or jarosite [68]. Because of the insufficient size, a more accurate identification of the amorphous-phase chemical composition is impossible. The presence of cracks filled with Si, S, and Fe in Figure 4d,e is consistent with the amorphous phase composition identified by TEM (Figure 7d) and may be related to the crystal–fluid interaction. Similarly, high FeO concentrations in EPMA data (Table 1, Tables S1 and S2) and positive correlation between Fe and S in compositional X-ray maps (Figure 4d,e) clearly indicate the presence of Fe-sulfide/sulfate within cracks. Moreover, the patchy F-enrichment of the marginal domains of the crystals in NWA 10153 (Figure 3c) and strong heterogeneity in Cl and F in NWA 10645 (Figure 4b,c) indicate their growth after the exsolution and the degassing of Cl-rich fluids, which change the volatile proportions in the remaining melt in favor of F.
The age of secondary alterations at low temperatures was proposed to be 633 ± 23 Ma ago [70], whereas the high-temperature alteration possibly occurred shortly after the nakhlites emplacement between 1.26 and 1.42 Ga [14,15,16,17,18]. Considering the presented data, alterations that were considered low-temperature actually occurred at much higher temperatures and much earlier than the proposed aqueous alteration [70].

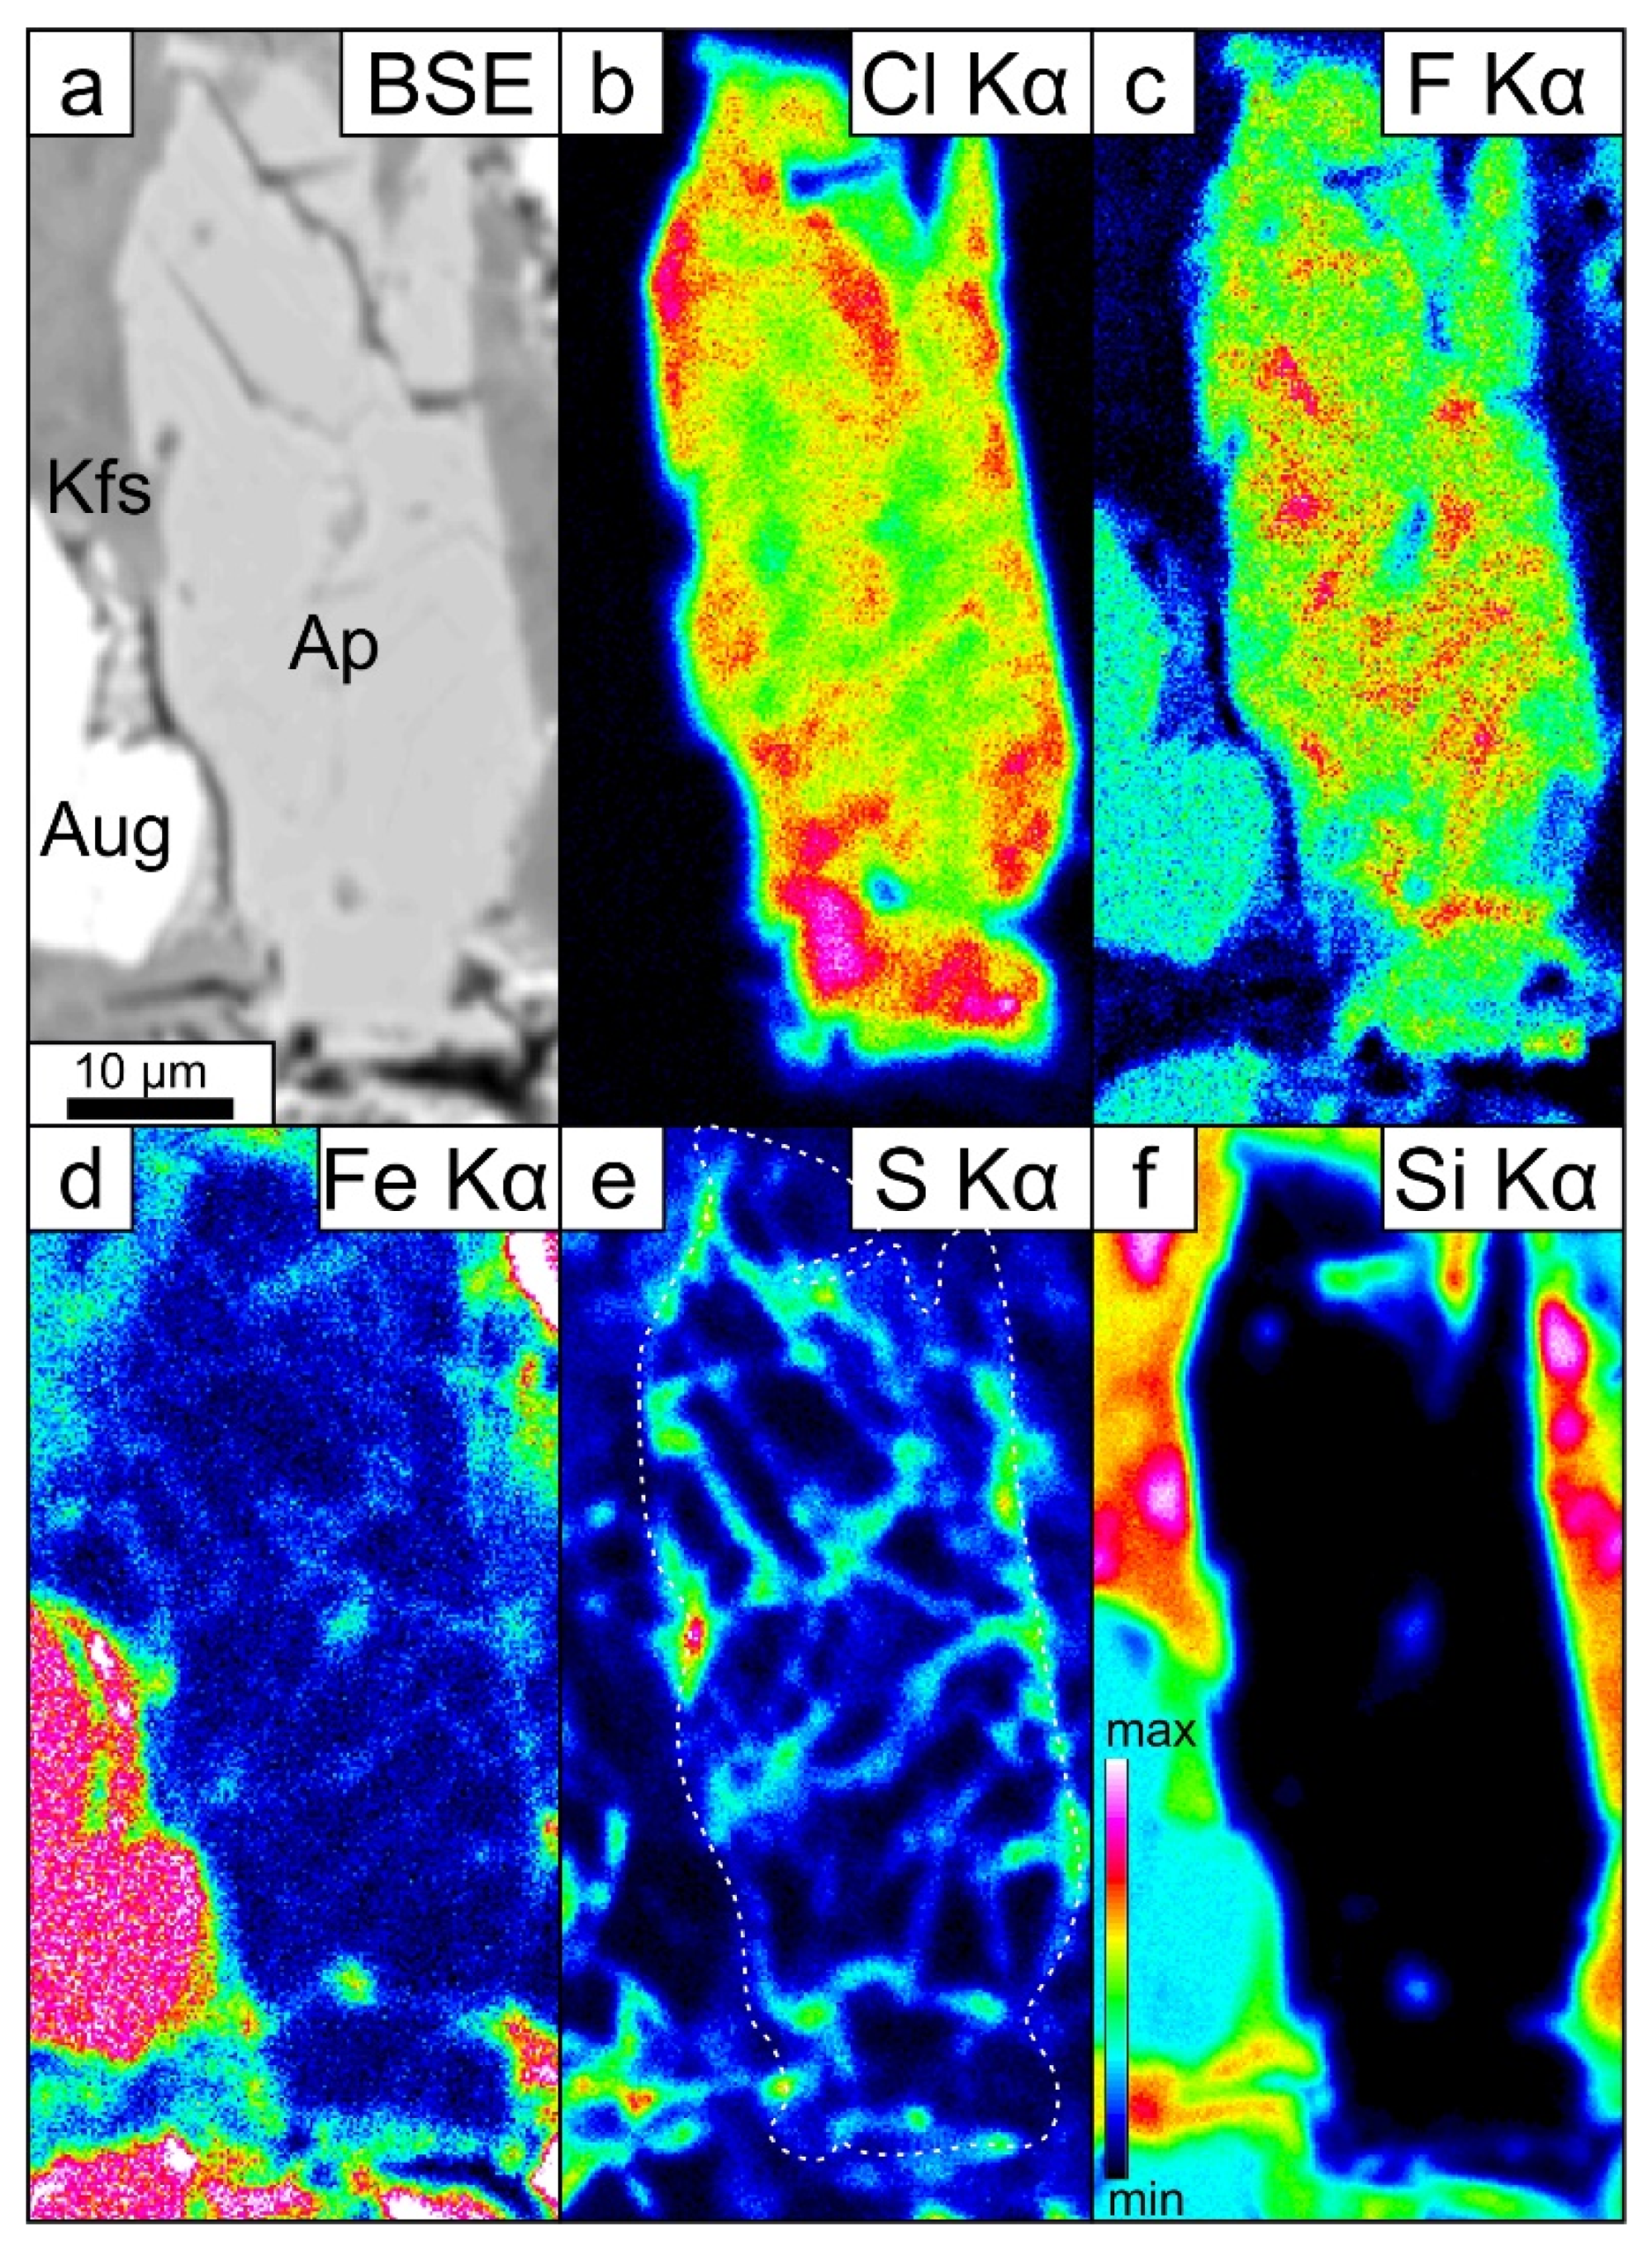
5.5. Amorphous Phosphate Domains

The patchy volatiles distribution in some apatites and the presence of amorphous domains in apatite cracks are important links that connect some apatite subgrains of magmatic origin with other subgrains in the same crystal that were subjected to the interaction with fluids. Crucial for the understanding of the apatite crystal transformation, which occurred because of the interactions with fluids, are the phosphate domains in the crystalline apatite structures, which have been identified by Raman spectroscopy as being amorphous.
The crystal transformation via interactions with hydrothermal fluids was identified as a dissolution–reprecipitation process [71,72,73,74,75,76]. It assumes three stages: (1) transition of crystal compounds into solution, (2) achievement of new saturation states in the solution and (3) reverse process of nucleation and precipitation of a new phase. Solution properties such as the supersaturation, pH, and ratio of cations to anions determine the thermodynamic relationships between the solution and the crystal and, consequently, the possible crystal nucleation and/or its dissolution [77]. Amorphous calcium phosphate (ACP) is the first solid phase formed during the apatite precipitation [58]. ACP readily transforms to a more thermodynamically stable crystalline phase (e.g., apatite) [78,79,80,81,82].
Raman spectroscopy is a suitable tool to observe the transformation of ACP to crystalline apatite for in situ experiments [59], stomatology [83], zoology [84,85], and medicine [86,87]. In all studies, this transformation is observed as a clear v1 Raman band shift from ~950 cm−1 (ACP marked band) to ~960 cm−1 (apatite), and a sharpening of the 960 cm−1 band manifests as a decreasing full width at half maximum (FWHM) value, which is possibly caused by an increase in both crystallinity and lattice ordering during the transformation [59]. Decreasing of FWHM towards crystallization was also observed in our samples. For the apatite phase, FWHM was around 26 ± 1, while the Raman band at 950 cm−1 had FWHM around 34 ± 2.
Although the transformation of ACP to apatite has been commonly observed in biomineralogy, reports on its occurrence in abiotic environments are limited. It has been suggested that the seawater-like REE pattern of Precambrian BIF apatites appears to be related to its formation near the water–sediment interface via a transient amorphous phase [88]. Moreover, as reported in 535 Myr Lower Cambrian, phosphorite phosphate aggregates (i.e., apatite radial flowers (ARFs)) are composed of amorphous phosphate “rays” and partially crystalline cores [89]. The presence of ARFs in stromatolites was a result of the precipitation of ACP and its consequent partial transformation to crystalline apatite [90]. In experiments, after the reaction with 1 N HCl at 600 °C and 500 MPa, fluorapatite consisted of a series of subparallel nanochannels and an assemblage of monazite grains in a cavity filled with an amorphous material with a Cl-rich fluorapatite composition [91]. The observation of amorphous domains in transformed apatites in meteorites possibly indicates a similar process (Figure 8). Comparable conditions and fluid compositions (acidic and Cl-rich) have been proposed to wane magmatism in nakhlites [6,68]. It was possibly related to the degassed magmatic fluids and provided an environment for crystallization of apatite populations II and III, precipitation of ACP, and amorphous phase filling cracks in fluorapatite.
The other possible explanation of the ACP occurrence that must be considered is its shock-induced origin. Nakhlites are known to exhibit only limited traces of shock effects [5]. Similarly, optical microscope observations and SEM images show relatively low shock-deformations (e.g., plagioclase and other minerals in both meteorites are irregularly fractured). Furthermore, some shock-related textures are clearly visible based on the TEM and Raman spectroscopy. The crystal lattice bending (Figure 7h) and fragmented and tilted apatite crystals (Figure 7a,b) were observed in apatite in NWA 10645. Similar crystal–plastic deformations were reported from relatively low-shocked Martian shergottites and lunar highlands samples (stages S2–S3 in the six-stages scale) [62,92,93]. Moreover, the Raman spectra collected from lunar apatites indicates that the υ1 band weakened during the progressive increase of shock degree and disappearance of the υ2 and υ4 bands in stage S5 [94]. In the ACP spectrum (Figure 8), both bands are visible, which may indicate a stage lower than S5. Furthermore, the υ1 band in ACP and apatite spectra (Figure 8 and Figure 9) is sharp, which similarly indicates a shock stage below S5. Shock-induced microtextures were observed not only in apatite but also in plagioclase. The lack of twinned plagioclase crystals in lunar apatite is related to the S1-stage shock [94]. Moreover, the presence of clearly distinguishable Raman bands at ~285, ~486, and ~506 cm−1 in different plagioclase clusters in NWA 10645 in comparison to the literature data [94] clearly indicate the S1–S4 shock stage. All signs indicate a lack of significant structural disorder and low-shock effects, which are most likely not sufficiently strong to cause recrystallization that was reported in high-shock stages (S5–S6) [62,94] and possibly not sufficiently powerful to cause the amorphization of apatite in either meteorite.

6. Conclusions

The two studied meteorites, NWA 10153 and NWA 10645, show three compositionally different apatite groups, similar to those previously described in nakhlites of magmatic and hydrothermal origin. The present study recognizes a fourth phase, which is amorphous, and may be considered a transition phase between magmatic and hydrothermal phases. Because of their interactions with fluids, magmatic apatites change their primary compositions and evolve toward chlorapatites (however, they do not achieve a pure chlorapatite endmember arrangement). The transformation occurs through dissolution–precipitation, and the amorphous phosphate domains are witnesses to the process. They have been identified by Raman analyses. The interaction with fluids and the resulting transformation cause the volatile distribution patterns to become irregular and patchy. Degassing of restitic magma causes fluorapatite crystallization. The fluorapatite crystals appear in the primary magmatic apatite hosts and show a strong structural affinity for the last episode of system evolution. In addition, the amorphous phase occurring together with fluorapatite indicates the presence of not only Cl-rich fluids, but also the presence of C, Fe, Mg, S, Si, and K. This result suggests a high-temperature hydrothermal episode with a complex fluid composition. The apatites in both studied meteorites are interesting and diverse materials, and one can reconstruct the entire sequence of the formation and transformation processes. This outcome occurs because each process has left its relics and intermediate phases to facilitate such a reconstruction.

Supplementary Materials

The following are available online at https://www.mdpi.com/2075-163X/9/11/695/s1. Table S1: Electron microprobe analyses of apatites from the NWA10645 and NWA10153 meteorites using the first protocol (dedicated to volatiles). Table S2: Electron microprobe analyses of apatites from the NWA10645 and NWA10153 meteorites using the second protocol (dedicated to trace elements). Table S3: Trace element abundances (µg/g) in the apatites from the NWA 10645 and NWA 10153 meteorites determined by LA-ICP-MS. <DL = below detection limit; inc = not evaluated due to an inclusion in the LA signal.

Author Contributions

Ł.B. and E.S. conceived the research; E.C. provided research material; R.W. performed TEM analyses and analyzed the data; G.A.K.-B. performed EPMA analyses and collected compositional X-ray maps for F, Cl, Si, S and Fe; Ł.B., I.K. and A.Z. analyzed and processed the EPMA data; K.M. collected Raman spectra and analyzed the data; J.S. collected LA-ICP-MS analyses; Ł.B. and K.L. analyzed the LA-ICP-MS data; the discussion and implications have been prepared by all authors; and Ł.B.and E.S. wrote the paper.

Funding

The study was co-funded by Polish NCN grant No. 2013/11/B/ST10/04753 and a grant for young scientists at the Institute of Geological Sciences PAS, and supported by COST Action TD1308 “ORIGINS”.

Acknowledgments

We appreciate thoughtful and constructive reviews by three anonymous reviewers who provided inspiring advice. We would like to thank Anja Schreiber for preparation of foils for TEM study.

Conflicts of Interest

The authors declare no conflicts of interest.

References

  1. Rickman, H.; Błęcka, M.I.; Gurgurewicz, J.; Jørgensen, U.G.; Słaby, E.; Szutowicz, S.; Zalewska, N. Water in the history of Mars: An assessment. Planet. Space Sci. 2019, 166, 70–89. [Google Scholar] [CrossRef]
  2. Newsom, H.E.; Hagerty, J.J.; Goff, F. Mixed hydrothermal fluids and the origin of the Martian soil. J. Geophys. Res. Planets 1999, 104, 8717–8728. [Google Scholar] [CrossRef] [Green Version]
  3. Rao, M.N.; Sutton, S.R.; McKay, D.S.; Dreibus, G. Clues to Martian brines based on halogens in salts from nakhlites and MER samples. J. Geophys. Res. E Planets 2005, 110, 1–12. [Google Scholar] [CrossRef]
  4. Rao, M.N.; Nyquist, L.E.; Wentworth, S.J.; Sutton, S.R.; Garrison, D.H. The nature of Martian fluids based on mobile element studies in salt-assemblages from Martian meteorites. J. Geophys. Res. 2008, 113, 1–12. [Google Scholar] [CrossRef]
  5. Treiman, A.H. The nakhlite meteorites: Augite-rich igneous rocks from Mars. Geochemistry 2005, 65, 203–270. [Google Scholar] [CrossRef]
  6. McCubbin, F.M.; Nekvasil, H. Maskelynite-hosted apatite in the Chassigny meteorite: Insights into late-stage magmatic volatile evolution in martian magmas. Am. Mineral. 2008, 93, 676–684. [Google Scholar] [CrossRef]
  7. Schwenzer, S.P.; Herrmann, S.; Ott, U. Noble gases in two shergottites and one nakhlite from Antarctica: Y000027, Y000097, and Y000593. Polar Sci. 2009, 3, 83–99. [Google Scholar] [CrossRef] [Green Version]
  8. Filiberto, J.; Treiman, A.H. Martian magmas contained abundant chlorine, but little water. Geology 2009, 37, 1087–1090. [Google Scholar] [CrossRef]
  9. Changela, H.G.; Bridges, J.C. Alteration assemblages in the nakhlites: Variation with depth on Mars. Meteorit. Planet. Sci. 2011, 45, 1847–1867. [Google Scholar] [CrossRef]
  10. McCubbin, F.M.; Elardo, S.M.; Shearer, C.K.; Smirnov, A.; Hauri, E.H.; Draper, D.S. A petrogenetic model for the comagmatic origin of chassignites and nakhlites: Inferences from chlorine-rich minerals, petrology, and geochemistry. Meteorit. Planet. Sci. 2013, 48, 819–853. [Google Scholar] [CrossRef] [Green Version]
  11. Cartwright, J.A.A.; Gilmour, J.D.D.; Burgess, R. Martian fluid and Martian weathering signatures identified in Nakhla, NWA 998 and MIL 03346 by halogen and noble gas analysis. Geochim. Cosmochim. Acta 2013, 105, 255–293. [Google Scholar] [CrossRef]
  12. Weis, F.A.; Bellucci, J.J.; Skogby, H.; Stalder, R.; Nemchin, A.A.; Whitehouse, M.J. Water content in the Martian mantle: A Nakhla perspective. Geochim. Cosmochim. Acta 2017, 212, 84–98. [Google Scholar] [CrossRef]
  13. Udry, A.; Day, J.M.D. 1.34 billion-year-old magmatism on Mars evaluated from the co-genetic nakhlite and chassignite meteorites. Geochim. Cosmochim. Acta 2018, 238, 292–315. [Google Scholar] [CrossRef]
  14. Nyquist, L.E.E.; Bogard, D.D.D.; Shih, C.-Y.; Greshake, A.; Stöffler, D.; Eugster, O. Ages and Geologic Histories of Martian Meteorites. Space Sci. Rev. 2001, 96, 105–164. [Google Scholar] [CrossRef]
  15. Korochantseva, E.V.; Schwenzer, S.P.; Buikin, A.I.; Hopp, J.; Ott, U.; Trieloff, M. 40Ar-39Ar and cosmic-ray exposure ages of nakhlites-Nakhla, Lafayette, Governador Valadares-and Chassigny. Meteorit. Planet. Sci. 2011, 46, 1397–1417. [Google Scholar] [CrossRef]
  16. Herzog, G.F.; Caffee, M.W. Cosmic-Ray Exposure Ages of Meteorites. In Treatise on Geochemistry, 2nd ed.; Turekian, K., Holland, H., Eds.; Elsevier Science & Technology: Oxford, UK, 2014; pp. 419–454. [Google Scholar] [CrossRef]
  17. Wieler, R.; Huber, L.; Busemann, H.; Seiler, S.; Leya, I.; Maden, C.; Masarik, J.; Meier, M.M.M.; Nagao, K.; Trappitsch, R.; et al. Noble gases in 18 Martian meteorites and angrite Northwest Africa 7812-Exposure ages, trapped gases, and a re-evaluation of the evidence for solar cosmic ray-produced neon in shergottites and other achondrites. Meteorit. Planet. Sci. 2016, 51, 407–428. [Google Scholar] [CrossRef]
  18. Cohen, B.E.; Mark, D.F.; Cassata, W.S.; Lee, M.R.; Tomkinson, T.; Smith, C.L. Taking the pulse of Mars via dating of a plume-fed volcano. Nat. Commun. 2017, 8, 640. [Google Scholar] [CrossRef] [PubMed]
  19. McCubbin, F.M.; Jones, R.H. Extraterrestrial Apatite: Planetary Geochemistry to Astrobiology. Elements 2015, 11, 183–188. [Google Scholar] [CrossRef]
  20. Ganapathy, R.; Anders, E. Ages of calcium-rich achondrites—II: Howardites, nakhlites, and the Angra dos Reis angrite. Geochim. Cosmochim. Acta 1969, 33, 775–787. [Google Scholar] [CrossRef]
  21. Eugster, O.; Busemann, H.; Lorenzetti, S.; Terribilini, D. Ejection ages from krypton-81-krypton-83 dating and pre-atmospheric sizes of martian meteorites. Meteorit. Planet. Sci. 2002, 37, 1345–1360. [Google Scholar] [CrossRef]
  22. Rubin, A.E. Mineralogy of meteorite groups. Meteorit. Planet. Sci. 1997, 32, 231–247. [Google Scholar] [CrossRef]
  23. Piccoli, P.M.; Candela, P.A. Apatite in Igneous Systems. Rev. Mineral. Geochem. 2002, 48, 255–292. [Google Scholar] [CrossRef]
  24. Howarth, G.H.; Pernet-Fisher, J.F.; Bodnar, R.J.; Taylor, L.A. Evidence for the exsolution of Cl-rich fluids in martian magmas: Apatite petrogenesis in the enriched lherzolitic shergottite Northwest Africa 7755. Geochim. Cosmochim. Acta 2015, 166, 234–248. [Google Scholar] [CrossRef]
  25. Jolliff, B.L.; Haskin, L.A.; Colson, R.O.; Wadhwa, M. Partitioning in REE-saturating minerals: Theory, experiment, and modelling of whitlockite, apatite, and evolution of lunar residual magmas. Geochim. Cosmochim. Acta 1993, 57, 4069–4094. [Google Scholar] [CrossRef]
  26. Mikouchi, T.; Miyamoto, M.; McKay, G.A. Mineralogy of Antarctic basaltic shergottite Queen Alexandra Range 94201: Similarities to Elephant Moraine A79001 (Lithology B) martian meteorite. Meteorit. Planet. Sci. 1998, 33, 181–189. [Google Scholar] [CrossRef]
  27. Herd, C.D.K.; Treiman, A.H.; Mckay, G.A.; Shearer, C.K. The behavior of Li and B during planetary basalt crystallization. Am. Mineral. 2004, 89, 832–840. [Google Scholar] [CrossRef]
  28. Patiño Douce, A.E.; Roden, M.F.; Chaumba, J.; Fleisher, C.; Yogodzinski, G. Compositional variability of terrestrial mantle apatites, thermodynamic modeling of apatite volatile contents, and the halogen and water budgets of planetary mantles. Chem. Geol. 2011, 288, 14–31. [Google Scholar] [CrossRef]
  29. Shearer, C.K.; Burger, P.V.; Papike, J.J.; Sharp, Z.D.; Mckeegan, K.D. Fluids on differentiated asteroids: Evidence from phosphates in differentiated meteorites GRA 06128 and GRA 06129. Meteorit. Planet. Sci. 2011, 46, 1345–1362. [Google Scholar] [CrossRef]
  30. McCubbin, F.M.; Hauri, E.H.; Elardo, S.M.; Vander Kaaden, K.E.; Wang, J.; Shearer, C.K. Hydrous melting of the martian mantle produced both depleted and enriched shergottites. Geology 2012, 40, 683–686. [Google Scholar] [CrossRef]
  31. McCubbin, F.M.; Shearer, C.K.; Burger, P.V.; Hauri, E.H.; Wang, J.; Elardo, S.M.; Papike, J.J. Volatile abundances of coexisting merrillite and apatite in the martian meteorite Shergotty: Implications for merrillite in hydrous magmas. Am. Mineral. 2014, 99, 1347–1354. [Google Scholar] [CrossRef]
  32. Tartèse, R.; Anand, M.; Barnes, J.J.; Starkey, N.A.; Franchi, I.A.; Sano, Y. The abundance, distribution, and isotopic composition of Hydrogen in the Moon as revealed by basaltic lunar samples: Implications for the volatile inventory of the Moon. Geochim. Cosmochim. Acta 2013, 122, 58–74. [Google Scholar] [CrossRef]
  33. Santos, A.R.; Agee, C.B.; Mccubbin, F.M.; Shearer, C.K.; Burger, P.V.; Sharp, Z.D.; Zimmer, M. Apatite and merrillite from Martian meteorite NWA 7034. In Proceedings of the 44th Lunar and Planetary Science Conference 2013, The Woodlands, TX, USA, 18–22 March 2013; Volume 1719, p. 2601. [Google Scholar]
  34. Howarth, G.H.; Liu, Y.; Chen, Y.; Pernet-Fisher, J.F.; Taylor, L.A. Postcrystallization metasomatism in shergottites: Evidence from the paired meteorites LAR 06319 and LAR 12011. Meteorit. Planet. Sci. 2016, 51, 2061–2072. [Google Scholar] [CrossRef]
  35. Liu, Y.; Ma, C.; Beckett, J.R.; Chen, Y.; Guan, Y. Rare-earth-element minerals in martian breccia meteorites NWA 7034 and 7533: Implications for fluid–rock interaction in the martian crust. Earth Planet. Sci. Lett. 2016, 451, 251–262. [Google Scholar] [CrossRef]
  36. Bellucci, J.J.; Whitehouse, M.J.; John, T.; Nemchin, A.A.; Snape, J.F.; Bland, P.A.; Benedix, G.K. Halogen and Cl isotopic systematics in Martian phosphates: Implications for the Cl cycle and surface halogen reservoirs on Mars. Earth Planet. Sci. Lett. 2017, 458, 192–202. [Google Scholar] [CrossRef]
  37. Bouvier, A.; Gattacceca, J.; Grossman, J.; Metzler, K. The Meteoritical Bulletin, No. 105. Meteorit. Planet. Sci. 2017, 52, 2411. [Google Scholar] [CrossRef]
  38. Day, J.M.D.; Taylor, L.A.; Floss, C.; McSween, H.Y. Petrology and chemistry of MIL 03346 and its significance in understanding the petrogenesis of nakhlites on Mars. Meteorit. Planet. Sci. 2006, 41, 581–606. [Google Scholar] [CrossRef]
  39. Daly, L.; Lee, M.R.; Piazolo, S.; Griffin, S.; Bazargan, M.; Campanale, F.; Chung, P.; Cohen, B.E.; Pickersgill, A.E.; Hallis, L.J.; et al. Boom boom pow: Shock-facilitated aqueous alteration and evidence for two shock events in the Martian nakhlite meteorites. Sci. Adv. 2019, 5, eaaw5549. [Google Scholar] [CrossRef] [PubMed] [Green Version]
  40. Whitney, D.L.; Evans, B.W. Abbreviations for names of rock-forming minerals. Am. Mineral. 2010, 95, 185–187. [Google Scholar] [CrossRef]
  41. Wirth, R. Focused Ion Beam (FIB): A novel technology for advanced application of micro- and nanoanalysis in geosciences and applied mineralogy. Eur. J. Mineral. 2004, 16, 863–876. [Google Scholar] [CrossRef] [Green Version]
  42. Wirth, R. Focused Ion Beam (FIB) combined with SEM and TEM: Advanced analytical tools for studies of chemical composition, microstructure and crystal structure in geomaterials on a nanometre scale. Chem. Geol. 2009, 261, 217–229. [Google Scholar] [CrossRef]
  43. White, T.J.; ZhiLi, D. Structural derivation and crystal chemistry of apatites. Acta Crystallogr. Sect. B Struct. Sci. 2003, 59, 1–16. [Google Scholar] [CrossRef] [PubMed]
  44. Pasero, M.; Kampf, A.R.; Ferraris, C.; Pekov, I.V.; Rakovan, J.; White, T.J. Nomenclature of the apatite supergroup minerals. Eur. J. Mineral. 2010, 22, 163–179. [Google Scholar] [CrossRef]
  45. Goldoff, B.; Webster, J.D.; Harlov, D.E. Characterization of fluor-chlorapatites by electron probe microanalysis with a focus on time-dependent intensity variation of halogens. Am. Mineral. 2012, 97, 1103–1115. [Google Scholar] [CrossRef]
  46. Stock, M.J.; Humphreys, M.C.S.; Smith, V.C.; Johnson, R.D.; Pyle, D.M. New constraints on electron-beam induced halogen migration in apatite. Am. Mineral. 2015, 100, 281–293. [Google Scholar] [CrossRef]
  47. Ketcham, R.A. Technical Note: Calculation of stoichiometry from EMP data for apatite and other phases with mixing on monovalent anion sites. Am. Mineral. 2015, 100, 1620–1623. [Google Scholar] [CrossRef]
  48. Tunheng, A.; Hirata, T. Development of signal smoothing device for precise elemental analysis using laser ablation-ICP-mass spectrometry. J. Anal. At. Spectrom. 2004, 19, 932–934. [Google Scholar] [CrossRef]
  49. Van Achterbergh, E.; Ryan, C.G.; Jackson, S.E.; Griffin, W.L. Data reduction software for LA-ICP-MS. In Laser Ablation-ICPMS in the Earth Sciences: Principles and Applications; Sylvester, P.J., Ed.; Mineralogical Association of Canada: Ottawa, ON, Canada, 2001; pp. 239–243. [Google Scholar]
  50. McCubbin, F.M.; Boyce, J.W.; Srinivasan, P.; Santos, A.R.; Elardo, S.M.; Filiberto, J.; Steele, A.; Shearer, C.K. Heterogeneous distribution of H2O in the Martian interior: Implications for the abundance of H2O in depleted and enriched mantle sources. Meteorit. Planet. Sci. 2016, 51, 2036–2060. [Google Scholar] [CrossRef]
  51. McDonough, W.F.; Sun, S.-S. The composition of the Earth. Chem. Geol. 1995, 120, 223–253. [Google Scholar] [CrossRef]
  52. Wadhwa, M.; Crozaz, G. Trace and minor elements in minerals of nakhlites and Chassigny: Clues to their petrogenesis. Geochim. Cosmochim. Acta 1995, 59, 3629–3645. [Google Scholar] [CrossRef]
  53. Terada, K.; Sano, Y. Ion microprobe U-Th-Pb dating and REE analyses of phosphates in the nakhlites Lafayette and Yamato-000593/000749. Meteorit. Planet. Sci. 2004, 39, 2033–2041. [Google Scholar] [CrossRef]
  54. Wadhwa, M.; Crozaz, G.; Barrat, J.-A. Trace element distributions in the Yamato 000593/000749, NWA 817 and NWA 998 nakhlites: Implications for their petrogenesis and mantle source on Mars. Antarct. Meteor. Res. 2004, 17, 97–116. [Google Scholar]
  55. Kravitz, L.C.; Kingsley, J.D.; Elkin, E.L. Raman and Infrared Studies of Coupled PO4−3 Vibrations. J. Chem. Phys. 1968, 49, 4600–4610. [Google Scholar] [CrossRef]
  56. Comodi, P.; Liu, Y.; Frezzotti, M.L. Structural and vibrational behaviour of fluorapatite with pressure. Part II: In situ micro-Raman spectroscopic investigation. Phys. Chem. Miner. 2001, 28, 225–231. [Google Scholar] [CrossRef]
  57. He, Q.; Liu, X.; Hu, X.; Li, S.; Wang, H. Solid solution between lead fluorapatite and lead fluorvanadate apatite: Mixing behavior, Raman feature and thermal expansivity. Phys. Chem. Miner. 2011, 38, 741–752. [Google Scholar] [CrossRef]
  58. Combes, C.; Rey, C. Amorphous calcium phosphates: Synthesis, properties and uses in biomaterials. Acta Biomater. 2010, 6, 3362–3378. [Google Scholar] [CrossRef] [PubMed] [Green Version]
  59. Stammeier, J.A.A.; Purgstaller, B.; Hippler, D.; Mavromatis, V.; Dietzel, M. In-situ Raman spectroscopy of amorphous calcium phosphate to crystalline hydroxyapatite transformation. MethodsX 2018, 5, 1241–1250. [Google Scholar] [CrossRef] [PubMed]
  60. Glass, B.P.; Fries, M. Micro-Raman spectroscopic study of fine-grained, shock-metamorphosed rock fragments from the Australasian microtektite layer. Meteorit. Planet. Sci. 2008, 43, 1487–1496. [Google Scholar] [CrossRef]
  61. Database of Raman spectroscopy, X-ray diffraction and chemistry of minerals. Available online: http://rruff.info/ (accessed on 8 September 2019).
  62. Kizovski, T.V.; White, L.F.; Tait, K.T.; Darling, J.; Moser, D.E.; Barker, I.; Joy, B.; McCubbin, F.M.; Černok, A.; De Cecco, V.E.; et al. Identifying the effects of shock on the composition of Martian phosphate minerals using correlative structural and chemical techniques. In Proceedings of the 50th Lunar and Planetary Science Conference 2019, The Woodlands, TX, USA, 18–22 March 2019; Volume 2132, p. 2731. [Google Scholar]
  63. Słaby, E.; Förster, H.-J.; Wirth, R.; Giera, A.; Birski, Ł.; Moszumańska, I. Validity of the Apatite/Merrillite Relationship in Evaluating the Water Content in the Martian Mantle: Implications from Shergottite Northwest Africa (NWA) 2975. Geosciences 2017, 7, 99. [Google Scholar] [CrossRef]
  64. Hicks, L.J.; Bridges, J.C.; Gurman, S.J. Ferric saponite and serpentine in the nakhlite martian meteorites. Geochim. Cosmochim. Acta 2014, 136, 194–210. [Google Scholar] [CrossRef] [Green Version]
  65. Filiberto, J.; Treiman, A.H.; Giesting, P.A.; Goodrich, C.A.; Gross, J. High-temperature chlorine-rich fluid in the martian crust: A precursor to habitability. Earth Planet. Sci. Lett. 2014, 401, 110–115. [Google Scholar] [CrossRef]
  66. Bridges, J.C.; Catling, D.C.; Saxton, J.M.; Swindle, T.D.; Lyon, I.C.; Grady, M.M. Alteration assemblages in Martian meteorites: Implications for near-surface processes. Space Sci. Rev. 2001, 96, 365–392. [Google Scholar] [CrossRef]
  67. Bridges, J.C.; Schwenzer, S.P. The nakhlite hydrothermal brine on Mars. Earth Planet. Sci. Lett. 2012, 359–360, 117–123. [Google Scholar] [CrossRef]
  68. McCubbin, F.M.; Tosca, N.J.; Smirnov, A.; Nekvasil, H.; Steele, A.; Fries, M.; Lindsley, D.H. Hydrothermal jarosite and hematite in a pyroxene-hosted melt inclusion in martian meteorite Miller Range (MIL) 03346: Implications for magmatic-hydrothermal fluids on Mars. Geochim. Cosmochim. Acta 2009, 73, 4907–4917. [Google Scholar] [CrossRef]
  69. Papike, J.J.; Karner, J.M.; Shearer, C.K. Comparative planetary mineralogy: Implications of martian and terrestrial jarosite. A crystal chemical perspective. Geochim. Cosmochim. Acta 2006, 70, 1309–1321. [Google Scholar] [CrossRef]
  70. Borg, L.; Drake, M.J. A review of meteorite evidence for the timing of magmatism and of surface or near-surface liquid water on Mars. J. Geophys. Res. E Planets 2005, 110, 1–10. [Google Scholar] [CrossRef]
  71. Manecki, M.; Maurice, P.A.; Traina, S.J. Uptake of aqueous Pb by Cl-, F-, and OH- apatites: Mineralogic evidence for nucleation mechanisms. Am. Mineral. 2000, 85, 932–942. [Google Scholar] [CrossRef]
  72. Harlov, D.E.; Foerster, H.-J.; Nijland, T.G. Fluid-induced nucleation of (Y + REE)-phosphate minerals within apatite: Nature and experiment. Part I. Chlorapatite. Am. Mineral. 2002, 87, 245–261. [Google Scholar] [CrossRef]
  73. Harlov, D.E.; Förster, H.J. Fluid-induced nucleation of (Y+REE)-phosphate minerals within apatite: Nature and experiment. Part II. Fluorapatite. Am. Mineral. 2003, 88, 1209–1229. [Google Scholar] [CrossRef]
  74. Harlov, D.E. Formation of monazite and xenotime inclusions in fluorapatite megacrysts, Gloserheia Granite Pegmatite, Froland, Bamble Sector, southern Norway. Mineral. Petrol. 2011, 102, 77–86. [Google Scholar] [CrossRef]
  75. Harlov, D.E. Fluids and Geochronometers: Charting and Dating Mass Transfer During Metasomatism and Metamorphism. J. Indian Inst. Sci. 2015, 95, 109–124. [Google Scholar]
  76. Harlov, D.E. Apatite: A Fingerprint for Metasomatic Processes. Elements 2015, 11, 171–176. [Google Scholar] [CrossRef]
  77. Wang, L.J.; Lu, J.; Xu, F.; Zhang, F. Dynamics of crystallization and dissolution of calcium orthophosphates at the near-molecular level. Chin. Sci. Bull. 2011, 56, 713–721. [Google Scholar] [CrossRef] [Green Version]
  78. Onuma, K.; Ito, A.; Tateishi, T.; Kameyama, T. Surface observations of synthetic hydroxyapatite single crystal by atomic force microscopy. J. Cryst. Growth 1995, 148, 201–206. [Google Scholar] [CrossRef]
  79. Onuma, K.; Ito, A. Cluster Growth Model for Hydroxyapatite. Chem. Mater. 1998, 10, 3346–3351. [Google Scholar] [CrossRef]
  80. Pan, H.; Liu, X.Y.; Tang, R.; Xu, H.Y. Mystery of the transformation from amorphous calcium phosphate to hydroxyapatite. Chem. Commun. 2010, 46, 7415. [Google Scholar] [CrossRef] [PubMed]
  81. Ibsen, C.J.S.; Chernyshov, D.; Birkedal, H. Apatite Formation from Amorphous Calcium Phosphate and Mixed Amorphous Calcium Phosphate/Amorphous Calcium Carbonate. Chem. A Eur. J. 2016, 22, 12347–12357. [Google Scholar] [CrossRef] [PubMed]
  82. Lotsari, A.; Rajasekharan, A.K.; Halvarsson, M.; Andersson, M. Transformation of amorphous calcium phosphate to bone-like apatite. Nat. Commun. 2018, 9, 4170. [Google Scholar] [CrossRef] [PubMed]
  83. Iafisco, M.; Degli Esposti, L.; Ramírez-Rodríguez, G.B.; Carella, F.; Gómez-Morales, J.; Ionescu, A.C.; Brambilla, E.; Tampieri, A.; Delgado-López, J.M. Fluoride-doped amorphous calcium phosphate nanoparticles as a promising biomimetic material for dental remineralization. Sci. Rep. 2018, 8, 17016. [Google Scholar] [CrossRef] [PubMed]
  84. Tsuji, T.; Onuma, K.; Yamamoto, A.; Iijima, M.; Shiba, K. Direct transformation from amorphous to crystalline calcium phosphate facilitated by motif-programmed artificial proteins. Proc. Natl. Acad. Sci. USA 2008, 105, 16866–16870. [Google Scholar] [CrossRef] [PubMed] [Green Version]
  85. Bentov, S.; Zaslansky, P.; Al-Sawalmih, A.; Masic, A.; Fratzl, P.; Sagi, A.; Berman, A.; Aichmayer, B. Enamel-like apatite crown covering amorphous mineral in a crayfish mandible. Nat. Commun. 2012, 3, 839. [Google Scholar] [CrossRef] [PubMed] [Green Version]
  86. Kazanci, M.; Fratzl, P.; Klaushofer, K.; Paschalis, E.P. Complementary information on in vitro conversion of amorphous (precursor) calcium phosphate to hydroxyapatite from raman microspectroscopy and wide-angle X-ray scattering. Calcif. Tissue Int. 2006, 79, 354–359. [Google Scholar] [CrossRef] [PubMed]
  87. Chatzipanagis, K.; Iafisco, M.; Roncal-Herrero, T.; Bilton, M.; Tampieri, A.; Kröger, R.; Delgado-López, J.M. Crystallization of citrate-stabilized amorphous calcium phosphate to nanocrystalline apatite: A surface-mediated transformation. CrystEngComm 2016, 18, 3170–3173. [Google Scholar] [CrossRef]
  88. Alibert, C. Rare earth elements in Hamersley BIF minerals. Geochim. Cosmochim. Acta 2016, 184, 311–328. [Google Scholar] [CrossRef]
  89. Li, Y.L.; Sun, S.; Chan, L.S. Phosphogenesis in the 2460 and 2728 million-year-old banded iron formations as evidence for biological cycling of phosphate in the early biosphere. Ecol. Evol. 2013, 3, 115–125. [Google Scholar] [CrossRef] [PubMed] [Green Version]
  90. Sánchez-Navas, A.; Martín-Algarra, A. Genesis of apatite in phosphate stromatolites. Eur. J. Mineral. 2001, 13, 361–376. [Google Scholar] [CrossRef]
  91. Harlov, D.E.; Wirth, R.; Förster, H.J. An experimental study of dissolution-reprecipitation in fluorapatite: Fluid infiltration and the formation of monazite. Contrib. Mineral. Petrol. 2005, 150, 268–286. [Google Scholar] [CrossRef]
  92. Cernok, A.; Darling, J.; White, L.; Dunlop, J.; Anand, M. Shock-Induced Texture in Lunar Mg-Suite Apatite and its Effect on Volatile Distribution. In Proceedings of the 5th European Lunar Symposium, Münster, Germany, 2–3 May 2017. [Google Scholar]
  93. Barrett, T.J.; Černok, A.; Degli-Alessandrini, G.; Anand, M.; Frenchi, I.A.; Darling, J. Apatite microstructures and its volatiles composition in Eucrites. In Proceedings of the 50th Lunar and Planetary Science Conference 2019, The Woodlands, TX, USA, 18–22 March 2019; Volume 2132, p. 1689. [Google Scholar]
  94. Černok, A.; White, L.F.; Darling, J.; Dunlop, J.; Anand, M. Shock-induced microtextures in lunar apatite and merrillite. Meteorit. Planet. Sci. 2019, 54, 1262–1282. [Google Scholar] [CrossRef]
Figure 1. BSE images of typical mineral assemblages in NWA 10153 (a,b) and NWA 10645 (c,d). The blue blocks and arrows indicate the position of lifted TEM foils. Abbreviations according to Whitney and Evans [40]: Ap—apatite (predominantly Cl-rich fluorapatite), Kfs—alkali feldspar (Ab40.4Or56.2), Aug—augite (Fs23.1-48.9Wo33.3-41.1), Mes—mesostasis, Pl—plagioclase (An23.4-25.4Ab71.3-73.0Or5.3-3.4), Ol—olivine (cores Fa61.3-63.7, rims Fa76.2-81.8), Ti-mag—titanomagnetite.
Minerals 09 00695 g001
Figure 2. Ternary plot of the apatite X-site occupancy (mol %) for NWA 10153 and NWA 10645 with marked evolutionary trends (after McCubbin et al. [50]).
Minerals 09 00695 g002
Figure 3. BSE image (a) and X-ray compositional maps (bf) of apatite in NWA 10153. All images are at identical scales. The color scale representing increasing element concentration in the lower left corner of X-ray compositional map (f) is common to all X-ray maps; however, the intensities are not necessarily correlated. The white dashed line in map (e) was applied to highlight apatite. Abbreviations according to Whitney and Evans [40]: Ap—apatite, Kfs—alkali feldspar, Pl—plagioclase, Ti-mag—titanomagnetite.
Minerals 09 00695 g003
Figure 4. BSE image (a) and X-ray compositional maps (bf) of apatite in NWA 10645. All images are at identical scales. The color scale represents increasing element concentration in the lower left corner of the X-ray compositional map (f), which is common to all X-ray maps; however, the intensities are not necessarily correlated. The white, dashed line in map (e) was applied to highlight apatite. Abbreviations according to Whitney and Evans [40]: Ap—apatite, Kfs—alkali feldspar, Aug—augite.
Minerals 09 00695 g004
Figure 5. Chondrite-normalized [51] REE distribution patterns for apatites of from the NWA 10153 and NWA 10645 meteorites. For comparison, the REE patterns are from other reported apatite in nakhlites after Wadhwa and Crozaz [52], Terada and Sano [53], and Wadhwa et al. [54] are shown.
Minerals 09 00695 g005
Figure 6. TEM photomicrographs of apatite in NWA 10153: (a) bright-field image of the cell wall formation at an early stage of recovery and annealing; (b) lattice fringe image of first-generation F-rich chlorapatite; (c) diffraction pattern (FFT) corresponding to b; (d) indexed diffraction pattern (FFT) from the area in f. Note that the indices are identical to those in c. Thus, the crystallographic orientation was identical between the first- and second-generation apatites; (e) high-angle annular dark-field (HAADF) image of the first-generation F-rich chlorapatite (b) and a vein of the second-generation fluorapatite in a crack (f); (f) lattice fringe image of a second-generation fluorapatite; (g) EDX analysis of a first-generation, F-rich chlorapatite. Note the presence of a Cl peak; (h) EDX analysis of a second-generation fluorapatite. Note the lack of a Cl peak and the presence of the Fe, Si, and S peaks.
Minerals 09 00695 g006
Figure 7. TEM photomicrographs of apatite in NWA 10645: (a) high-angle annular dark-field (HAADF) and (b) bright-field images of fragmented and tilted apatite crystals (most likely due to a shock event); (c) EDX analysis of the amorphous material filling cracks in apatite; (d) lattice fringe image of cracks filled with amorphous material and apatite; (e) bright-field image of a fragmented (polycrystalline) area with amorphous material (lower, left part) and an undisturbed crystal domain (upper, right part); (f) lattice fringe image of a first-generation, F-rich chlorapatite in a dislocation free cell; (g) diffraction pattern (FFT) corresponding to f; (h) lattice fringes are banded due to shock events; (i) EDX analysis of an undisturbed area of F-rich chlorapatite.
Minerals 09 00695 g007
Figure 8. (a) Microphotograph of the imaged area of NWA 10645, which shows Raman imaging hemorrhage; (b) Raman integration maps in the regions of 140–210, 460–550, 925–1005, 1590–2272, and 2830–3030 cm−1. (c) K-means clustering (KMC) results with the 5 main classes and (d) their average spectra. The color coding for the classes is presented in the figure; the image size is 120 × 120 µm (60 × 60 pixels).
Minerals 09 00695 g008
Figure 9. Raman spectra of the apatite spectrum collected from the meteorite and the reference spectra of chlorapatite (ClAp, RRUFF ID R060192), fluorapatite (FAp, RRUFF ID R040098), and hydroxyapatite (Hap, RRUFF ID R060180). The standard spectra of apatites are from the RRUFF Raman spectra database [61].
Minerals 09 00695 g009
Table 1. Selected electron microprobe and laser ablation inductively coupled plasma mass spectrometry (LA-ICP-MS) analyses for apatite crystals from the NWA10153 and NWA10645 meteorites. Only the results above detection limits are presented.
MeteoriteNWA10153NWA10645
Analysis#1#3#10#12#4#5#8#11
SiO20.330.610.470.360.340.190.320.36
SO30.05 0.040.120.09
P2O539.9039.9940.5241.4340.4940.8340.0540.54
FeO1.281.230.751.271.170.871.431.06
MnO0.080.080.100.110.090.140.120.14
CaO54.2853.9254.7654.8254.1054.4553.4755.27
SrO0.120.100.110.110.080.060.080.07
Y2O30.040.030.020.020.060.080.060.05
La2O30.040.030.020.020.060.100.070.09
Ce2O30.090.070.050.060.150.210.160.18
Pr2O30.010.010.010.010.020.030.020.02
Nd2O30.060.040.030.040.080.110.080.09
Sm2O30.010.010.010.010.010.020.010.02
HREE2O30.030.020.020.020.040.050.040.03
Na2O0.06 0.060.06
H2O calc1 0.230.120.050.070.050.130.150.17
F1.641.872.321.992.212.161.791.74
Cl3.062.992.503.102.682.473.013.25
Total100.84100.91101.79103.28101.31101.15100.60103.02
O = (F,Cl)1.381.461.541.541.531.471.441.46
Sum corrected99.4599.45100.26101.7499.7899.6899.16101.55
Formula based on 10 cations in the Ca site
Si0.060.100.080.060.060.030.050.06
P5.675.735.765.845.785.815.755.66
S0.010.000.000.000.000.010.020.01
Y0.000.000.000.000.010.010.010.00
LREE0.010.010.010.010.020.030.020.02
HREE0.000.000.000.000.000.000.000.00
Fe0.180.170.110.180.170.120.200.15
Mn0.010.010.010.020.010.020.020.02
Ca9.769.799.869.799.799.819.729.78
Sr0.010.010.010.010.010.010.010.01
Na0.020.000.000.000.000.000.020.02
F0.871.001.231.051.181.150.960.91
Cl0.870.860.710.870.770.700.870.91
OH0.260.140.060.080.050.150.180.18
1 H2O calculated on ideal stoichiometry.

