Article

Extracellular and Intracellular Biomineralization Induced by Bacillus licheniformis DB1-9 at Different Mg/Ca Molar Ratios

1
Shandong Provincial Key Laboratory of Depositional Mineralization and Sedimentary Minerals, College of Earth Science and Engineering, Shandong University of Science and Technology, Qingdao 266590, China
2
Laboratory for Marine Mineral Resources, Qingdao National Laboratory for Marine Science and Technology, Qingdao 266237, China
3
Department of Bioengineering, College of Chemical and Environmental Engineering, Shandong University of Science and Technology, Qingdao 266590, China
4
School of Earth Sciences, University of Bristol, Bristol BS8 1RJ, UK
5
Cabot Institute, University of Bristol, Cantock’s Close, Bristol BS8 1UJ, UK
*
Authors to whom correspondence should be addressed.
Zuozhen Han, Xiao Gao and Hui Zhao worked as the co-first authors.
Minerals 2018, 8(12), 585; https://doi.org/10.3390/min8120585
Submission received: 12 October 2018 / Revised: 5 December 2018 / Accepted: 6 December 2018 / Published: 11 December 2018

Abstract

:
Biomineralization has become a research hotspot and attracted widespread attention in the field of carbonate sedimentology. In this study, precipitation of carbonate minerals was induced by Bacillus licheniformis DB1-9 bacteria, (identity confirmed with its phylogenetic tree), to further explore the biomineralization mechanisms. During experiments, lasting up to 24 days with varying Mg/Ca molar ratios and regular monitoring of conditions, ammonia and carbonic anhydrase are released by the bacteria, resulting in a pH increase. Carbonic anhydrase could have promoted carbon dioxide hydration to produce bicarbonate and carbonate ions, and so promoted supersaturation to facilitate the precipitation of carbonate minerals. These include rhombohedral, dumbbell-shaped, and elongated calcite crystals; aragonite appears in the form of mineral aggregates. In addition, spheroidal and fusiform minerals are precipitated. FTIR results show there are organic functional groups, such as C–O–C and C=O, as well as the characteristic peaks of calcite and aragonite; these indicate that there is a close relationship between the bacteria and the minerals. Ultrathin slices of the bacteria analyzed by HRTEM, SAED, EDS, and STEM show that precipitate within the extracellular polymeric substances (EPS) has a poor crystal structure, and intracellular granular areas have no crystal structure. Fluorescence intensity and STEM results show that calcium ions can be transported from the outside to the inside of the cells. This study provides further insights to our understanding of biomineralization mechanisms induced by microorganisms.

1. Introduction

Cyanobacteria, along with other bacterial groups, have played an important role in the formation of microbialites (which include stromatolites) [1,2,3,4], that occur throughout the geological record, right back to some of the oldest sedimentary rocks [3,5,6,7,8,9,10]. These deposits represent evidence for the existence of life and, indeed, in rare cases, they actually contain fossil relics of the life-forms themselves, although there has often been controversy over biogenicity [11,12]. One of the main outstanding questions, however, is the role of the microbes themselves in precipitating carbonate. Most microbialites are composed of limestone and dolomite, unless silicified or phosphatized, but the mechanisms by which the carbonate minerals are precipitated are still much debated [13,14,15,16,17,18]. Is precipitation related to the activities of the microbes themselves, or is it related to the mucilage (i.e., EPS = extracellular polymeric substances) which envelops the bacteria? And then, what about the viruses, present in all environments up to ten times the number of bacteria; do they have a role [19,20]? However, it could be that precipitation of carbonate is largely controlled by the microchemical environment, with the microbes just providing the substrate. Indeed, in addition to microbialites with their clear sedimentary structures reflecting the former presence of a microbial mat or biofilm, there are great thicknesses of fine-grained limestone (or dolomite) in the geological record where the origin of the carbonate is completely unknown. Could these also be microbial deposits, where bacteria have induced precipitation through their photosynthetic and other biological activities? In order to explore the precipitation of carbonate by microbes, many researchers have performed experiments by using different species of cyanobacteria to induce carbonate minerals, in the laboratory and in the field [21,22,23,24]. We take this topic a stage further by reporting, in this paper, the results of experiments with varying Ca/Mg ratios and run durations, where live bacteria (Bacillus licheniformis DB1-9) are induced to precipitate carbonate. Detailed analyses of the precipitates are presented, and it is demonstrated that carbonic anhydrase (a common enzyme in bacteria) and ammonia are major factors in the biomineralization process.
With biomineralization experiments, halophilic bacteria have frequently been used, since salinity has been considered a key factor in biomineralization. For dolomite, water molecules adsorbed around magnesium ions have been regarded as a kinetic barrier to precipitation, but it has been produced through mediation by Haloferax volcanii DS52 under high salinity (200‰ and 280‰) [25]. The Chromohalobacter israelensis LD532 bacteria have been used to induce Mg-rich calcite and aragonite minerals at 10% salinity and, in this case, organic functional groups, such as C–O–C and –OH, were also involved [26]. Halobacillus trueperi bacteria induced minerals at different salt concentrations [27], and Deng et al. successfully used halophiles to induce dolomite, with bacterial EPS acting as nucleation sites [28]. Sulfate-reducing bacteria (SRB) have also been used in experiments. Acinetobacter calcoaceticus SRB4 bacteria have induced the precipitation of struvite, a phosphate mineral [29], and their EPS have also been considered as the nucleation site. Braissant et al. found that EPS extracted from Desulfovibrio H0407_12.1Lac have a strong adsorption capacity for metal ions [13]. Mg-calcite and Ca-dolomite have also been formed in the presence of EPS produced by SRB [30]. Besides halophiles and SRB, methanogenic archaea have been used to precipitate dolomite at low temperature under anaerobic conditions [31]. Other aerobic bacteria have produced dolomite, including Virgibacillus marismortui and Marinobacter sp. in the presence of oxygen [32]. The spheroidal vaterite, which is an unstable mineral, has been precipitated by Lysinibacillus sp. GW-2 bacteria [33]. Myxococcus sp. bacteria have the ability to induce various minerals, including phosphates, carbonates, sulfates, chlorides, oxalates, and silicates [34]. Some researchers have reported that carbonates induced by marine bacteria are affected by the medium viscosity: calcite is formed at a slow ion diffusion rate, whereas aragonite is precipitated at a faster rate [35]. To sum up, many different species of microorganisms have been used to induce minerals, and in-depth research has been conducted to explore the biomineralization mechanisms involved. However, some factors controlling biomineralization are still uncertain, due to the diverse species of bacteria and the complexity of bacterial metabolic activity [34]. Thus, the processes and mechanisms of biomineralization still need further study.
There are different opinions concerning the products and processes of biomineralization induced by microorganisms. Firstly, spheroidal-spherulitic and dumbbell-shaped minerals have commonly been regarded as biogenic minerals [20,35]. However, there are some issues here. Some spheroidal-spherulitic minerals have been precipitated in a medium without any bacteria [36], perhaps due to the presence of organic substances, such as tryptone and beef extract. Spheroidal minerals have also been produced by Sanchez-Roman et al. under abiotic conditions [32]. Secondly, it has been demonstrated that a rise in pH will increase CaCO3 saturation in the environment, leading to the precipitation of minerals. It has also been reported that ammonia released by bacteria is the main reason for the pH increase [37], although some microbes do not produce enough ammonia for pH to reach 9.0. Carbonic anhydrase (CA) does promote carbon dioxide hydration to generate bicarbonate and carbonate ions; these will also increase pH with the help of ammonia [36]. Thirdly, the bacterial cell surface can provide nucleation sites and others have reported that EPS provide nucleation sites [38,39]. With regard to the nucleation mechanism, acidic amino acids, such as aspartic acid (Asp) and glutamic acid (Glu), probably play an important role [40]. Proteins and polysaccharides may also take part in the process [39,40,41]. It is thought that organic functional groups and gene sequences regulate the nucleation of crystals [39,41]. Thus, there is a need for further exploration of nucleation sites and mechanisms. Fourthly, biomineralization induced by microorganisms should be discussed from two points of view: intracellular and extracellular biomineralization [24]. Many researchers have focused on extracellular biomineralization, namely, the morphology, mineralogy, and mechanisms of microbially induced mineral precipitation. Intracellular biomineralization has received less attention, in view of the limitation of experimental techniques. However, examples include intracellular amorphous carbonates (nanospheres) within Candidatus Gloeomargarita lithophora, a new species of cyanobacteria [42,43]; intracellular amorphous alkaline-earth metal carbonates found in unicellular eukaryotes [44], and ‘micropearls’ occurring in lacustrine and marine bacteria [45,46,47]. Intracellular nanospheres have been interpreted as mineralized bacterial vesicles, and even viruses [20]. In our opinion, unravelling intracellular biomineralization is a major challenge in understanding organism fluid mineral precipitation in the natural environment, and is an indivisible aspect of the research reported here.
In this study, different Mg/Ca molar ratios (0, 3, 6, 9, and 12) were employed to investigate the biomineralization processes induced by Bacillus licheniformis DB1-9 bacteria. The phylogenetic tree of B. licheniformis was constructed using the neighbor-joining method. Growth curves, pH curves, carbonic anhydrase (CA) activity, concentrations of carbonate and bicarbonate ions, ammonia tests, and amino acid composition of EPS were investigated to explore the biomineralization mechanisms. Mineralogy, morphology, elemental composition, and other characteristics of the minerals precipitated were analyzed by XRD, SEM, EDS, and FTIR. Superthin slices of B. licheniformis were prepared and studied by HRTEM, SAED, EDS, and STEM. This study aims to provide further understanding of biomineralization induced by microorganisms in the laboratory and nature, and the controls on mineralogy and morphology of the precipitates.

2. Materials and Methods

2.1. Identification and Cultivation of DB1-9 Bacteria

B. licheniformis DB1-9 bacteria have been cultivated by Associate Professor Huaxiao Yan in the Department of Bioengineering, Shandong University of Science and Technology, and been preserved in a refrigerator at −20 °C. According to published methods [29,36,48], the total DNA of B. licheniformis DB1-9 bacteria was extracted and used as a template to amplify the 16S rDNA, and then the 16S rDNA was sequenced by Shanghai Sangon Biotech Co., Ltd (Shanghai, China). The complete DNA sequences were obtained through fragment assembly using DNAMAN 8.0 software, and uploaded to GenBank. Basic Local Alignment Search Tool (BLAST) was used to compare the nucleotide homology between the 16S rDNA of B. licheniformis DB1-9 bacteria and those of other bacteria. The phylogenetic tree of B. licheniformis DB1-9 bacteria was constructed by the neighbor-joining method using MEGA 7.0 software [24].
The detailed steps of Gram staining are as follows: B. licheniformis DB1-9 bacteria were spread evenly on a glass slide and dried naturally, then fixed by a flame 3 times, stained by ammonium oxalate crystal violet solution for 1 min, washed slowly with distilled water, dyed by iodine solution for 1 min, washed with distilled water again, decolorized by 95% ethanol for 20–30 s, washed again, dyed with magenta for 3–5 min, washed again, and then analyzed by microscopy (YS2-H, Nikon, Japan).
The morphology and size of B. licheniformis DB1-9 bacteria were analyzed by scanning electron microscope (SEM, FEI Quanta 200, FEI, Hillsboro, OR, USA). A single colony on the surface of a solid culture medium was spread evenly on the conductive adhesive and dried naturally, then examined by SEM.
The culture medium for cultivation and multiplication of B. licheniformis DB1-9 bacteria contains the following ingredients (per L): beef extract, 5.0 g; NaCl, 5.0 g; and tryptone 10.0 g. The final pH of the medium was 7.2. The solid culture medium was prepared by adding 20 g of agar powder based on the above components. A single colony of B. licheniformis DB1-9 bacteria, which had been cultivated in a constant temperature incubator (DHP-9050B, Shanghai Langgan Laboratory Equipment Co., Ltd., China) at 30 °C for 48 h, was selected and inoculated into the liquid medium to culture for about 24 h at 30 °C in a constant temperature oscillation incubator (HZQ-F160, Harbin Donglian Electronic Technology Development Co., Ltd., Hei Longjiang, China), with a speed of 130 rpm under normal light conditions. The cell concentrations were measured by a spectrophotometer (721, Shanghai Aoxi Scientific Instrument Co., Ltd., Shanghai, China) at a wavelength of 600 nm. When the OD600 was up to 0.8, the preparation of fermented liquid was finished.

2.2. Biological and Chemical Measurements

The fermented liquid was inoculated into 500 mL of the sterile liquid culture medium in a 1 L conical flask at the volume ratio of 1%. Up to 74 h, OD600 values were measured every 2 h by a spectrophotometer; from 74 to 98 h, every 6 h; and, finally, measurements were taken at 98, 128, 146, 162, and 192 h. The pH values of the experimental and control group were measured by a pH meter (PB-11, Sartorius, Germany). The experiment was performed in triplicate. The pH values of the experimental and control group at 192 h were analyzed by SPSS 21 software. The carbonic anhydrase (CA) activity, carbonate and bicarbonate concentrations, and ammonia, were detected according to the methods described by Zhuang et al [36]. The CA activity was measured every 3 h from 0 to 99 h, and then measured at 114, 128, and 152 h. The bicarbonate concentrations were measured from 0 to 293 h. The carbonate concentration could not be detected before 114 h, thus, the carbonate concentration was detected in the time range of 114–293 h. All experiments were performed in liquid culture medium without any Ca and Mg, only with sodium chloride, beef extract, tryptone, and bacteria. Based on the concentration of carbonate and bicarbonate ions, the mass of sodium carbonate and sodium bicarbonate could be calculated. Therefore, another pH curve was obtained by measuring the pH of the sodium carbonate–sodium bicarbonate solution. The pH values of the experimental group and the sodium carbonate–sodium bicarbonate solution at 192 h were also analyzed by SPSS 21 software. The concentrations of ammonium ions were measured according to the method described by Zhuang et al. [36]. The pH values based on ammonium ion concentrations were also calculated according to the above method [36].

2.3. Amino Acid Composition in EPS

EPS were extracted according to the method described by Zhuang et al. [36]. EPS were dried in a lyophilizer (FD-1A-50, Shanghai Bilang instrument Manufacturing Co. Ltd., Shanghai, China) under a vacuum at −60 °C, and then sent to Jiangsu Coastal Chemical Analysis & Technological Service Ltd. Amino acids in EPS were analyzed by an amino acid analyzer (Hitachi L-8900, Tokyo, Japan).

2.4. Precipitation Experiments

The liquid culture medium used to precipitate the minerals contains the following ingredients (per L): beef extract, 5.0 g; NaCl, 5.0 g; tryptone, 10.0 g; CaCl2 (0.01 M); Na2CO3 (0.006 M); NaHCO3 (0.006 M); and Mg/Ca molar ratio 0, 3, 6, 9, and 12. MgSO4·7H2O was used to prepare the Mg2+ parent solution (2 M) and to adjust the Mg/Ca molar ratio. The liquid culture medium was sterilized by autoclave (Shanan ShangHai LDZX-50KBS). A solution of Na2CO3 (1 M) and NaHCO3 (1 M) was prepared and sterilized by a filter with a 0.22 µm pore-sized membrane. Na2CO3 (1M) filtrate (0.9 mL) and 0.9 mL of NaHCO3 (1 M) filtrate were added to 150 mL of liquid culture medium. The pH was adjusted to 7.0 using concentrated hydrochloric acid. The preparation of the liquid culture medium was now complete. The liquid culture medium inoculated with the fermented liquid (OD600 = 0.8), by a volume ratio of 1%, was set as the experimental group; the second group, with added sterile distilled water, was set as control group A, and the volume of distilled water was the same as that of the fermented liquid; the third group, with no Ca or Mg or bacteria, was set as control group B. All culture groups were triplicated at each value of Mg/Ca molar ratio, and cultivated in the constant temperature oscillation incubator at 30 °C with a speed of 130 rpm under normal light conditions.
After being cultured for 12 day, the precipitates in the experimental group could be observed by the naked eye, but there were no precipitates in the control group. The precipitates in the experimental group were aspirated and transferred into an Eppendorf tube, washed 3 times with distilled water, and then preserved in anhydrous ethanol for future research. After being cultured for 24 days, the precipitates in the experimental group were isolated, again, according to the same method. There were still no precipitates in the control group.

2.5. Characterization of Precipitates

The naturally dried mineral precipitates in the experimental group were analyzed with X-ray diffraction (XRD, D/Max-RC, Rigaku, Tokyo, Japan). The scanning angle (2θ) of XRD ranged from 10° to 90°, with a step size of 0.02° and a count time of 8° min−1 [44,45,46,49,50,51,52,53,54]. The mineral phases of the precipitates were further determined by comparison with the standard data on the powder diffraction file (PDF) of the International Center for Diffraction Data (ICDD) by Jade 6.0 software.
Fourier transform infrared (FTIR, Nicolet 380, Thermo Fisher Scientific Inc., Waltham, MA, USA) measurements were conducted using the potassium bromide method in a scanning range of 400–4000 cm−1 with a resolution of 4 cm−1 [55,56,57].
The minerals in the experimental group were gold-coated and analyzed by scanning electron microscope (SEM, S-4800, Hitachi, Tokyo, Japan) [55,58,59,60,61]; at the same time, the elemental composition of the minerals was also determined by energy dispersive spectroscopy (EDS, EDAX, Mahwah, NJ, USA).

2.6. Analysis of the Ultrathin Slices of B. licheniformis

The preparation of the ultrathin slices of B. licheniformis followed the procedure of Han et al. [23]. The detailed steps were as follows: After being cultivated for 24 days, 10 mL of the bacterial liquid was centrifuged at 3000 rpm for 5 min. It was found to be best not to take precipitates from the bottom of the flask, as they contained a lot of minerals that affected the preparation of ultrathin slices of cells. After centrifugation, the material was washed 3 times with a phosphate buffer (Na2HPO4·12H2O 20.7472 g·L−1, NaH2PO4·2H2O 3.1167 g·L−1, pH 7.2). The aim of this step was to remove the ingredients of the culture medium, particularly the beef extract, NaCl, and tryptone. After being fixed by glutaraldehyde (2.5% (v/v)) for 12 h, the material was dehydrated by acetone solution according to the following sequence: 30% (15 min)–50% (15 min)–70% (15 min)–80% (15 min)–90% (15 min)–95% (15 min)–100% (15 min)–100% (15 min)–100% (15 min). At last, 30% epoxy resin solution was added to embed the cells. The ultrathin slices were analyzed by high-resolution transmission electron microscopy (HRTEM, H-7650, Hitachi, Tokyo, Japan) [57,58,62,63,64,65], scanning transmission microscopy (STEM, Tecnai G2 F20, FEI, Hillsboro, OR, USA) and EDS. The parameters of these instruments are given in articles [66,67,68,69,70].

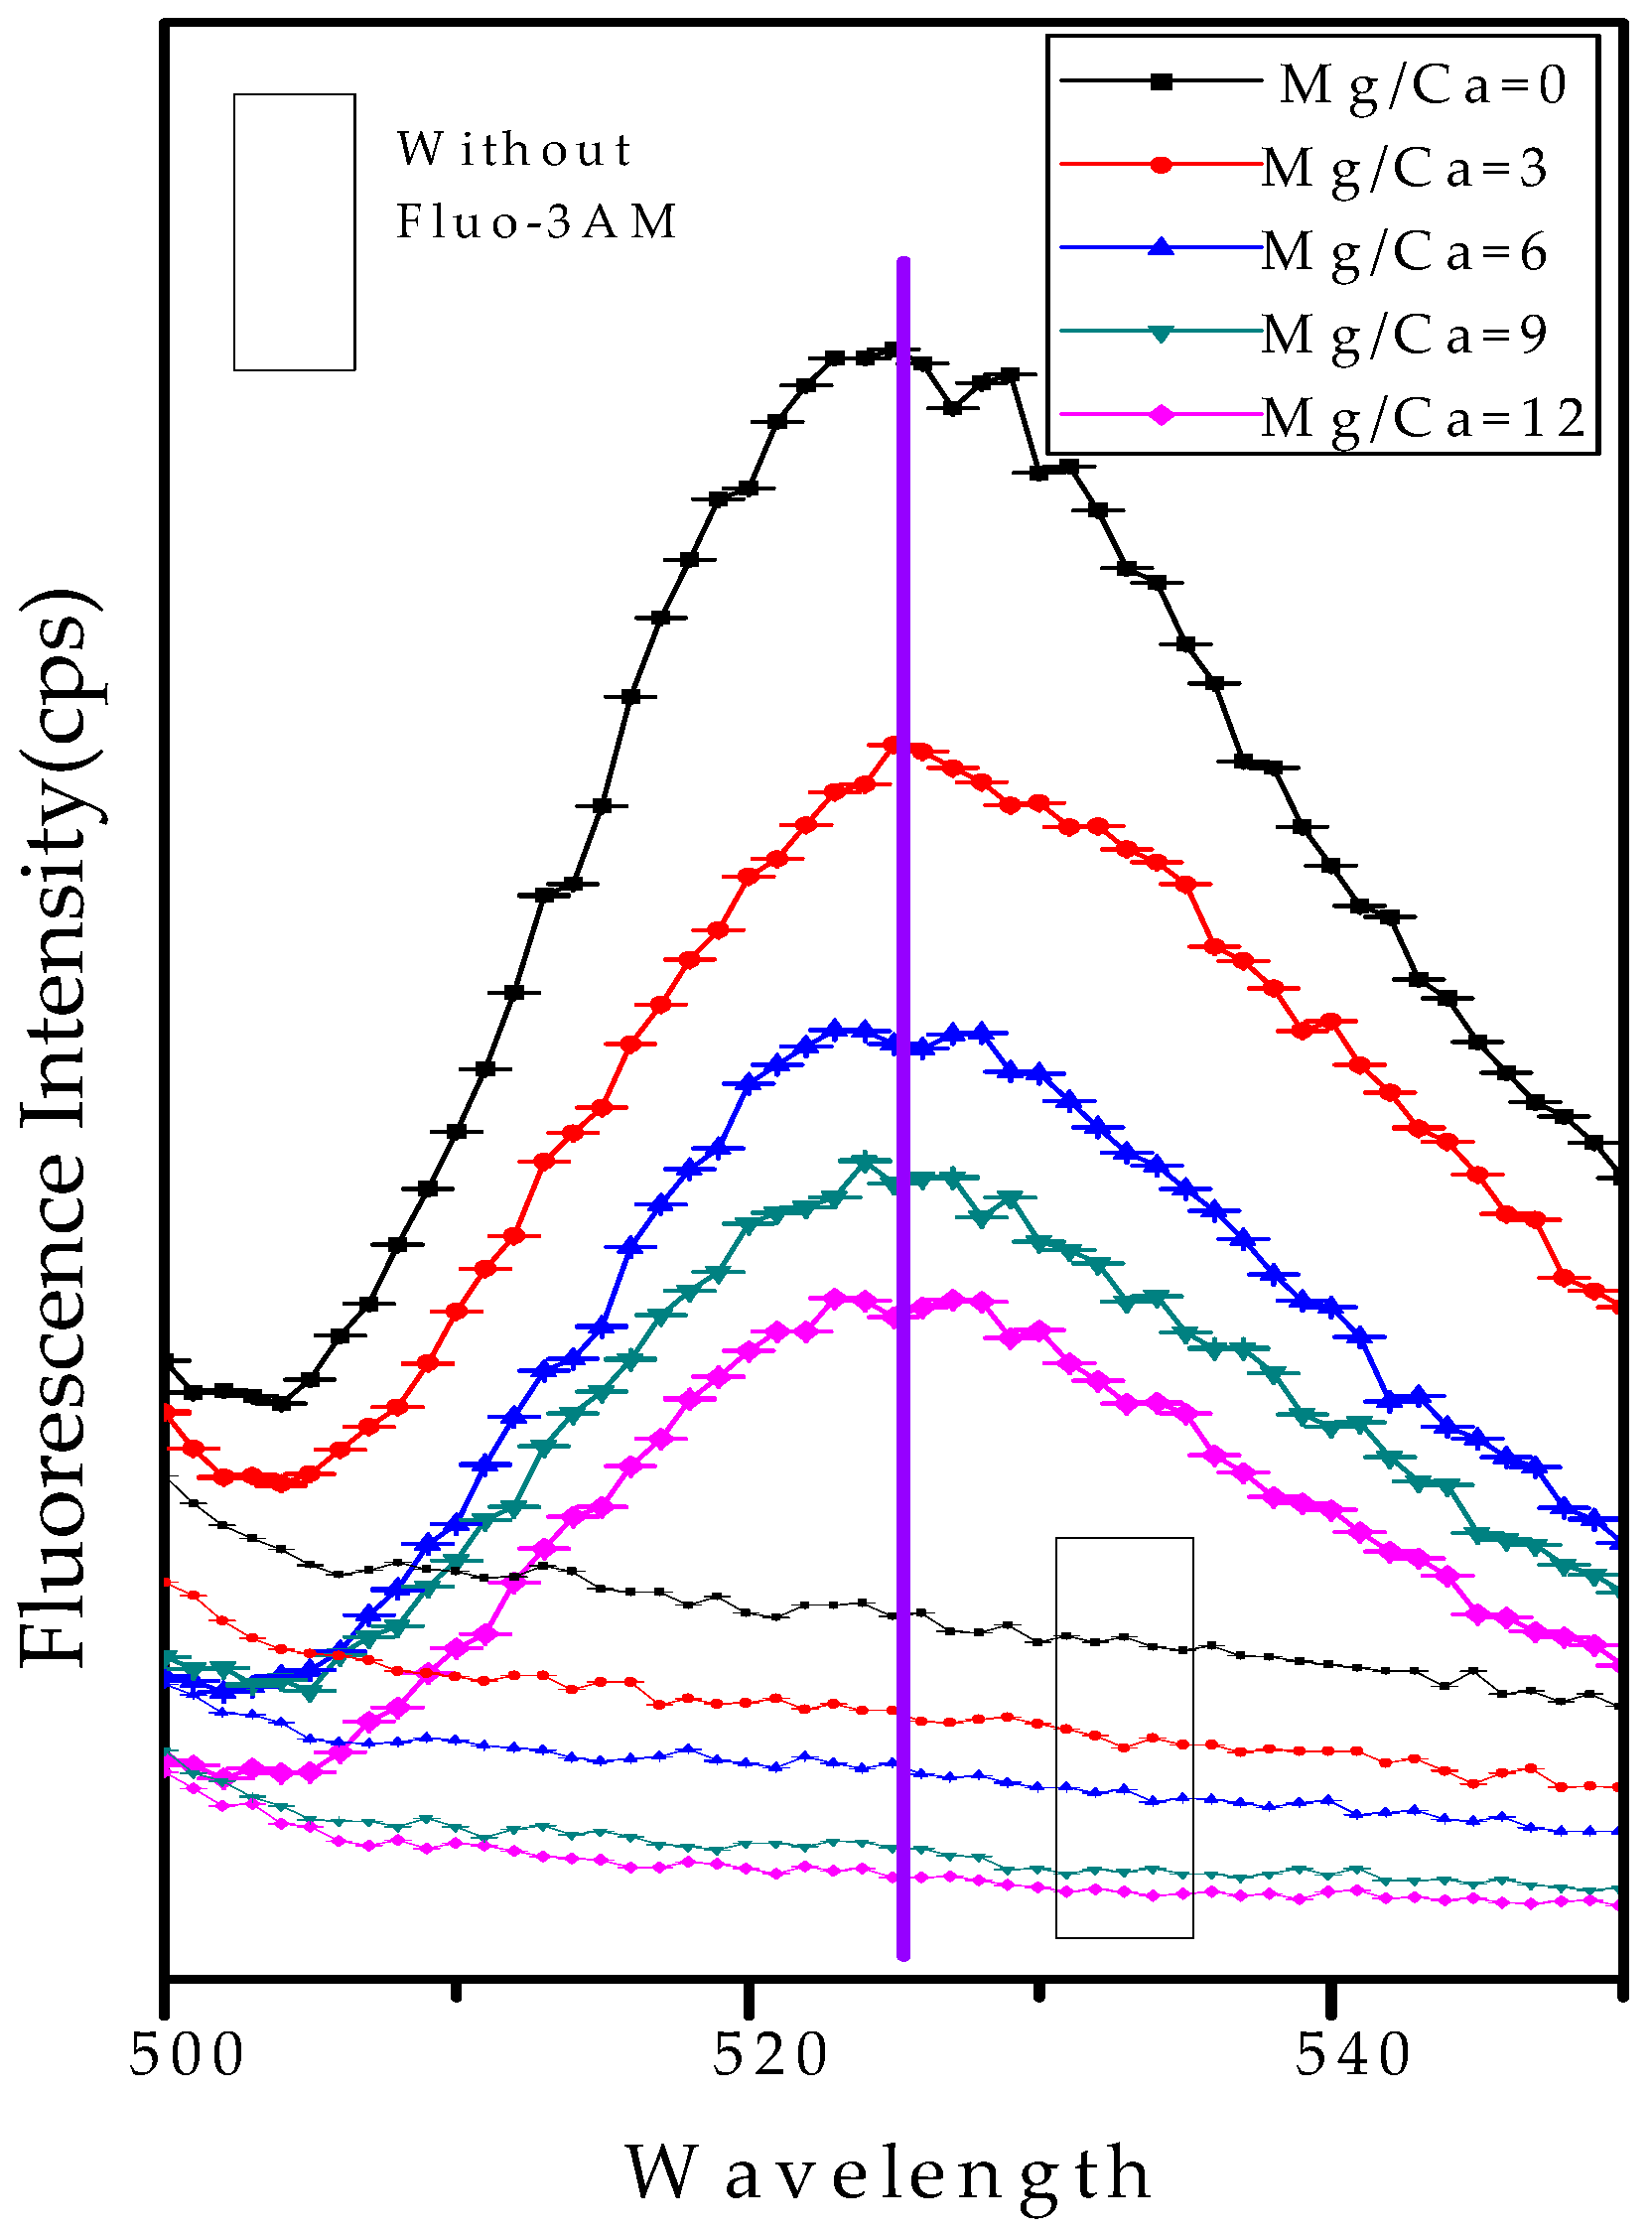
2.7. Analysis of the Intracellular Ca2+ Ions by Fluorescence Intensity

The fluorescence intensities of intracellular Ca2+ ions were measured according to the method described by Zhuang et al [36]. Statistical analysis was performed by SPSS 21 software.

3. Results

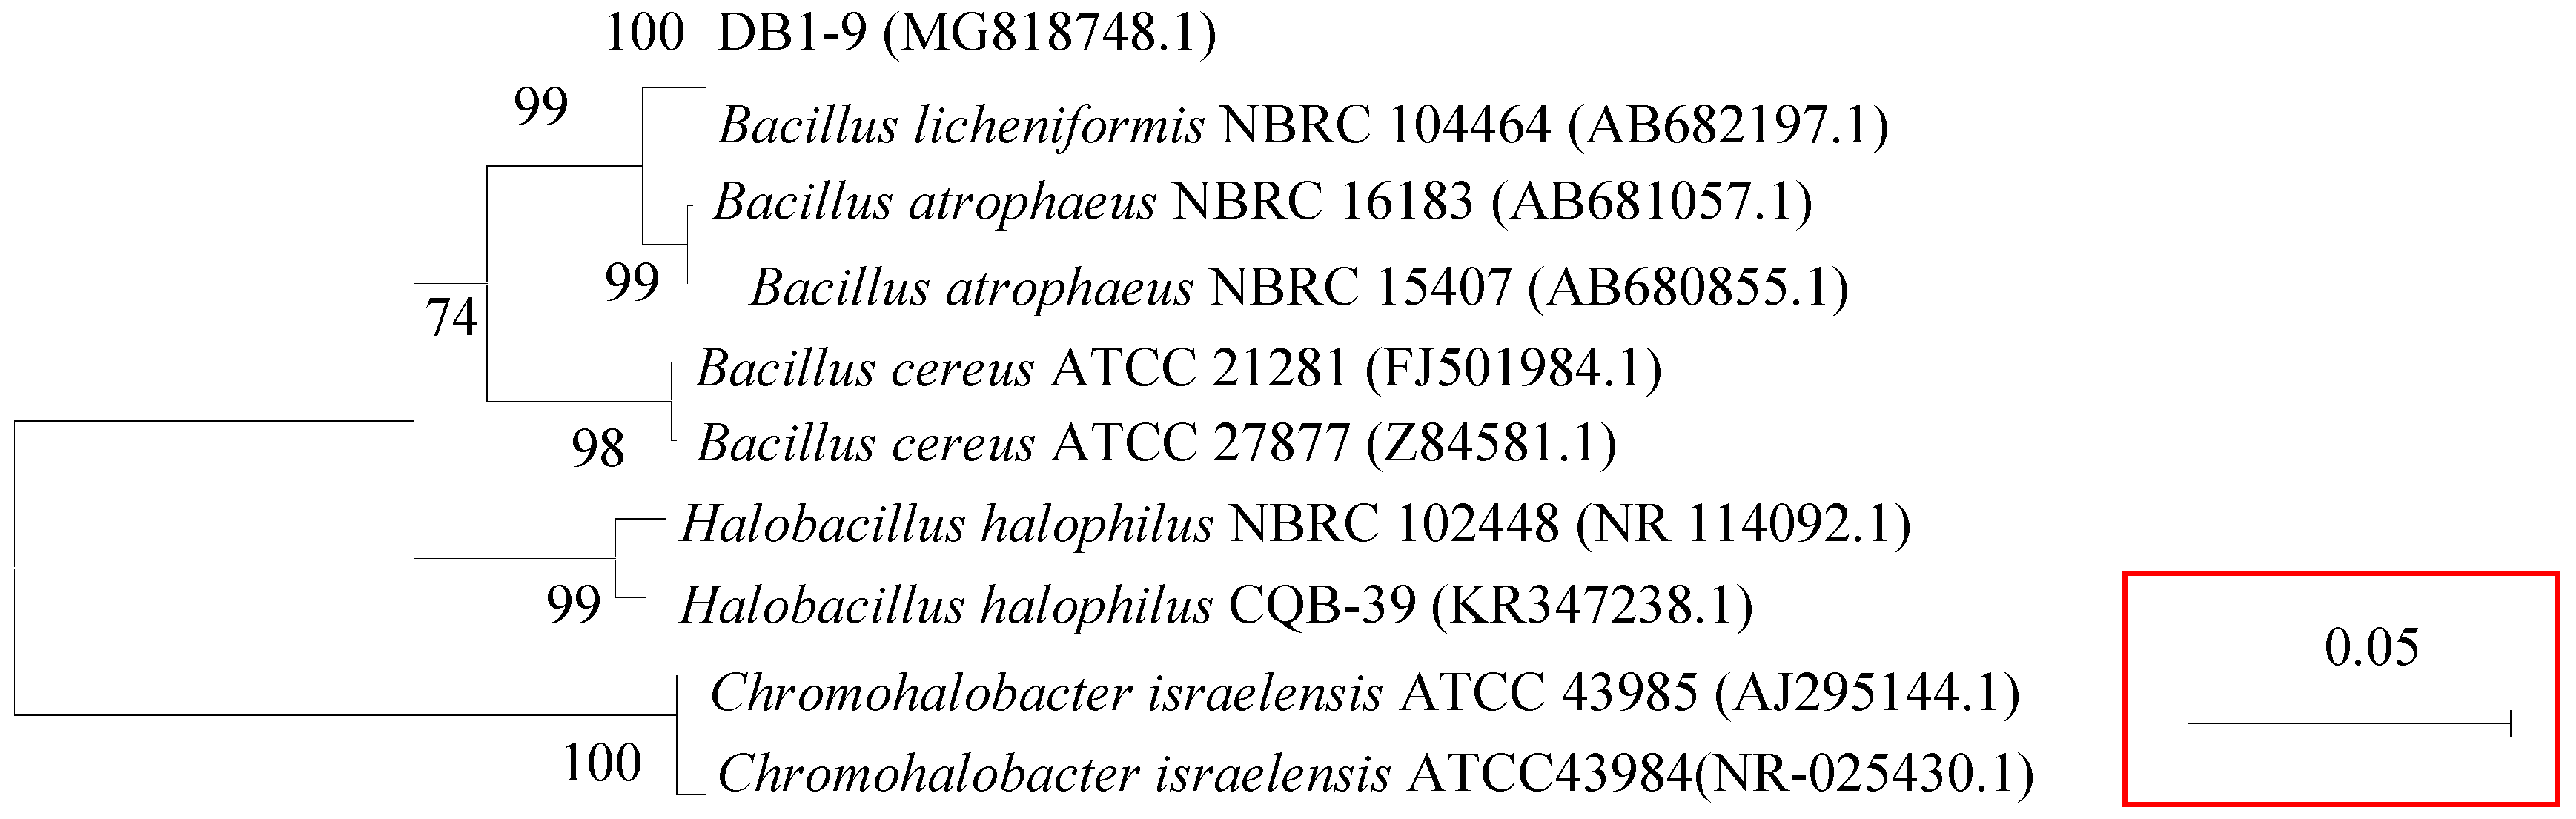
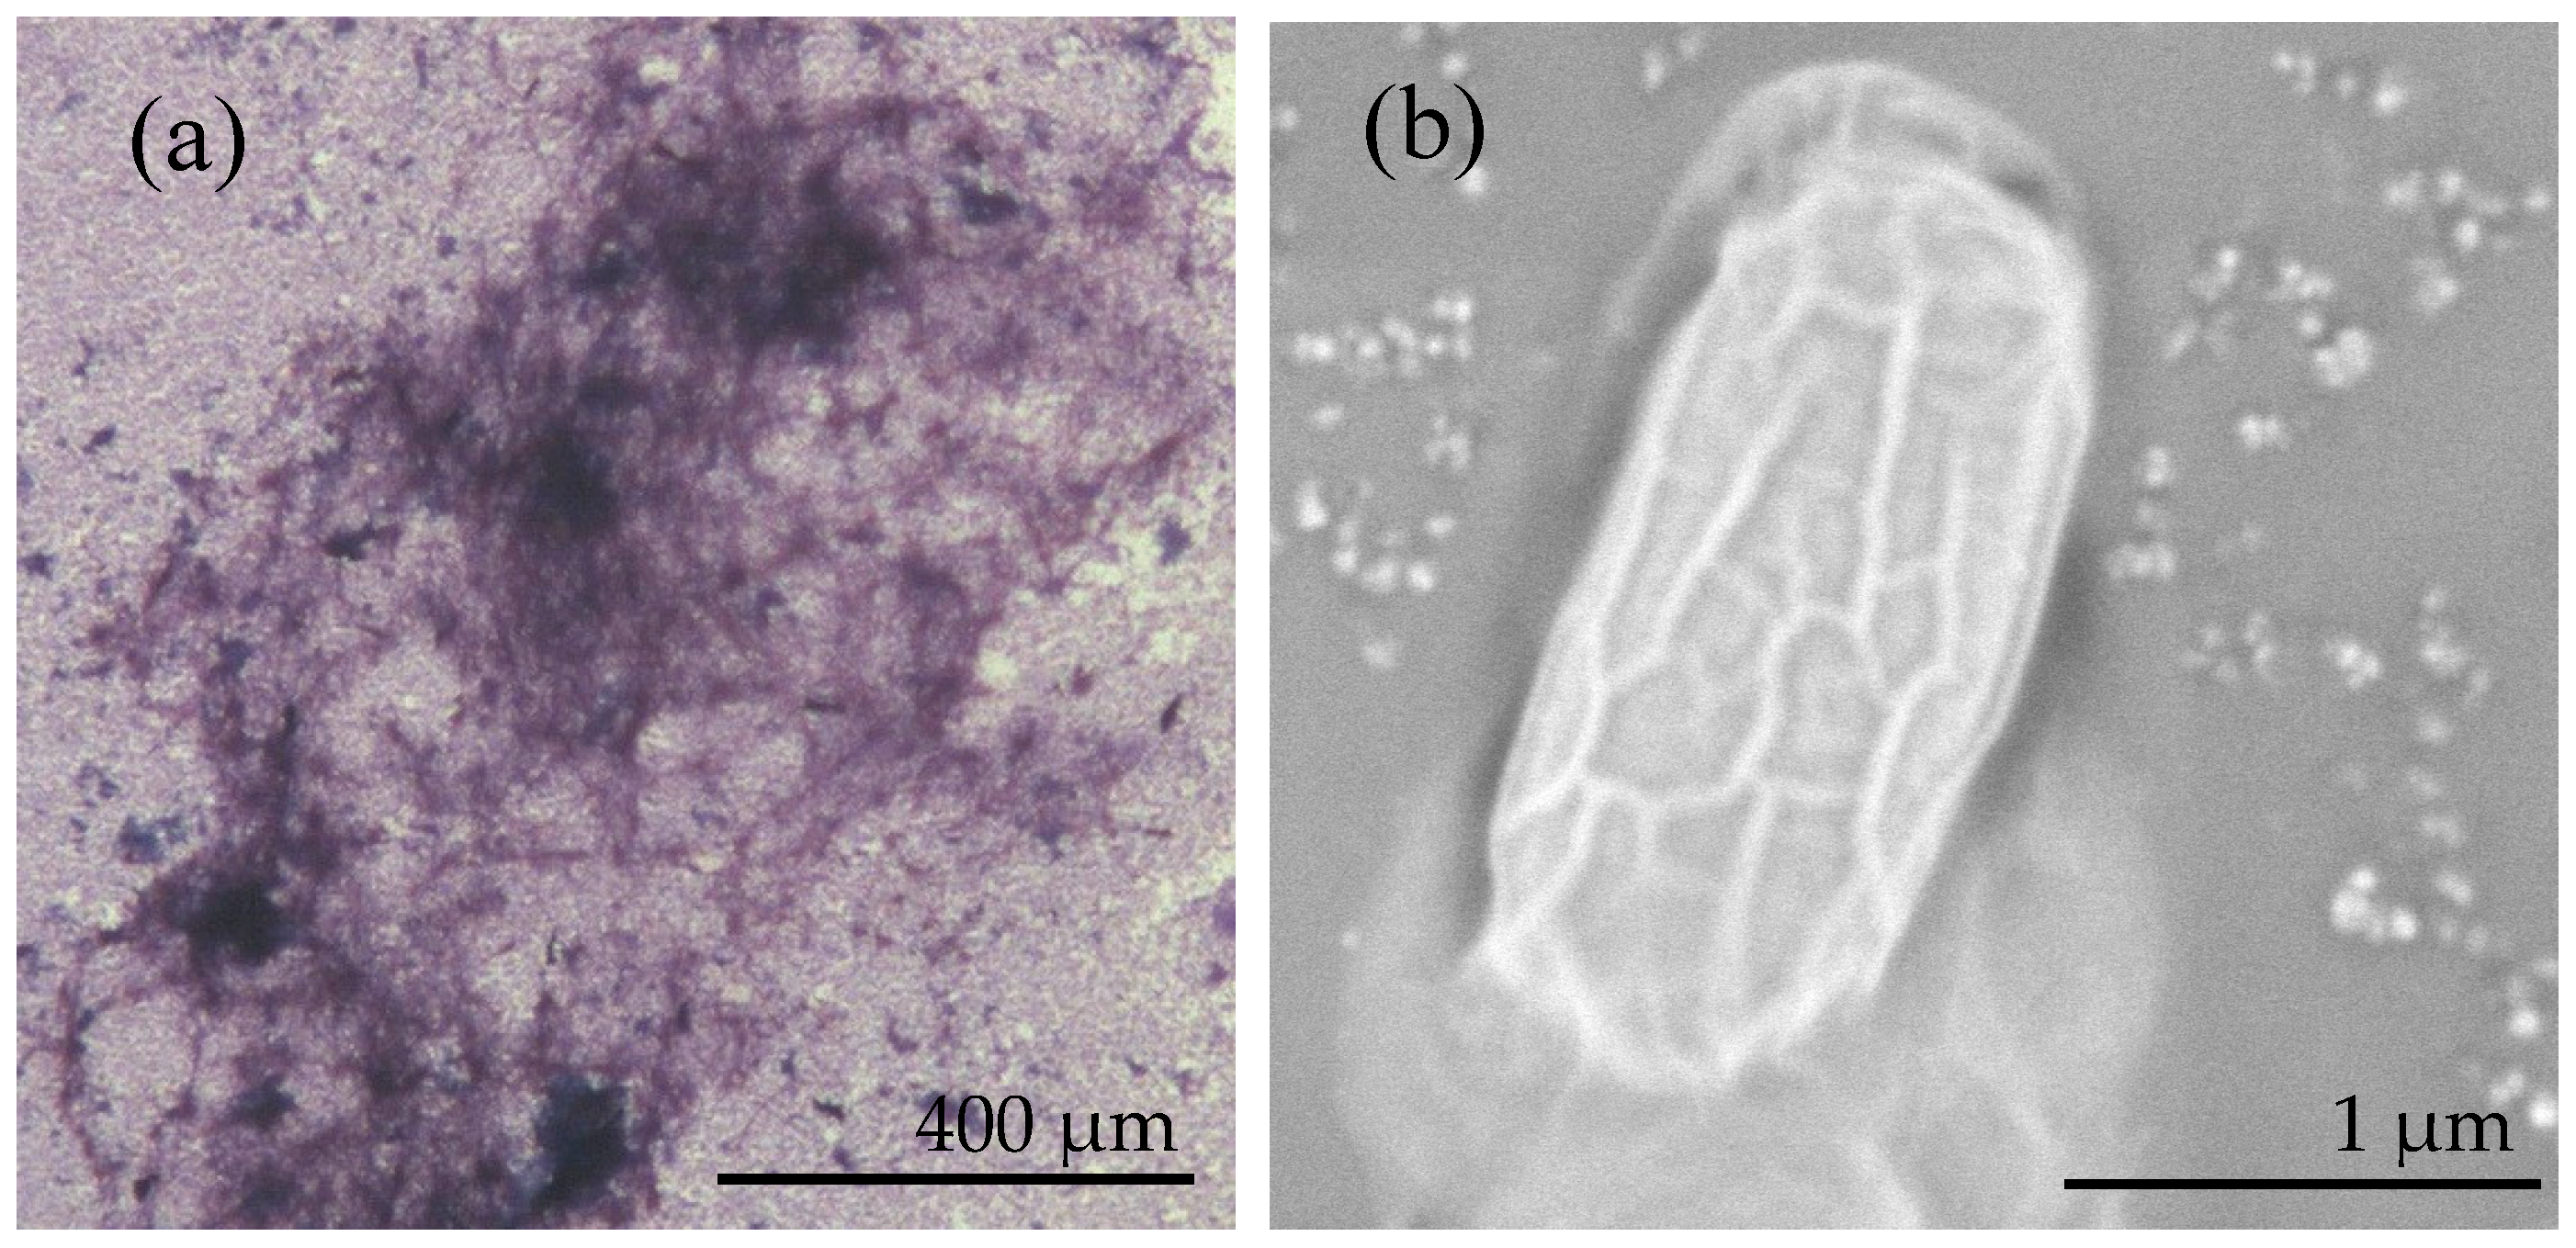
3.1. Identification and Characterization of B. licheniformis DB1-9 Bacteria

The 16s rDNA sequence of DB1-9 bacteria is 1486 bp and has been uploaded to GenBank and been given an accession number of MG818748.1. The 16S rDNA of strain DB1-9 shares 99% homology with 99 strains of B. licheniformis. The phylogenetic tree, based on the 16S rDNA sequence, shows that the DB1-9 strain is closest to B. licheniformis (Figure 1), indicating that the DB1-9 strain can be identified as the B. licheniformis species. The result of Gram staining shows that the bacteria are purple (Figure 2a), indicating that B. licheniformis is Gram-positive. SEM results show that the bacterium is 2 µm in length and 1 µm in width. EPS are present around the bacterium (Figure 2b) and there are no minerals in the EPS here, since the medium in which the bacteria grew lacks Ca2+ and Mg2+ ions.

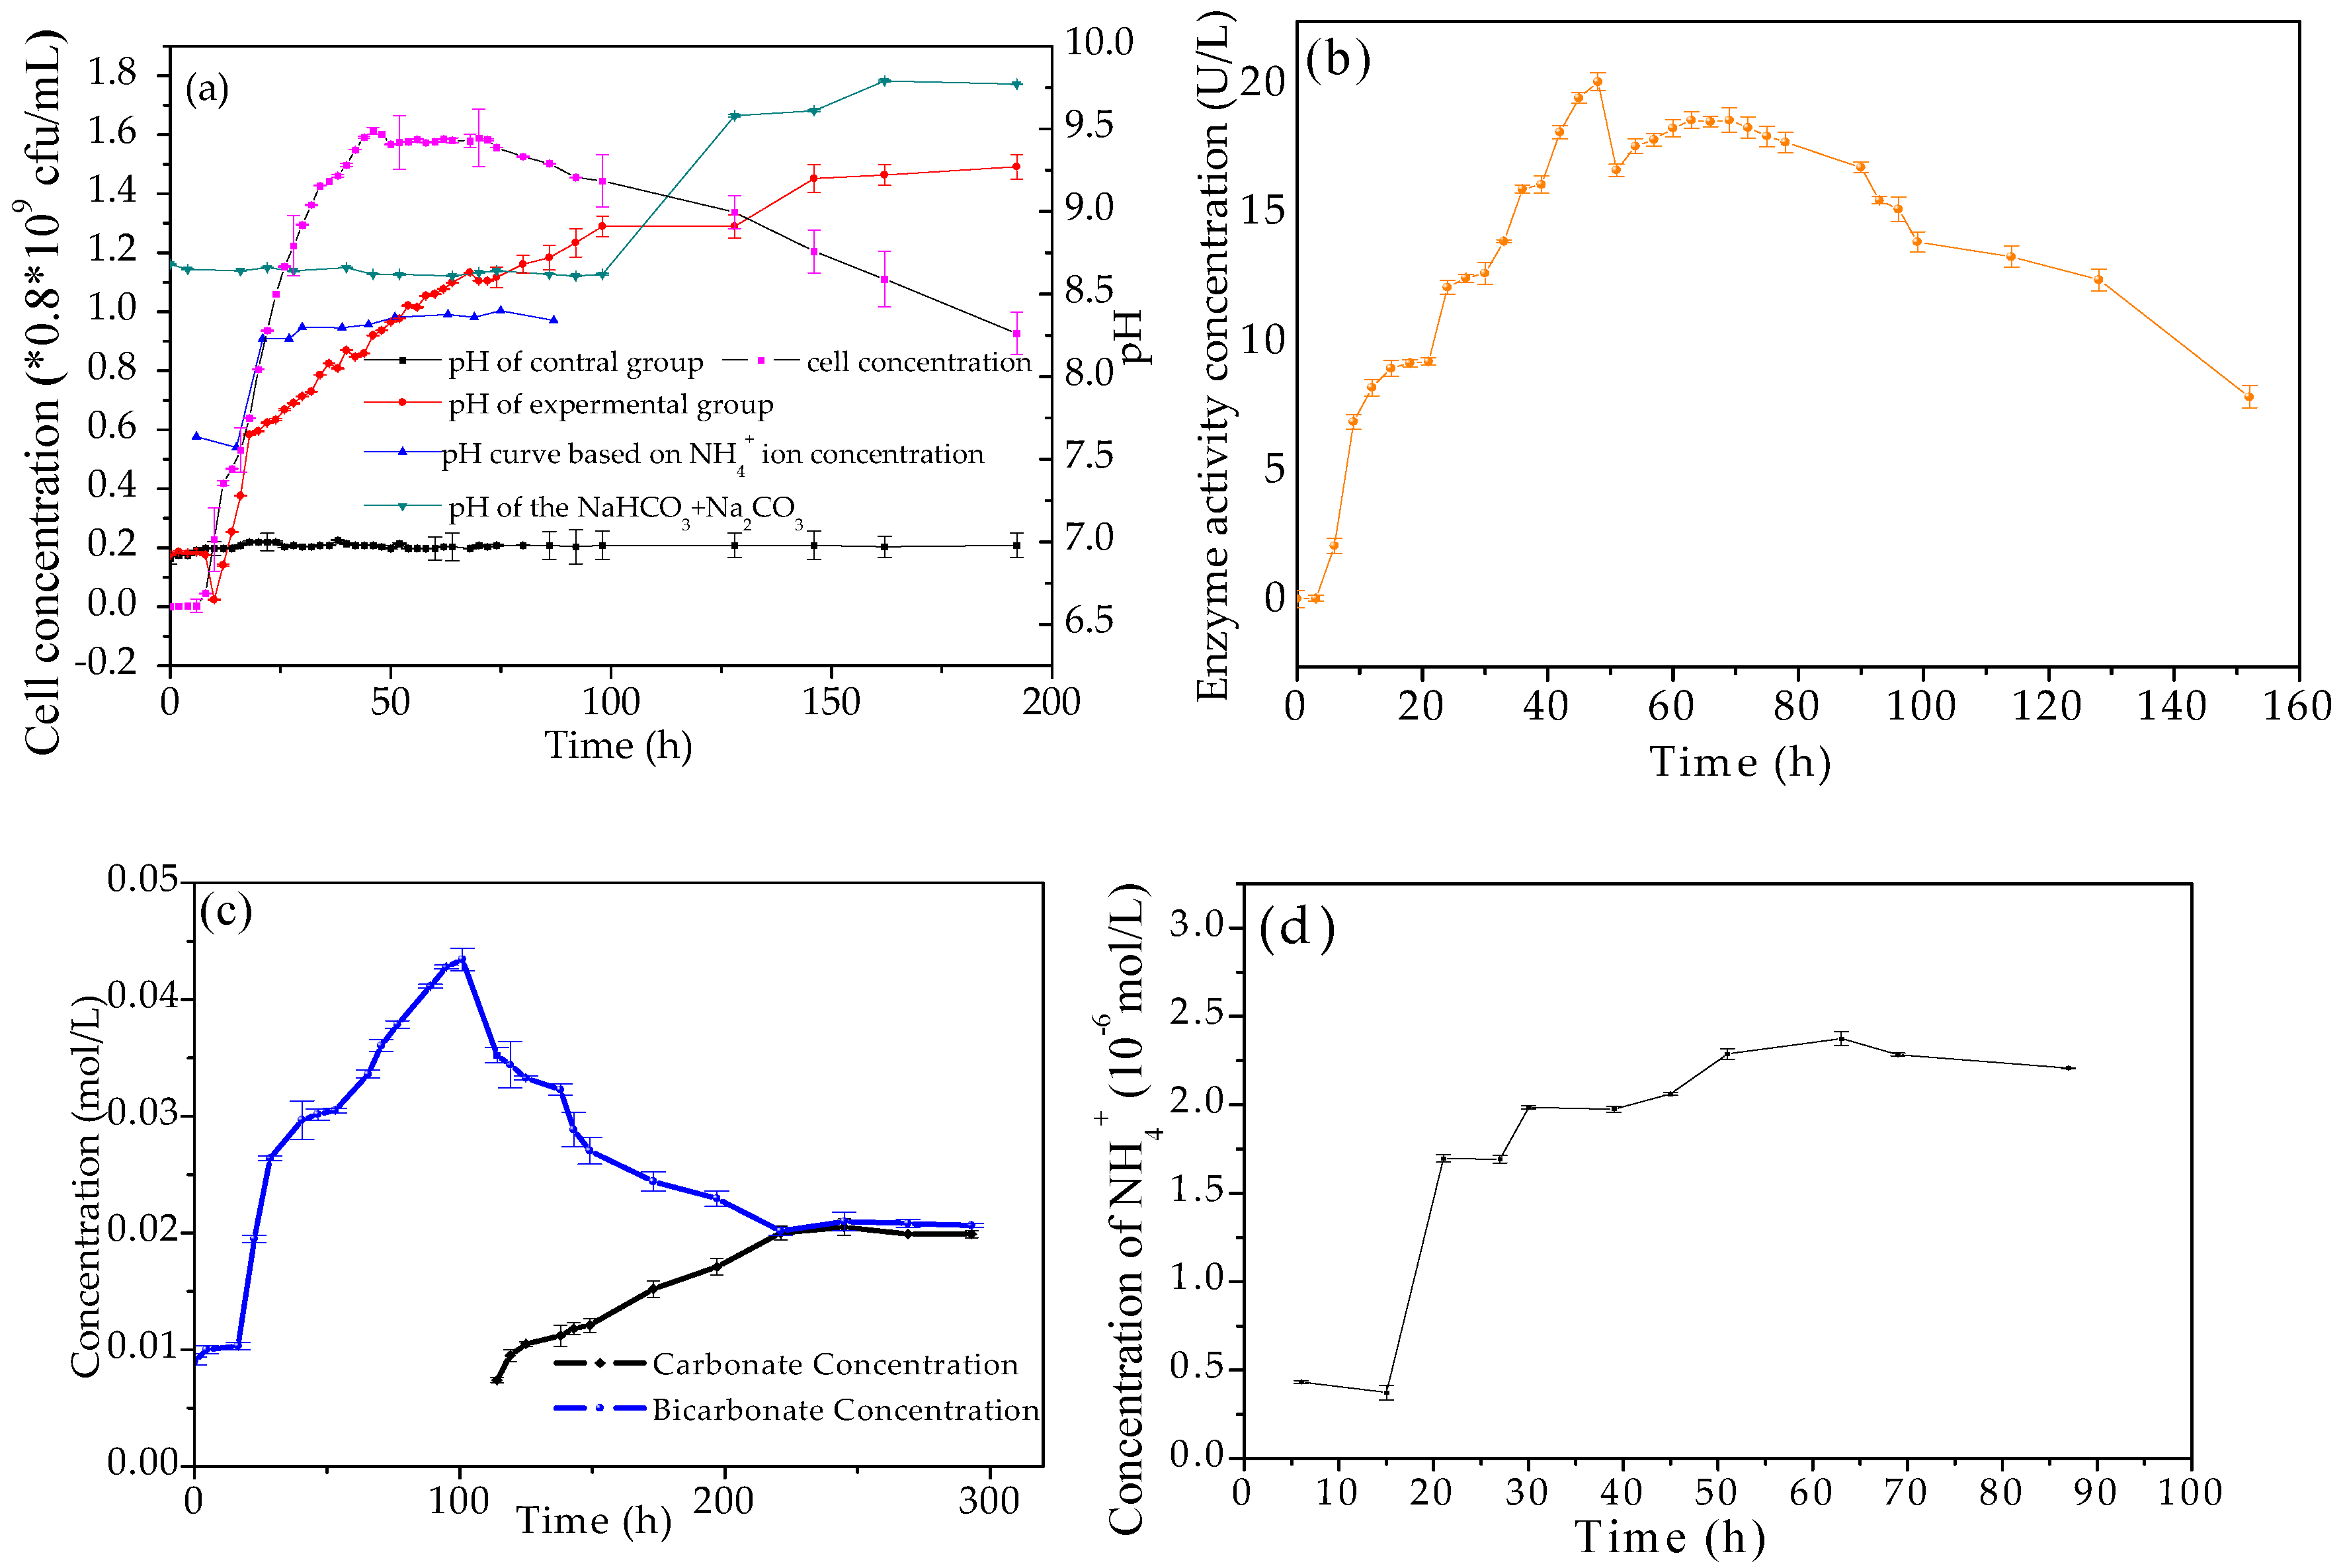
3.2. Evolution of Biological and Chemical Parameters

Figure 3a,b show that ammonia has been produced by B. licheniformis, with the experimental group having a dark brown color, whereas the control group has the color of Nessler’s reagent, which increases the pH value.
Figure 4a shows the growth curve of B. licheniformis DB1-9 bacteria and the pH curves. It can be seen from the growth curve that 0–8 h is the delay period or lag time; the logarithmic growth period is from 8 to 46 h. The stable period is in a time range of 46–74 h; the cell concentration has remained almost constant because the birth rate has equaled the mortality rate. The decline period is from 74–192 h. In the delay period, pH increases from 6.92 to 7.06. During the logarithmic growth period, the pH sharply increases from 7.06 to 8.25. In the stable period, the pH increases from 8.25 to 8.6. The most striking thing to notice is that the pH continues to rise from 8.6 to 9.27 in the decline period. An ammonia test was performed in the time range of 24–48 h (Figure 3) and the result shows DB1-9 bacteria can release ammonia. The ammonia released in the logarithmic growth period is the main reason for the pH increase from 7.06 to 8.25. NH4+ ion concentration increases from 0 to 2.25 × 10⁻⁶ mol/L in the time range of 0–50 h, and remains almost constant from then on (Figure 4d). The pH curve based on the NH4+ ion concentration shows that the ammonia released by B. licheniformis is able to increase in pH to about 8.25 (Figure 4a); this also reveals that factors other than ammonia can also increase pH. The pH values of the control group are almost constant at 7.0, significantly different from those of the experimental group (p < 0.01).
Figure 4b shows the CA activity of B. licheniformis. It can be seen that the CA activity curve has two parts: from 0 to 69 h, CA activity increases from 0.145 to 18.682 U/L; from 69 to 152 h, CA activity decreases from 18.682 to 7.972 U/L. Roughly, the trend of the CA change is similar to that of the cell growth curve (Figure 4a)—the bacterial concentration increases and, at the same time, the CA activity also increases; when the cell concentration decreases, the CA activity also decreases. However, CA activity did not decrease to 0, suggesting that even in the decline period, CA activity still existed in the liquid culture medium. Alkaline CA can promote the hydration reaction of carbon dioxide (CO2) to produce bicarbonate and carbonate ions. In this study, when pH increases beyond 8.0, CA activity still continues, suggesting a connection to increasing alkalinity, and further indicating CA release of bicarbonate and carbonate ions in the liquid culture medium. Thus, bicarbonate and carbonate ion concentrations were also measured in this study.
From Figure 4c, it can be seen that bicarbonate concentration increases from 0.028 to 0.049 M in the time range of 0–101 h, and then decreases to 0.0351 M from 101 to 293 h. Carbonate ions were not detected from 0 to 114 h, and increased from 0.0074 to 0.0199 M in the time range of 114–293 h. When the bicarbonate concentration decreased, the carbonate ion concentration increased instead; this suggests that the bicarbonate ions were converted to carbonate ions in the liquid culture medium. The released carbonate ions also resulted in an increase in pH values. In order to verify how high the pH could reach under the influence of bicarbonate and carbonate ions, a series of pH values were obtained by measuring pH values of the sodium carbonate and sodium bicarbonate solution, which were prepared according to the concentration of carbonate and bicarbonate ions (Table 1). A new pH curve, shown in Figure 4a, shows that bicarbonate and carbonate ions released through the CA catalysis indeed play an important role in pH increase during the decline period of bacteria. There was also a significant difference in pH values at 192 h between the experimental group and the sodium carbonate–sodium bicarbonate solution (p < 0.01). That is to say, the pH increase is caused by the combined effect of CA and ammonia released by B. licheniformis.

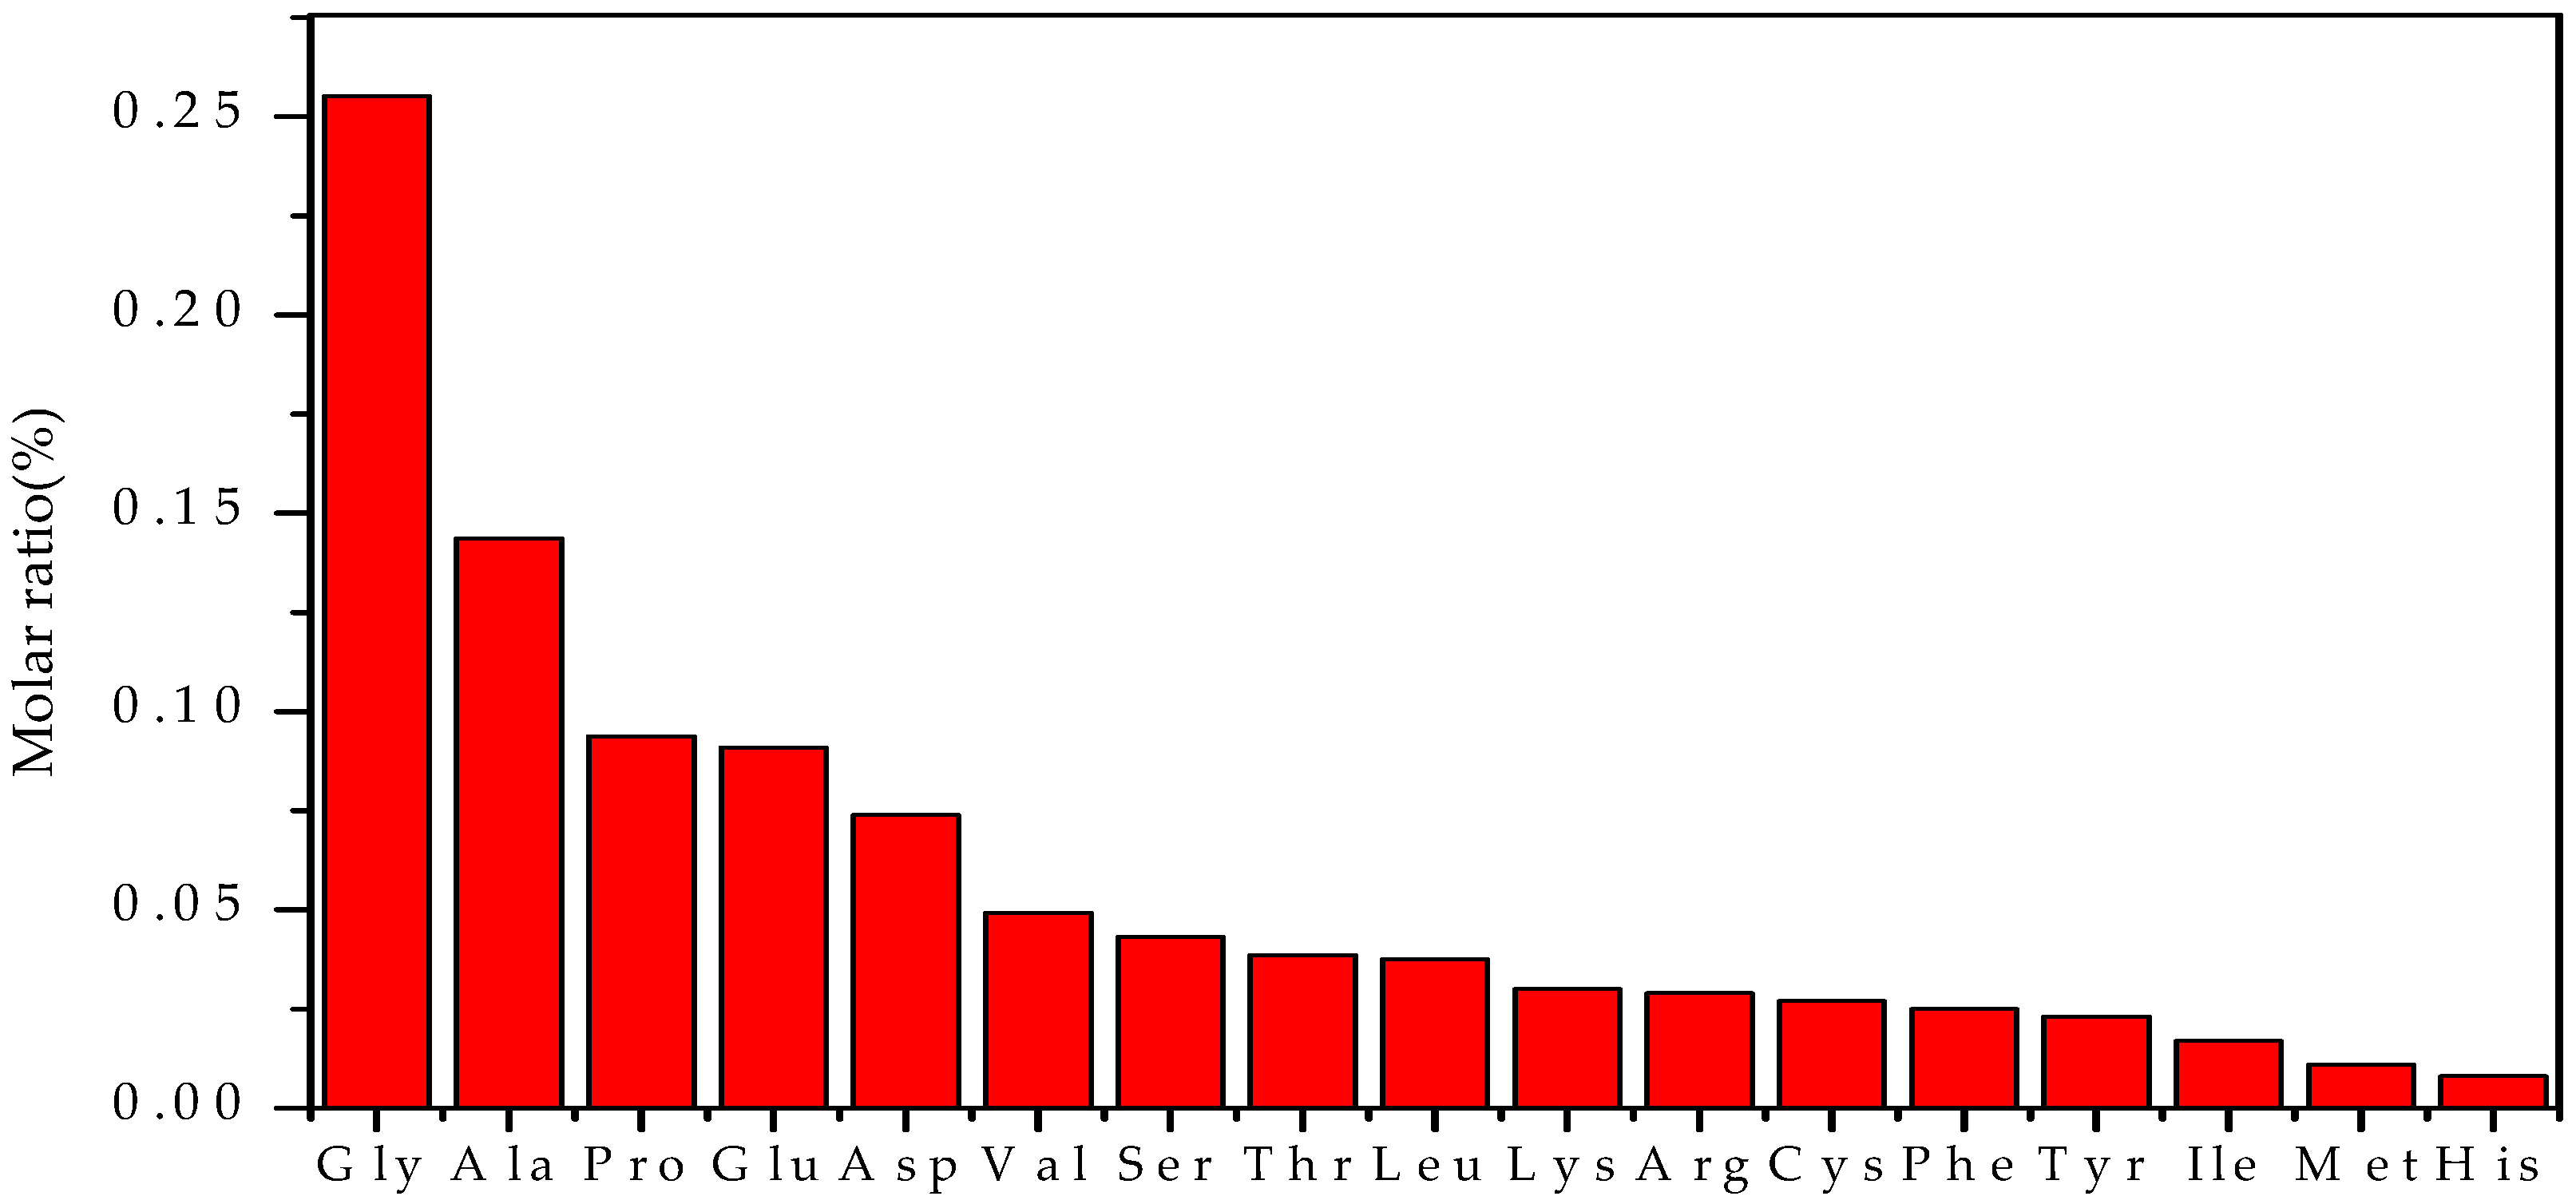
3.3. The Amino Acid Composition of EPS

EPS of B. licheniformis contain 17 kinds of amino acid (Figure 5). Glycine (Gly), alanine (Ala), and proline (Pro) are the top three, followed by glutamic acid (Glu) and aspartic acid (Asp). Histidine (His) was the lowest of the 17 amino acids. When the pH in the experimental group increases to 9.0 or so, the carboxyl groups of Glu and Asp can be deprotonated. Thus, Glu and Asp carry a lot of negative charges. As a result of this, the negatively charged EPS around the cell are able to adsorb a large number of metal cations, including Ca2+ and Mg2+ ions, to promote the nucleation of minerals.

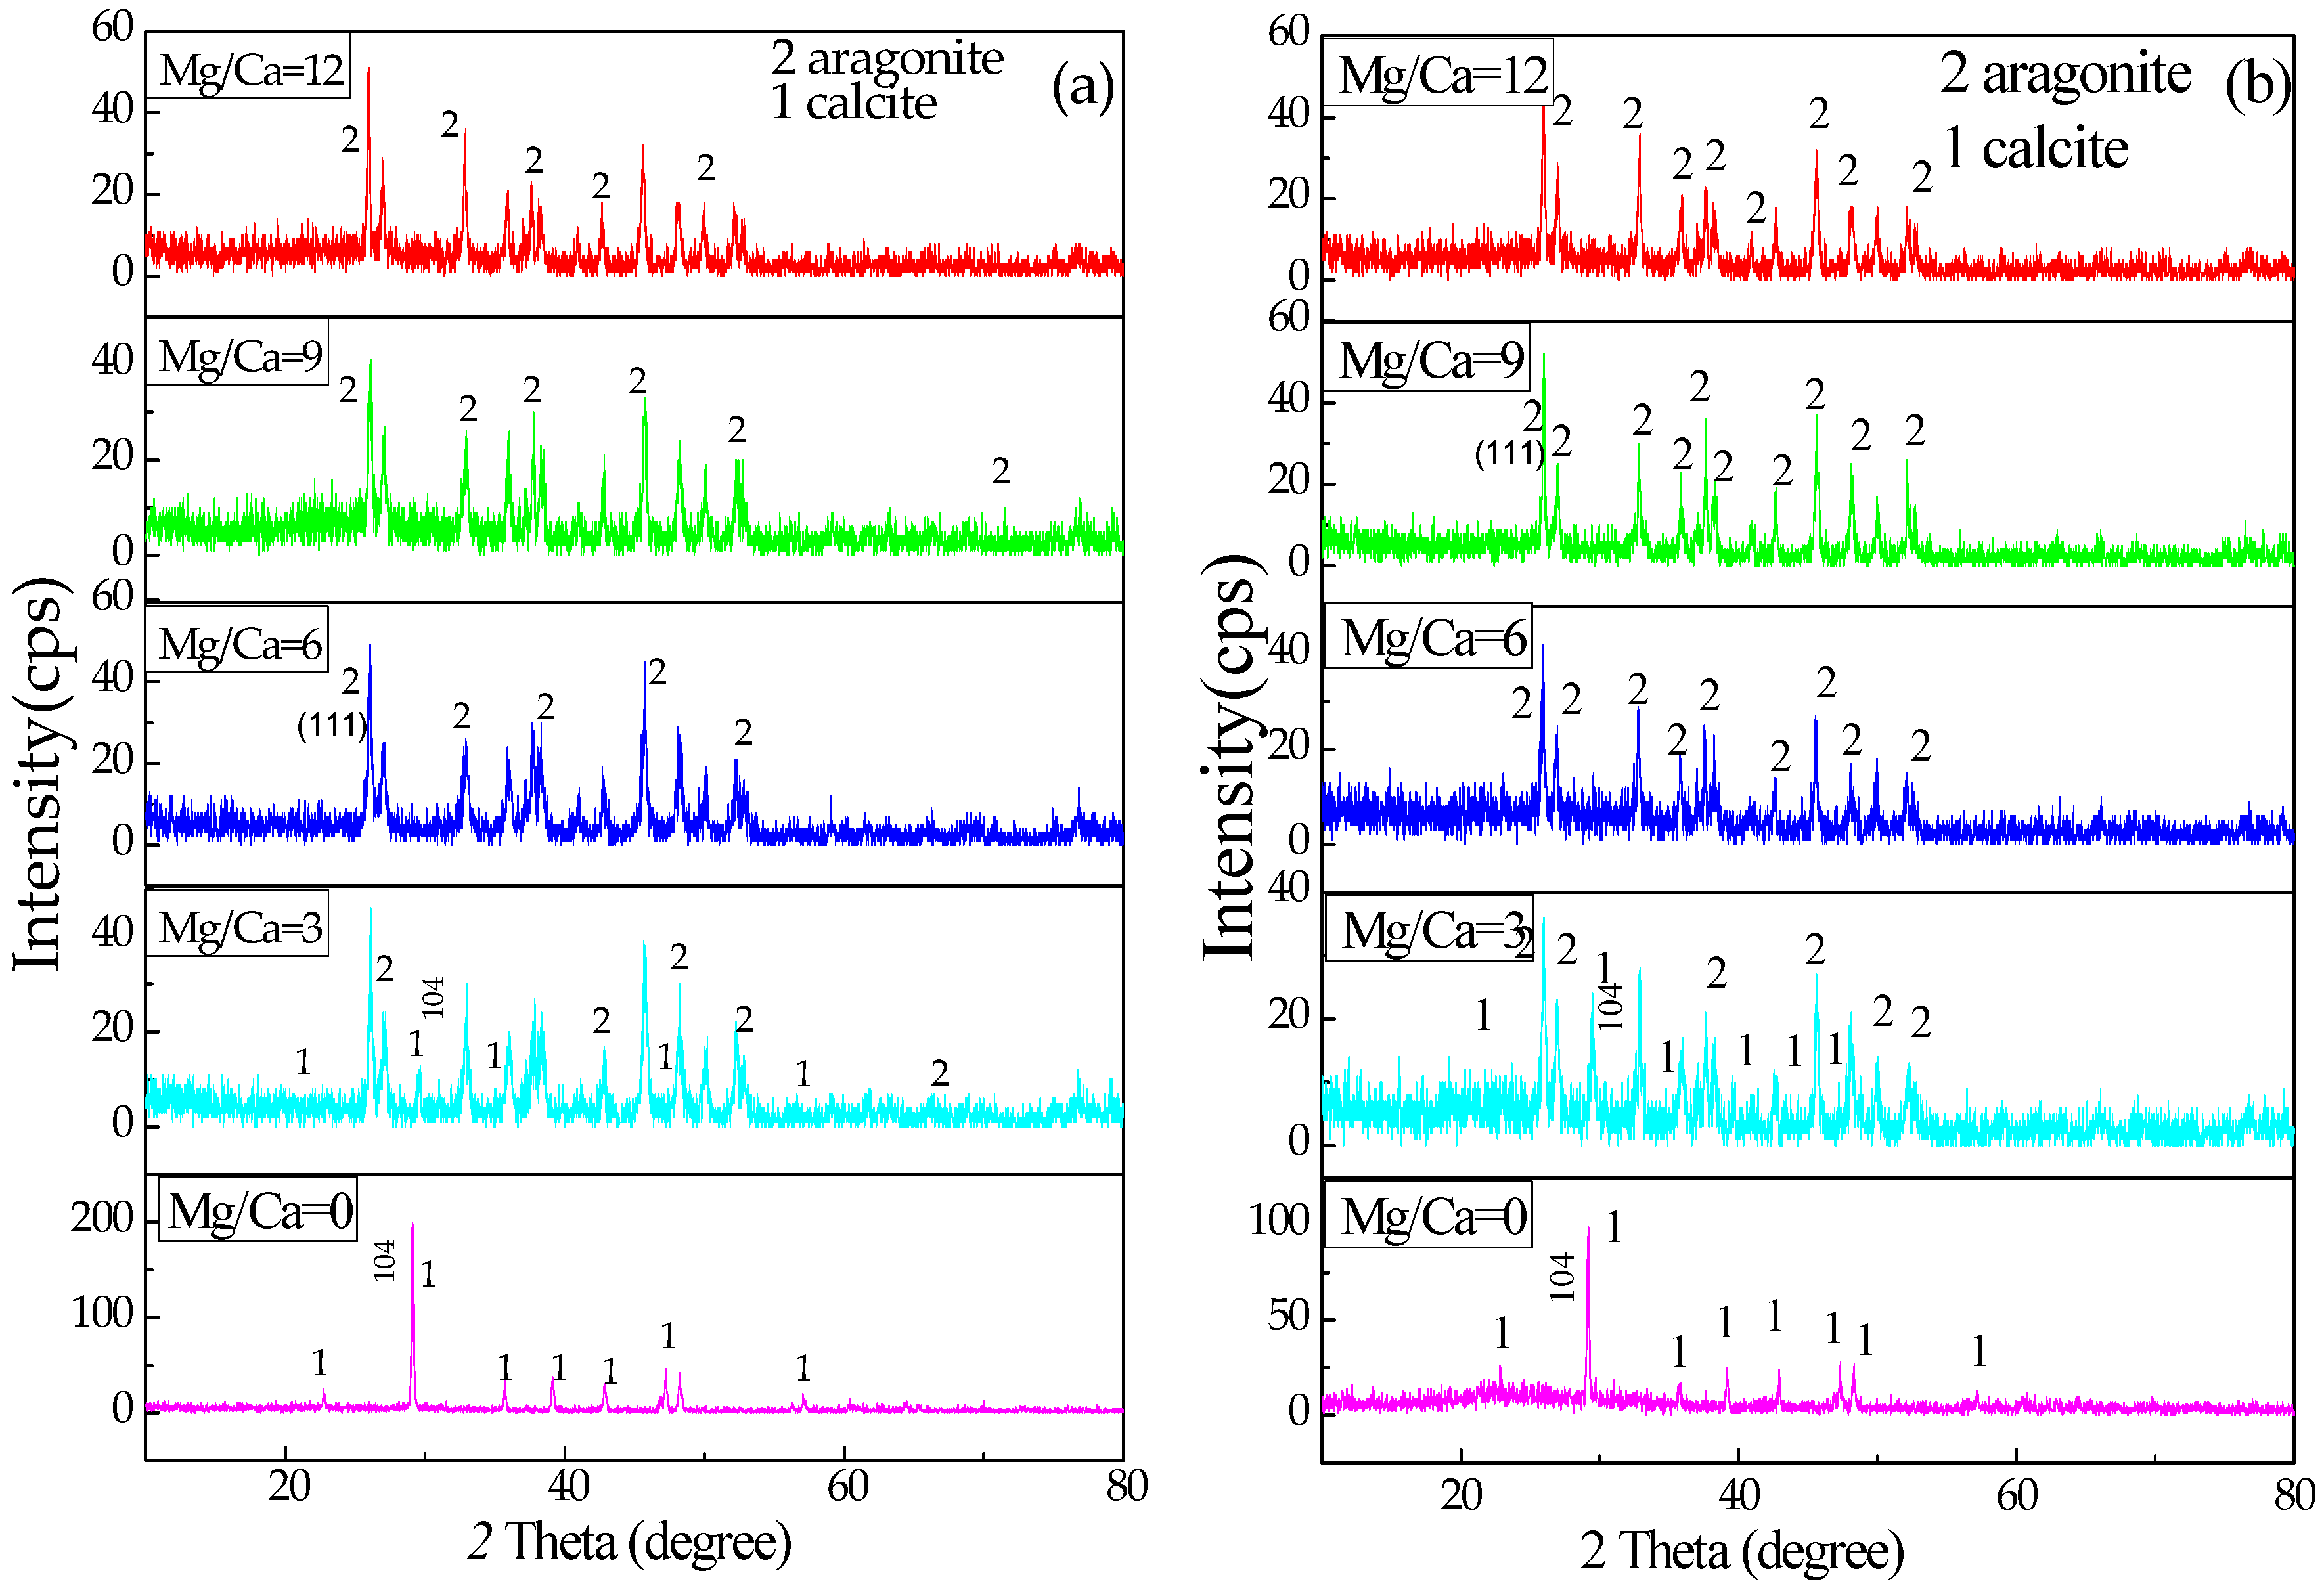
3.4. XRD Analysis of the Minerals Induced by B. licheniformis

Figure 6 shows that the minerals precipitated are calcite at a Mg/Ca molar ratio of 0, a mixture of calcite and aragonite at a Mg/Ca molar ratio of 3, and aragonite only at a Mg/Ca molar ratio of 6, 9, and 12, when the minerals were cultivated for 12 and 24 days. With an increasing cultivation time, 2θ of calcite (104) becomes larger at a Mg/Ca molar ratio of 3. That is to say, d (104) of calcite after 24 days has become smaller, indicating that some Ca ions have been replaced by Mg ions in the calcite crystal lattice. At the same time, the full peak width at half maximum (FWHM) for calcite (104) at a Mg/Ca molar ratio of 3, cultivated for 24 days, is larger than that cultivated for 12 day, indicating a decreasing crystallinity for the calcite with time, as a result of the incorporation of Mg2+ ions. The FWHM of aragonite (111) at each level of Mg/Ca molar ratio after 12 day is smaller with increasing cultivation time, suggesting that the crystallinity of aragonite is higher in the presence of more Mg2+ ions. The FWHM of aragonite (111), cultivated for 24 days, also becomes smaller with increasing Mg/Ca molar ratio, again, showing that the higher crystallinity of aragonite is closely related to the higher concentration of Mg2+ ions. That is to say, Mg2+ ions have played an important role in aragonite formation. In the control group, there were no mineral precipitates. These results also show that B. licheniformis can release ammonia and bicarbonate and carbonate ions to increase pH, and that the supersaturation of calcite and aragonite in the liquid culture medium can be elevated so that these minerals precipitate in the experimental group.

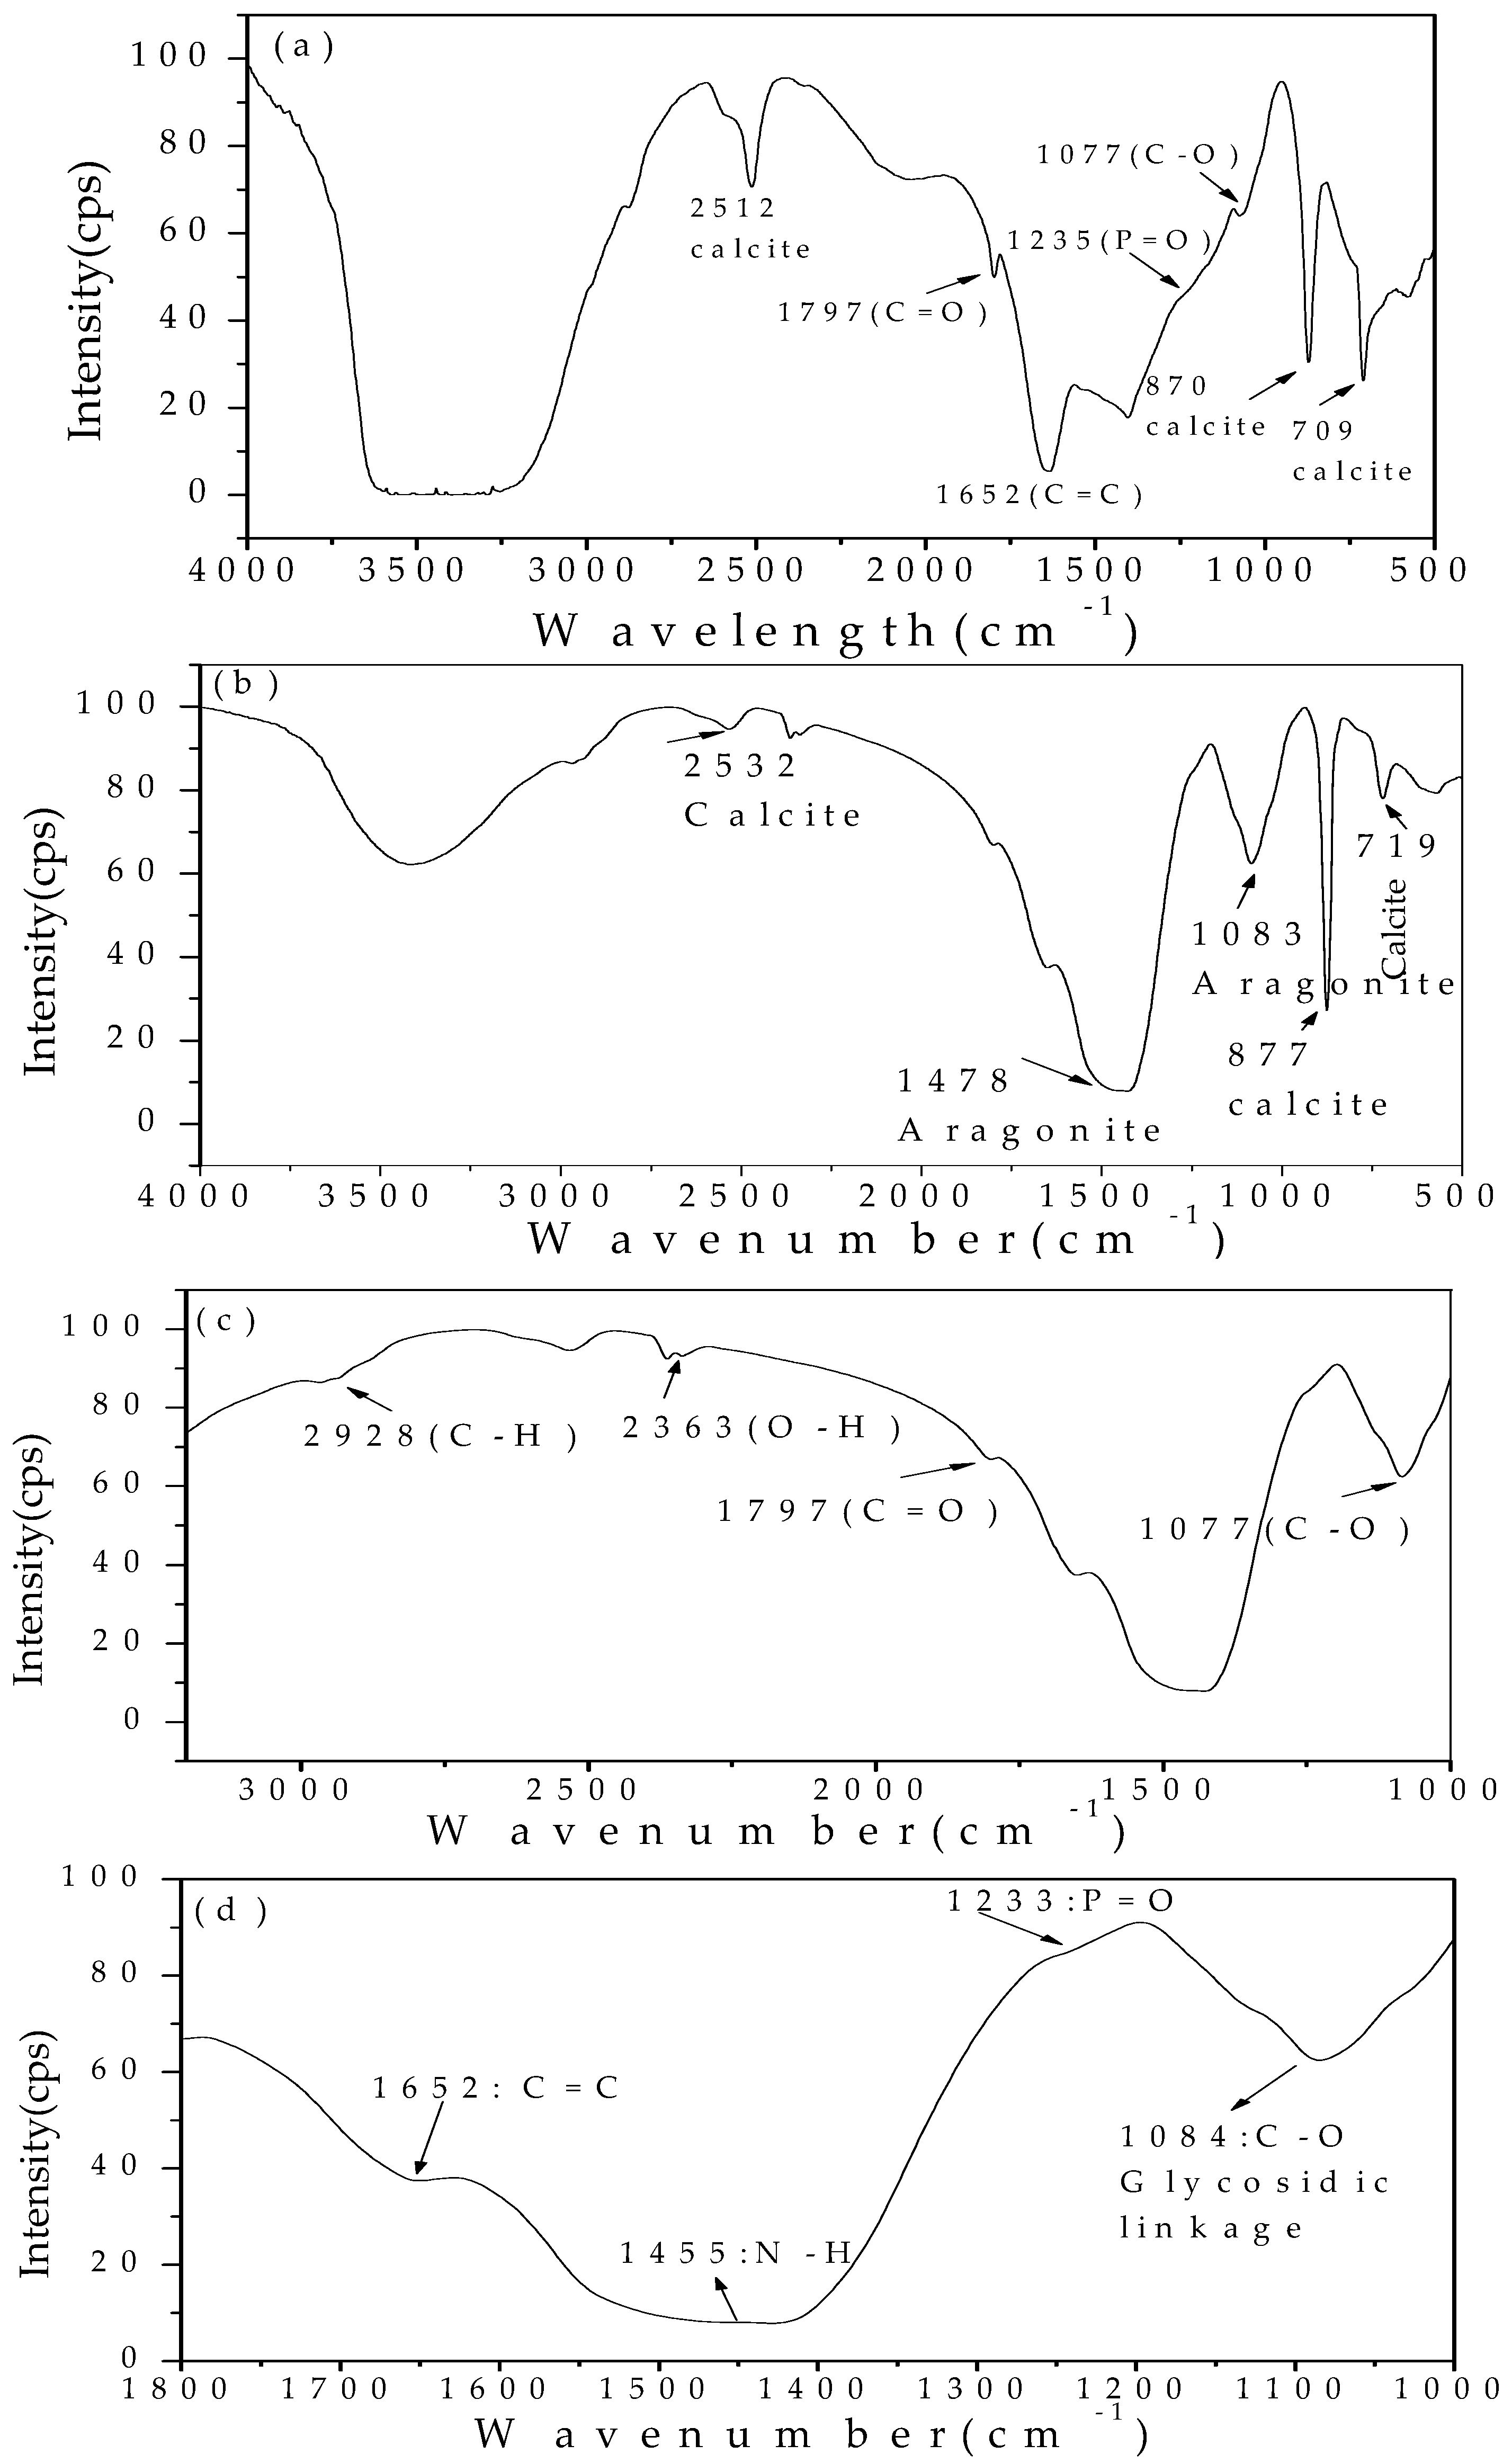
3.5. FTIR Analysis of the Minerals at a Mg/Ca Molar Ratio of 0 and 3 Induced by Bacteria

The sample preparation work followed the procedure of Tian et al. and Wang et al. [71,72]. The characteristic peaks of the minerals and organic functional groups can be obtained from Figure 7. The characteristic peaks of calcite are 712, 875, 1421, and 2514 cm−1, and those of aragonite are at 710, 856, 1082, and 1475 cm−1 [40]. It can be seen from Figure 7a that the peaks at 709, 870, and 2512 cm−1 are the characteristic peaks of calcite; some organic functional groups, such as C–O (1077 cm−1), P=O (1235 cm−1), C=C (1652 cm−1), and C=O (1797 cm−1) are also present. It can be seen from Figure 7b that the peaks at 719, 877, and 2532 cm−1, are the characteristic peaks of calcite, and the peaks at 1083 and 1478 cm−1 prove the existence of aragonite, consistent with the results of XRD analyses. Besides the characteristic peaks of these minerals induced by B. licheniformis, there are also some peaks showing other organic functional groups present in/on the minerals, such as C–H methylene vibrational band (2925 cm−1), O–H vibrational band (2363 cm−1), C=O vibrational band (1797 cm−1), and C–O vibrational band (1077 cm−1), shown in Figure 7c, and C=C, N–H, P=O, and C–O (glycosidic linkage) vibrational band at 1652, 1455, 1233, and 1084 cm−1, shown in Figure 7d, indicating that there was a close relationship between the organic functional groups and B. licheniformis. As to which kind of specific organic functional group affects calcite and aragonite, further exploration is needed.

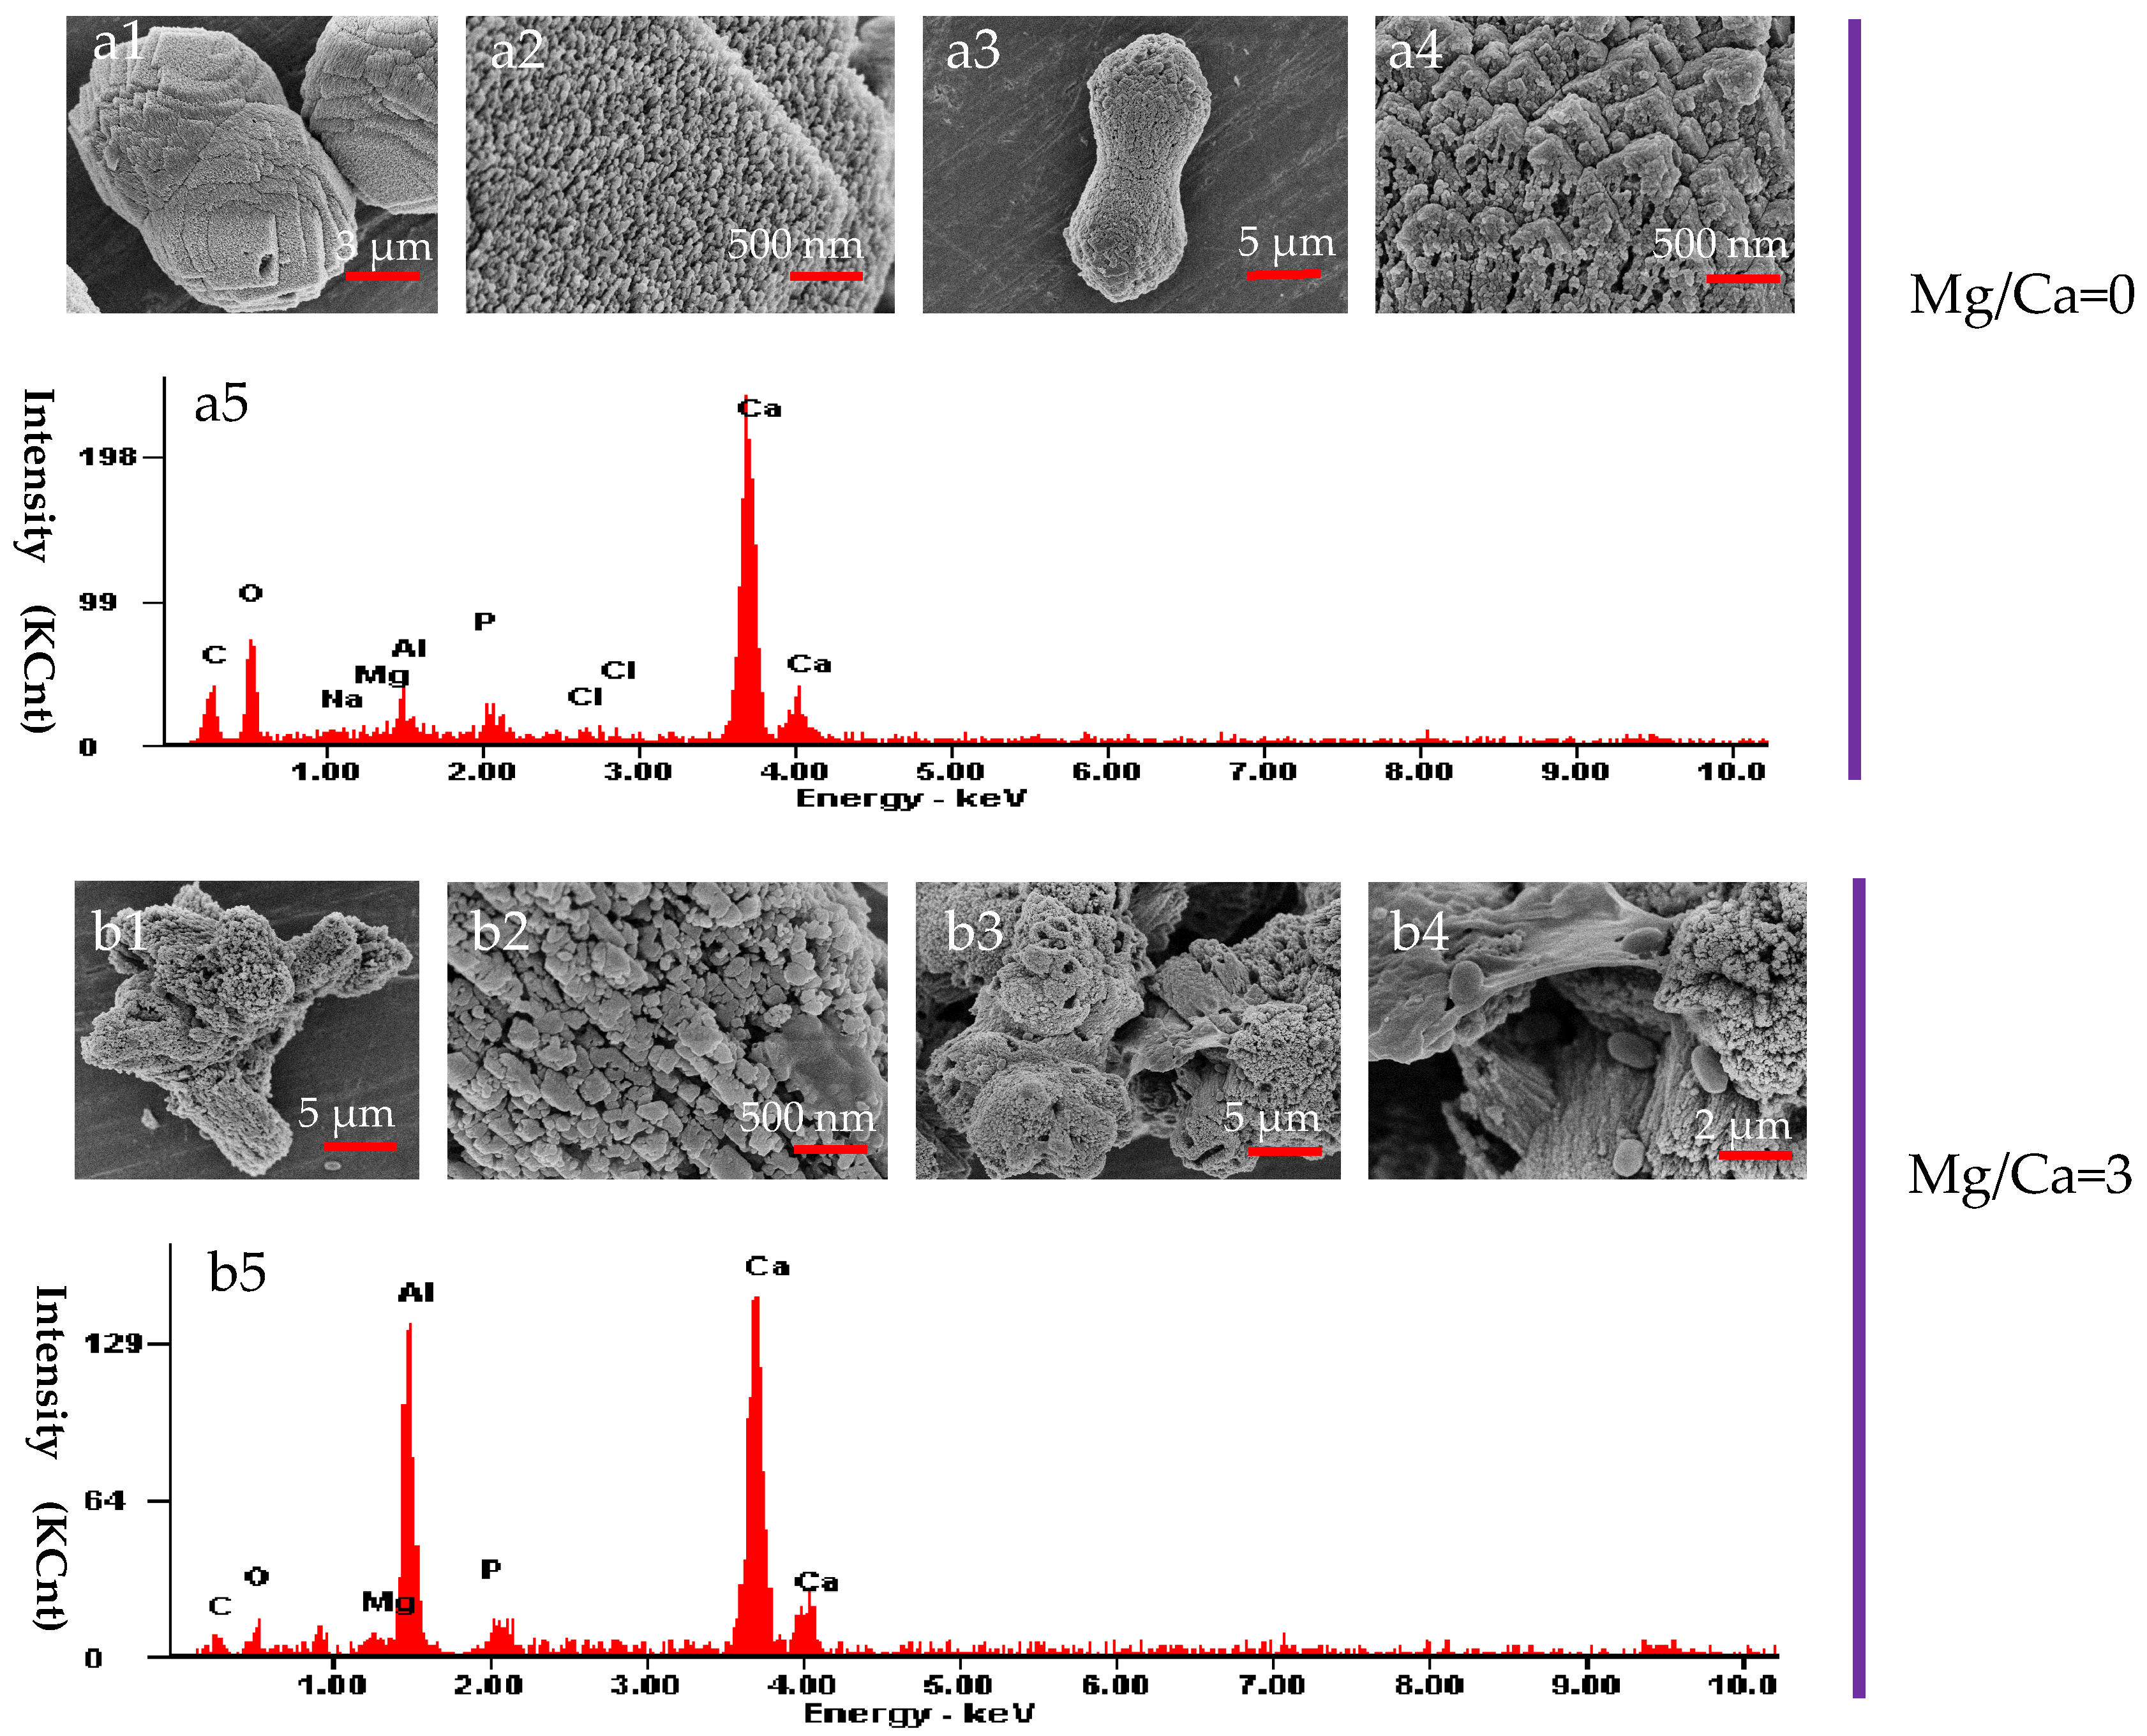
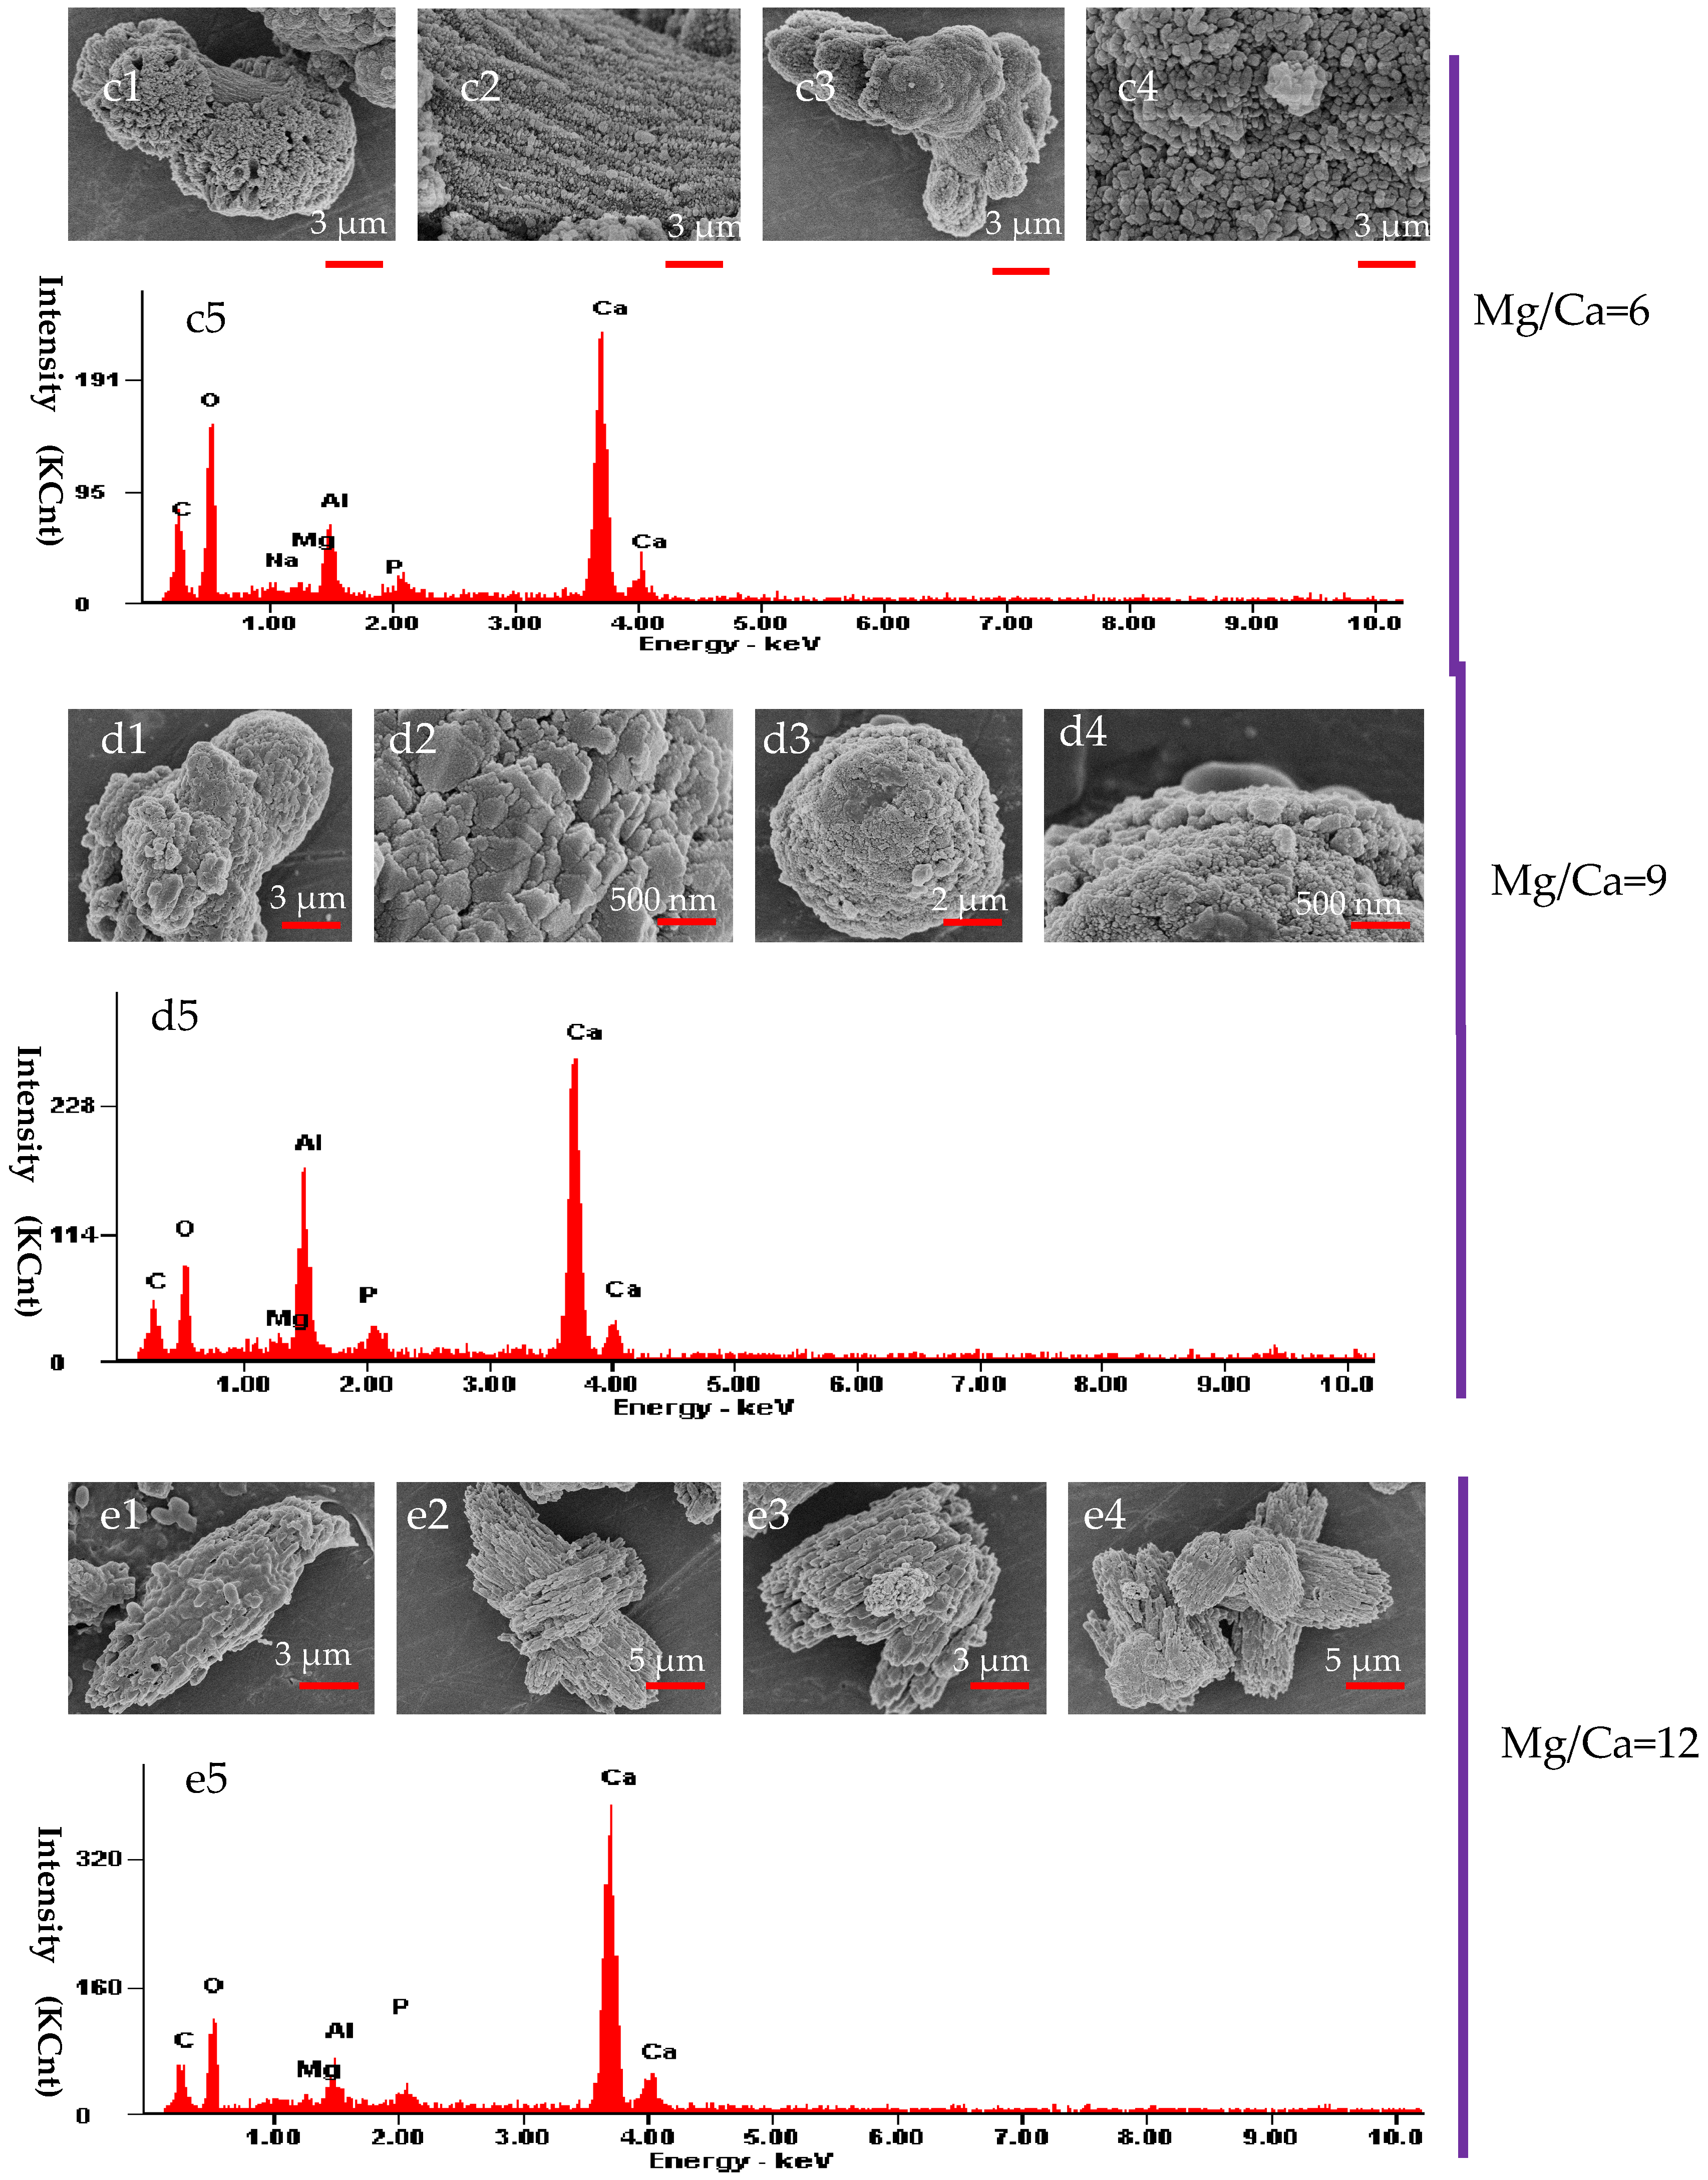
3.6. The Morphology and Elemental Composition of the Minerals Analyzed by SEM and EDX

Figure 8 shows the SEM and EDS results on the minerals precipitated after 24 days of cultivation. The elongate calcite crystals (Figure 8(a1)) and dumbbell-shaped calcite (Figure 8(a3)) can be observed at a Mg/Ca molar ratio of 0. The elongate calcite shows a layer-by-layer growth mode, and is covered with micron-sized rhombohedral calcite crystallites (Figure 8(a2)). The dumbbell-shaped calcite grows symmetrically along a central axis, and the surface is covered with many scale-like calcite crystallites (Figure 8(a4)), significantly different from the elongate calcite surfaces. At a Mg/Ca molar ratio of 3, aragonite is commonly present in the form of aggregates (Figure 8(b1)), and the surface shows a large number of rectangular crystallites growing in a parallel fashion (Figure 8(b2)). Many minute cavities are observed on the surfaces of some aragonite crystals (Figure 8(b3)), where B. licheniformis were once present. It can be seen from Figure 8(b4) that there are EPS and microorganisms adsorbed on/between the crystal aggregates. These features are significant in that they demonstrate that crystal precipitation was closely related to the presence of B. licheniformis. At a Mg/Ca molar ratio of 6, some aragonite crystals are in the shape of a cauliflower (Figure 8(c1)), with a surface covered in granular crystallites, no longer the rectangular forms (Figure 8(c2)). There are also some irregular aragonite aggregates (Figure 8(c3)), whose surfaces are covered with a large number of flake-shaped crystallites, up to 30 nanometers in size (Figure 8(c4)). Figure 8(d1–d4) show the morphology of aragonite crystallites precipitated at a Mg/Ca molar ratio of 9. There are also irregular aragonite aggregates (Figure 8(d1)), whose surfaces are covered with flake-shaped crystallites (Figure 8(d2)), larger than those shown in Figure 8(c4). Besides this, there is a spheroidal aragonite form (Figure 8(d3)) which is composed of a large number of nanometer granules (Figure 8(d4)). At a Mg/Ca molar ratio of 12, aragonite appears with a fusiform (Figure 8(e1)) or fascicular (Figure 8(e2,e3)) shape, and also in the form of aggregates (Figure 8(e4)). EDS analyses show that there are Ca, C, O, Al, and P elements in calcite at a Mg/Ca molar ratio of 0 (Figure 8(a5)). In addition to these elements, at higher Mg/Ca ratios, Mg is present in the aragonite (Figure 8(b5,c5,d5,e5)). P comes from B. licheniformis, Al from the mount beneath the sample, and Mg from the MgSO4 reagent in the culture medium.

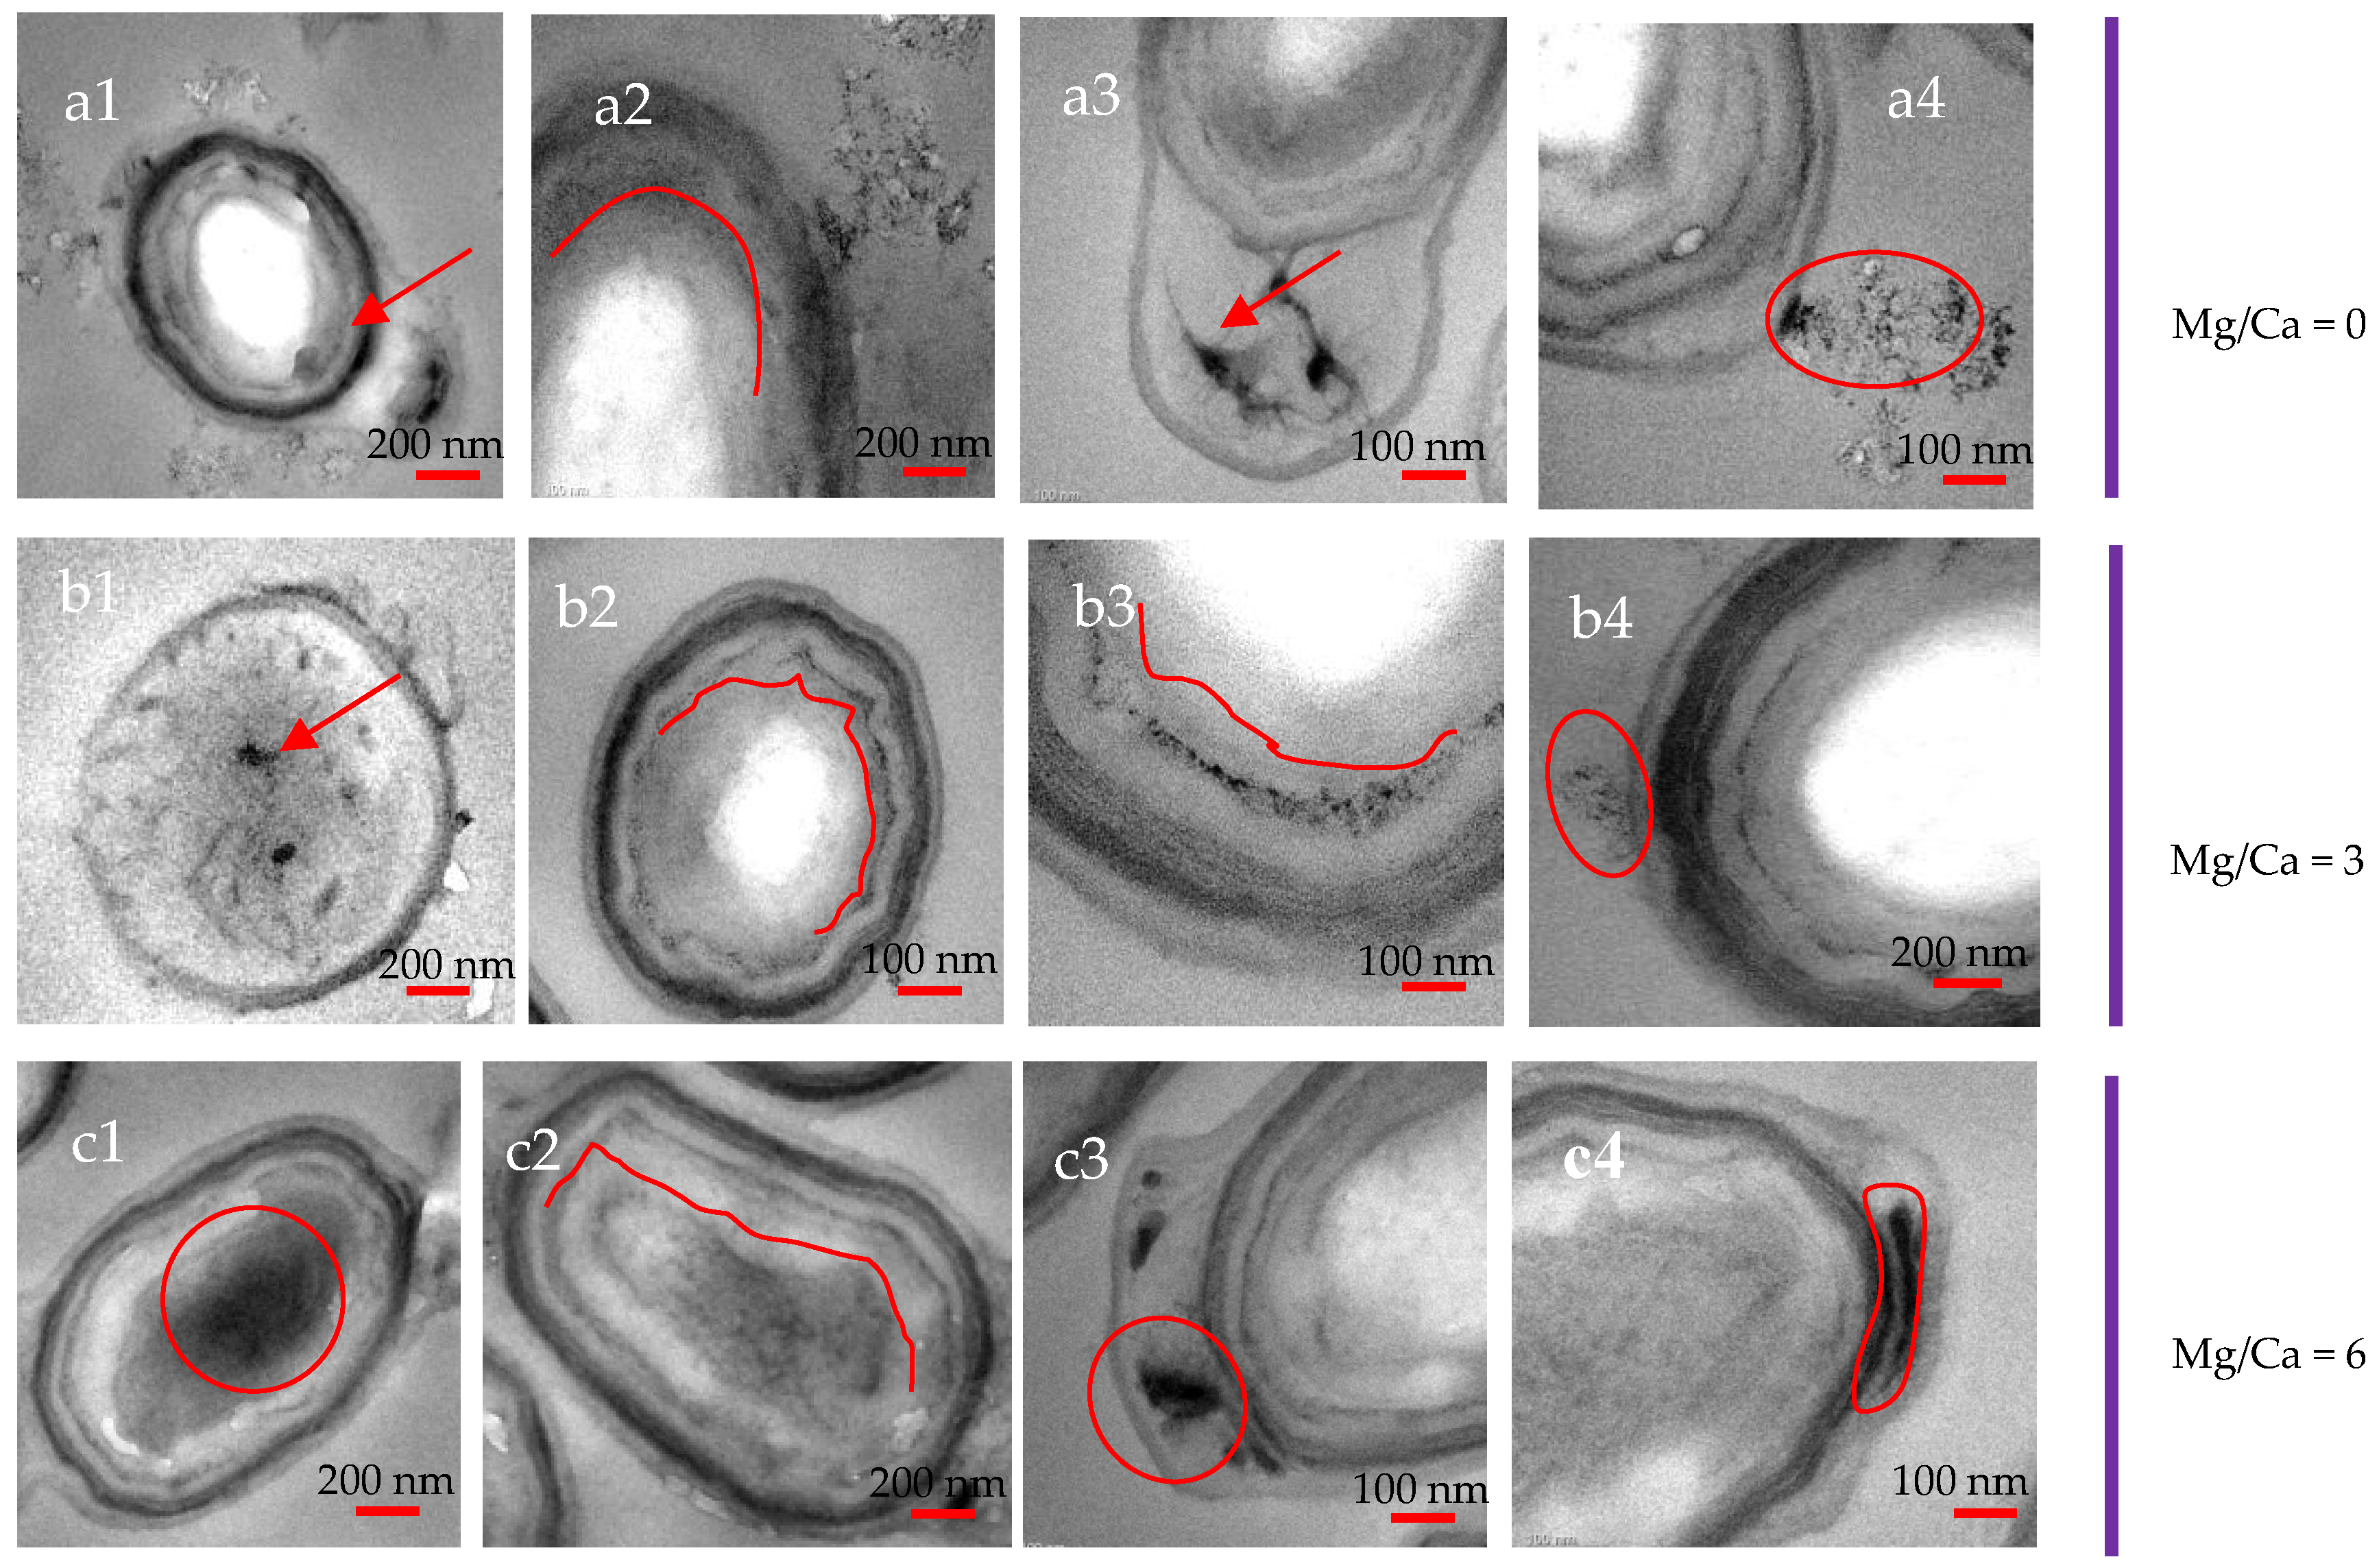
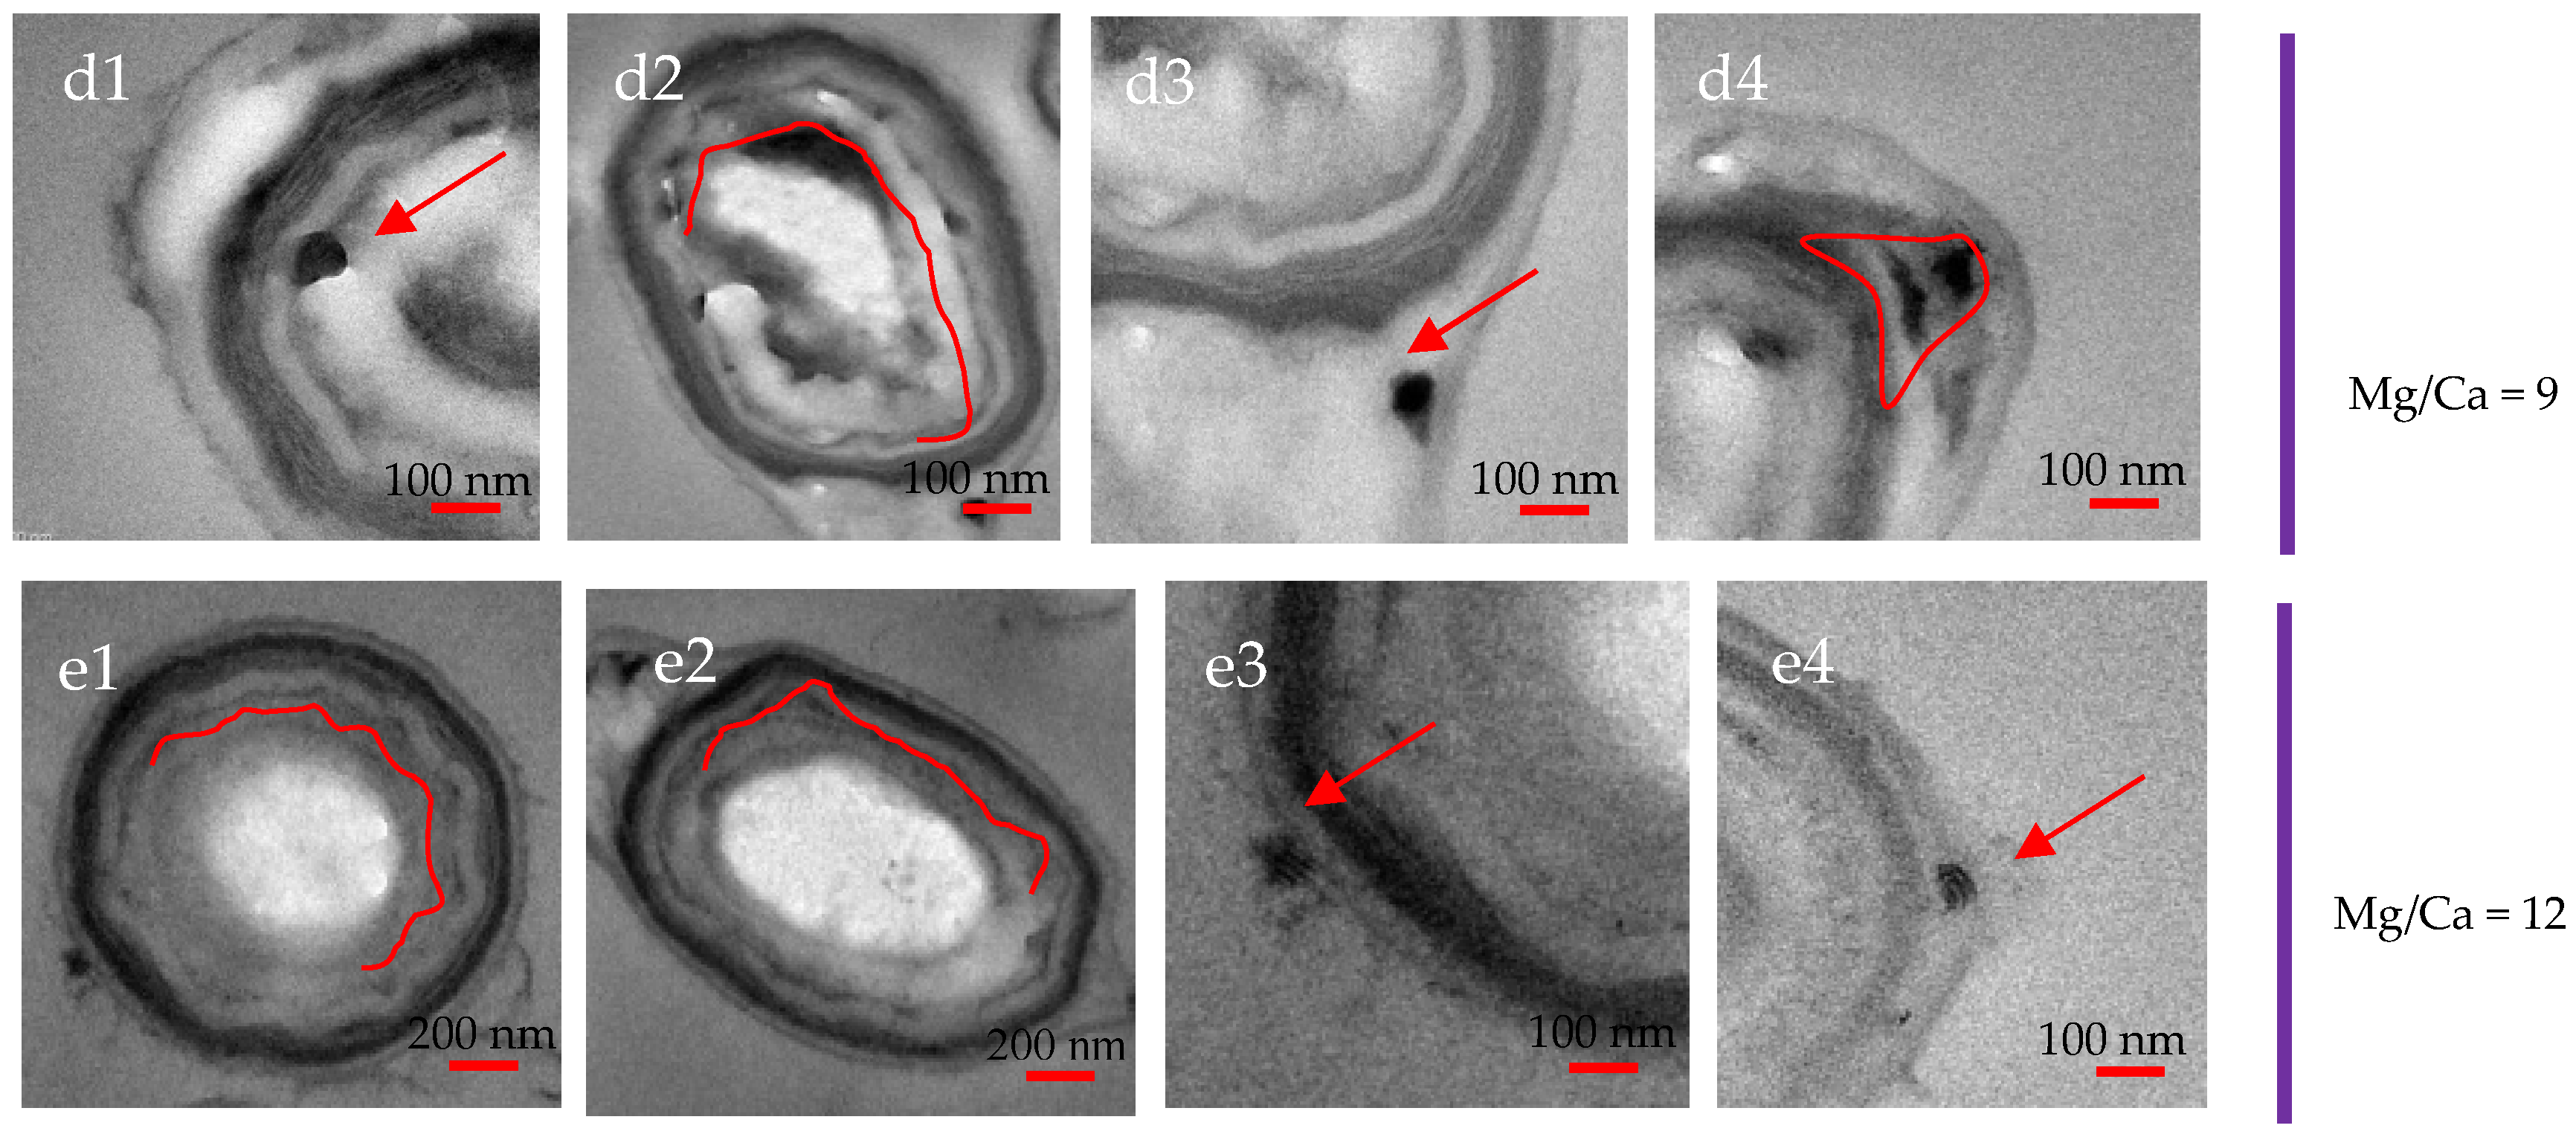
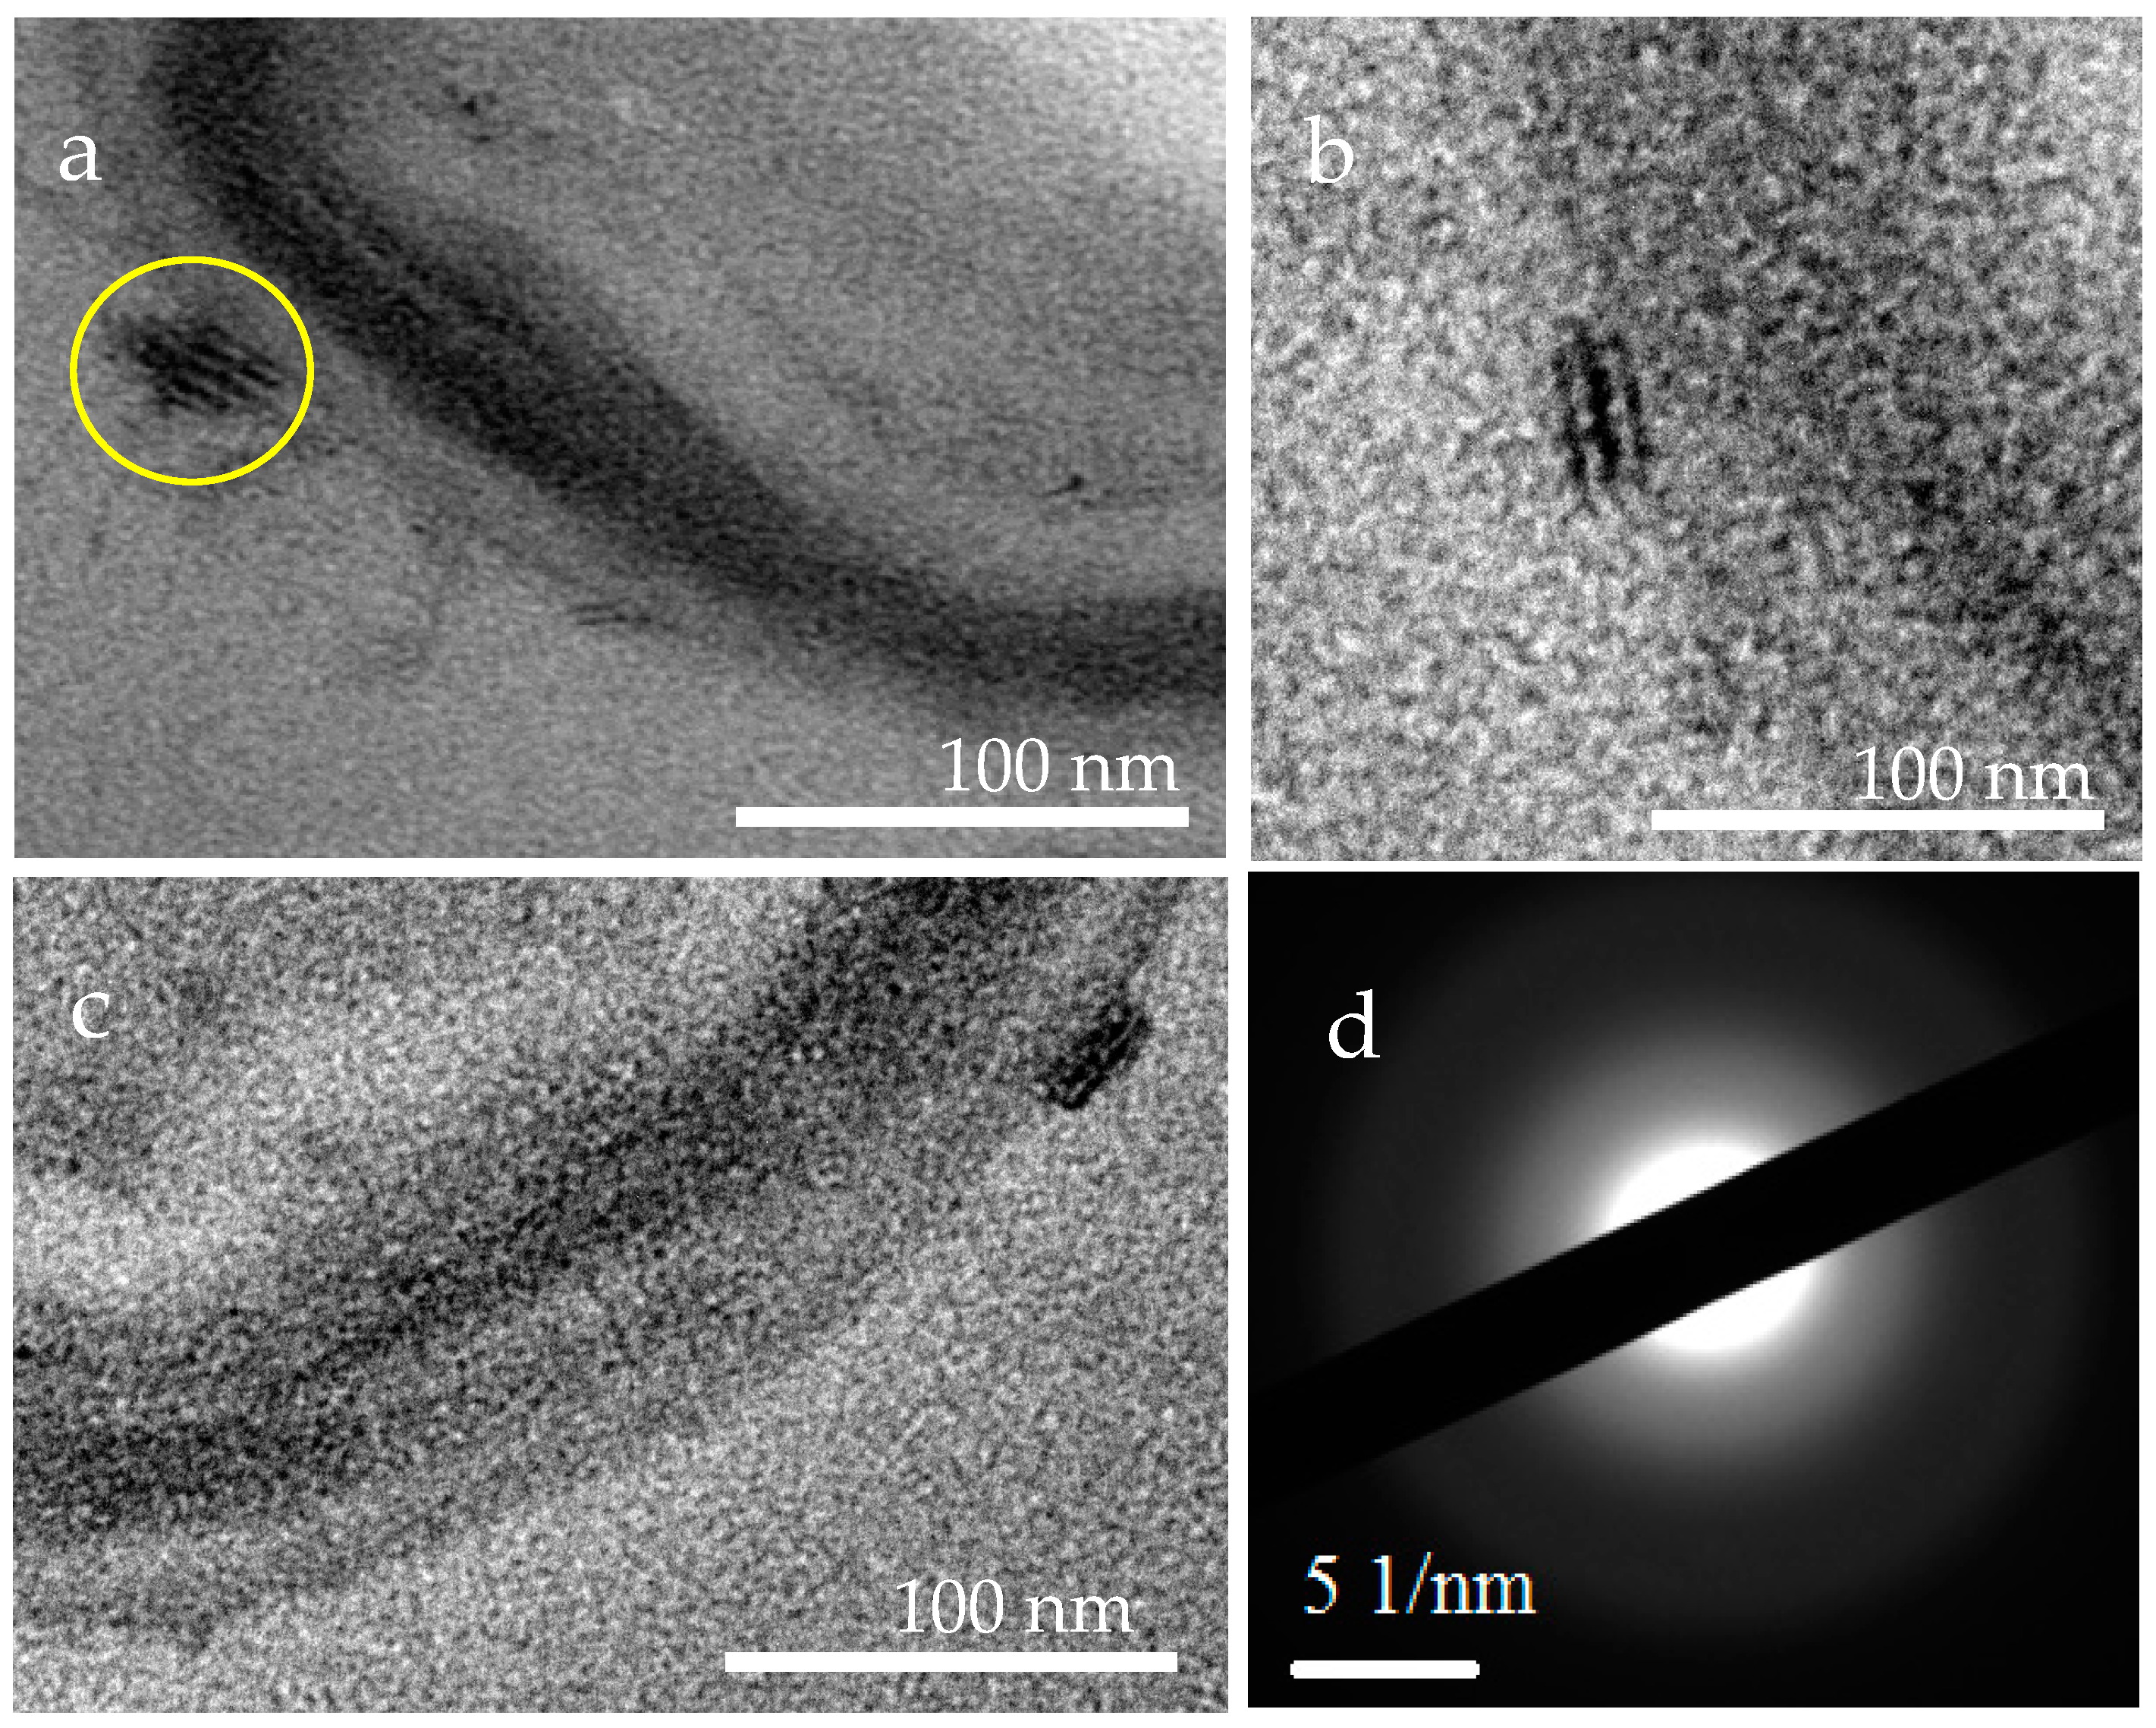
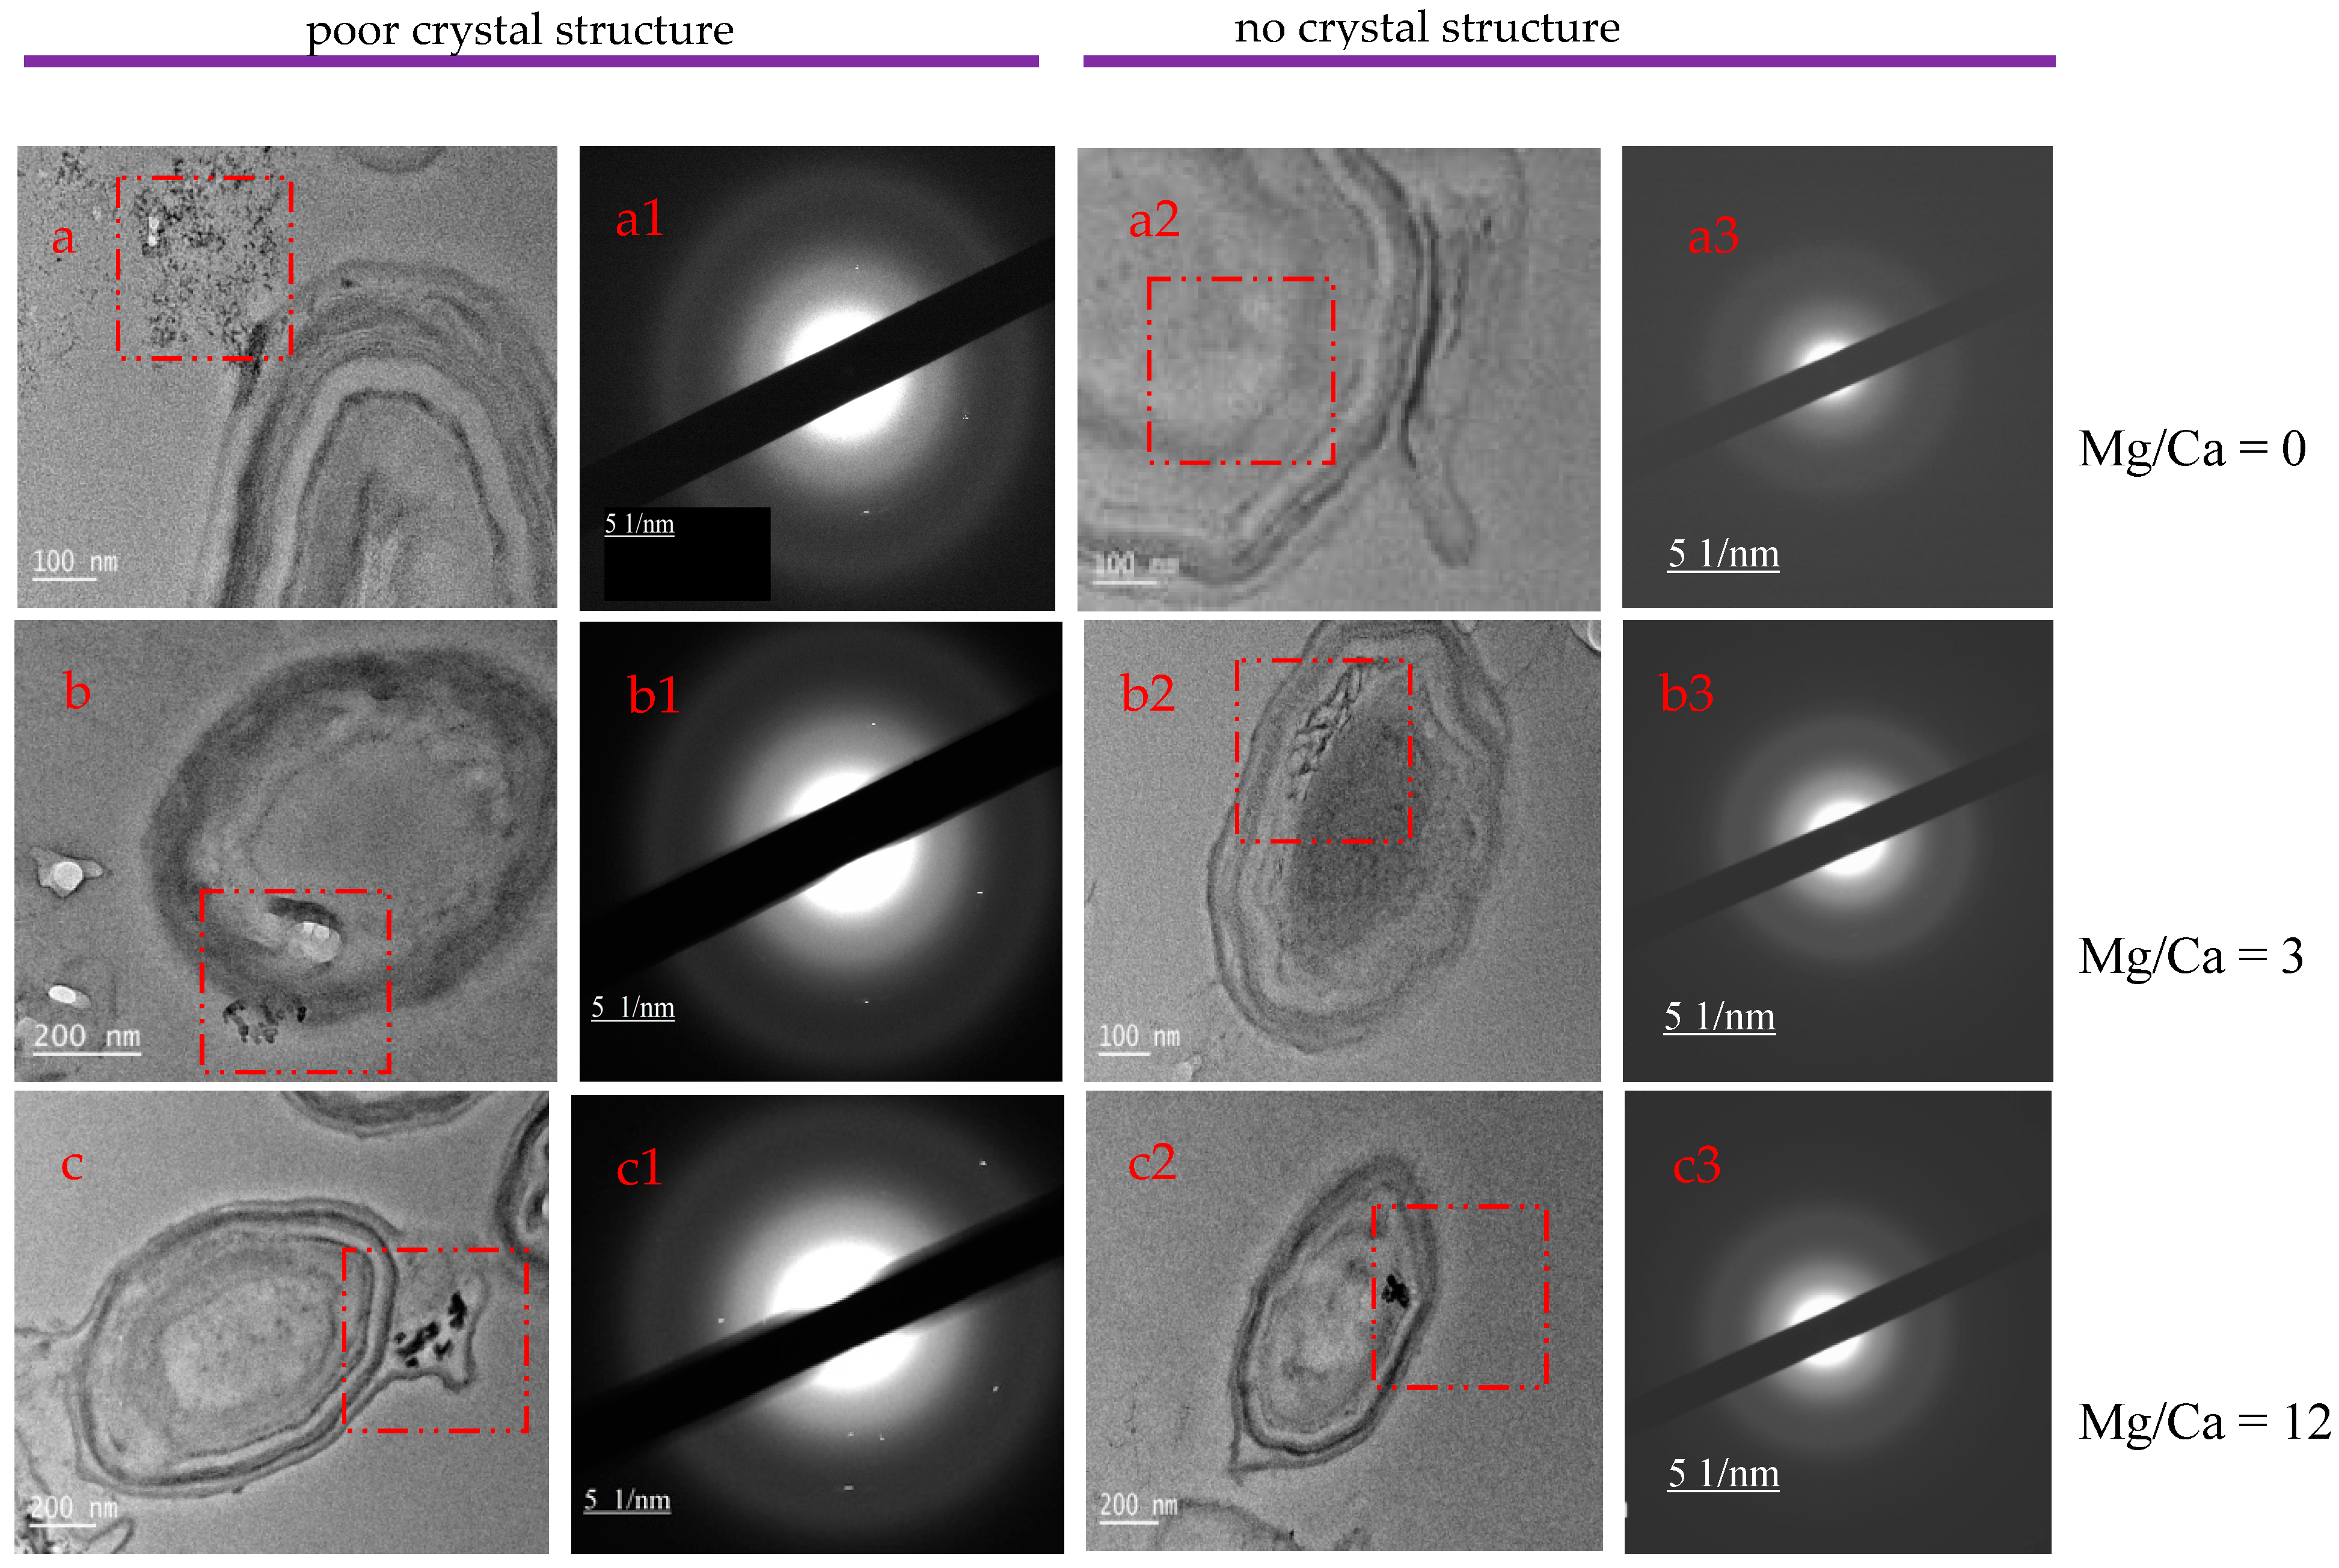
3.7. Intracellular and Extracellular Biomineralization of B. licheniformis

Ultrathin slices of B. licheniformis with a thickness of 70 nanometers have been prepared and analyzed by HRTEM-SAED. It can be seen from Figure 9(a1,a2) that the layered cell wall is obvious, and different sizes of dark granular areas are present inside the cells at a Mg/Ca molar ratio of 0. Figure 9(a3,a4) also show that some larger dark granules are growing inside the cell, or are adsorbed/ growing on the external surface (maybe within the EPS) of B. licheniformis. The density or thickness of the dark areas (granules) is higher than that of other areas, so that the dark area cannot be penetrated by electrons when analyzed by HRTEM. At a Mg/Ca molar ratio of 3, the nanometer dark granular areas are also present inside the cell (Figure 9(b1–b3)), and some granules have grown within the EPS, or maybe are adsorbed on to the EPS (Figure 9(b4)). At a Mg/Ca molar ratio of 6, some granules are aggregated in the center of the cell (Figure 9(c1)); some are randomly distributed along the long axis within the cell (Figure 9(c2)), and others in the EPS are growing from smaller granules into larger (Figure 9(c3)) and longer granules (Figure 9(c4)). At a Mg/Ca molar ratio of 9, a dark granule, less than 100 nm in length, is growing on the cell membrane (Figure 9d1); the dark granular areas are mainly distributed inside the cell (Figure 9(d2)) and in the EPS at the cell end (Figure 9(d3,d4)). At a Mg/Ca molar ratio of 12, in addition to the abovementioned dark granular areas (Figure 9(e2)), dark granular areas composed of the alternating light and dark bands, with a length of less than 100 nm, appear within/on the EPS (Figure 9(e1,e3,e4); the details are shown in Figure 10), indicating that the organic matter likely played a part in the formation of these unique dark granular areas. Many researchers have suggested that EPS can act as the nucleation site for crystallites, as is apparent in the results presented here with the dark granules in the EPS. In addition, in this study, we have shown that there are other nucleation sites, including cell membranes and the intracellular organelles.
In order to investigate the crystal structure of the dark granular or elongate material, SAED analyses were performed. A small number of diffraction spots were obtained in the SAED images (Figure 11(a1,b1,c1)), indicating that the extracellular dark material (Figure 11a–c) has a poor crystal structure. Intracellular dark granular areas (Figure 11(a2,b2,c2)) have no crystal structure, due to the fact that there are no diffraction spots in the SAED images (Figure 11(a3,b3,c3)). Some researchers have considered why amorphous material remains stable inside the cell since in general, and an amorphous mineral is unstable and will develop into a more stable form with a better crystal structure, such as amorphous calcium carbonate (ACC) changing into calcite. The mechanism of keeping the amorphous matter stable inside a cell has been related to the intracellular organic molecules. The dark clumps (Figure 10a–c), composed of alternating light and dark bands within the EPS of the cell, have been examined further by SAED, and the results show that they still have no crystal structure (Figure 10d). Although intracellular and extracellular dark granular and linear material can be observed, and the extracellular dark matter has a poor crystal structure and the intracellular granular material has no crystal structure, the elemental composition still cannot be determined; thus, the next objective in this research is to investigate if the dark granular or linear material contains Ca and Mg elements.

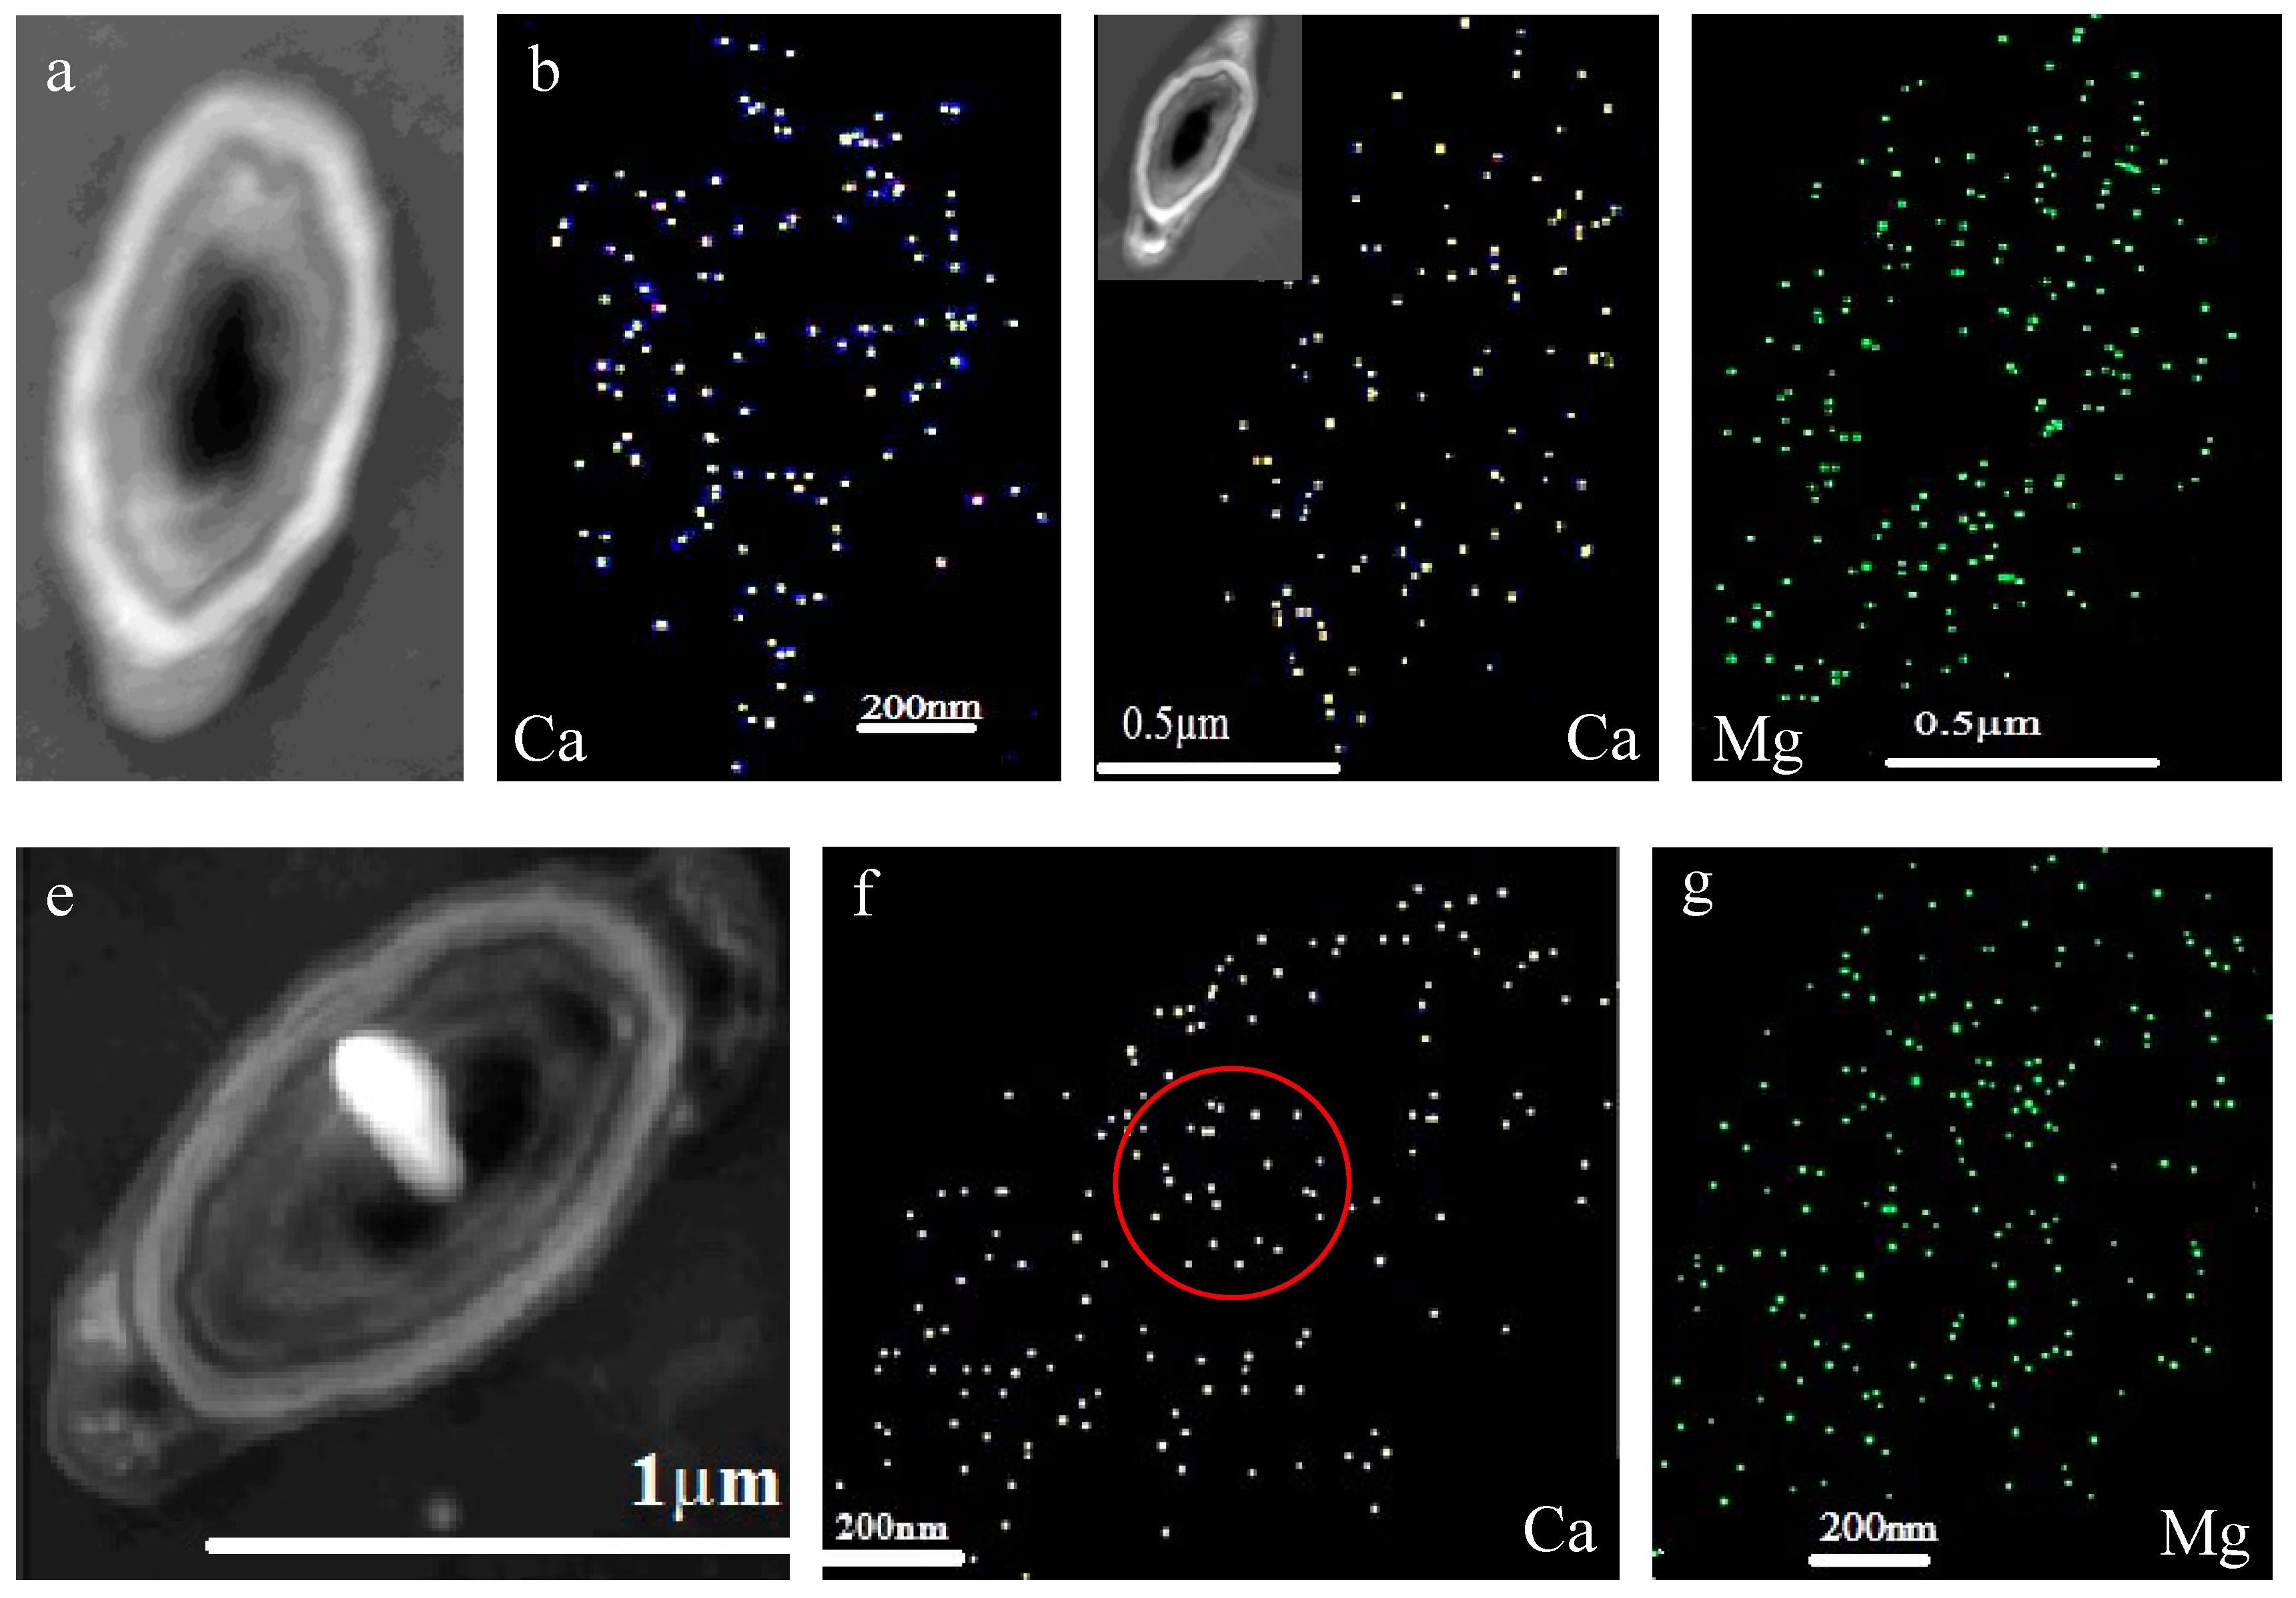
3.8. Ca and Mg Elemental Analysis of B. licheniformis

Figure 12 shows the morphology of B. licheniformis and the distribution of Ca and Mg elements. In the TEM images, the dark and denser areas inside the cell and within the cell EPS indicate the presence of metallic elements, and the light areas indicate the existence of organic matter. However, in the STEM images, the result is the reverse. Figure 12a,c,e show that the surface of the cell is the brightest, in a shape of light circle; the brightness decreases from the outside to the inside of the cell, and the cell center is commonly the darkest area of the cell, suggesting that the concentration of metal elements decreases from the outside to inside of the cell. Figure 12b shows the distribution of Ca within/on B. licheniformis bacteria at a Mg/Ca molar ratio of 0, also indicating that the concentration of Ca is higher on the surface/within the EPS than that inside the cell.
Figure 12c,d show the distribution of Ca and Mg within/on B. licheniformis at a Mg/Ca molar ratio of 3, also revealing the same rule that the concentrations of Ca and Mg decrease from outside to inside the cell, that is to say, the transport mode of Ca2+ and Mg2+ ions was diffusion, due to the fact that the metal ions were transferred along the concentration gradient, namely, from high to low concentration. The light area inside the cell (shown in Figure 12e) also contains Ca and Mg (Figure 12f,g). Figure 12f,g show the distribution of Ca and Mg within/on B. licheniformis at a Mg/Ca molar ratio of 12. It can be observed that the concentration of Mg is higher than that at a Mg/Ca molar ratio of 3, suggesting that more and more Mg2+ ions could enter inside the cell by diffusion, with the increase of Mg2+ ion concentration. These results also show that the ability of B. licheniformis to prevent ions from entering the cell is limited. As is well known, Ca2+ and Mg2+ ions are cofactors of many enzymes in the cell since, without these ions, the enzymes will lose their activity, while, if the concentrations of Ca2+ and Mg2+ ions are too high, they will have an adverse effect on the cell. In order to protect themselves, the only way is for solid amorphous matter to be formed, using the Ca2+ and Mg2+ ions transferred from the outside to the inside of the cell, along the concentration grade. This protection mechanism has already been discussed by scientists studying intracellular biomineralization. The amorphous dark granular areas inside the cell are maybe part of this protection mechanism.
In order to study the changes in intracellular Ca2+ concentration, a fluorescence intensity experiment has been performed. Figure 13 shows that there are no fluorescence intensities of bacteria at different Mg/Ca molar ratios without adding the Fluo-3 AM reagent, indicating that the bacteria themselves do not emit the fluorescence. After adding the Fluo-3 AM reagent, the fluorescence intensities of intracellular Ca2+ ions decrease with the increase in Mg/Ca molar ratio, further demonstrating that Ca2+ ions can enter the cell. The concentration of Ca2+ in the medium is higher than that inside the cell, thus, Ca2+ could be transferred from outside to inside the cell by diffusion. The fluorescence intensities at 525 nm were analyzed by SPSS 21 software, and the results show that there was an extremely significant difference in the fluorescence intensity, not only between the experimental and control group (p < 0.01), but also at different Mg/Ca molar ratio in the experimental group (p < 0.01). Changes in the concentration of intracellular Mg2+ ions in cells will be studied later.

4. Discussion

4.1. The Mechanism of Extracellular Biomineralization Induced by B. licheniformis

Microorganisms can increase pH and alkalinity to make the solution reach supersaturation, and this promotes the precipitation of minerals. Many researchers have suggested that the ammonia released from bacteria plays an important role in the pH increase [23]; however, others disagree with this opinion [36]. They have postulated that the quantity of ammonia released from the bacteria is not enough to increase the pH sufficiently, and that the pH values based on the ammonium concentration are much lower than those of the liquid culture medium inoculated with bacteria. In addition, besides ammonia, other factors could cause a pH increase, including CA. Thus, in this study, both ammonia and CA have been investigated.
The ammonia test demonstrated that B. licheniformis can release ammonia, leading to an increase in pH in the culture medium according to the following reaction (1):
NH 3   +   H 2 O   NH 4 +   +   OH
Besides ammonia, CA can also be secreted by B. licheniformis. CA is a kind of metal enzyme widely present in microorganisms and plants [73], and there is an acidic and alkaline CA [36]. In this study, the pH increase from 7.0 to 9.25 shows that the liquid culture medium is alkaline. There are still CA activities under alkaline conditions, indicating that CA secreted by B. licheniformis is the alkaline type. It has been reported that CA is one of the fastest reactive enzymes [74], since without CA catalysis, the hydration reaction of CO2 is very slow [75], and the typical catalytic rate of different types of CA can be up to 104–106/s [74]. Thus, due to the presence of the alkaline CA in this study, the following reaction (2) occurs:
CO 2 + H 2 O H 2 CO 3 HCO 3 + H +
The ammonia dissolves into the water to produce a large number of hydroxyl groups (OH), which can react with H+ to form water molecules, thus, reaction (2) will be ongoing and, at the same time, the following reaction (3) will occur:
HCO 3 + OH CO 3 2 + H 2 O
Thus, due to the presence of the ammonia, CA can release a large number of bicarbonate and carbonate ions, which can also increase the pH values in the culture medium. In this study, we can conclude that the pH increase is caused by the combination effect of the ammonia and the CA released by B. licheniformis, fully consistent with the results of Zhuang et al. [36].
It has been reported that CA produced by microbial metabolism plays an important role in biomineralization [26]. The results of our study are consistent with this. The presence of CA can produce enough bicarbonate and carbonate ions, and also lead to a pH increase to 9.25 with the help of ammonia; thus, the supersaturation of the carbonate minerals in the liquid culture medium can be elevated. Following this, carbonate precipitation will take place according to the following reaction (4):
2 Ca 2 +   +   CO 3 2 + HCO 3   +   OH 2 CaCO 3 + H 2 O
If there is no CA production and no alkaline environment, the minerals will not be produced, and this was confirmed in this study by the absence of mineral precipitates in the control group. Therefore, the microorganism, B. licheniformis, plays an important role in biomineralization, and there is no precipitation of carbonate minerals without microorganisms.

4.2. The Organic Functional Groups

In this study, many different kinds of organic functional groups (Figure 7) have been detected, including C–H, O–H, C=O, C–O, C=C, N–H, and P=O. No matter what kind of organic substance these organic functional groups come from, nor whether they are adsorbed on the surface of crystals or exist within minerals, these organic functional groups are closely related to the bacteria. Many researchers have suggested that the morphology of minerals is affected by the organic functional groups [76]. The elongate calcite crystallites obtained in this study, and their morphology, may be related to C=O group, which came from polysaccharides, amino acids, simple sugars, or organic matter containing carboxyl groups. Oxygen atoms in the C=O group carry negative charges, which mean they can interact with the polar surfaces of crystals, but would not affect the neutral surfaces. Through the influence of organic functional groups, the growth rate of some crystal planes will change, thus changing the morphology of crystals. It has been reported that biological macromolecules containing abundant carboxyl groups tend to interact with the stronger polar crystal planes of calcite, whereas other macromolecules with less acidity interact with neutral crystal planes, thus leading to the formation of elongate calcite [77]. There are many studies of this aspect of biominerals; for example, the proteins coming from sea urchin and mollusk shells are always glycosylated, and contain glycosidic groups (–C–O–C–), which could be responsible for the unique morphology of their constituent crystals [25,76].
From the FTIR results, the N–H group was detected, probably derived from amino acids of the EPS. Nitrogen atoms from the N–H groups also carry negative charges, and so can adsorb Ca2+ and Mg2+ ions to form a dense ring around the cell; this is consistent with the results of the STEM analyses (Figure 12). The minerals growing within/on the EPS have a poor crystallinity (Figure 10), contrasting with the better crystallinity of the calcite forming around the cells of the cyanobacteria Synechocystis sp. PCC6803 [78]. This could be due to the different species of bacteria or to the damage of calcite by Mg2+ ions. It is well documented that EPS has a major role in biomineralization processes [26]. The STEM results here support this. The organic functional groups of the EPS not only reduce the nucleation energy, making the whole process of biomineralization proceed more easily [79], but they also promote the nucleation itself [80].
The P=O group detected by FTIR likely came from the phospholipids in the cell membranes or from deoxyribonucleic acid (DNA) and ribonucleic acid (RNA). The negatively charged oxygen atoms in the P=O groups, located in the phospholipids, can also adsorb Ca2+ and Mg2+ ions, thus leading to the dark nanometer-sized granules growing on the inner membrane inside the cell wall (Figure 9). Although metal ions do not easily enter the cell, Ca2+ can enter through the ion channel [81]. The element P, occurring within calcite and aragonite crystals within the EDS (Figure 6), may be derived from the bacteria themselves. The EDS results are consistent with those of FTIR. The presence of P in the mineral matter is supporting evidence for biomineralization induced by bacteria in the culture medium which contains no P [82].
It has been reported that the composition, structure, and morphology of minerals can be changed through bacterial influence [76]. Thus, it is to be expected that B. licheniformis could induce the preferential growth of some crystal planes of minerals and, thus, modify their morphology via various organic functional groups.

4.3. The Relationship between Mg/Ca Molar Ratio and Calcium Carbonate Minerals

From the study of fluid inclusions within ancient primary marine halite, it has been concluded that the Mg/Ca ratio of seawater has changed in a range of 1.0–5.2 throughout the Phanerozoic Eon [83]. The transition of the polymorph mineralogy of calcium carbonate precipitates through Phanerozoic time has been caused by the variations of Mg/Ca ratios. With a low seawater Mg/Ca ratio (<2), the predominant calcium carbonate precipitate has been calcite, that is, low Mg calcite (during calcite seas); when seawater Mg/Ca ratio has been high (>2), high Mg calcite and aragonite have become the predominant polymorphs of calcium carbonate (i.e., aragonite seas) [84]. In this study, Mg/Ca molar ratios have been set as 0, 3, 6, 9, and 12, and the results also show that aragonite was the only mineral phase precipitated when the Mg/Ca molar ratio exceeded 3, and calcite was the predominant mineral at a Mg/Ca molar ratio of 0 and 3. This demonstrates the important role Mg/Ca molar ratios have played in the formation of polymorphs of calcium carbonate. However, there were no minerals formed in the control groups, which had the same Mg/Ca molar ratios as the experimental group. Why is this so? There must be other factors involved to influence the formation of calcite versus aragonite seas besides Mg/Ca molar ratios. In our opinion, microorganisms may well have played that significant role in the transition of calcite seas to aragonite seas, and it suggests that biological factors should not be neglected during the precipitation process of carbonate minerals. In this respect, the experiments of Ries et al. [85], to investigate the effects of varying seawater Mg/Ca molar ratio on biomineralization within marine bacterial biofilms, demonstrated that biomineralization occurred exclusively on the biofilm plates, and no precipitates formed on the non-biofilm control plates. Thus, as for the reasons behind the transition of calcite seas to aragonite seas, biological factors should be considered besides pCO2, Mg/Ca molar ratios, salinities, and temperatures, amongst others.
In this study, the emphasis has been on Ca2+ ions and the formation of calcite and aragonite, rather than on the Mg2+ ions. Mg2+ ions would be expected to be involved in the formation of magnesium carbonate or magnesium phosphate, just like Ca2+ ions in the liquid culture medium. However, the result is the opposite in our experiments: Mg2+ always exists as ions, and no magnesium minerals are formed. It is possible that Mg2+ ions need a longer time than Ca2+ ions to form their carbonate or phosphate. It has frequently been reported that the most difficult step is the dehydration of hydrated cations, which would then form cation–carbonate pairs [25]. The enthalpy of Mg[H2O]62+ dehydration is 351.8 kal/mol, and that of Ca[H2O]62+ 264.3 kal/mol at room temperature and atmospheric pressure (298 K, 1 atm) [25]. It is likely that the presence of hydrated membranes makes it difficult for Mg2+ ions to form mineral crystals. However, some researchers have other opinions. For example, from experiments Xu et al. demonstrated that Mg2+ ions in dry formamide could still not form magnesium carbonate crystals [86]. The Mg2+ ions with no hydrated membrane should react with CO32 ions quickly, due to the fact that energy is not needed to remove the water molecules around the Mg2+ ions. In addition, Xu et al. found that the lattice limitation on the spatial configuration of CO32 groups, other than cation hydration, prevents Mg2+ and CO32− ions from forming long-range ordered structures [86]. The mechanism of Mg2+ biomineralization induced by microorganisms will be explored further in the future.

4.4. The Transport Mode of Ca2+ and Mg2+ Ions and the Nucleation Site

It has been shown here that abundant Ca2+ and Mg2+ ions are adsorbed on/within EPS, and that these ions are able to enter the cell (Figure 12); this indicates that the transport mode of these ions, from outside to inside the cell, is diffusion, taking place along a concentration gradient from high to low. As is well known, soluble ions cannot easily enter a cell due to the barrier of the cell membrane, which is composed of a phospholipid bilayer. However, there are ion-channels located in the cell membrane, which can act as carriers to transfer Ca2+ ions from the outside to inside of the cell. It has been reported that the voltage-gated Ca2+ channels can mediate Ca2+ entry into cells in response to membrane depolarization [87], and the membrane-embedded ion-channels are electrolyte-filled nanotubes with different kinds of proteins [88]. Such transport through Ca2+ channels is called facilitated diffusion, which is much faster than simple diffusion, where there are no carriers. Similarly, it is suggested there are Mg2+ channels, in addition to the Ca2+ channels. Some researchers have reported that the primary uptake system, namely the CorA Mg2+ channel, is present in about half of all bacteria and archaea [89]. Thus, Mg2+ ions could also be transferred through ion-channels by diffusion. When Ca2+ and Mg2+ ions are present outside the cell at the same time, the factors governing the selectivity filter of the voltage-gated Ca2+ ion-channel lie in the pore size, oligomericity, and solvent accessibility [90]. That is to say, Mg2+ ions can also enter the cell through the Ca2+ ion channel by diffusion. Thus, many Ca2+ and Mg2+ ions can be observed inside the cell, as well as on/within EPS, as shown in Figure 12.
It is generally accepted that the microbial cell surface and EPS are important nucleation sites [30]. However, from experiments where dolomite minerals are not observed on a heat-treated cell surface [28], it has been inferred that the cell surface, alone, is not sufficient to serve as the nucleation site. In our opinion, there are many amino acids in/on the surface of cells, such as glutamic acid and aspartic acid, occurring in some kind of ion channel, which could bind metal ions like Ca2+ and Mg2+. If bacterial cells were heat-killed at a high-enough temperature, these amino acids in/on the surface of cells may also be destroyed and so be missing, which would not have been beneficial to the adsorption of metal ions. That is to say, we agree with the opinion that the cell surface alone is not sufficient to serve as the nucleation site, but there are other factors concerning the cell surface which can affect the adsorption and nucleation of the metal ions. Besides the cell surfaces themselves, the EPS around the cell surface may have also played an important role [30,31,32]. In the experiments performed by Deng et al., the sulfate-reducing bacteria (SRB) and halophiles have an EPS-like material, which may have served as the nucleation site for dolomite [27]. In our research, there are also EPS-like materials around the cell surface and, here, there is nanometer-sized material with poor crystallinity. Thus, the EPS of bacteria are also nucleation sites. However, if the EPS were isolated from the cell surface by the heat treatment, and used to induce mineral precipitation, the question as to whether the heated EPS is still a nucleation site needs further study.

5. Conclusions

In this study, B. licheniformis DB1-9 bacteria were identified by 16S rDNA sequencing, and used to induce carbonate mineral precipitation at different Mg/Ca molar ratios. In experiments, pH values increased to 9.25, mainly as a result of the combination effect of carbonate anhydrase (CA) and ammonia released by B. licheniformis. CA can catalyze the hydration reaction of carbon dioxide to release abundant bicarbonate and carbonate ions; these can then elevate the supersaturation state of calcium carbonate in the liquid culture medium, and promote the precipitation of polymorphs of calcium carbonate. The presence of Mg2+ ions and some organic functional groups can affect the morphology of mineral precipitates. The formation of aragonite minerals is not only related to the Mg2+ ions, but also has a strong correlation with the presence of microorganisms. Intracellular nanometer-sized dark granular areas have no crystal structure, whereas similar granules on/within the EPS have a poor crystal structure. This study contributes towards our understanding of biomineralization induced by microorganisms, and is also relevant to processes involved in the change from calcite to aragonite seas in the Phanerozoic.

Author Contributions

Z.H. conceived and designed the experiments; X.G. performed the experiments; Z.H., H.Z., and H.Y. analyzed the results of all the experiments; X.G. and H.Y. wrote the paper; H.Z. and M.E.T. revised the manuscript; Y.Z. performed the some experiments; Z.B. helped us to analyze the data by using SPSS 21 software; J.P. helped us to modify figures, and G.W. helped us to do some experiments. All authors read and approved the manuscript.

Funding

This work was supported by the National Natural Science Foundation of China (41772095, U1663201, 41702131), Taishan Scholar Talent Team Support Plan for Advanced & Unique Discipline Areas, Major Scientific and Technological Innovation Projects of Shandong Province (2017CXGC1602, 2017CXGC1603), SDUST Research Fund (2015TDJH101), Natural Science Foundation of Shandong Province (ZR2017BD001), the China Postdoctoral Science Foundation founded project (2016M600548, 2017T100502), Qingdao Postdoctoral Applied Research Project (2015199), the Scientific and Technological Innovation Project Financially Supported by Qingdao National Laboratory for Marine Science and Technology (No. 2016ASKJ13), Open Fund of the Key Laboratory of Marine Geology and Environment, Chinese Academy of Sciences (No. MGE2016KG10).

Conflicts of Interest

The authors declare no conflict of interest.

References

  1. Burne, R.V.; Moore, L.S. Microbialites: Organosedimentary deposits of benthic microbial communities. Palaios 1987, 2, 241–254. [Google Scholar] [CrossRef]
  2. Riding, R. Microbial carbonates: The geological record of calcified bacterial–algal mats and biofilms. Sedimentology 2010, 47, 179–214. [Google Scholar] [CrossRef]
  3. Chen, J.T.; VanLoon, A.J.; Han, Z.; Chough, S.K. Funnel-shaped, breccia-filled clastic dykes in the late Cambrian Chaomidian formation (Shandong Province, China). Sediment. Geol. 2009, 221, 1–6. [Google Scholar] [CrossRef]
  4. Chen, J.T.; Chough, S.K.; Chun, S.S. Limestone pseudoconglomerates in the Late Cambrian Gushan and Chaomidian Formations (Shandong Province, China): Soft-sediment deformation induced by storm-wave loading. Sedimentology 2009, 56, 1174–1195. [Google Scholar] [CrossRef]
  5. Grotzinger, J.P.; Knoll, A.H. Stromatolites in Precambrian carbonates: evolutionary mileposts or environmental dipsticks? Annu. Rev. Earth Planet. Sci. 1999, 27, 313–358. [Google Scholar] [CrossRef] [PubMed]
  6. Hofmann, H.J.; Grey, K.; Hickman, A.H.; Thorpe, R.I. Origin of 3.45 Ga coniform stromatolites in Warrawoona Group, Western Australia. Geol. Soc. Am. Bull. 1999, 111, 1256–1262. [Google Scholar] [CrossRef]
  7. Nutman, A.P.; Bennett, V.C.; Friend, C.R.L.; Kranendonk, M.J.V.; Chivas, A.R. Rapid emergence of life shown by discovery of 3,700-million-year-old microbial structures. Nature 2016, 537, 535. [Google Scholar] [CrossRef]
  8. Chen, J.T.; Han, Z.Z.; Zhang, X.L.; Fan, A.P.; Yang, R.C. Early diagenetic deformation structures of the Furongianribbon rocks in Shandong Province of China—A new perspective of the genesis of limestone conglomerates. Sci. China Earth Sci. 2010, 53, 241–252. [Google Scholar] [CrossRef]
  9. Yang, R.C.; Fan, A.P.; Han, Z.Z. Characteristics and genesis of microbial lumps in the Maozhuang Stage (Cambrian Series 2), Shandong Province, China. Sci. China Earth Sci. 2013, 56, 494–503. [Google Scholar] [CrossRef]
  10. Chen, J.T.; Chough, S.K.; Han, Z.; Lee, J.H. An extensive erosion surface of a strongly deformed limestone bed in theGushan and Chaomidian formations (late middle Cambrian to Furongian), Shandong Province, China: Sequence-stratigraphic implications. Sediment. Geol. 2011, 233, 129–149. [Google Scholar] [CrossRef]
  11. Brasier, M.D.; Jonathan, A.; Martin, S.; David, W. Changing the picture of Earth’s earliest fossils (3.5-1.9 Ga) with new approaches and new discoveries. Proc. Natl. Acad. Sci. USA 2015, 112, 4859–4864. [Google Scholar] [CrossRef] [PubMed]
  12. Kranendonk, M.J.V.; Philippot, P.; Lepot, K.; Bodorkos, S.; Pirajno, F. Geological setting of Earth’s oldest fossils in the ca. 3.5 Ga Dresser Formation, Pilbara Craton, Western Australia. Precambrian Res. 2008, 167, 93–124. [Google Scholar] [CrossRef]
  13. Braissant, O.; Decho, A.W.; Dupraz, C.; Glunk, C.; Przekop, K.M.; Visscher, P.T. Exopolymeric Substances of Sulfate-Reducing Bacteria: Interactions with Calcium at Alkaline pH and Implication for Formation of Carbonate Minerals. Geobiology 2010, 5, 401–411. [Google Scholar] [CrossRef]
  14. Decho, A.W. Overview of biopolymer-induced mineralization: What goes on in biofilms? Ecol. Eng. 2010, 36, 137–144. [Google Scholar] [CrossRef]
  15. Dupraz, C.; Reid, R.P.; Braissant, O.; Decho, A.W.; Norman, R.S.; Visscher, P.T. Processes of carbonate precipitation in modern microbialmats. Earth Sci. Rev. 2009, 96, 141–162. [Google Scholar] [CrossRef]
  16. Vasconcelos, C.; Warthmann, R.; Mckenzie, J.A.; Visscher, P.T.; Bittermann, A.G.; Lith, Y.V. Lithifying microbial mats in Lagoa Vermelha, Brazil: Modern Precambrian relics? Sediment. Geol. 2006, 185, 175–183. [Google Scholar] [CrossRef]
  17. Han, C.; Jiang, Z.; Han, M. The lithofacies and reservoir characteristics of the Upper Ordovician and Lower Silurian black shale in the Southern Sichuan Basin and its periphery, China. Mar. Pet. Geol. 2016, 75, 181–191. [Google Scholar] [CrossRef]
  18. Liu, X.H.; Luo, J.L. Diagenesis and diagenetic facies of gas reservoirs in the Upper Paleozoic 8th member of Shihezi Fm and 2nd member of Shanxi Fm in Yulin-Shenmu area, Ordos basin. Oil Gas Geol. 2006, 2, 010. [Google Scholar]
  19. Pacton, M.; Wacey, D.; Corinaldesi, C.; Tangherlini, M.; Kilburn, M.R.; Gorin, G.E.; Danovaro, R.; Vasconcelos, C. Viruses as new agents of organomineralization in the geological record. Nat. Commun. 2014, 5, 4298. [Google Scholar] [CrossRef] [Green Version]
  20. Perri, E.; Tucker, M.E.; Słowakiewicz, M.; Whitaker, F.; Bowen, L.; Perrotta, I.D. Carbonate and silicate biomineralization in a hypersaline microbial mat (Mesaieed sabkha, Qatar): Roles of bacteria, extracellular polymeric substances and viruses. Sedimentology 2018, 65, 1213–1245. [Google Scholar] [CrossRef]
  21. Planavsky, N.; Reid, R.P.; Lyons, T.W.; Myshrall, K.L.; Visscher, P.T. Formation and diagenesis of modern marine calcified cyanobacteria. Geobiology 2010, 7, 566–576. [Google Scholar] [CrossRef] [PubMed]
  22. Georgelin, T.; Jaber, M.; Lambert, J.F.; Benzerara, K. In vitro synthesis of amorphous Mg-, Ca-, Sr- and Ba-carbonates: What do we learn about intracellular calcification by cyanobacteria? Geochim. Cosmochim. Acta 2015, 161, 36–49. [Google Scholar] [CrossRef]
  23. Han, Z.; Meng, R.; Yan, H.; Zhao, H.; Han, M.; Zhao, Y.; Sun, B.; Sun, Y.; Wang, J.; Zhuang, D. Calcium carbonate precipitation by Synechocystis sp. PCC6803 at different Mg/Ca molar ratios under the laboratory condition. Carbonates Evaporites 2017, 32, 561–575. [Google Scholar] [CrossRef]
  24. Sánchez-Román, M.; Romanek, C.S.; Fernández-Remolar, D.C.; Sánchez-Navas, A.; Mckenzie, J.A.; Pibernat, R.A.; Vasconcelos, C. Aerobic biomineralization of Mg-rich carbonates: Implications for natural environments. Chem. Geol. 2011, 281, 143–150. [Google Scholar] [CrossRef] [Green Version]
  25. Qiu, X.; Wang, H.; Yao, Y.; Duan, Y. High salinity facilitates dolomite precipitation mediated by Haloferax volcanii DS52. Earth Planet. Sci. Lett. 2017, 472, 197–205. [Google Scholar] [CrossRef]
  26. Han, Z.; Li, D.; Zhao, H.; Yan, H.; Li, P. Precipitation of Carbonate Minerals Induced by the Halophilic Chromohalobacter Israelensis under High Salt Concentrations: Implications for Natural Environments. Minerals 2017, 7, 95. [Google Scholar] [CrossRef]
  27. Rivadeneyra, M.A.; Párraga, J.; Delgado, R.; Ramos-Cormenzana, A.; Delgado, G. Biomineralization of carbonates by Halobacillus trueperi in solid and liquid media with different salinities. FEMS Microbiol. Ecol. 2004, 48, 39–46. [Google Scholar] [CrossRef] [Green Version]
  28. Deng, S.; Dong, H.; Lv, G.; Jiang, H.; Yu, B.; Bishop, M.E. Microbial dolomite precipitation using sulfate reducing and halophilic bacteria: Results from Qinghai Lake, Tibetan Plateau, NW China. Chem. Geol. 2010, 278, 151–159. [Google Scholar] [CrossRef]
  29. Han, Z.; Zhao, Y.; Yan, H.; Zhao, H.; Han, M.; Sun, B.; Sun, X.; Hou, F.; Sun, H.; Han, L. Struvite Precipitation Induced by a Novel Sulfate-Reducing Bacterium Acinetobacter calcoaceticus SRB4 Isolated from River Sediment. Geomicrobiol. J. 2015, 32, 868–877. [Google Scholar] [CrossRef]
  30. Bontognali, T.R.R.; Vasconcelos, C.; Warthmann, R.J.; Bernasconi, S.M.; Dupraz, C.; Strohmenger, C.J.; Mckenzie, J.A. Dolomite formation within microbial mats in the coastal sabkha of Abu Dhabi (United Arab Emirates). Sedimentology 2010, 57, 824–844. [Google Scholar] [CrossRef]
  31. Kenward, P.A.; Goldstein, R.H.; González, L.A.; Roberts, J.A. Precipitation of low-temperature dolomite from an anaerobic microbial consortium: The role of methanogenic Archaea. Geobiology 2010, 7, 556–565. [Google Scholar] [CrossRef] [PubMed]
  32. Sánchez-Román, M.; Vasconcelos, C.; Warthmann, R.; Rivadeneyra, M.; Mckenzie, J.A. Microbial Dolomite Precipitation under Aerobic Conditions: Results from Brejo do Espinho Lagoon (Brazil) and Culture Experiments; John Wiley & Sons, Ltd.: Hoboken, NJ, USA, 2012; pp. 167–178. [Google Scholar]
  33. Lv, J.J.; Ma, F.; Li, F.C.; Zhang, C.H.; Chen, J.N. Vaterite induced by Lysinibacillus sp. GW-2 strain and its stability. J. Struct. Biol. 2017, 200, 97–105. [Google Scholar] [CrossRef] [PubMed]
  34. Gonzalezmunoz, M.T.; Rodrigueznavarro, C.; Martinezruiz, F.; Arias, J.M.; Merroun, M.L.; Rodriguezgallego, M. Bacterial biomineralization: New insights from Myxococcus-induced mineral precipitation. Geol. Soc. Lond. Spec. Publ. 2010, 336, 31–50. [Google Scholar] [CrossRef]
  35. Buczynski, C.; Chafetz, H.S. Habit of bacterially induced precipitates of calcium carbonate and the influence of medium viscosity on mineralogy. J. Sediment. Res. 1991, 61, 226–233. [Google Scholar] [CrossRef]
  36. Zhuang, D.; Yan, H.; Tucker, M.E.; Zhao, H.; Han, Z.; Zhao, Y.; Sun, B.; Li, D.; Pan, J.; Zhao, Y. Calcite precipitation induced by Bacillus cereus MRR2 cultured at different Ca2+ concentrations: Further insights into biotic and abiotic calcite. Chem. Geol. 2018, 500, 64–87. [Google Scholar] [CrossRef]
  37. Grasby, S.E. Naturally precipitating vaterite (μ-CaCO3) spheres: Unusual carbonates formed in an extreme environment. Geochim. Cosmochim. Acta 2003, 67, 1659–1666. [Google Scholar] [CrossRef]
  38. Teng, H.H.; Dove, P.M.; Deyoreo, J.J. Reversed calcite morphologies induced by microscopic growth kinetics: Insight into biomineralization. Geochim. Cosmochim. Acta 1999, 63, 2507–2512. [Google Scholar] [CrossRef]
  39. Addadi, L.; Weiner, S. Interactions between Acidic Macromolecules and Structured Crystal Surfaces. Stereochemistry and Biomineralization. Mol. Cryst. 1986, 134, 305–322. [Google Scholar] [CrossRef]
  40. Kalmar, L.; Homola, D.; Varga, G. Structural disorder in proteins brings order to crystal growth in biomineralization. Bone 2012, 51, 528–534. [Google Scholar] [CrossRef]
  41. Marin, F.; Luquet, G. Molluscan biomineralization: The proteinaceous shell constituents of Pinna nobilis L. Mater. Sci. Eng. C 2005, 25, 105–111. [Google Scholar] [CrossRef]
  42. Couradeau, E.; Benzerara, K.; Gérard, E.; Moreira, D.; Bernard, S. An early-branching microbialite cyanobacterium forms intracellular carbonates. Science 2012, 336, 459–462. [Google Scholar] [CrossRef] [PubMed]
  43. Benzerara, K.; Skouripanet, F.; Li, J.; Férard, C.; Gugger, M.; Laurent, T.; Couradeau, E.; Ragon, M.; Cosmidis, J.; Menguy, N. Intracellular Ca-carbonate biomineralization is widespread in cyanobacteria. Proc. Natl. Acad. Sci. USA 2014, 111, 10933–10938. [Google Scholar] [CrossRef] [PubMed] [Green Version]
  44. Chen, Y.; Niu, M.; Yuan, S.; Teng, H. Durable antimicrobial finishing of cellulose with QSA silicone by supercritical adsorption. Appl. Surf. Sci. 2013, 264, 171–175. [Google Scholar] [CrossRef]
  45. Martignier, A.; Pacton, M.; Filella, M.; Jaquet, J.M.; Barja, F.; Pollok, K.; Langenhorst, F.; Lavigne, S. Intracellular amorphous carbonates uncover a new biomineralization process in eukaryotes. Geobiology 2016, 15, 240–253. [Google Scholar] [CrossRef] [PubMed]
  46. Liu, Q.; Zhu, J.; Sun, T.; Zhou, H.; Shao, Q.; Li, G.; Liu, X.; Yin, Y. Porphyrin nanotubes composed of highly ordered molecular arrays prepared by anodic aluminum template method. RSC Adv. 2013, 3, 2765–2769. [Google Scholar] [CrossRef]
  47. Martignier, A.; Filella, M.; Pollok, K.; Melkonian, M.; Bensimon, M.; Barja, F.; Langenhorst, F.; Jaquet, J.M.; Ariztegui, D. Marine and freshwater micropearls: Biomineralization producing strontium-rich amorphous calcium carbonate inclusions is widespread in the genus Tetraselmis (Chlorophyta). Biogeosciences 2018, 15, 6591–6605. [Google Scholar] [CrossRef]
  48. Han, Z.; Zhang, X.; Chi, N.; Han, M.; Woo, J.; Lee, H.S.; Chen, J. Cambrian oncoids and other microbial-related grains on the North China Platform. Carbonates Evaporites 2015, 30, 373–386. [Google Scholar] [CrossRef]
  49. Zhou, S.; Chen, H.; Ding, C.; Niu, H.; Zhang, T.; Wang, N.; Zhang, Q.; Liu, D.; Han, S.; Yu, H. Effectiveness of crystallitic carbon from coal as milling aid and for hydrogen storage during milling with magnesium. Fuel 2013, 109, 68–75. [Google Scholar] [CrossRef]
  50. Zhou, S.; Chen, H.; Ran, W.; Wang, N.; Han, Z.; Zhang, Q.; Zhang, X.; Niu, H.; Yu, H.; Liu, D. Effect of carbon from anthracite coal on decomposition kinetics of magnesium hydride. J. Alloys Compd. 2014, 592, 231–237. [Google Scholar] [CrossRef]
  51. Wang, J.; Xiao, W.; Wang, J.; Lu, J.; Yang, J. Hollow mesoporous silica spheres synthesized with cationic and anionic mixed surfactant as templates. Mater. Lett. 2015, 142, 269–272. [Google Scholar] [CrossRef]
  52. Huang, Y.Q.; Zhao, Q.; Wang, Y.H.; Ge, S.S.; Shao, Q. A New Layered Six-Connected Network Based on Tetranuclear Copper(II) Cores. J. Chem. Crystallogr. 2012, 42, 706–710. [Google Scholar] [CrossRef]
  53. Zhao, B.; Shao, Q.; Hao, L.; Zhang, L.; Liu, Z.; Zhang, B.; Ge, S.; Guo, Z. Yeast-template synthesized Fe-doped cerium oxide hollow microspheres for visible photodegradation of acid orange 7. J. Colloid Interface Sci. 2017, 511, 39–47. [Google Scholar] [CrossRef] [PubMed]
  54. Zhao, H.; Dong, S.; Zhang, Y.; Sun, B.; Zhang, C. Thermogravimetry study of the pyrolytic characteristics and kinetics of macro-algae Macrocystis pyrifera residue. J. Therm. Anal. Calorim. 2013, 111, 1685–1690. [Google Scholar] [CrossRef]
  55. Hu, X.; Cheng, W.; Nie, W.; Shao, Z. Synthesis and characterization of a temperature-sensitive hydrogel based on sodium alginate and N-isopropylacrylamide. Polym. Adv. Technol. 2015, 26, 1340–1345. [Google Scholar] [CrossRef]
  56. Hu, X.; Cheng, W.; Shao, Z. Novel authigenic gas foaming hydrogels for preventing coal spontaneous combustion. e-Polymers 2015, 15, 361–368. [Google Scholar] [CrossRef]
  57. Wu, T.; Shao, Q.; Ge, S.; Bao, L.; Liu, Q. The facile preparation of novel magnetic zirconia composites with the aid of carboxymethyl chitosan and their efficient removal of dye. RSC Adv. 2016, 6, 58020–58027. [Google Scholar] [CrossRef]
  58. Huang, J.; Cao, Y.; Shao, Q.; Peng, X.; Guo, Z. Magnetic Nanocarbon Adsorbents with Enhanced Hexavalent Chromium Removal: Morphology Dependence of Fibrillar vs Particulate Structures. Ind. Eng. Chem. Res. 2017, 56, 10689–10701. [Google Scholar] [CrossRef]
  59. Wu, Z.; Gao, S.; Chen, L.; Jiang, D.; Shao, Q.; Zhang, B.; Zhai, Z.; Wang, C.; Zhao, M.; Ma, Y. Electrically Insulated Epoxy Nanocomposites Reinforced with Synergistic Core–Shell SiO2@MWCNTs and Montmorillonite Bifillers. Macromol. Chem. Phys. 2017, 218, 1700357. [Google Scholar] [CrossRef]
  60. Zhu, W.; Ge, S.; Shao, Q. Adsorption properties of ZrO2 hollow microboxes prepared using CaCO3 cubes as templates. RSC Adv. 2016, 6, 81736–81743. [Google Scholar] [CrossRef]
  61. Zhao, J.; Ge, S.; Liu, L.; Shao, Q.; Mai, X.; Zhao, C.X.; Hao, L.; Wu, T.; Yu, Z.; Guo, Z. Microwave Solvothermal Fabrication of Zirconia Hollow Microspheres with Different Morphologies Using Pollen Templates and Their Dye Adsorption Removal. Ind. Eng. Chem. Res. 2017, 57, 231–241. [Google Scholar] [CrossRef]
  62. Liu, Q.Y.; Jia, Q.Y.; Zhu, J.Q.; Shao, Q.; Fan, J.F.; Wang, D.M.; Yin, Y.S. Highly ordered arrangement of meso-tetrakis (4-aminophenyl) porphyrin in self-assembled nanoaggregates via hydrogen bonding. Chin. Chem. Lett. 2014, 25, 752–756. [Google Scholar] [CrossRef]
  63. Ge, S.; Zhu, W.; Shao, Q. Fabrication and characterization of hollow zirconia microspheres using calcium carbonate as template. Zeitschrift für Physikalische Chemie 2016, 230, 1617–1628. [Google Scholar] [CrossRef]
  64. Liu, X.; Shao, X.Y.; Fang, G.B. Preparation and properties of chemically reduced graphene oxide/copolymer-polyamide nanocomposites. e-Polymers 2017, 17, 3–14. [Google Scholar] [CrossRef]
  65. Tian, J.; Shao, Q.; Dong, X.; Zheng, J.; Pan, D.; Zhang, X.; Cao, H.; Hao, L.; Liu, J.; Mai, X. Bio-template synthesized NiO/C hollow microspheres with enhanced Li-ion battery electrochemical performance. Electrochim. Acta 2018, 261, 236–245. [Google Scholar] [CrossRef]
  66. Ge, S.; Yang, X.; Shao, Q.; Liu, Q.; Wang, T.; Wang, L.; Wang, X. Self-assembled flower-like antimony trioxide microstructures with high infrared reflectance performance. J. Solid State Chem. 2013, 200, 136–142. [Google Scholar] [CrossRef]
  67. Liu, Q.; Zhao, Q.; Li, Y. CdCl2·H2O nanorods oriented parallel on the langmuir film of (Phthalocyaninato) [Tetrakis(4-pyridyl)porphyrinato] cerium complex. CrystEngComm 2012, 14, 1105–1110. [Google Scholar] [CrossRef]
  68. Liu, Q.; Yang, Y.; Hui, L.; Zhu, R.; Qian, S.; Yang, S.; Xu, J. NiO nanoparticles modified with 5,10,15,20-tetrakis(4-carboxyl pheyl)-porphyrin: Promising peroxidase mimetics for H2O2 and glucose detection. Biosens. Bioelectron. 2015, 64, 147–153. [Google Scholar] [CrossRef]
  69. He, M.; Jin, H.; Zhang, L.; Jiang, H.; Yang, T.; Cui, H.; Fossard, F.; Wagner, J.B. Environmental transmission electron microscopy investigations of Pt-Fe2O3 nanoparticles for nucleating carbon nanotubes. Carbon 2016, 110, 243–248. [Google Scholar] [CrossRef]
  70. Zhao, H.; Yan, H.; Zhang, C.; Sun, B.; Zhang, Y.; Dong, S.; Xue, Y.; Qin, S. Thermogravimetry study of pyrolytic characteristics and kinetics of the giant wetland plant Phragmites australis. J. Therm. Anal. Calorim. 2012, 110, 611–617. [Google Scholar] [CrossRef]
  71. Tian, B.; Qiao, Y.Y.; Tian, Y.Y.; Xie, K.C.; Liu, Q.; Zhou, H.F. FTIR study on structural changes of different–rank coals caused by single/multiple extraction with cyclohexanone and NMP/CS 2 mixed solvent. Fuel Process. Technol. 2016, 154, 210–218. [Google Scholar] [CrossRef]
  72. Wang, J.; Chen, D.; Xu, Y. Influence of the crystal texture on Raman spectroscopy of the AlN films prepared by pulse laser deposition. J. Spectrosc. 2012. [Google Scholar] [CrossRef]
  73. Scozzafava, A.; Supuran, C.T. Hydroxyurea is a carbonic anhydrase inhibitor. Bioorg. Med. Chem. 2003, 11, 2241–2246. [Google Scholar] [CrossRef]
  74. Lindskog, S. Structure and mechanism of carbonic anhydrase. Pharmacol. Ther. 1997, 74, 1–20. [Google Scholar] [CrossRef]
  75. Hermann, G.J.; Thatcher, J.W.; Mills, J.P. Mitochondrial fusion in yeast requires the transmembrane GTPase Fzo1p. J. Cell Biol. 1998, 143, 359–373. [Google Scholar] [CrossRef] [PubMed]
  76. Aizenberg, J.; Lambert, G.; Weiner, S.; Addadi, L. Factors involved in the formation of amorphous and crystalline calcium carbonate: A study of an ascidian skeleton. J. Am. Chem. Soc. 2002, 124, 32–39. [Google Scholar] [CrossRef] [PubMed]
  77. Albeck, S.; Addadi, L.; Weiner, S. Regulation of calcite crystal morphology by intracrystalline acidic proteins and glycoproteins. Connect. Tissue Res. 1996, 35, 419–424. [Google Scholar] [CrossRef]
  78. Yan, H.; Han, Z.; Zhao, H. Characterization of calcium deposition induced by Synechocystis sp. PCC6803 in BG11 culture medium. Chin. J. Oceanol. Limnol. 2014, 32, 503–510. [Google Scholar] [CrossRef]
  79. Tourney, J.; Ngwenya, B.T. Bacterial extracellular polymeric substances (EPS) mediate CaCO3 morphology and polymorphism. Chem. Geol. 2009, 262, 138–146. [Google Scholar] [CrossRef]
  80. Wei, J.; Anuradha, S.; Bongkeun, S.; Ward, B.B.; Beveridge, T.J.; Myneni, S.C.B. Elucidation of functional groups on gram-positive and gram-negative bacterial surfaces using infrared spectroscopy. Langmuir 2004, 20, 11433–11442. [Google Scholar] [CrossRef]
  81. Lev, S.; Moreno, H.; Martinez, R.; Canoll, P.; Peles, E.; Musacchio, J.M.; Plowman, G.D. Protein tyrosine kinase PYK2 involved in Ca2+-induced regulation of ion channel and MAP kinase functions. Nature 1995, 376, 737. [Google Scholar] [CrossRef] [PubMed]
  82. Han, Z.; Zhao, Y.; Yan, H. The Characterization of Intracellular and Extracellular Biomineralization Induced by Synechocystis sp. PCC6803 Cultured under Low Mg/Ca Ratios Conditions. Geomicrobiology 2017, 34, 362–373. [Google Scholar] [CrossRef]
  83. Lowenstein, T.K.; Timofeeff, M.N.; Brennan, S.T.; Hardie, L.A.; Demicco, R.V. Oscillations in Phanerozoic seawater chemistry: Evidence from fluid inclusions. Science 2001, 294, 1086–1088. [Google Scholar] [CrossRef] [PubMed]
  84. Ries, J.B. Review: Geological and experimental evidence for secular variation in seawater Mg/Ca (calcite-aragonite seas) and its effects on marine biological calcification. Biogeosciences 2010, 7, 2795–2849. [Google Scholar] [CrossRef]
  85. Ries, J.B.; Anderson, M.A.; Hill, R.T. Seawater Mg/Ca controls polymorph mineralogy of microbial CaCO3: A potential proxy for calcite-aragonite seas in Precambrian time. Geobiology 2008, 6, 106–119. [Google Scholar] [CrossRef] [PubMed]
  86. Xu, J.; Yan, C.; Zhang, F.; Konishi, H.; Xu, H.; Teng, H.H. Testing the cation-hydration effect on the crystallization of Ca-Mg-CO3 systems. Proc. Natl. Acad. Sci. USA 2013, 110, 17750–17755. [Google Scholar] [CrossRef] [PubMed]
  87. Catterall, W.A. Structure and regulation of voltage-gated Ca2+ channels. Annu. Rev. Cell Dev. Biol. 2000, 16, 521–555. [Google Scholar] [CrossRef] [PubMed]
  88. Miedema, H.; Meter-Arkema, A.; Wierenga, J.; Tang, J.; Eisenberg, B.; Nonner, W.; Hektor, H.; Gillespie, D.; Meijberg, W. Permeation Properties of an Engineered Bacterial OmpF Porin Containing the EEEE-Locus of Ca2+ Channels. Biophys. J. 2004, 87, 3137–3147. [Google Scholar] [CrossRef] [PubMed]
  89. Moomaw, A.S.; Maguire, M.E. Cation Selectivity by the CorA Mg2+ Channel Requires a Fully Hydrated Cation. Biochemistry 2010, 49, 5998–6008. [Google Scholar] [CrossRef] [PubMed]
  90. Dudev, T.; Lim, C. Competition among Ca2+, Mg2+, and Na+ for Model Ion Channel Selectivity Filters: Determinants of Ion Selectivity. J. Phys. Chem. B 2012, 116, 10703–10714. [Google Scholar] [CrossRef]
Figure 1. Phylogenetic tree constructed with the neighbor-joining method based on bacterial 16S rDNA sequence alignment.
Minerals 08 00585 g001
Figure 2. B. licheniformis analyzed by microscopy and SEM. (a) The Gram stain in biological microscope view; (b) the morphology in SEM view.
Minerals 08 00585 g002
Figure 3. Ammonia test of B. licheniformis DB1-9 bacteria cultivated for 30 h. (a,b) The control group is the culture medium without bacteria (right); the experimental group is inoculated with bacteria (left). (a) before adding Nessler’s reagent, (b) after adding Nessler’s reagent.
Minerals 08 00585 g003
Figure 4. Physiological and biochemical characteristics of B. licheniformis. (a) The black line represents the cell growth curve (purple symbols); the red line represents the pH value of the experimental group and the black line (black symbols) represents the pH value of the control group; the dark green line represents the pH value based on the concentration of carbonate and bicarbonate ions; the blue line represents the pH value based on the concentration of NH4+; (b) the curve of CA activity; (c) the curve of carbonate and bicarbonate concentration; (d) the curve of NH4+ concentration.
Minerals 08 00585 g004
Figure 5. The amino acid composition of EPS from B. licheniformis.
Minerals 08 00585 g005
Figure 6. XRD analyses of the minerals induced by B. licheniformis. (a) The minerals cultivated for 12 d; (b) the minerals cultivated for 24 days.
Minerals 08 00585 g006
Figure 7. The minerals analyzed by FTIR. (a) Calcite at Mg/Ca molar ratio of 0; (b) calcite and aragonite at Mg/Ca molar ratio of 3; (c) the minerals at Mg/Ca molar ratio of 3 from 1000 to 3200 cm−1; (d) the minerals at Mg/Ca molar ratio of 3 from 1000 to 1800 cm−1.
Minerals 08 00585 g007
Figure 8. SEM and EDS analyses (a5, b5, c5, d5, and e5) of the minerals in the experimental group after 24 days of cultivation. Mg/Ca molar ratio of 0 (a1a4); Mg/Ca molar ratio of 3 (b1b4); Mg/Ca molar ratio of 6 (c1c4); Mg/Ca molar ratio of 9 (d1d4); Mg/Ca molar ratio of 12 (e1e4).
Minerals 08 00585 g008aMinerals 08 00585 g008b
Figure 9. TEM analyses of ultrathin slices of B. licheniformis cultivated for 24 d. The intracellular and extracellular granules are marked with red arrows. Mg/Ca molar ratio of 0 (a1a4): intracellular granules (a1,a2) and extracellular granules (a3,a4); Mg/Ca molar ratio of 3 (b1b4): intracellular granules (b1b3) and extracellular granules (b4); Mg/Ca molar ratio of 6 (c1c4): intracellular granules (c1,c2) and extracellular granules (c3,c4); Mg/Ca molar ratio of 9 (d1d4): intracellular granules (d1,d2) and extracellular granules (d3,d4); Mg/Ca molar ratio of 12 (e1e4): intracellular granules (e1,e2) and extracellular granules (e3,e4).
Minerals 08 00585 g009aMinerals 08 00585 g009b
Figure 10. The dark clumps composed of alternating light and dark bands within the EPS of B. licheniformis analyzed by HRTEM and SAED. (ac) images of the dark clumps analyzed by HRTEM, (d) SAED image of the dark clump marked by the yellow circle in (a).
Minerals 08 00585 g010
Figure 11. Analyses of intracellular and extracellular dark granular areas by HRTEM-SAED. HRTEM images of extracellular dark granular areas (ac), SAED images of the area marked with the red square (a1,b1,c1). HRTEM images of intracellular dark granular areas (a2,b2,c2), SAED images of the area marked with the red square (a3,b3,c3). (a1,b1,c1) show bright diffraction spots; (a3,b3,c3) have no bright spots.
Minerals 08 00585 g011
Figure 12. The morphology of B. licheniformis and elemental composition analyzed by STEM. (a,b) Mg/Ca molar ratio of 0; (c,d) Mg/Ca molar ratio of 3; (e,f,g) Mg/Ca molar ratio of 12.
Minerals 08 00585 g012
Figure 13. The fluorescence intensity of intracellular Ca2+ ions at different Mg/Ca molar ratios.
Minerals 08 00585 g013
Table 1. pH values based on the concentrations of bicarbonate and carbonate ions.
Time (h)CO32− (mol/L)HCO3 (mol/L)Na2CO3 (g/L)NaHO3 (g/L)pH
000.028001.70808.68 ± 0.0033
4.500.026801.74468.56 ± 0.0032
16.500.028801.75688.64 ± 0.0001
22.500.034402.09848.66 ± 0.0033
28.500.038602.35468.64 ± 0.0030
40.500.040602.47668.66 ± 0.0031
46.500.040902.49498.62 ± 0.0033
5300.041102.50718.62 ± 0.0035
65.500.043002.62308.61 ± 0.0057
70.500.044502.71458.63 ± 0.0032
76.500.045602.78168.64 ± 0.0036
8900.047602.90368.62 ± 0.0008
9500.048602.96468.61 ± 0.0034
10100.049002.98908.62 ± 0.0058
1250.01050.04280.63002.61089.58 ± 0.0059
1430.01180.04010.70802.44619.61 ± 0.0062
1730.01520.03740.91202.28149.79 ± 0.0037
1970.01710.03651.02602.22659.77 ± 0.0033

