1. Introduction
The Earth’s mantle is divided into an upper and a lower part, separated by a transition zone (TZ) at a depth of between 520 km and 670 km. The TZ is characterized by phase transitions between polymorphs of olivine: wadsleyite and ringwoodite. The viscosity of the TZ is still a matter of debate. Some studies propose that it represents a weak layer [
1,
2] although slab stagnation may suggest the opposite [
3]. A way of answering this question is to determine experimentally the rheology of the key phases of the TZ: wadsleyite and ringwoodite. Such experiments are very challenging, due to the P, T conditions which prevail in the TZ; however, recent technological developments have made such experiments possible. Two apparatuses can presently perform deformation experiments in the P, T condition of the TZ: the rotational Drickamer apparatus [
4], and the D-DIA apparatus [
5]. Using these devices, several studies have addressed the rheology of wadsleyite (e.g., [
6,
7]) and ringwoodite [
8,
9], including the one describing the sample investigated here [
10]. In these experiments, rheological data are obtained by coupling deformation apparatuses with synchrotron X-ray beams. The total plastic strain is usually inferred from X-ray radiography, whereas stress is deduced from lattice strain measurements from Bragg peaks displacements. The limited availability of synchrotron beamline access represents a strong limitation associated with such investigations. In the present study, we investigate an alternative approach based on the investigation and post-mortem, by transmission electron microscopy (TEM), of samples deformed at high-pressure. Not being performed in situ, our approach cannot be seen as a substitute for synchrotron studies (for instance, in giving access to stress-strain relationships). It can, however, complement in situ experiments and allow exploiting high-pressure deformation experiments to be performed off-line.
Deformed crystals contain defect microstructures which represent a valuable source of information about their mechanical properties. In this study, these defects and dislocations will not be characterized individually (as is commonly done at the TEM; see for instance a preliminary study of this sample in [
10]). Dislocations introduce a long-range strain field in their surrounding materials. Each dislocation gives rise to a small increment of misorientation. This effect has been known and used for a long time, since undulatory extinction represents a common criterion for intragranular plasticity without recovery in optical microscopy. With the advent of automated orientation mapping by electron backscatter diffraction (EBSD) in the scanning electron microscope (SEM), the measurement of intragranular misorientation has been used as a proxy for plastic strain [
11,
12], with applications for severely deformed materials [
13,
14]. Such measurements are now possible in the TEM with a very high spatial resolution, and we have demonstrated recently the capability of the technique in providing information about deformation mechanisms in a bridgmanite and ferropericlase aggregate deformed at high-pressure and high-temperature [
14].
Here we apply a technique called scanning precession electron diffraction (SPED) to the characterization of a sample deformed at 17.3 GPa and 1700 K, which contains both wadsleyite and ringwoodite. This sample represents a unique opportunity to gain information on the relative strength of the two phases, since they bore exactly the same deformation conditions.
2. Materials and Methods
2.1. Sample M1219: Synthesis and Deformation
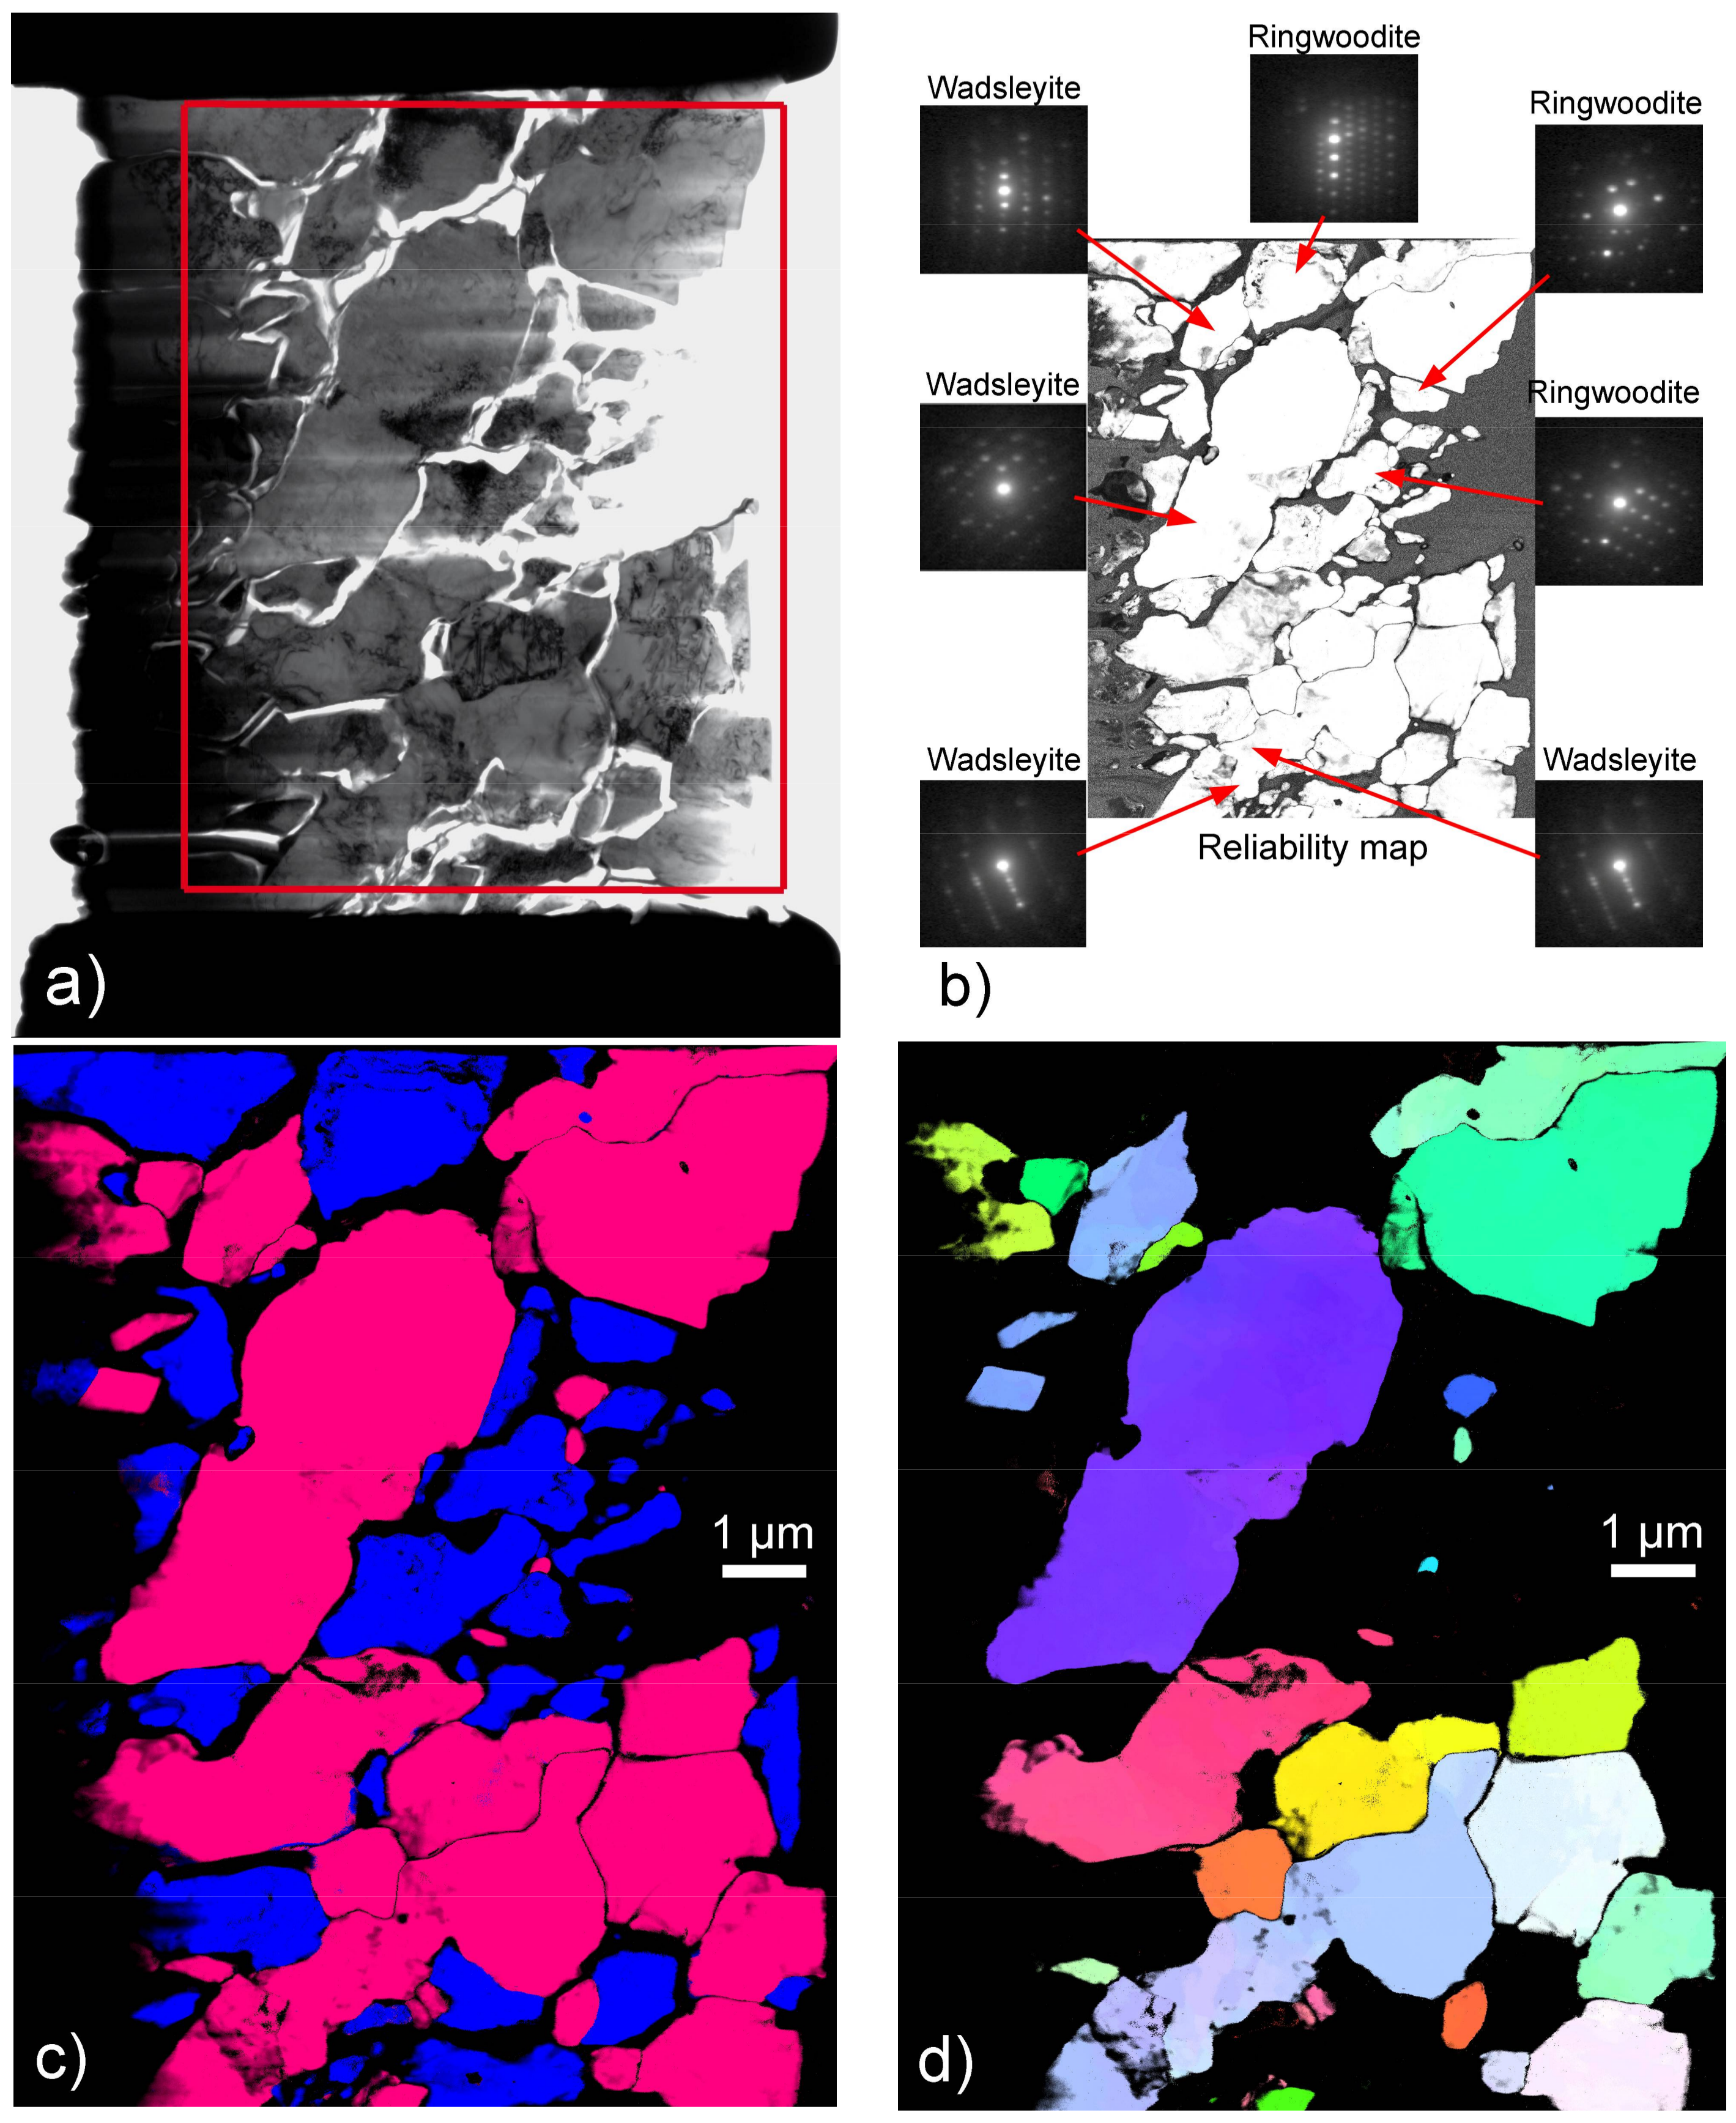
Deformation of the sample characterized in this study (reference M1219) has been described in [
10]. The main information is summarized here. Polycrystalline ringwoodite was synthesized from an olivine (San Carlos origin with composition (Mg
0.9Fe
0.1)
2SiO
4) aggregate while increasing temperature to 1700 K at ~17–18 GPa in the D-DIA apparatus at the BL04B1 beamline of SPring-8. The sample was axially deformed with stress-strain measurements by X-ray diffraction and radiography respectively. Ringwoodite partially transformed to wadsleyite after a strain of 14.8% during deformation at 17.3 GPa and 1700 K. The wadsleyite + ringwoodite aggregate was further deformed to a strain of 24.9%. Stresses of coexisting wadsleyite and ringwoodite were not determined because X-ray diffraction peaks of ringwoodite (e.g., 220, 311 and 400) overlaps with those of wadsleyite (e.g., 040 + 200, 141 and 240), due to similarity between their crystal structures.
2.2. TEM Characterization
For the TEM investigation, sample foils were cut from the deformed samples using a dual beam focused ion (FIB) milling machine with Ga ion and electron beams (FEI (Hillsboro, OR, USA), Scios at the Bayerisches Geoinstitut, Bayreuth, Germany). TEM investigations were performed at the University of Lille with a FEI® Tecnaï G220Twin microscope (FEI, Hillsboro, OR, USA), operating at 200 kV, and with a Philips CM30 microscope operating (now FEI, Hillsboro, OR, USA) at 300 kV; both were equipped with a LaB6 filament and were using a double tilt sample-holder.
Orientation maps were acquired with a step size of 5 nm, using SPED in the TEM with the ASTAR™ tool from NanoMEGAS (Forest, Belgium) [
15]. The TEM is set in micro-beam mode (spot size 4 nm), and the incident electron beam, which is focused on the sample, is scanned over the area thanks to a dedicated hardware control system composed of TEM deflecting coils. In this mode, where the sample is illuminated by a convergent beam, the diffraction pattern consists of discs. Using the smallest condenser aperture (50 µm) the diffraction patterns are made of very small, spot-like discs, and can be indexed as spot patterns. The individual exposure time at each location is 10 ms. In this study, we used precession illumination (with a precession angle of 0.5°) in the TEM, which allows many more reflections to be seen in the diffraction pattern with intensities closer to the kinematical diffraction conditions. Diffraction patterns are collected with an external Stingray CCD camera (Allied Vision Technologies GmbH, Stadtroda, Germany) that points on the TEM phosphorous screen, and stored in the computer memory for further indexation and post processing. The diffraction patterns were collected as 144 × 144 pixel images, at a camera length of 89 mm. In the ASTAR system, electron diffraction spot patterns are indexed (providing the local crystal orientations) by comparing individually obtained patterns via cross-correlation matching techniques with pre-calculated electron diffraction templates generated every 0.5° (orientation resolution). For wadsleyite and ringwoodite, templates have been generated from the crystallographic data of Horiuchi and Sawamoto [
16] and Hazen et al. [
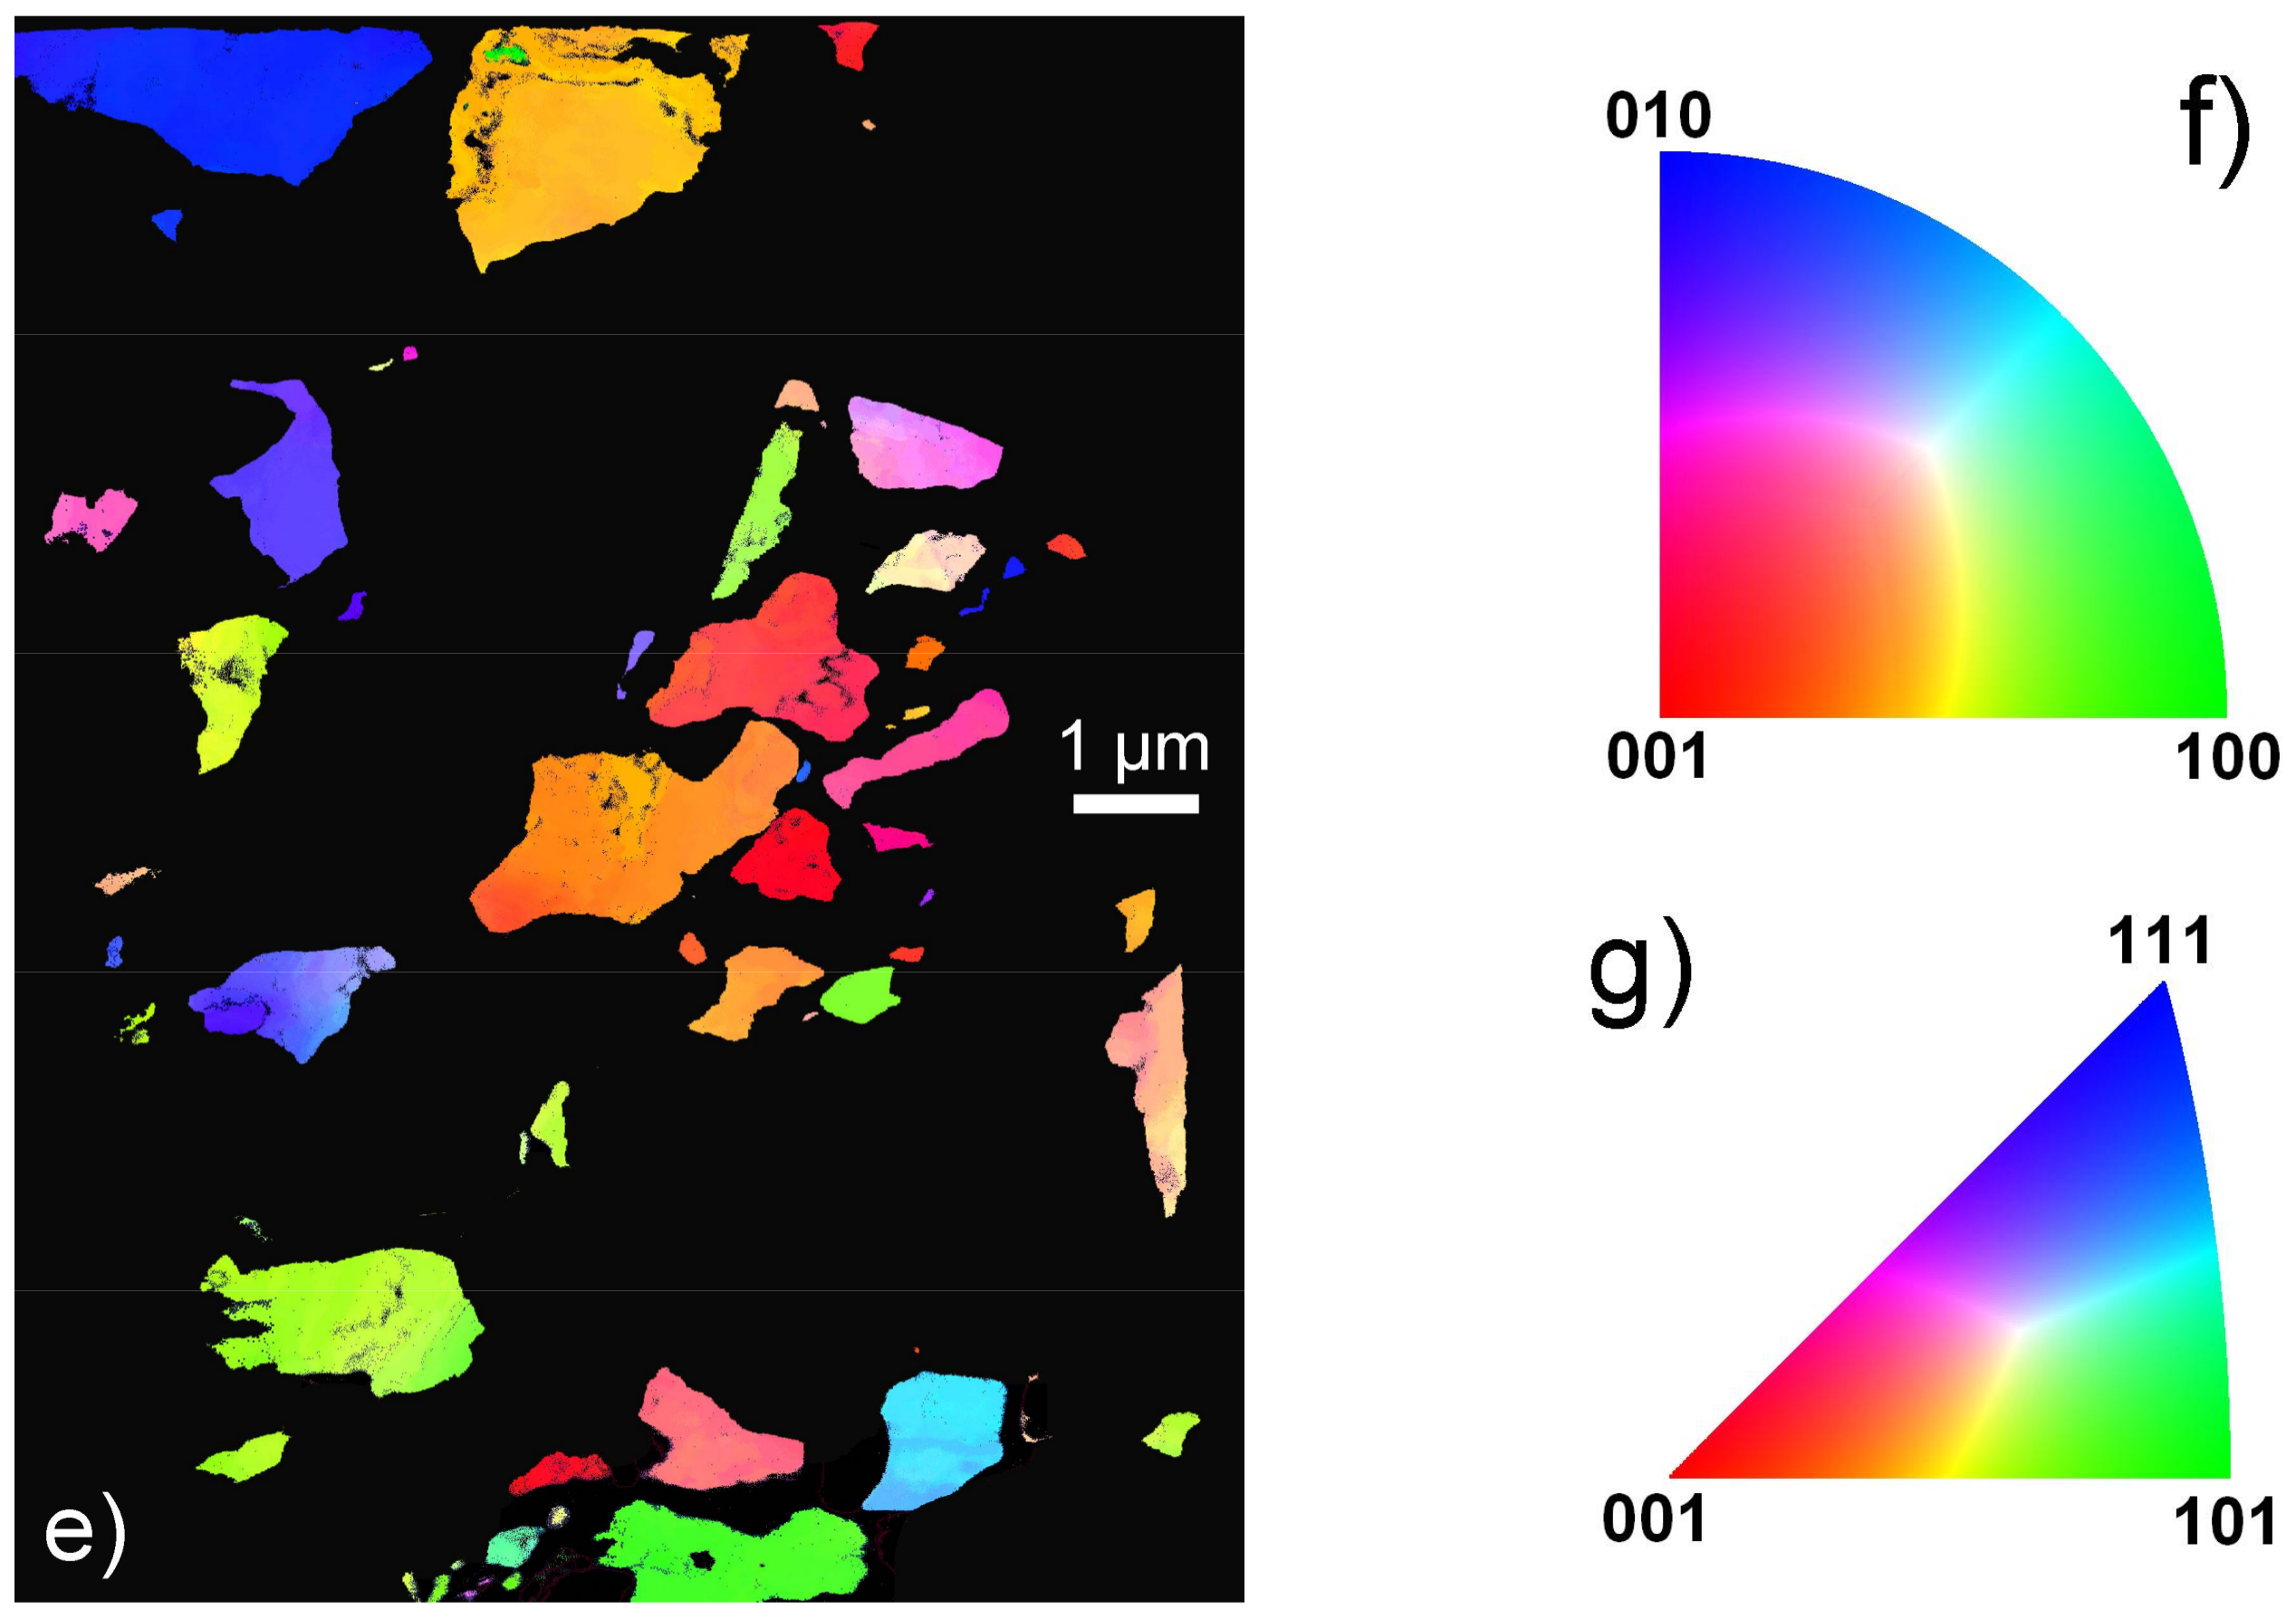
17] respectively. From this indexation, one obtains an orientation map which displays, with a color coding, the most probable orientation at each scanned beam position.
The quality of indexation from template matching is quantified by the image correlation index, which is calculated for every template [
18]:
In this expression, the diffraction pattern is represented by the intensity function
, and every template
i is described by the function
. The highest
Q value corresponds to the solution retained. The reliability of this solution can be quantified by the ratio of the matching indexes for the two best solutions
Q1 and
Q2:
In reliability maps, the brighter the pixel, the more reliable the indexation proposed is. On the contrary, the darker the pixel, the less the solution is reliable. This is typically the case at grain boundaries where two solutions of co-existing grains overlap, or when for various reasons, the quality of the diffraction patterns is diminished.
In this study we use orientation maps to calculate local misorientations, as recently developed in the EBSD community (e.g., [
19]). Post-processing of the orientation maps was performed using HKL Channel 5 software (Oxford Instruments, Abingdon-on-Thames, UK). As commonly used in EBSD, several quantities are calculated from the orientation maps:
The Kernel Average Misorientation (KAM) calculates the average misorientation between a pixel and its neighbors, provided that the misorientation does not exceed a predefined threshold value, e.g., 5°; thus, the incorporation of well-defined grain boundaries is avoided. If plastic deformation results from dislocation glide and crystal lattice rotation, this approach allows quantitative evaluation of the local plastic strain gradients [
20]. A kernel is a set of points of prescribed size surrounding the scan point of interest. The size of the kernel is generally prescribed to the
nth nearest-neighbors. Hence this parameter is sensitive to the step size of the measurement grid.
The Grain Orientation Spread (GOS) is the average deviation in orientation between each point in a grain and the average orientation of the grain. This approach leads to assigning the same value of the GOS to every scan point contained within a grain. The minimum area grain size is set to 100 pixels (ca. 50 nm in diameter assuming quasi-spherical grains), and the grain tolerance angle is set to 15°.
The Grain Reference Orientation Deviation (GROD) is based on the misorientation between a reference point of that grain and the other points. The reference point can be the mean misorientation of the grain or the point of the grain where the KAM is the lowest.
KAM, GROD and GOS approaches are complementary. GROD maps show the orientation field referenced to a fixed point, whereas KAM shows the magnitude of the gradient, which can be seen as the first derivative of the orientation field.
4. Discussion
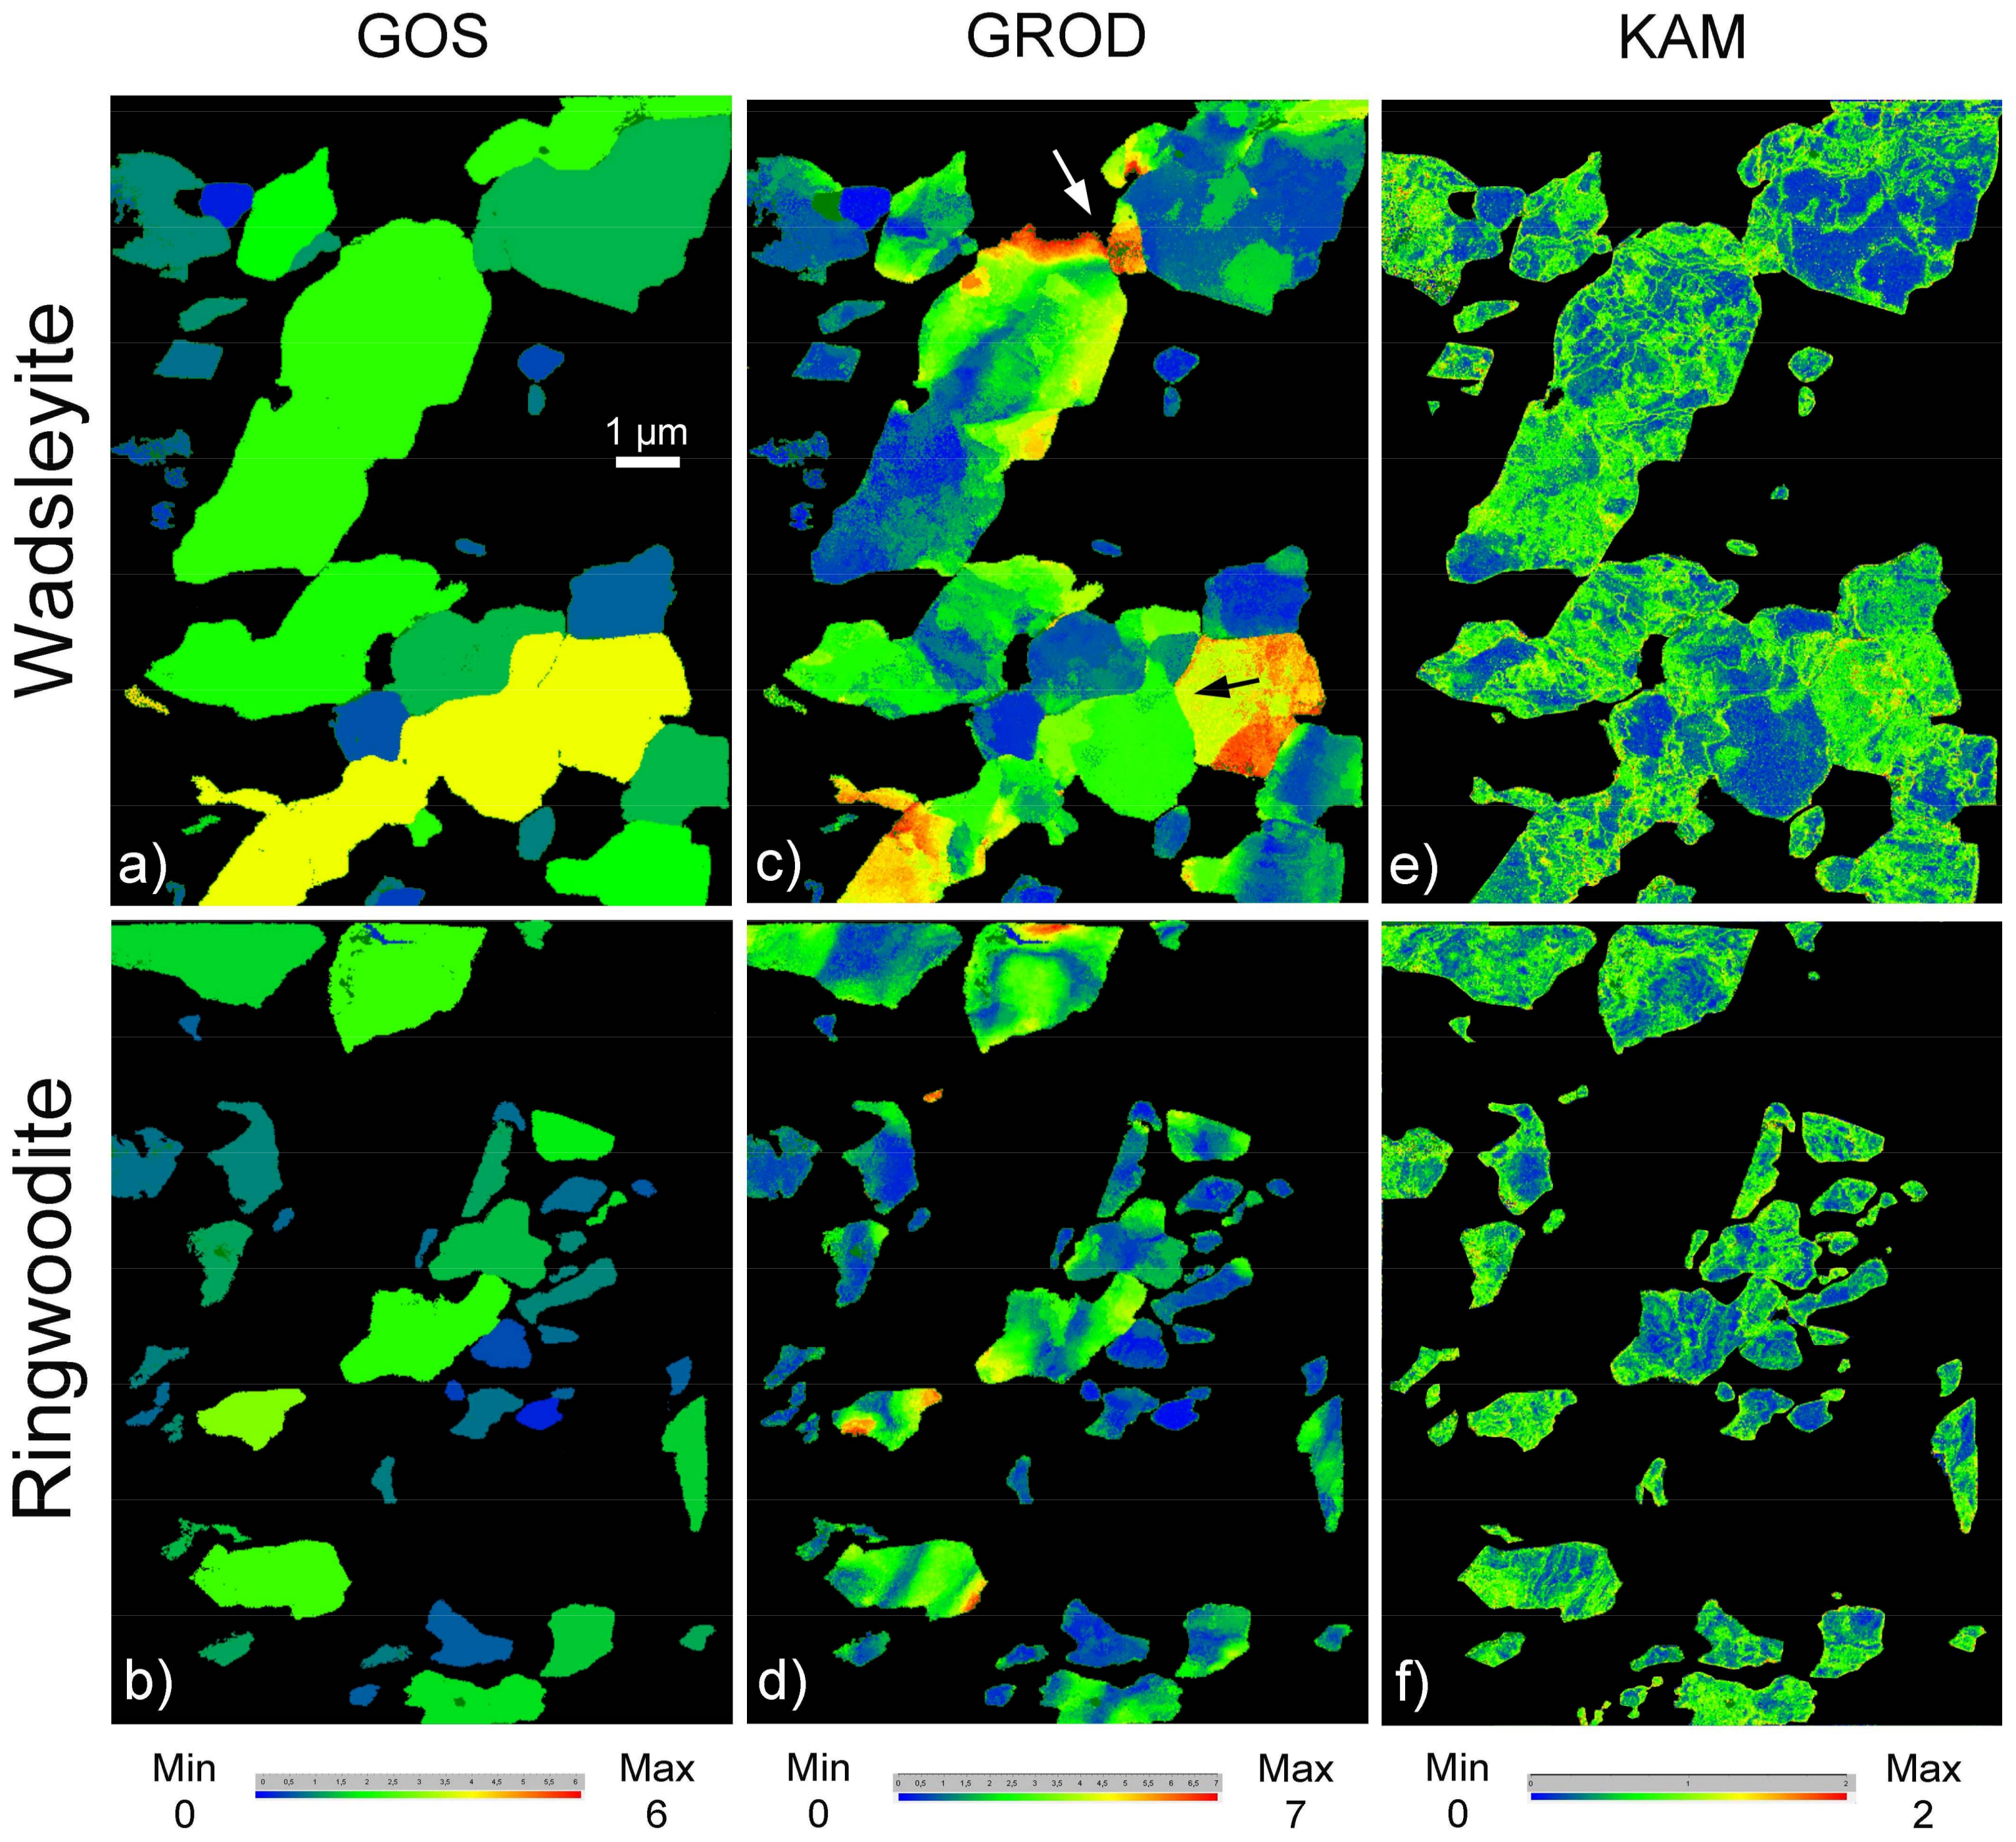
To emphasize the intragranular misorientations, we applied several post-treatments of the IPF maps which are displayed in
Figure 2.
Figure 2a,b show the grain orientation spreadings (GOS) of wadsleyite and ringwoodite respectively. This representation gives each grain a uniform color describing the range of misorientation within the grain. One can readily see that almost all grains exhibit significant intragranular misorientations resulting from plastic deformation. It is, however, difficult to exploit this data to compare grains with different sizes, since the GOS is intrinsically grain size dependent. The GROD (
Figure 2c,d) allows us to visualize how intragranular misorientations organize themselves spatially within the grains. It represents a potential means to study how plasticity transfers from one grain to another in response to grain to grain interactions (see for instance [
21] for a theoretical description of such heterogeneities resulting from plastic strain): see as illustration the strain concentration in-between the two large wadsleyite grains on top of
Figure 2c (white arrow). It also gives interesting clues about the processes taking place in the materials. For instance, one can see in
Figure 2c a curved boundary separating two parts of a grain of wadsleyite (black arrowed on
Figure 2c) which exhibit a misorientation of 6°; this is a subgrain boundary (SGB). It is striking that, across the SGB, very distinct GROD values are observed. The part on the left is almost free of dislocations (see
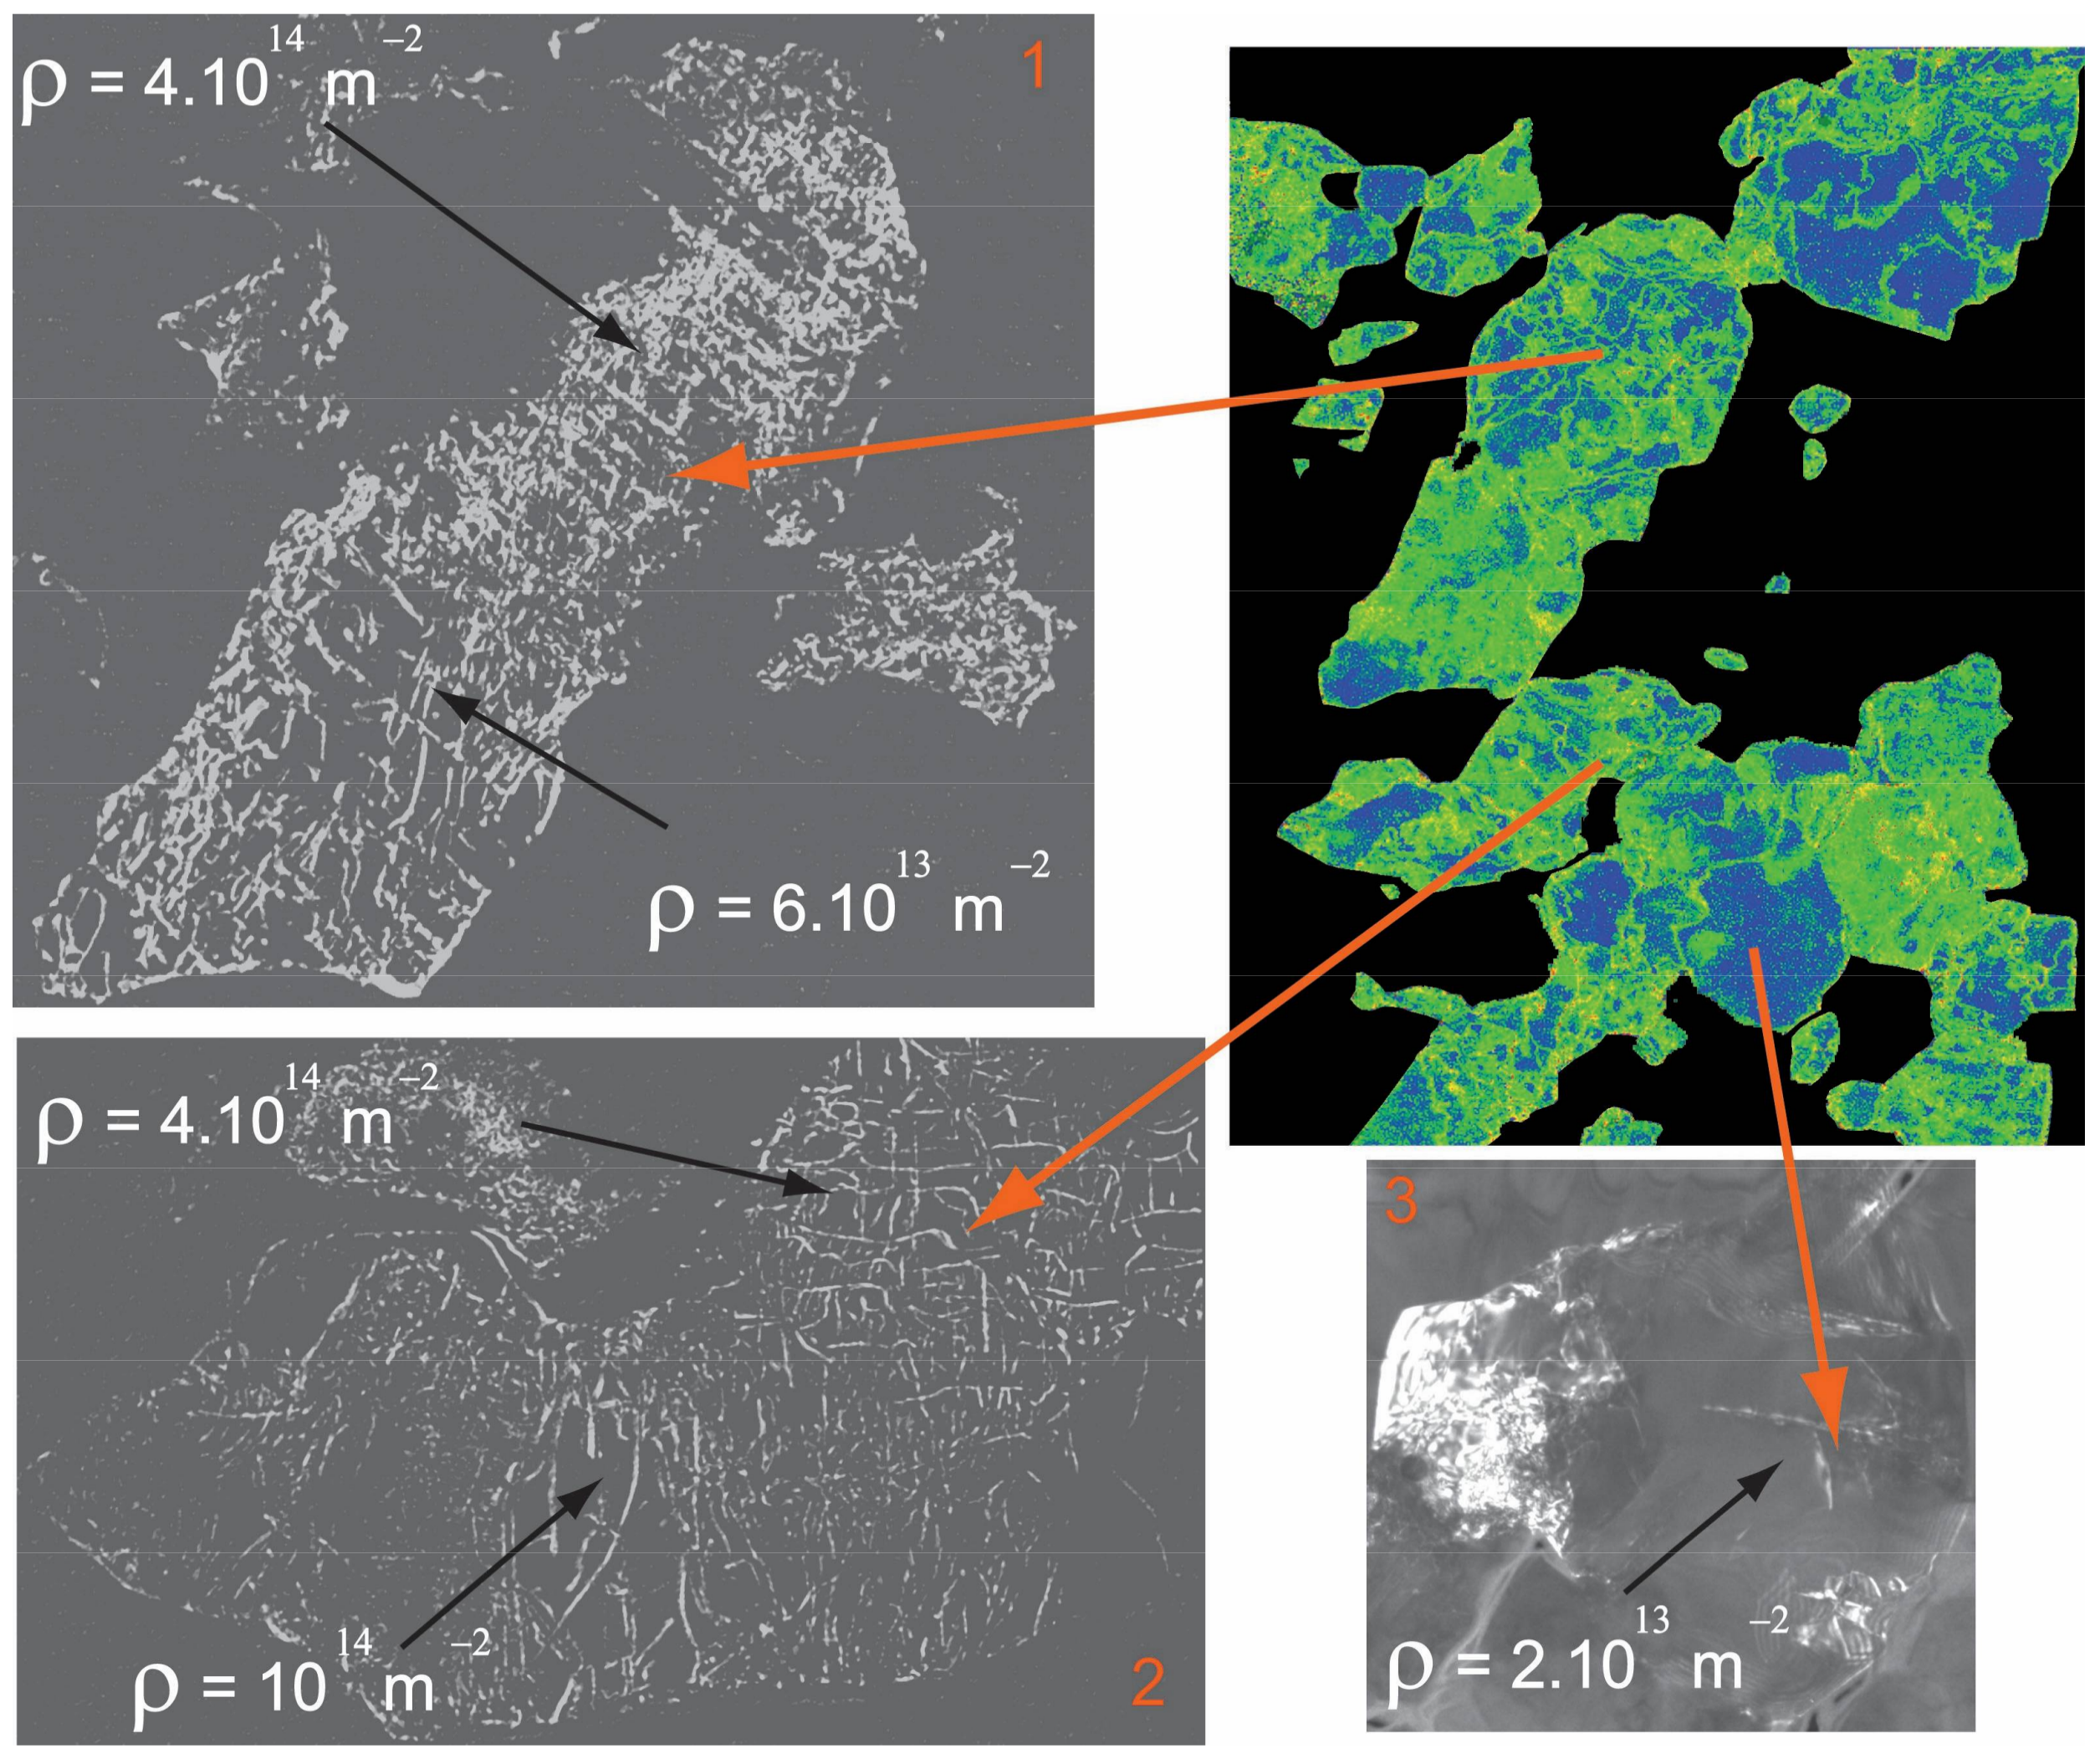
Figure 3, where this part has been imaged by weak-beam dark-field), whereas the part on the right exhibits a high amount of internal misorientation, as shown by the GROD. This grain is thus experiencing recovery by SGB migration, driven by the difference of stored elastic energy well highlighted by the GROD. Indeed, the center of curvature of the SGB (which gives the sense of motion) is located in the part characterized by highest GROD.
In EBSD, the angular resolution is such that accurate measurements of geometrically necessary dislocation (GNDs) densities are now possible [
23,
24]. So far, applications have been mostly shown to apply to metals after severe deformation. The situation is not so favorable in SPED. The actual quantitative determination of dislocation density is indeed facing the angular resolution of SPED which, in a standard mode, is lower than in EBSD. Ghamarian et al. [
13] discuss this issue and report that the minimum resolvable GND density relates to the angular resolution and to the step size:
With an angular resolution of 0.5° and our step size (5 nm), the minimum dislocation density resolvable would be in the order of 3 × 10
15 m
−2 (in wadsleyite, which is under examination here, the Burgers vectors lengths are 0.569 nm for [100] dislocations and 0.761 nm for
dislocations). We have conducted conventional weak-beam dark-field investigations of some grains of wadsleyite. The results are presented in
Figure 3. The dislocation densities measured are in the order of 10
14 m
−2, i.e., slightly below the threshold found from Equation (3). It is also worthy of mention that such measurements face the somehow artificial (or at least experimentally constrained) distinction between geometrically necessary dislocations (GNDs) and statistically stored dislocations (SSDs). In SPED, the spatial resolution is close overcoming this limitation, as shown recently by Rottmann and Hemker [
25], who demonstrated that strains from individual dislocations could be mapped. Here, we decide to stay at the level of the KAM mapping. Rollett et al. [
26] have shown that local gradients in orientation revealed by the KAM correlate well with plastic strain heterogeneities modeled in the framework of crystal plasticity theory.
Figure 3 shows that if the correlation between KAM maps and images of dislocations patterns is not sufficient to resolve individual dislocations and provide reliable quantitative measurements, the agreement is fair. Note that the KAM map (
Figure 2e) also shows the plastic strain gradient driving the mobility of the SGB discussed above. We propose that the KAM represents a proxy of plastic strain which can be used to compare strains in different grains. In a previous study performed on an aggregate of bridgmanite and ferropericlase [
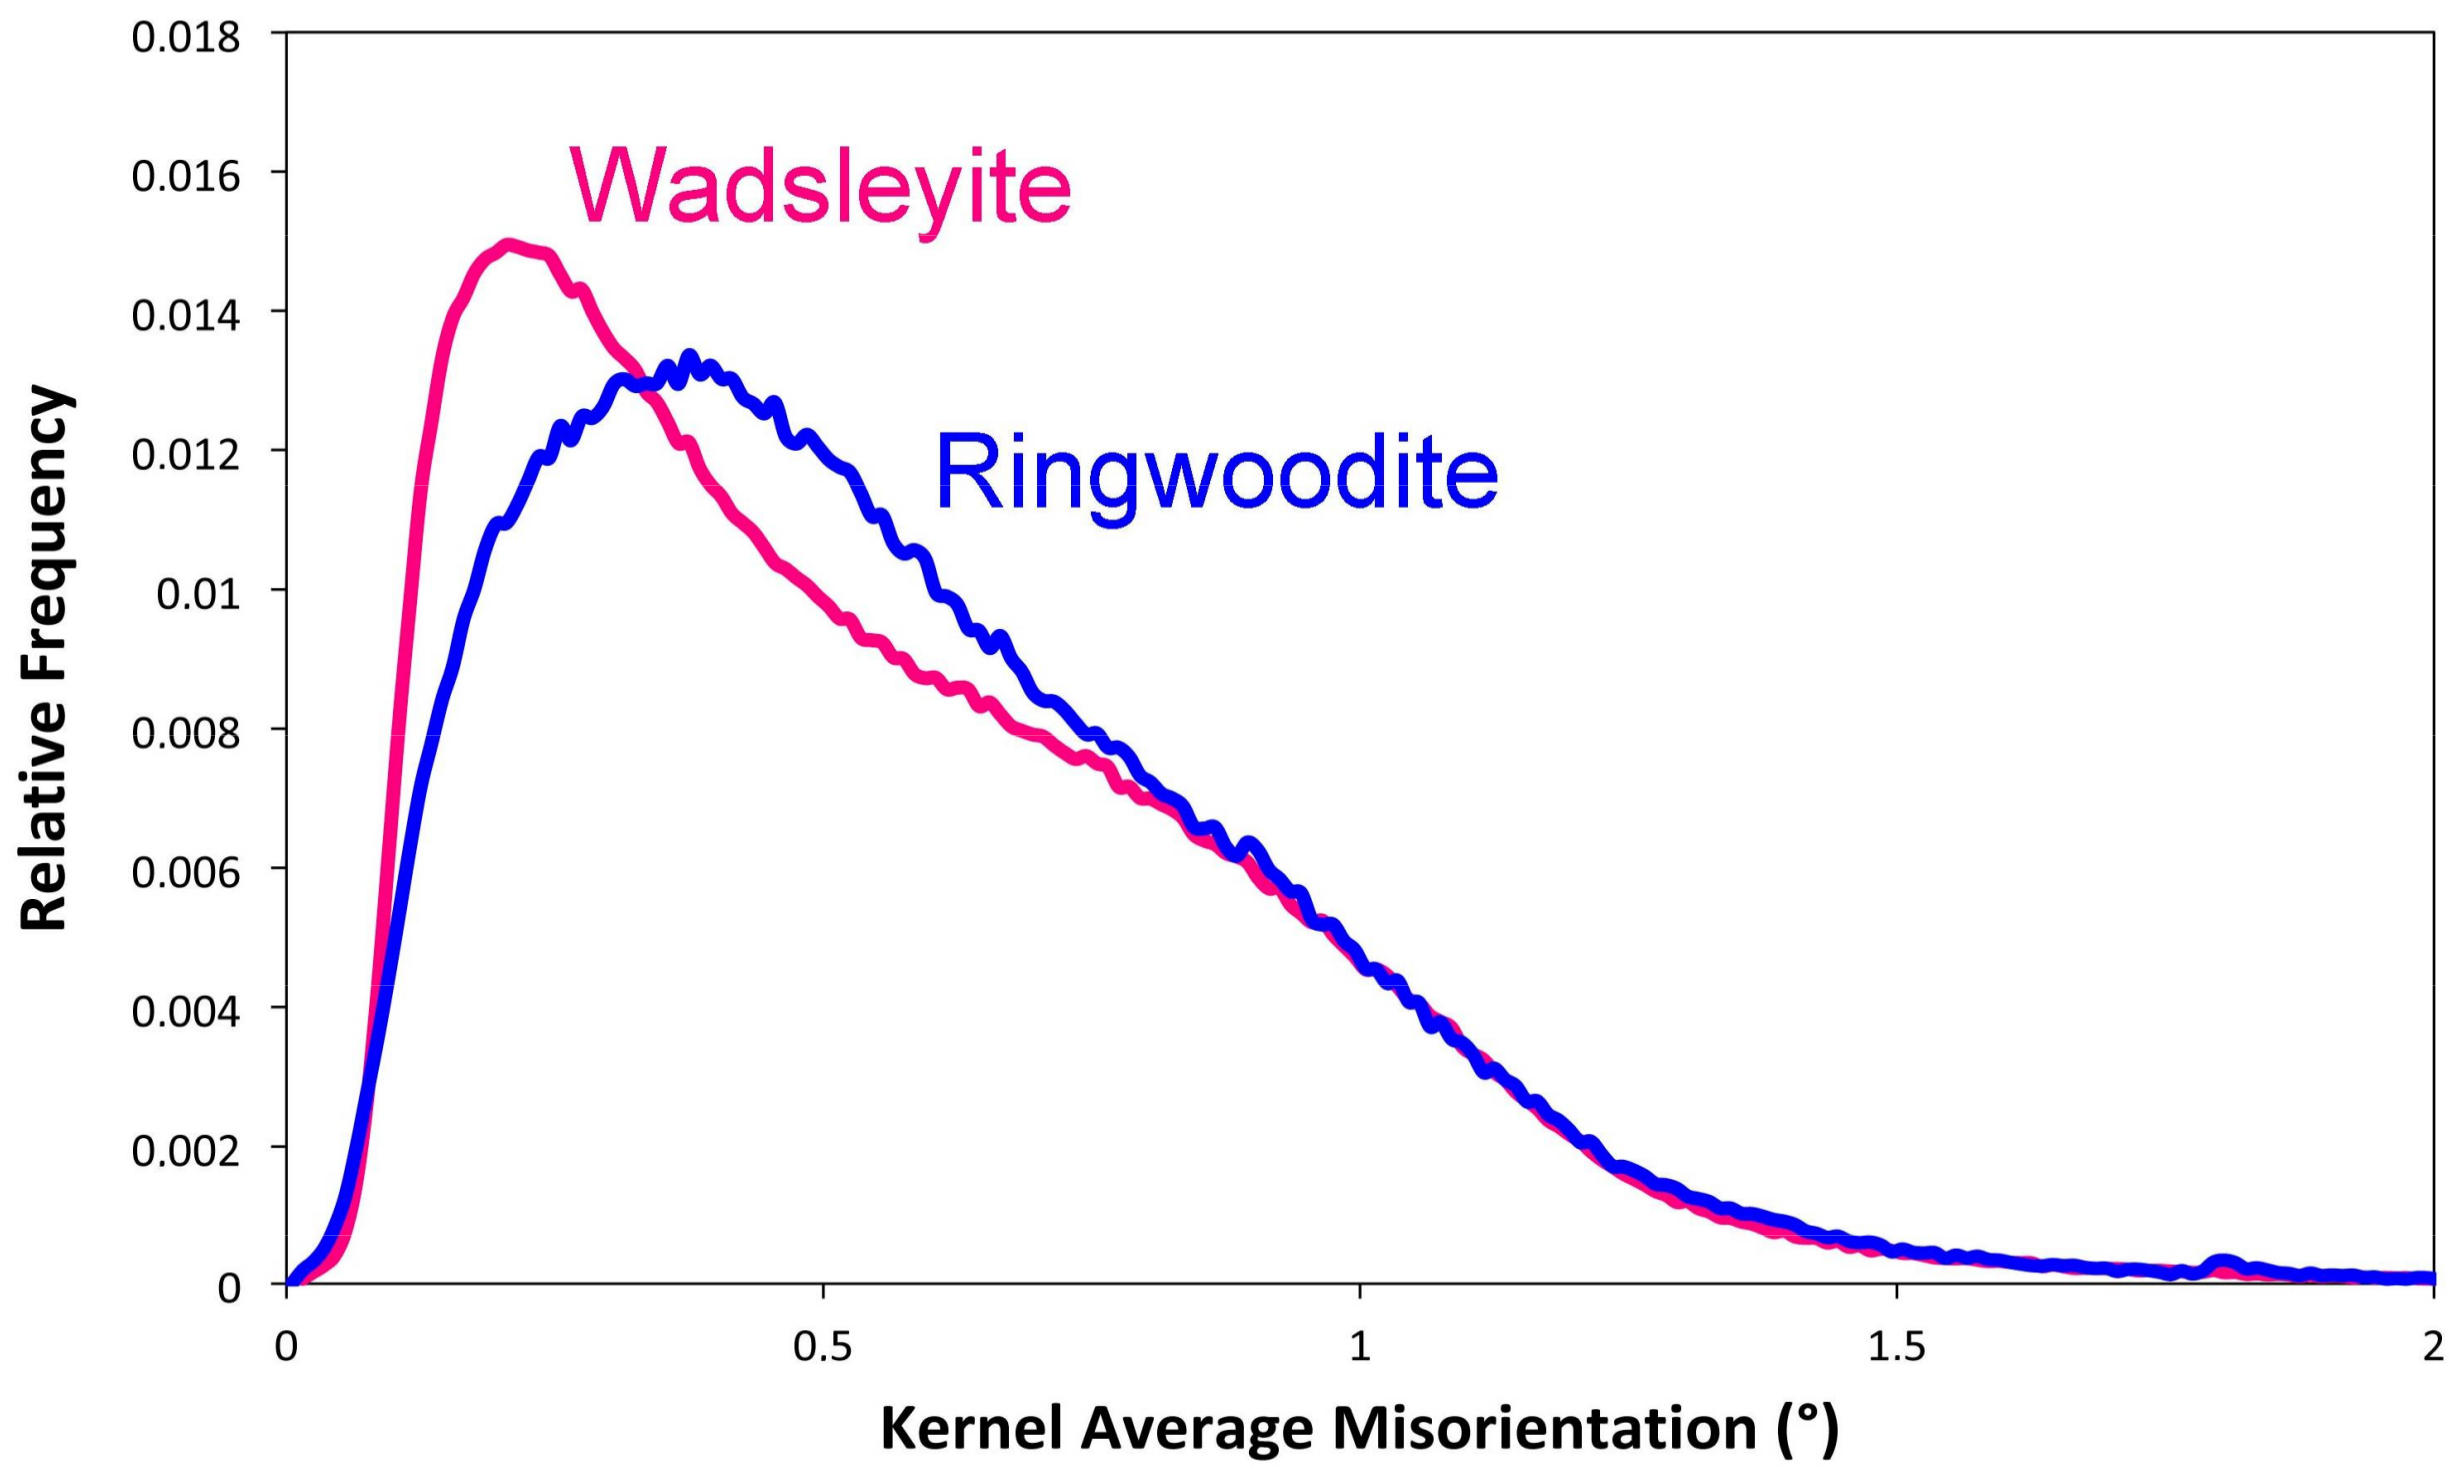
14], we avoided making such comparisons, since the two phases were undergoing very different deformation mechanisms (dense shear lamellae for bridgmanite, and homogeneous dislocation glide for ferropericlase). Here, wadsleyite and ringwoodite both deform by dislocation glide, and exhibit very comparable dislocation microstructures. Their Burgers vectors also present comparable lengths, which should not induce any differential bias in the detection (Equation (1)). The results are presented in
Figure 4. Beyond 0.8°, the KAM distributions are similar for both phases. For lower misorientations, the curves are slightly different with those of ringwoodite, exhibiting a log-normal profile (whereas the wadsleyite shows a distinct peak at 0.2°).
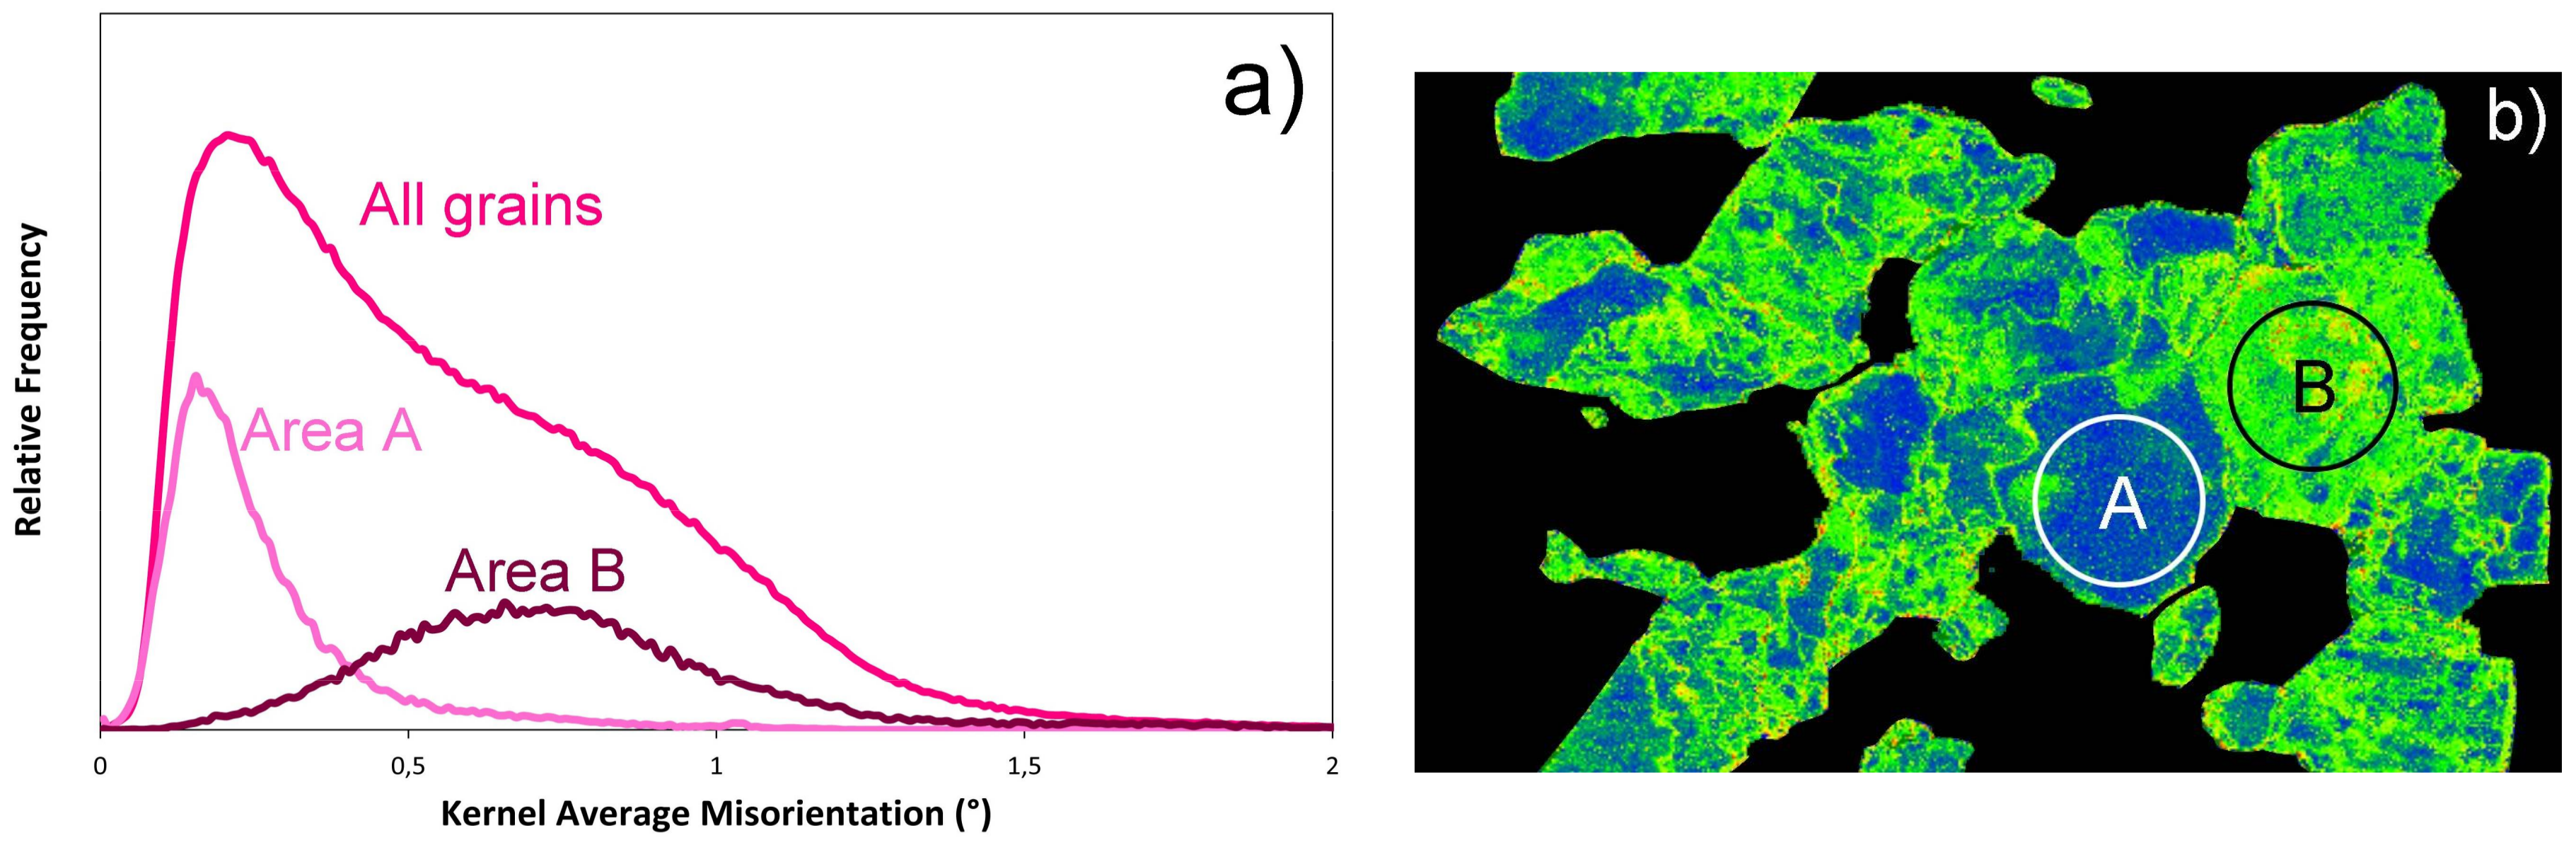
The difference between the two minerals is illustrated in
Figure 5. In
Figure 5a, we show the KAM distributions samples in two regions located on both sides of the SGB already mentioned. The KAM distributions of those two regions reproduce the peaks of the global distribution. We propose that the peculiar shape of the KAM distribution of wadsleyite reflects activation of recovery driven by SGB migration. Apparently, this mechanism is not activated in ringwoodite. One might not exclude the possibility that the difference in behavior is related to the smaller grain size of ringwoodite grains. However, we raise the possibility that this is due to the fact that ringwoodite, being cubic, activates many slip systems with non-perpendicular Burgers vectors, which give rise to profuse interactions (junctions), leading to a dislocation storage which is less favorable to the formation and migration of SGBs.
5. Conclusions
As previously shown with bridgmanite and ferropericlase [
14], we present here a new demonstration that SPED is well adapted to the study of plastic deformation of mantle phases deformed at high-pressure and high-temperature. This is made possible thanks to the short acquisition time at each probe location which preserves beam-sensitive phases. The spot patterns of SPED are also very robust against highly deformed materials, and the technique is well suited to characterize highly deformed phases with dislocation densities which become challenging for standard weak-beam dark-field characterizations. Hence, we suggest that SPED represents an interesting means of studying samples deformed at high-pressure, even without coupling with a synchrotron beamline. Considering the limited availability of synchrotron access, this might open interesting perspectives for high-pressure deformation facilities. Moreover, we show here that even for studies carried out at the synchrotron, SPED can provide complementary information.
In the present case, where the plastic behavior of wadsleyite and ringwoodite at 17.3 GPa, 1700 K was studied, we find no significant contrast in the plastic response of both phases, except that recovery by subgrain boundary migration seems to be more easily activated in wadsleyite.

 ,
, 


