Recovery of Phosphate Minerals from Plant Tailings Using Direct Froth Flotation

Department of Mining & Nuclear Engineering, Missouri University of Science and Technology, Rolla, MO 65409, USA
*
Author to whom correspondence should be addressed.
Minerals 2017, 7(8), 145; https://doi.org/10.3390/min7080145
Submission received: 13 June 2017
/
Revised: 2 August 2017
/
Accepted: 9 August 2017
/
Published: 12 August 2017
Abstract
:Wastes produced from the phosphate industry presents many challenges due to the high economic and environmental impacts involved with their disposal. However, the relative scarcity of high-grade phosphate ores has driven researchers to recover and recycle these valuable wastes (secondary sources). The goal of this study was to investigate the possibility of upgrading the P2O5 content in tailings produced from a phosphorous production plant using direct froth flotation. Characterization assays, including X-ray diffraction (XRD), scanning electron microscopy (SEM), X-ray fluorescence (XRF), and mineral liberation analysis (MLA), were first conducted to identify the mineralogical and morphological characteristics of tailings samples and grain properties to better understand the behavior of the flotation feed. Flotation experiments were conducted using Denver D-12 in a 1-L flotation cell in the presence of sodium silicate (dispersant) and sodium oleate (collector). Several parameters, such as the solids content of the flotation pulp, pulp pH and flotation time, were investigated to optimize the recovery and grade of the concentrate products. Results obtained from this study indicated that the P2O5 content in plant tailings could be upgraded from 21.57% to 28.4% at >73% recovery.
1. Introduction
Phosphorous is an essential element that occurs at 1000–1300 ppm in the earth crust. Phosphorus is used in many applications, such as in the production of fertilizers, detergents, and pharmaceuticals and in other industrial processes [1,2]. Due to its high reactivity, phosphorus does not exist by itself in nature. Phosphorus is typically present as phosphates, i.e., inorganic salts of phosphoric acid. In general, the grade of phosphate ores is expressed as phosphorus pentoxide (P2O5), which is a major precursor for the production of phosphorous-based fertilizers. For economic production, the grade of P2O5 in the host phosphate rocks should be at least 24% [3]. Anions such as F−, Cl− and OH− may substitute for PO43− anion which makes variations in the percentage of P2O5 and other associated minerals such as silicates, carbonates, fluorides and clays along with metal oxides. These impurities create challenges in the processing of ore and can influence the production of phosphoric fertilizers.
Growing demands for phosphorous and its derivatives and the depletion of primary high-grade resources have motivated the design and development of new technologies to extract phosphates from low-grade ores and other secondary resources. Tailings and wastewaters produced from the phosphate industry are the main secondary sources of phosphates [4,5]. These low-grade resources can be enriched to increase the grade of P2O5 to meet the requirements for the production of P2O5-based fertilizers. Several separations and beneficiation techniques, such as heavy media, calcination, leaching, and flotation, have been used for the enrichment of P2O5 [6,7,8,9]. Nitric acid and sulfuric acid are the two common acids used in the leaching of phosphates [10]. However, acid leach leads to the formation of large amounts of acidic wastes.
Of these beneficiation methods, froth flotation is especially suited for dealing with low grade ores due to its higher selectivity compared with other enrichment processes. Froth flotation is a three-phase separation process in which a target mineral in an aqueous suspension is first rendered hydrophobic using “collectors”. When air is dispersed into the suspension, the hydrophobic particles selectively attach to air bubbles and the bubble-particle aggregates float to the surface and recovered in a resultant “froth” or “concentrate” layer. Remaining mineral impurities called “tail” are thereby separated in the aqueous pulp. Nearly 60% of phosphate production in the world comes from flotation processes [11,12].
Flotation of phosphate ores is a technically challenging process due to the variations in the composition of phosphate-bearing minerals and the similar physicochemical properties of phosphate minerals and the associated gangue minerals [13]. Many efforts have been devoted to deal with these difficulties in order to develop robust processes to improve the phosphate recovery and enrichment efficiency [14,15,16,17,18,19]. Currently, there are two major processes adopted by the phosphate industry to enrich phosphate minerals by froth flotation: Direct flotation process and reverse flotation process. In direct froth flotation process, the value minerals (apatite and apatite derivatives) are rendered hydrophobic, floated and collected in the froth layer whereas in the reverse flotation process, phosphate-bearing minerals are depressed allowing the gangue minerals to float.
Direct flotation is generally used to process phosphate ores that are rich in silica and dolomite minerals. The grade of P2O5 can be increased up to ~30%–34% in concentrate products at above 80% recovery [20]. A direct flotation process of phosphates has been used by Florida’s phosphate mines for a long time. In this process, fatty acids and sodium silicates are used as collectors and dispersants, respectively and phosphate minerals are floated with fine silicates at pH 9–9.5 [21]. In order to upgrade the phosphate concentrate to a salable product, initial concentrates are further cleaned in the second stage of the flotation process where fine silica is floated using amine-based collectors at pH ranges from 6.5–8.
Reverse flotation can be applied for phosphate ores that have high carbonate and low silica content. The grade of P2O5 in the tailing products depends on silicate content in the feed. When silicate content is lower in the feed, the P2O5 grade is higher in the tailings, and vice versa. The recovery of P2O5 in reverse flotation process is usually more than 80% [20]. Amines and their derivatives are used as collectors to float the fine silica at neutral pH follows by dewatering and conditioning the phosphate tailings with fatty acid/fuel oil collectors at pH 9. After conditioning, the phosphate minerals are floated from coarse silica.
This study investigated upgrading the P2O5 content in tailings produced from a phosphate production plant located in the USA by froth flotation. Flotation experiments were carried out using Denver D-12 with a 1-L flotation cell. Sodium silicate was used as a gangue dispersant, and sodium oleate was used as a collector. Several parameters, such as pulp density (solid content), the pH of the flotation pulp and the flotation time, were investigated. Prior to the flotation experiments, extensive characterizations of tailings samples were performed to determine the mineralogical and elemental compositions. Moreover, zeta potential measurements were conducted to fundamentally explore the interactions between the chemical reagents and the major mineral constituents of ore, i.e., apatite and quartz. The characterization and electrokinetics measurements enabled us to predict the behavior of flotation feed to optimize the recovery and grade of concentrate products.
2. Materials and Methods
2.1. Materials
Representative tailings samples were provided from a phosphate production plant located in the USA. All chemicals used in the flotation experiments were purchased from Fisher Scientific Company, Hampton, NH, USA. These included sodium oleate, which was used as a collector, methyl isobutyl carbinol (MIBC), which was used as a frother, sodium silicate, which was used as a dispersant, and sodium carbonate (Na2CO3), which was used to adjust the pH of the flotation pulp. Additionally, pure apatite and quartz mineral samples used in the zeta potential experiments were purchased from Ward’s Science, Rochester, NY, USA.
2.2. Methodology
2.2.1. Sample Characterization
Sieve Analysis. Screens of 2000, 500, 250, 125, 63, 44 and 37 µm were used for sieving. Sieves were shaken in a mechanical shaker for the time determined by ASTM C136-14 protocols to provide complete separation for the sieve shaker being used.
X-Ray Diffraction (XRD). X-ray diffraction (XRD) was conducted on whole tailing samples, flotation feed and flotation products to investigate the crystalline phases and mineral associations within the samples. Powder X-ray diffraction (PXRD) was conducted with a PANalytical X’Pert Pro Multipurpose Diffractometer (MPD) with Cu Kα radiation (λ = 1.54 Å) and a proportional counter detector equipped with a flat graphite monochromator. RIQAS software was used to analyze Rietveld refinement of the X-ray diffraction patterns to estimate phase composition. To determine instrumental broadening, a Gaussian correction was applied using NIST SRM 660a LaB6.
Scanning Electron Microscopy (SEM). Scanning electron micrographs were obtained using a SEM instrument combined with energy dispersive X-ray spectroscopy (EDX). Qualitative and semi-quantitative chemical analyses in the EDX mode were performed to support SEM characterization. All samples were prepared to appropriate sizes to fit the specimen chamber. Samples were coated with 2–3-nm-thick gold layers and rigidly mounted on specimen stubs.
Mineral Liberation Analysis (MLA). MLA data were obtained using the extended backscattered electron liberation analysis (XBSE) method where the acquired BSE image was used to differentiate mineral phases based on gray level as the gray level intensity varied (dependent on the phase composition). The acquired X-ray spectrum obtained from each phase was compared with those in an X-ray mineral database to qualitatively determine mineral phases and the surface area data for each mineral that was used for their quantitative determination. The MLA results were provided by the Center for Advanced Mineral & Metallurgical Processing (CAMP) in Montana Tech of the University of Montana, Missoula, MT, USA.
2.2.2. Zeta Potential Measurements
Zeta potential measurements were performed on pure mineral samples (apatite and quartz) before and after mixing with different flotation reagents (collector and dispersant). Zeta potential measurements were performed using a Zetasizer Nano ZS instrument (Malvern Instruments, Inc., Westborough, MA, USA). All measurements were obtained at room temperature. Samples were prepared at 0.1 wt % of mineral in a 0.1 M KCl background solution. The prepared mineral suspension was agitated using an IKA RW20 mechanical stirrer (IKA Instruments, Wilmington, NC, USA) for 45 min at a constant agitation rate of 250 rpm. The suspensions were allowed to settle overnight. The supernatant liquid was considered for all zeta potential measurements. In all experiments, the solution pH was adjusted using either 1 M HCl or 1 M NaOH as needed.
2.2.3. Flotation Experiments
Preparation of the Flotation Feed. Tailing samples were mixed using a mechanical agitator for 24 h to ensure sample homogeneity. Representative samples were then collected, dried and sieved according to ASTM C136-14. In general, the optimum reported feed size in the direct flotation of phosphate minerals is between 45 µm and 125 µm [22]. Thus, the flotation feed size used throughout this study was the −125 + 45 µm size fraction obtained from sieving.
Experiments. Flotation tests were conducted using a Denver D-12 flotation machine equipped with a 1-L tank and a 3.88-inch diameter impeller. Tap water was used as a medium in all experiments unless otherwise stated. Sodium carbonate (Na2CO3) was used to adjust the pH of the flotation pulp. The rotor speed of the flotation machine was set at 1200 rpm in all flotation experiments. The pulp was conditioned for 5 min prior to any reagent addition. The various experimental conditions used in this study are presented in Table 1. Collector (sodium oleate) was added at a predetermined dosage as shown in Table 1, and the suspension was conditioned for an additional 3 min. The dispersant (sodium silicate) was added after the slurry was conditioned with the collector and the pulp was agitated for another 3 min. The concentrations of stock solutions of sodium oleate and sodium silicate were 100 g/L and 400 g/L, respectively. The frothing agent (MIBC) was added thereafter. Reagents’ dosages were initially chosen based on previously published research work [11,23,24] then dosages were optimized experimentally. The pulp was further conditioned for 2 min before air was introduced. The froth products were collected at different time intervals as shown in Table 1. The concentrate fractions were dried in an oven overnight at 80 °C. Mineralogical analyses of concentrates and tailings samples were determined by coupling powder X-ray diffraction (XRD) with SEM energy dispersive X-ray spectroscopy (SEM-EDX). Phosphate mineral recovery was calculated using dry weights of concentrates and tailing products using Equation (1), where C and T are dry weights of the concentrate and tailing products, respectively, and c and t are the percentages of P2O5 in concentrates and tailings, respectively.
Recovery = Cc/(Cc + Tt) × 100%
3. Results and Discussion
3.1. Characterization of Tailing Samples and Flotation Feed
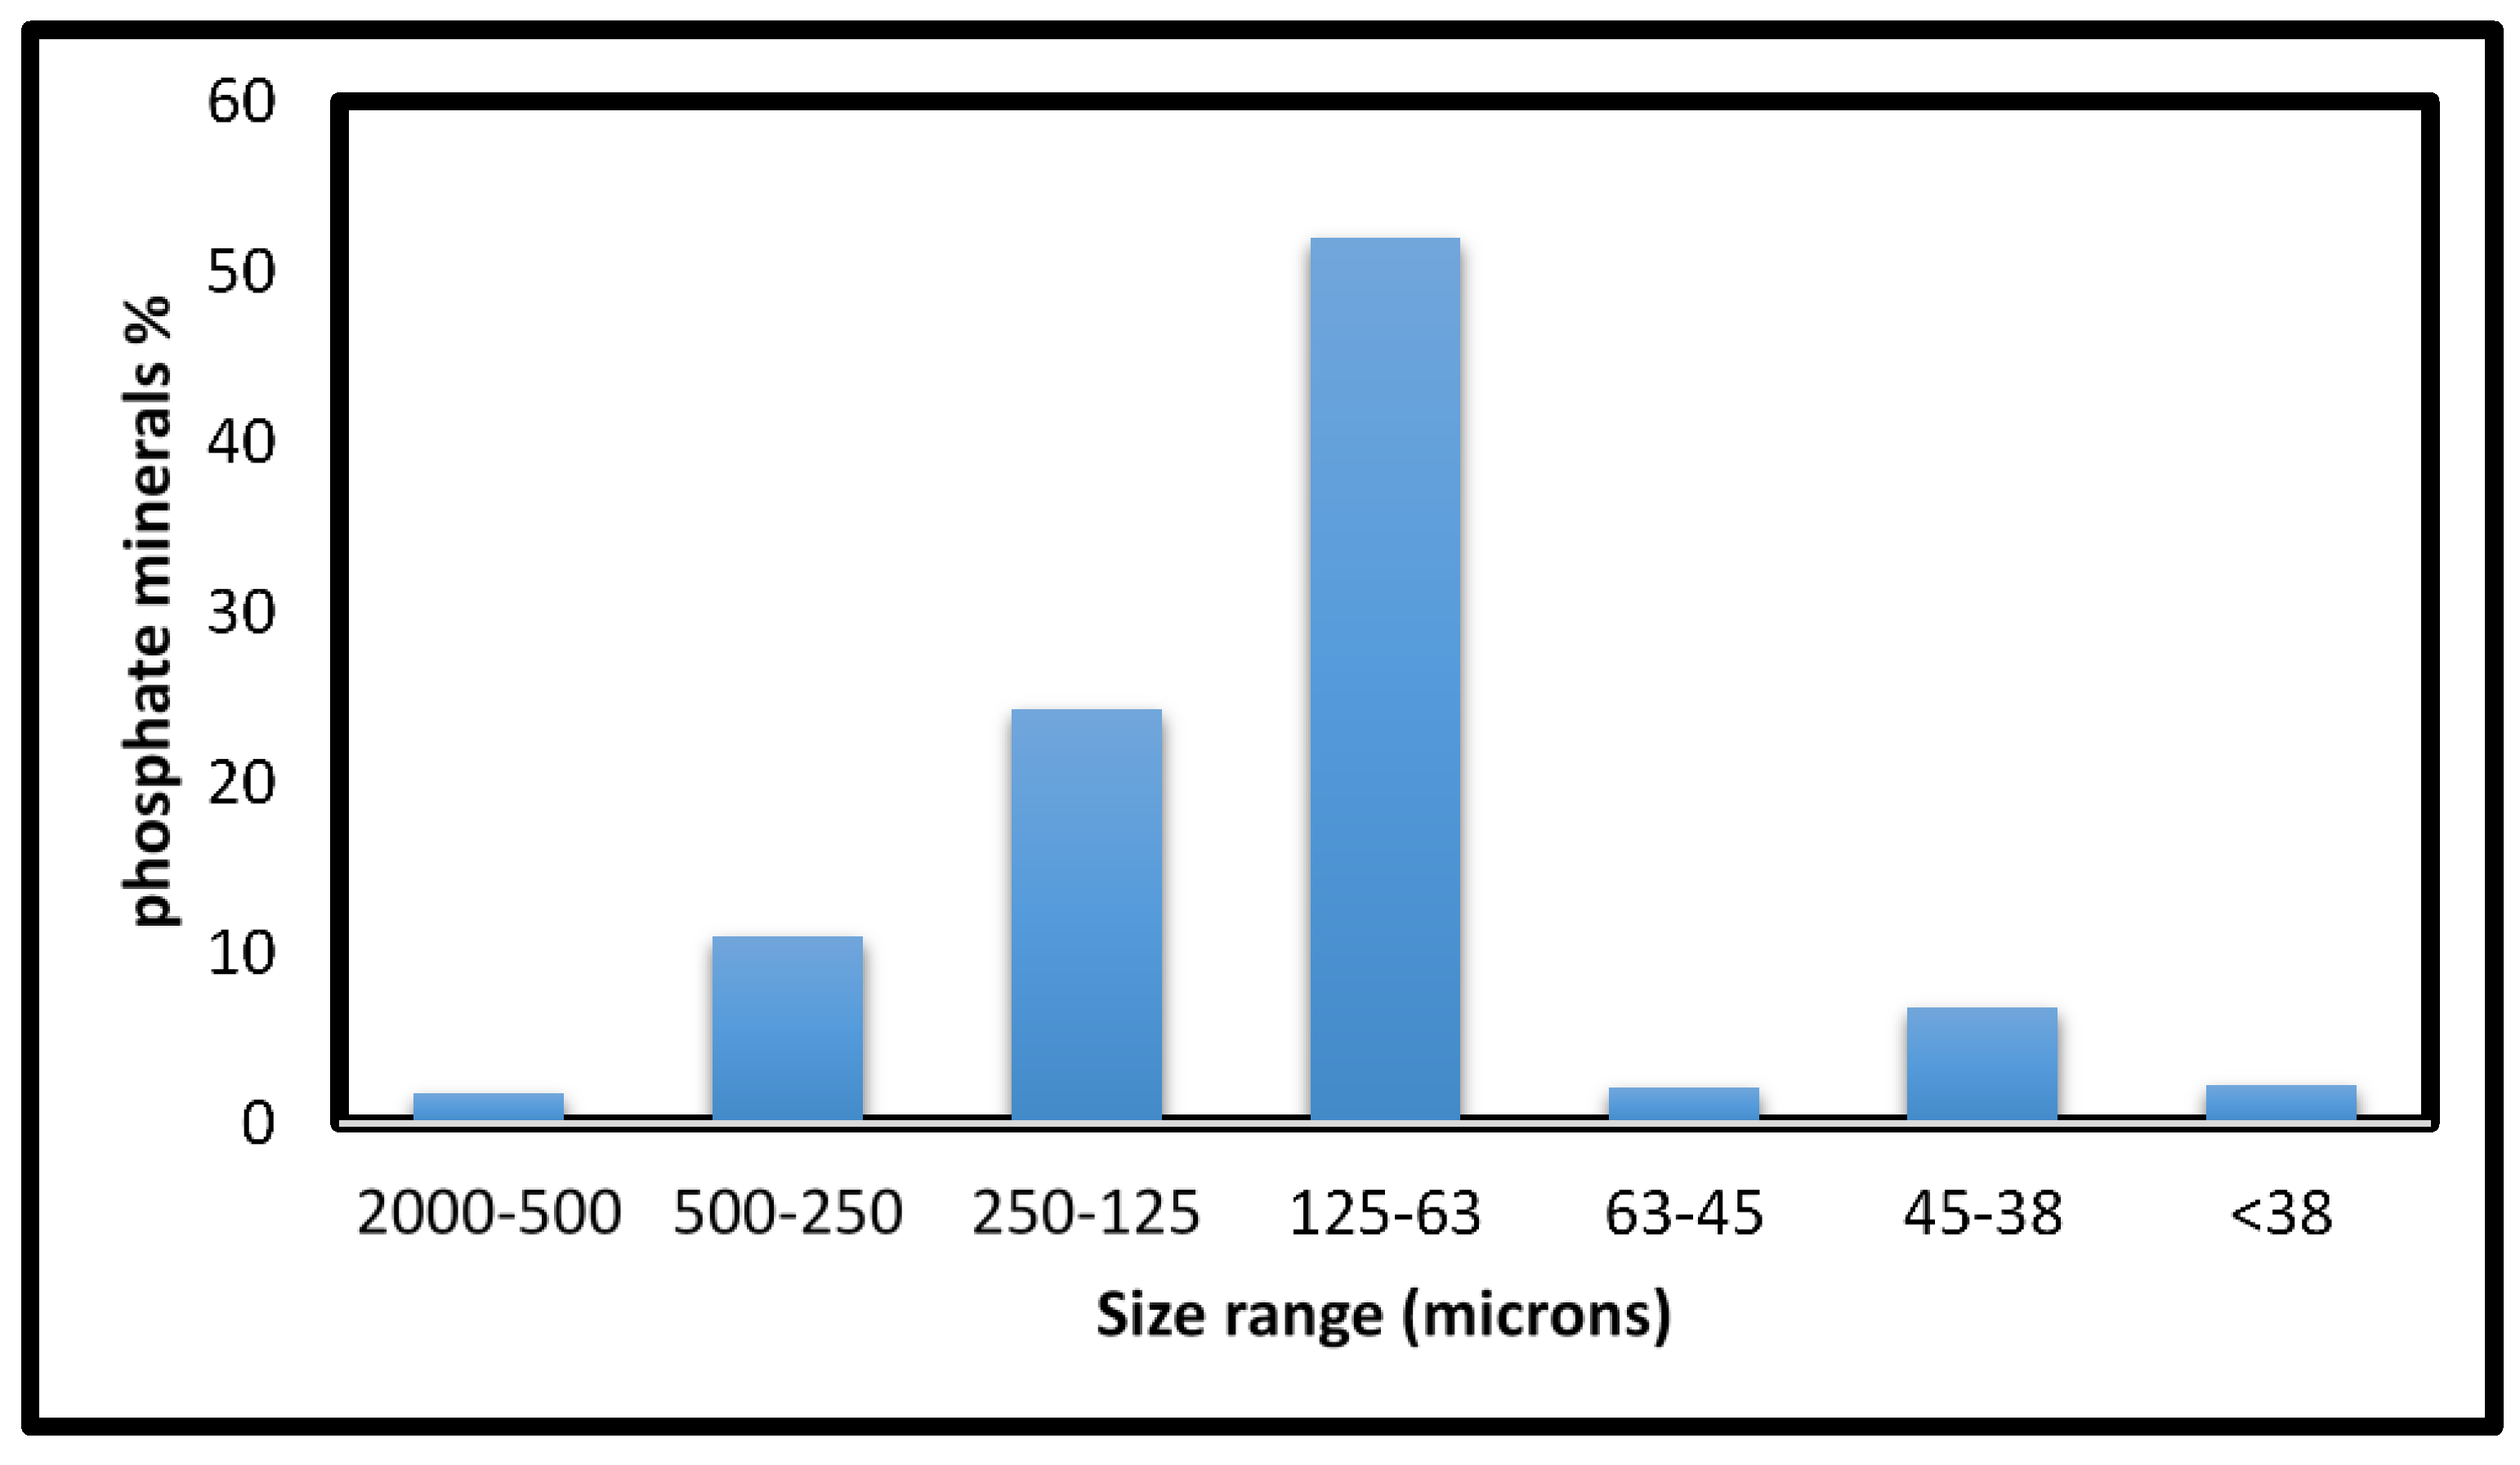
X-ray powder diffraction (XRD) was conducted on the tailing samples to identify the different minerals and other possible materials present in the samples. To reduce common errors associated with mineral identification and analysis, such as orientation, specimen transparency granularity, and microabsorption, sample sizes were reduced, and the surface roughness of the samples were diminished by mortar and pestle before analysis. Three major minerals were detected: apatite, fluroapatite and quartz. These semiquantitative results demonstrated that the phosphate minerals constituent was approximately 70 percent of the sample and the remainder was quartz. The distribution of phosphate minerals in different size fractions of the tailing samples is shown in Figure 1. Overall, the majority of phosphate minerals were in the size range of 63–250 µm.
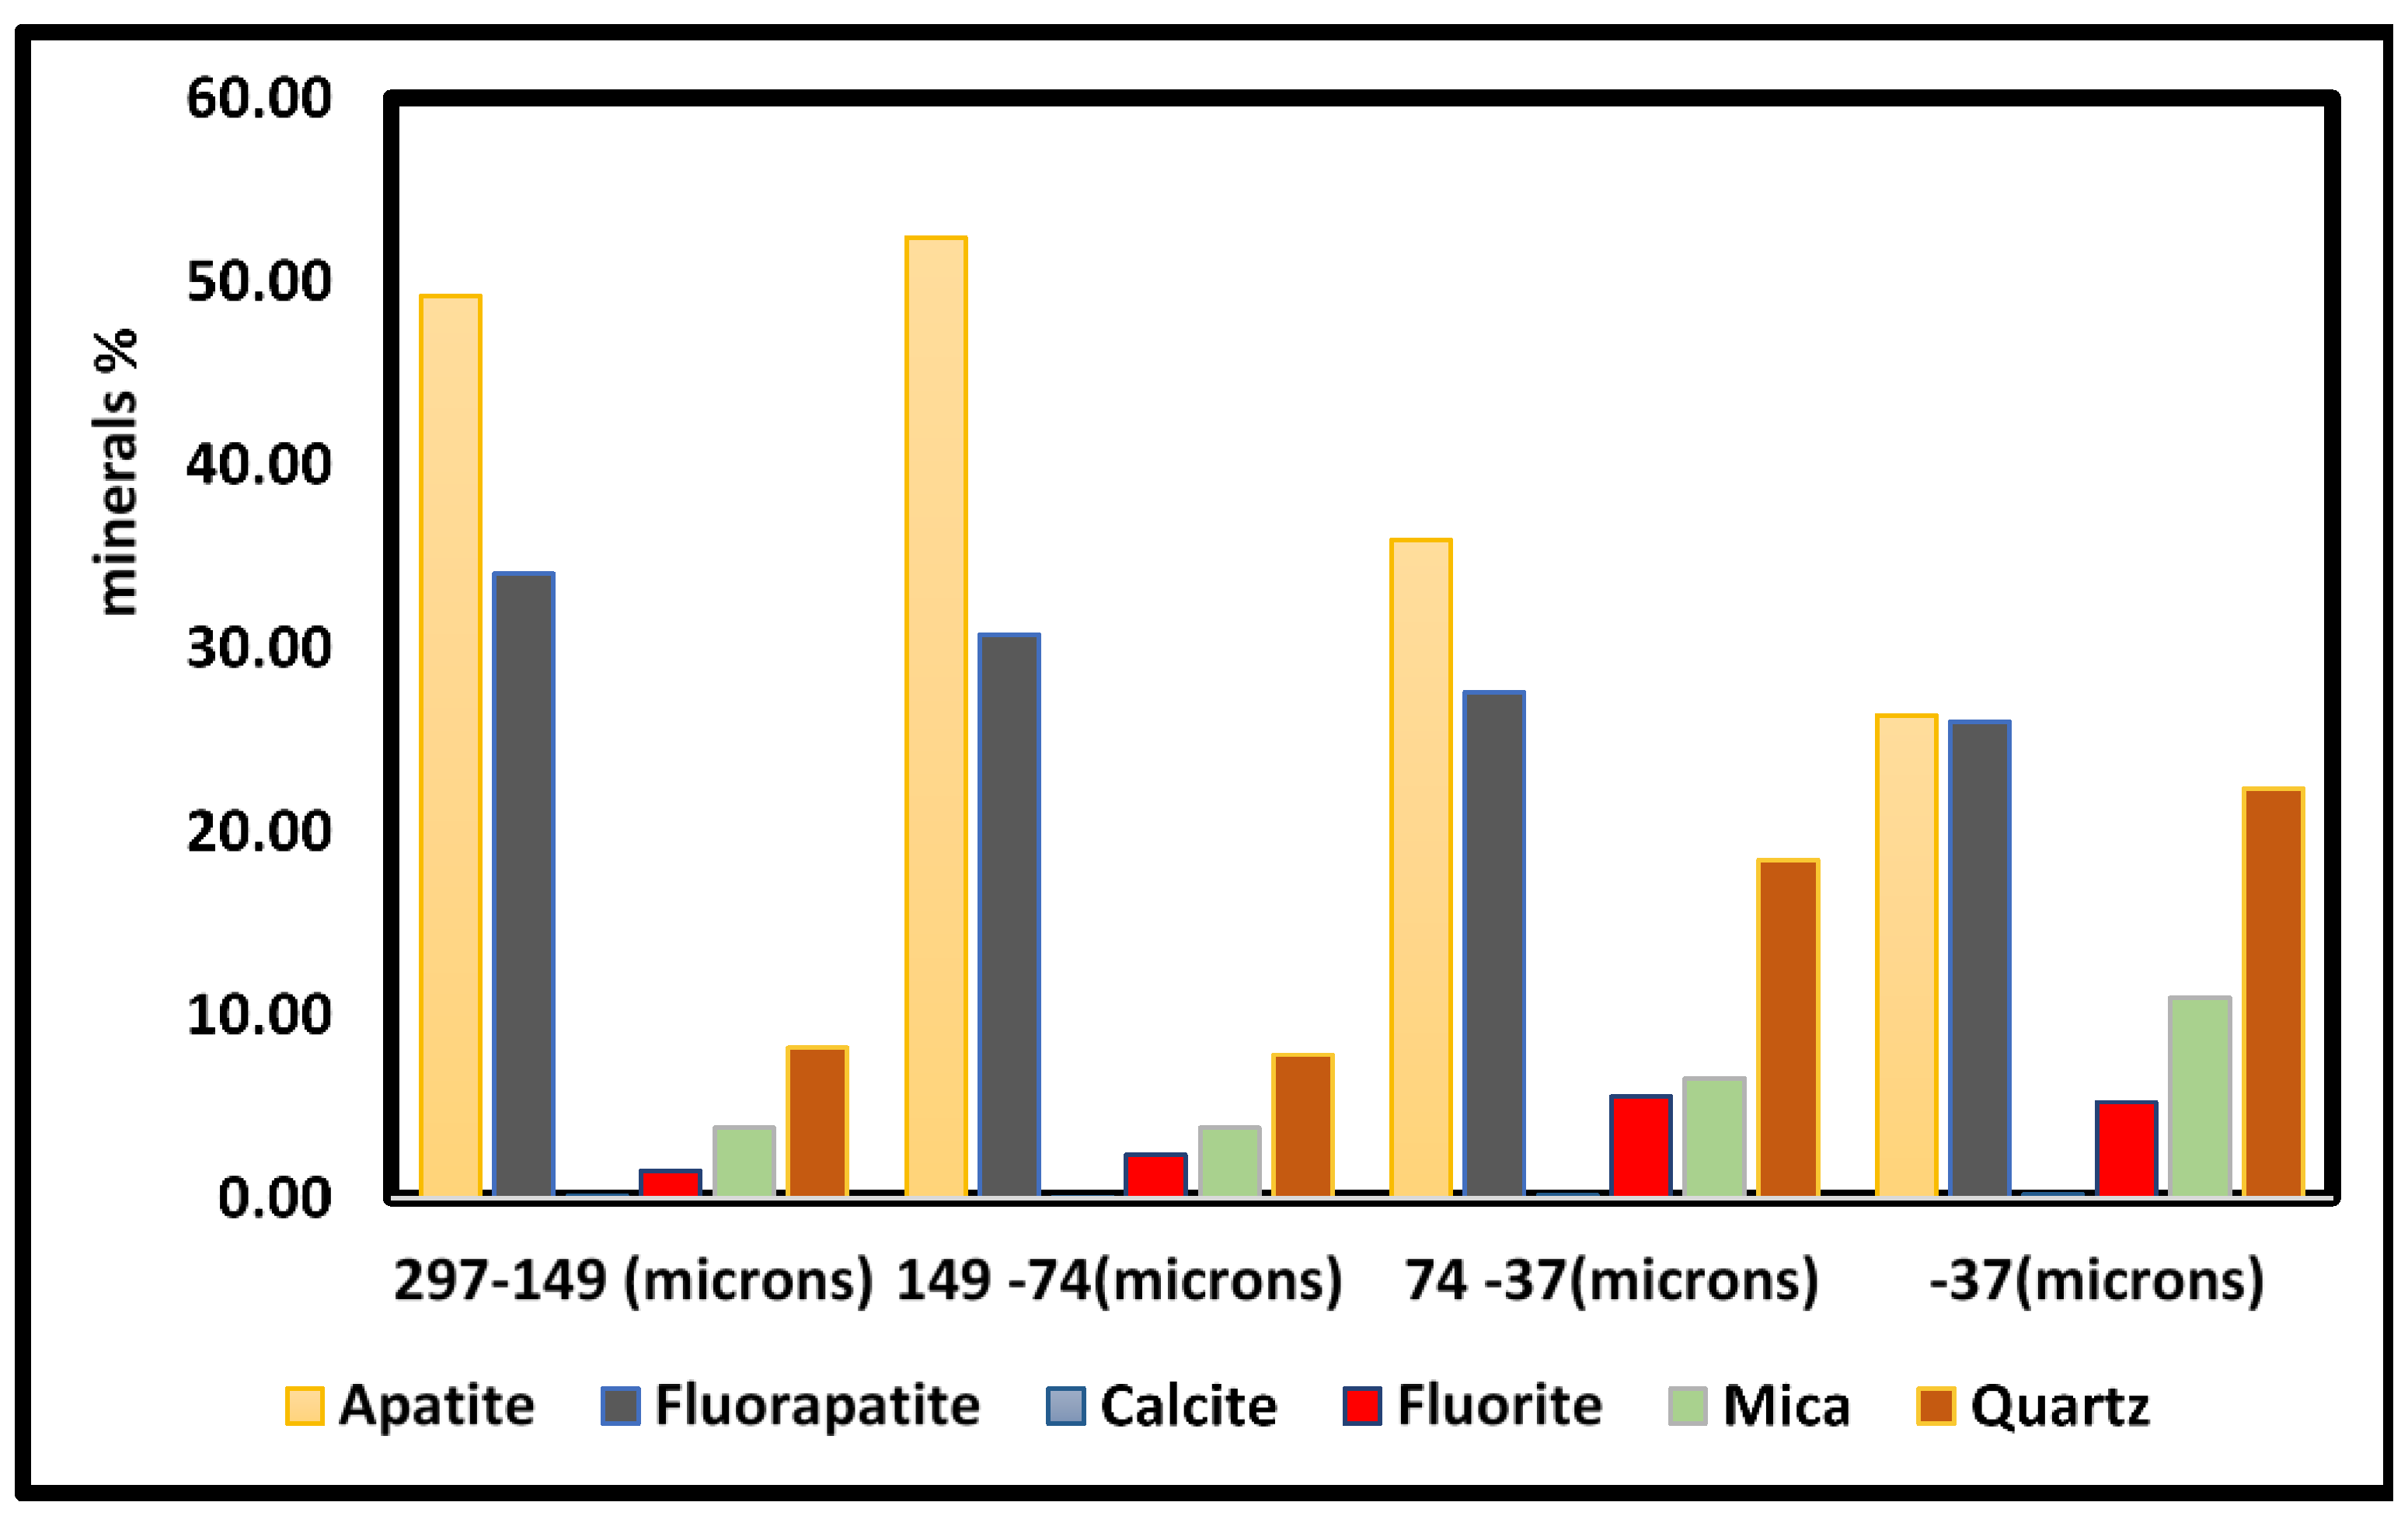
Figure 2 shows the distribution of the constituent minerals in different size fractions of the tailing samples as determined by MLA. The primary phosphate-containing phases were apatite and an apatite-fluorite mix. Apatite and the mixed apatite phases (apatite-fluorite mix) were found in different amounts in the tailing samples at approximately 50% apatite and 30% fluorapatite.
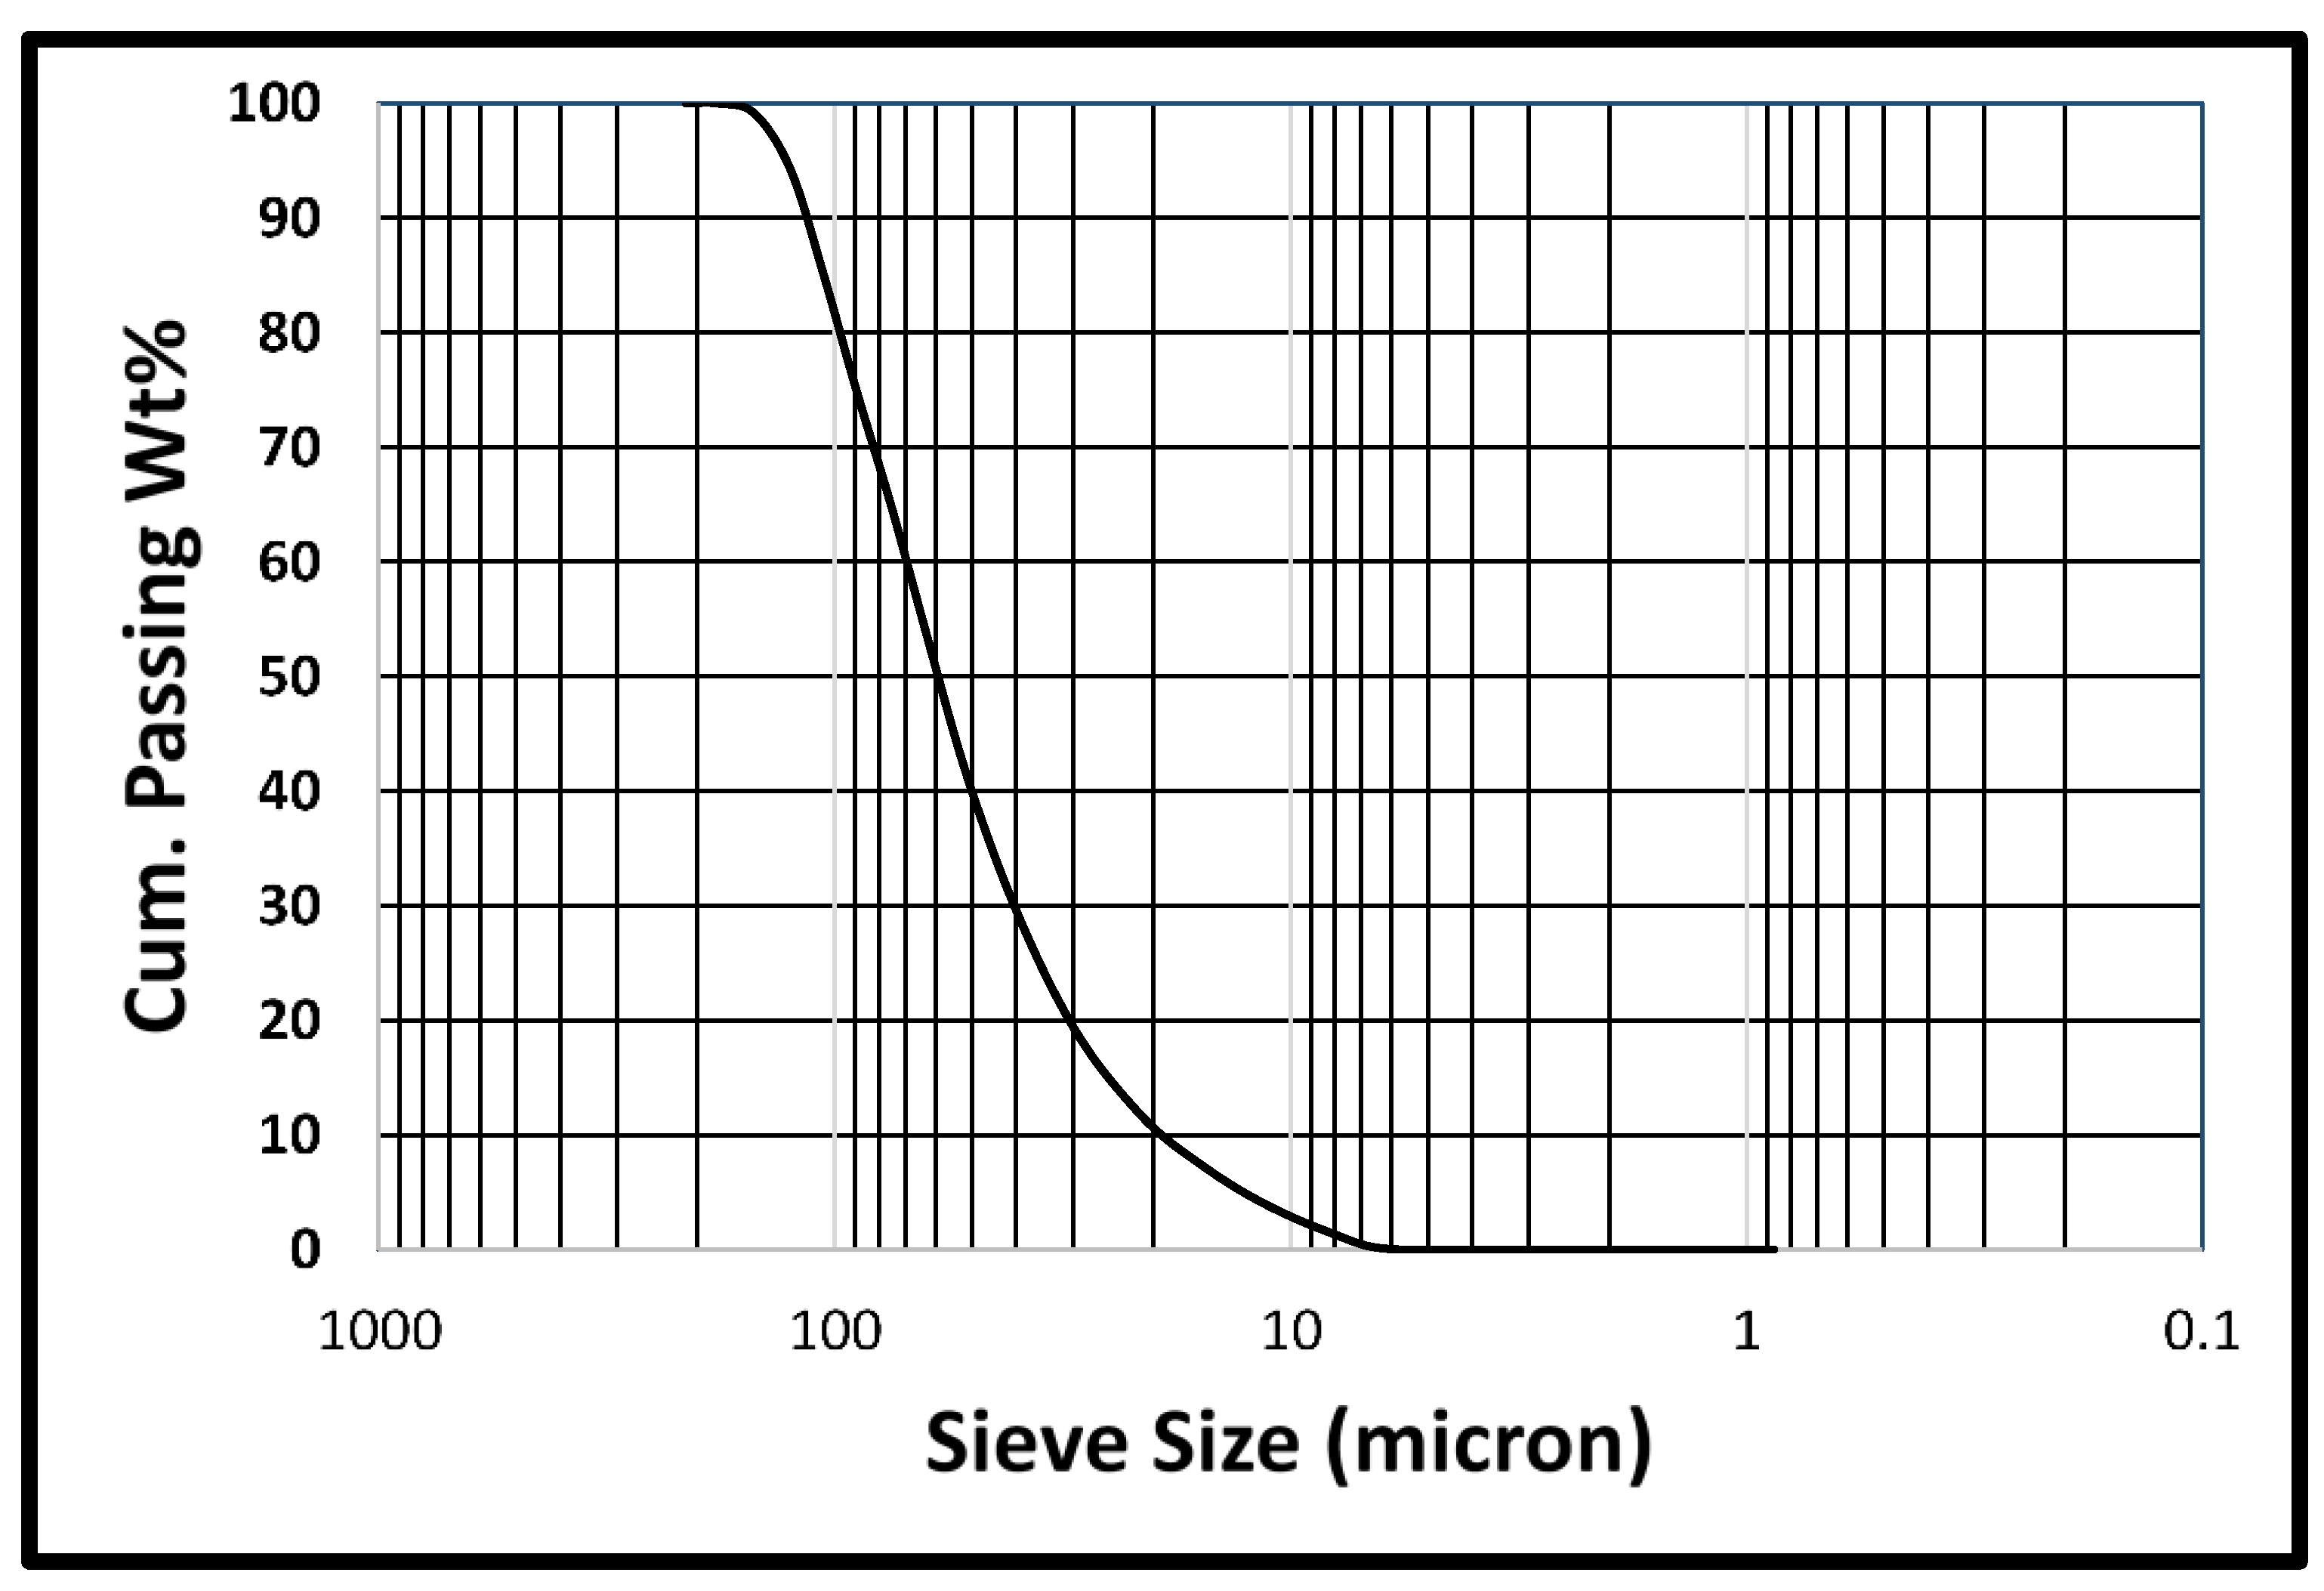
The composite particle size distribution of the flotation feed, as determined by mineral liberation analysis (MLA), is shown in Figure 3. The P80 of the composite particle size distributions was approximately 100 µm.
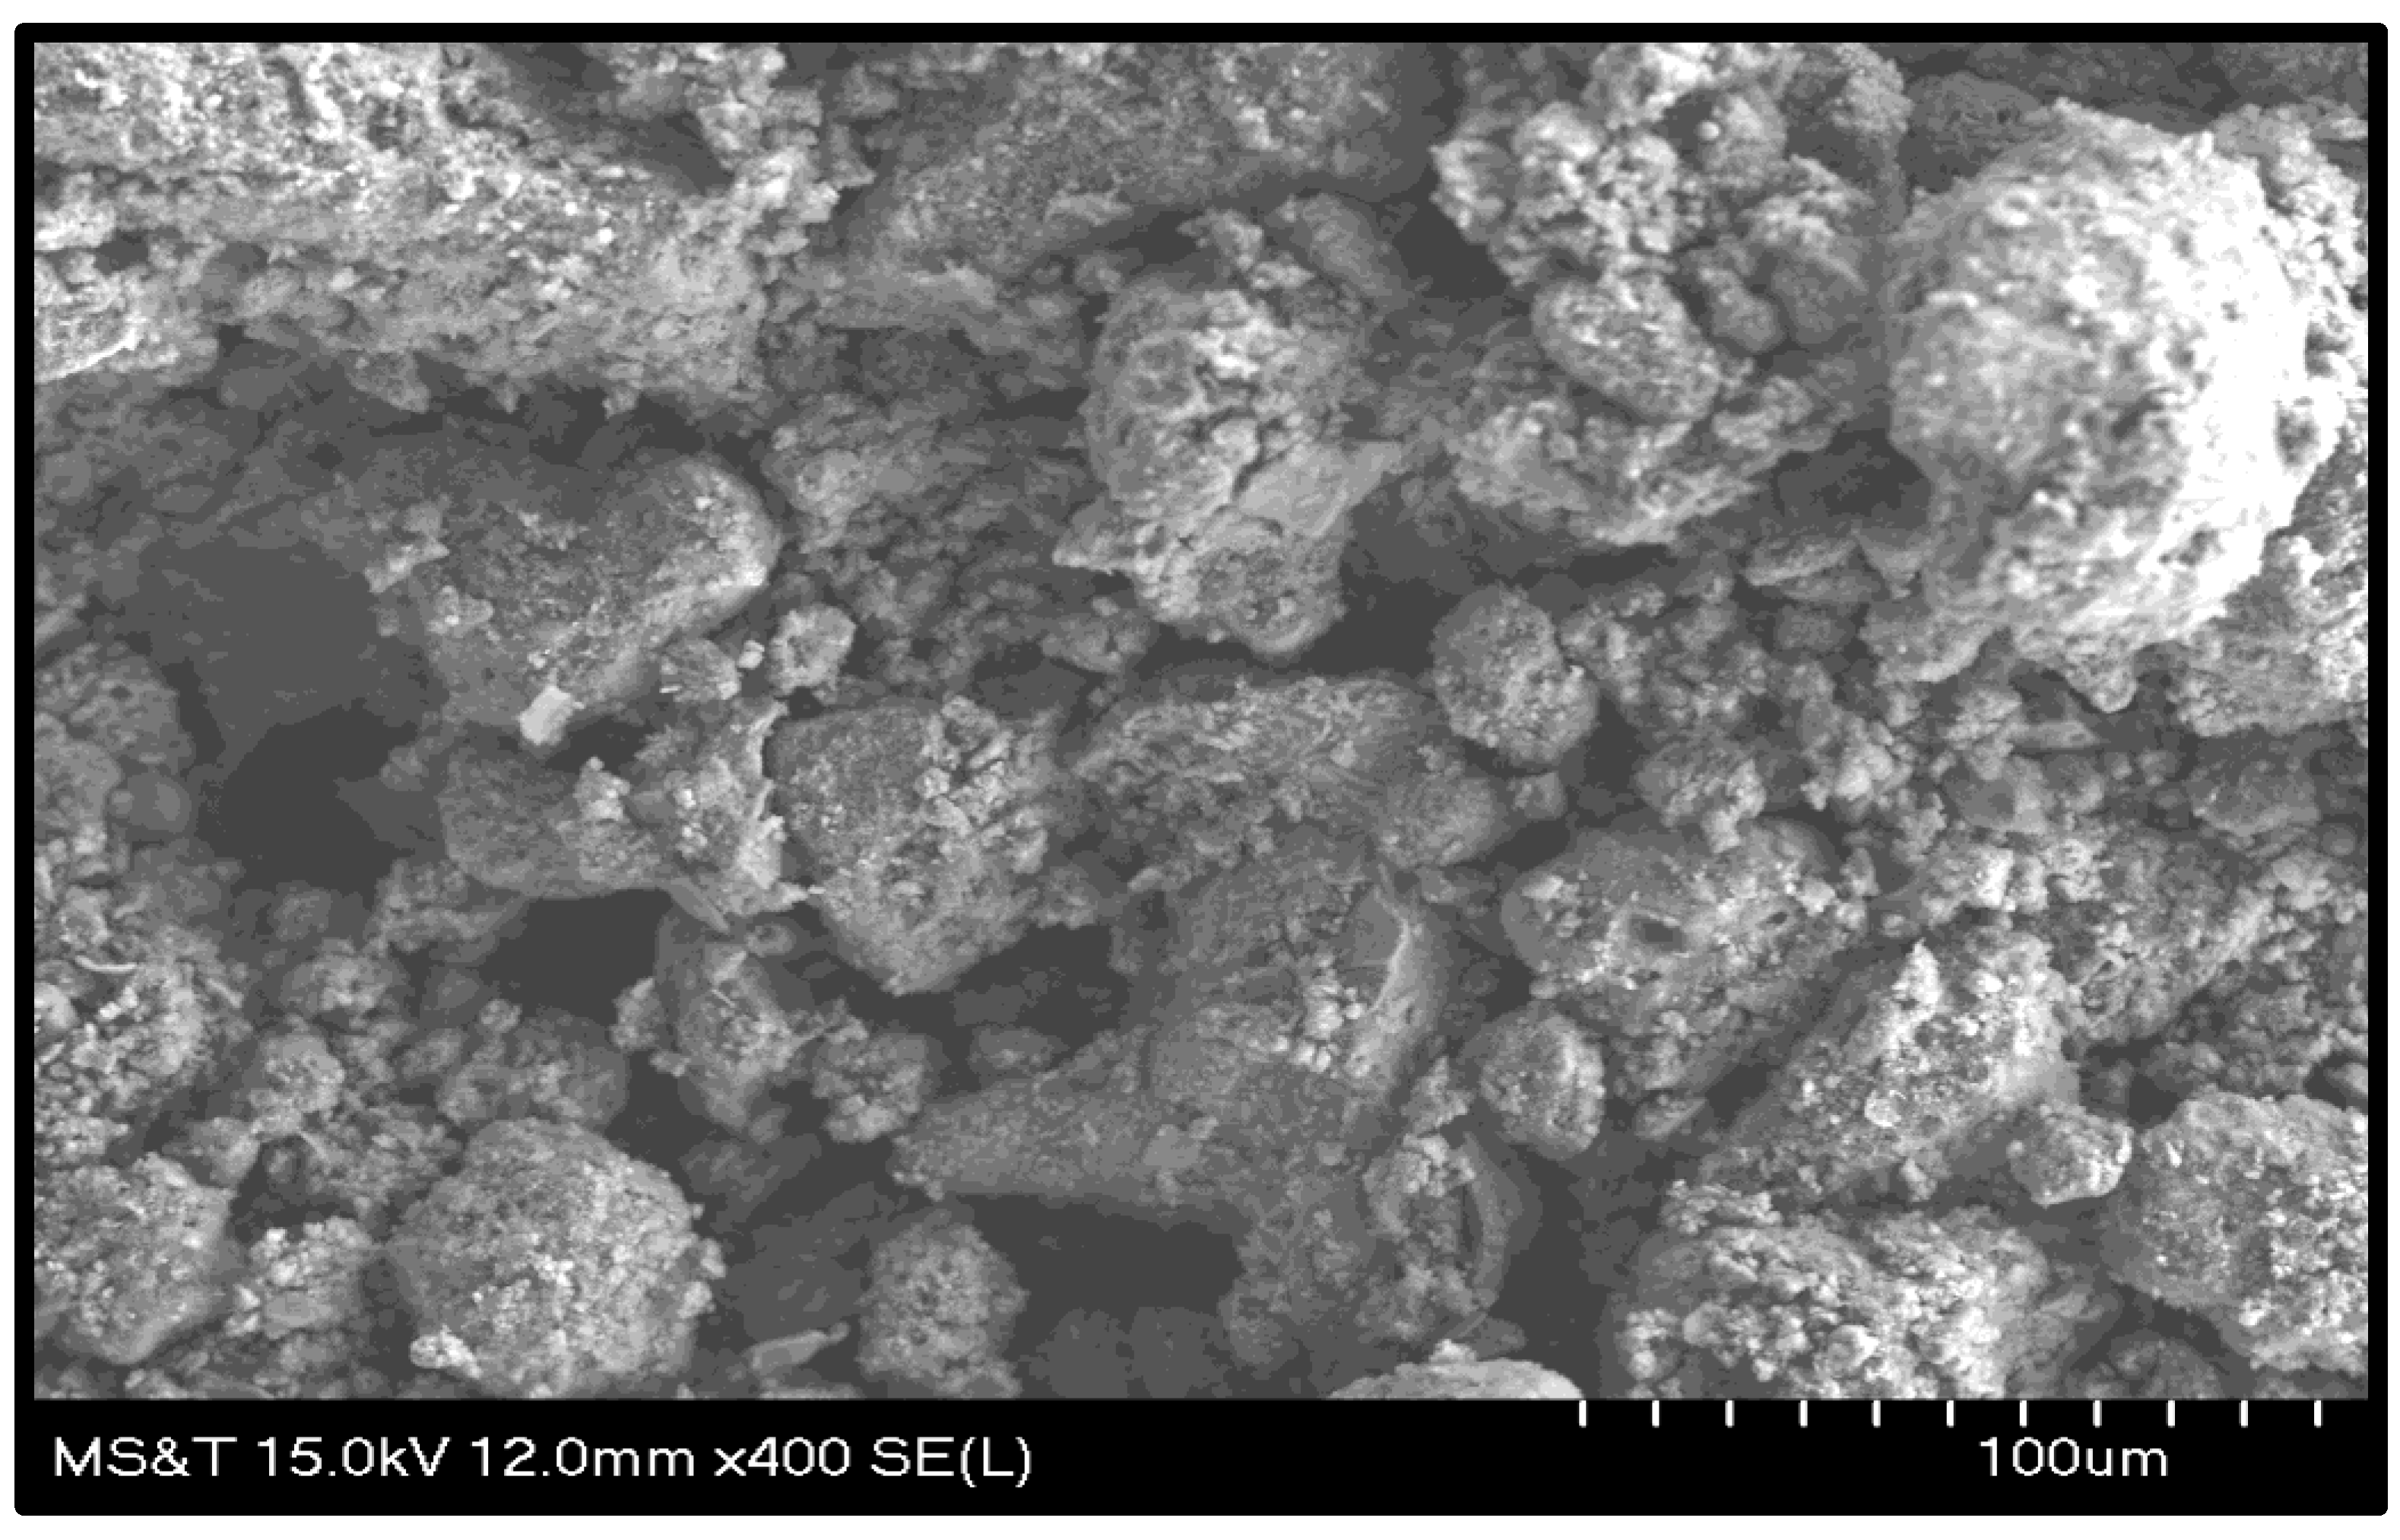
More information about the morphological characteristics of the flotation feed were obtained from SEM-EDX. The SEM-EDX micrographs are shown in Figure 4. The images revealed that approximately 80% of the mineral grains were smaller than 100 µm, which is consistent with the results obtained from sieve analysis. Figure 4 also shows some particle agglomeration in the flotation feed.
Grain Size and Mineral Liberation
The grain size and mineral liberation in the flotation feed was investigated using MLA. The apatite had a larger grain than the mixed apatite/fluorite phase with a grain size distribution P80 of just over 100 µm for apatite compared with 75 µm for mixed apatite/fluorite. Figure 5 shows a classified MLA image of the flotation feed. The classified false color MLA image in Figure 5 highlights a quartz/apatite particle with FeO inclusions. As indicated, apatite was slightly better liberated than the mixed apatite/fluorite phase. The overall liberations for the apatite and mixed apatite/fluorite phases in the feed were nearly 60% and 55% for particles containing 90%–100% apatite and fluorapatite, respectively.
3.2. Zeta Potential Measurements
Zeta potential measurements of pure apatite and quartz samples were conducted, separately, to fundamentally explore and compare the surface properties and electrical characteristics (surface charge) of mineral particles and to identify interactions between the minerals and different reagents. The Zeta potential vs. pH graphs of pure apatite and quartz were established at a pH range of 2–12 to determine the optimum pH range for a specific mineral/reagent system. Figure 6 shows the changes in surface charge (as indicated by the sign and magnitudes of potential values) of apatite and quartz dispersions over a pH range of 2–12. The isoelectric points of apatite and quartz were at pH 4.9 and 2.8, respectively. The optimum pulp pH in the direct flotation of phosphate minerals reported in literature is between 9 and 11 [23,25]. Within that pH range, the zeta potential values of apatite and quartz were −20 and −37 mV, respectively. This difference in electrical characteristics within this pH range enables the selective alteration of surface properties of either mineral through the addition of appropriate reagents. For example, a negatively charged reagent will preferentially adsorb on the surface of apatite because apatite particles are less negative, whereas a positively charged reagent will preferentially adsorb on the surface of quartz particles due to electrostatic attractive forces leading to partial charge neutralization. The results of the zeta potential vs. pH graphs are consistent with results reported in the literature [23,26,27].
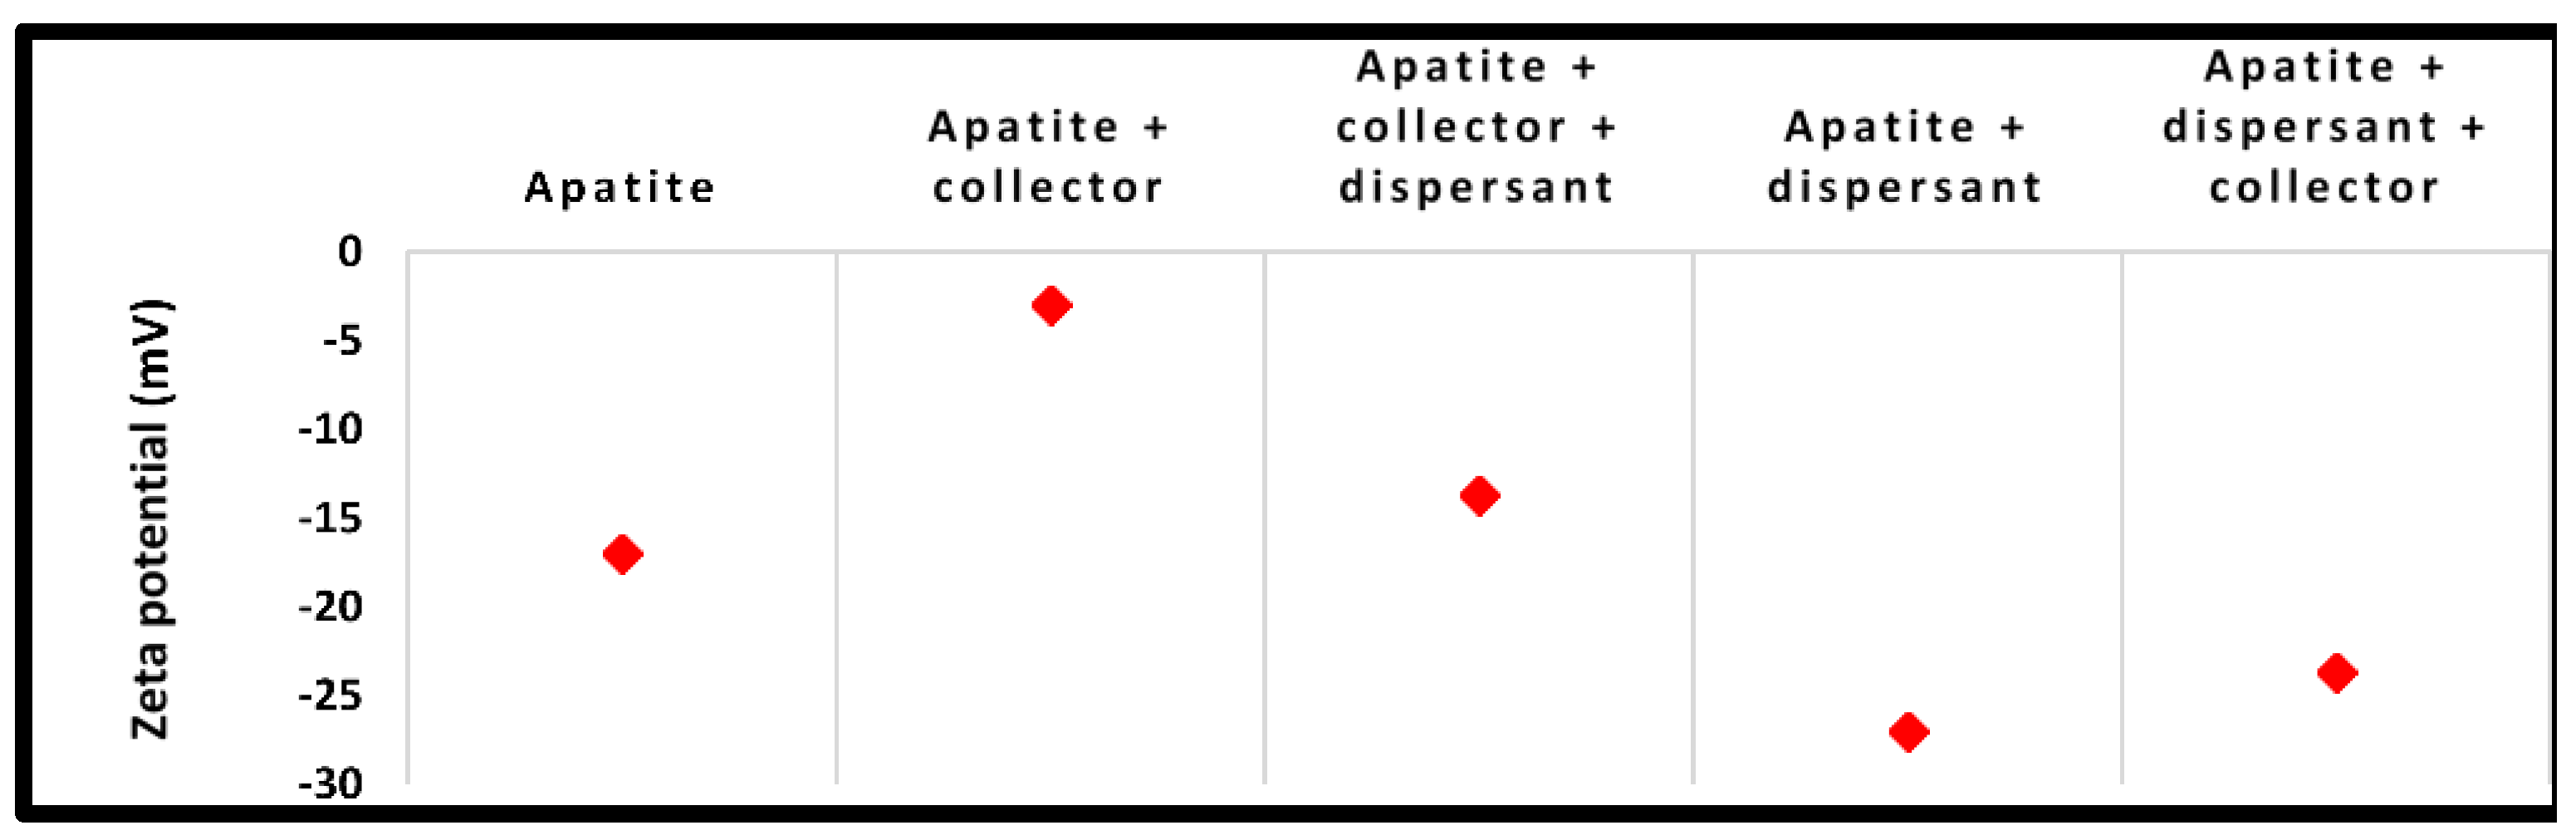
Figure 7A,B shows the zeta potential values of quartz and apatite particles before and after mixing with different reagents at pH 9. As indicated from the change of zeta values after reagent adsorption, the interactions of sodium oleate (collector) with apatite were stronger when compared with interactions with quartz. The zeta potential of apatite increased from −17 mV before the addition of the collector to almost zero mV (Figure 7A), whereas the zeta potential barely changed when quartz was mixed with collector. This indicated that the collector would preferentially adsorb on the surface of apatite rather than on the surface of quartz. However, the changes in zeta potential values of the apatite and quartz particles after mixing with the dispersant were quite interesting. As shown in Figure 7A,B, the dispersant adsorbed on the surfaces of both apatite and quartz. The interaction of dispersant with apatite was stronger as indicated by the larger shift of the zeta potential (toward a more negative value). These results indicated that the dispersant might have a depressing action on apatite flotation, which was previously reported literature [11]. To investigate the effect of addition order of collector and dispersant on the charge of apatite particles, another set of experiments were conducted where collector was added followed by dispersant and vice versa (Figure 8). As shown in Figure 8, the interaction of sodium oleate (collector) with apatite was much weaker when sodium silicate (dispersant) was added first as compared to the case when collector was added prior to dispersant. These results are consistent with the observed low recovery of phosphate minerals when the dispersant was added prior to the collector in flotation process where the observed recovery was ~30% at 60 wt % of solids (graphs are not shown). For this reason, collector was added prior to the dispersant in all flotation experiments.
3.3. Flotation Experiments
3.3.1. Baseline Experiments
The baseline experiments were performed periodically based on the conditions listed in Table 1. This was done to define a base recovery and to ensure the reproducibility of results and congruity of the experimental parameters. In these experiments, the pulp density (solids content), pulp pH, and residence time of the pulp in the flotation cell were varied.
Influence of pH at Different Flotation Time Intervals
Baseline tests were conducted at the natural pH of the pulp (6.87) and at pH 9. Sodium carbonate was used to adjust the pH of the pulp as needed. The solids concentration was kept at 60 wt %, and the froth (concentrate) were collected over different flotation time intervals as explained in Table 1. As shown in Figure 9, the flotation performance at pH 9 was better when compared with the performance at natural pH whether the flotation time of the pulp was short (4 min) or long (10 min). For example, at 4 min pulp flotation time, the average recoveries of P2O5 were 74% and 58% at pH 9 and at natural pH, respectively. At the same flotation time, the P2O5 grade in the concentrates were 23.5% at pH 9 and 21.8% at natural pH. Moreover, the recovery of P2O5 at a specific pH was slightly better when the flotation time of the pulp was longer. For example, at pH 9, the recovery of P2O5 was 77.1% when compared with 76.3% at natural pH.
Influence of Solid Content
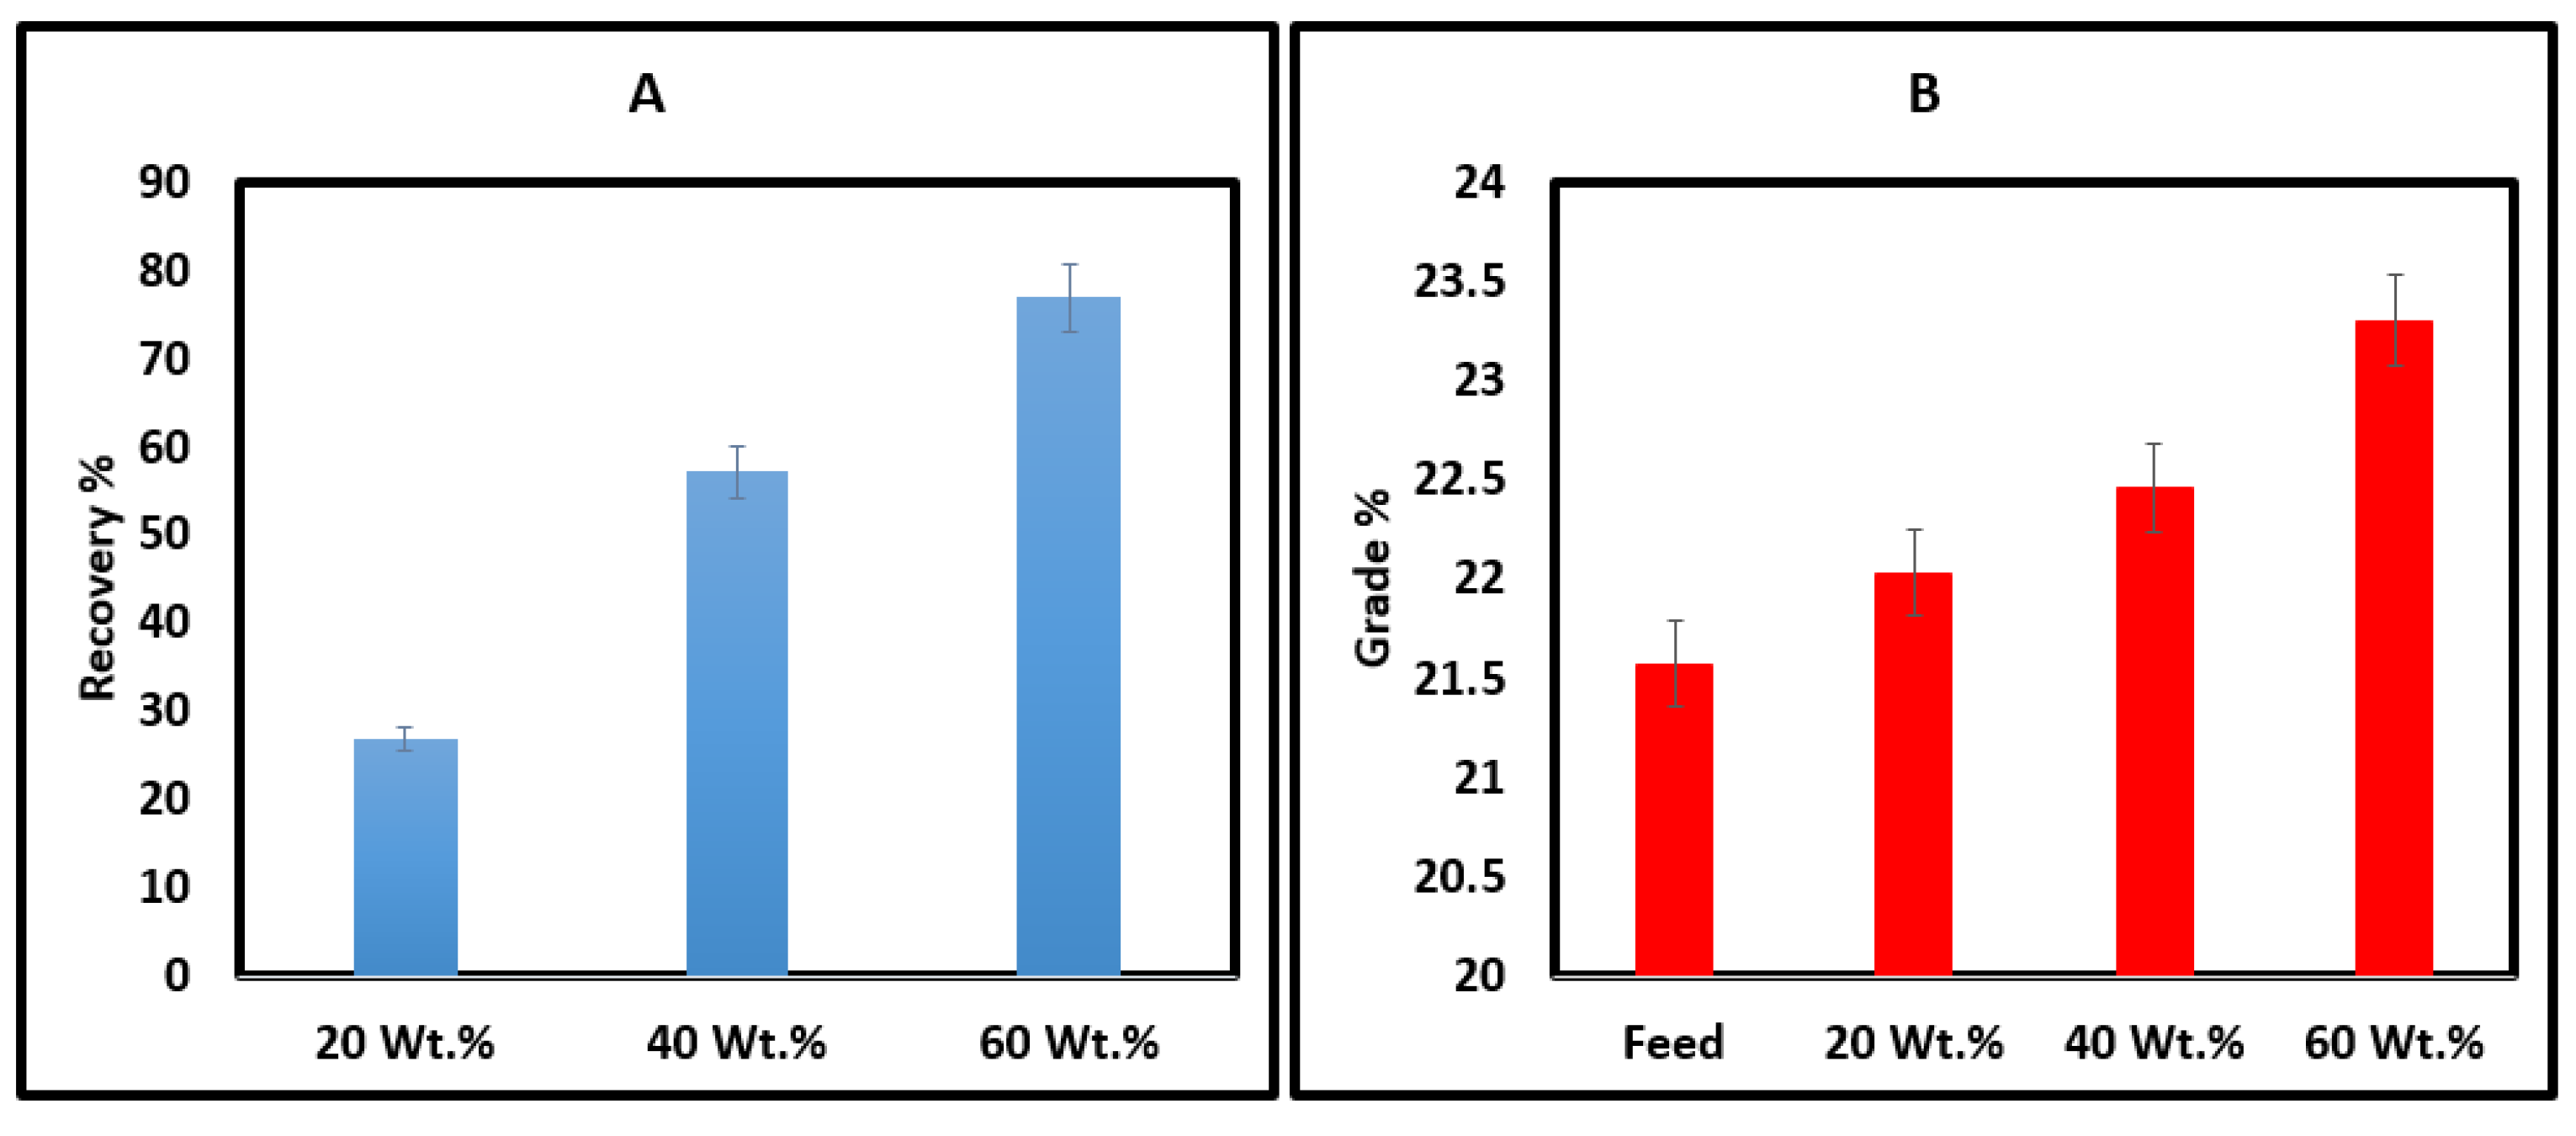
Figure 10 shows the recovery of P2O5 at different solid concentrations. For this set of experiments, the pulp pH was set at approximately 9 and the residence time was 10 min because these conditions were shown to give a better performance as indicated from the previous section. As shown in Figure 10, the best recovery of P2O5 was approximately 77% at 60 wt % solids, whereas the P2O5 grade showed an increase from 21.57% in the feed to 23.3% in the concentrate products.
The increase in the recovery with increasing the pulp density was observed in other studies as well [14]. This increase is due to several possible reasons: When the concentration of solids is low “thin pulp”, the individual mineral particles are at a larger distance from each other as compared to the particles in a thick pulp where the solid concentration is higher. The bubbles will arrive at surface less loaded and bubble-particle aggregates will be less stable. Another reason may be attributed to the increased amount of reagents; collector and frother used when more solids were added since these reagents were added on a basis of weight of reagents per weight of solids (i.e., collector was added at a dosage of 250 g/ton of ore). The increased amount of frother, in particular, plays a major role here since it increases the bubble flux and froth stability. Miller et al. [15,16] and Lu et al. [17] also investigated the effect of high solid concentration on the flotation selectivity of phosphate minerals in the presence of fatty acids collectors. They reported that at high solid concentration, fatty acid collectors would have a strong tendency to spread at the surface of apatite and fluoroapatite surface and a weak tendency to spread at quartz surface as indicated from contact angle measurements.
The P80 of the composite particle size distributions of baseline concentrates ranged from 70 to 90 µm and liberation was similar between all the samples, ranging from 44% to 50% liberation for particles of 95% apatite grade as obtained by MLA analysis. The mineral content of the concentrate products was very consistent. Apatite and the mixed apatite phase (apatite-fluorite mix) ranged from 28% to 34% each, and collectively were 60% to 62% of the mineral content of the samples. Quartz was around 18%, mica (K-Al silicate) was about 10%, K-Feldspar was 4% and fluorite was between 3% and 4%.
3.3.2. Flotation Experiments in the Presence of Sodium Silicate Dispersant
The function of the dispersant in any direct froth flotation process is to disperse the unwanted minerals, increase their hydrophilicity and inhibit their flotation. In this set of experiments, sodium silicate was chosen as a dispersant because it is considered to be one of the most effective dispersants for silicate minerals [20]. Sodium silicate was added at a fixed dosage of 250 g/ton as presented in Table 1. Different influencing parameters were examined to optimize the flotation process in the presence of sodium silicate dispersants. These parameters are discussed in the following sub-sections.
Influence of Solid Content
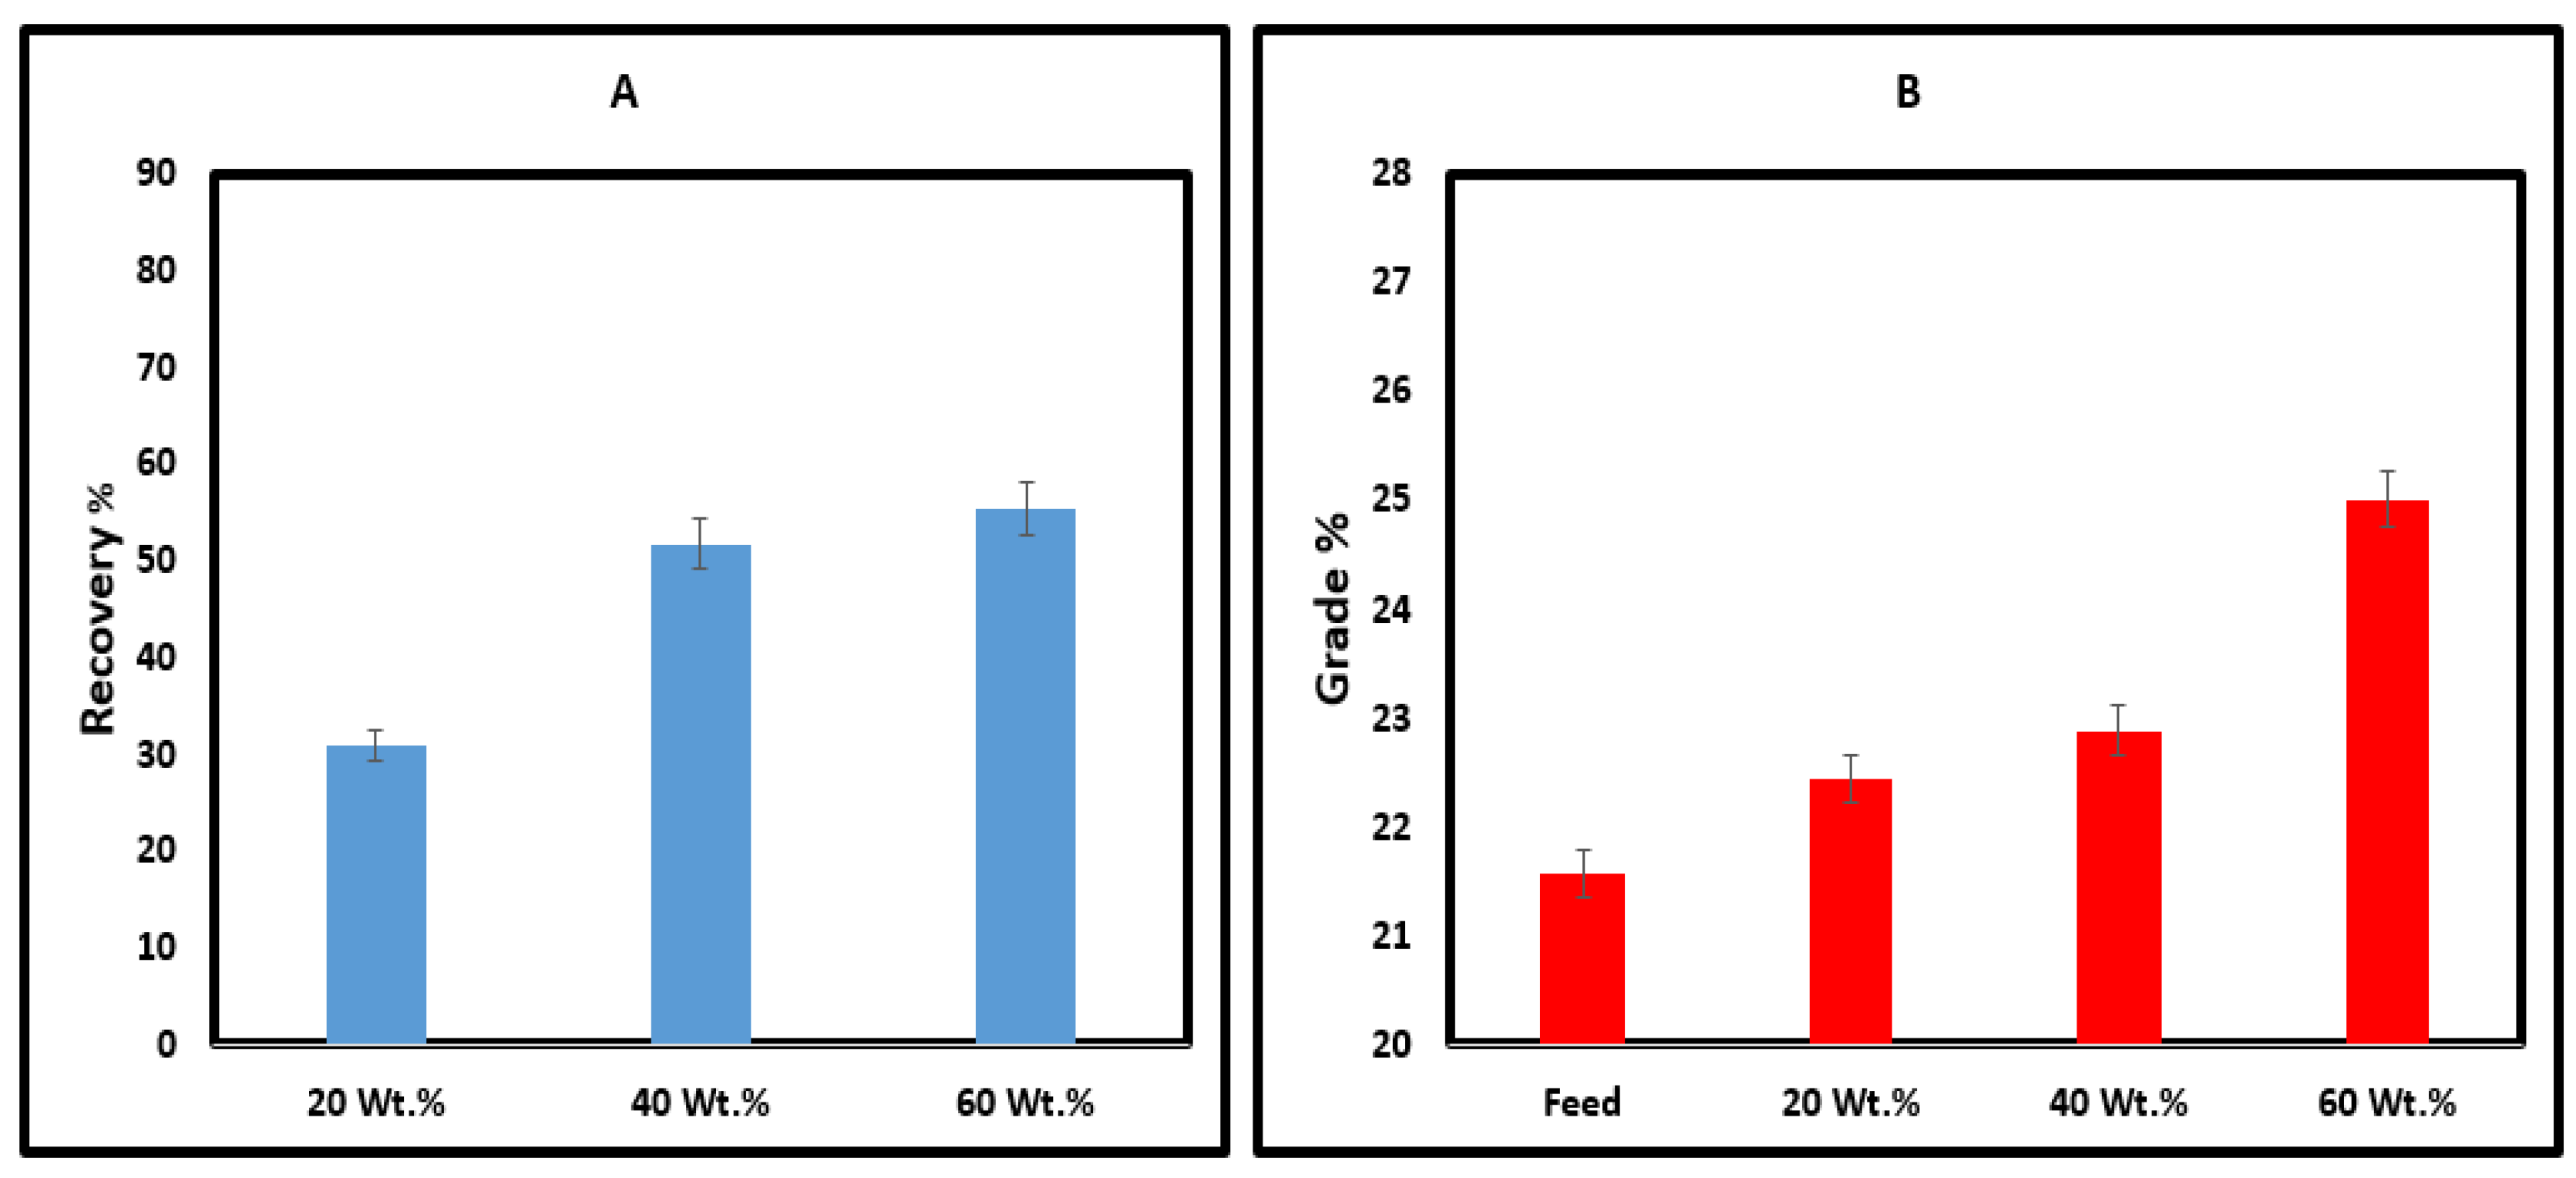
The effects of solid content of the pulp (pulp density) on the recovery of P2O5 and on the P2O5 grade of the concentrate products were examined at solid contents of 20 wt %, 40 wt % and 60 wt %. In this set of experiments, the collector, the dispersant, and the frothing agent were sequentially added to the feed at the specified solid percentage value at pH 9. The froth was collected over a period of 10 min. The average recovery of P2O5 was 30.88% at 20% solids, whereas the P2O5 grade was only at 22.4% compared with 21.57% in the feed. When the solids contents increased to 40 wt %, the average recovery of P2O5 increased to 51.7%, and the P2O5 grade increased to 22.88%. The best flotation performance was observed when solids contents were increased to 60 wt %. At this point, the average recovery of P2O5 was 55.4% and the grade of P2O5 increased from 21.57% in the feed to 25.01% in the concentrate products. The results are shown in Figure 11. Compared with the results obtained from baseline experiments (Figure 12), the recovery was lower when sodium silicate was used and unlike the baseline results, it tends to reach a maximum value with increasing the pulp density. As discussed earlier, reagents were added based on the weight of reagent per the weight of the ore. This means that when solid content was increased, the dispersant dosage was increased as well. The dispersant is anticipated to have a depressing effect on apatite especially at longer flotation time. Therefore, when more dispersant was added, more mineral particles were depressed. Thus, even though the froth is more stable at higher solid concentration due to the increased amount of frother, more of these solids were actually depressed by the dispersant.
Influence of Pulp pH at Different Flotation Time Intervals
The pH value of the pulp plays an important role in the froth flotation process because any small change of the pH value may alter the electrical characteristics of solids and reagents at different interfaces. Flotation experiments were conducted at a natural pulp pH of 6.87 and a pH 9 with 60 wt % at 4 and 10 min flotation time intervals. Froth was collected over 10 min. To increase the pulp pH to 9, sodium carbonate was used. The results are shown in Figure 13. The average recovery of P2O5 at natural pH at 10 min residence time was 72.69%, whereas the P2O5 grade of the concentrate increased to approximately 22% from that of the feed. However, when the pulp pH increased to 9 by using sodium carbonate, the average P2O5 grade increased to 25% at a 55.4% recovery. The froth was collected at 4 min at which the average recovery of P2O5 at natural pH was 70.1%, whereas the P2O5 grade of the concentrate increased to 22% from that of the feed. However, when the pulp pH increased to 9, the average P2O5 grade increased to 28.4% at a 73.86% recovery. Sodium carbonate was anticipated to have a depressing effect on apatite because it had adsorptive properties, thereby rendering it more hydrophilic. However, the concentrate grade was slightly better at pH 9.
4. Conclusions
This study investigated the potential to upgrade the P2O5 content in tailings produced from phosphorus production plant using direct froth flotation process. Bench scale flotation tests were carried out using a Denver D-12 flotation cell. Several parameters, such as the solids contents of flotation pulp, pulp pH and flotation time were investigated to optimize froth recovery and grade. The following conclusions may be drawn from this study:
- Zeta potential measurement performed on pure apatite and quartz suspensions before and after mixing with different reagents indicated that the collector had preferential adsorption on apatite surfaces rather than on quartz surfaces. Zeta potential measurements also revealed that the sequence of addition of chemical reagents could dramatically affect the flotation outcomes.
- The study showed that pH value impacted the flotation performance. The recovery and grade of P2O5 in the concentrate products improved when the pH was increased to 9 as compared to natural pH of 6.87.
- For baseline experiments when no dispersant was added, the best flotation performance was observed at 60% feed solids and 10 min of pulp residence time when the pH of the pulp was increased to 9. Under these conditions, the average recovery of P2O5 was 77%, and the grade of P2O5 increased from 21.57% in the feed to 23.3% in the concentrate products.
- When sodium silicate was used as a dispersant, the best flotation performance was observed at 60% feed solids and 4 min residence time at pH 9. Under these conditions, the accumulated recovery of P2O5 was 73.86%, and the grade of P2O5 increased from 21.57% in the feed to 28.4% in the concentrate products.
- Sodium silicate dispersant helped to significantly improve the flotation outcomes at shorter flotation time, which is critical at industrial scale where the energy consumption is a determinant factor to assess the economic feasibility of flotation processes. At shorter flotation time of 4 min, the addition of sodium silicate at pH 9 increased the grade of concentrates to 28.4% as compared to 23.3% in baseline experiment without affecting the recovery. As indicated, the recoveries of phosphate minerals in concentrate products were 74% in the baseline experiment as compared to and 73.88% when sodium silicate was used.
Author Contributions
Lana Alagha is the corresponding author and the project supervisor. Lana Alagha and Ashraf Alsafasfeh conceived and designed the experiments; Ashraf Alsafasfeh performed the experiments; both authors analyzed the data; Ashraf Alsafasfeh wrote the paper under Lana Alagha’s guidance and supervision.
Conflicts of Interest
The authors declare no conflict of interest.
References
- Cordell, D.; Drangert, J.O.; White, S. The story of phosphorus: Global food security and food for thought. Glob. Environ. Chang. 2009, 19, 292–305. [Google Scholar] [CrossRef]
- Vaneeckhaute, C.; Janda, J.; Vanrolleghem, P.A.; Filip, M.G.; Meers, E. Phosphorus use efficiency of bio-based fertilizers: Bioavailability and fractionation. Pedosphere 2016, 26, 310–325. [Google Scholar] [CrossRef]
- Holmes, G.G.; Lishmund, S.R.; Oakes, G.M. A Review of Industrial Minerals and Rocks in New South Wales; Geological Survey of New South Wales: New South Wales, Australia, 1982.
- De-Bashan, L.E.; Bashan, Y. Recent advances in removing phosphorus from wastewater and its future use as fertilizer (1997–2003). Water Res. 2004, 38, 4222–4246. [Google Scholar] [CrossRef] [PubMed]
- Sørensen, B.L.; Dall, O.L.; Habib, K. Environmental and resource implications of phosphorus recovery from waste activated sludge. Waste Manag. 2015, 45, 391–399. [Google Scholar] [CrossRef] [PubMed]
- Abouzeid, A.Z.M. Physical and thermal treatment of phosphate ores—An overview. Int. J. Miner. Process. 2008, 85, 59–84. [Google Scholar] [CrossRef]
- Issahary, D.; Pelly, I. Phosphate beneficiation by calcination. Prediction of P2O5 in the product, mining and plant control. Int. J. Miner. Process. 1985, 15, 219–230. [Google Scholar] [CrossRef]
- Sadeddin, W.; Abu-Eishah, S.I. Minimization of free calcium carbonate in hard and medium-hard phosphate rocks using dilute acetic acid solution. Int. J. Miner. Process. 1990, 30, 113–125. [Google Scholar] [CrossRef]
- Singh, R.; Sankar, T.A.P. Selective flotation of Maton (India) phosphate ore slimes with particular reference to the effects of particle size. Int. J. Miner. Process. 1992, 36, 283–293. [Google Scholar] [CrossRef]
- Sultonov, B.E.; Namazov, S.S.; Zakirov, B.S. Chemical enrichment of low-grade phosphorites of Central Kyzyl Kum. J. Chem. Technol. Metall. 2014, 49, 288–292. [Google Scholar]
- Sis, H.; Chander, S. Reagents used in the flotation of phosphate ores: A critical review. Miner. Eng. 2003, 16, 577–585. [Google Scholar] [CrossRef]
- Liu, X.; Zhang, Y.; Liu, T.; Cai, Z.; Chen, T.; Sun, K. Beneficiation of a Sedimentary Phosphate Ore by a Combination of Spiral Gravity and Direct-Reverse Flotation. Minerals 2016, 6, 38. [Google Scholar] [CrossRef]
- Houot, R. Beneficiation of phosphatic ores through flotation: Review of industrial applications and potential developments. Int. J. Miner. Process. 1982, 9, 353–384. [Google Scholar] [CrossRef]
- Althyabat, S.; Yoon, R.-H. Flotability of fine phosphates in a batch column flotation cell. Min. Metall. Process. 2011, 28, 110–116. [Google Scholar]
- Miller, J.D.; Liu, N.; Lu, Y. Improved Phosphate Flotation with Nonionic Polymers; Florida Institute of Phosphate Research: Bartow, FL, USA, 2001. [Google Scholar]
- Miller, J.D.; Wang, X.; Li, M. A Selective Collector for Phosphate Flotation; Florida Institute of Phosphate Research: Bartow, FL, USA, 2002. [Google Scholar]
- Lu, Y.; Liu, N.; Wang, X.; Miller, J.D. Improve Phosphate Flotation-Nonionic Polymers. In Beneficiation of Phosphates: Advances in Research and Practice; Zhang, P., El-Shall, H., Wiegel, R., Eds.; Society for Mining, Metallurgy & Exploration (SME): Englewood, CO, USA, 1999; pp. 3–19. [Google Scholar]
- Yehia, A.; Youseff, M.A.; Boulos, T.R. Different alternatives for minimizing the collector consumption in phosphate fatty acid flotation. Miner. Eng. 1990, 3, 273–278. [Google Scholar] [CrossRef]
- Peleka, E.N.; Mavros, P.P.; Zamboulis, D.; Matis, K.A. Removal of phosphates from water by a hybrid flotation–membrane filtration cell. Desalination 2006, 198, 198–207. [Google Scholar] [CrossRef]
- Wang, X.R. Study on the Flotation Process of Low Grade Phosnhorite; Wuhan University of Technology: Wuhan, China, 2005; pp. 1–11. [Google Scholar]
- Kawatra, S.K.; Carlson, J.T. Beneficiation of Phosphate Ore; Society for Mining, Metallurgy & Exploration (SME): Englewood, CO, USA, 2013. [Google Scholar]
- Santana, R.C.; Farnese, A.C.; Fortes, M.C.; Ataíde, C.H.; Barrozo, M.A. Influence of particle size and reagent dosage on the performance of apatite flotation. Sep. Purif. Technol. 2008, 64, 8–15. [Google Scholar] [CrossRef]
- Zhang, L. Enhanced Phosphate Flotation Using Novel Depressants. Master’s Thesis, University of Kentucky, Lexington, KY, USA, 2013. [Google Scholar]
- Kou, J.; Tao, D.; Xu, G. Fatty acid collectors for phosphate flotation and their adsorption behavior using QCM-D. Int. J. Miner. Process. 2010, 95, 1–9. [Google Scholar] [CrossRef]
- Abouzeid, A.Z.; Negm, A.T.; Elgillani, D.A. Upgrading of calcareous phosphate ores by flotation: Effect of ore characteristics. Int. J. Miner. Process. 2009, 90, 81–89. [Google Scholar] [CrossRef]
- Kaya, A.; Yukselen, Y. Zeta potential of clay minerals and quartz contaminated by heavy metals. Can. Geotech. J. 2005, 42, 1280–1289. [Google Scholar] [CrossRef]
- Somasundaran, P. Zeta potential of apatite in aqueous solutions and its change during equilibration. J. Colloid Interface Sci. 1968, 27, 659–666. [Google Scholar] [CrossRef]
Figure 1.
Distribution of phosphate minerals in different size fractions of the tailing samples as determined by XRD.
Figure 1.
Distribution of phosphate minerals in different size fractions of the tailing samples as determined by XRD.

Figure 2.
Distribution of minerals in different size fractions of the tailing samples as determined by MLA.
Figure 2.
Distribution of minerals in different size fractions of the tailing samples as determined by MLA.

Figure 3.
Particle size distribution of the flotation feed.

Figure 4.
SEM micrographs of the flotation feed at 100 μm.

Figure 5.
Classified MLA image of flotation feed (74 × 37 µm2) showing mineral associations in the grains. Particle inset units are in pixels concentration palette values are in area percentage.
Figure 5.
Classified MLA image of flotation feed (74 × 37 µm2) showing mineral associations in the grains. Particle inset units are in pixels concentration palette values are in area percentage.

Figure 6.
Zeta potential of apatite and quartz dispersions as a function of pH.

Figure 7.
Zeta potential of (A) apatite and (B) quartz before and after mixing with different reagents at pH 9.
Figure 7.
Zeta potential of (A) apatite and (B) quartz before and after mixing with different reagents at pH 9.

Figure 8.
Zeta potential of apatite before and after mixing with flotation reagents at pH 9.

Figure 9.
(A) Flotation recovery and (B) P2O5 grade (%) of concentrate products obtained from baseline experiments.
Figure 9.
(A) Flotation recovery and (B) P2O5 grade (%) of concentrate products obtained from baseline experiments.

Figure 10.
(A) Flotation recovery and (B) P2O5 grade (%) of concentrate products obtained from baseline experiments at different solid content.
Figure 10.
(A) Flotation recovery and (B) P2O5 grade (%) of concentrate products obtained from baseline experiments at different solid content.

Figure 11.
(A) Flotation recovery and (B) P2O5 grade (%) at different percentages of pulp solids (wt %) in the presence of sodium silicate dispersant.
Figure 11.
(A) Flotation recovery and (B) P2O5 grade (%) at different percentages of pulp solids (wt %) in the presence of sodium silicate dispersant.

Figure 12.
Comparison of flotation outcomes at 60 wt % experimental condition. (A) Recovery of P2O5 and (B) grade of P2O5.
Figure 12.
Comparison of flotation outcomes at 60 wt % experimental condition. (A) Recovery of P2O5 and (B) grade of P2O5.

Figure 13.
(A) Flotation recovery and (B) P2O5 grade (%) at different pH values in the presence of sodium silicate dispersant.
Figure 13.
(A) Flotation recovery and (B) P2O5 grade (%) at different pH values in the presence of sodium silicate dispersant.


Table 1.
Different conditions tested in the flotation of phosphate tailings.
| Experiment Conditions | Reagents’ Dosages | |||||
|---|---|---|---|---|---|---|
| Experiment | Variable Conditions | Collector (g/ton) | Frother (g/ton) | Dispersant (g/ton) | Fixed Conditions | |
| Baseline experiments (Collector and Frother) | Effect of solid content | 20 wt % | 200 | 63.5 | 0 | Flotation time: 10 min pH~9 Air@ 10 L/min |
| 40 wt % | ||||||
| 60 wt % | ||||||
| Effect of pulp pH | Natural pH (6.87) | 200 | 63.5 | 0 | Flotation time: 10 min Solid content: 60 wt % Air@ 10 L/min | |
| pH 9 | ||||||
| Effect of flotation time | 10 min | 200 | 63.5 | 0 | Solid content: 60 wt % pH~9 Air@ 10 L/min | |
| 4 min | ||||||
| Flotation experiments with dispersant | Effect of solid content | 20 wt % | 200 | 63.5 | 250 | Flotation time: 10 min pH~9 Air@ 10 L/min |
| 40 wt % | ||||||
| 60 wt % | ||||||
| Effect of pulp pH | Natural pH (6.87) | 200 | 63.5 | 250 | Flotation time: 10 min Solid content: 60 wt % Air@ 10 L/min | |
| pH 9 | ||||||
| Effect of flotation time | 10 min | 200 | 63.5 | 250 | Solid content: 60 wt % pH~9 Air@ 10 L/min | |
| 4 min | ||||||
© 2017 by the authors. Licensee MDPI, Basel, Switzerland. This article is an open access article distributed under the terms and conditions of the Creative Commons Attribution (CC BY) license (http://creativecommons.org/licenses/by/4.0/).
Share and Cite
MDPI and ACS Style
Alsafasfeh, A.; Alagha, L. Recovery of Phosphate Minerals from Plant Tailings Using Direct Froth Flotation. Minerals 2017, 7, 145. https://doi.org/10.3390/min7080145
AMA Style
Alsafasfeh A, Alagha L. Recovery of Phosphate Minerals from Plant Tailings Using Direct Froth Flotation. Minerals. 2017; 7(8):145. https://doi.org/10.3390/min7080145
Chicago/Turabian StyleAlsafasfeh, Ashraf, and Lana Alagha. 2017. "Recovery of Phosphate Minerals from Plant Tailings Using Direct Froth Flotation" Minerals 7, no. 8: 145. https://doi.org/10.3390/min7080145
Note that from the first issue of 2016, this journal uses article numbers instead of page numbers. See further details here.