
Crystal Chemistry and Stability of Hydrated Rare-Earth Phosphates Formed at Room Temperature

Department of Chemistry, Kyushu University, 744 Motooka, Nishi-ku, Fukuoka 819-0395, Japan
*
Author to whom correspondence should be addressed.
Minerals 2017, 7(5), 84; https://doi.org/10.3390/min7050084
Submission received: 29 April 2017
/
Revised: 15 May 2017
/
Accepted: 17 May 2017
/
Published: 19 May 2017
(This article belongs to the Special Issue Nucleation of Minerals: Precursors, Intermediates and Their Use in Materials Chemistry)
Abstract
:In order to understand the crystal chemical properties of hydrous rare-earth (RE) phosphates, REPO4,hyd, that form at ambient temperature, we have synthesized REPO4,hyd through the interaction of aqueous RE elements (REEs) with aqueous P at room temperature at pH < 6, where the precipitation of RE hydroxides does not occur, and performed rigorous solid characterization. The second experiment was designed identically except for using hydroxyapatite (HAP) crystals as the P source at pH constrained by the dissolved P. Hydrated RE phosphate that precipitated at pH 3 after 3 days was classified into three groups: LREPO4,hyd (La → Gd) containing each REE from La-Gd, MREPO4,hyd (Tb → Ho), and HREPO4,hyd (Er → Lu). The latter two groups included increasing fractions of an amorphous component with increasing ionic radius, which was associated with non-coordinated water. REallPO4,hyd that contains all lanthanides except Pm transformed to rhabdophane structure over 30 days of aging. In the experiments using HAP, light REEs were preferentially distributed into nano-crystals, which can potentially constrain initial RE distributions in aqueous phase. Consequently, the mineralogical properties of hydrous RE phosphates forming at ambient temperature depend on the aging, the pH of the solution, and the average ionic radii of REE, similarly to the well-crystalline RE phosphates.
1. Introduction
Rare-earth (RE) elements (REEs), such as the lanthanides (La-Lu), are important rare metals in geological resources, and commonly used for technological application owing to their fluorescent, catalytic, and magnetic properties [1]. REEs are also potential fission products and used as surrogates for trivalent actinides in various experimental studies in nuclear chemistry [2,3,4]. Among a variety of REE-bearing minerals, RE phosphate is one of the important REE hosts that have further applications to phosphors, though post-heat treatment is required [1].
Crystalline RE phosphates occur in four different structures: monazite (light REPO4; P21/n), rhabdophane (light REPO4·nH2O; P6222 or C2), xenotime (heavy REPO4; I41/amd), and churchite (heavy REPO4·nH2O; I2/a) [5,6,7,8]. In the crust (granite, metamorphic and/or metasomatic rocks, and pegmatite), monazite and xenotime are the stable phases for light REE and heavy REE, respectively, while rhabdophane and churchite occurrences are almost exclusively encountered in soil [9,10,11,12,13].
The structure depends on physico-chemical parameters such as pH, reaction time, and temperature [14,15,16]. Ionic radii also influence the crystal structure and morphology. Although the previous studies have reported on the mineralogical properties of all four types of RE phosphates and their application to accommodate foreign cations [17,18], these studies were mainly concerned with the well-crystalline phase formed at elevated temperatures at acidic pH ~1, e.g., [16,19]. The crystal chemical property of the hydrous RE phosphates that formed at ambient temperature has not been explored in detail. In addition, recent studies reported a novel synthesis of RE phosphate nanocrystals in P-free solution using microorganisms that release P from cell interiors at pH 3–5 at room temperature [20,21]; however, the electron diffraction pattern revealed vague patterns with diffused diffraction maxima owing to the presence of amorphous matter, which prevents the full identification of these nanoparticles. Hence, the first half of the present study reports a systematic characterization of hydrated RE phosphates, REPO4,hyd, that formed at ambient temperature to understand their crystal-chemical properties. The formation of RE hydroxides formation was suppressed by using the pH condition of <6 in the present experiment.
In geological media, RE phosphates occur primarily as an accessary mineral such as monazite and xenotime, and the secondary precipitates of RE phosphates such as rhabdophane frequently play a key role as an indicative of various geochemical signatures such as for estimating paleo-environment [22,23] and migration of actinides such as Pu in the Oklo natural fission reactor [17,18,24,25,26,27,28,29]. The secondary RE phosphates commonly occur in weathered profiles in association with original phosphate minerals, such as apatite, which acts as a source of phosphorus (P) and provides unique reaction interfaces for the formation of secondary phosphates such as epitaxial growth and pseudomorphism [30]; however, the effects of the substrates has not been evaluated for the formation of hydrous RE phosphate. Thus, the second half of the present study demonstrates the time-course of the formation process of hydrated RE phosphates, REPO4,hyd, over the HAP crystal at ambient temperatures at varying pHs constrained by dissolved phosphate to elucidate the evolution of secondary RE phosphate at the interfaces and the REE fractionation between solution and solid.
2. Materials and Methods
2.1. REPO4,hyd Precipitation from Aqueous Trivalent REE and Phosphate in Solution
In the present study, REi refers to phases containing individual La-Lu elements but excludes Pm, and REall refers to phases containing all La-Lu elements except for Pm. To simplify the discussion, Sc and Y were not included in the present experiment. A series of hydrated RE phosphates, REiPO4,hyd (where RE = La-Lu except for Pm) were synthesized from aqueous solutions. The reactants used as starting materials were La(NO3)3·6H2O (99.9%), Ce(NO3)3·6H2O (98%), Pr(NO3)3·xH2O (99.5%), Nd(NO3)3·6H2O (99.5%), Sm(NO3)3·6H2O (99.5%), Gd(NO3)3·6H2O (99.5%), Dy(NO3)3·6H2O (99.5%), Ho(NO3)3·xH2O (99.5%), Er(NO3)3·xH2O (99.5%), and Yb(NO3)3·xH2O (99.9%) supplied by Wako Pure Chemical (Osaka, Japan), Eu(NO3)3·6H2O (99.9%) and Tb(NO3)3·6H2O (99.9%) supplied by Strem Chemicals (Newburyport, MA, USA), Tm(NO3)3·xH2O (99.9%) supplied by Alfa Aesar (Ward Hill, MA, USA), and Lu(NO3)3·4H2O (99.95%) supplied by Kanto Chemical (Tokyo, Japan). A 0.1 mol·L−1 RE3+ solution was prepared for each REE by dissolving the reactants in ultrapure water (Milli-Q®, Merck Millipore, Billerica, MA, USA). The pH of each solution was adjusted to pH 3.0 ± 0.1 with NaOH and HNO3 using a pH meter (Toko TXP-999i, Tokyo, Japan) with an electrode (Toko PCE108CW-SR). The margin of error in the pH measurements was within 0.1 pH units. In addition, 10 mL of a 0.1 mol·L−1 NaH2PO4 (Wako Pure Chemical) aqueous solution adjusted to pH 9.0 ± 0.1 was added to 10 mL of a 0.1 mol·L−1 RE solution with continuous stirring, and the pH was adjusted to 3.0 ± 0.1. The solutions were shaken by a rotary shaker for 3 days at room temperature. The suspensions were filtered with an Omnipore membrane filter with a pore size of 0.1 µm (Merck Millipore JVWP04700, Billerica, MA, USA) and rinsed with ultrapure water. The precipitates were dried in air at room temperature. REallPO4,hyd was synthesized using the same procedure as REiPO4,hyd and a solution with a total RE concentration of 0.1 mol·L−1 (RE = La-Lu except Pm), in which the concentration of each REE was set to 7.1 mmol·L−1.
To evaluate the effects of crystal aging, REiPO4,hyd (RE = La, Tb, Dy, Ho, and Yb) and REallPO4,hyd were reacted for an extended duration ranging from 3 to 30 days. The effect of pH was examined in the case of LaPO4,hyd formation by varying the pH from 1 to 5. LaPO4,hyd was synthesized at pH 1 by pouring 10 mL of 0.1 mol·L−1 NaH2PO4 into 10 mL of 0.1 mol·L−1 La(NO3)3. The pH of the NaH2PO4 and La(NO3)3 solutions were adjusted beforehand to 9.0 ± 0.1 and 1.1, respectively, to account for the number of protons that would be released to the solution during the reaction. For synthesis at pH 5, 10 mL of 0.1 mol·L−1 NaH2PO4 was poured into 10 mL of 0.1 mol·L−1 La(NO3)3, for which the pH values were adjusted beforehand to 12.2 and 5.3, respectively. After mixing the solutions, the pH was subsequently adjusted again to 5.0 ± 0.1. The same incubation and filtration procedures were performed as for the other REiPO4,hyd phases.
Additional experiments were performed to investigate the thermal stability of REiPO4,hyd formed at room temperature. REiPO4,hyd (RE = Tb, Dy, Ho, and Yb) and REallPO4,hyd synthesized from a solution at pH 3 for 3 days were annealed at 70, 120, 200, 300, 400, or 500 °C for 1 h in a muffle furnace (Yamato Scientific FM38, Tokyo, Japan).
2.2. REPO4,hyd Formation on HAP Crystals
RE3+ solutions at a concentration of 2.0 mmol·L−1 (RE = La, Tb, Yb) were prepared by dissolving RE(NO3)3·nH2O in Milli-Q® water, which was adjusted to a pH of 5 using HNO3. 0.2 g of synthetic HAP in the form of Ca5(PO4)3OH powder (Wako Pure Chemical) was added to 100 mL of the RE3+ solutions at room temperature. The HAP grains are rod-shaped, with approximate dimensions of 1.5 µm × 300 nm and a specific surface area of 6.31 m2·g−1 [30]. The S/V ratio (where S is the apatite surface area and V is the volume of solution) was 1.3 × 102 cm−1 in these experiments. The suspensions of HAP powders were gently agitated using a magnetic stirrer for 1, 3, 9, and 24 h and 3 and 10 days. The solution pH was measured for each duration. The precipitate was collected by centrifugation at 3000 rpm for 10 min at 25 °C, washed with ultrapure water, and dried in air at room temperature. The supernatants remaining after centrifugation were filtered under reduced pressure with an Omnipore membrane filter with a pore size of 0.025 µm (Merck Millipore VSWP04700), which was small enough to separate the precipitates from the supernatant. REallPO4,hyd was also synthesized on HAP through the same procedure using a solution with a total RE concentration of 2.0 mmol·L−1 (RE = La-Lu except Pm), in which the concentration of each REE was 0.14 mmol·L−1.
2.3. Analytical Methods
The crystal structures of REiPO4,hyd (RE = La-Lu) and REallPO4,hyd prepared from solution at room temperature were determined using powder X-ray diffraction analysis (XRD, Rigaku MultiFlex, Tokyo, Japan or Rigaku SmartLab). The analysis was conducted using Cu Kα radiation (λ = 1.5418 Å) at 40 kV and 40 mA for the MultiFlex instrument, and at 40 kV and 30 mA for the SmartLab instrument in a scan range of 2θ = 10°–63° with a scan speed of 2° per min. A non-reflective silicon (111) holder was used to hold the specimens. The REPO4,hyd that formed on HAP crystals was analyzed using the SmartLab XRD in a scan range of 10°–50° using a SiO2 glass plate as a specimen holder. Each spectrum was smoothed with a modified Savitzky–Golay filter and the linear background was subtracted using JADE 7 software (Materials Data Incorporated, Livermore, CA, USA). Subsequently, peak separation and fitting were conducted using the same software to calculate the crystallite size from the Scherrer equation:
where D, K, λ, β, and θ refer to the crystallite size (Å), the Scherrer constant (in this study K = 0.9), the wavelength of X-rays (1.5418 Å), the full-width at half maximum of the peak (rad), and the Bragg angle at the peak (rad), respectively.
REiPO4,hyd (RE = La-Lu) and REallPO4,hyd prepared from solution at pH 3 for 3 days and 30 days were analyzed by Fourier transform infrared spectroscopy (FT-IR) using KBr disks (1 mg sample/100 mg KBr, 10 mm in diameter). Spectra were recorded at a resolution of 4 cm−1 by summation of 32 scans.
Thermogravimetry–differential thermal analysis (TG–DTA) was performed on REiPO4,hyd (RE = La-Lu) and REallPO4,hyd prepared from solution at pH 3 for a duration of 3 days. Furthermore, REiPO4,hyd (RE = La, Tb, Yb) and REallPO4,hyd were reacted at pH 3 for 30 days and were analyzed to investigate the effect of aging. Each specimen was heated to 500 °C at a heating rate of 10 °C/min and then held for 10 min at 500 °C under a nitrogen gas flow of 250 mL/min using α-alumina as a reference material (Hitachi TG/DTA7300, Tokyo, Japan).
The supernatant after filtration was analyzed to obtain the concentrations of RE (RE = La-Lu), Ca, and P using inductively coupled plasma atomic emission spectroscopy (ICP-AES, PerkinElmer Optima 530 DV, Waltham, MA, USA).
High-resolution transmission electron microscopy (HRTEM), selected-area electron diffraction (SAED), high-angle annular dark-field scanning transmission electron microscopy (HAADF-STEM), and energy dispersive X-ray spectroscopy (EDS) were performed for all precipitate samples obtained in the syntheses using a JEOL JEM-ARM200F (Tokyo, Japan) with an accelerating voltage of 200 kV. The spherical aberration coefficient Cs is ~0 mm. The contrast in HAADF-STEM mode correlates with the mass and thickness of the target material [31]. TEM specimens were prepared by placing drops of a suspension of the synthesized precipitates onto a holey carbon mesh supported by a Cu grid.
3. Results
3.1. XRD Analysis
XRD patterns for REiPO4,hyd (RE = La-Lu except Pm) and REallPO4,hyd reacted at pH 3 for 3 days are shown in Figure 1a. The peak positions of REiPO4,hyd (RE = La-Gd except Pm) correspond well, with a slight peak shift, to the structure of rhabdophane [8]. The patterns for REiPO4,hyd (RE = Tb-Lu) and REallPO4,hyd could not be identified due to the broadened peaks and lack of matching structures. Although a few of the REiPO4,hyd (RE = Er-Lu) peaks appear to be similar to those of xenotime [5], the patterns lack a (200) peak and, thus, the structures were not determined convincingly. Furthermore, the patterns for REiPO4,hyd (RE = Tb-Ho) display intermediate profiles between those of REiPO4,hyd (RE = La-Gd except Pm) and REiPO4,hyd (RE = Er-Lu). Based on the structural characteristics indicated by XRD analysis in this study, the structure of the REiPO4,hyd precipitates are classified as LREPO4,hyd for phases containing RE = La-Gd, MREPO4,hyd containing RE = Tb-Ho, and HREPO4,hyd containing RE = Er-Lu, respectively. In LREPO4,hyd, which has a rhabdophane structure, the coordination numbers (CNs) of RE3+ ions are one third eight-fold and two-thirds nine-fold [8], resulting in an average CN of 8.7. RE3+ in MREPO4,hyd and HREPO4,hyd can be considered to have eight-fold coordination because the CN of xenotime and churchite is eight-fold. Based on the CNs of all possible REiPO4,hyd phases, the average ionic radius of REallPO4,hyd containing all RE (RE = La-Lu except Pm) is calculated to be 1.07 Å, which lies just between that of Gd (CN = 8.7, 1.09 Å) and of Tb (CN = 8, 1.04 Å) [32].
The XRD pattern of REallPO4,hyd correlates to a combination of the GdPO4,hyd and TbPO4,hyd patterns. A linear combination of these two profiles indicates volume fractions of 35% GdPO4,hyd structure and 65% TbPO4,hyd structure (Figure 1b).
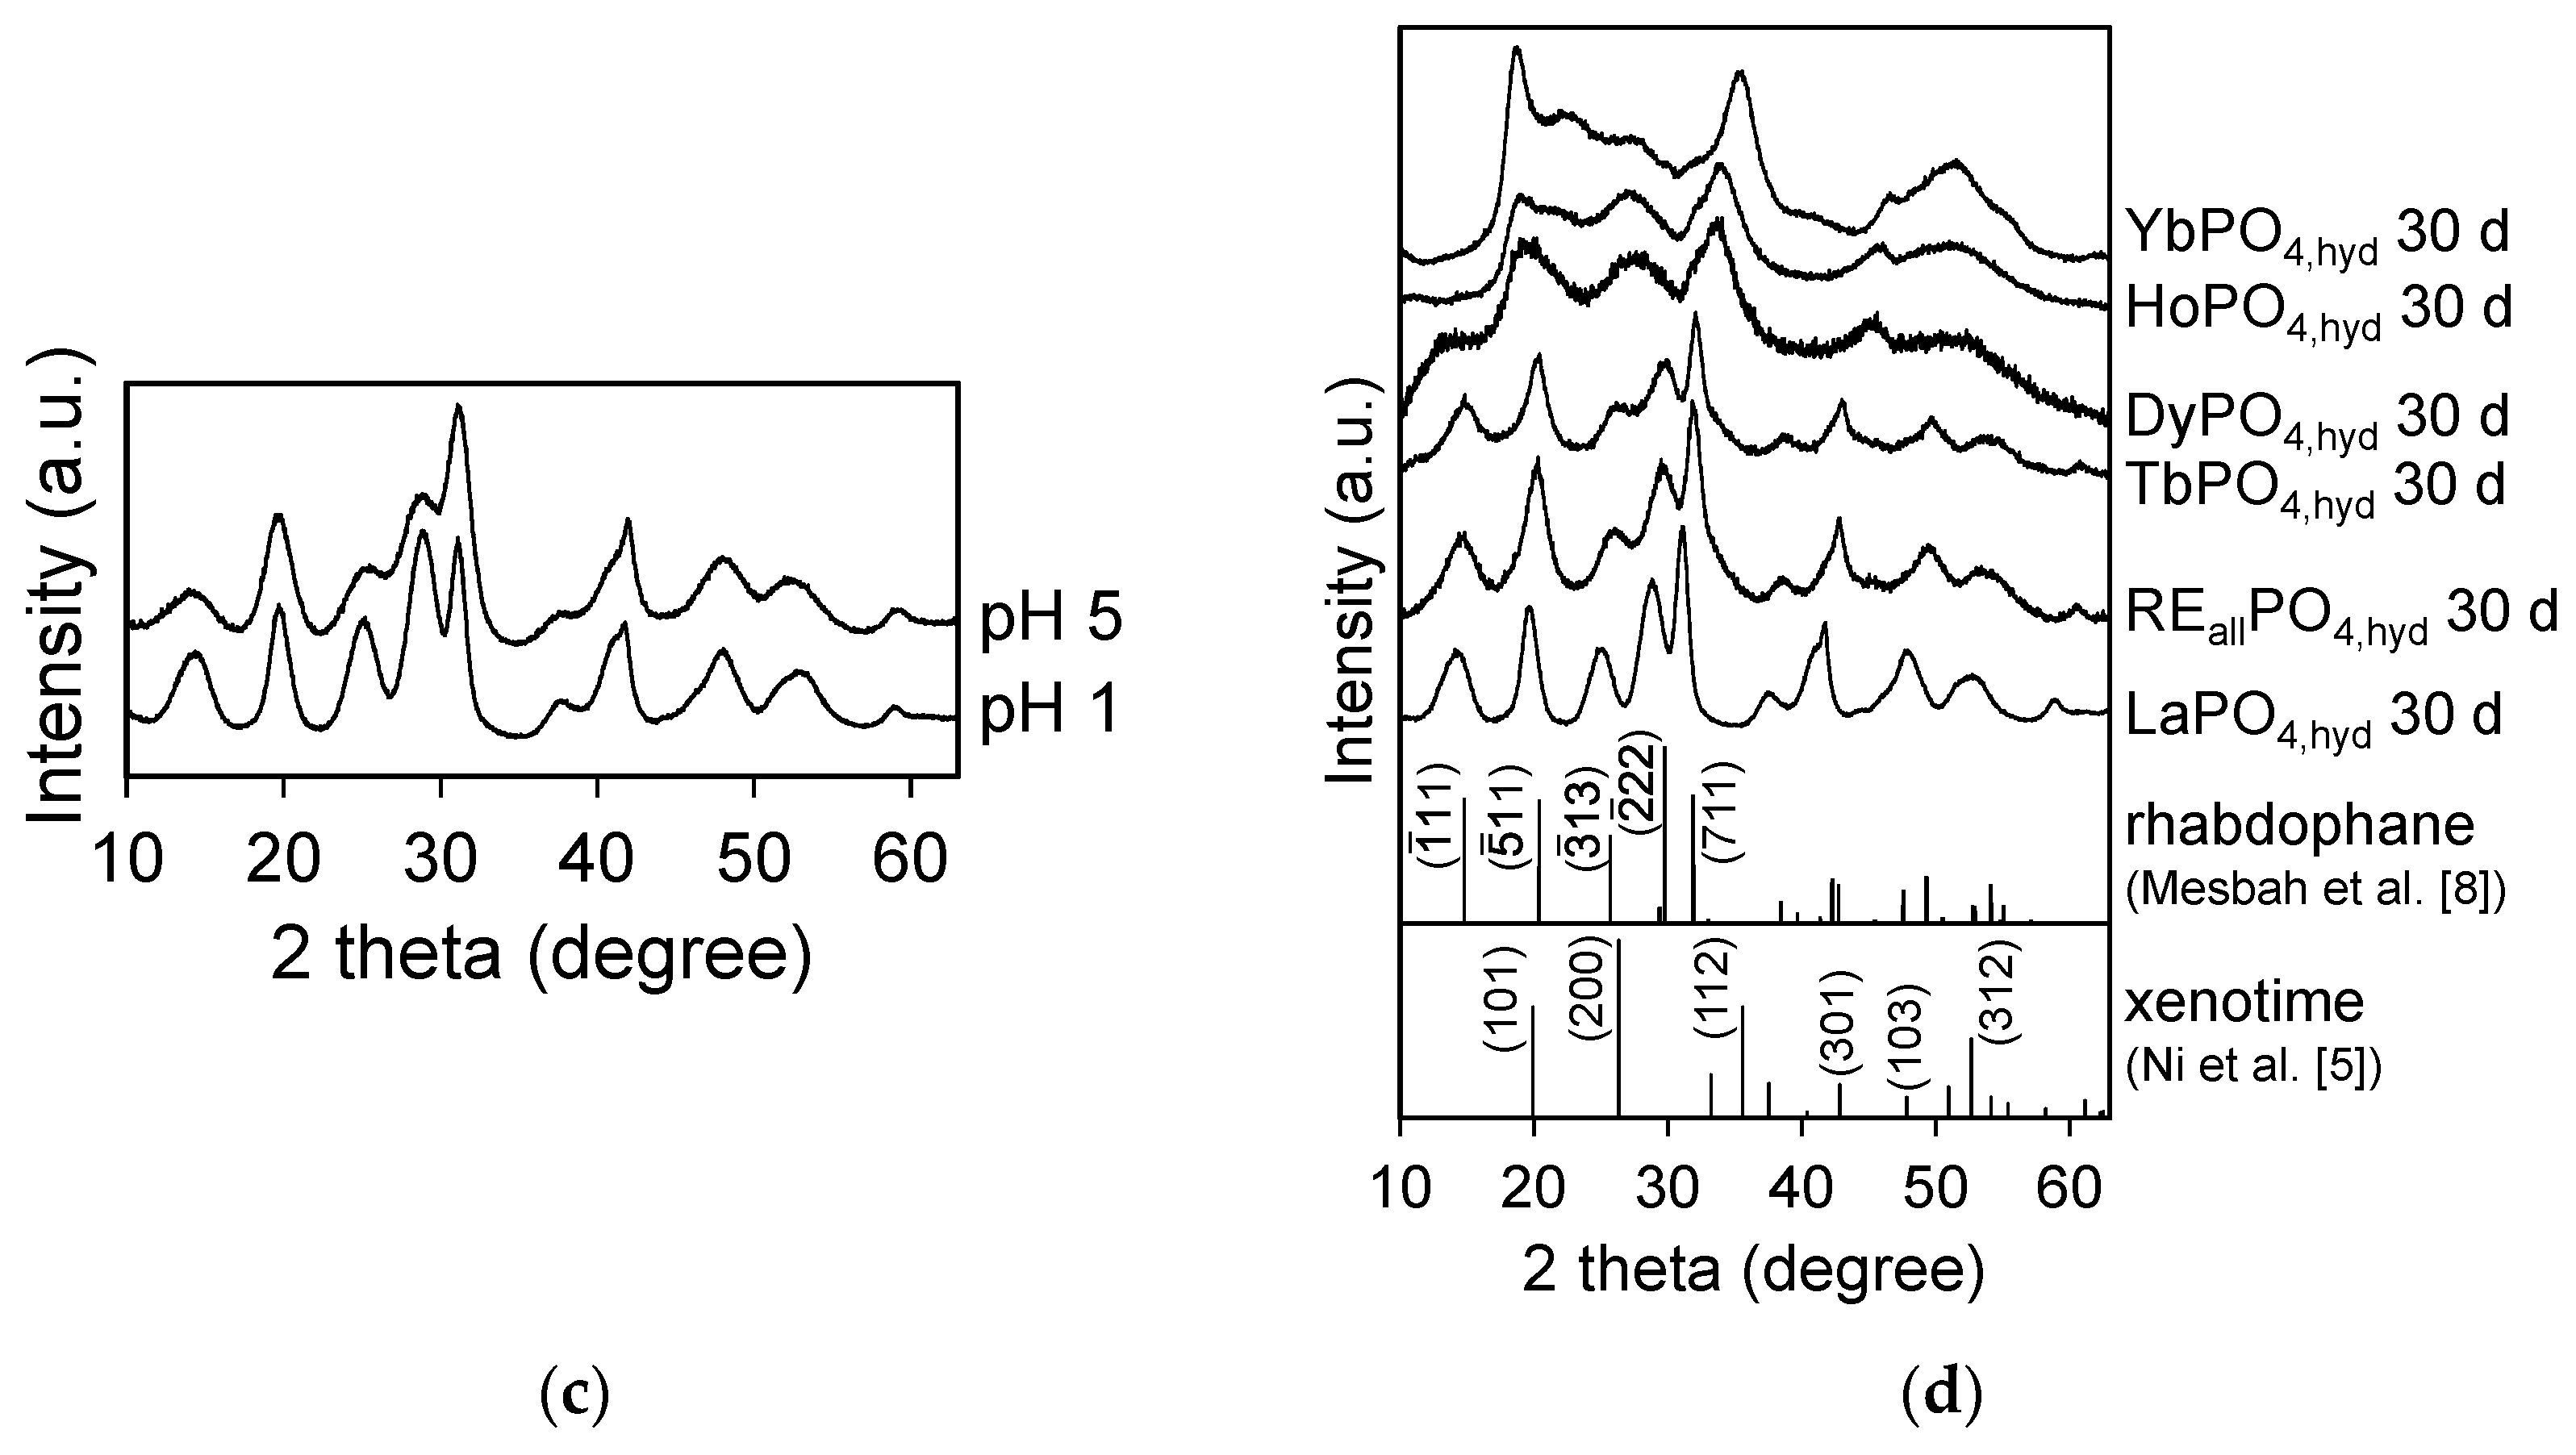
The effect of pH on LaPO4,hyd precipitates are shown in Figure 1a,c. The full width at half maximum (FWHM) of each peak becomes smaller as the pH lowers.
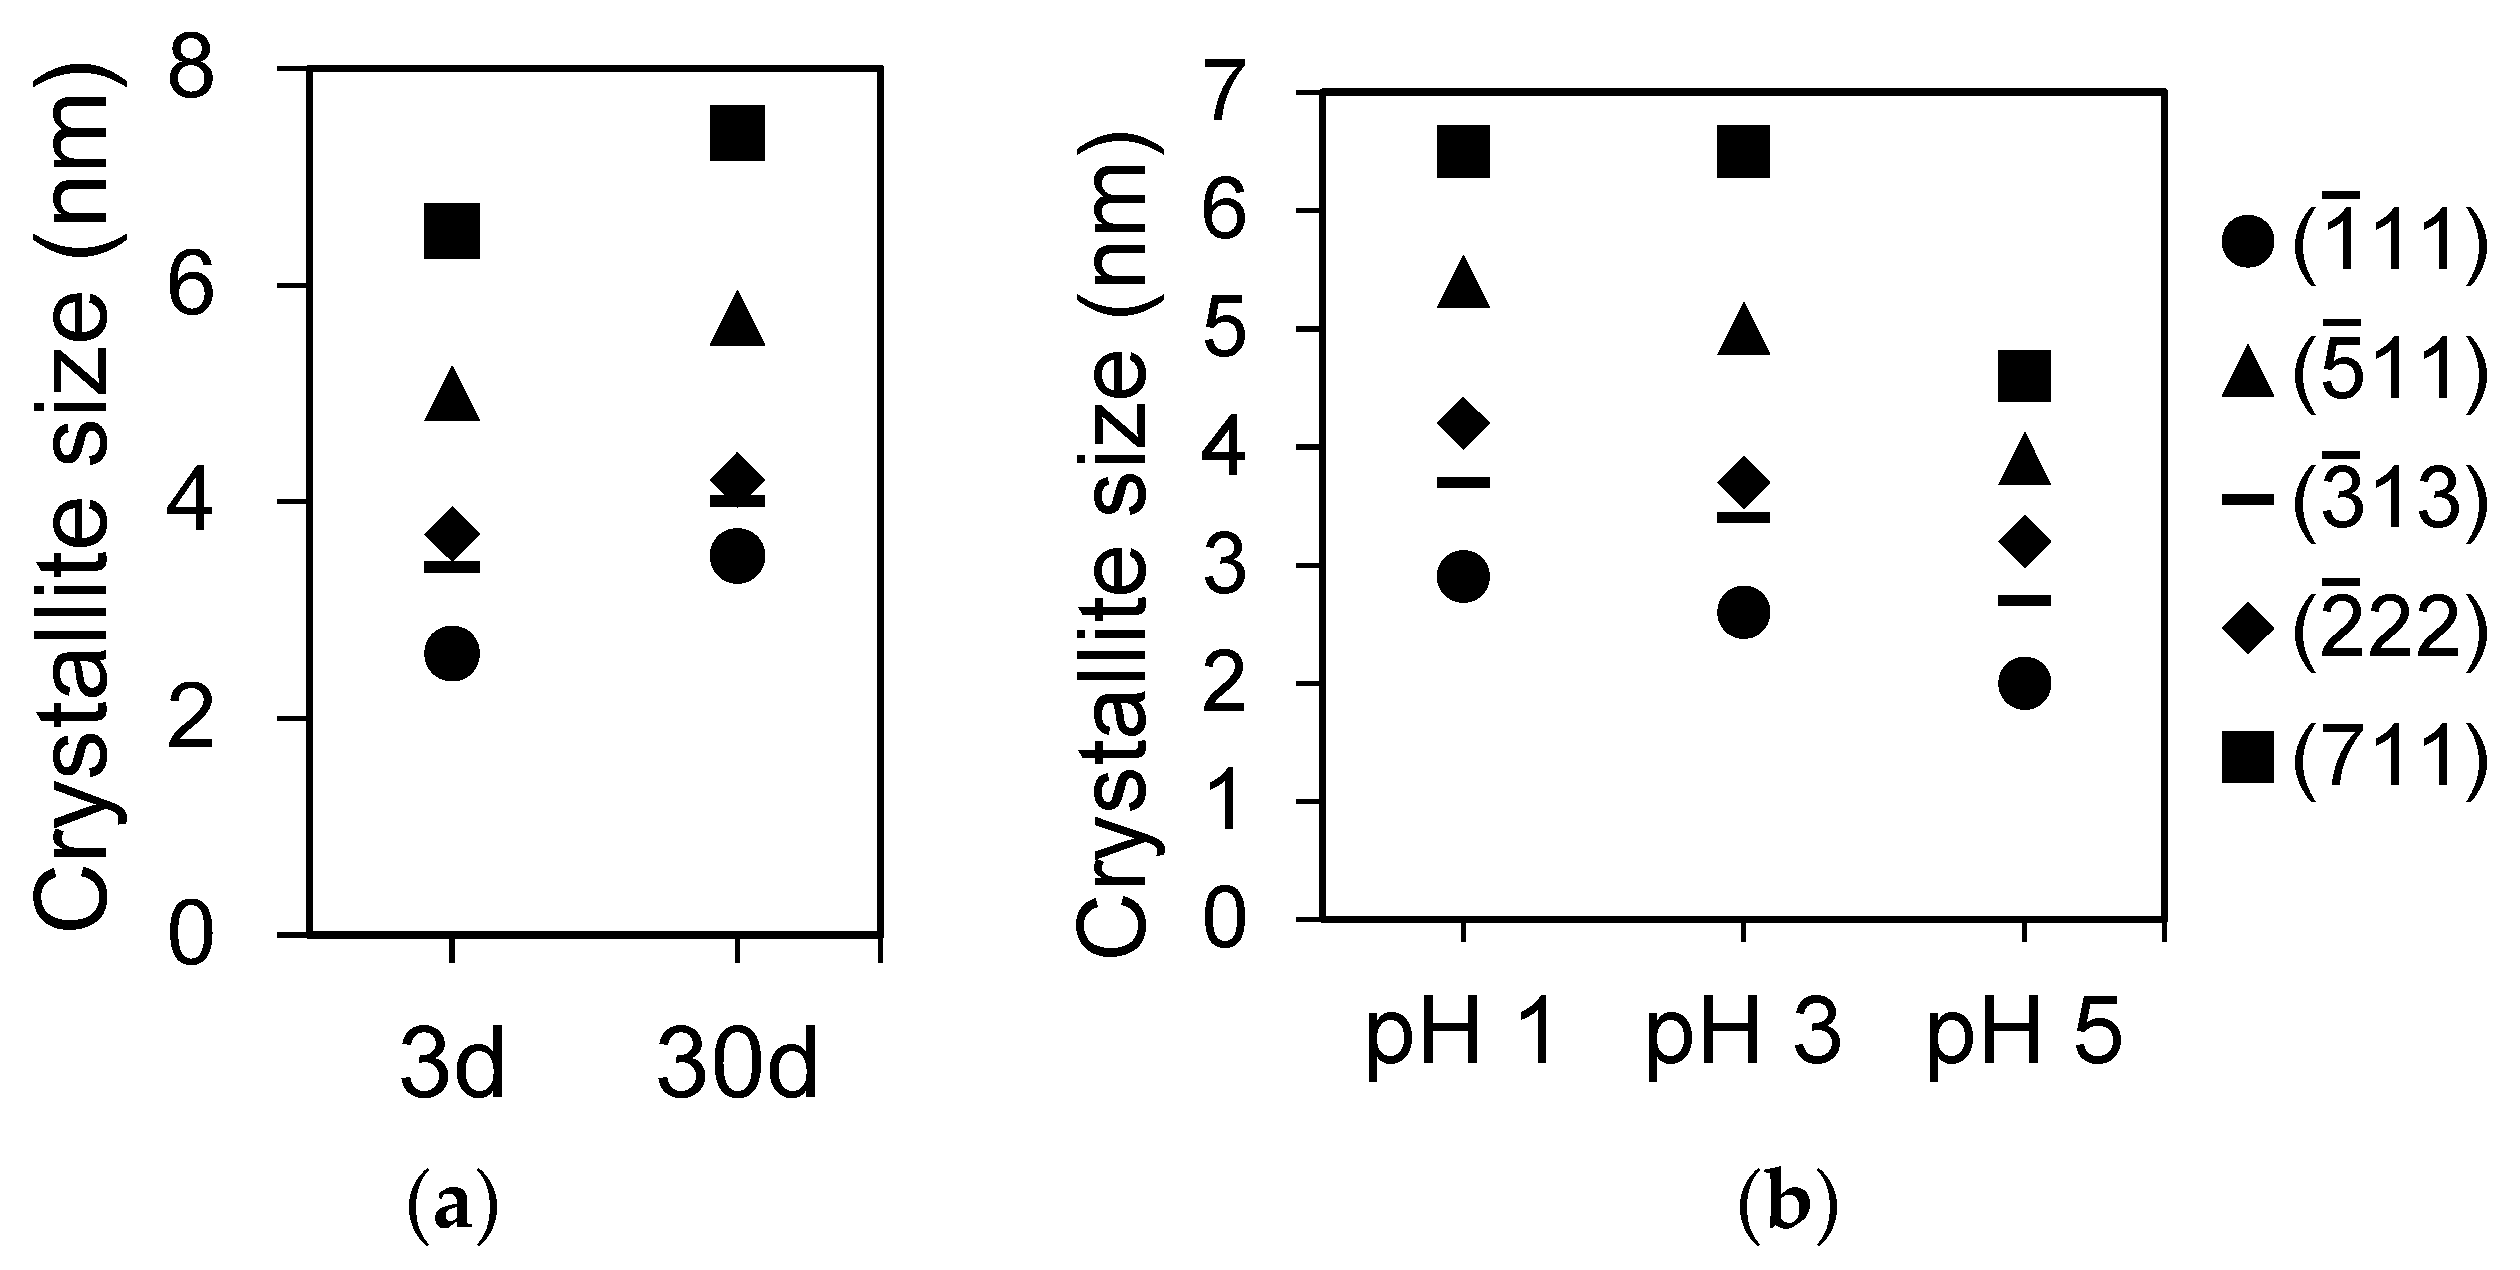
In the aging experiments, there was little difference in the XRD profiles between 3 and 30 days for REiPO4,hyd (RE = La, Dy, Ho, and Yb); however, the structures of REallPO4,hyd and TbPO4,hyd changed significantly to become rhabdophane-structured after 30 days of aging (Figure 1a,d). In the DyPO4,hyd pattern, a small peak corresponding to the (11) plane of rhabdophane appeared after 30 days of reaction, although the other peaks remained unchanged. The crystallite sizes of LaPO4,hyd calculated on the basis of the XRD patterns in Figure 1 using Scherrer equation are clearly a function of pH and the aging period (Figure 2a,b) and are summarized in Table 1.
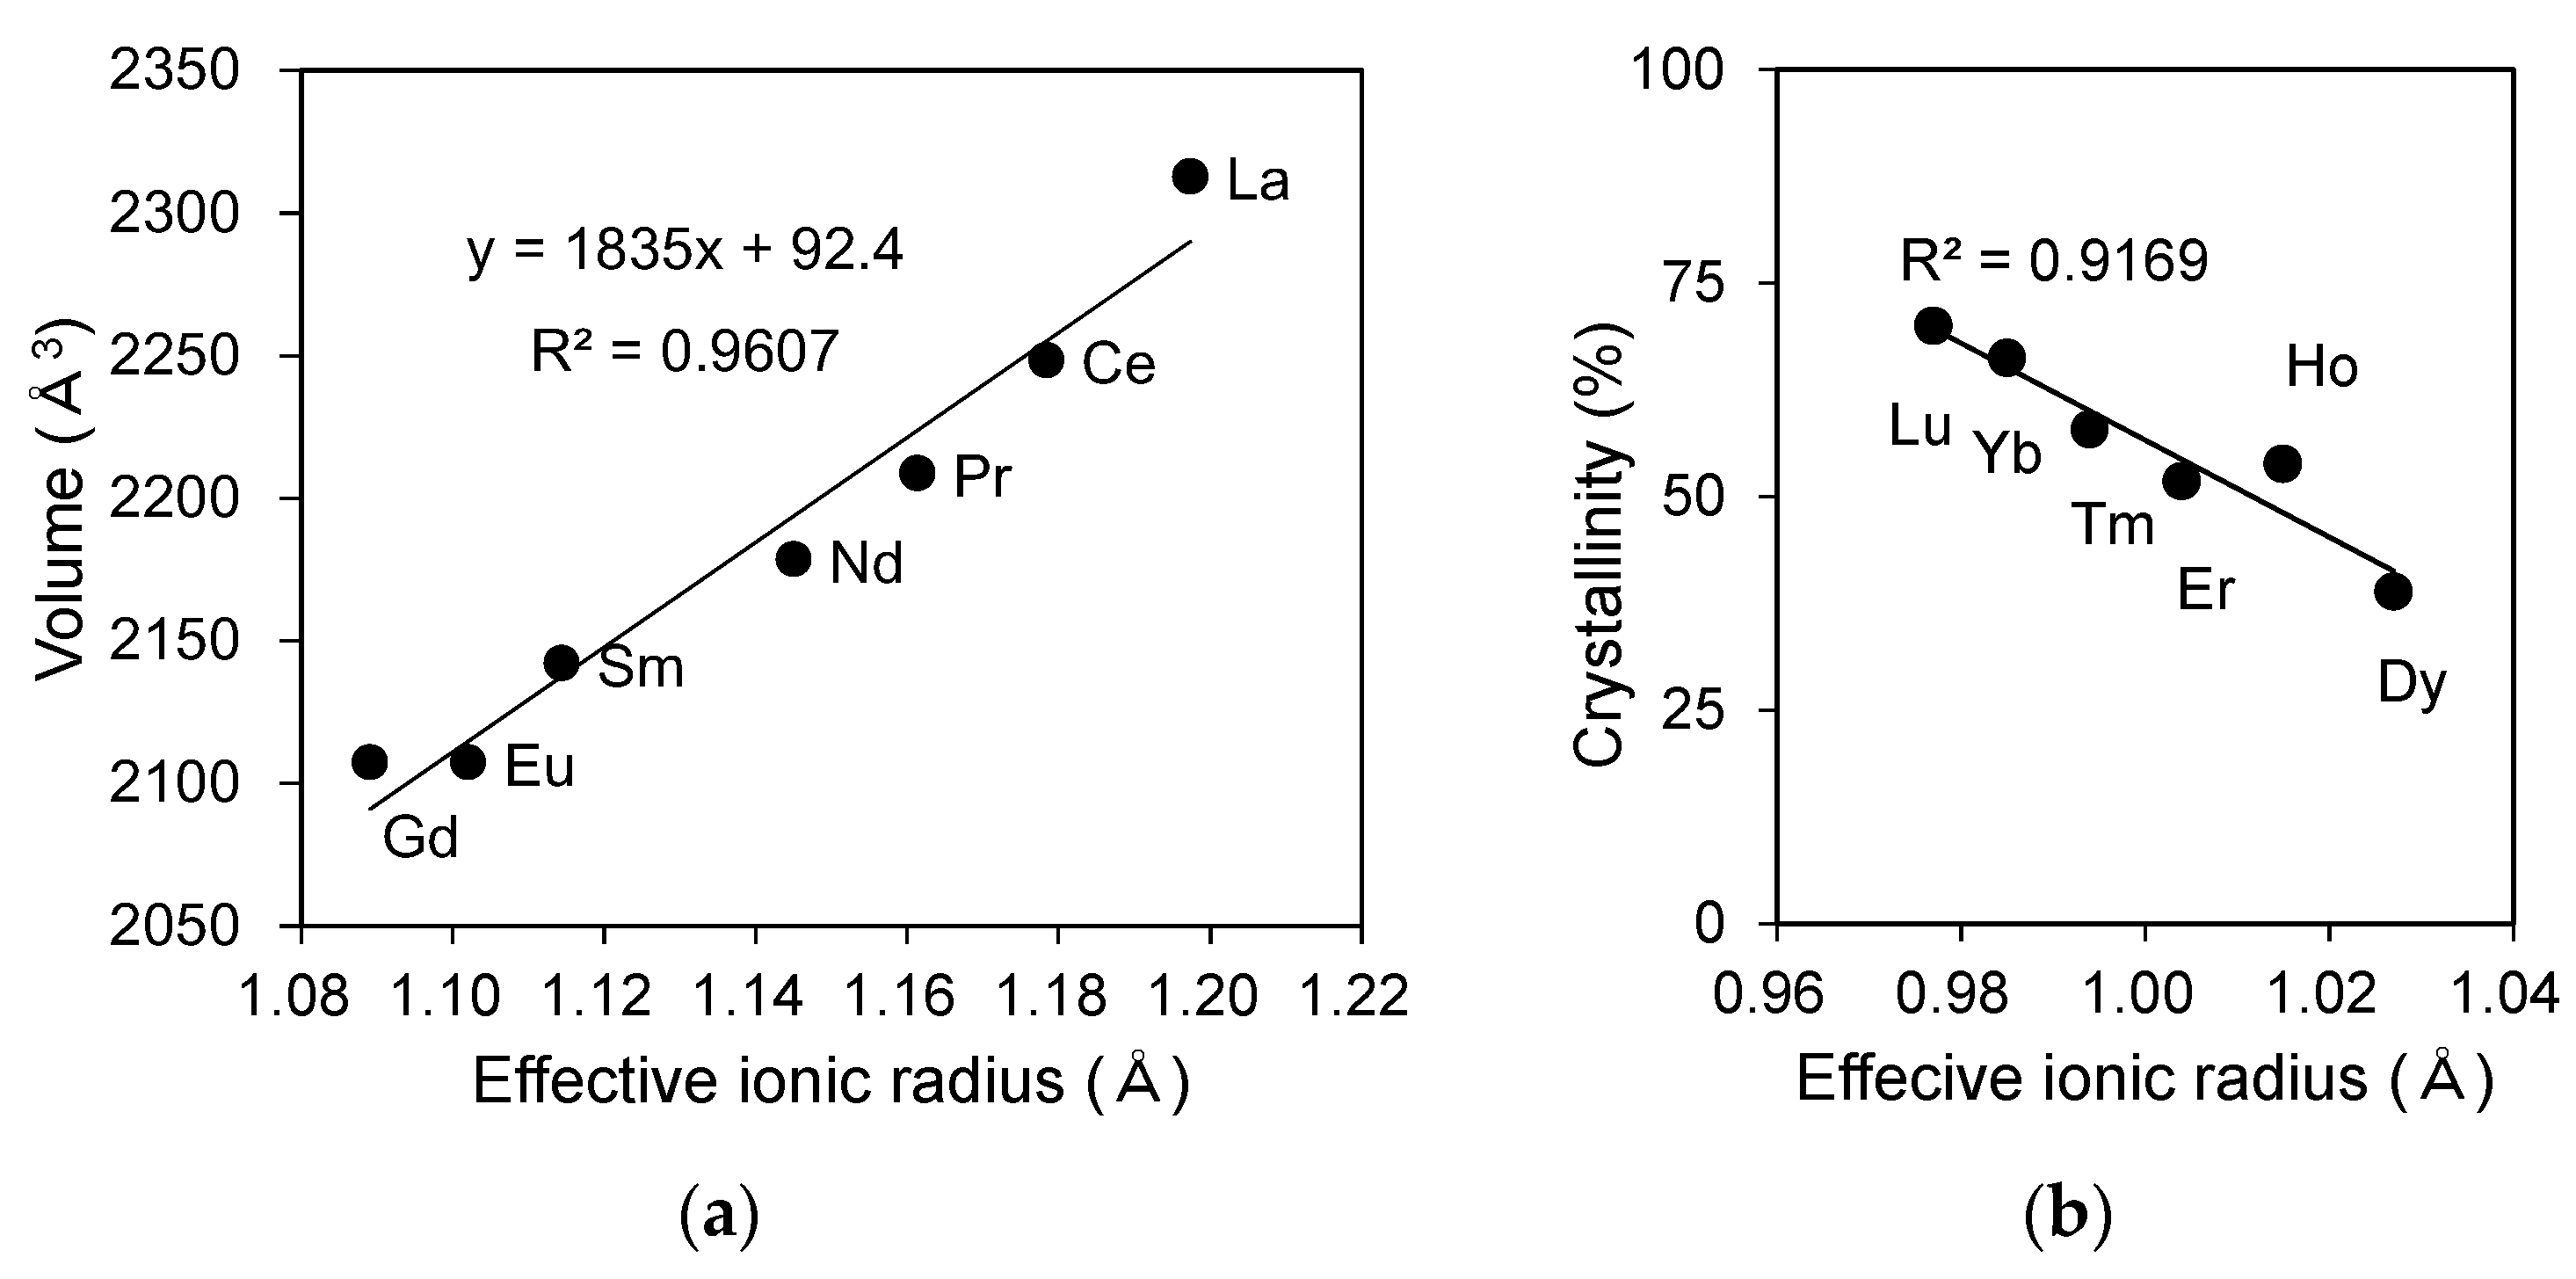
The calculated lattice volume of LREPO4,hyd reacted at a pH of 3 for 3 days are plotted as a function of the effective ionic radius in Figure 3a by fitting the (11), (11), (13), (22), and (711) peaks to the peaks of the rhabdophane structure using the JADE software. The calculated lattice parameters are summarized in Table 2. The calculated lattice volume displays a positive linear correlation with the effective ionic radius, indicating that the crystal lattice shrinks uniformly as the ionic radius decreases (Figure 3a). The lattice volumes calculated in the present experiment are larger than that of well-crystalline rhabdophane structure reported in [8], most likely owing to the presence of more water molecules in the structure of LREPO4,hyd.
The crystallinity of REiPO4,hyd (RE = Dy-Lu) was calculated based on the profile fitting of amorphous halos in the XRD patterns (Figure S2, Table 3) and is plotted in Figure 3b as a function of effective ionic radius. The results indicate that DyPO4,hyd has the largest amorphous volume and that the amorphous fraction linearly decreases towards LuPO4,hyd.
The XRD patterns of REiPO4,hyd (RE = Tb, Ho, Dy, and Yb) and REallPO4,hyd obtained from the annealing experiments are summarized in Figure 4. TbPO4,hyd transformed to a monazite structure at 400 °C with small peaks occurring at a 2θ value around 30°, as indicated by the circle. DyPO4,hyd appeared to transform to a xenotime structure at 400 °C, as indicated by the appearance of small peaks at a 2θ value around 25.8°. HoPO4,hyd and YbPO4,hyd also transformed to a xenotime structure at around 300 and 200 °C, respectively. REallPO4,hyd appeared to retain its initial structure up to 200 °C and then transformed to a rhabdophane structure, which was retained up to 500 °C. In contrast, TbPO4,hyd did not become rhabdophane-structured but directly transformed to a monazite structure when annealed in air. The thermal behavior of TbPO4,hyd is different from that observed in the aging experiments, in which the structure simply changed to that of rhabdophane.
3.2. FT-IR Analysis
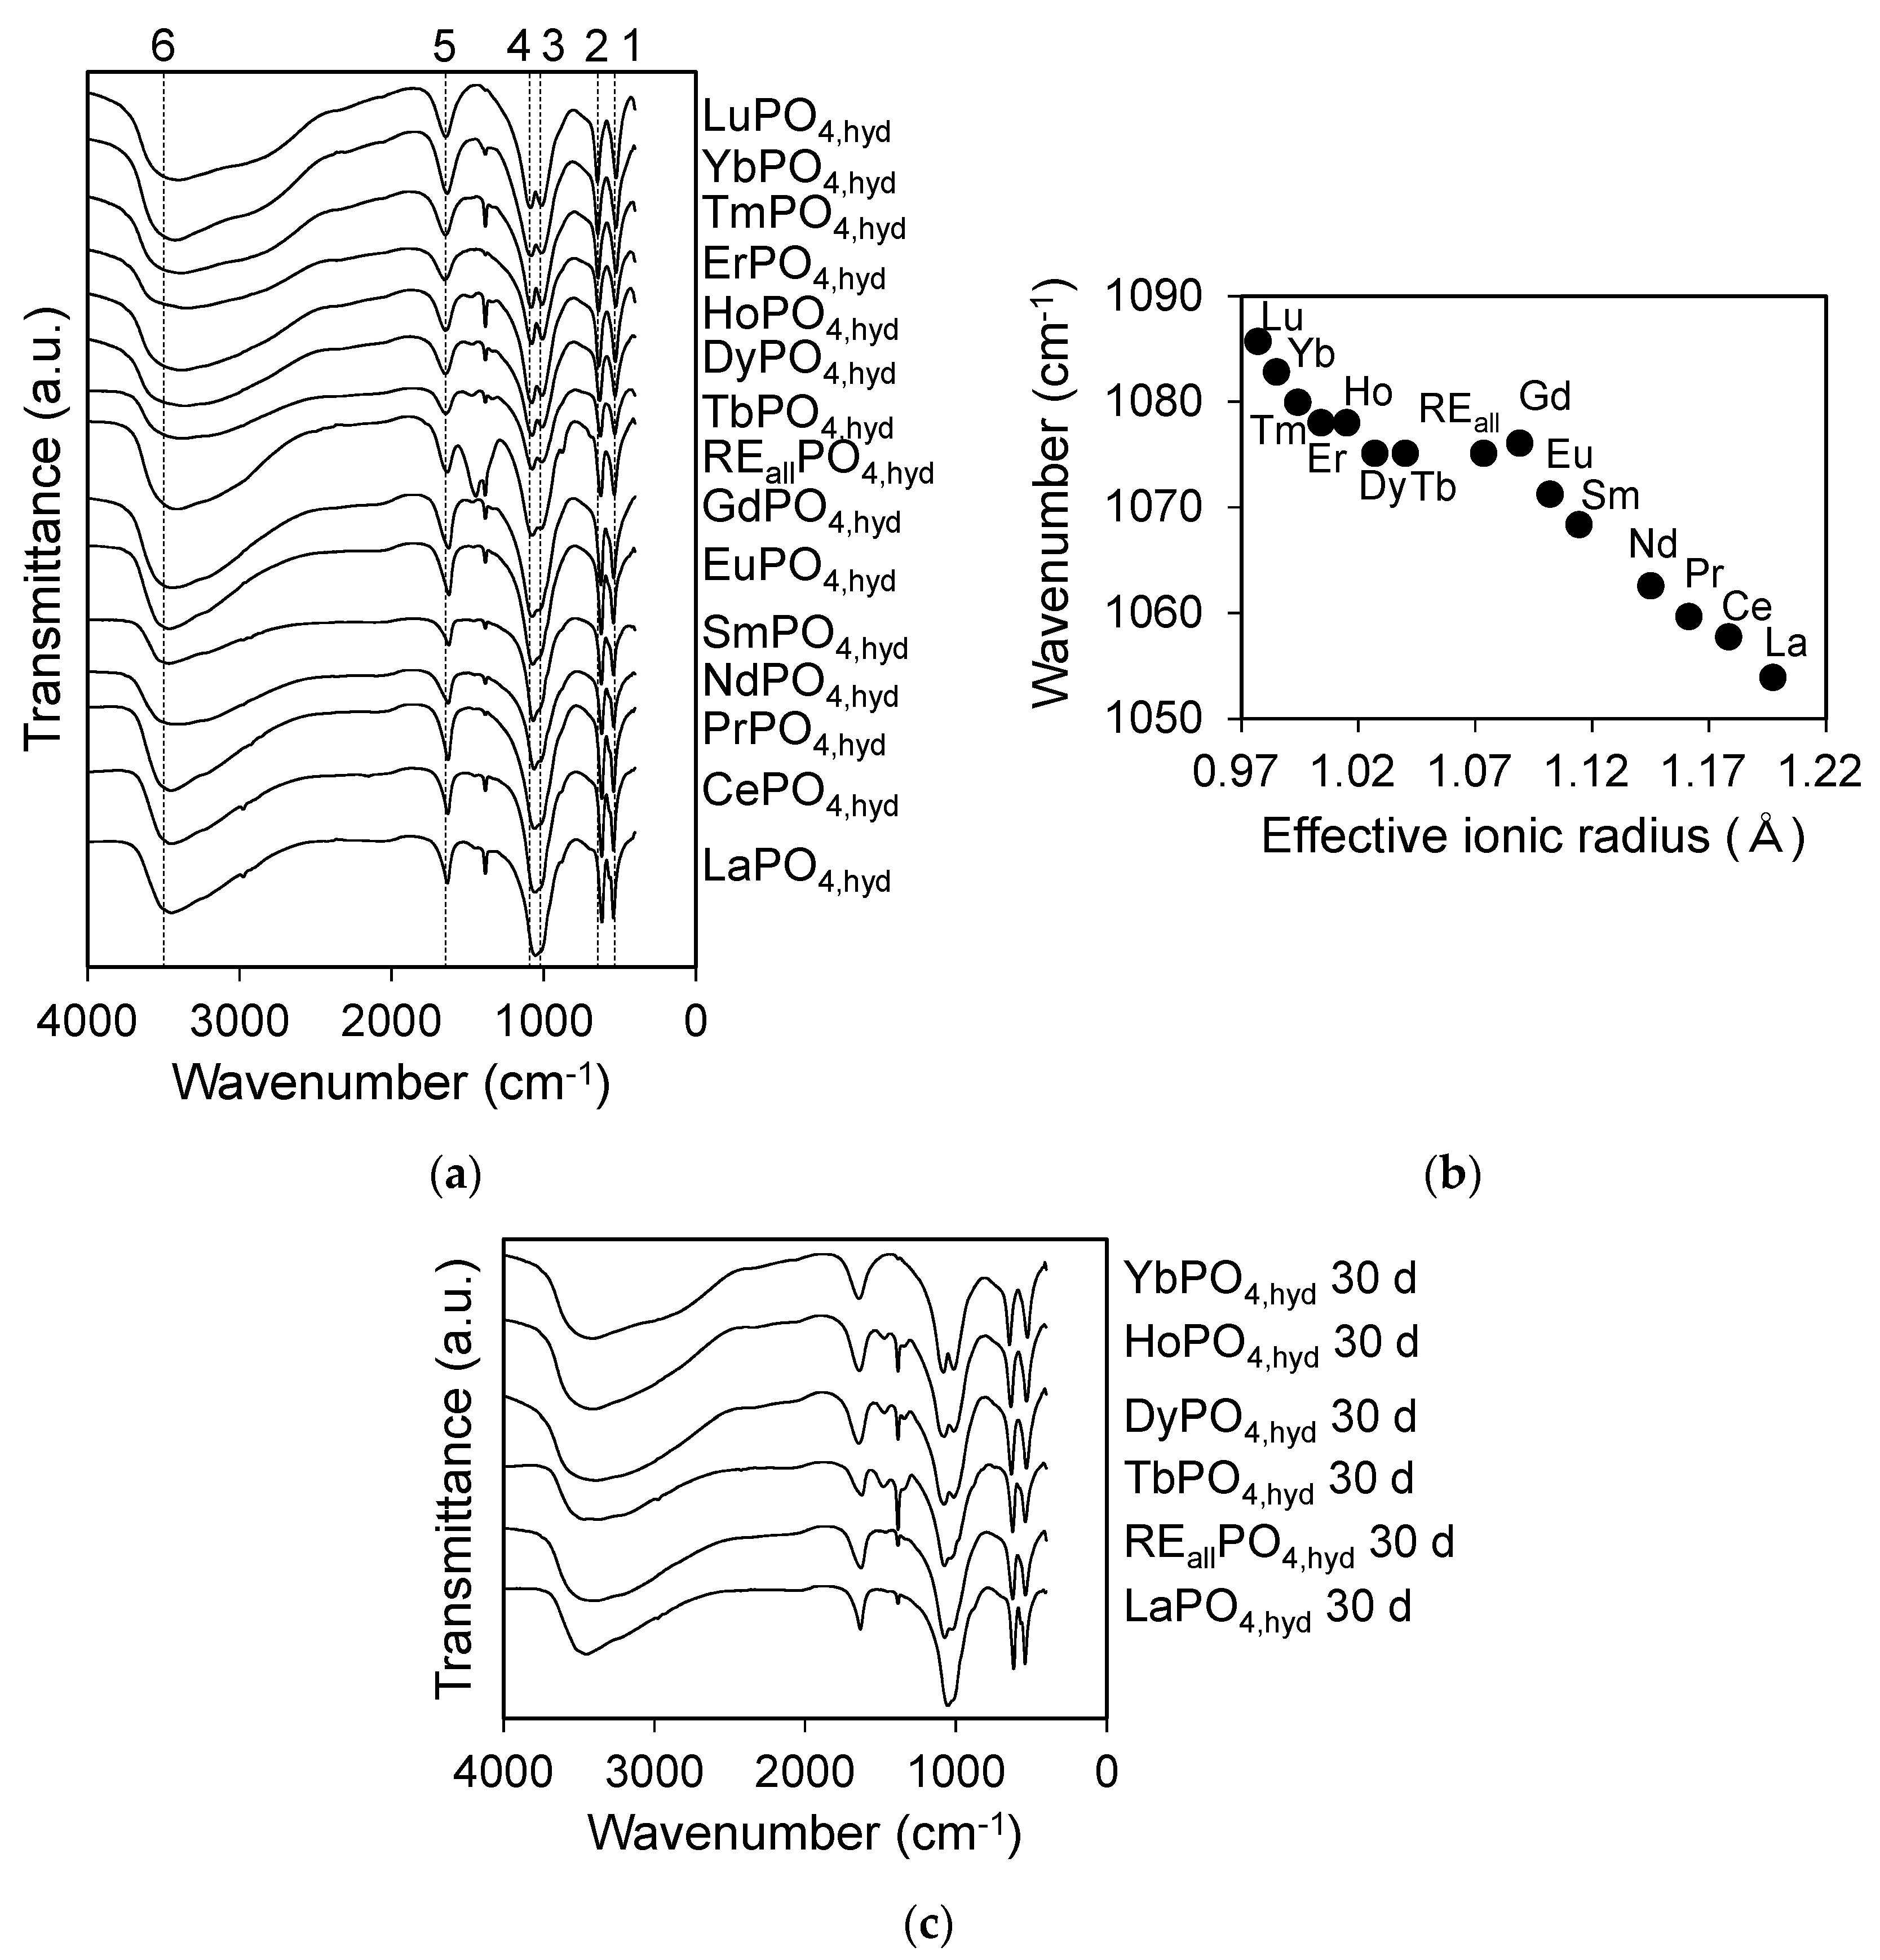
Infrared spectra for REiPO4,hyd (RE = La-Lu except Pm) and REallPO4,hyd reacted at pH 3 for 3 days are shown in Figure 5a. Two bands at 520–650 cm−1 (labeled 1 and 2) correspond to the asymmetric P–O bending vibration, ν3, while the bands at 1000–1100 cm−1 (labeled 3 and 4) correspond to the antisymmetric P–O stretching vibration, ν4 [33,34,35]. Bands 3 and 4 are not clearly separated for LREPO4,hyd. The symmetric stretching mode ν1, which typically appears as a small absorption band at ~966–985 cm−1 [36] and the bending vibration ν2 were not observed, possibly because those bands were superimposed in the ν3 and ν4 regions for the hydrated RE phosphates [35]. The wavenumbers of band 4 in the ν3 region plotted as a function of the effective ionic radius (Figure 5b and Table 4) exhibit a linear decrease with increasing ionic radius for LREPO4,hyd and HREPO4,hyd, while MREPO4,hyd and REallPO4,hyd did not exhibit such trends. The broad bands at ~1600 cm−1 (band 5) and at ~3000–3500 cm−1 (band 6) are derived from coordinated H2O [34]. Nitrate impurities derived from the initial REE reagents produce the band at ~1380 cm−1.
FT-IR spectrum of the aged TbPO4,hyd and REallPO4,hyd appeared to be similar to that of LaPO4,hyd, especially at bands 3 and 4 (Figure 5c). These FT-IR results concur with the XRD analyses, i.e., they indicate a change in the structures of REallPO4,hyd and TbPO4,hyd to a rhabdophane structure after 30 days of aging in solution.
3.3. TG-DTA Analysis
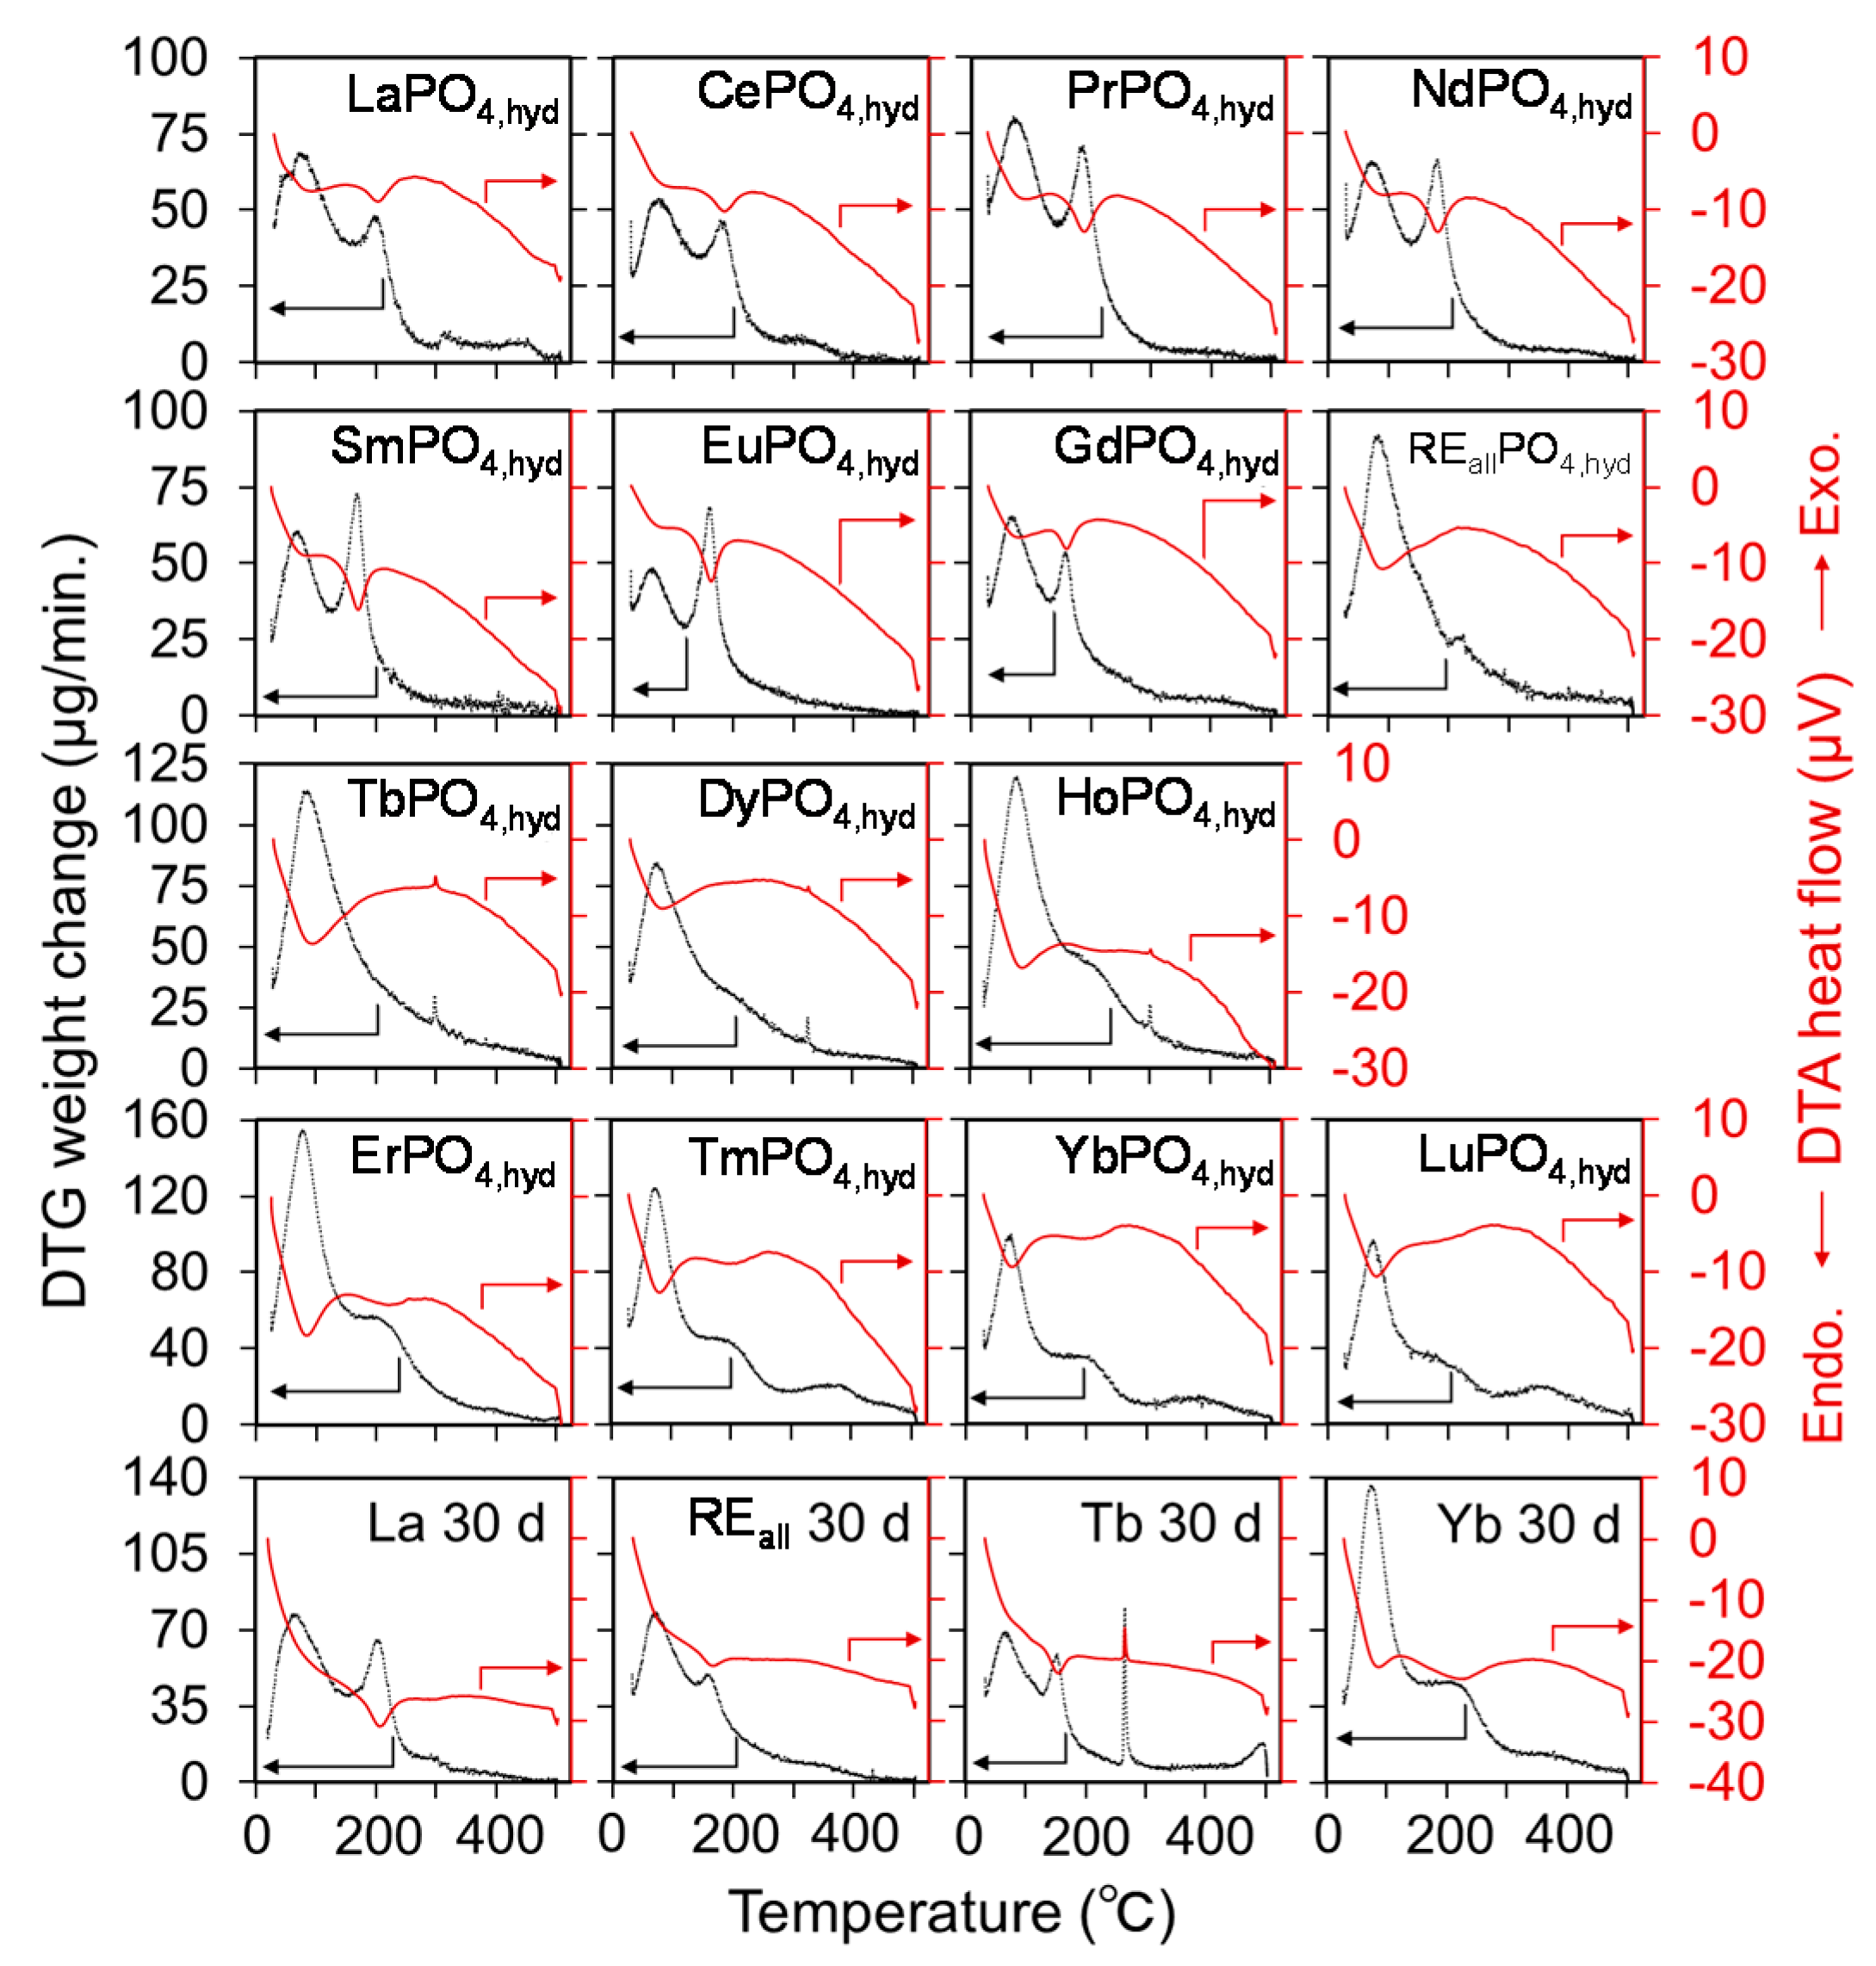
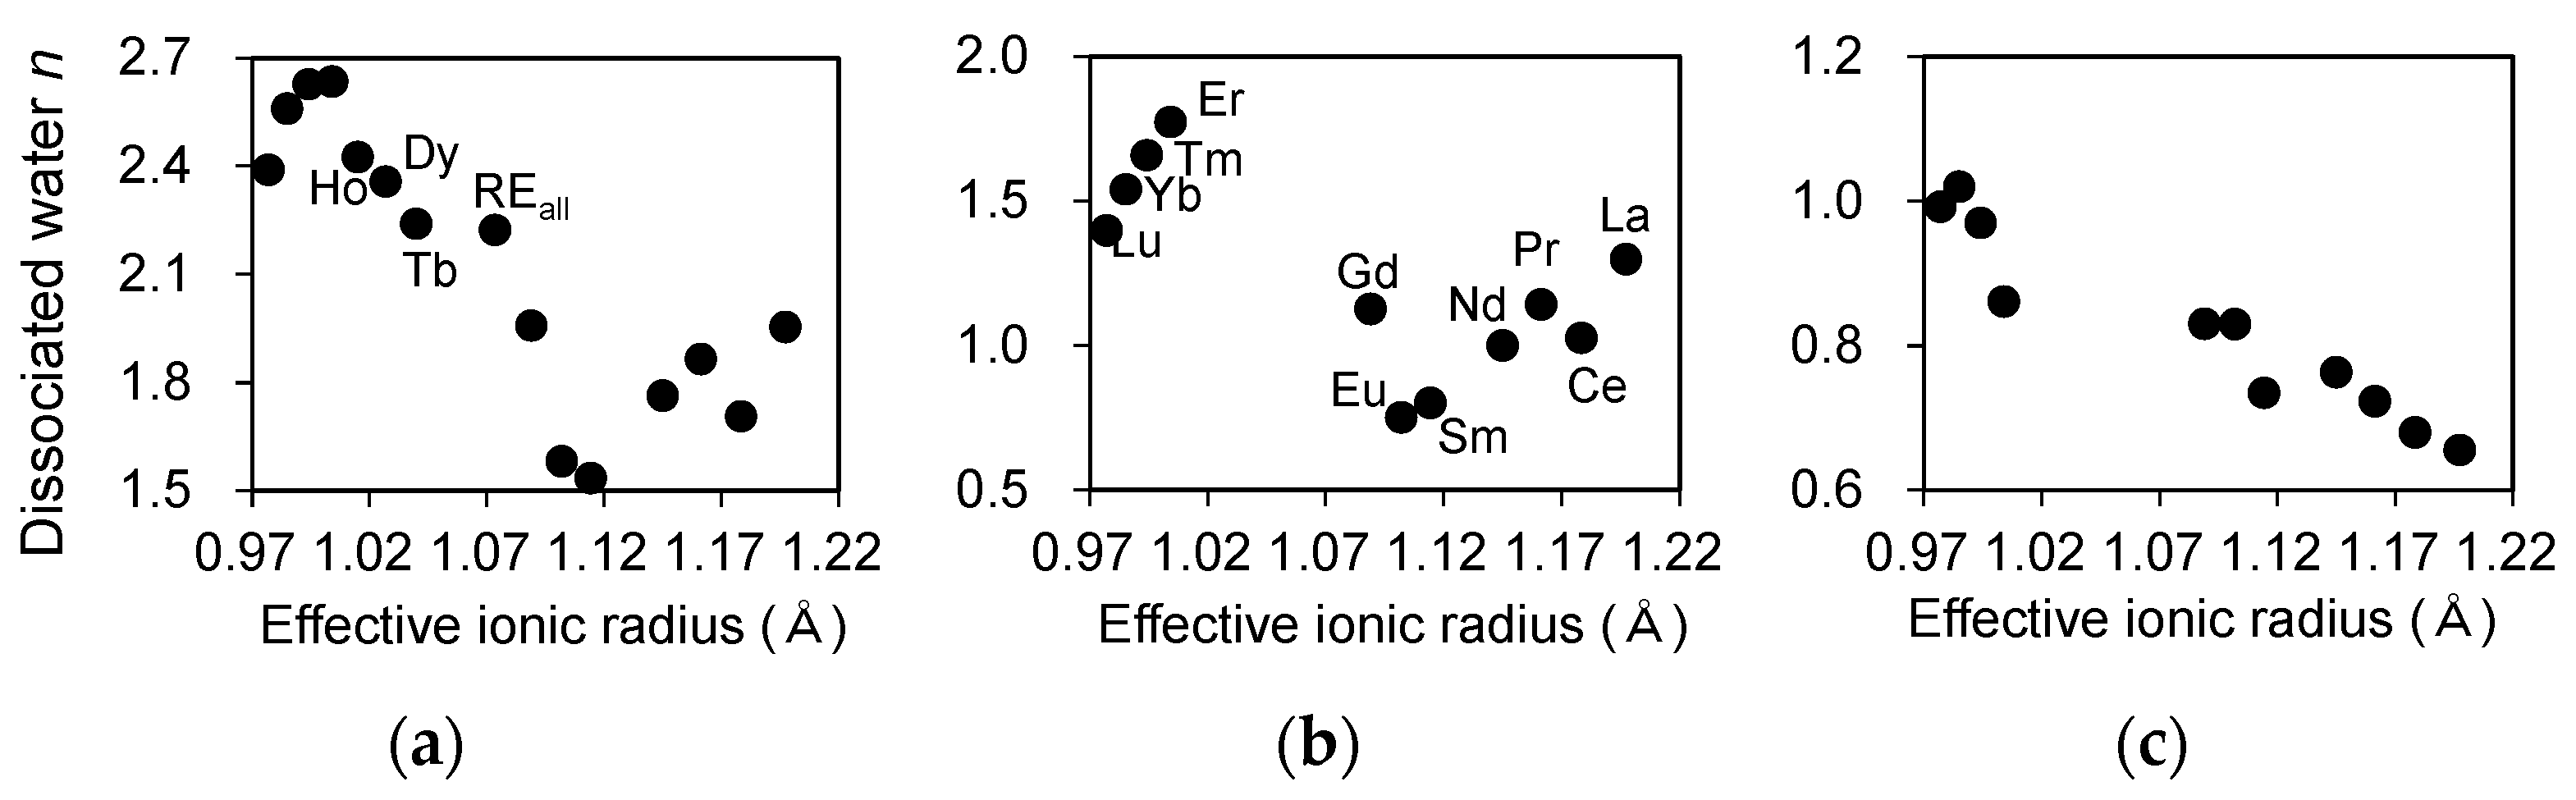
Derivatives of the TG (DTG) and DTA spectra for REiPO4,hyd (RE = La-Lu) and REallPO4,hyd reacted at a pH of 3 for 3 days are shown in Figure 6. LREPO4,hyd and HREPO4,hyd display a two-step dehydration, which is indicated by the presence of a DTG upper peak with an endothermic DTA peak. Assuming that the material remaining after heating to 500 °C entirely comprise anhydrous RE phosphates and the weight loss is derived solely from the dissociation of H2O in REPO4,hyd, the amount of dissociated water was calculated for the total heating duration (Figure 7a) and for each dehydration step (Figure 7b,c), and compiled in Table 5. The starting temperature of the second dehydration step was determined by selecting the local minimum of the DTG spectrum or the peak of the DTA spectrum between the first and second dehydration steps. A diagram of the dehydration extent in the first step in HREPO4,hyd indicates that the amount of water loss increases as a function of ionic radius (Figure 7b). The amount of water loss in the second dehydration step also appears to exhibit a linear decrease as the ionic radii decrease in LREPO4,hyd and HREPO4,hyd (Figure 7c). MREPO4,hyd and REallPO4,hyd each exhibited only one dehydration peak. For these phases, a DTG upper peak and a DTA exothermic peak are present, indicating that crystallization occurred during dehydration.
In addition, the DTG and DTA spectra of REiPO4,hyd (RE = La, Tb, and Yb) and REallPO4,hyd after 30 days of reaction time are shown in Figure 6 for comparison with samples measured after 3 days of reaction time. Although LaPO4,hyd and YbPO4,hyd did not appear significantly different from those samples that had reacted for 3 days, additional dehydration peaks appeared in the spectra of TbPO4,hyd and REallPO4,hyd reacted for 30 days.
3.4. ICP-AES Analysis
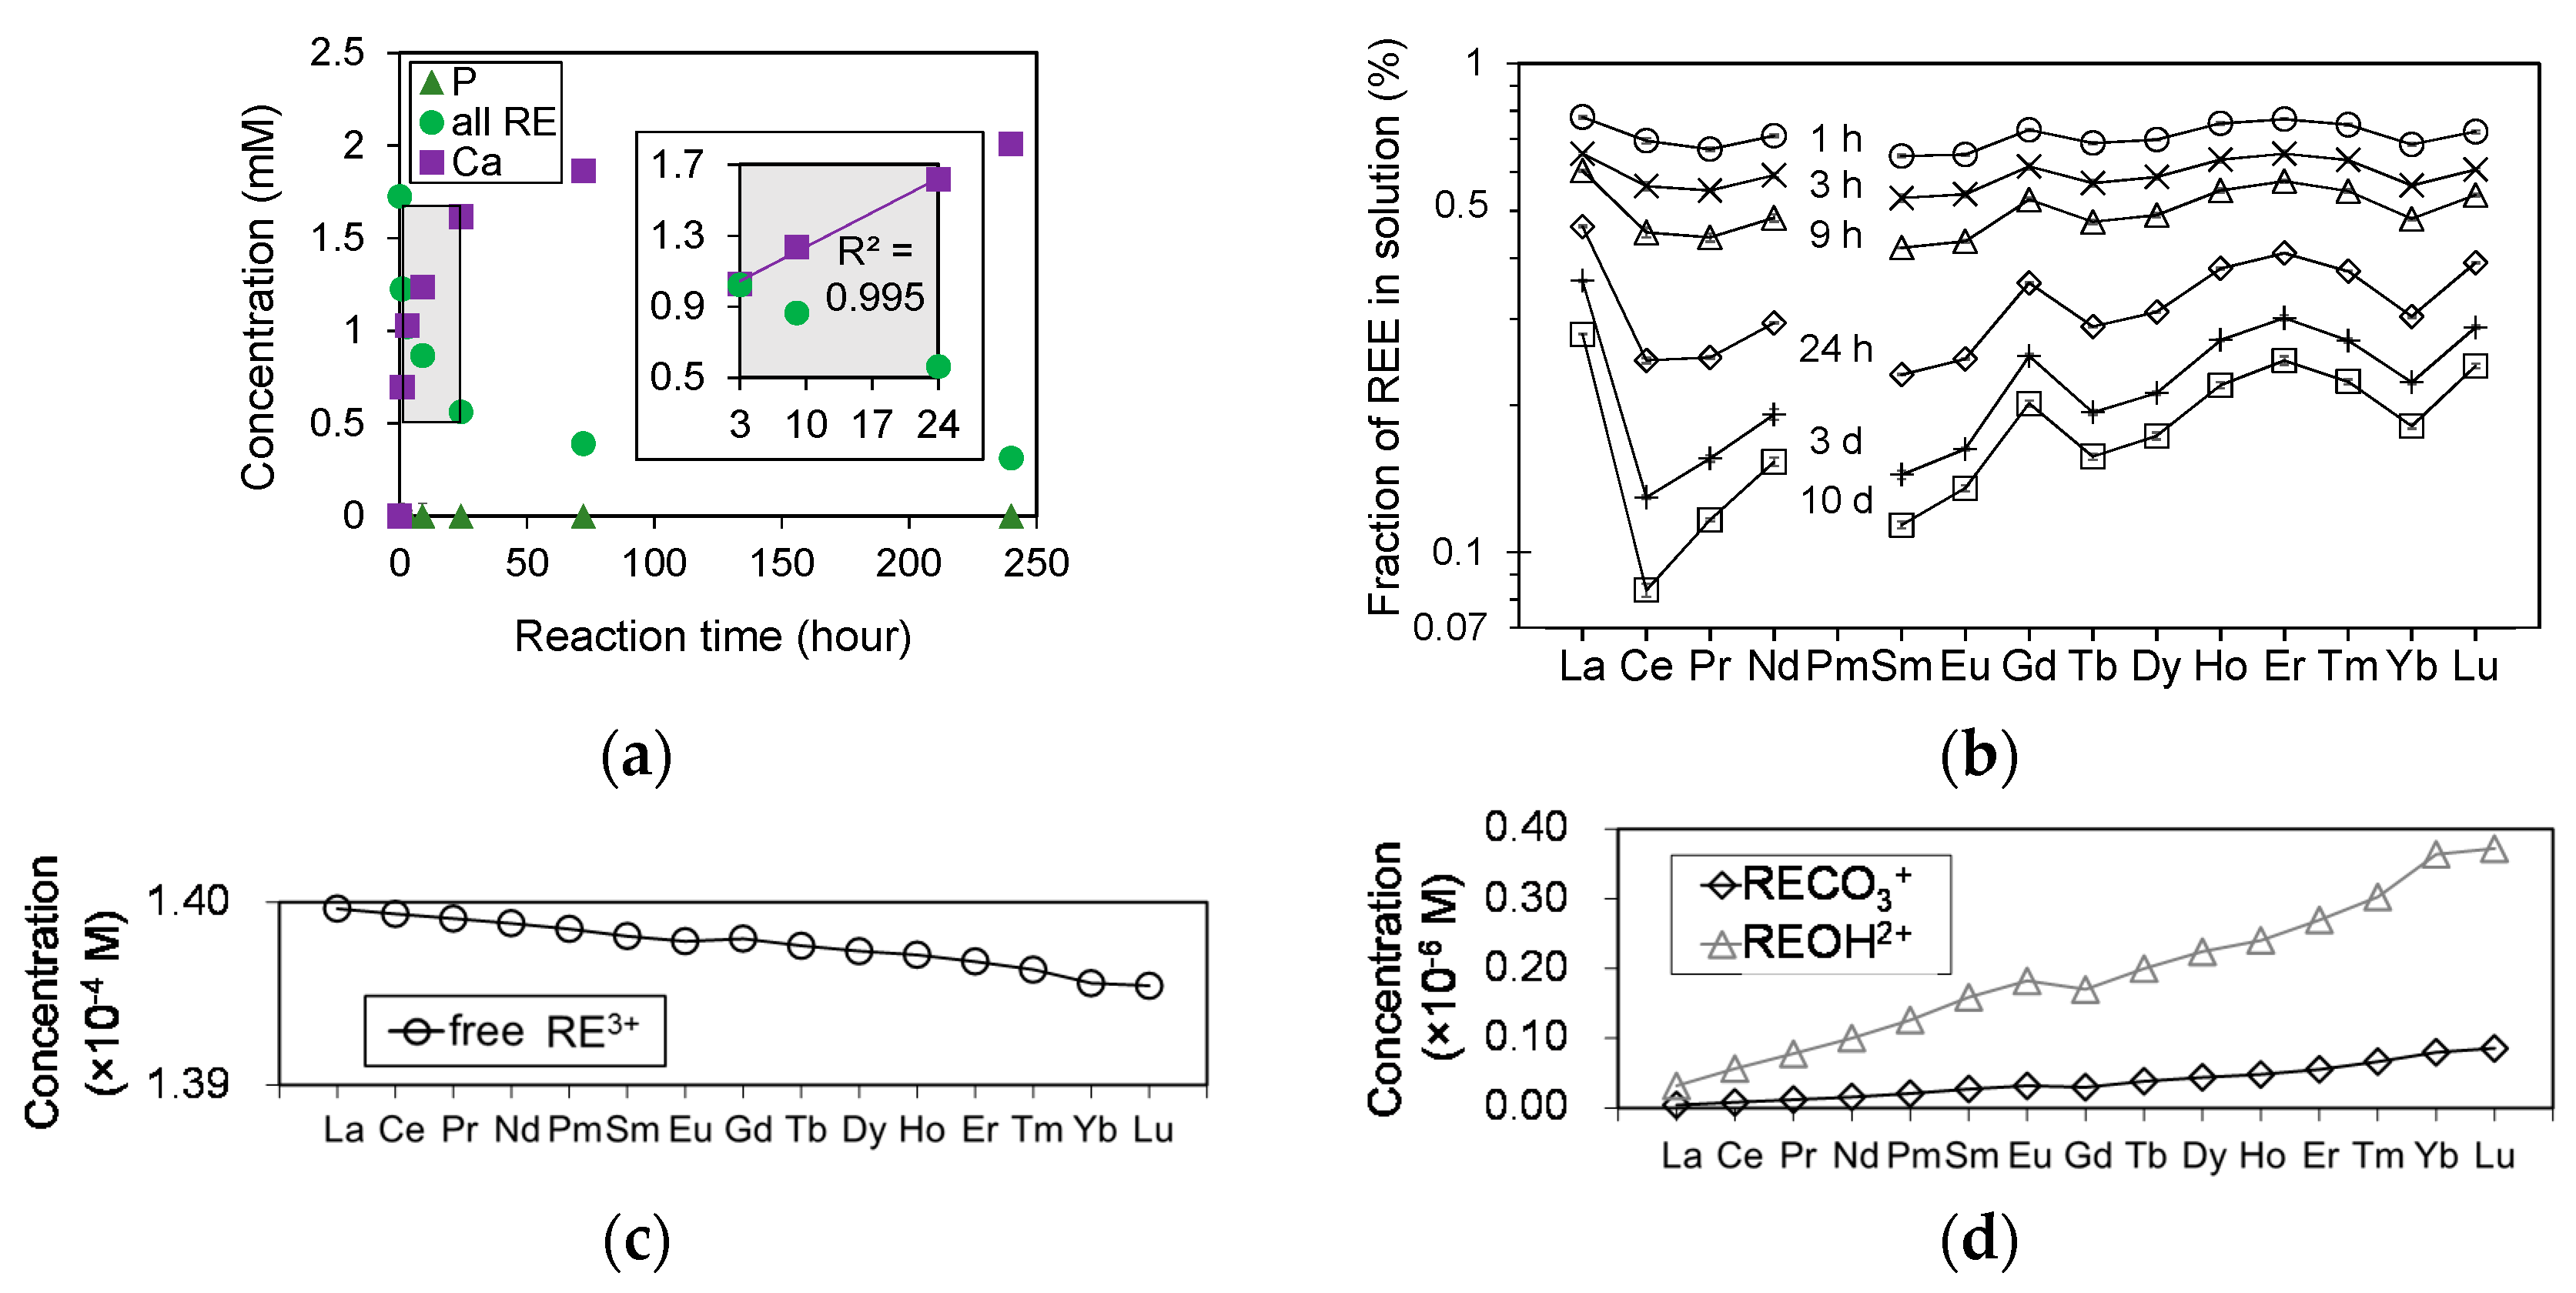
In experiments of HAP dissolution in a solution containing all REEs, the concentrations of RE (RE = La-Lu except Pm), Ca, and P were measured for each duration using ICP-AES. The results are summarized in Table 6 and the total REE concentrations are plotted in Figure 8a as a function of reaction time. The P concentration is under the detection limit for all durations. The Ca concentration increased linearly for periods from 3 to 24 h, whereas the total concentration of all REEs decreased inversely with the Ca concentration. The reaction did not reach equilibrium within the duration of this dissolution experiment (Figure 8a); however, more than 80% of the total initial REE concentration was removed from solution after 240 h.
Figure 8b shows the transition in the patterns of REEs in solution reacted with HAP. The four curves at La-Nd, Sm-Gd, Gd-Ho, and Er-Lu exhibit the lanthanide tetrad effect [37]. Furthermore, more heavy REEs remained in solution compared with light REEs, and this trend becomes more pronounced with reaction time. The possible concentrations of free RE3+, RECO3+, and REOH2+ at these experimental conditions were calculated using Geochemist’s Workbench using their formation constants [38], and input data of PCO2 = 10−3.5 bar [39] and phosphate free solution. The calculation results clearly demonstrate that the concentration of free RE3+ decreases as the ionic radius decreases because the amount of other REE complexes such as RECO3+ and REOH2+ increase with decreasing ionic radius (Figure 8c,d).
3.5. TEM Analysis
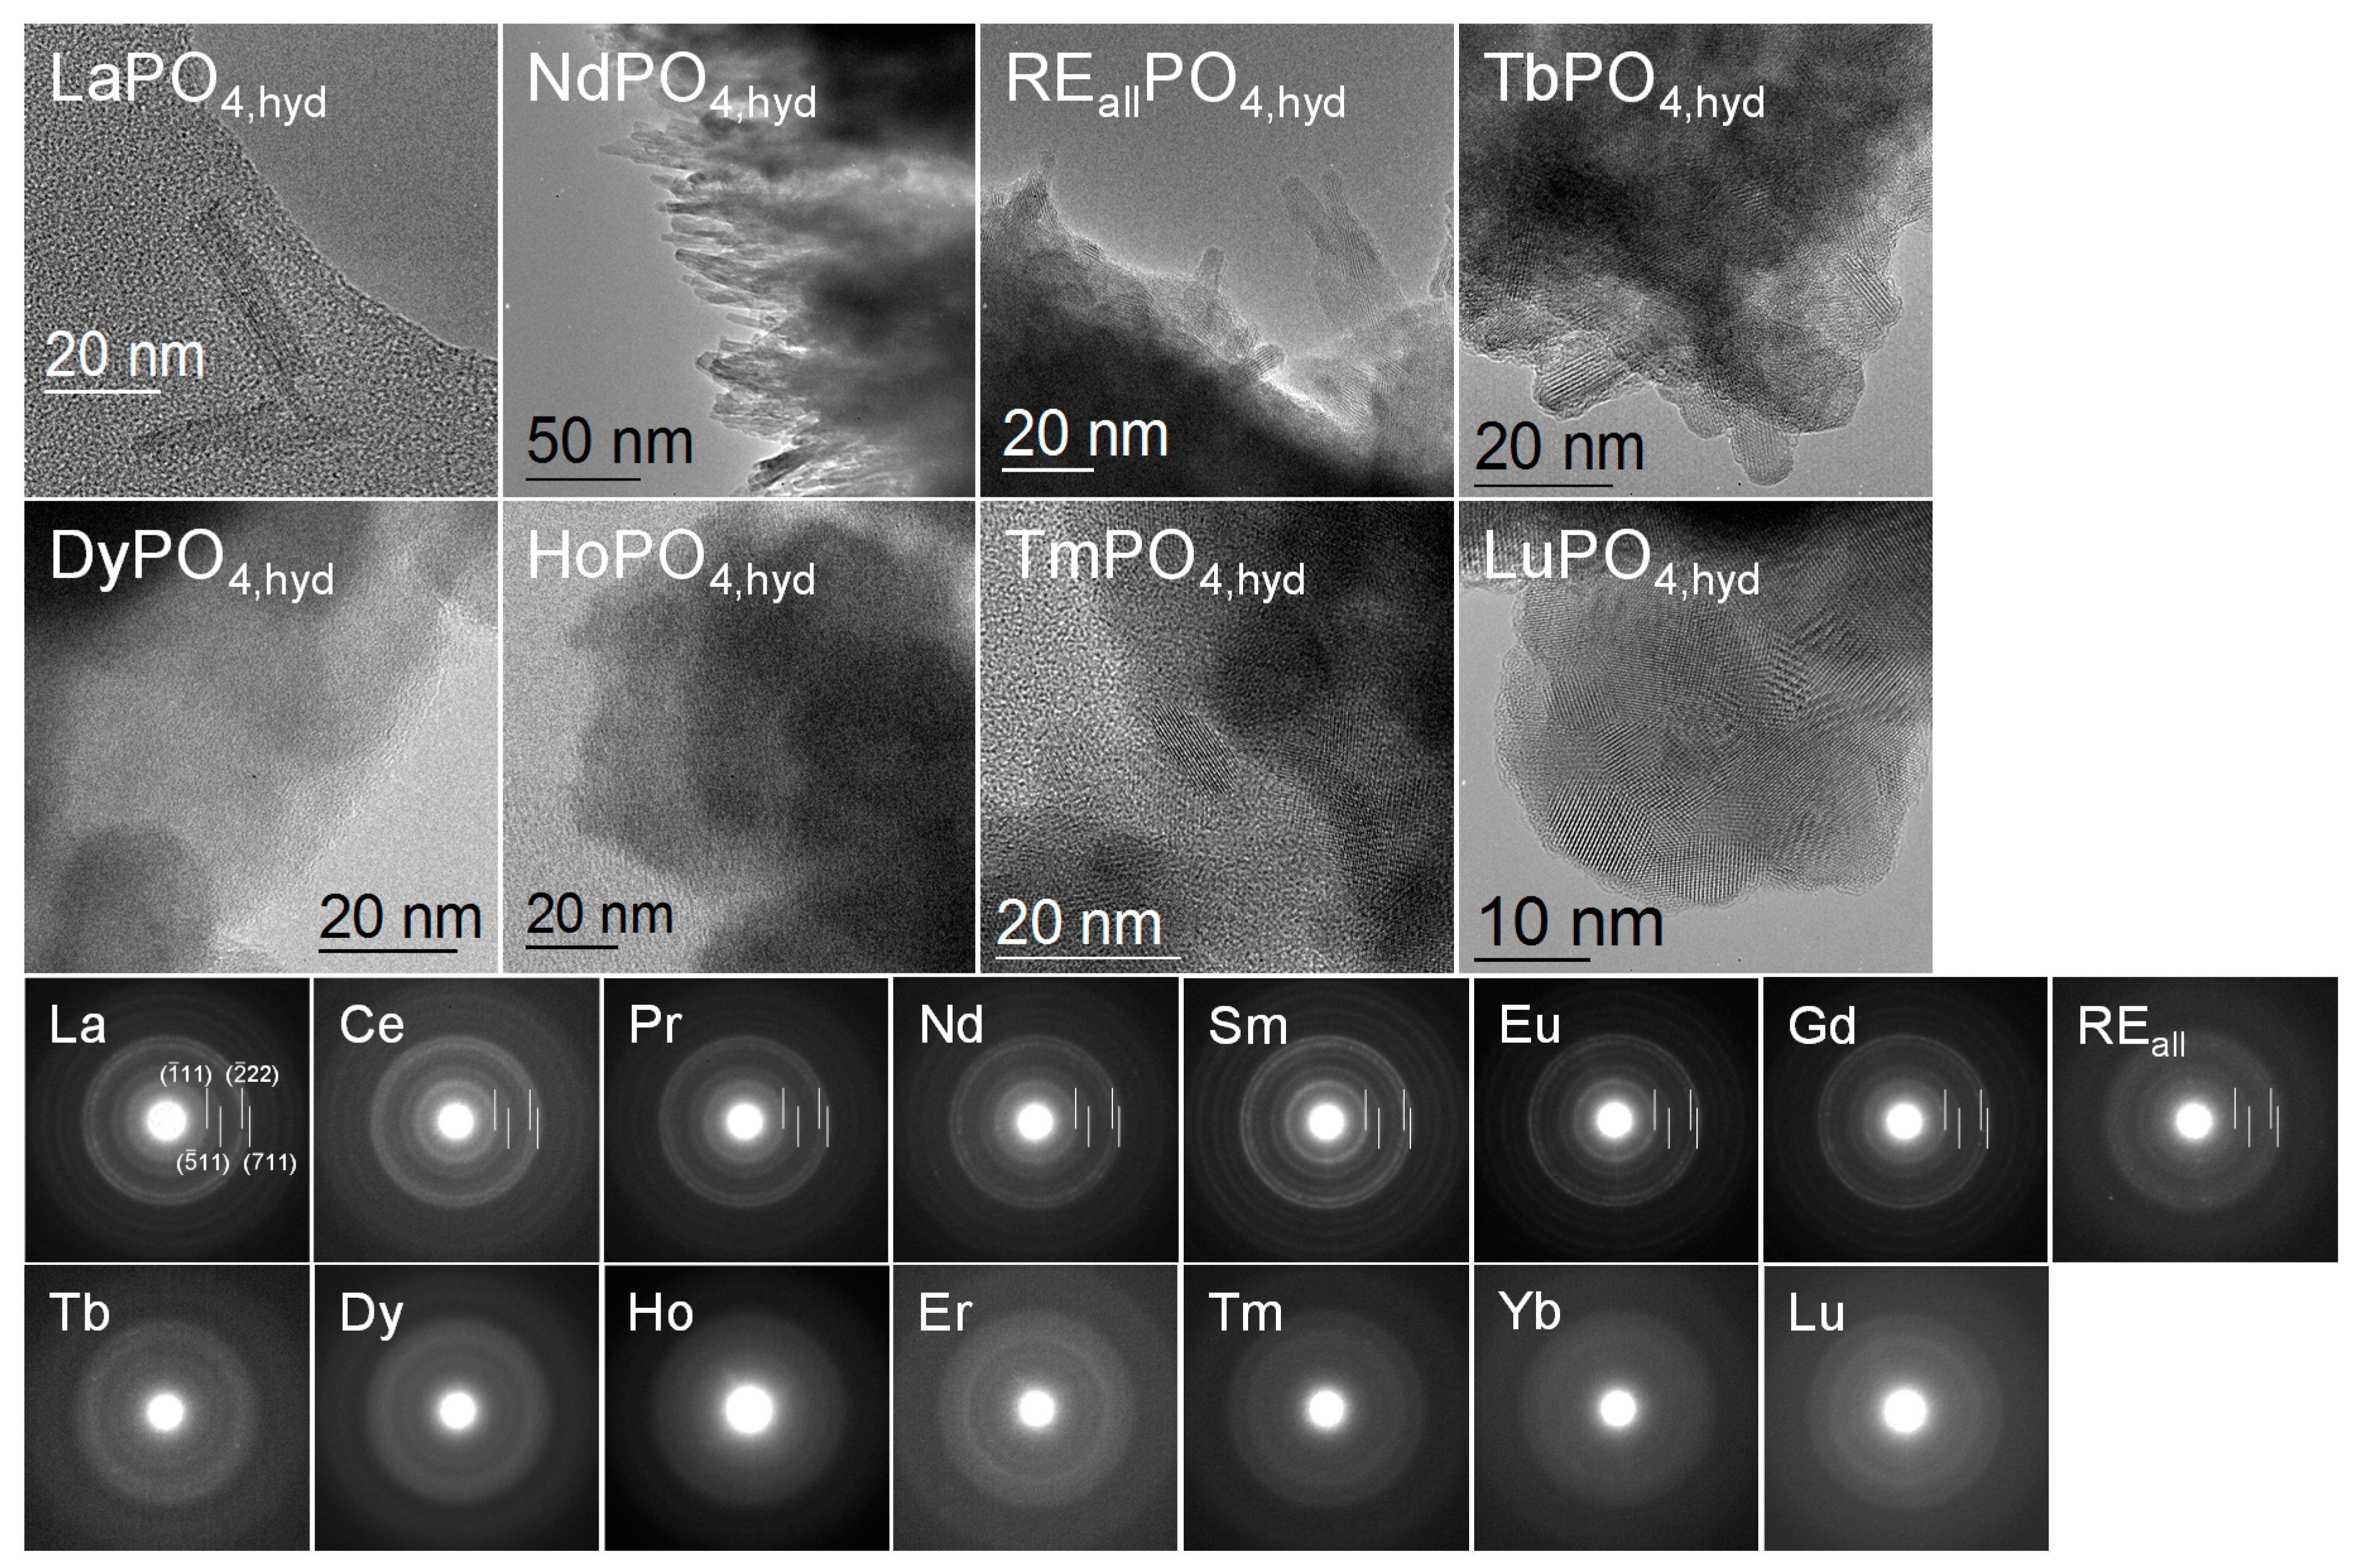
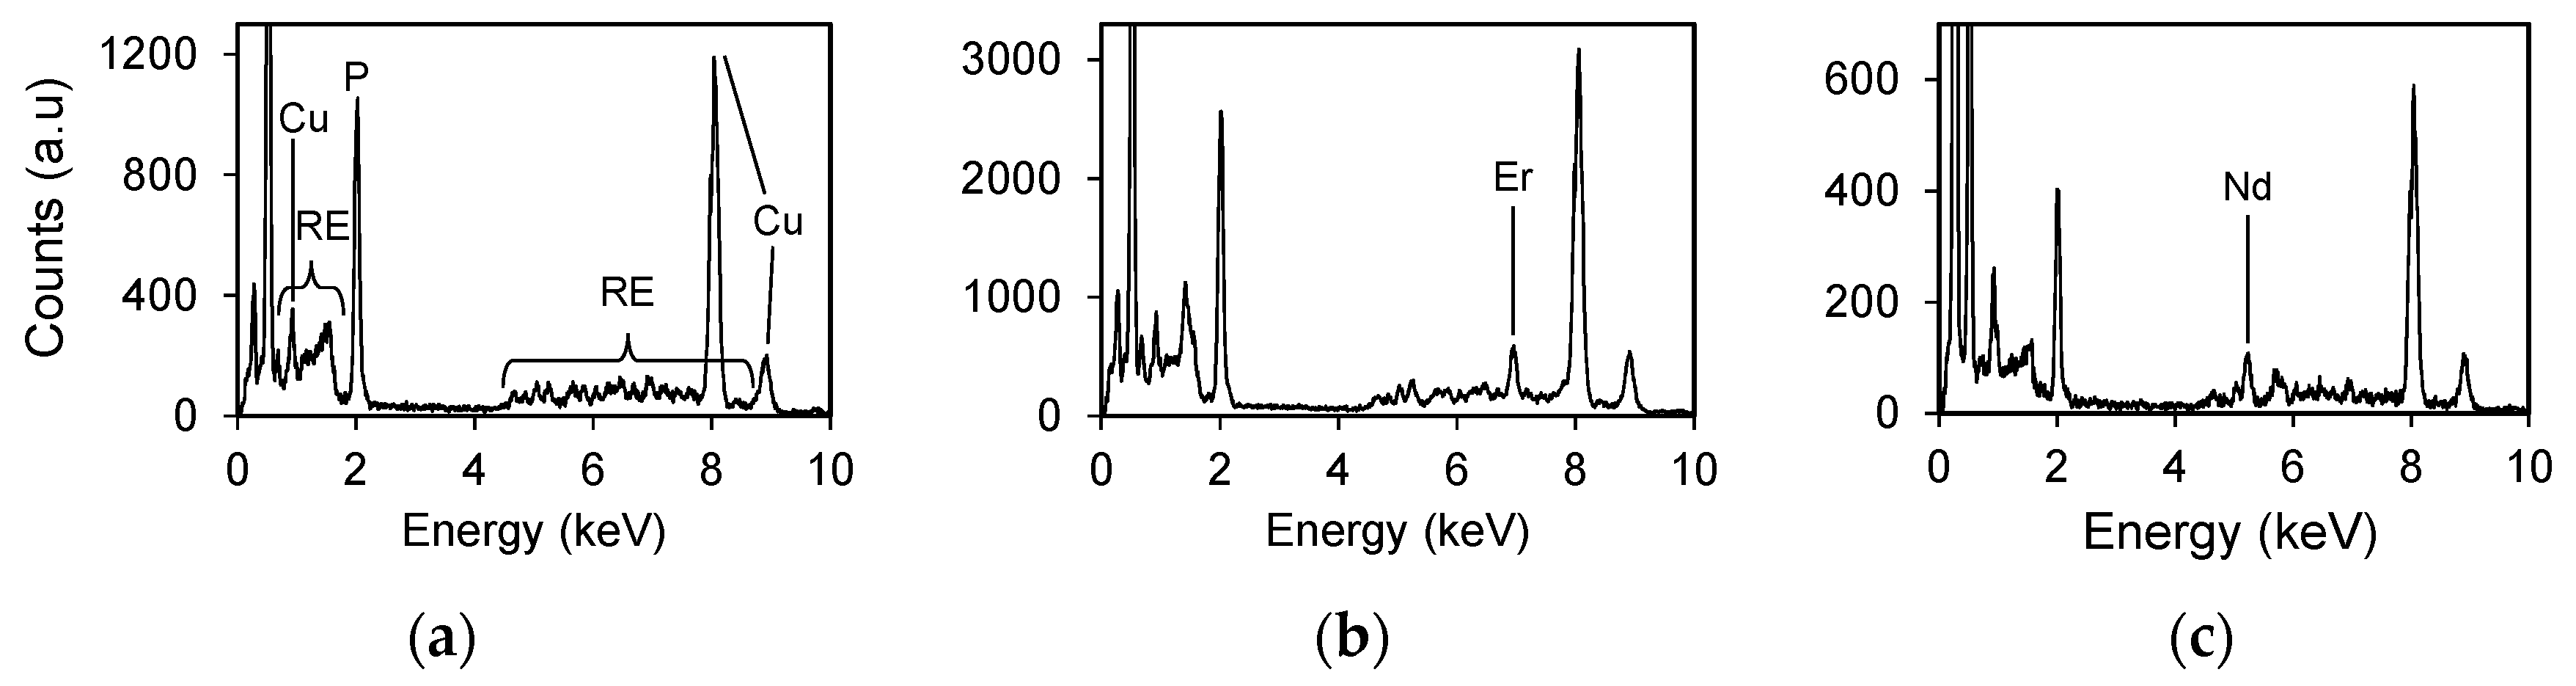
The grain shapes of REPO4,hyd gradually change with ionic radius. HRTEM images show that REiPO4,hyd (RE = La, Nd, Tb) and REallPO4,hyd form rod-shaped particles of ~50 nm in length. TmPO4,hyd and LuPO4,hyd are spherically shaped with diameters of 10 nm (Figure 9). DyPO4,hyd and HoPO4,hyd precipitates do not exhibit any specific shape due to their amorphous characteristics. The SAED patterns of LREPO4,hyd and REallPO4,hyd display the same ring pattern as that of the rhabdophane structure. Although the SAED patterns of other REPO4,hyd are indistinct due to the large amorphous fractions, the REiPO4,hyd (RE = Tb-Lu) structure can be distinguished from the rhabdophane structure by the lack of an innermost diffraction ring. In EDS analyses, most analytical points from the REallPO4 crystals contain uniform collective peaks at 4–8 keV corresponding to the L lines of REEs (Figure 10a). However, a few points display non-uniform spectrums, as shown in Figure 10b,c, in which enhanced peaks for Er and Nd occur, respectively.
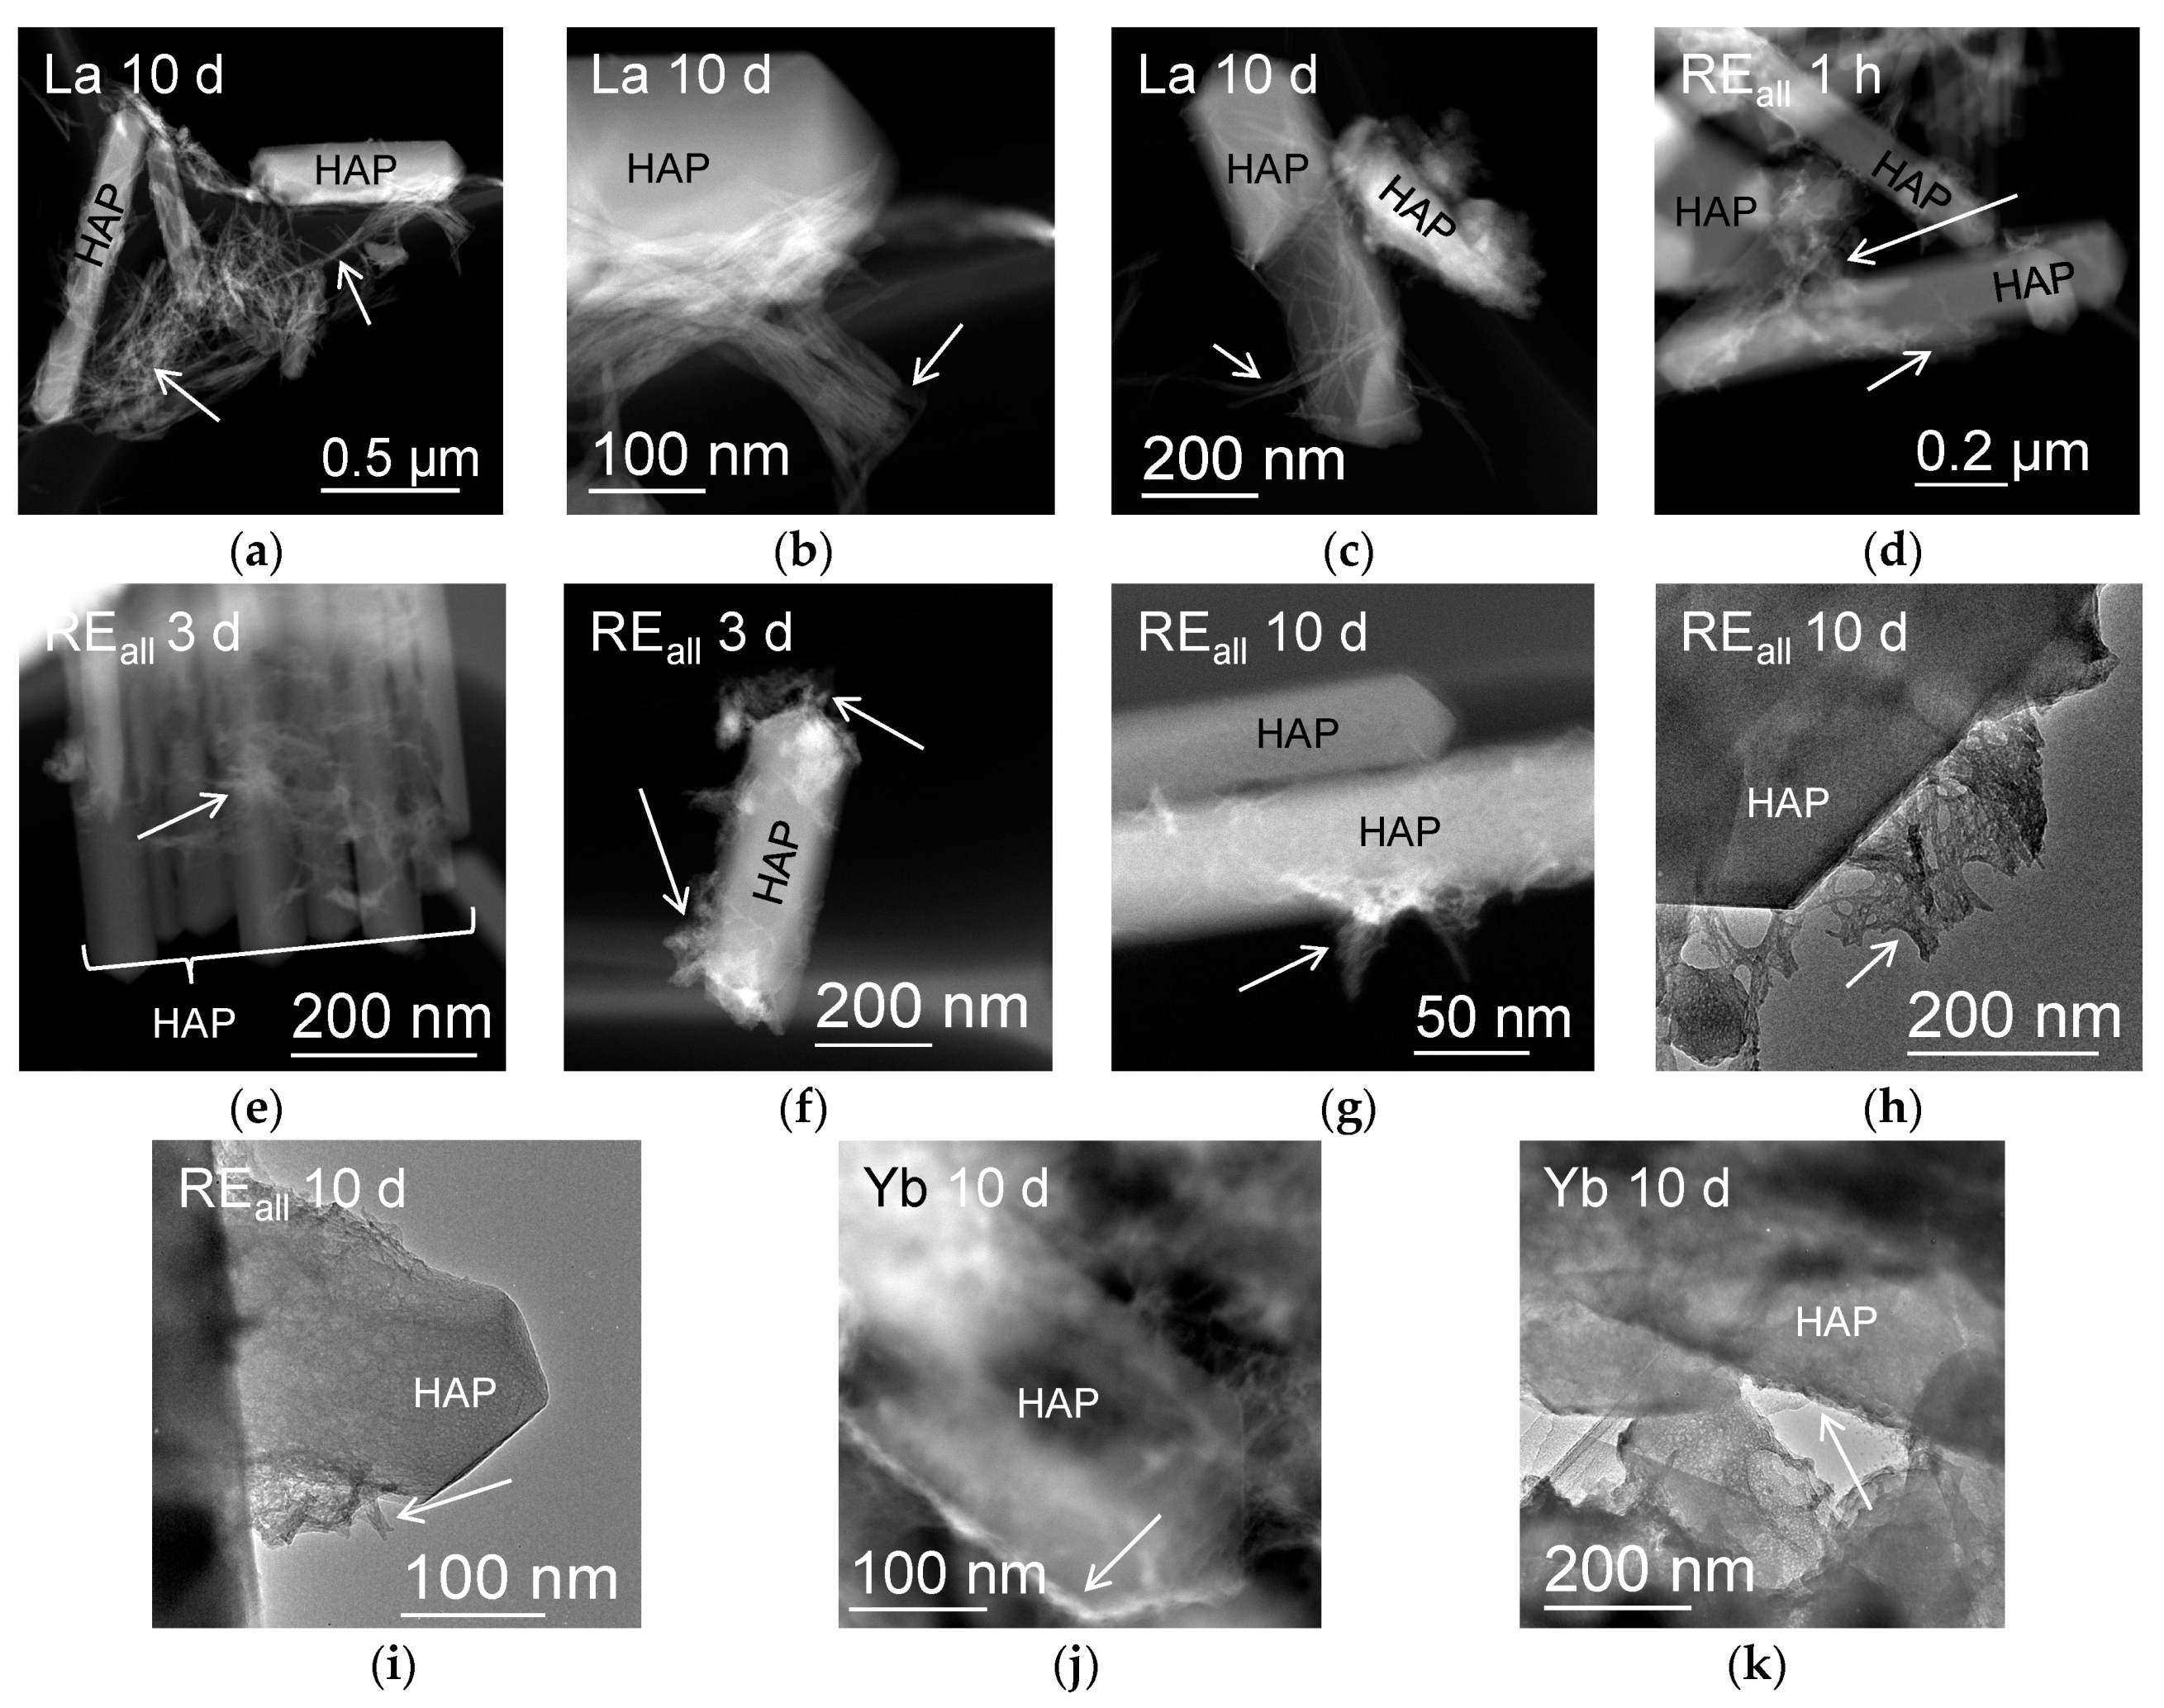
REiPO4,hyd (RE = La, Tb, and Yb) and REallPO4,hyd formed on HAP crystals appear to differ slightly from those formed in mixed solutions. For example, LaPO4 precipitated as fibrous crystals on HAP (Figure 11a–c), in contrast to the rod-shaped crystals precipitated from the mixed solutions. REallPO4,hyd precipitates that formed on HAP exhibit shorter fibrous shaped crystals than the LaPO4,hyd precipitates on HAP (Figure 11d–i). The crystal shapes were not significantly affected by the reaction time. YbPO4,hyd precipitated at the rim of HAP crystals with a non-fibrous morphology (Figure 11j–k), reflecting the rapid precipitation of YbPO4,hyd and consumption of phosphate upon the release of P from the surface of HAP crystals.
4. Discussion
4.1. Properties of REPO4,hyd Formed at Room Temperature
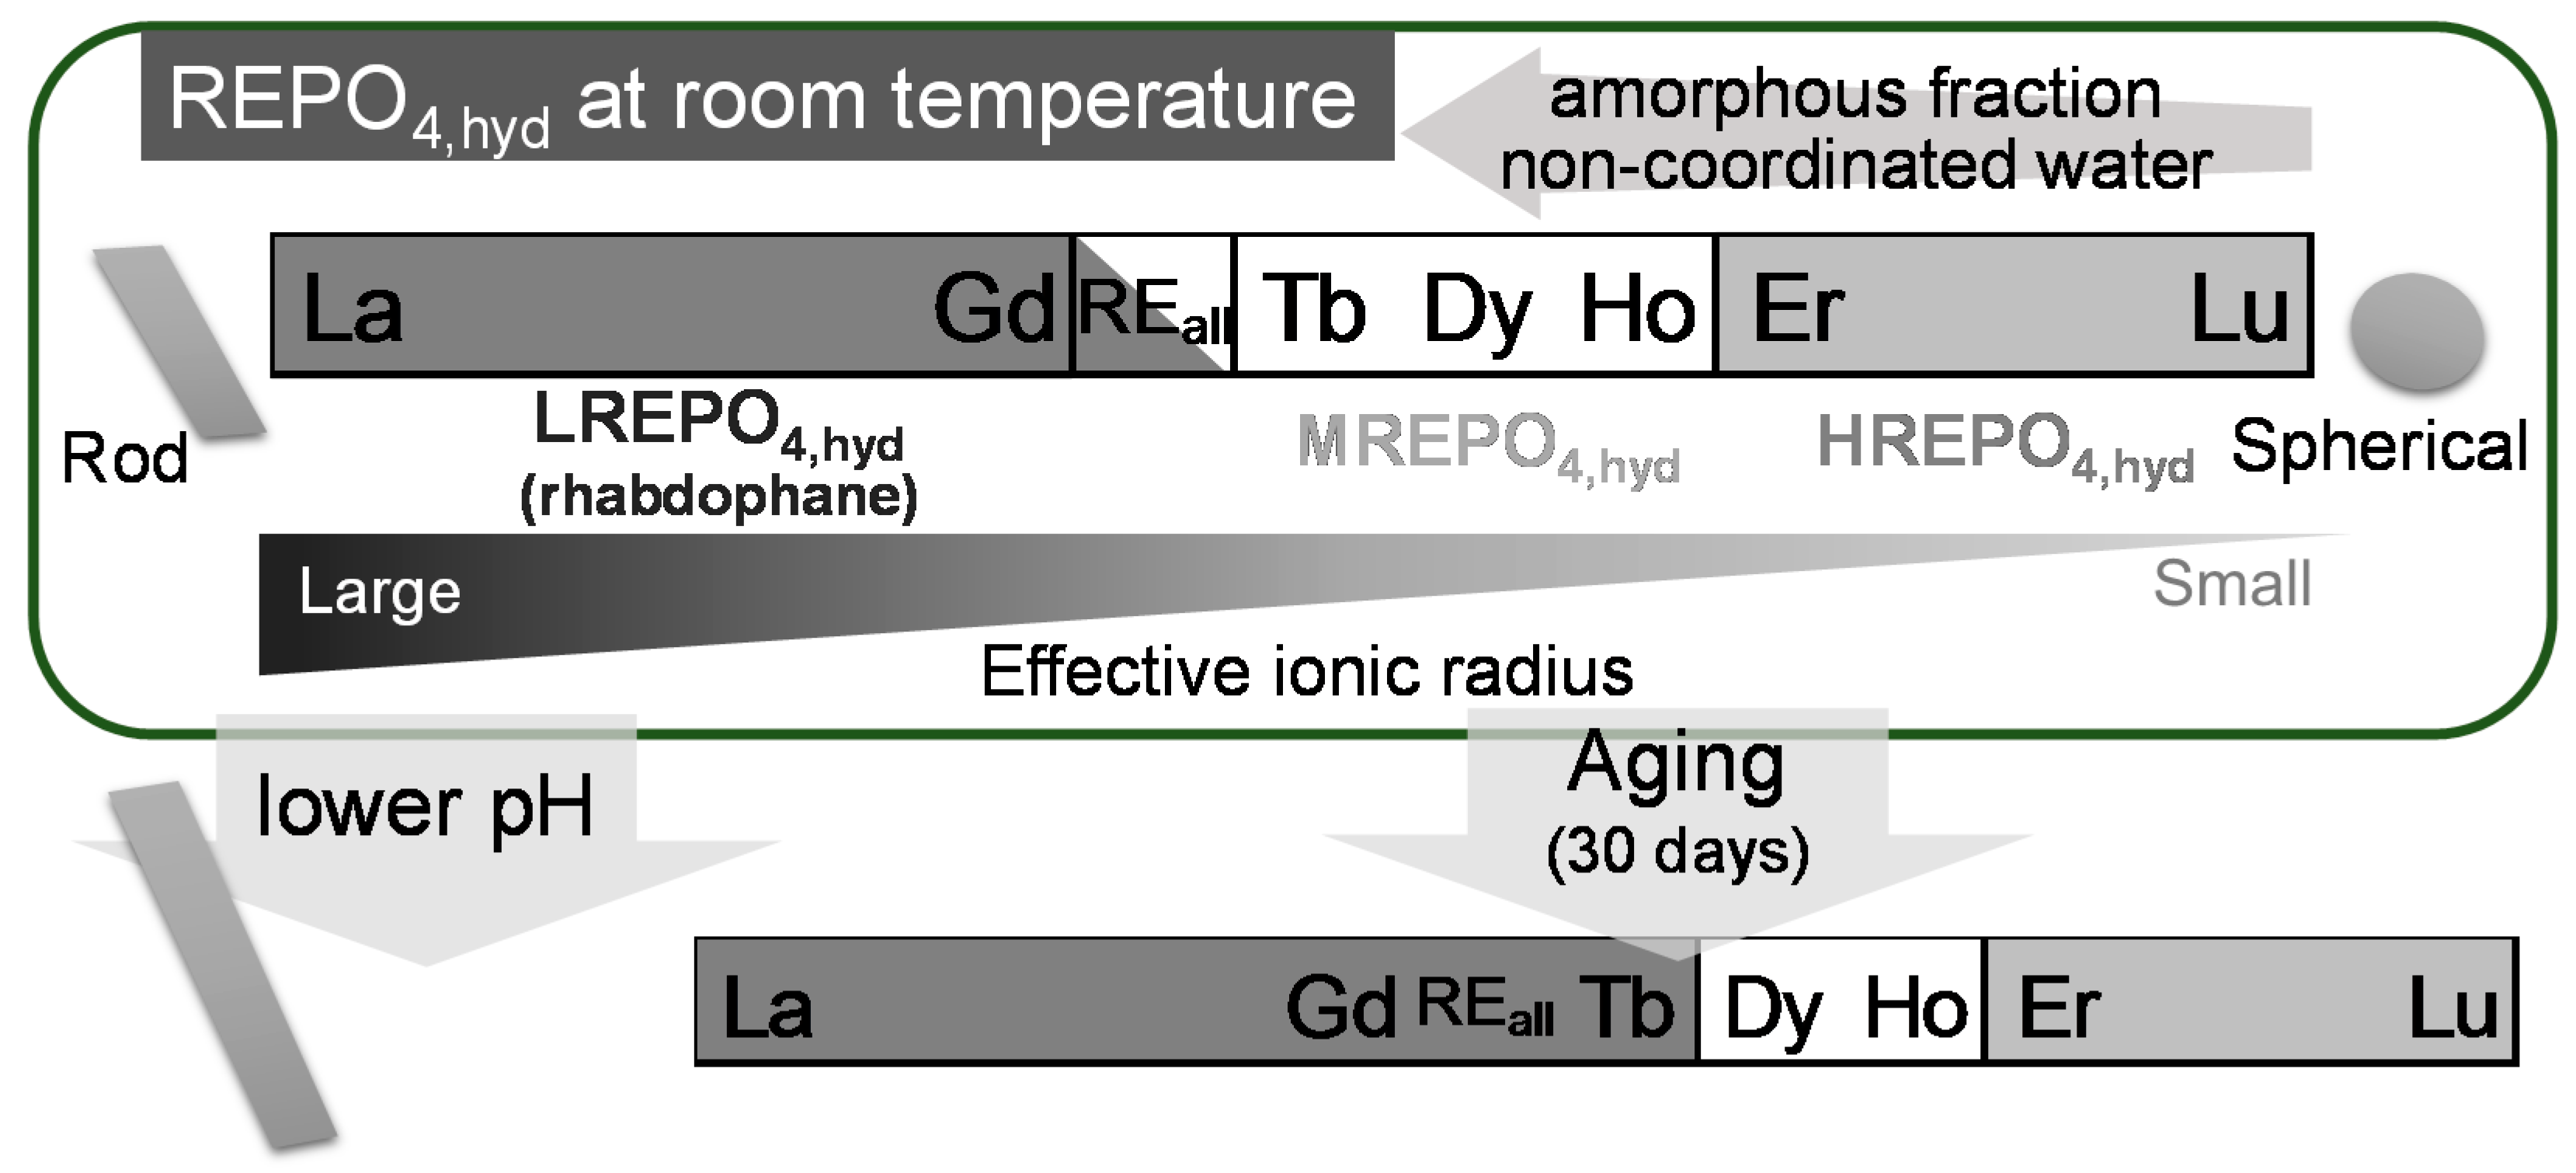
The REPO4,hyd that formed at room temperature in this study and its characteristics are summarized schematically in Figure 12. The LREPO4,hyd that formed at room temperature exhibited a rhabdophane structure similar to [40]. In this study, monazite did not form an primary product from solution at room temperature, although Hikichi and Hukuo [41] and Hikichi et al. [14] reported that monazite formed from aqueous solutions at 50 °C and pH < 1 within 28 days and at pH 5 after 900 days. Previous studies also reported that monazite was formed at 90 °C from solutions at pH < 1 [40,42], proceeded by the rhabdophane structure losing hydrated waters as a function of the aging time [40]. The differences in pH and the elevated temperatures may account for the absence of monazite in the present experiments at room temperature. This study considers mildly-acidic pH ranges relevant to natural environments without forming RE hydroxides, and the results show that monazite is not likely to form at room-temperature conditions.
Hikichi et al. [14] reported that a churchite structure in DyPO4, YPO4, and YbPO4 formed at a pH of 3 at 20 °C; however, Hikichi et al. [43] did not identify a churchite structure for YPO4 at a pH of 3.7 at 50 °C. The present study also did not detect a churchite structure at a pH of 3 at room temperature. The HREPO4,hyd structure did not match the structure of any RE phosphate minerals, and only a few peaks in the XRD pattern corresponding to the anhydrous tetragonal structure of the xenotime structure appeared in the HREPO4,hyd patterns. Such characteristics in the XRD pattern were also recognized in a previous study by Lucas et al. [40] reporting the synthesis of YPO4·nH2O at 50 °C. As described in the results section, the structure of these phases cannot be identified conclusively. However, it is clear that the HREPO4,hyd structure involves not only amorphous features but also some periodic features. In addition, the structural periodicity is very limited, most likely less than 10 nm as a first approximation based on the XRD peak broadness. Indeed, HRTEM images revealed aggregates of particles as small as ~10 nm. In some cases, although the structure could not be clearly seen initially, electron-beam irradiation resulted in the formation of xenotime structure (Figure 9). Such transformation prevented the acquisition of HRTEM images of HREPO4,hyd particles with their original structure. The evidence implies that the original structure is closely related to very small, nanometer-sized particles with a tetragonal structure similar to that of xenotime.
The presence of a structured component in HREPO4,hyd is also supported by the gradual decrease in wavenumber for band 4, corresponding to the antisymmetric stretching vibration, as a function of the REE ionic radius in the FT-IR spectrum. This feature indicates lattice contraction of a configured structure (Figure 5b). There is evidence that the lattices of monazite, rhabdophane, xenotime, and churchite contract and appear as a shift in the bands derived from the P–O stretching vibration mode [34,36,44,45]. The lattice shrinks as it incorporates smaller REEs, and the P–O distance becomes slightly shorter, resulting in greater wavenumbers for this vibration. It is noted that HREPO4,hyd is partially composed of amorphous matter in addition to material with a configured structure, as shown in Figure 3b, and only the structured portion contributes to the shift in the wavenumber. The fact that there was no correlation between the effective ionic radius and the antisymmetric stretching vibration wavenumber in the MREPO4,hyd sample may indicate that no configured structure is present in MREPO4,hyd. Although Lucas et al. [40] detected a structural transformation to churchite after 1 h of reaction at 50 °C in solution, no such structural transition was observed in the present study in aging experiments for HREPO4,hyd at room temperature. This indicates that the HREPO4,hyd structure is stable at room temperature and that structural transformation is slow on the time-scale of the present study.
The XRD analysis revealed that the structure of REallPO4,hyd comprises a combination of the GdPO4,hyd and TbPO4,hyd structures (Figure 1b); however, the both structures in REallPO4,hyd are not composed of the end member compositions of GdPO4,hyd and TbPO4,hyd. Rather they are composed of all REE at almost same composition as that in the starting reagents as evidenced by the EDX analysis (Figure 10a).
In the LaPO4,hyd precipitation experiments, the crystallite size increased with increasing reaction time from 3 days to 30 days (Figure 1a,d and Figure 2a). This ripening behavior in crystallites was also seen for other REEs, as evidenced by the smaller full-width at half-maximum of diffraction peaks after aging (Figure 1a,d). The crystallite size also increased as pH decreased (Figure 1a,c and Figure 2b). This can be explained by the saturation ratio Ω:
where IAP0, Ks0, and η refer to the ion activity product (mol2·dm−6), the solubility product (mol2·dm−6), and the number of ions per formula unit, respectively [46]. Using the parameters Ks0 = 10−25.7 [47] and η = 2 for LaPO4, the value of Ω at pH 1 was calculated in the present study to be four orders of magnitude smaller than that at pH 5 due to the smaller amount of PO43− (Table 7). Stumm [46] recorded that Ω values greater than 1 exponentially induce faster formation of smaller nuclei; hence, lower pH produces larger crystal sizes.
4.2. Thermal Stability of RE Phosphates Formed at Room Temperature
Because secondary RE phosphate minerals that form during rock weathering in surface environments are frequently subjected to subsequent thermal events, the thermal stability of REPO4,hyd that formed at room temperature was evaluated. In the present study, the structures of REPO4,hyd were classified into three categories: LREPO4,hyd corresponds to the rhabdophane structure, whereas the structures of both MREPO4,hyd and HREPO4,hyd could not be conclusively identified. The thermal stability of rhabdophane has been thoroughly investigated in previous studies and the rhabdophane structure is known to be stable up to ~500 °C–800 °C [15,48,49], ~750 °C [50]. The present study focused on the thermal stability of the unidentified structures, MREPO4,hyd and HREPO4,hyd, which were stable in air up to 100–300 °C on the time-scale of the experiments. The thermal stability of these two types of phosphates was comparable to the stability of YPO4·2H2O, in which the churchite structure transforms to the xenotime structure by annealing at ~100 °C for 73 h and at ~200 °C within 1 h [50,51]. Non-coordinated water seems to be unrelated to the crystal structure, based on a comparison between the TG-DTA charts and the XRD patterns of heated samples (Figure 4 and Figure 6). Although Mesbah et al. [52] reported that two-step dehydration processes of well-crystalline rhabdophane in detail, the present study demonstrated that structural transitions occurred during the second dehydration step (after the local minimum in the DTG spectrum) for LREPO4,hyd and HREPO4,hyd, or during crystallization (at the DTA peak of exothermic) for MREPO4,hyd and REallPO4,hyd. As noted above, the initial structure can survive up to a certain temperature, at least 120 °C. The TbPO4,hyd structure does not possess a perfect rhabdophane structure, but persists up to 300 °C under dry conditions, although rhabdophane forms after 30 days of aging in solution (Figure 1d). Thus, REPO4,hyd formed at room temperature is more stable under dry conditions than wet conditions. Therefore, when the average ionic radii are larger than that of Tb (1.04 Å), the initial structure of REPO4,hyd is not stable and will transform to the rhabdophane structure by aging under wet conditions at room temperature.
4.3. Formation of REPO4,hyd on Apatite at Room Temperature
In REPO4,hyd formation experiments using apatite as a source of P, the dissolution rate of HAP in a RE3+ solution was determined to be 7.3 × 10⁻⁹ mol·m−2·min−1 based on the rate of Ca release from HAP for a period of 3–24 h, as shown in Figure 8a. The pH of the solution remained within 5.5–5.6 during the period, after an initial increase in pH from ~5.1 in the first 3 h. The dissolution rate calculated in the present study is comparable with the dissolution rate determined by a previous study in pure water; 10−7–10−9 mol·m−2·min−1 at pHs ranging from 2–7 [53], indicating that the presence of soluble REEs in solution does not significantly affect the dissolution rate of HAP.
The solution pH adjacent to the HAP surface could be slightly higher than that of the bulk solution. However, RE hydroxide was not characterized in the present study, indicating that the local pH at the HAP surface did not exceed ~8.
RE phosphates precipitated at the surface of apatite crystals through dissolution–precipitation mechanisms without the involvement of further mechanisms, such as epitaxial growth and pseudomorphism, which were previously reported in experiments on apatite interaction with aqueous Pb [30]. In general, epitaxial growth and pseudomorphism only occur when the crystallographic characteristics, such as the lattice parameter of the secondary precipitate, are closely related to those of the substrate and when a difference in solubility between the original and secondary mineral acts as the driving force [54,55,56]. The crystallographic parameters of the RE phosphate precipitates that were characterized in the present study (LREPO4,hyd (rhabdophane), MREPO4,hyd, and HREPO4,hyd) are not related to those of HAP, preventing the occurrence of those two specific mechanisms. Thus, dissolution–precipitation on apatite surfaces without the lattice relationship is the only mechanism expected for the initial formation of hydrous RE phosphates at ambient temperature in nature. Indeed, rhabdophane crystals associated with apatite were found to be crystallographically unrelated to apatite in natural environments [23], whereas the dissolution–precipitation mechanisms at high temperature >300 °C were reported to exhibit the topotaxial lattice relationship between apatite and monazite [57,58].
5. Implications
In the present study, only the rhabdophane structure was conclusively identified, which was constrained by the average ionic radius calculated according to the proportion of each constituent REE. This finding can be applied to predict the initial structure of hydrated RE phosphates formed in natural surface environments. However, natural systems involve more complicated species, such as other ions and organic matter. Organic ligands can produce smaller particles [59]. Organic matter, in particular, has the potential to control the stability of the rhabdophane structure, as some previous studies have reported that the rhabdophane structure was stable even for HREE (Yb, Lu) when organic matter was added to the starting reagent [60,61,62] or mechanical treatment was used to introduce it to the churchite structure [49,63]. A natural occurrence of rhabdophane-Y was reported by Takai and Uehara [64]; however, the mineral they discovered contains a wide variety of other LREE including ~20 wt % La2O3 and 15 wt % Nd2O3 in addition to ~15 wt % Y2O3. Thus, their report is consistent with the results obtained in the present experiments, which conclude that the structure is determined by the average ionic radius for phases that include multiple REEs.
Aqueous REEs frequently become immobilized in phosphate minerals by the consumption of apatite or they are simply bound to aqueous P during alteration processes [27,64]. Under typical environmental conditions, the hydrated RE phosphates observed in the present study are expected to initially form at nanoscale sizes. As natural water is not supersaturated with regard to RE phosphates [65] when compared with the composition of solutions used in this study, actual RE phosphates may slowly precipitate as larger crystals locally near apatite grains in natural aquifers than those observed in the present study.
The observed development of REE patterns during the formation and aging of REallPO4,hyd suggests that REE fractionation during the formation of nanoscale REallPO4,hyd is plausible. Therefore, the REE pattern for rhabdophane is not identical to that of the reacting solution. This is of particular importance when mineral REE patterns are used to estimate certain geochemical conditions of the ambient environment, such as oxidation states, compared with REE patterns of bedrock [22]. If specific phosphate minerals such as rhabdophane are dominant in a weathering profile, the chemical composition of the RE phosphate may constrain the bulk REE composition of the weathered profile, as demonstrated by a previous field study [66]. In the present study, only REE fractionation into the rhabdophane structure was examined. Further experiments are needed in order to evaluate REE fractionation into other structures such as MREPO4,hyd and HREPO4,hyd by varying the average ionic radius over all REEs.
Previous studies highlighted the importance of biomineralization of RE phosphates in constraining the mobility of REEs in the environment [20,21,67]. In these studies, biogenic Ce phosphate was characterized as having a needle-shaped rhabdophane structure [20], while Yb phosphate precipitated as amorphous nanoparticles ~50 nm in size [21]. The structure and morphology of these phases are very similar to those of LREPO4,hyd and HREPO4,hyd observed in the present study. Hydrous RE phosphate precipitation as a result of microbial activity was also reported in a weathering profile of granite [67]. Given that the majority of P in extracellular substances occurs as orthophosphate [68], the crystallographic nature of biogenic RE phosphates may be mainly controlled by the combined effects of the inorganic reaction processes elucidated in the present study and the effects of organically-bound P species.
Supplementary Materials
The following are available online at www.mdpi.com/2075-163X/7/5/84/s1, Figure S1: XRD patterns of REiPO4,hyd (RE = (a) La, (b) Tb, (c) Yb) and (d) REallPO4,hyd formed on HAP, Figure S2: Results of deconvolution of the XRD pattern obtained for REPO4,hyd.
Acknowledgments
This study is partially supported by Japan Science and Technology Agency (JST) Initiatives for Atomic Energy Basic and Generic Strategic Research and by a Grant-in-Aid for Scientific Research (KAKENHI) from the Japan Society for the Promotion of Science (16K12585, 16H04634). The authors would like to thank the emeritus professor, Takashi Murakami, of the University of Tokyo for his detailed comments on the early version of this manuscript, and Hiroyuki Shiotsu for helpful discussions during the course of this study. The authors are grateful to Midori Watanabe for her assistance on XRD, TG-DTA, and FT-IR analyses at the Center of Advanced Instrumental Analysis, Kyushu University. The findings and conclusions of the authors of this paper do not necessarily state or reflect those of the JST.
Author Contributions
Satoshi Utsunomiya conceived and designed the experiments; Asumi Ochiai performed the experiments and analyzed the data; and Asumi Ochiai and Satoshi Utsunomiya wrote the paper.
Conflicts of Interest
The authors declare no conflict of interest.
References
- Gai, S.; Li, C.; Yang, P.; Lin, J. Recent progress in rare earth micro/nanocrystals: Soft chemical synthesis, luminescent properties, and biomedical applications. Chem. Rev. 2014, 114, 2343–2389. [Google Scholar] [CrossRef] [PubMed]
- Chapman, N.A.; Smellie, J.A.T. Special issue—Natural analogs to the conditions around a final repository for high-level radioactive-waste—Introduction and summary of the workshop. Chem. Geol. 1986, 55, 167–173. [Google Scholar] [CrossRef]
- Choppin, G.R. Comparison of the solution chemistry of the actinides and lanthanides. J. Less Common Met. 1983, 93, 323–330. [Google Scholar] [CrossRef]
- Choppin, G.R. Comparative solution chemistry of the 4f and 5f elements. J. Alloys Compd. 1995, 223, 174–179. [Google Scholar] [CrossRef]
- Ni, Y.; Hughes, J.M.; Mariano, A.N. Crystal chemistry of the monazite and xenotime structures. Am. Mineral. 1995, 80, 21–26. [Google Scholar] [CrossRef]
- Mooney, R.C.L. X-ray diffraction study of cerous phosphate and related crystals. I. Hexagonal modification. Acta Crystallogr. 1950, 3, 337–340. [Google Scholar] [CrossRef]
- Kohlmann, M.; Sowa, H.; Reithmayer, K.; Schulz, H. Structure of a Y1−x(Gd,Dy,Er)xPO4·2H2O microcrystal using synchrotron radiation. Acta Crystallogr. C 1994, 50, 1651–1652. [Google Scholar] [CrossRef]
- Mesbah, A.; Clavier, N.; Elkaim, E.; Gausse, C.; Kacem, I.B.; Szenknect, S.; Dacheux, N. Monoclinic form of the rhabdophane compounds: REEPO4·0.667H2O. Cryst. Growth Des. 2014, 14, 5090–5098. [Google Scholar] [CrossRef]
- Braun, J.-J.; Pagel, M.; Herbillon, A.; Rosin, C. Mobilization and redistribution of REEs and thorium in a syenitic lateritic profile: A mass balance study. Geochim. Cosmochim. Acta 1993, 57, 4419–4434. [Google Scholar] [CrossRef]
- Braun, J.-J.; Viers, J.; Dupré, B.; Polve, M.; Ndam, J.; Muller, J.-P. Solid/liquid REE fractionation in the lateritic system of Goyoum, East Cameroon: The implication for the present dynamics of the soil covers of the humid tropical regions. Geochim. Cosmochim. Acta 1998, 62, 273–299. [Google Scholar] [CrossRef]
- Stille, P.; Pierret, M.-C.; Steinmann, M.; Chabaux, F.; Boutin, R.; Aubert, D.; Pourcelot, L.; Morvan, G. Impact of atmospheric deposition, biogeochemical cycling and water-mineral interaction on REE fractionation in acidic surface soils and soil water (the Strengbach case). Chem. Geol. 2009, 264, 173–186. [Google Scholar] [CrossRef]
- Sanematsu, K.; Kon, Y.; Imai, A.; Watanabe, K.; Watanabe, Y. Geochemical and mineralogical characteristics of ion-adsorption type REE mineralization in Phuket, Thailand. Miner. Depos. 2013, 48, 437–451. [Google Scholar] [CrossRef]
- Berger, A.; Janots, E.; Gnos, E.; Frei, R.; Bernier, F. Rare earth element mineralogy and geochemistry in a laterite profile from Madagascar. Appl. Geochem. 2014, 41, 218–228. [Google Scholar] [CrossRef]
- Hikichi, Y.; Hukuo, K.; Shiokawa, J. Synthesis of rare earth orthophosphates. Bull. Chem. Soc. Jpn. 1978, 51, 3645–3646. [Google Scholar] [CrossRef]
- Hikichi, Y.; Murayama, K.; Ohsato, H.; Nomura, T. Thermal changes of rare earth phosphate minerals. J. Mineral. Soc. Jpn. 1989, 19, 117–126. [Google Scholar] [CrossRef]
- Fang, Y.P.; Xu, A.W.; Song, R.Q.; Zhang, H.X.; You, L.P.; Yu, J.C.; Liu, H.Q. Systematic synthesis and characterization of single-crystal lanthanide orthophosphate nanowires. J. Am. Chem. Soc. 2003, 125, 16025–16034. [Google Scholar] [CrossRef] [PubMed]
- Dacheux, N.; Clavier, N.; Podor, R. Monazite as promising long-term radioactive waste matrix: Benefits of high-structural flexibility and chemical durability. Am. Mineral. 2013, 98, 833–847. [Google Scholar] [CrossRef]
- Deschanels, X.; Seydoux-Guillaume, A.M.; Magnin, V.; Mesbah, A.; Tribet, M.; Moloney, M.P.; Serruys, Y.; Peuget, S. Swelling induced by alpha decay in monazite and zirconolite ceramics: A XRD and TEM comparative study. J. Nucl. Mater. 2014, 448, 184–194. [Google Scholar] [CrossRef]
- Yan, R.; Sun, X.; Wang, X.; Peng, Q.; Li, Y. Crystal structures, anisotropic growth, and optical properties: Controlled synthesis of Lanthanide orthophosphate one-dimensional nanomaterials. Chem. Eur. J. 2005, 11, 2183–2195. [Google Scholar] [CrossRef] [PubMed]
- Jiang, M.; Ohnuki, T.; Kozai, N.; Tanaka, K.; Suzuki, Y.; Sakamoto, F.; Kamiishi, E.; Utsunomiya, S. Biological nano-mineralization of Ce phosphate by Saccharomyces cerevisiae. Chem. Geol. 2010, 277, 61–69. [Google Scholar] [CrossRef]
- Jiang, M.; Ohnuki, T.; Tanaka, K.; Kozai, N.; Kamiishi, E.; Utsunomiya, S. Post-adsorption process of Yb phosphate nano-particle formation by Saccharomyces cerevisiae. Geochim. Cosmochim. Acta 2012, 93, 30–46. [Google Scholar] [CrossRef]
- Murakami, T.; Utsunomiya, S.; Imazu, Y.; Prasad, N. Direct evidence of late Archean to early Proterozoic anoxic atmosphere from a product of 2.5 Ga old weathering. Earth Planet. Sci. Lett. 2001, 184, 523–528. [Google Scholar] [CrossRef]
- Ichimura, K.; Murakami, T. Formation of rare earth phosphate minerals in 2.45-Ga paleosol. J. Mineral. Petrol. Sci. 2009, 104, 86–91. [Google Scholar] [CrossRef]
- Forster, H.J. The chemical composition of REE-Y-Th-U-rich accessory minerals in peraluminous granites of the Erzgebirge-Fichtelgebirge region, Germany. Part II: Xenotime. Am. Mineral. 1998, 83, 1302–1315. [Google Scholar] [CrossRef]
- Bingen, B.; Demaiffe, D.; Hertogen, J. Redistribution of rare earth elements, thorium, and uranium over accessory minerals in the course of amphibolite to granulite facies metamorphism: The role of apatite and monazite in orthogneisses from southwestern Norway. Geochim. Cosmochim. Acta 1996, 60, 1341–1354. [Google Scholar] [CrossRef]
- Ohnuki, T.; Kozai, N.; Samadfam, M.; Yasuda, R.; Kamiya, T.; Sakai, T.; Murakami, T. Analysis of uranium distribution in rocks by μ-PIXE. Nucl. Inst. Methods Phys. Res. B 2001, 181, 586–592. [Google Scholar] [CrossRef]
- Stille, P.; Gauthier-Lafaye, F.; Jensen, K.A.; Salah, S.; Bracke, G.; Ewing, R.C.; Louvat, D.; Million, D. REE mobility in groundwater proximate to the natural fission reactor at Bangombé (Gabon). Chem. Geol. 2003, 198, 289–304. [Google Scholar] [CrossRef]
- Horie, K.; Hidaka, H.; Gauthier-Lafaye, F. Isotopic evidence for trapped fissiogenic REE and nucleogenic Pu in apatite and Pb evolution at the Oklo natural reactor. Geochim. Cosmochim. Acta 2004, 68, 115–125. [Google Scholar] [CrossRef]
- Hidaka, H.; Kikuchi, M. SHRIMP in situ isotopic analyses of REE, Pb and U in micro-minerals bearing fission products in the Oklo and Bangombe natural reactors: A review of a natural analogue study for the migration of fission products. Precambr. Res. 2010, 183, 158–165. [Google Scholar] [CrossRef]
- Kamiishi, E.; Utsunomiya, S. Nano-scale reaction processes at the interface between apatite and aqueous lead. Chem. Geol. 2013, 340, 121–130. [Google Scholar] [CrossRef]
- Utsunomiya, S.; Ewing, R.C. Application of high-angle annular dark field scanning transmission electron microscopy, scanning transmission electron microscopy-energy dispersive X-ray spectrometry, and energy-filtered transmission electron microscopy to the characterization of nanoparticles in the environment. Environ. Sci. Technol. 2003, 37, 786–791. [Google Scholar] [PubMed]
- Shannon, R.D. Revised effective ionic radii and systematic studies of interatomic distances in halides and chalcogenides. Acta Crystallogr. A 1976, 32, 751–767. [Google Scholar] [CrossRef]
- Hezel, A.; Ross, S.D. Forbidden transitions in the infra-red spectra of tetrahedral anions—III. Spectra-structure correlations in perchlorates, sulphates and phosphates of the formula MXO4. Spectrochim. Acta 1966, 22, 1949–1961. [Google Scholar] [CrossRef]
- Assaaoudi, H.; Ennaciri, A.; Rulmont, A. Vibrational spectra of hydrated rare earth orthophosphates. Vib. Spectrosc. 2001, 25, 81–90. [Google Scholar] [CrossRef]
- Heuser, J.; Bukaemskiy, A.A.; Neumeier, S.; Neumann, A.; Bosbach, D. Raman and infrared spectroscopy of monazite-type ceramics used for nuclear waste conditioning. Prog. Nucl. Energy 2014, 72, 149–155. [Google Scholar] [CrossRef]
- Kijkowska, R.; Cholewka, E.; Duszak, B. X-ray diffraction and Ir-absorption characteristics of lanthanide orthophosphates obtained by crystallization from phosphoric acid solution. J. Mater. Sci. 2003, 38, 223–228. [Google Scholar] [CrossRef]
- Masuda, A.; Ikeuchi, Y. Lanthanide tetrad effect observed in marine environment. Geochem. J. 1979, 13, 19–22. [Google Scholar] [CrossRef]
- Lee, J.H.; Byrne, R.H. Examination of comparative rare earth element complexation behavior using linear free-energy relationships. Geochim. Cosmochim. Acta 1992, 56, 1127–1137. [Google Scholar] [CrossRef]
- Langmuir, D. Aqueous Environmental Geochemistry; Prentice-Hall: Upper Saddle River, NJ, USA, 1997; p. 602. [Google Scholar]
- Lucas, S.; Champion, E.; Breigiroux, D.; Bernache-Assollant, D.; Audubert, F. Rare earth phosphate powders RePO4·nH2O (Re = La, Ce or Y)—Part I. Synthesis and characterization. J. Solid State Chem. 2004, 177, 1302–1311. [Google Scholar] [CrossRef]
- Hikichi, Y.; Hukuo, K. Synthesis of monazite in aqueous solution. Nippon Kagaku Kaishi 1975, 8, 1311–1314. [Google Scholar] [CrossRef]
- Hukuo, K.; Hikichi, Y. Synthesis of hexagonal cerium phosphate from aqueous solution. Nippon Kagaku Kaishi 1975, 4, 622–626. [Google Scholar] [CrossRef]
- Hikichi, Y.; Hukuo, K.; Shiokawa, J. Synthesis of xenotime (YPO4) by precipitation from aqueous solution. Nippon Kagaku Kaishi 1978, 2, 186–189. [Google Scholar] [CrossRef]
- Begun, G.M.; Beall, G.W.; Boatner, L.A.; Gregor, W.J. Raman spectra of the rare earth orthophosphates. J. Raman Spectrosc. 1981, 11, 273–278. [Google Scholar] [CrossRef]
- Assaaoudi, H.; Ennaciri, A. Vibrational spectra and structure of rare earth orthophosphates, weinschenkite type. Spectrochim. Acta A 1997, 53, 895–902. [Google Scholar] [CrossRef]
- Stumm, W. Chemistry of the Solid-Water Interface. Processes at the Mineral-Water and Particle-Water Interface in Natural Systems; John Wiley & Sons: New York, NY, USA, 1992; p. 428. [Google Scholar]
- Cetiner, Z.S.; Wood, S.A.; Gammons, C.H. The aqueous geochemistry of the rare earth elements. Part XIV. The solubility of rare earth element phosphates from 23 to 150 °C. Chem. Geol. 2005, 217, 147–169. [Google Scholar] [CrossRef]
- Utsunomiya, S.; Murakami, T.; Nakada, M.; Kasama, T. Iron oxidation state of a 2.45-Byr-old paleosol developed on mafic volcanics. Geochim. Cosmochim. Acta 2003, 67, 213–221. [Google Scholar] [CrossRef]
- Hikichi, Y.; Sasaki, T.; Murayama, K.; Nomura, T. Mechanochemical changes of weinschenkite-type RPO4·2H2O (R = Dy, Y, Er, or Yb) by grinding and thermal reactions of the ground specimens. J. Am. Ceram. Soc. 1989, 72, 1073–1076. [Google Scholar] [CrossRef]
- Lucas, S.; Champion, E.; Bernache-Assollant, D.; Leroy, G. Rare earth phosphate powders RePO4·nH2O (Re = La, Ce or Y)—Part II. Thermal behavior. J. Solid State Chem. 2004, 177, 1312–1320. [Google Scholar] [CrossRef]
- Hikichi, Y.; Hukuo, K.; Shiokawa, J. Synthesis of monoclinic YPO4·2H2O and its thermal change. Nippon Kagaku Kaishi 1977, 11, 1634–1638. [Google Scholar] [CrossRef]
- Mesbah, A.; Clavier, N.; Elkaim, E.; Szenknect, S.; Dacheux, N. In pursuit of the rhabdophane crystal structure: From the hydrated monoclinic LnPO4·0.667H2O to the hexagonal LnPO4 (Ln = Nd, Sm, Gd, Eu and Dy). J. Solid State Chem. 2017, 249, 221–227. [Google Scholar] [CrossRef]
- Valsami-Jones, E.; Ragnarsdottir, K.V.; Putnis, A.; Bosbach, D.; Kemp, A.J.; Cressey, G. The dissolution of apatite in the presence of aqueous metal cations at pH 2–7. Chem. Geol. 1998, 151, 215–233. [Google Scholar] [CrossRef]
- Putnis, A. Mineral replacement reactions: from macroscopic observations to microscopic mechanisms. Mineral. Mag. 2002, 66, 689–708. [Google Scholar] [CrossRef]
- Putnis, A.; Putnis, C.V. The mechanism of reequilibration of solids in the presence of a fluid phase. J. Solid State Chem. 2007, 180, 1783–1786. [Google Scholar] [CrossRef]
- Xia, F.; Brugger, J.; Chen, G.; Ngothai, Y.; O’Neill, B.; Putnis, A.; Pring, A. Mechanism and kinetics of pseudomorphic mineral replacement reactions: A case study of the replacement of pentlandite by violarite. Geochim. Cosmochim. Acta 2009, 73, 1945–1969. [Google Scholar] [CrossRef]
- Harlov, D.E.; Wirth, R.; Förster, H.-J. An experimental study of dissolution-reprecipitation in fluorapatite: Fluid infiltration and the formation of monazite. Contrib. Mineral. Petrol. 2005, 150, 268–286. [Google Scholar] [CrossRef]
- Harlov, D.E. Apatite: A fingerprint for metasomatic processes. Elements 2015, 11, 171–176. [Google Scholar] [CrossRef]
- Boakye, E.E.; Mogilevsky, P.; Hay, R.S. Synthesis of nanosized spherical rhabdophane particles. J. Am. Ceram. Soc. 2005, 88, 2740–2746. [Google Scholar]
- Hikichi, Y.; Ota, T.; Hattori, T.; Imaeda, T. Synthesis and thermal reactions of rhabdophane-(Y). Mineral. J. 1996, 18, 87–96. [Google Scholar] [CrossRef]
- Min, W.; Daimon, K.; Ota, T.; Matsubara, T.; Hikichi, Y. Synthesis and thermal reactions of rhabdophane-(Yb or Lu). Mater. Res. Bull. 2000, 35, 2199–2205. [Google Scholar] [CrossRef]
- Ito, H.; Fujishiro, Y.; Sato, T.; Okuwaki, A. Preparation of lanthanide orthophosphates by homogeneous precipitation under hydrothermal conditions using lanthanide-EDTA chelates. Br. Ceram. Trans. 1995, 94, 146–150. [Google Scholar]
- Hikichi, Y.; Yogi, K.; Ota, T. Preparation of rhabdophane-type RPO4·nH2O (R = Y or Er, n = 0.7–0.8) by pot-milling churchite-type RPO4·2H2O at 20–25 °C in air. J. Alloys Compd. 1995, 224, L1–L3. [Google Scholar] [CrossRef]
- Takai, Y.; Uehara, S. Rhabdophane-(Y), YPO4·H2O, a new mineral in alkali olivine basalt from Hinodematsu, Genkai-cho, Saga Prefecture, Japan. J. Mineral. Petrol. Sci. 2012, 107, 110–113. [Google Scholar] [CrossRef]
- Roncal-Herrero, T.; Rodríguez-Blanco, J.D.; Oelkers, E.H.; Benning, L.G. The direct precipitation of rhabdophane (REEPO4·nH2O) nano-rods from acidic aqueous solutions at 5–100 °C. J. Nanopart. Res. 2011, 13, 4049–4062. [Google Scholar] [CrossRef]
- Aubert, D.; Stille, P.; Probst, A. REE fractionation during granite weathering and removal by waters and suspended loads: Sr and Nd isotopic evidence. Geochim. Cosmochim. Acta 2001, 65, 387–406. [Google Scholar] [CrossRef]
- Taunton, A.E.; Welch, S.A.; Banfield, J.F. Microbial controls on phosphate and lanthanide distributions during granite weathering and soil formation. Chem. Geol. 2000, 169, 371–382. [Google Scholar] [CrossRef]
- Masaki, S.; Shiotsu, H.; Ohnuki, T.; Sakamoto, F.; Utsunomiya, S. Effects of CeO2 nanoparticles on microbial metabolism. Chem. Geol. 2015, 391, 33–41. [Google Scholar] [CrossRef]
Figure 1.
(a) XRD patterns of REiPO4,hyd (RE =La-Lu except Pm) and REallPO4,hyd reacted at pH 3 for 3 days at room temperature. The patterns are arranged in order of increasing effective ionic radius from top to bottom; (b) comparison between XRD pattern of REallPO4,hyd and a calculated linear combination of the patterns of GdPO4,hyd + TbPO4,hyd, which indicate proportions of 35% GdPO4,hyd and 65% TbPO4,hyd in the pattern based on a least-squares fitting method. The difference in the profiles between REallPO4,hyd and the calculation is also shown; (c) XRD patterns of LaPO4,hyd reacted at pH 1 and 5 for 3 days; (d) XRD patterns of REiPO4,hyd (RE = La, Tb, Dy, Ho, Yb) and REallPO4,hyd reacted at pH 3 for 30 days, accompanied by XRD patterns of rhabdophane-(Sm) and xenotime-(Lu) with Miller indexes from [5,8].


Figure 2.
Crystallite sizes of LaPO4,hyd calculated based on the Scherrer equation using JADE software. (a) LaPO4,hyd formed at pH 3 after 3 or 30 days; (b) LaPO4,hyd formed at pH values of 1, 3, and 5 after 3 days.
Figure 2.
Crystallite sizes of LaPO4,hyd calculated based on the Scherrer equation using JADE software. (a) LaPO4,hyd formed at pH 3 after 3 or 30 days; (b) LaPO4,hyd formed at pH values of 1, 3, and 5 after 3 days.

Figure 3.
(a) Lattice volume of LREPO4,hyd (RE = La-Gd) calculated using JADE software, accompanied by a linear regression line; (b) crystallinity of REiPO4,hyd (RE = Dy-Lu) determined from XRD patterns calculated using JADE. These values indicate the intensity percentage of a crystalline peak Ic, which is obtained by subtracting the intensity of the amorphous halo Ia appearing at a 2-theta value of 20–30 degrees as: Crystallinity (%) = Ic/(Ic + Ia).

Figure 4.
Transition in XRD patterns of REiPO4,hyd (RE = Tb, Dy, Ho, Yb) and REallPO4,hyd formed at pH 3 for 3 days at room temperature during annealing up to 500 °C. The patterns of each REPO4,hyd are accompanied by the spectrum of the ideal RE phosphate minerals; rhabdophane, monazite, and xenotime, based on [5,8], where r.t. represents room temperature. A circle indicates peaks exhibiting structural transformation.

Figure 5.
(a) IR spectra of REiPO4,hyd (RE = La-Lu) and REallPO4,hyd reacted at pH 3 for 3 days. The bands labeled 1–2, 3–4, 5, and 6 correspond to the P–O bending, P–O antisymmetric stretching, O–H bending, and O–H stretching vibrations, respectively; (b) a diagram showing the wavenumber of the P–O antisymmetric stretching vibration (labeled 4 in Figure 5a) of REiPO4,hyd (RE = La-Lu) and REallPO4,hyd as a function of the effective ionic radius; (c) IR spectra of REiPO4,hyd (RE = La, Tb, Dy, Ho, Yb) and REallPO4,hyd reacted at pH 3 for 30 days.

Figure 6.
Differential thermogravimetric and thermal spectra of REiPO4,hyd (RE = La-Lu) and REallPO4,hyd reacted at pH 3 for 3 days. REiPO4,hyd (RE = La, Tb, Yb) and REallPO4,hyd reacted for 30 days are also shown. The black dotted line indicates the DTG curve and the red solid line represents the DTA heat flow.

Figure 7.
(a) The number of water molecules per formula unit in REPO4,hyd plotted as a function of REE ionic radius determined based on the TG-DTA results (Figure 6); the amounts of water dissociated during (b) the first dehydration step and (c) the second dehydration step calculated for LREPO4,hyd and HREPO4,hyd.

Figure 8.
(a) Time-dependent concentrations of P (filled green triangles), Ca (filled purple squares), and all RE (filled light green circles) in solution during the experiment with HAP in contact with a RE3+ solution; (b) development of REE patterns in the solution as a function of time. The concentrations were normalized to the initial concentration; (c) thermodynamic calculation of aqueous RE3+ species in solution at a pH of 5 under the conditions of the present study. Concentration of free (non-coordinated) RE3+ calculated by subtracting the concentration of RECO3+ and REOH2+ from the initial concentration of RE3+ (0.14 mM of each RE3+); (d) the concentrations of RECO3+ and REOH2+ obtained by multiplying the initial concentrations of RE3+ (0.14 mM of each La-Lu), the concentration of CO32− or OH−, and the formation constant CO3β1 or OHβ1 [38]. The concentrations of CO32− and OH− were calculated using Geochemist’s Workbench with the thermodynamic database thermo.dat and input data of pH 5 and PCO2 = 10−3.5 bar [39].

Figure 9.
Top panels: Bright-field TEM image of REiPO4,hyd (RE = La, Nd, Tb, Dy, Ho, Tm, Lu) and REallPO4,hyd formed at pH 3 for 3 days. Bottom panels: Selected-area electron diffraction pattern of REiPO4,hyd (RE = La-Lu) and REallPO4,hyd formed at pH 3 for 3 days. White lines with mirror indices are shown for rhabdophane structure.

Figure 10.
STEM-EDX spectra of REallPO4,hyd at (a) a typical point; (b) an Er-rich point; (c) a Nd-rich point. The Cu peak originates from the Cu TEM grid.
Figure 10.
STEM-EDX spectra of REallPO4,hyd at (a) a typical point; (b) an Er-rich point; (c) a Nd-rich point. The Cu peak originates from the Cu TEM grid.

Figure 11.
(a–c) HAADF-STEM images of LaPO4,hyd during HAP dissolution in contact with a La solution for 10 days. The fibrous nano-crystals indicated by the arrows correspond to LaPO4,hyd precipitation. (d) HAADF-STEM image of REallPO4,hyd formed during HAP dissolution after 1 h; (e,f) 3 days; (g) 10 days. (h,i) Bright-Field TEM images of the reaction products in all REE solutions after 10 days. The shorter fibrous nano-crystals indicated by the arrows correspond to REallPO4,hyd precipitation. (j,k) HAADF-STEM images of YbPO4,hyd precipitated on HAP during HAP dissolution in contact with a Yb3+ solution for 10 days. YbPO4,hyd nano-particles occur at the rim of HAP.

Figure 12.
Schematic illustration summarizing the properties of initially formed hydrated RE phosphates.
Figure 12.
Schematic illustration summarizing the properties of initially formed hydrated RE phosphates.


Table 1.
Crystallite size of LaPO4,hyd samples formed under four different conditions. The calculation was performed for five major peaks in the XRD pattern using the JADE software based on the Scherrer equation with a Scherrer constant K of 0.9.
Table 1.
Crystallite size of LaPO4,hyd samples formed under four different conditions. The calculation was performed for five major peaks in the XRD pattern using the JADE software based on the Scherrer equation with a Scherrer constant K of 0.9.
| Miller Index | LaPO4,hyd Crystallite Size (nm) | |||
|---|---|---|---|---|
| pH 3, 3 days | pH 3, 30 days | pH 1, 3 days | pH 5, 3 days | |
| (11) | 2.6 | 3.5 | 2.9 | 2.0 |
| (11) | 5.0 | 5.7 | 5.4 | 3.9 |
| (13) | 3.4 | 4.0 | 3.7 | 2.7 |
| (22) | 3.7 | 4.2 | 4.2 | 3.2 |
| (711) | 6.5 | 7.4 | 6.5 | 4.6 |
Table 2.
Lattice parameters a, b, c and β, and lattice volume for REiPO4,hyd (RE = La-Gd) calculated based on the peaks in the XRD patterns using the JADE software.
Table 2.
Lattice parameters a, b, c and β, and lattice volume for REiPO4,hyd (RE = La-Gd) calculated based on the peaks in the XRD patterns using the JADE software.
| REE | Effective Ionic Radius (Å) 1 | Lattice Parameter (Å) | Lattice Volume (Å3) | |||
|---|---|---|---|---|---|---|
| a | b | c | β | |||
| La | 1.197 | 29.17 | 7.19 | 12.29 | 116.3 | 2313 |
| Ce | 1.178 | 28.50 | 7.22 | 12.13 | 115.7 | 2249 |
| Pr | 1.161 | 28.61 | 7.06 | 12.14 | 115.8 | 2209 |
| Nd | 1.145 | 28.48 | 7.04 | 12.07 | 115.8 | 2179 |
| Sm | 1.114 | 28.34 | 6.99 | 12.01 | 115.8 | 2142 |
| Eu | 1.102 | 27.93 | 7.02 | 11.91 | 115.5 | 2108 |
| Gd | 1.089 | 27.89 | 7.06 | 11.85 | 115.5 | 2108 |
1 The effective ionic radius r = 1/3 rCN8 + 2/3 rCN9.
Table 3.
The results of quantification of the crystallinity of REiPO4,hyd (RE = Dy-Lu) calculated using the JADE software.
Table 3.
The results of quantification of the crystallinity of REiPO4,hyd (RE = Dy-Lu) calculated using the JADE software.
| REE | Effective Ionic Radius (Å) 1 | Crystallinity (%) |
|---|---|---|
| Dy | 1.027 | 38.9 |
| Ho | 1.015 | 53.9 |
| Er | 1.004 | 51.8 |
| Tm | 0.994 | 57.9 |
| Yb | 0.985 | 66.2 |
| Lu | 0.977 | 70.0 |
1 The effective ionic radius from [32].
Table 4.
List of the wavenumber of band 4 that corresponds to P–O antisymmetric stretching vibration, ν4 in the FT-IR spectra obtained for REiPO4 (RE = La-Lu) and REallPO4,hyd from FT-IR spectra.
Table 4.
List of the wavenumber of band 4 that corresponds to P–O antisymmetric stretching vibration, ν4 in the FT-IR spectra obtained for REiPO4 (RE = La-Lu) and REallPO4,hyd from FT-IR spectra.
| REE | Effective Ionic Radius (Å) 1 | Wavenumber (cm−1) |
|---|---|---|
| La | 1.197 | 1053.9 |
| Ce | 1.178 | 1057.8 |
| Pr | 1.161 | 1059.7 |
| Nd | 1.145 | 1062.6 |
| Sm | 1.114 | 1068.4 |
| Eu | 1.102 | 1071.3 |
| Gd | 1.089 | 1076.1 |
| REall | 1.074 | 1075.1 |
| Tb | 1.040 | 1075.1 |
| Dy | 1.027 | 1075.1 |
| Ho | 1.015 | 1078.0 |
| Er | 1.004 | 1078.0 |
| Tm | 0.994 | 1079.9 |
| Yb | 0.985 | 1082.8 |
| Lu | 0.977 | 1085.7 |
1 Effective ionic radius: rLa-Gd = 1/3 rCN8 + 2/3 rCN9, rTb-Lu = rCN8, and rall is the average of rLa-Lu.
Table 5.
Summary of dehydration or crystallization temperature and the amount of dissociated water n from the REiPO4,hyd (RE = La-Lu) and REallPO4,hyd during the TG-DTA analysis heated up to 500 °C. The value n corresponds to the number of H2O molecule per unit formula.
Table 5.
Summary of dehydration or crystallization temperature and the amount of dissociated water n from the REiPO4,hyd (RE = La-Lu) and REallPO4,hyd during the TG-DTA analysis heated up to 500 °C. The value n corresponds to the number of H2O molecule per unit formula.
| REE | Effective Ionic Radius (Å) 1 | Second Dehydration Temperature (°C) | Crystallization Temperature (°C) | Dissociated Water n | ||
|---|---|---|---|---|---|---|
| Total | First | Second | ||||
| La | 1.197 | 165 | - | 1.95 | 1.30 | 0.66 |
| Ce | 1.178 | 147 | - | 1.71 | 1.03 | 0.68 |
| Pr | 1.161 | 143 | - | 1.86 | 1.14 | 0.72 |
| Nd | 1.145 | 137 | - | 1.76 | 1.00 | 0.76 |
| Sm | 1.114 | 127 | - | 1.54 | 0.80 | 0.73 |
| Eu | 1.102 | 117 | - | 1.58 | 0.75 | 0.83 |
| Gd | 1.089 | 133 | - | 1.96 | 1.13 | 0.83 |
| REall | 1.074 | - | 220 | 2.22 | - | - |
| Tb | 1.040 | - | 300 | 2.24 | - | - |
| Dy | 1.027 | - | 326 | 2.36 | - | - |
| Ho | 1.015 | - | 300 | 2.43 | - | - |
| Er | 1.004 | 178 | - | 2.64 | 1.77 | 0.86 |
| Tm | 0.994 | 169 | - | 2.63 | 1.66 | 0.97 |
| Yb | 0.985 | 150 | - | 2.56 | 1.54 | 1.02 |
| Lu | 0.977 | 160 | - | 2.39 | 1.40 | 0.99 |
1 Effective ionic radius: rLa-Gd = 1/3 rCN8 + 2/3 rCN9, rTb-Lu = rCN8, and rall is the average of rLa-Lu.
Table 6.
The solution composition determined by ICP-AES at each reaction time during the formation of REallPO4,hyd, in which HAP crystals were in contact with the solution containing all REEs.
Table 6.
The solution composition determined by ICP-AES at each reaction time during the formation of REallPO4,hyd, in which HAP crystals were in contact with the solution containing all REEs.
| Reaction Time | Concentration (mmol·dm−3) | ||||||||||||||||
|---|---|---|---|---|---|---|---|---|---|---|---|---|---|---|---|---|---|
| La | Ce | Pr | Nd | Sm | Eu | Gd | Tb | Dy | Ho | Er | Tm | Yb | Lu | Ca | P 1 | pH | |
| 0 h | 0.12 | 0.11 | 0.13 | 0.12 | 0.12 | 0.13 | 0.11 | 0.13 | 0.11 | 0.13 | 0.13 | 0.13 | 0.13 | 0.13 | udl1 | udl | 5.06 |
| 1 h | 0.10 | 0.08 | 0.09 | 0.09 | 0.08 | 0.08 | 0.08 | 0.09 | 0.08 | 0.10 | 0.10 | 0.10 | 0.09 | 0.10 | 0.70 | udl | 5.16 |
| 3 h | 0.08 | 0.06 | 0.07 | 0.07 | 0.06 | 0.07 | 0.06 | 0.07 | 0.07 | 0.08 | 0.08 | 0.08 | 0.08 | 0.08 | 1.03 | udl | 5.53 |
| 9 h | 0.07 | 0.05 | 0.06 | 0.06 | 0.05 | 0.06 | 0.06 | 0.06 | 0.06 | 0.07 | 0.07 | 0.07 | 0.06 | 0.07 | 1.23 | udl | 5.55 |
| 24 h | 0.06 | 0.03 | 0.03 | 0.04 | 0.03 | 0.03 | 0.04 | 0.04 | 0.03 | 0.05 | 0.05 | 0.05 | 0.04 | 0.05 | 1.62 | udl | 5.63 |
| 3 days | 0.04 | 0.01 | 0.02 | 0.02 | 0.02 | 0.02 | 0.03 | 0.02 | 0.02 | 0.03 | 0.04 | 0.03 | 0.03 | 0.04 | 1.86 | udl | 5.66 |
| 10 days | 0.03 | 0.01 | 0.01 | 0.02 | 0.01 | 0.02 | 0.02 | 0.02 | 0.02 | 0.03 | 0.03 | 0.03 | 0.02 | 0.03 | 2.01 | udl | - 2 |
1 udl: Under detection limits (0.05 ppb for Ca and 15 ppb for P). 2 The pH after 10 days was not available.
Table 7.
Saturation ratio, Ω of the reacting solution with respect to LaPO4,hyd. Activities of RE3+ and PO43− were calculated using Geochemist’s Workbench with the thermodynamic database minteq. The input data are 0.05 mM RE3+, 0.05 mM PO43−, 0.1 M Na+, and 0.5 M NO3−.
Table 7.
Saturation ratio, Ω of the reacting solution with respect to LaPO4,hyd. Activities of RE3+ and PO43− were calculated using Geochemist’s Workbench with the thermodynamic database minteq. The input data are 0.05 mM RE3+, 0.05 mM PO43−, 0.1 M Na+, and 0.5 M NO3−.
| pH | Activity (mol·dm−3) | Ion Activity Product IAP0 | Saturation Ratio Ω | |
|---|---|---|---|---|
| aRE3+ | aPO43− | |||
| 1 | 2.06 × 10⁻³ | 8.80 × 10⁻²¹ | 1.81 × 10⁻²³ | 3.01 × 101 |
| 3 | 1.29 × 10⁻³ | 4.95 × 10⁻¹⁶ | 6.37 × 10⁻¹⁹ | 5.65 × 10³ |
| 5 | 1.26 × 10⁻³ | 5.16 × 10⁻¹² | 6.53 × 10⁻¹⁵ | 5.72 × 10⁵ |
© 2017 by the authors. Licensee MDPI, Basel, Switzerland. This article is an open access article distributed under the terms and conditions of the Creative Commons Attribution (CC BY) license (http://creativecommons.org/licenses/by/4.0/).
Share and Cite
MDPI and ACS Style
Ochiai, A.; Utsunomiya, S. Crystal Chemistry and Stability of Hydrated Rare-Earth Phosphates Formed at Room Temperature. Minerals 2017, 7, 84. https://doi.org/10.3390/min7050084
AMA Style
Ochiai A, Utsunomiya S. Crystal Chemistry and Stability of Hydrated Rare-Earth Phosphates Formed at Room Temperature. Minerals. 2017; 7(5):84. https://doi.org/10.3390/min7050084
Chicago/Turabian StyleOchiai, Asumi, and Satoshi Utsunomiya. 2017. "Crystal Chemistry and Stability of Hydrated Rare-Earth Phosphates Formed at Room Temperature" Minerals 7, no. 5: 84. https://doi.org/10.3390/min7050084
Note that from the first issue of 2016, this journal uses article numbers instead of page numbers. See further details here.