
Microstructural Analysis of a Mylonitic Mantle Xenolith Sheared at Laboratory-like Strain Rates from the Edge of the Wyoming Craton


1
Department of Earth and Environmental Sciences, Ben-Gurion University of the Negev, Be’er Sheva 8410501, Israel
2
Scripps Institution of Oceanography, University of California San Diego, La Jolla, CA 92093, USA
3
Department of Earth, Environmental and Planetary Sciences, Brown University, Providence, RI 02912, USA
*
Author to whom correspondence should be addressed.
Minerals 2021, 11(9), 995; https://doi.org/10.3390/min11090995
Submission received: 30 July 2021
/
Revised: 31 August 2021
/
Accepted: 3 September 2021
/
Published: 10 September 2021
(This article belongs to the Special Issue Mantle Strain Localization—How Minerals Deform at Deep Plate Interfaces)
Abstract
:Combined observations from natural and experimental deformation microstructures are often used to constrain the rheological properties of the upper mantle. However, relating natural and experimental deformation processes typically requires orders of magnitude extrapolation in strain rate due to vastly different time scales between nature and the lab. We examined a sheared peridotite xenolith that was deformed under strain rates comparable to laboratory shearing time scales. Microstructure analysis using an optical microscope and electron backscatter diffraction (EBSD) was done to characterize the bulk crystallographic preferred orientation (CPO), intragrain misorientations, subgrain boundaries, and spatial distribution of grains. We found that the microstructure varied between monophase (olivine) and multiphase (i.e., olivine, pyroxene, and garnet) bands. Olivine grains in the monophase bands had stronger CPO, larger grain size, and higher internal misorientations compared with olivine grains in the multiphase bands. The bulk olivine CPO suggests a dominant (010)[100] and secondary activated (001)[100] that are consistent with the experimentally observed transition of the A to E-types. The bulk CPO and intragrain misorientations of olivine and orthopyroxene suggest that a coarser-grained initial fabric was deformed by dislocation creep coeval with the reduction of grain size due to dynamic recrystallization. Comparing the deformation mechanisms inferred from the microstructure with experimental flow laws indicates that the reduction of grain size in orthopyroxene promotes activation of diffusion creep and suggests a high activation volume for wet orthopyroxene dislocation creep.
1. Introduction
Analysis of rock microstructure and fabric (e.g., grain size and texture) by solid-state deformation serves as a tool for reconstructing the mechanical and thermo-chemical conditions of deformation (e.g., [1]). Understanding how mantle microstructure evolves with deformation under various conditions is particularly important for assessing the prevailing rheological flow laws and for our ability to understand mantle kinematic and dynamic properties from seismic data. However, many variables can affect the grain size and texture of peridotitic samples, including: differential stress, mechanism of deformation, water content, pressure, temperature, melt fraction, degree of annealing, pre-existing texture, and the fraction and distribution of auxiliary minerals such as pyroxenes and garnet [2,3,4,5,6,7,8,9,10,11]. Most constraints for the microstructural evolution come from laboratory experiments where the stress, pressure, temperature, chemical environment, and initial fabric are well-constrained [12,13,14,15,16,17,18,19]. Therefore, microstructures of natural samples are interpreted and benchmarked by comparison with experimentally induced microstructures. Nonetheless, this comparison is hampered by the necessary extrapolation of strain rate. Due to the limited timescale of laboratory experiments, strain rates from the lab (~10−4–10−7 s−1) typically differ by orders of magnitude from strain rates in the mantle (~10−10–10−15 s−1). Other experimental challenges include deforming multiphase samples (since trade-off between temperature and strain rate is hindered by melting) under high confining pressure and high strains (ɣ ≥ 10) (e.g., Figure 1e,f).
Seismic anisotropy observations and rheological considerations suggest the origin of wide-scale anisotropic upper mantle that is caused by dislocation creep of olivine resulting in the preferred orientation of their crystal lattices [20,21,22,23]. Therefore, the relations between the style and conditions of deformation and resulting crystallographic preferred orientation (CPO) have been of great interest [24,25,26]. However, in some cases, the experimental data are difficult to compare directly with the natural observations. The formation of CPO types under different conditions [27] illustrates inconsistencies between the expected experimentally based theory and observations from mantle samples [28,29]. In addition, the abundance and spatial distribution of “secondary” minerals (i.e., minerals with lower modal abundance) in mantle peridotite may impact its rheology. Although olivine has the dominant effect on the elastic-plastic properties of the mantle, secondary phases such as orthopyroxene (opx) [30,31,32,33], clinopyroxene [34], spinel, and garnet [35] also play a significant role in shaping the microstructure and rheological evolution of the mantle. For example, viscosity contrasts between the secondary minerals and olivine can be significant when considering a polymineralic upper mantle [36,37,38].
The application of laboratory flow laws to model the relevant deformation conditions in the upper mantle requires extrapolation of flow laws between conditions in the mantle and lab, particularly in stress and strain rate. In addition, high strain experimental data for the dominant deformation mechanisms are harder to acquire for multiphase aggregates, in particular, at mantle pressures [39]. Thus, the uncertainties related to extrapolation in strain rates compel researchers to adopt simplifications and assumptions when relating experimental data to natural conditions (e.g., Figure 1e,f). However, natural rocks that preserve textural evidence of relatively high stress and strain rate deformation, though generally rare, allow us to more directly compare natural and laboratory microstructures formed under similar conditions (e.g., Figure 1f, [3,40,41]). Here, we analyze microstructures in a sheared mylonitic mantle xenolith and then compare these observations to rheological properties inferred from deformation experiments on similar mantle assemblages. The presence of discrete monophase and multiphase domains in the studied mylonite facilitates comparisons with experiments that typically involve simplified lithologies. Importantly, the temperature, pressure, and water content of the natural xenolith are well-constrained, and inferred strain rates are comparable to laboratory conditions. Thus, this xenolith provides a unique opportunity to “ground truth” rheological parameters derived from the lab.
2. Materials and Methods
2.1. Sample Description
The mylonitic xenolith, H69-15F, is a garnet harzburgite [42,43] from the Williams diatreme, located at the edge of the northern Wyoming craton [44]. Williams xenoliths are divided into low-temperature spinel-bearing peridotites and high-temperature garnet-bearing peridotites. The latter record overall Mg# of 91.4 [43] and equilibration temperatures above a stable shield geotherm, suggesting recent heating [45]. The mylonitic xenolith reported here is garnet-bearing with an equilibrated temperature of T = 1320 °C, pressure of P = 4.6 GPa [45], and low-to-moderate water content in olivine (12.4 H2O ppm wt.; [42,46]). However, since the diffusion of hydrogen is slower in opx than in olivine at high temperature, we used the olivine–opx partition coefficient of Dolv/opx = 0.11 [47] to estimate the water content in olivine (33.5 H2O ppm wt.) from the measured water content in opx (305 H2O ppm wt.). We regarded the P-T-H2O conditions as representative of the conditions of the sample in the mantle rather than conditions related to the kimberlite eruption because we did not observe chemical zoning or late-stage features that would suggest a chemical change during the eruption [48]. The sample shows a mylonitic microstructure (Figure 1a) suggesting significant shear strain (ɣ ≥ 10). Bands comprising only olivine (monophase) alternate with bands consisting of olivine, opx, and garnet (multiphase) (Figure 1b,c). In addition, a distinctive population of olivine is characterized by tablet-shaped grains interpreted as a brief post-deformation stage where these grains grew by discontinuous static recrystallization (DiSRX) (Figure 1d; [46]). H69-15F exhibits the highest degree of shearing compared to other xenoliths from the same kimberlite. Thus, we consider that the microstructure in H69-15F reflects a region of short-lived, highly localized deformation events—inferred to result from lithospheric delamination and kimberlite volcanism at the edge of the Wyoming craton [42,43].
2.2. Analytical Methods
Electron backscatter diffraction (EBSD) mapping was done using a field emission gun FEI Apreo LoVac scanning electron microscopy (SEM) equipped with Oxford Instruments Symmetry EBSD detector at UC San Diego. Step sizes varied from 1–5 μm, at a working distance between 26 to 28 mm, current of 26 to 51 nA, and accelerating voltage of 20 kV. We used three EBSD maps normal to each other from the three orthogonal X-Z, X-Y, and Y-Z planes in the kinematic reference frames (lineation and foliation were determined using the opx shape and crystallographic preferred orientations, see [42]). Post-acquisition data visualization and calculation were done using MTEX software version 5.5.0 [49,50].
Grain boundaries are defined with a minimum misorientation angle of 10°. Grain orientation spread (GOS) was used to determine the intragrain misorientations angle relative to the grain averaged orientation (“mis2mean” function). Grain reference orientation deviation (GROD) is used to define the full misorientation vector between misorientations at the grain interior. The GROD analysis enables plotting the axis of misorientation in the pre-defined grains, which can be plotted in both the kinematic (pole figure) and crystallographic (inverse pole figure) reference frames. Pole figures were calculated either as area-weighted (where CPO is mostly affected by the large grains) or as one point per grain (where CPO is mostly affected by the small grains) contoured by the density of the orientation distribution function (ODF) with a half-width of 10°. The type of pole figure calculation (area-weighted vs. one-point-per-grain) were used as needed, as defined in the figure caption. Strength of the CPO was quantified using the dimensionless J-index [51] and M-index [52]. Shape preferred orientation (SPO) was calculated using grains with aspect ratios larger than 1.2 by plotting the orientations of the principal long and short axes of the crystal shape with respect to the crystal axes reference frame [53].
3. Results
3.1. Microstructures, CPO, and Inter- and Intra-Grain Misorientations
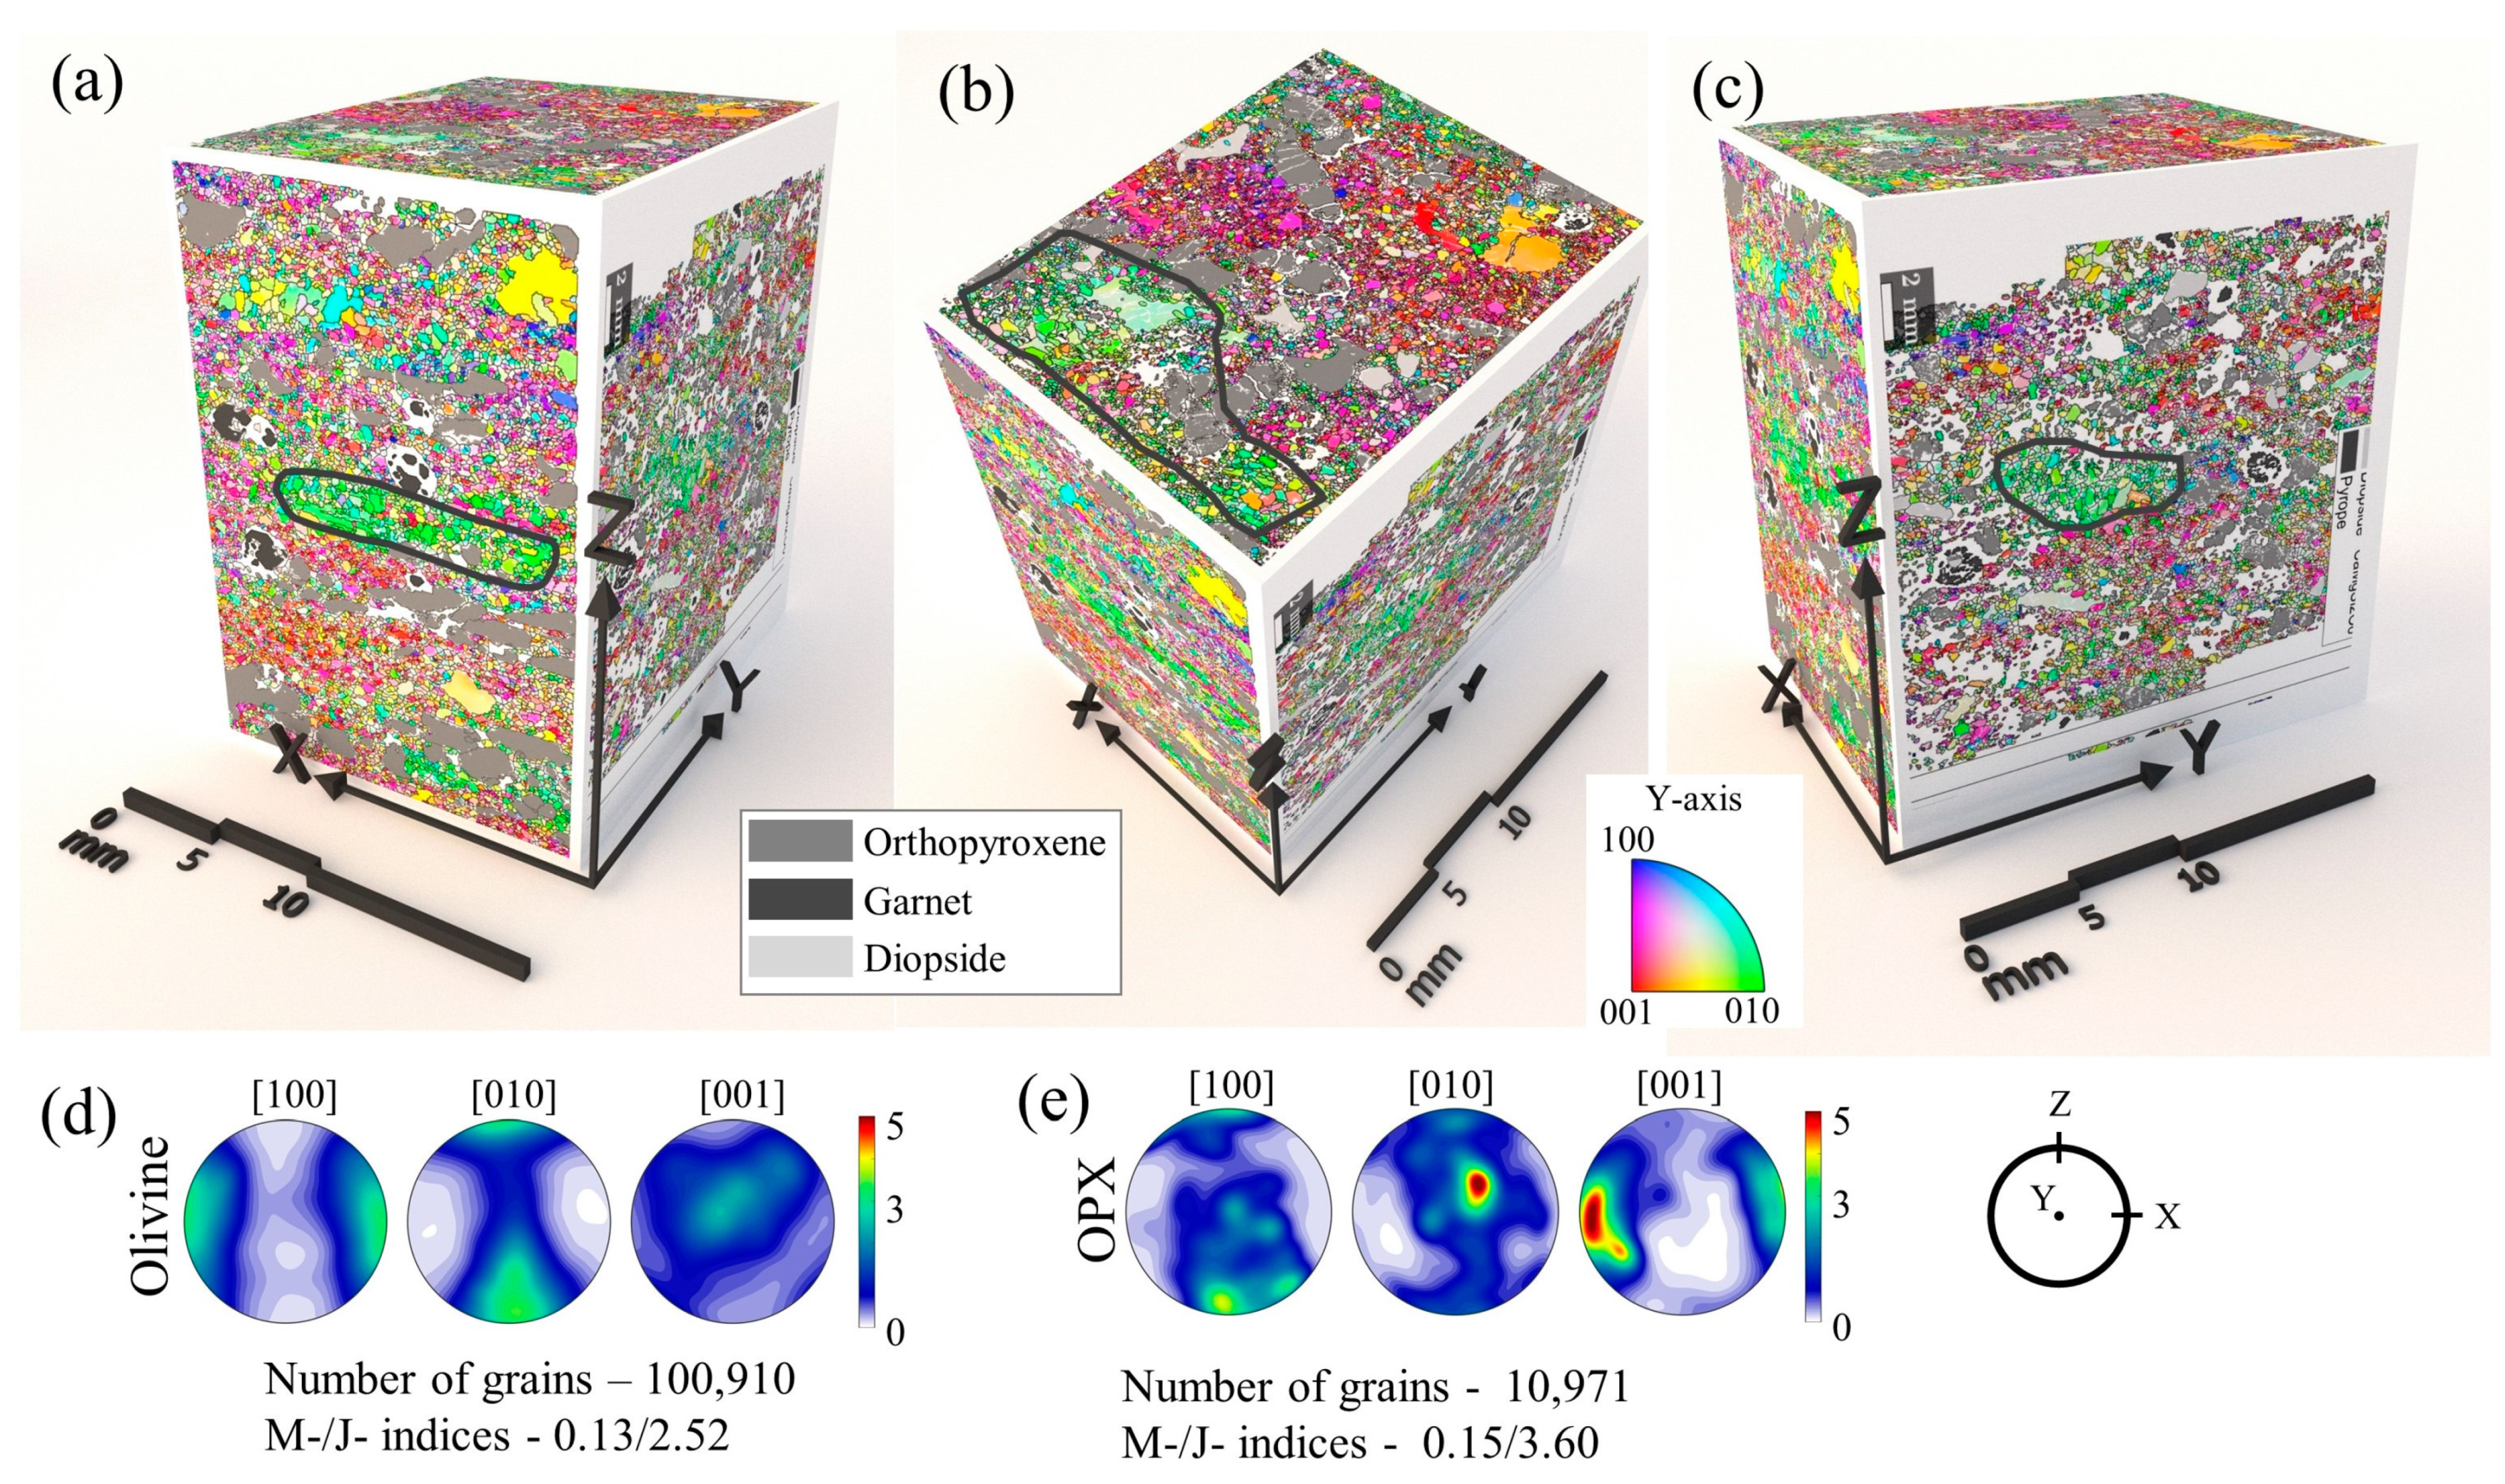
Microstructure and textural characteristics of the mylonitic sample were analyzed and the distribution of phases, CPOs, and intragrain misorientations were determined. Using the three orthogonal EBSD maps, we show the microstructure of the sample in 3-D (Figure 2). The 3-D view (maps are not spatially linked to each other at their corners) demonstrates bands defined by elongated domains of similarly oriented olivine grains. The elongated domains of grains are seen in the X-Z plane as elongated bands ~4–5 mm width and broader bands with 5–7 mm width in the X-Y plane (e.g., polygon on Figure 2a,b). In the Y-Z plane, these domains appear more equant with a weak elongation parallel to the Y-axis (Figure 2c). The cumulative grain orientations of the three maps yield a bulk olivine CPO of the sample with the [100] aligned parallel to the lineation and the [010] aligned normal to the foliation and with moderate strength (M-index = 0.13). This texture fits the A-type fabric using the classification of Karato et al. [27] and suggests the dominance of (010)[100] slip system. Importantly, in addition to the characteristic A-type fabric, the CPO also includes a weaker [010] girdle on the Y-Z plane. The opx exhibits a CPO indicative of easy slip on its typically activated (100)[001] slip system with a weaker [100] maxima aligned towards the Y-axis and a weaker [010] maxima aligned towards the Z-axis. The two weaker maxima in [100] and [010] suggest the (minor) activation of the less frequently observed opx CPO, indicative of the (010)[001] slip system.
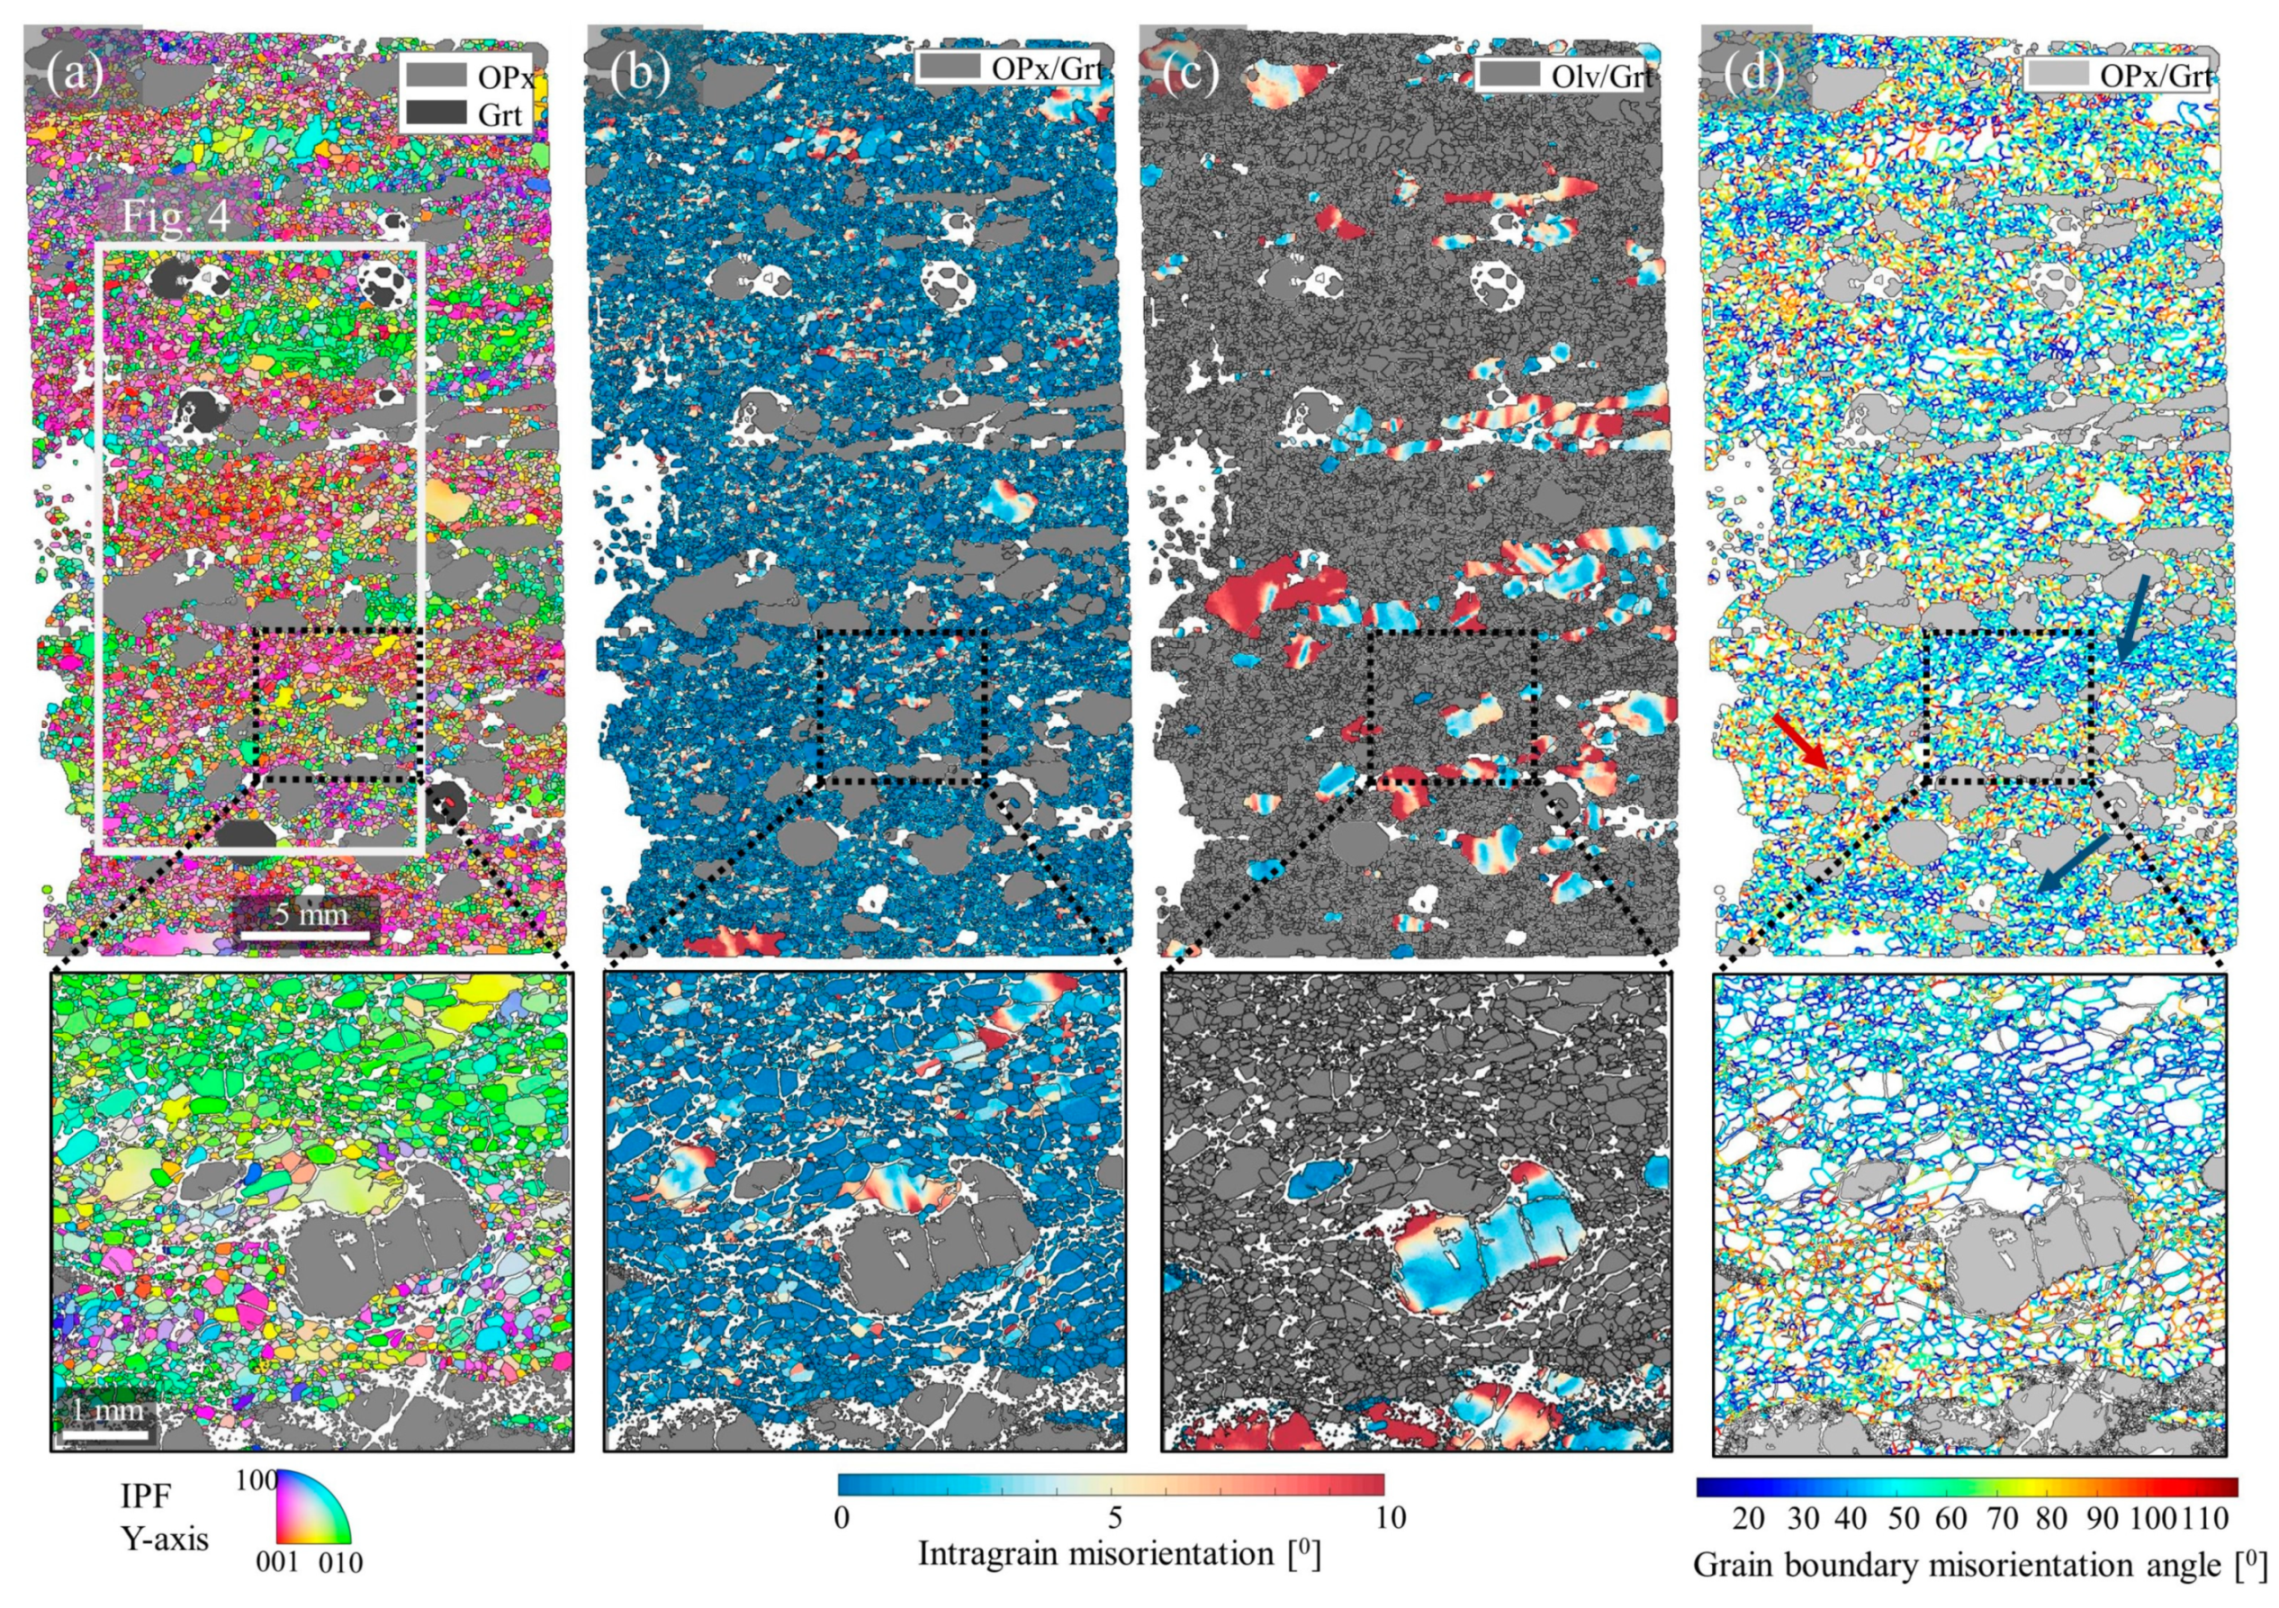
To further examine the style and mechanism of deformation, we used intragrain misorientation maps (“mis2mean”) depicting the orientation variations within crystals caused by geometrically necessary dislocations associated with deformation by dislocation creep. Most of the olivine grains had low intragrain misorientation, with only a few grains with total misorientation over 5° (warm colors in Figure 3b,c). The latter population of grains included medium-size porphyroclasts and smaller, often elongated, euhedral grains, suggesting previously strained grains with recrystallized grains at their boundaries, either during dynamic or static conditions [54]. Large opx porphyroclasts with high intragrain misorientations showed small recrystallized opx grains at their boundaries with low intragrain misorientation that often formed a characteristic “tail” structure ([6,55]). The degree of recrystallization was significantly lower for the opx grains, easily visible when comparing the ratio between the cool colors (recrystallized grains) and the warm colors (porphyroclast grains) in olivine (Figure 3b) and opx (Figure 3c). Garnet grains were relatively large (~2 mm in diameter) and round with negligible intragrain misorientation, suggesting that they did not deform significantly by internal plastic deformation.
3.2. Olivine Monophase and Multiphase Bands
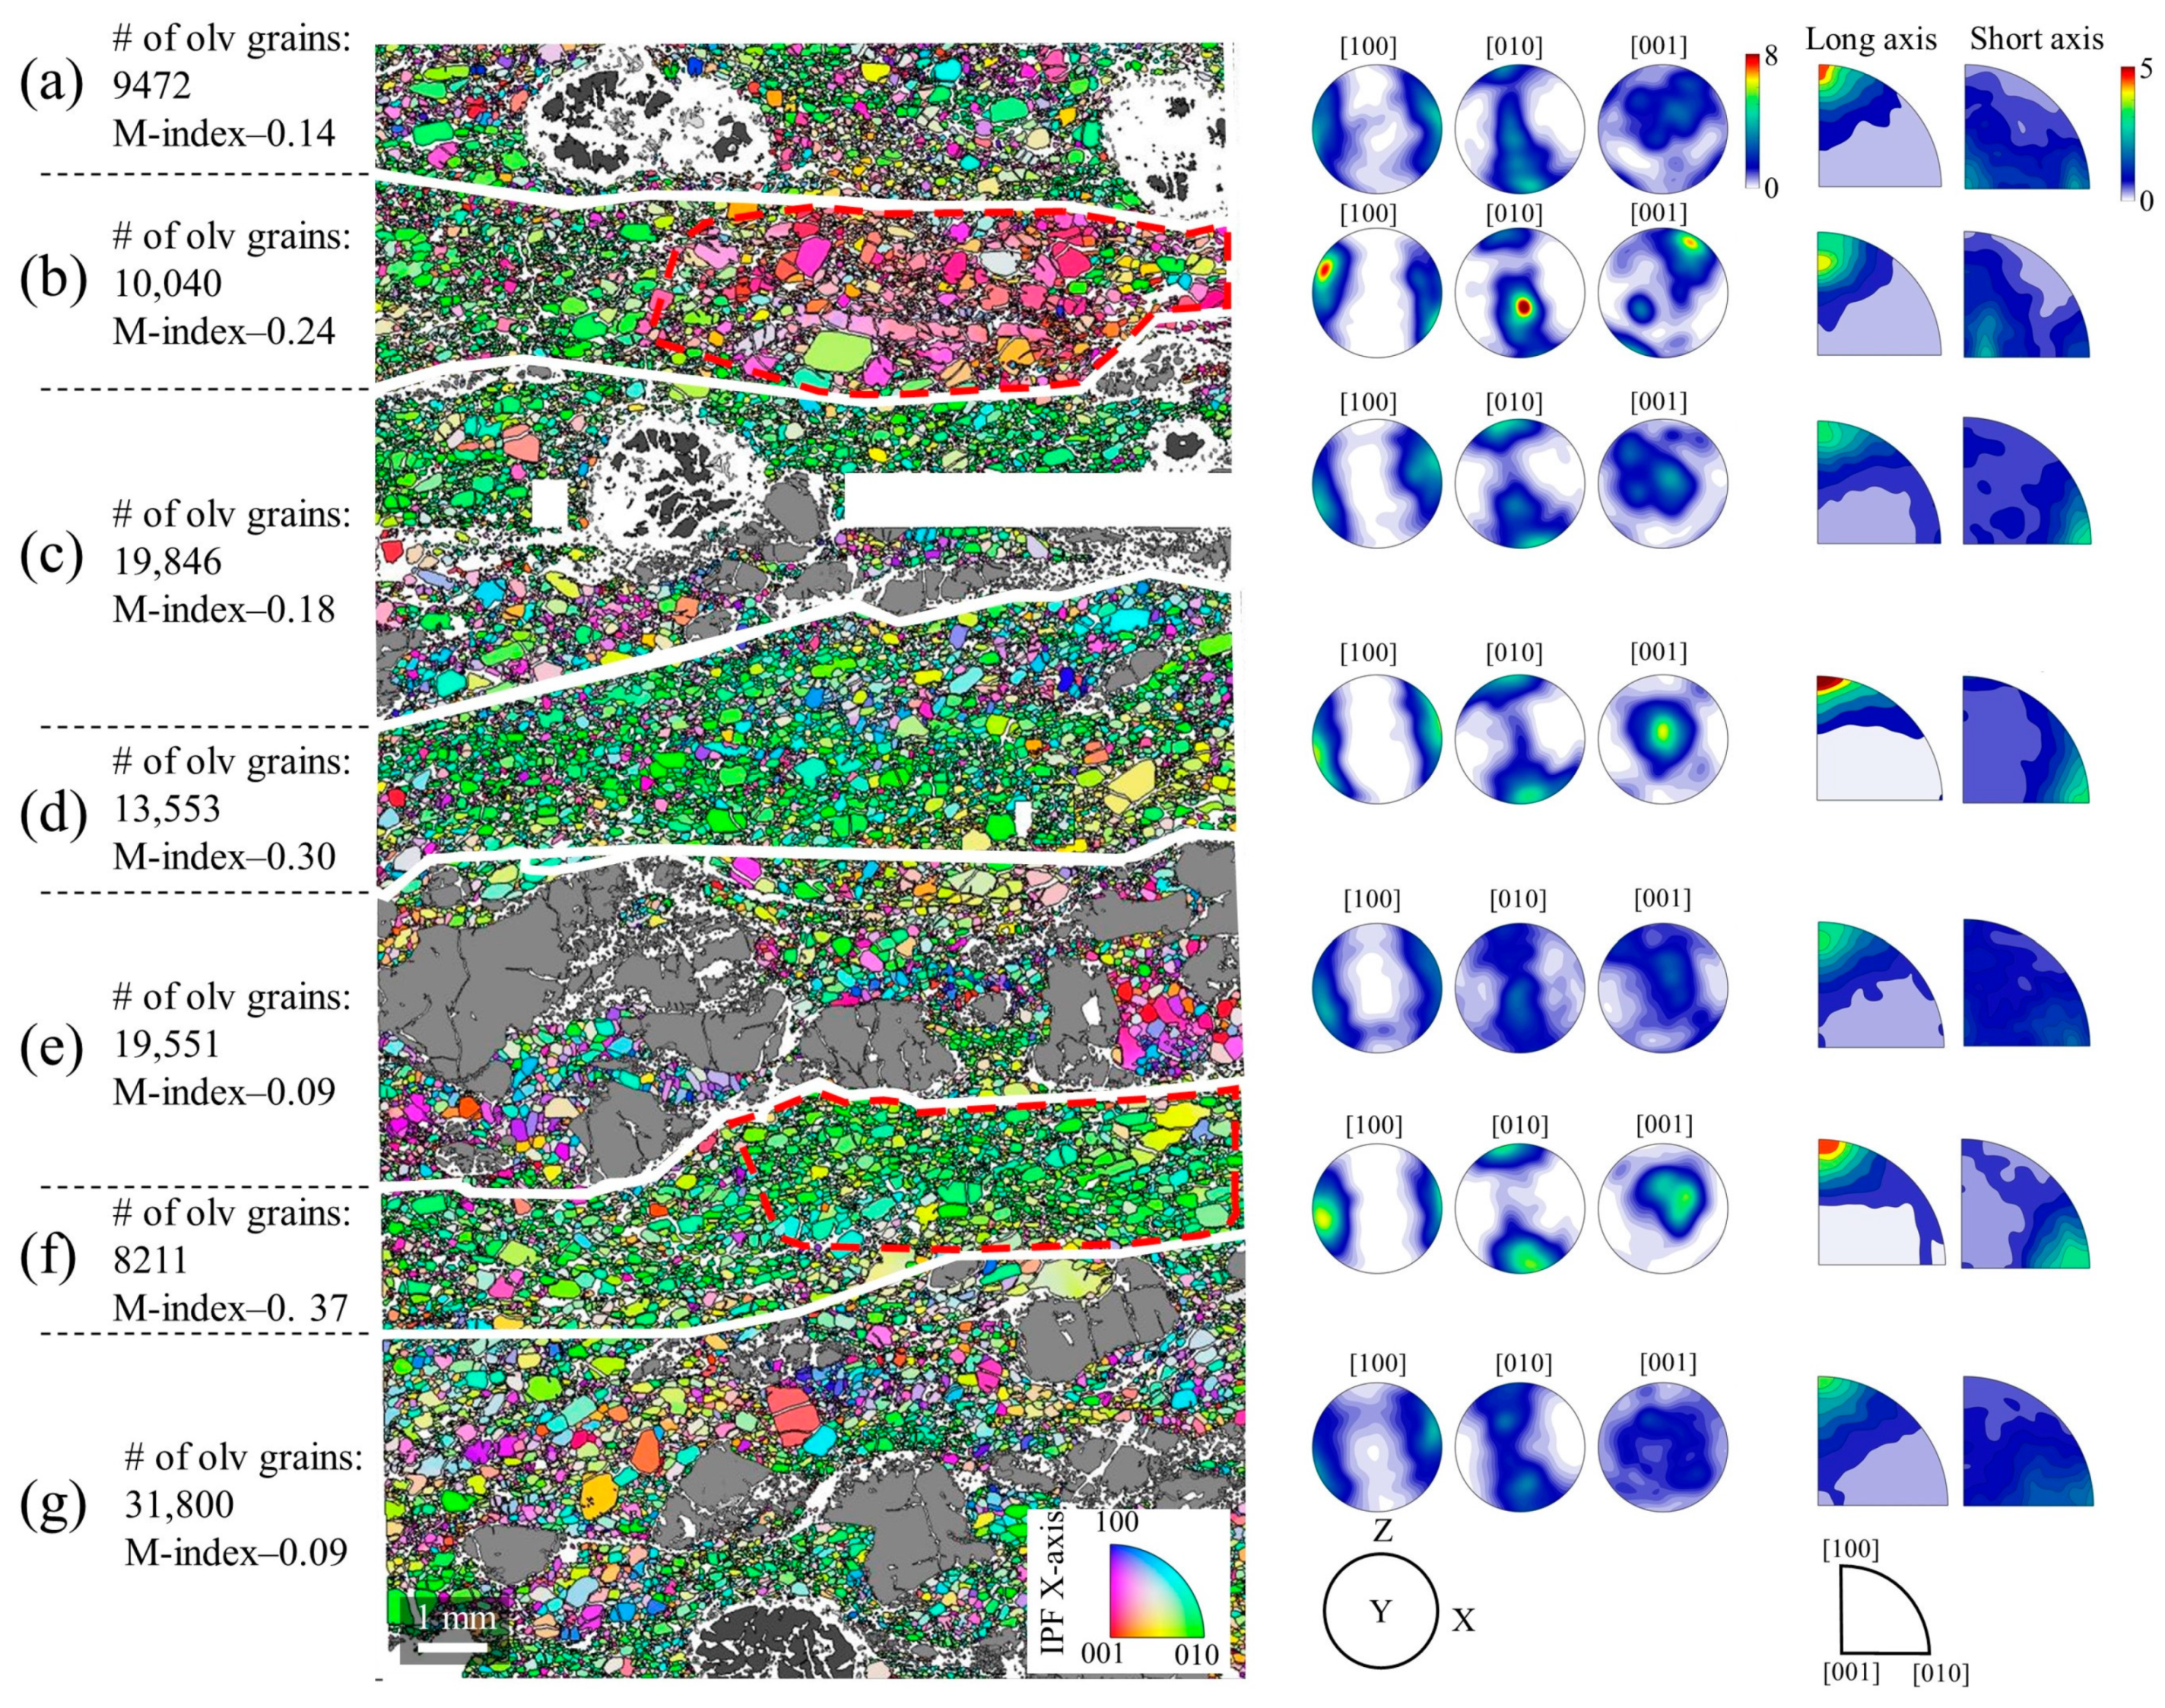
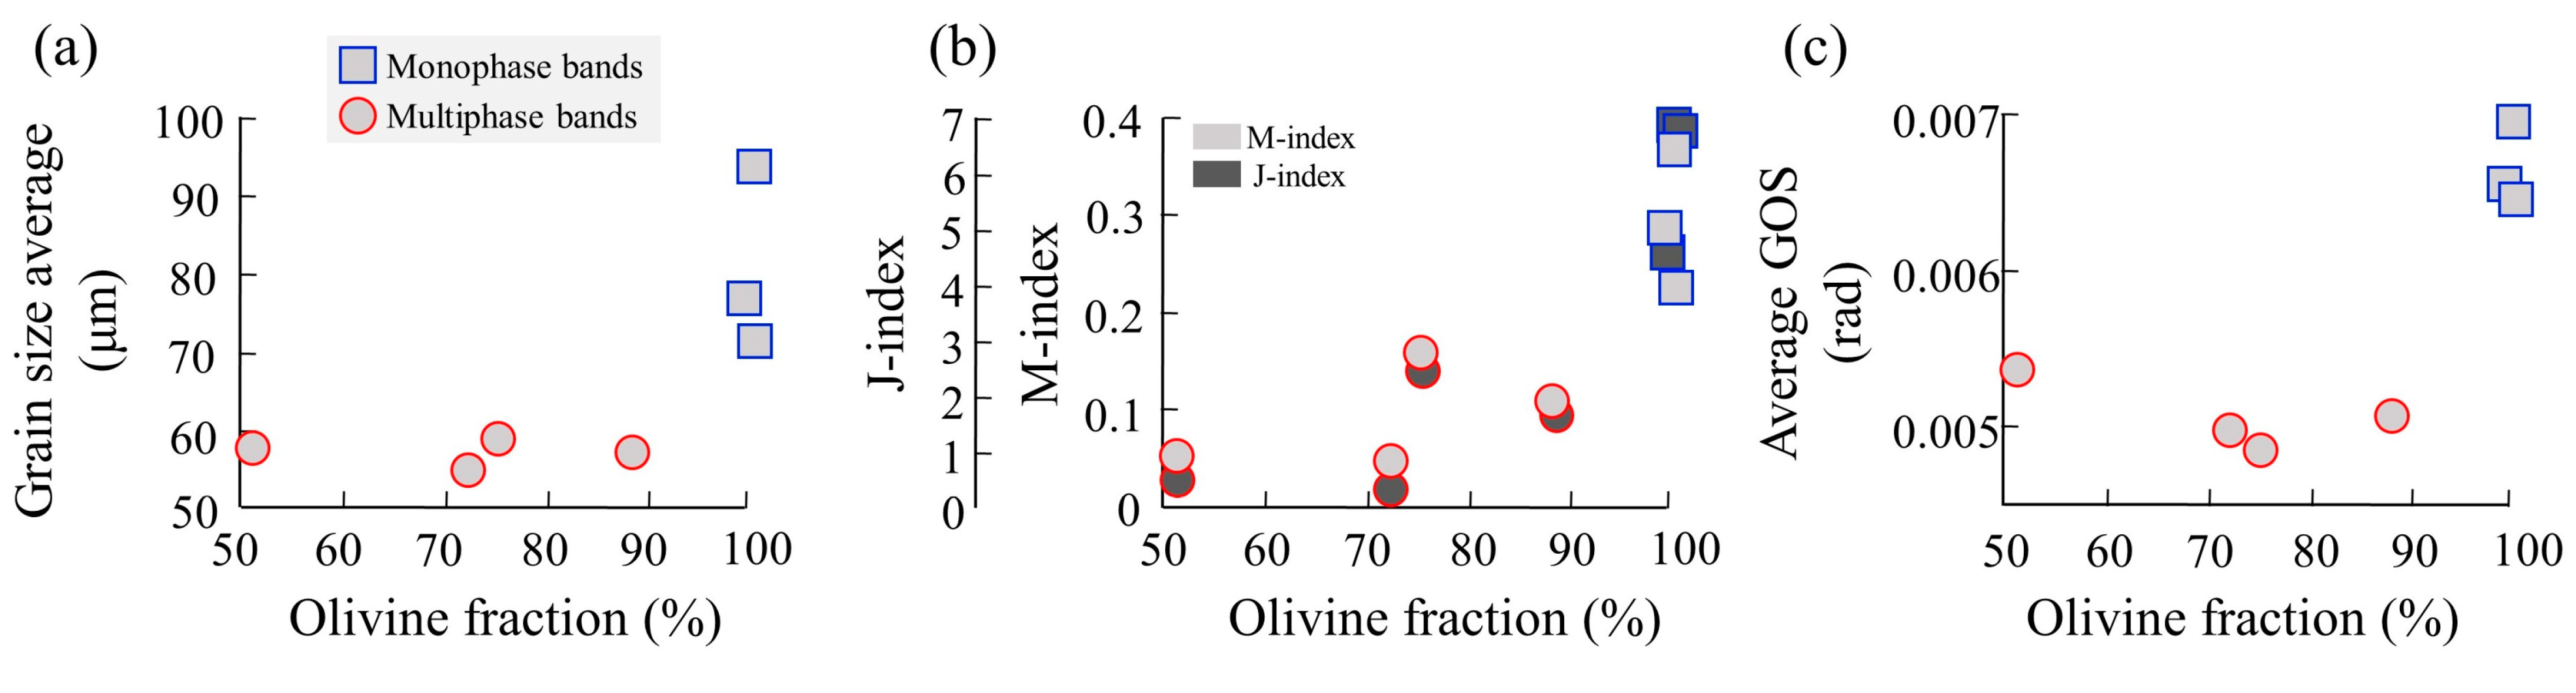
The X-Z cross-sections of the mylonite (Figure 1 and Figure 3) show characteristic banding with regard to olivine, opx, and garnet modal abundance. These bands consist of either only olivine (“monophase”) or olivine with opx/garnet (“multiphase”) and are ~2 and 5 mm wide, respectively. The olivine–olivine grain boundary misorientation map in Figure 3d illustrates that the mono/multiphase bands are also distinguished by lower/higher grain boundary misorientations, respectively (Figure 3d). To analyze the microstructural properties of individual bands, we used a higher-resolution map (3 μm step size) of the X-Z plane (area delineated with white frame in Figure 3a). The analysis of different bands demonstrates a difference in CPO strength, with monophase bands showing a stronger olivine CPO than multiphase bands (Figure 4). Most olivine bands show an A-type fabric. However, one band (band in Figure 4b) shows a characteristic E-type fabric with the [100] maxima rotated beyond the lineation [56,57], strong [010] maxima parallel to the Y-axis, and [001] maxima oriented clockwise from the normal to foliation (Z-axis). The shape preferred orientation (SPO) of olivine is generally aligned such that the long axis is parallel to the [100] axis and the short axis is parallel to the [010] axis (Figure 4). Similar SPO is produced when considering only grains with high or low GOS, suggesting that the recrystallization and tablet grains do not affect the bulk SPO alignment. However, for the band showing E-type (Figure 4b), the short axis is aligned parallel to [001]. Quantification of the microstructural properties of these bands shows that olivine monophase bands contain (i) larger olivine grains on average, (ii) stronger olivine CPO, and (iii) higher intragrain misorientation (Figure 5).
3.2.1. Intragrain Misorientations, Recrystallization, and CPO Strength
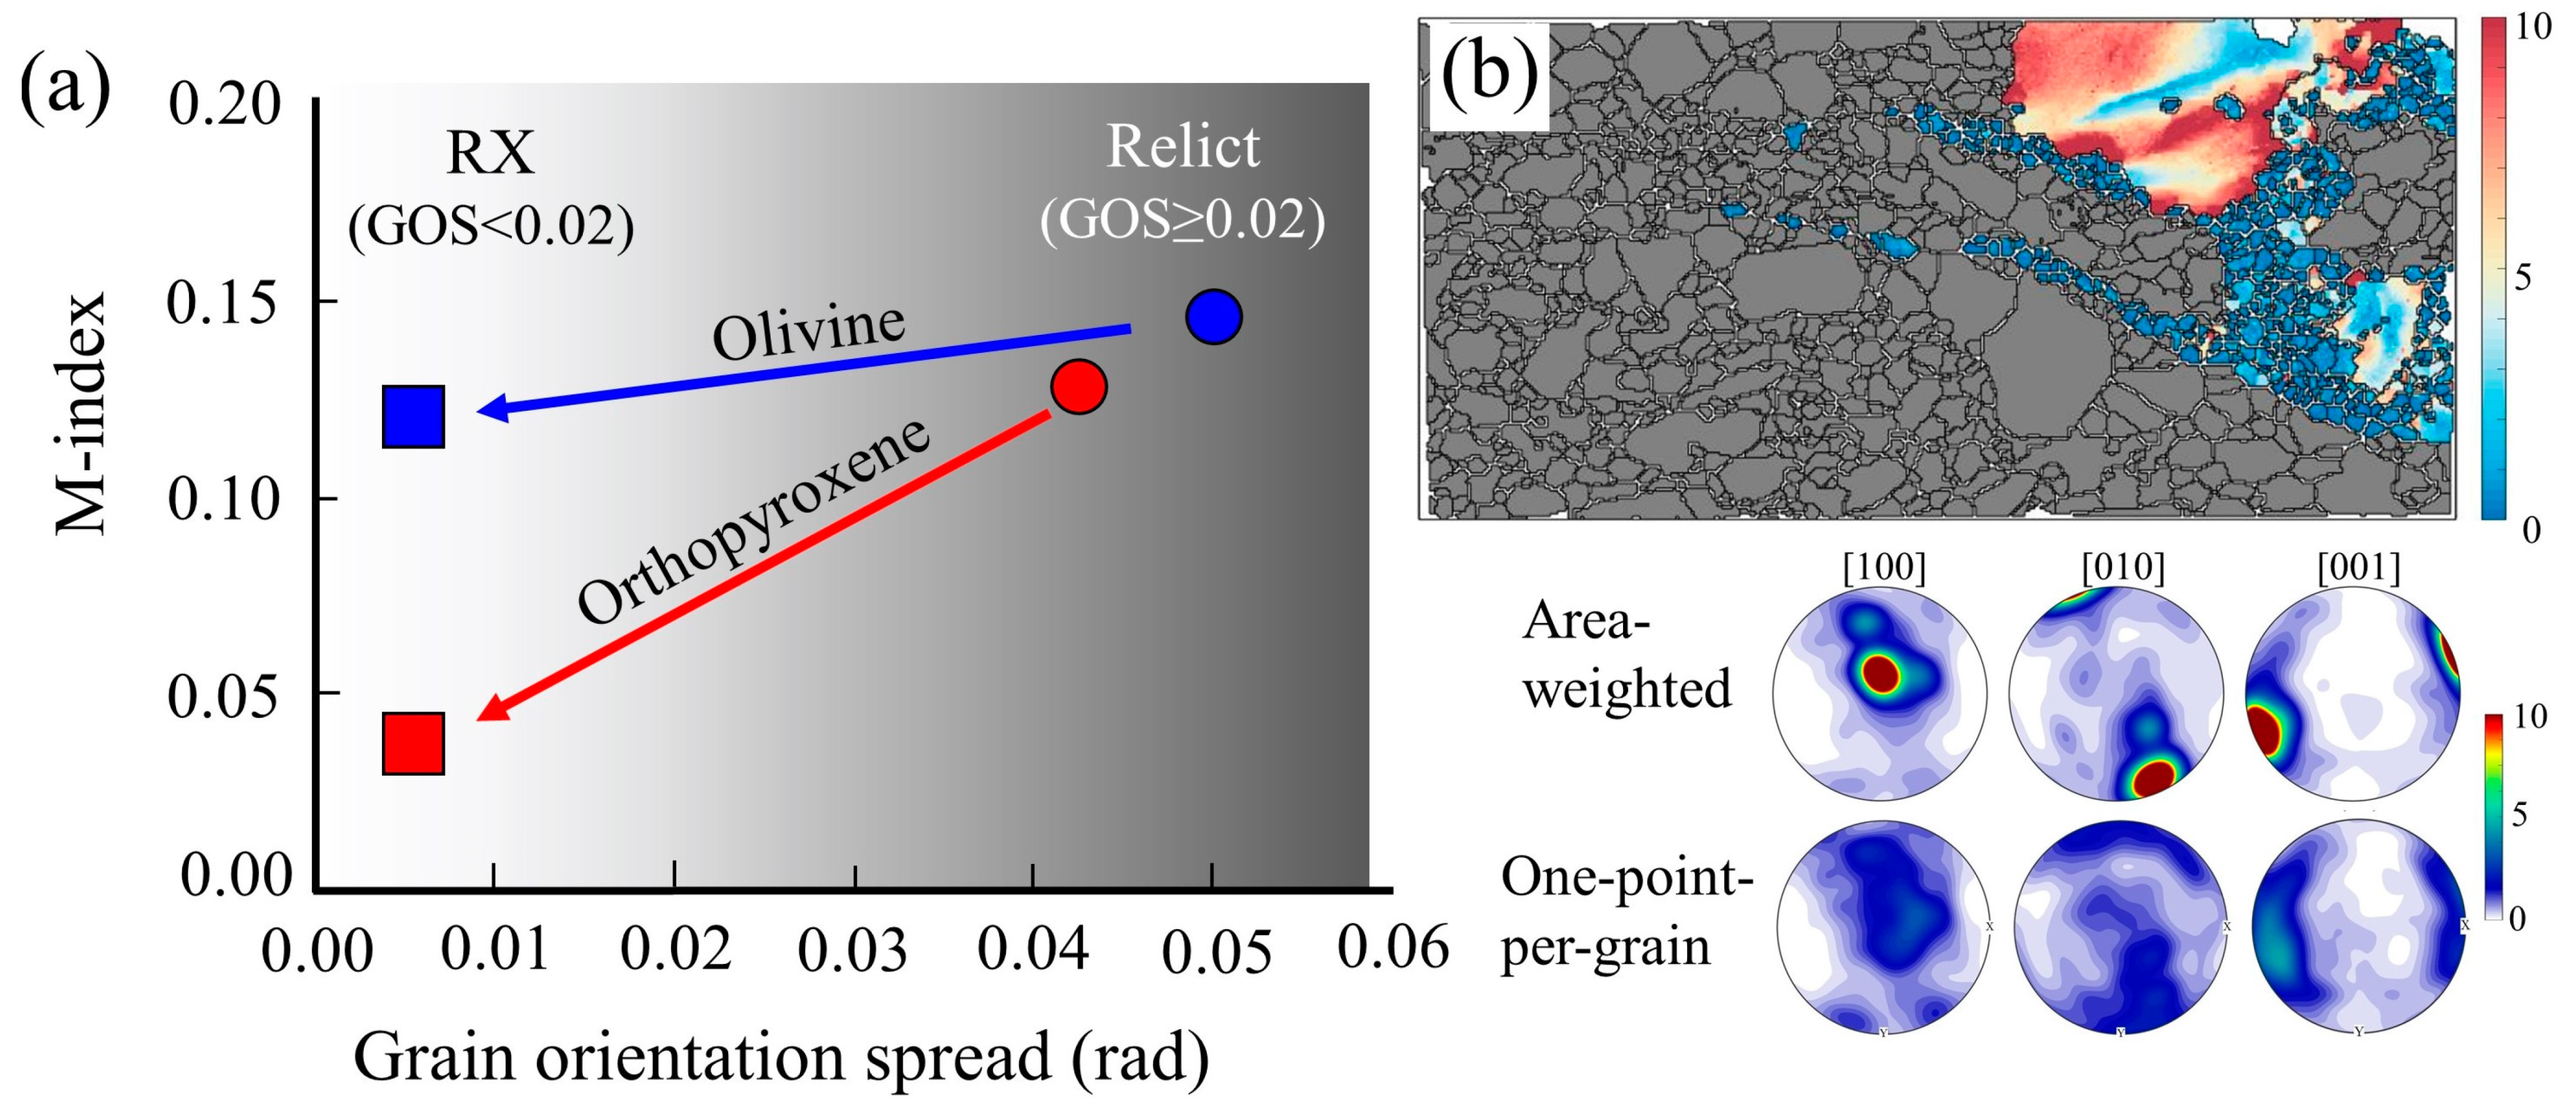
The mylonitic microstructure and maps of the intragrain misorientation (Figure 3b,c) highlight the different grain properties of olivine and opx grains with high/low intragrain misorientation. To compare these two grain populations, we combined data for all olivine and opx grains from two EBSD maps (X-Z and X-Y planes shown in Figure 2). The third plane (Y-Z) was omitted due to lower indexing. We used the averaged GOS value of grains to differentiate recrystallized and porphyroclast (highly deformed) grains; for this analysis, porphyroclast grains are defined as grains with GOS ≥ 0.02 rad and recrystallized grains are defined as grains with GOS < 0.02 rad. Using the GOS threshold, we calculated that 75% of the olivine grains are recrystallized compared to 26% of the opx grains. Comparing the CPO strength of the relict vs. recrystallized population for olivine and opx shows diverse trends (Figure 6a). For olivine, the CPO strengths of the porphyroclasts and recrystallized grains are similar (M-index = 0.12–0.15); for opx, the CPO strength of the porphyroclasts (M-index = 0.13) is similar to the CPO strength of olivine; however, opx recrystallized grains show a transition to significantly weaker CPO (M-index = 0.035) (Figure 6a and Figure S1, Supplementary Materials). In Figure 6b, we highlight recrystallization fabrics in opx and show the CPO of a region with an individual opx porphyroclast and the adjacent recrystallized areas that define tails of small opx grains in an olivine matrix. The area-weighted CPO highlights the orientation of the porphyroclast, while the one-point-per-grain CPO highlights the dispersed CPO of the recrystallized grains.
3.2.2. Subgrain Boundary Analysis
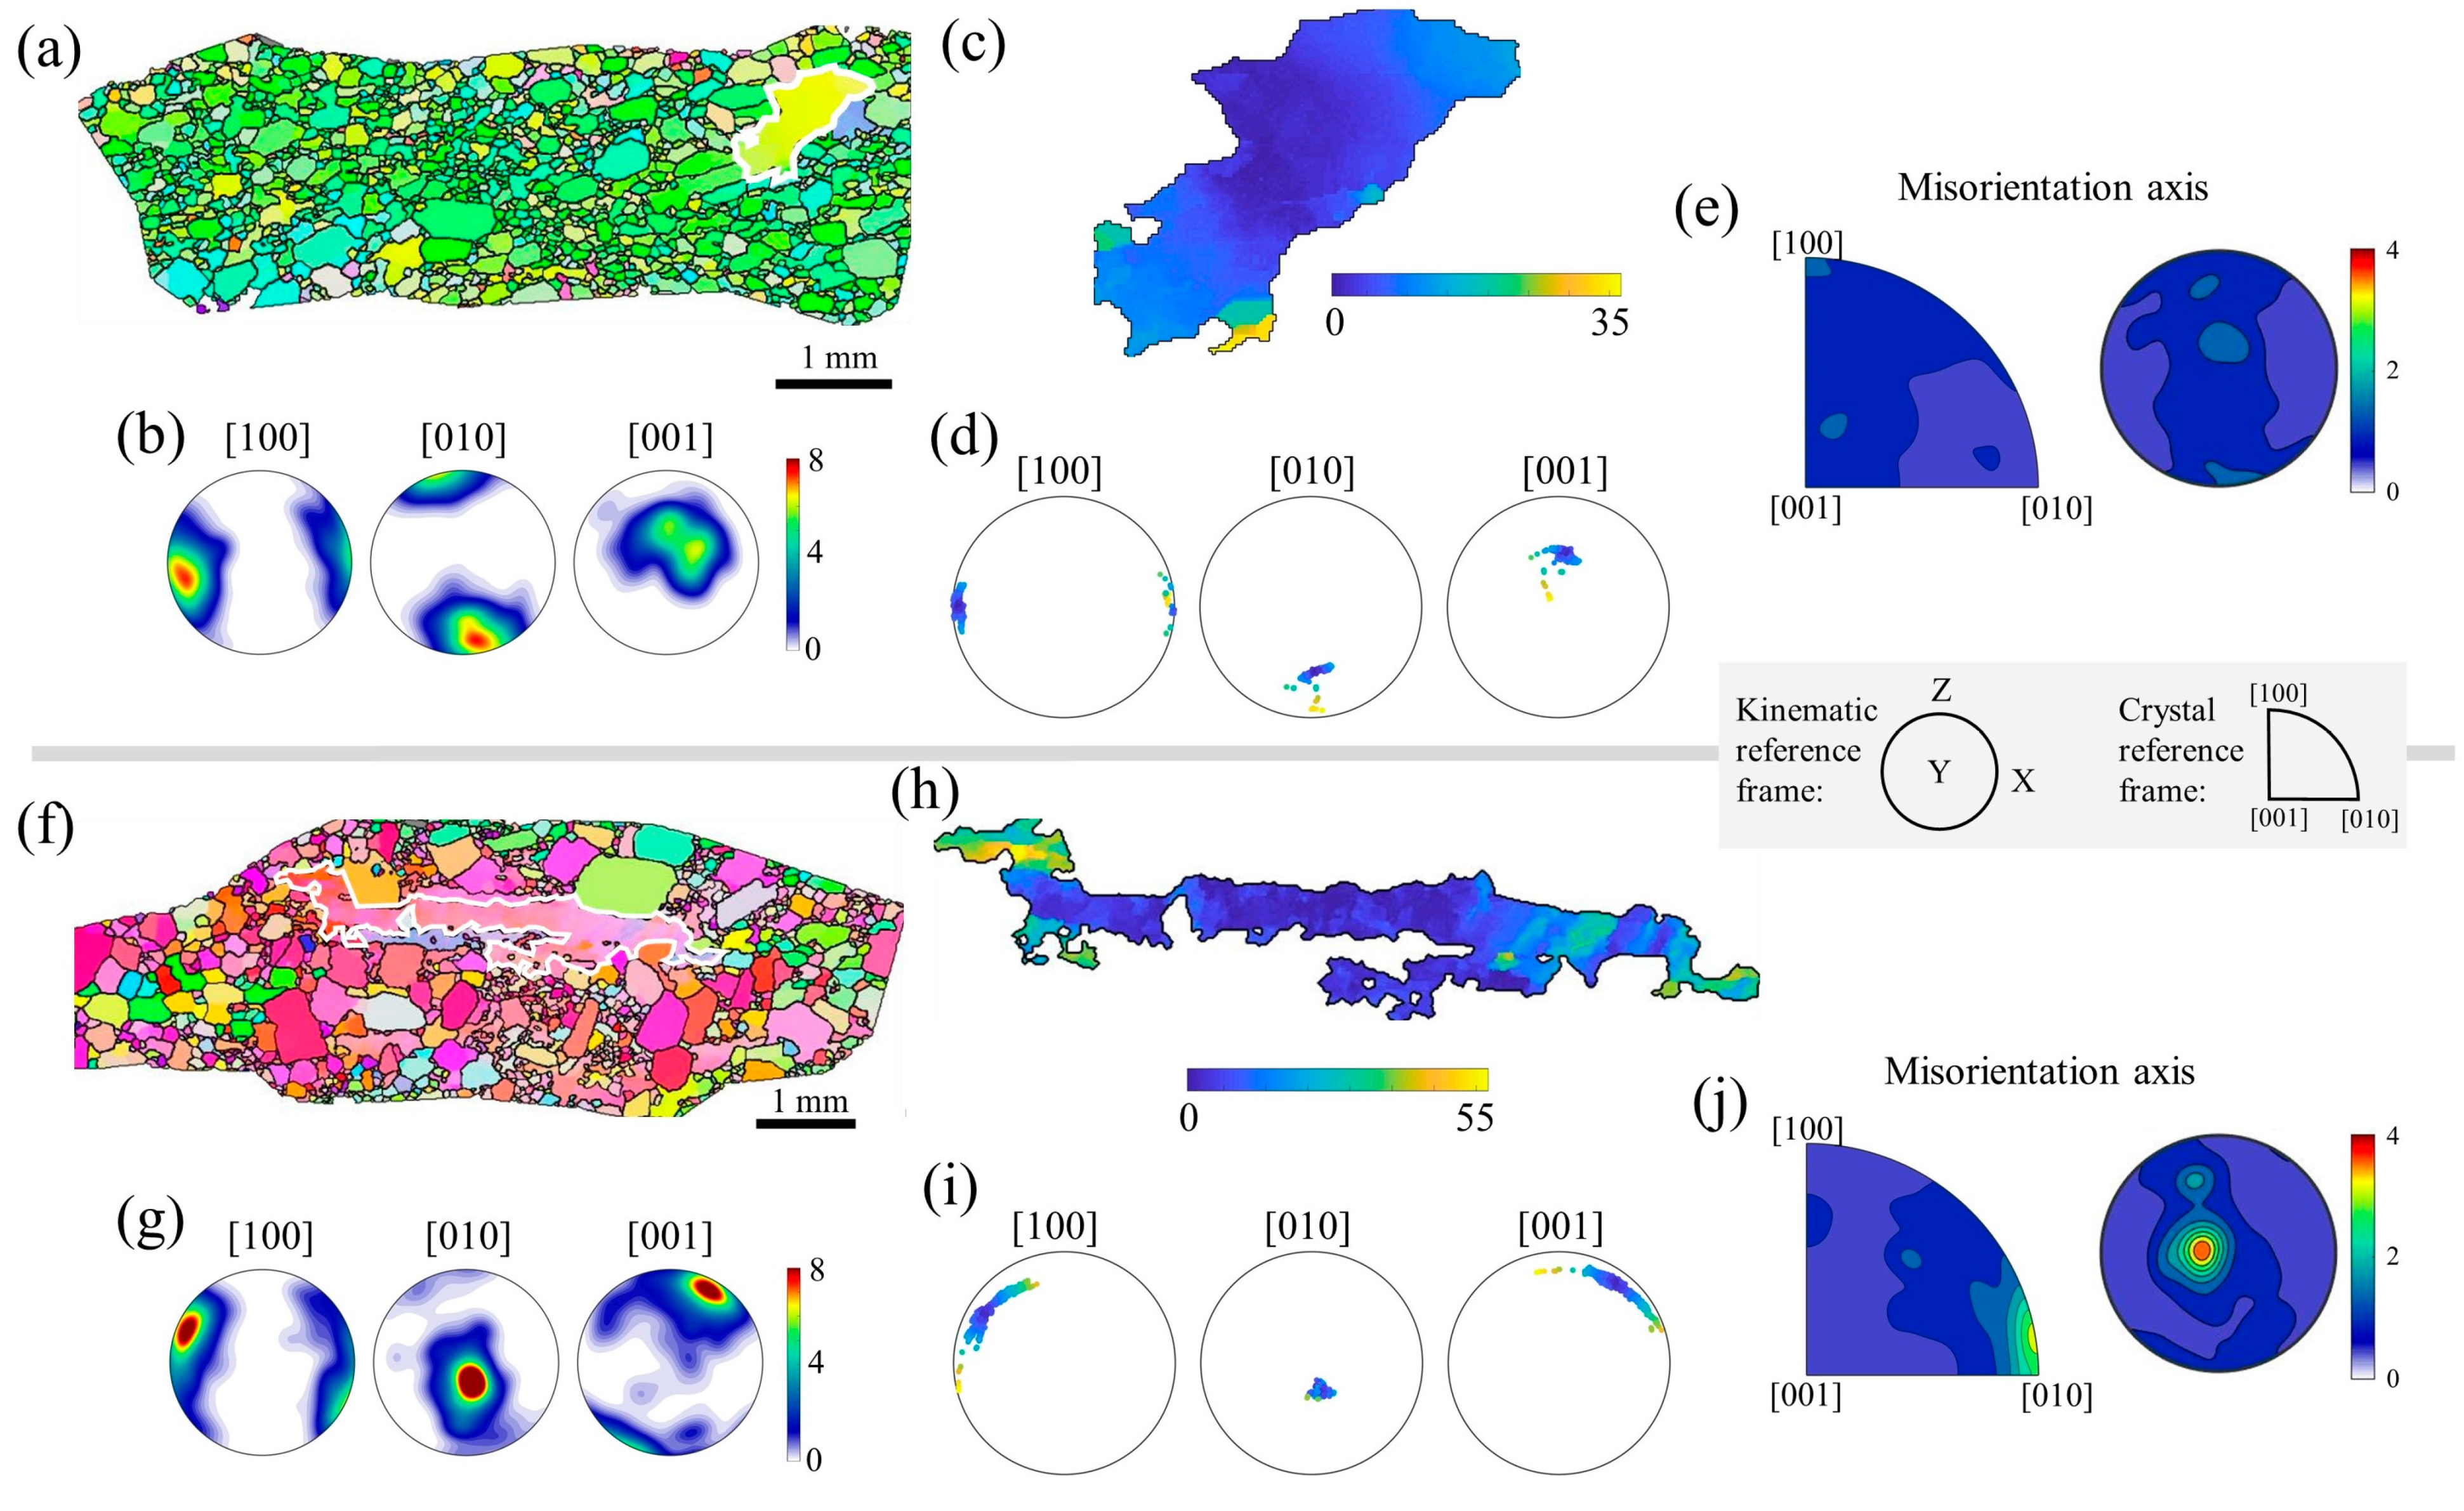
Analysis of grains with small angles of intragrain misorientation (<10 degrees), defining subgrain boundaries, can be used to constrain the mechanism/s and kinematics of deformation [58]. Grains with high internal misorientations (e.g., large grains with warm colors in Figure 3b,c, for olivine and opx, respectively) presumably represent porphyroclast (i.e., large grains that were present before the rapid deformation stage). These grains were picked for subgrain boundary analysis to constrain the dominant slip system and the deformation geometry experienced by each specific grain (Figure 7 and Figure 8). For olivine, we expect subgrain boundaries to reflect the (010)[100] slip system in accordance with its bulk A-type CPO [24]. However, subgrain analyses show more evidence for the (001)[100] slip system than the (010)[100] slip system [42]. This discrepancy between bulk CPO and sub-grain boundary in xenoliths from the Wyoming Craton was discussed by Chin et al. [42], and similar observations have been reported for samples from other locations and tectonic regimes; in general, these observations are interpreted to reflect complex strain histories in continental settings that could result in an apparent mismatch between bulk and subgrain fabric [28,59]. Figure 7 highlights two porphyroclasts with high intragrain misorientation surrounded by recrystallized grains (i.e., low intra-grain misorientations). The first grain (Figure 7a–e) with a relatively small misorientation shows that most of the rotation occurs in the [100] and [010] and bulk orientation consistent with A-type (i.e., [100] aligned with lineation, [010] aligned quasi-perpendicular to the foliation); the area containing the surrounding grains displays a clear A-type fabric (Figure 7b). The second porphyroclast (Figure 7f–j) shows evidence for the (001)[100] slip system, with the misorientation axis aligned with the crystallographic [010] axis, which is parallel to the kinematic Y-axis; the surrounding grains exhibit an E-type fabric with the [100] rotated anti-clockwise to the lineation [56,57,60] and [001] sub-perpendicular to the shear plane (Figure 7g).
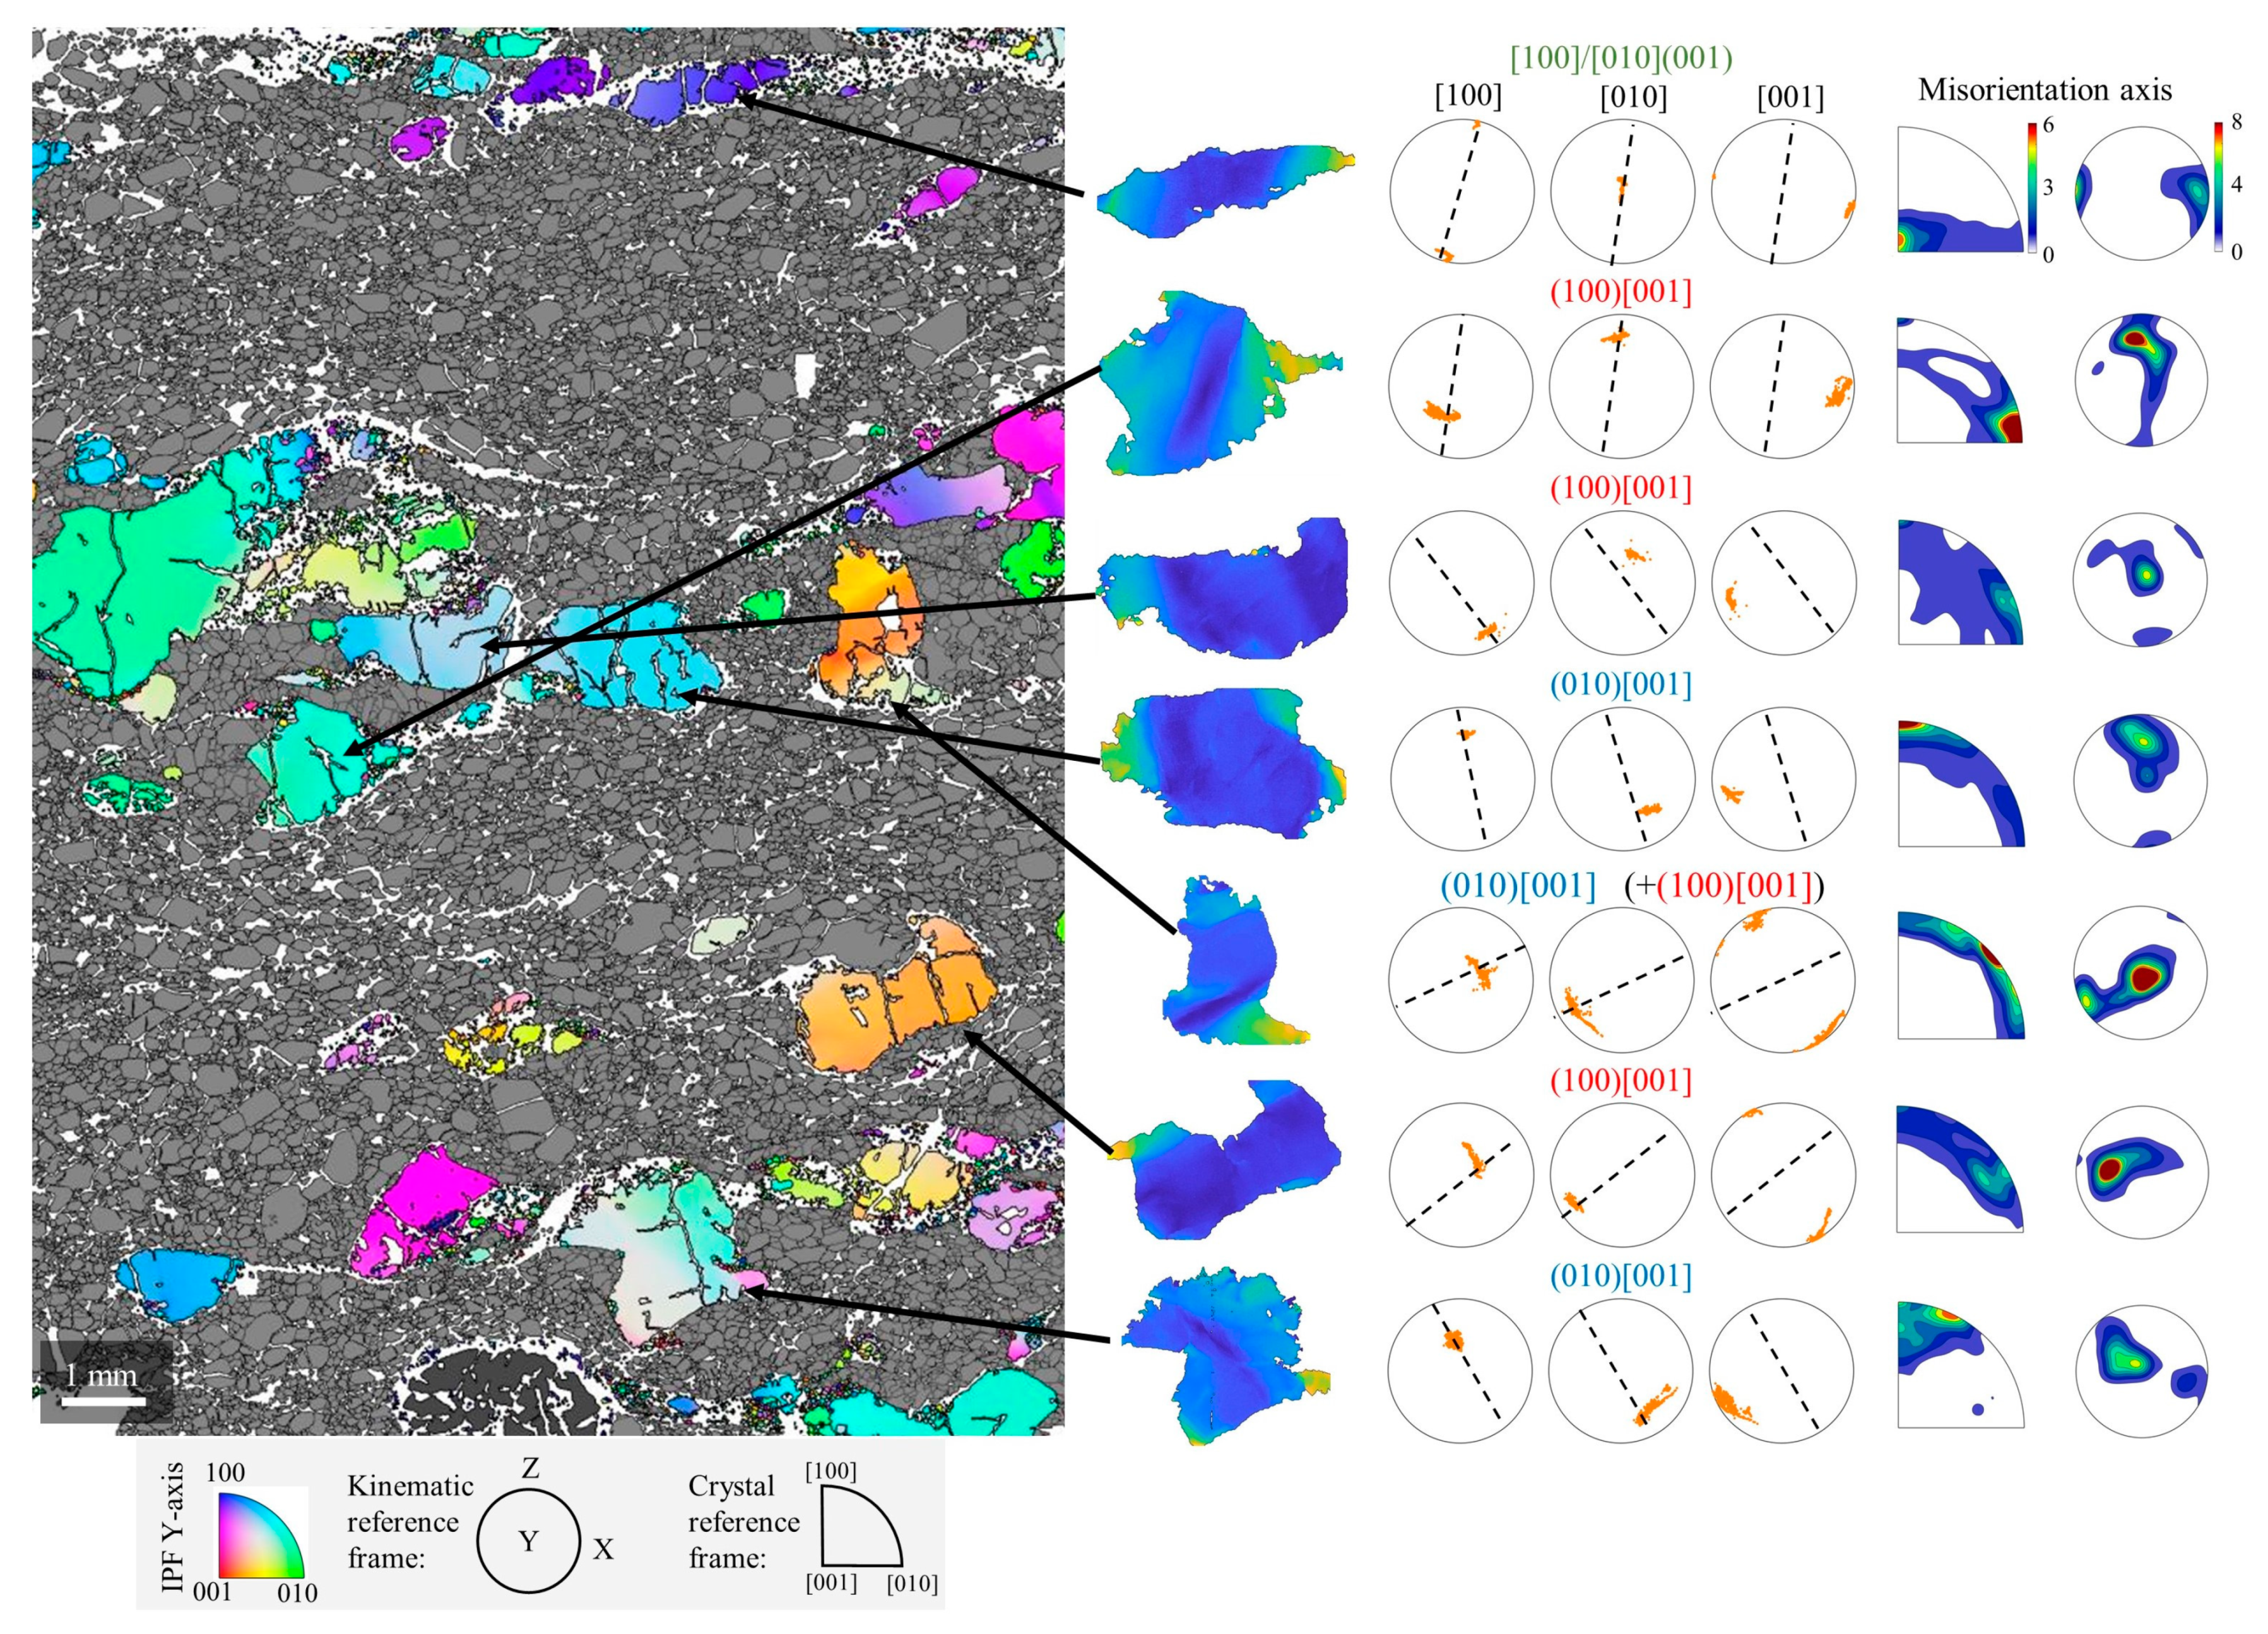
Opx porphyroclasts are larger than olivine porphyroclasts, significantly less recrystallized, and exhibit large areas with high intragrain misorientation. Due to their large size, they can also show a significant spread of the intragrain orientations (e.g., Figure 7i), which can be used for investigating the active slip system/s and the kinematics of deformation. In addition, opx slip systems are less diverse than olivine, showing evidence for (100)[001] or (010)[001] [61], which (by consistency) can help in constraining the kinematics of deformation and, thus, also the dominant olivine slip system. The subgrain boundary analysis of opx in Figure 8 shows seven grains. In the sample reference frame, the misorientation axes are dominantly aligned near the sample Y-axis, suggesting simple shear kinematics, and confirm our interpreted kinematic frame. The misorientation axes show evidence for activation of both the (100)[001] and the (010)[001] slip systems. Similar to results for olivine, the bulk opx CPO (Figure 2d) suggests that the (100)[001] slip system is dominant, while subgrain boundary analysis indicates significant activity from both (100)[001] and (010)[001].
4. Discussion
Here, we discuss our integrated results on a kimberlite-hosted cratonic mantle lherzolite from the Wyoming Craton, USA within the context of experimentally derived deformation studies. Microstructural and textural analysis of the rapid deformation event can be used for understanding processes related to a kimberlite eruption, dynamic stability of the lithosphere, and strength of cratons. The xenolith has a highly sheared, mylonitic texture interpreted to have formed under high strain rates—similar to lab conditions [42,46]—followed by high-temperature annealing and entrainment in the kimberlite [3,40,46,62]. Moreover, this series of events, effectively quenched by the geologically “instantaneous” kimberlite eruption, allows detailed comparison of textural evolution from the conditions of the laboratory to the conditions in the mantle.
4.1. Crystallographic Fabric
The symmetry and orientation of olivine CPO with respect to the kinematic reference frame determined in lab experiments are often used to infer the temperature, pressure, and chemical conditions of natural deformation [27]. However, the conditions responsible for these transitions are not well constrained from high-pressure experiments [13,17,25] Furthermore, the experimentally determined fabric transitions cannot explain, in a straightforward manner, the apparently overlapping range of the observed textures in natural samples, mainly originating from low stress and low strain-rate environments [28,29].
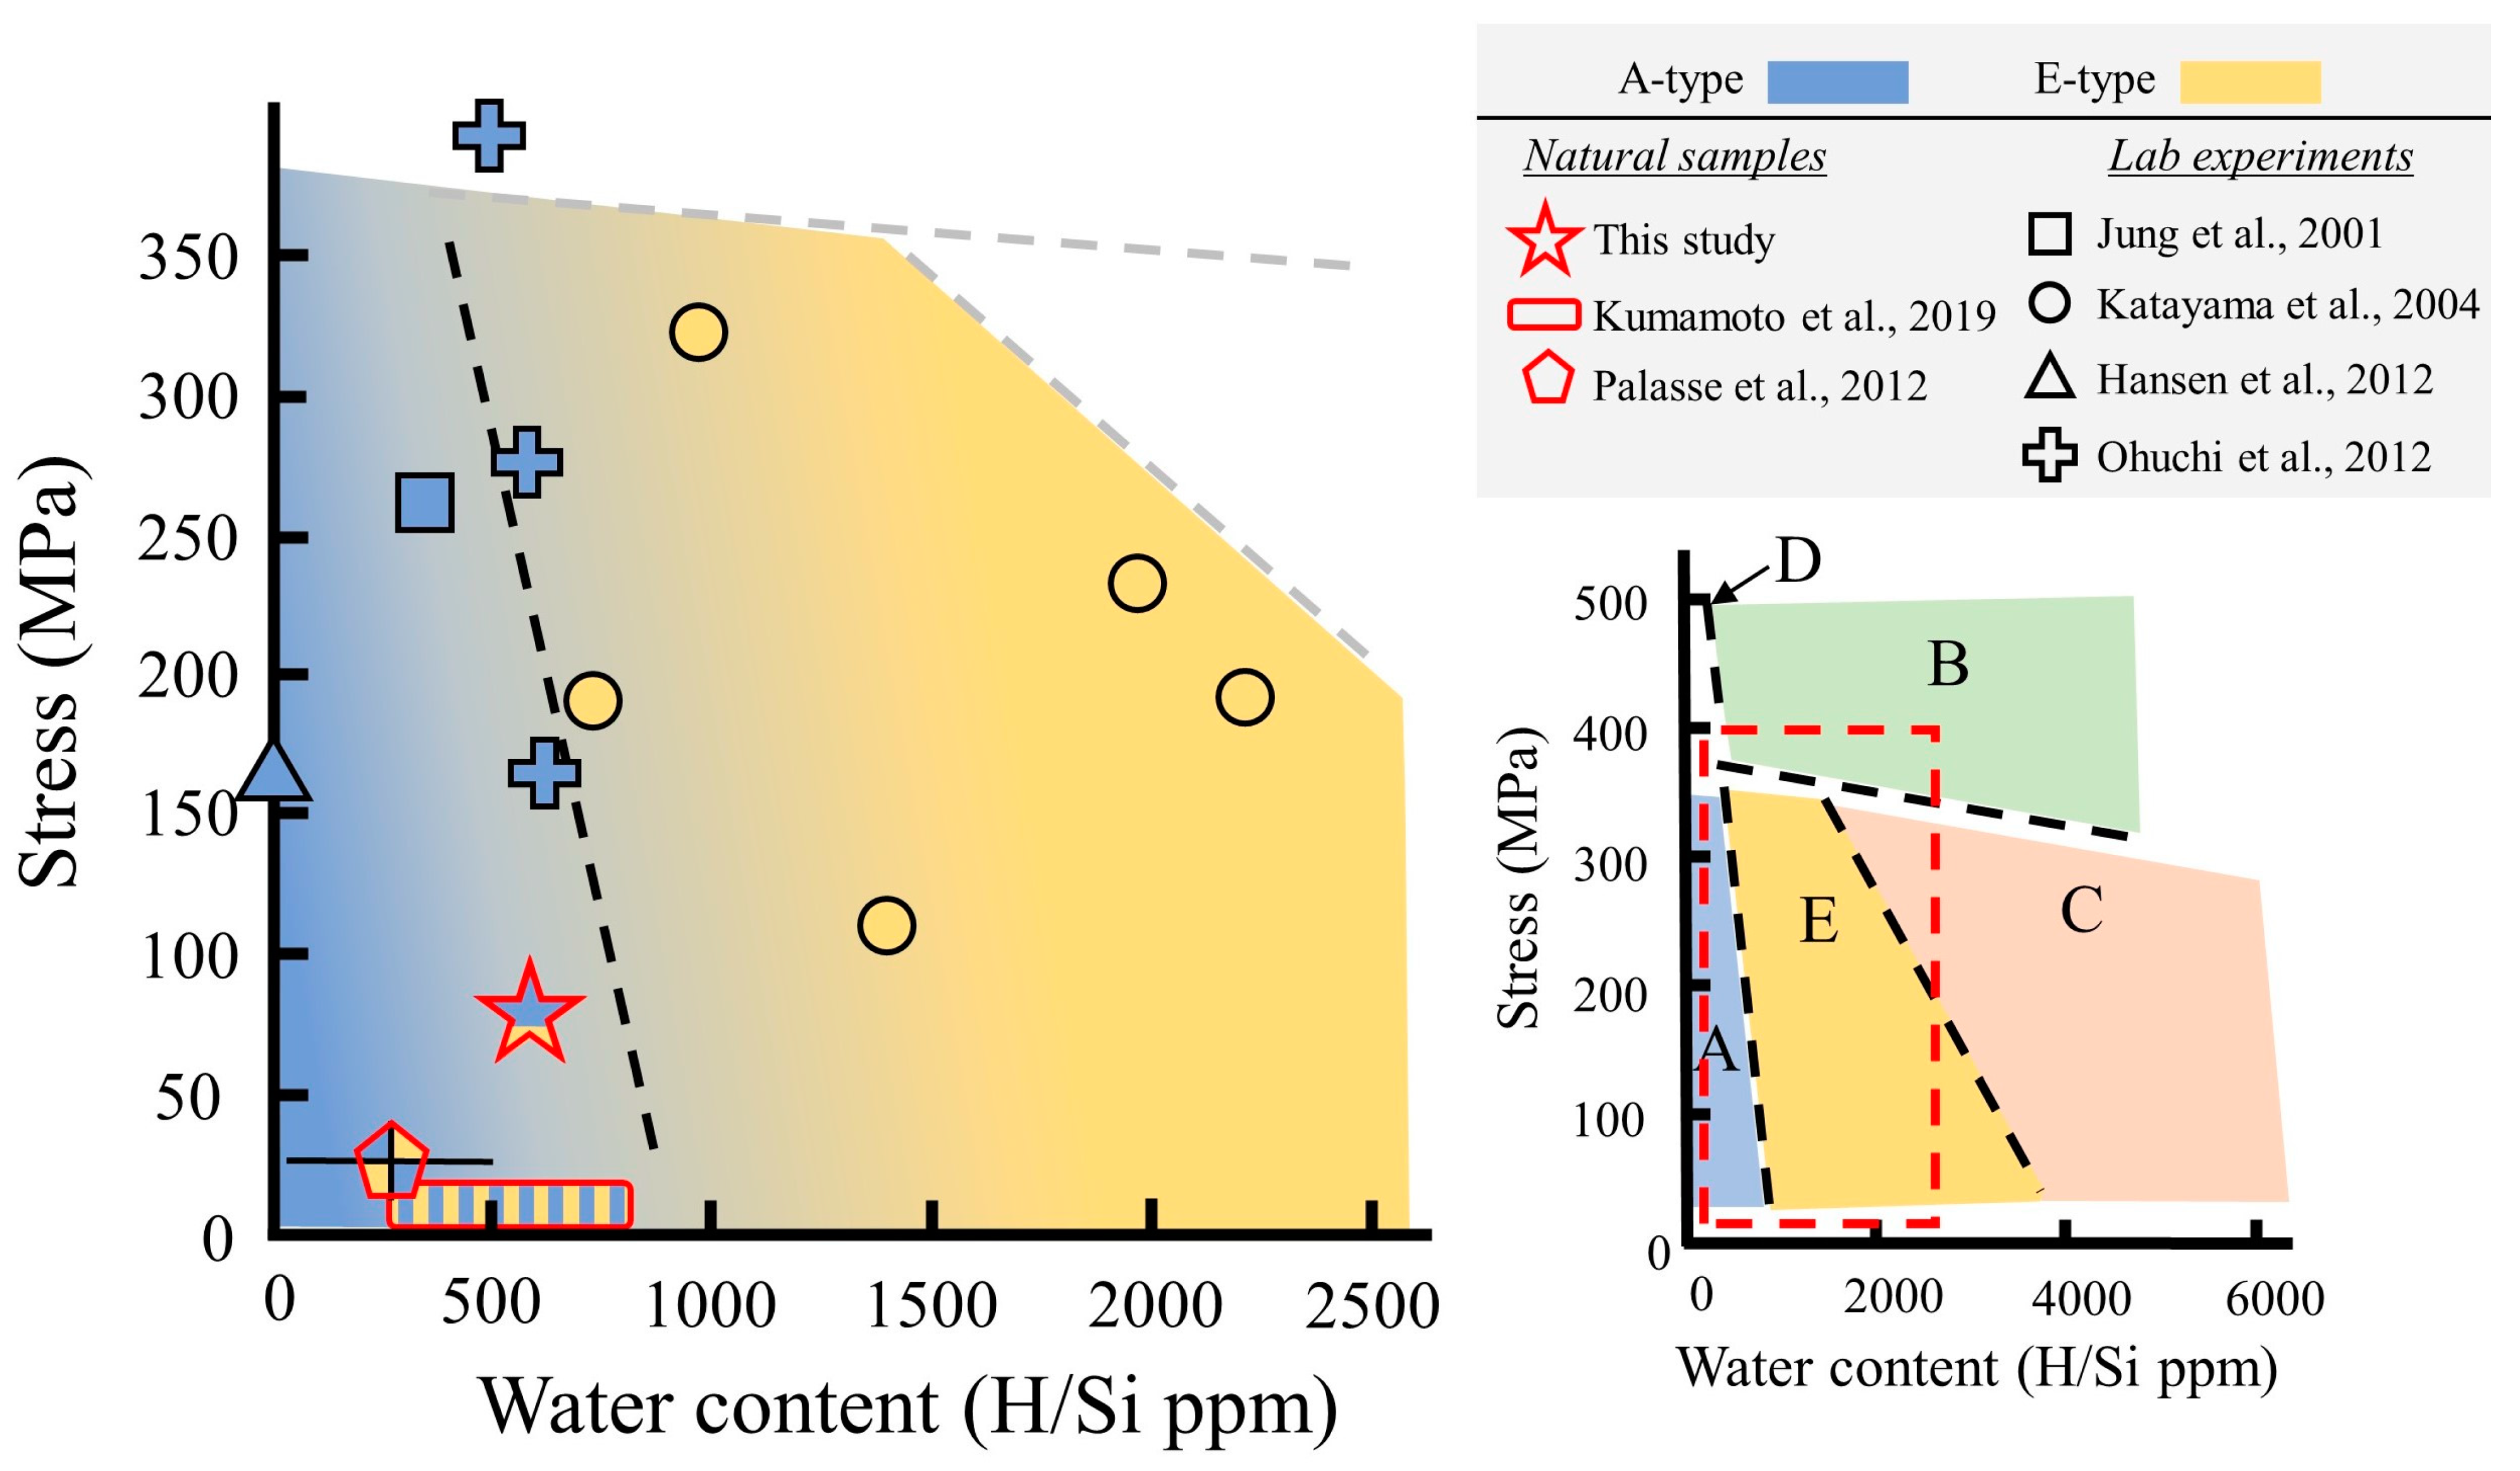
The bulk olivine CPO in the sample discussed here can be classified as A-type with some contribution of secondary E-type (or axial D-type fabrics) (Figure 2c). The grain-boundary analysis of deformed olivine grains also shows the two active fabrics A and E (Figure 7), although E-type subgrain boundaries are more distinct than A-type subgrain boundaries (Figure S2b,d, Supplementary Materials). This apparent discrepancy between the CPO and the SGB was also recognized in other studies on the Wyoming Craton [42] and at other localities [28,59]. This discrepancy may arise from a change of the thermo-chemical conditions during deformation [63], transition to grain-size sensitive deformation mechanism [64], a change in the deformation kinematics [28,65], or difference in the recovery rate for different slip systems [7,66]. With a change in the deformation conditions (either with the thermo-chemical conditions or the kinematics of deformation), the subgrain boundaries will reflect deformation from the latest deformation stage. In contrast, the bulk orientation of the sample (i.e., CPO) will be dependent on the different stages of deformation, potentially a pre-existing CPO, and the amount of strain imposed [67,68,69]. In the sample described here, both the CPO and the subgrain boundary analysis suggest activation of A-type and E-type. Using the measured water content (548 ppm H/Si, or the equivalent 33.5 ppm H2O) and estimated stress (80 MPa), we can place the mylonitic sample on the OH-stress space determined experimentally by Katayama et al. [60]. The H69-15F sheared xenolith sample is located close to the A-E boundary, consistent with the observed fabric dominated by A-type with significant evidence for active E-type (Figure 9).
The comparison between the opx fabric and experimental constraints is limited for opx since, unlike olivine, there are very limited data on opx fabric development under different mechanical-chemical conditions [72,73]. Nonetheless, there is coherence between the olivine and opx fabrics and slip systems we observed. For both phases, the Burgers vector of slip fits subgrain boundary analysis and the CPO of the [100] (olivine) and [001] (opx) axes aligns with shear direction and the bulk CPO, suggesting the typical, A-type, (010)[100] for olivine, and the “a on c”, (100)[001] for opx. However, subgrain boundaries show equal or even higher activation of the complementary slip system with the same Burgers vector but different slip plane-(001)[100] and (010)[001] for olivine and opx, respectively. This suggests that the activation of the two slip systems has a somewhat different expression on CPO and subgrain boundary. More experimental work on the relations between CPO evolution and subgrain boundaries (especially for opx) is needed.
4.2. Deformation Mechanisms and Deformation Rates
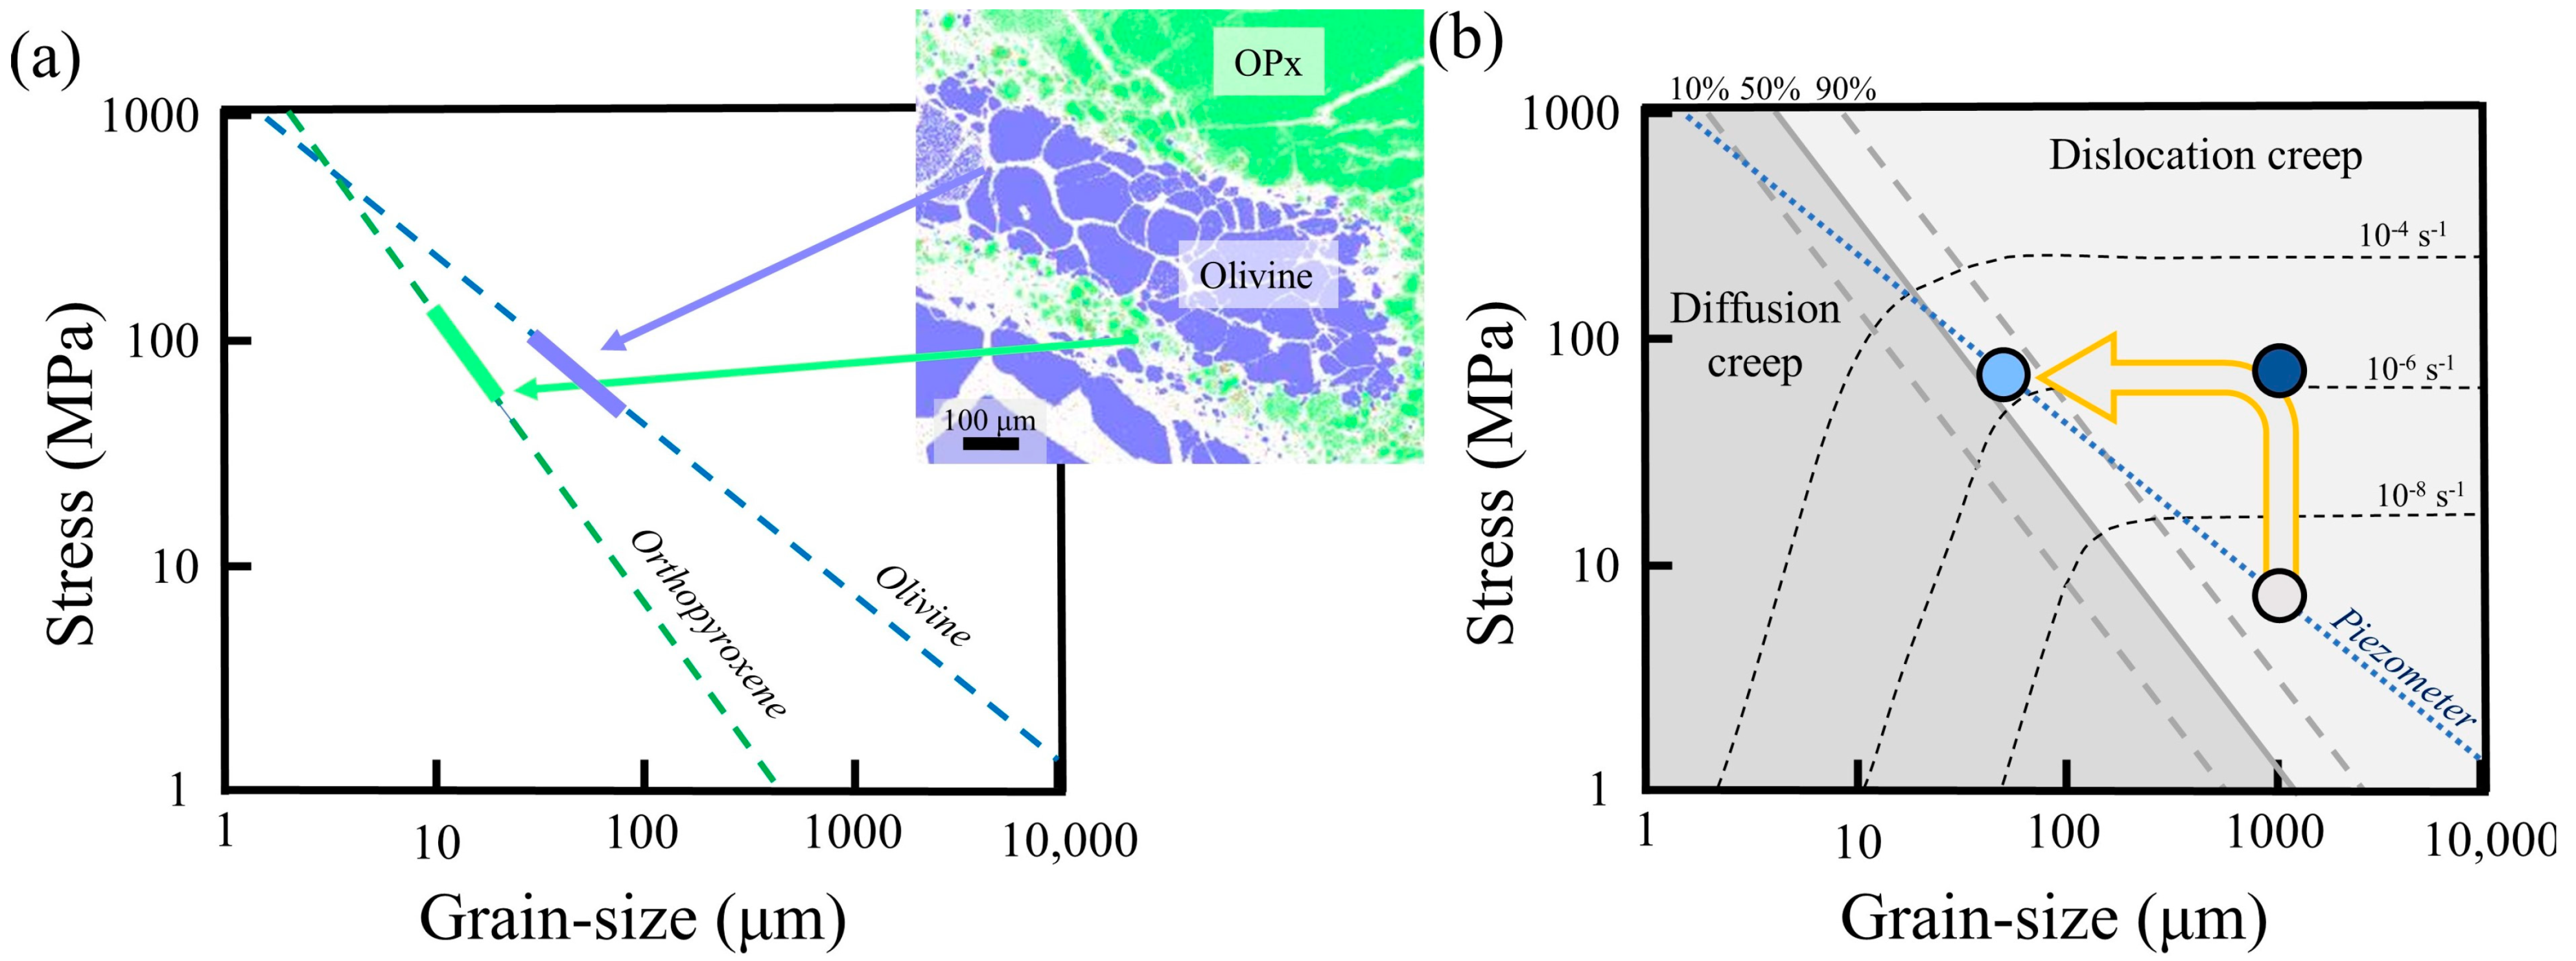
The marked differences in CPO strength, grain size, and intragrain misorientation between the olivine monophase and multiphase bands (Figure 4 and Figure 5) suggest that the presence of the other minerals (opx and garnet) tends to (a) lead to the formation of polyphase bands and (b) affects the deformation and recrystallization processes of olivine grains. Similar observations of the formation of olivine–olivine + opx banding and the role of opx on olivine CPO were reported from laboratory experiments (e.g., [33]). The range of olivine recrystallized grain sizes (which were distinguished from the statically recrystallized tablet-shaped grains by their equant shape and smaller size), (30–80 μm) gives a range of differential stress of 51–107 MPa using the piezometer of Van der Wal et al. [74]. The recrystallized opx grain size (10–20 μm) gives a differential stress of 58–145 MPa using the piezometer of Linckens et al. [75]. Thus, the two piezometers estimate similar differential stresses (Figure 10a; [76]). This analysis provides a minimum stress, since some static grain growth may have occurred. However, opx grains show no clear evidence for grain growth. In the flow law calculations below, we use a single stress of 80 MPa.
A deformation mechanism map was constructed using flow laws for wet olivine [21] under the deformation conditions of the mylonite: T = 1320 °C, P = 4.6 GPa, COH = 548 ppm H/Si (see Table S1, Supplementary Materials). The grain size of olivine porphyroclasts is estimated to be at least 1000 μm (relying on lower strain samples from the same diatreme; [46]) with an average recrystallized grain size of 50 μm. Assuming that the initial grain size formed under steady-state conditions (reflecting the stresses near the base of the lithospheric mantle), the initial stress was <10 MPa. When the rapid deformation event occurred, stresses increased to ~80 MPa; dislocation creep was active during the creation of the initial microstructure (i.e., the porphyroclast population) leading to grain size reduction by dynamic recrystallization. The deformation mechanism map for these conditions of H69-15F shows that, after recrystallization, the conditions are close to the transition between dislocation creep and diffusion creep (Figure 10b). This observation fits the field-boundary hypothesis that the recrystallized grain size will always be at the boundary between dislocation and diffusion deformation mechanisms due to the energy balance between grain size reduction and grain growth [77].
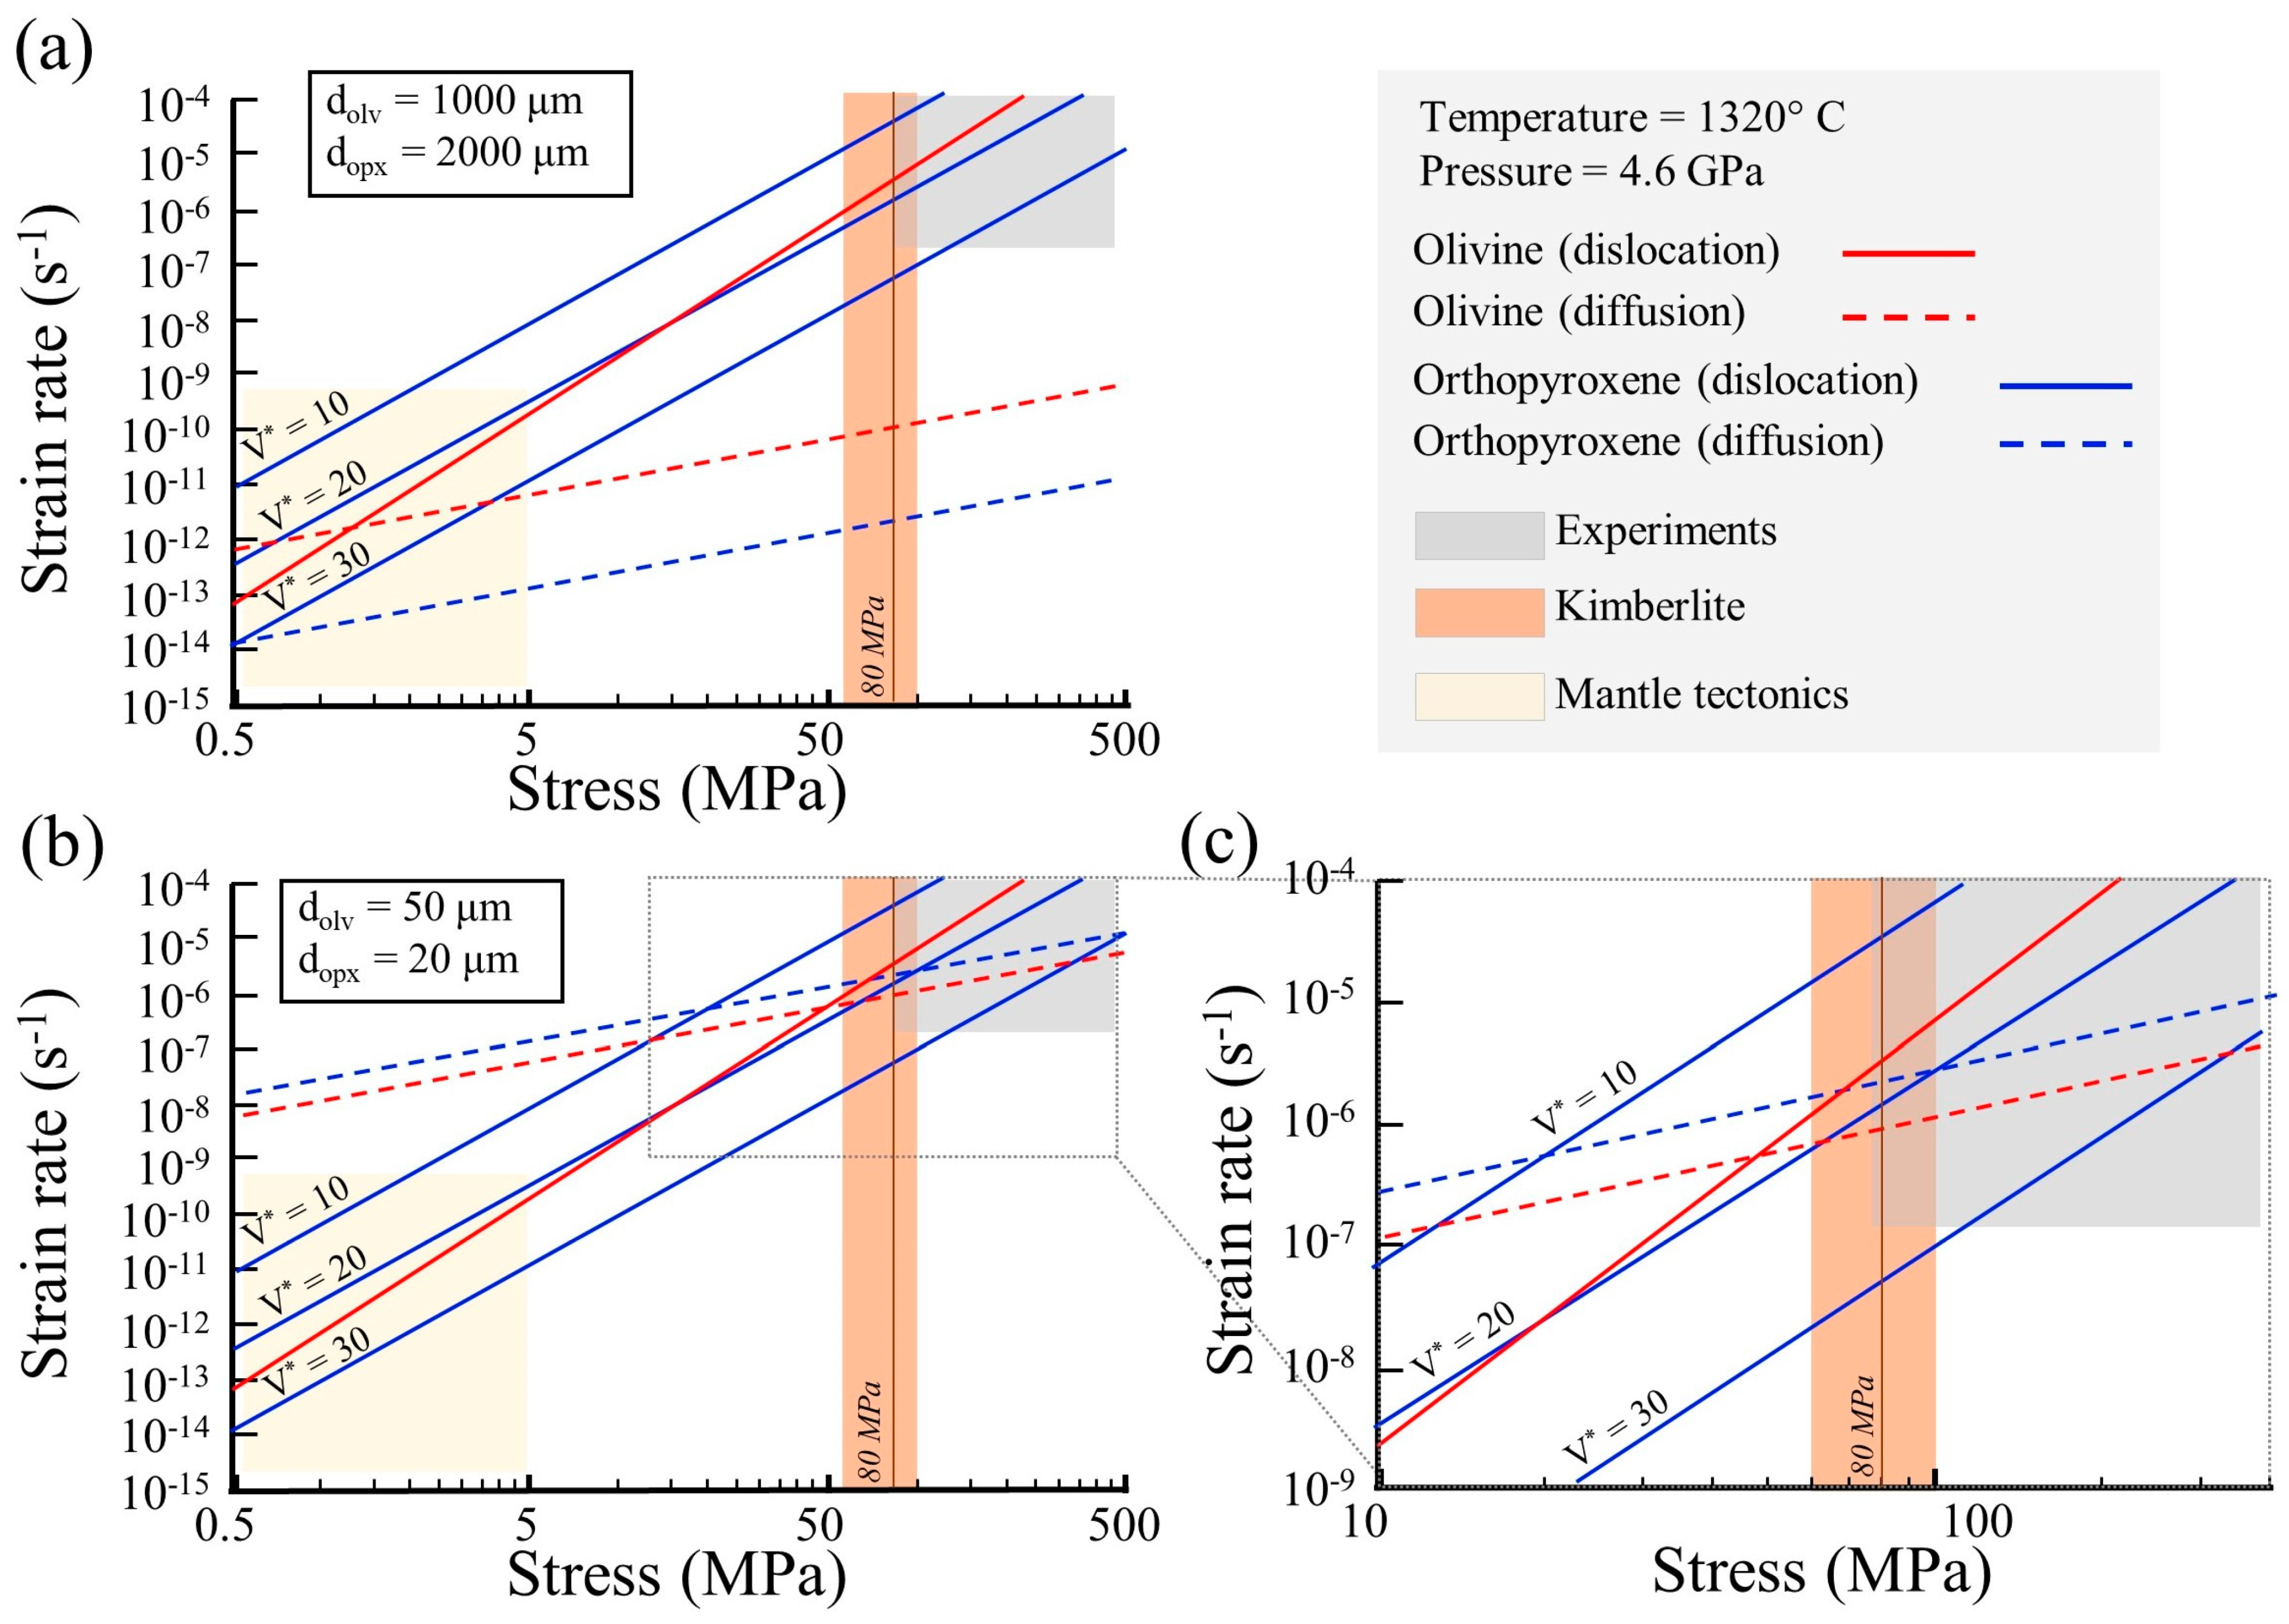
Using existing flow laws for wet olivine and opx under the P-T-COH conditions inferred for the shearing of sample H69-15F, we compared the predicted strain rates for the porphyroclasts grain size and for the recrystallized grain size using a standard flow law [21], e.g., where is the strain rate in units of s−1, A is the pre-exponential parameter, is the stress in MPa, d is grain size in , COH is the water content in H/106 Si, E is the activation energy in J/mol, P is pressure in GPa, V* is the activation volume in m3/mol, T is the temperature in K, and R is the gas constant with units of J/K mol. The flow law parameters for olivine from [21] and opx from [78,79] are listed in Table S1 (Supplementary Materials). Since the dislocation flow law for wet opx [78] was constructed using experiments at a confining pressure of 0.3 GPa, we included an activation volume to extrapolate from the pressure in the experiments to the 4.6 GPa pressure constrained for H69-15F. The influence of water content is included in the A term of the flow law listed in Table S1 (Supplementary Materials). The opx water content of our sample (3,504 H/106 Si) is within the range of the value determined for the opx in Zhang et al.’s [78] experiments (2760–5120 H/106 Si). We calculated trends for a range of activation volumes (V* = 10, 20, and 30 m3 106/mol). Activation volume has a strong effect on the predicted strain rates [80], which can be seen in Figure 11; different activation volumes result in orders of magnitude differences in strain rates. Relying on the microstructure and, in particular, the observation that the opx porphyroclasts show a significantly lower recrystallized grain fraction than olivine, we interpreted that the opx porphyroclast grains were deformed to lower strain [81] and that the coarse-grained opx was stronger than olivine at the relevant stresses. Therefore, using opx dislocation creep flow laws from Zhang et al. [78] and the comparison between calculated strain rates of opx and olivine porphyroclasts (Figure 11a), we recognized that an activation volume of V* > 20 m3 106/mol provided the best fit to our interpretation of relatively strong opx porphyroclasts.
We next considered the predicted strain rates for recrystallized opx during dislocation creep [78] and diffusion creep (based on experiments by Zhang et al. [79], which were conducted at comparable pressures to our natural sample, and, thus, require no extrapolation in pressure). Dislocation creep is predicted to be the dominant deformation mechanism when the activation volume is V* < ~20 (m3 106/mol) for dislocation creep. In contrast, diffusion creep is predicted to be the dominant deformation mechanism when V* > ~20 (m3 106/mol) for dislocation creep (Figure 11c). The weak CPO observed for the recrystallized opx tails (Figure 6 and Figure S1, and Table 1) suggests that the recrystallized grains were deformed by grain size sensitive creep (such as diffusion creep), reinforcing the inference from our analysis, suggesting a high activation energy (V* > 20 m3 106/mol) for dislocation creep of opx.
5. Conclusions and Summary
We analyzed the microstructure in a highly sheared lherzolite produced during a rapid lithospheric deformation event and compared it with microstructures and rheological properties produced in experiments under similar stress and strain rate conditions. Table 1 summarizes the results of our microstructural analysis and those from analyses of experimental samples from the literature.
(1) Large EBSD maps show monophase bands of olivine and multiphase bands. Microstructural analysis of olivine reveals weaker CPO strength, smaller grain size, and lower intragrain misorientation compared to the olivine in the monophase bands. These observations highlight the importance of secondary minerals in the deformation of an olivine-rich rock and suggest that the rock microstructure evolves to naturally organize weaker monophase bands to facilitate deformation.
(2) Olivine and opx show CPOs that fit the common A-type fabric for olivine indicative of dominant slip on the (010)[100] and slip on (100)[001] for opx. However, the subgrain boundary analysis also shows significant activation of olivine E-type, (001)[100], and opx (010)[001] slip systems. The dominant A-type and secondary E-type for olivine is consistent with the constrained conditions near the A to E transition determined for experimental samples at moderate water contents [60].
(3) Microstructural observations suggest olivine porphyroclasts are more susceptible to deformation and recrystallization than opx porphyroclasts. Recrystallized olivine grains are larger than recrystallized opx grains, as expected from experimentally established piezometers. Both olivine and opx porphyroclasts are predicted to deform by dislocation creep, consistent with their microstructures. To illustrate consistency between microstructural observations and flow laws, the activation volume for dislocation creep of wet opx [78] needs to be greater than ~20 m3 106/mol).
Supplementary Materials
The following are available online at https://www.mdpi.com/article/10.3390/min11090995/s1, Figure S1: Porphyroclasts vs. recrystallized CPO, Figure S2: Olivine’s sub-grain boundary analysis, Table S1: Flow-laws parameters.
Author Contributions
Conceptualization, Y.B., E.J.C. and G.H; methodology, Y.B. and E.J.C.; writing, Y.B., E.J.C. and G.H; original draft preparation, Y.B., E.J.C. and G.H. All authors have read and agreed to the published version of the manuscript.
Funding
This research was funded by NSF EAR, grant number 1719208 to E.J.C. and by NSF EAR, grant number 1361487 to G.H.
Data Availability Statement
Not applicable.
Acknowledgments
The authors thank the editors of the special volume “Mantle Strain Localization—How Minerals Deform at Deep Plate Interfaces” and two anonymous reviewers for their constructive comments.
Conflicts of Interest
The authors declare no conflict of interest.
References
- Ave Lallemant, H.; Mercier, J.C.; Carter, N.; Ross, J. Rheology of the upper mantle: Inferences from peridotite xenoliths. Tectonophysics 1980, 70, 85–113. [Google Scholar] [CrossRef]
- Baptiste, V.; Tommasi, A.; Demouchy, S. Deformation and hydration of the lithospheric mantle beneath the Kaapvaal craton, South Africa. Lithos 2012, 149, 31–50. [Google Scholar] [CrossRef]
- Mercier, J.C.C. Peridotite xenoliths and the dynamics of kimberlite intrusion. In The Mantle Sample: Inclusion in Kimberlites and Other Volcanics; Boyd, F., Meyer, H.O., Eds.; American Geophysical Union: Washington, DC, USA, 1979; Volume 16, pp. 197–212. [Google Scholar]
- Michibayashi, K.; Mainprice, D. The role of pre-existing mechanical anisotropy on shear zone development within oceanic mantle lithosphere: An example from the Oman ophiolite. J. Petrol. 2004, 45, 405–414. [Google Scholar] [CrossRef] [Green Version]
- Michibayashi, K.; Oohara, T. Olivine fabric evolution in a hydrated ductile shear zone at the Moho Transition Zone, Oman Ophiolite. Earth Planet. Sci. Lett. 2013, 377, 299–310. [Google Scholar] [CrossRef]
- Skemer, P.; Karato, S.I. Sheared lherzolite xenoliths revisited. J. Geophys. Res. 2008, 113, B07205. [Google Scholar] [CrossRef] [Green Version]
- Tommasi, A.; Vauchez, A.; Ionov, D.A. Deformation, static recrystallization, and reactive melt transport in shallow subcontinental mantle xenoliths (Tok Cenozoic volcanic field, SE Siberia). Earth Planet. Sci. Lett. 2008, 272, 65–77. [Google Scholar] [CrossRef]
- Tommasi, A.; Baptiste, V.; Vauchez, A.; Holtzman, B. Deformation, annealing, reactive melt percolation, and seismic anisotropy in the lithospheric mantle beneath the southeastern Ethiopian rift: Constraints from mantle xenoliths from Mega. Tectonophysics 2016, 682, 186–205. [Google Scholar] [CrossRef]
- Toy, V.G.; Newman, J.; Lamb, W.; Tikoff, B. The role of pyroxenites in formation of shear instabilities in the mantle: Evidence from an ultramafic ultramylonite, Twin Sisters massif, Washington. J. Petrol. 2010, 51, 55–80. [Google Scholar] [CrossRef] [Green Version]
- Warren, J.M.; Hirth, G.; Kelemen, P.B. Evolution of olivine lattice preferred orientation during simple shear in the mantle. Earth Planet. Sci. Lett. 2008, 272, 501–512. [Google Scholar] [CrossRef] [Green Version]
- Webber, C.; Newman, J.; Holyoke, C.W., III; Little, T.; Tikoff, B. Fabric development in cm-scale shear zones in ultramafic rocks, Red Hills, New Zealand. Tectonophysics 2010, 489, 55–75. [Google Scholar] [CrossRef]
- Boneh, Y.; Skemer, P. The effect of deformation history on the evolution of olivine CPO. Earth Planet. Sci. Lett. 2014, 406, 213–222. [Google Scholar] [CrossRef]
- Couvy, H.; Frost, D.J.; Heidelbach, F.; Nyilas, K.; Ungár, T.; Mackwell, S.J.; Cordier, P. Shear deformation experiments of forsterite at 11 GPa-1400 °C in the multianvil apparatus. Eur. J. Mineral. 2004, 16, 877–889. [Google Scholar] [CrossRef]
- Hansen, L.; Zimmerman, M.; Dillman, A.; Kohlstedt, D. Strain localization in olivine aggregates at high temperature: A laboratory comparison of constant-strain-rate and constant-stress boundary conditions. Earth Planet. Sci. Lett. 2012, 333, 134–145. [Google Scholar] [CrossRef]
- Jung, H.; Karato, S.-I. Water-induced fabric transitions in olivine. Science 2001, 293, 1460–1463. [Google Scholar] [CrossRef] [Green Version]
- Karato, S.-I.; Jung, H. Effects of pressure on high-temperature dislocation creep in olivine. Philos. Mag. 2003, 83, 401–414. [Google Scholar] [CrossRef]
- Ohuchi, T.; Kawazoe, T.; Nishihara, Y.; Nishiyama, N.; Irifune, T. High pressure and temperature fabric transitions in olivine and variations in upper mantle seismic anisotropy. Earth Planet. Sci. Lett. 2011, 304, 55–63. [Google Scholar] [CrossRef]
- Ohuchi, T.; Kawazoe, T.; Nishihara, Y.; Irifune, T. Change of olivine a-axis alignment induced by water: Origin of seismic anisotropy in subduction zones. Earth Planet. Sci. Lett. 2012, 317, 111–119. [Google Scholar] [CrossRef]
- Wallis, D.; Hansen, L.N.; Tasaka, M.; Kumamoto, K.M.; Parsons, A.J.; Lloyd, G.; Kohlstedt, D.; Wilkinson, A.J. The impact of water on slip system activity in olivine and the formation of bimodal crystallographic preferred orientations. Earth Planet. Sci. Lett. 2019, 508, 51–61. [Google Scholar] [CrossRef]
- Ave’lallemant, H.G.; Carter, N.L. Syntectonic recrystallization of olivine and modes of flow in the upper mantle. Geol. Soc. Am. Bull. 1970, 81, 2203–2220. [Google Scholar] [CrossRef]
- Hirth, G.; Kohlstedt, D. Rheology of the upper mantle and the mantle wedge: A view from the experimentalists. Inside Subduction Fact. 2003, 138, 83–105. [Google Scholar]
- Karato, S.-I.; Wu, P. Rheology of the upper mantle: A synthesis. Science 1993, 260, 771–778. [Google Scholar] [CrossRef]
- Long, M.D.; Becker, T.W. Mantle dynamics and seismic anisotropy. Earth Planet. Sci. Lett. 2010, 297, 341–354. [Google Scholar] [CrossRef]
- Hansen, L.N.; Zhao, Y.-H.; Zimmerman, M.E.; Kohlstedt, D.L. Protracted fabric evolution in olivine: Implications for the relationship among strain, crystallographic fabric, and seismic anisotropy. Earth Planet. Sci. Lett. 2014, 387, 157–168. [Google Scholar] [CrossRef]
- Mainprice, D. 2.20—Seismic Anisotropy of the Deep Earth from a Mineral and Rock Physics Perspective. In Treatise on Geophysics, 2nd ed.; Schubert, G., Ed.; Elsevier: Oxford, UK, 2015; pp. 487–538. [Google Scholar] [CrossRef]
- Zhang, S.; Karato, S.-I. Lattice preferred orientation of olivine aggregates deformed in simple shear. Nature 1995, 375, 774–777. [Google Scholar] [CrossRef]
- Karato, S.-I.; Jung, H.; Katayama, I.; Skemer, P. Geodynamic significance of seismic anisotropy of the upper mantle: New insights from laboratory studies. Annu. Rev. Earth Planet. Sci. 2008, 36, 59–95. [Google Scholar] [CrossRef] [Green Version]
- Bernard, R.E.; Behr, W.M.; Becker, T.W.; Young, D.J. Relationships between olivine CPO and deformation parameters in naturally deformed rocks and implications for mantle seismic anisotropy. Geochem. Geophys. Geosyst. 2019, 20, 3469–3494. [Google Scholar] [CrossRef] [Green Version]
- Kumamoto, K.M.; Warren, J.M.; Hansen, L.N. Evolution of the Josephine Peridotite Shear Zones: 2. Influences on Olivine Cpo Evolution. J. Geophys. Res. Solid Earth 2019, 124, 12763–12781. [Google Scholar] [CrossRef]
- Herwegh, M.; Linckens, J.; Ebert, A.; Berger, A.; Brodhag, S. The role of second phases for controlling microstructural evolution in polymineralic rocks: A review. J. Struct. Geol. 2011, 33, 1728–1750. [Google Scholar] [CrossRef]
- Sundberg, M.; Cooper, R.F. A composite viscoelastic model for incorporating grain boundary sliding and transient diffusion creep; correlating creep and attenuation responses for materials with a fine grain size. Philos. Mag. 2010, 90, 2817–2840. [Google Scholar] [CrossRef]
- Tasaka, M.; Zimmerman, M.E.; Kohlstedt, D.L. Rheological weakening of olivine+ orthopyroxene aggregates due to phase mixing: 1. Mechanical behavior. J. Geophys. Res. Solid Earth 2017, 122, 7584–7596. [Google Scholar] [CrossRef]
- Tasaka, M.; Zimmerman, M.E.; Kohlstedt, D.L.; Stünitz, H.; Heilbronner, R. Rheological weakening of olivine+ orthopyroxene aggregates due to phase mixing: Part 2. Microstructural development. J. Geophys. Res. Solid Earth 2017, 122, 7597–7612. [Google Scholar] [CrossRef] [Green Version]
- Zhao, N.; Hirth, G.; Cooper, R.F.; Kruckenberg, S.C.; Cukjati, J. Low viscosity of mantle rocks linked to phase boundary sliding. Earth Planet. Sci. Lett. 2019, 517, 83–94. [Google Scholar] [CrossRef]
- Storey, C.; Prior, D. Plastic deformation and recrystallization of garnet: A mechanism to facilitate diffusion creep. J. Petrol. 2005, 46, 2593–2613. [Google Scholar] [CrossRef] [Green Version]
- Burnley, P. The importance of stress percolation patterns in rocks and other polycrystalline materials. Nat. Commun. 2013, 4, 1–6. [Google Scholar] [CrossRef] [Green Version]
- Cross, A.; Skemer, P. Ultramylonite generation via phase mixing in high-strain experiments. J. Geophys. Res. Solid Earth 2017, 122, 1744–1759. [Google Scholar] [CrossRef]
- Hansen, L.N.; Warren, J.M. Quantifying the effect of pyroxene on deformation of peridotite in a natural shear zone. J. Geophys. Res. Solid Earth 2015, 120, 2717–2738. [Google Scholar] [CrossRef] [Green Version]
- Paterson, M. Relating experimental and geological rheology. Int. J. Earth Sci. 2001, 90, 157–167. [Google Scholar] [CrossRef]
- Katayama, I.; Michibayashi, K.; Terao, R.; Ando, J.I.; Komiya, T. Water content of the mantle xenoliths from Kimberley and implications for explaining textural variations in cratonic roots. Geol. J. 2011, 46, 173–182. [Google Scholar] [CrossRef]
- Goetze, C. Sheared Iherzolites: From the point of view of rock mechanics. Geology 1975, 3, 172–173. [Google Scholar] [CrossRef]
- Chin, E.J.; Chilson-Parks, B.; Boneh, Y.; Hirth, G.; Saal, A.; Hearn, B.C.; Hauri, E. The peridotite deformation cycle in cratons and the deep impact of subduction. Tectonophysics 2021, 229029. [Google Scholar] [CrossRef]
- Carlson, R.; Irving, A.; Hearn, B., Jr. Chemical and isotopic systematics of peridotite xenoliths from the Williams kimberlite, Montana: Clues to processes of lithosphere formation, modification and destruction. In Proceedings of the VIIth International Kimberlite Conference; University of Cape Town: Rondebosch, South Africa, 1999; pp. 90–98. [Google Scholar]
- Carlson, R.W.; Irving, A.J.; Schulze, D.J.; Hearn Jr, B.C. Timing of Precambrian melt depletion and Phanerozoic refertilization events in the lithospheric mantle of the Wyoming Craton and adjacent Central Plains Orogen. Lithos 2004, 77, 453–472. [Google Scholar] [CrossRef]
- Hearn, J.B.C. The Homestead kimberlite, central Montana, USA: Mineralogy, xenocrysts, and upper-mantle xenoliths. Lithos 2004, 77, 473–491. [Google Scholar]
- Boneh, Y.; Chin, E.J.; Chilson-Parks, B.H.; Saal, A.E.; Hauri, E.H.; Carter Hearn, B., Jr.; Hirth, G. Microstructural shift due to post-deformation annealing in the upper mantle. Geochem. Geophys. Geosyst. 2021, 22, e2020GC009377. [Google Scholar] [CrossRef]
- Warren, J.M.; Hauri, E.H. Pyroxenes as tracers of mantle water variations. J. Geophys. Res. Solid Earth 2014, 119, 1851–1881. [Google Scholar] [CrossRef]
- Demouchy, S.; Jacobsen, S.D.; Gaillard, F.; Stern, C.R. Rapid magma ascent recorded by water diffusion profiles in mantle olivine. Geology 2006, 34, 429–432. [Google Scholar] [CrossRef]
- Mainprice, D.; Bachmann, F.; Hielscher, R.; Schaeben, H. Descriptive tools for the analysis of texture projects with large datasets using MTEX: Strength, symmetry and components. Geol. Soc. Lond. Spec. Publ. 2014, 409, 251–271. [Google Scholar] [CrossRef]
- Hielscher, R.; Schaeben, H. A novel pole figure inversion method: Specification of the MTEX algorithm. J. Appl. Crystallogr. 2008, 41, 1024–1037. [Google Scholar] [CrossRef]
- Bunge, H.-J. Texture Analysis in Materials Science: Mathematical Methods; Elsevier: Amsterdam, The Netherlands, 2013. [Google Scholar]
- Skemer, P.; Katayama, I.; Jiang, Z.; Karato, S.-I. The misorientation index: Development of a new method for calculating the strength of lattice-preferred orientation. Tectonophysics 2005, 411, 157–167. [Google Scholar] [CrossRef]
- Chin, E.J.; Soustelle, V.; Liu, Y. An SPO-induced CPO in composite mantle xenoliths correlated with increasing melt-rock interaction. Geochim. Cosmochim. Acta 2020, 278, 199–218. [Google Scholar] [CrossRef]
- Urai, J.; Means, W.; Lister, G. Dynamic recrystallization of minerals. In Mineral and Rock Deformation: Laboratory Studies; American Geophysical Union: Washington, DC, USA, 1986; Volume 36, pp. 161–199. [Google Scholar]
- Platt, J.P. Rheology of two-phase systems: A microphysical and observational approach. J. Struct. Geol. 2015, 77, 213–227. [Google Scholar] [CrossRef] [Green Version]
- Mehl, L.; Hacker, B.R.; Hirth, G.; Kelemen, P.B. Arc-parallel flow within the mantle wedge: Evidence from the accreted Talkeetna arc, south central Alaska. J. Geophys. Res. Solid Earth 2003, 108. [Google Scholar] [CrossRef] [Green Version]
- Skemer, P.; Warren, J.M.; Kelemen, P.B.; Hirth, G. Microstructural and Rheological Evolution of a Mantle Shear Zone. J. Petrol. 2010, 51, 43–53. [Google Scholar] [CrossRef] [Green Version]
- Prior, D.J.; Wheeler, J.; Peruzzo, L.; Spiess, R.; Storey, C. Some garnet microstructures: An illustration of the potential of orientation maps and misorientation analysis in microstructural studies. J. Struct. Geol. 2002, 24, 999–1011. [Google Scholar] [CrossRef]
- Kaczmarek, M.-A.; Reddy, S.M. Mantle deformation during rifting: Constraints from quantitative microstructural analysis of olivine from the East African Rift (Marsabit, Kenya). Tectonophysics 2013, 608, 1122–1137. [Google Scholar] [CrossRef]
- Katayama, I.; Jung, H.; Karato, S.-I. New type of olivine fabric from deformation experiments at modest water content and low stress. Geology 2004, 32, 1045–1048. [Google Scholar] [CrossRef] [Green Version]
- Christensen, N.I.; Lundquist, S.M. Pyroxene orientation within the upper mantle. Geol. Soc. Am. Bull. 1982, 93, 279–288. [Google Scholar] [CrossRef]
- Drury, M.; Roermund, H.V. Fluid assisted recrystallization in upper mantle peridotite xenoliths from kimberlites. J. Petrol. 1989, 30, 133–152. [Google Scholar] [CrossRef]
- Chin, E.J.; Soustelle, V.; Hirth, G.; Saal, A.E.; Kruckenberg, S.C.; Eiler, J.M. Microstructural and geochemical constraints on the evolution of deep arc lithosphere. Geochem. Geophys. Geosyst. 2016, 17, 2497–2521. [Google Scholar] [CrossRef] [Green Version]
- Précigout, J.; Hirth, G. B-type olivine fabric induced by grain boundary sliding. Earth Planet. Sci. Lett. 2014, 395, 231–240. [Google Scholar] [CrossRef] [Green Version]
- Tommasi, A.; Tikoff, B.; Vauchez, A. Upper mantle tectonics: Three-dimensional deformation, olivine crystallographic fabric and seismic properties. Earth Planet. Sci. Lett. 1999, 168, 173–186. [Google Scholar] [CrossRef]
- Hidas, K.; Garrido, C.J.; Booth-Rea, G.; Marchesi, C.; Bodinier, J.-L.; Dautria, J.-M.; Louni-Hacini, A.; Azzouni-Sekkal, A. Lithosphere tearing along STEP faults and synkinematic formation of lherzolite and wehrlite in the shallow subcontinental mantle. Solid Earth 2019, 10, 1099–1121. [Google Scholar] [CrossRef] [Green Version]
- Boneh, Y.; Morales, L.F.; Kaminski, E.; Skemer, P. Modeling olivine CPO evolution with complex deformation histories: Implications for the interpretation of seismic anisotropy in the mantle. Geochem. Geophys. Geosyst. 2015, 16, 3436–3455. [Google Scholar] [CrossRef] [Green Version]
- Hansen, L.N.; Conrad, C.P.; Boneh, Y.; Skemer, P.; Warren, J.M.; Kohlstedt, D.L. Viscous anisotropy of textured olivine aggregates: 2. Micromechanical model. J. Geophys. Res. Solid Earth 2016, 121, 7137–7160. [Google Scholar] [CrossRef]
- Skemer, P.; Warren, J.M.; Hirth, G. The influence of deformation history on the interpretation of seismic anisotropy. Geochem. Geophys. Geosyst. 2012, 13, Q03006. [Google Scholar] [CrossRef] [Green Version]
- Bell, D.R.; Rossman, G.R.; Maldener, J.; Endisch, D.; Rauch, F. Hydroxide in olivine: A quantitative determination of the absolute amount and calibration of the IR spectrum. J. Geophys. Res. Solid Earth 2003, 108, 2105. [Google Scholar] [CrossRef] [Green Version]
- Paterson, M. The determination of hydroxyl by infrared-absorption in quartz, silicate-glasses and similar materials. Bull. Minéral. 1982, 105, 20–29. [Google Scholar] [CrossRef]
- Jung, H. Crystal preferred orientations of olivine, orthopyroxene, serpentine, chlorite, and amphibole, and implications for seismic anisotropy in subduction zones: A review. Geosci. J. 2017, 21, 985–1011. [Google Scholar] [CrossRef]
- Soustelle, V.; Manthilake, G. Deformation of olivine-orthopyroxene aggregates at high pressure and temperature: Implications for the seismic properties of the asthenosphere. Tectonophysics 2017, 694, 385–399. [Google Scholar] [CrossRef]
- Van der Wal, D.; Chopra, P.; Drury, M.; Gerald, J.F. Relationships between dynamically recrystallized grain size and deformation conditions in experimentally deformed olivine rocks. Geophys. Res. Lett. 1993, 20, 1479–1482. [Google Scholar] [CrossRef]
- Linckens, J.; Herwegh, M.; Müntener, O.; Mercolli, I. Evolution of a polymineralic mantle shear zone and the role of second phases in the localization of deformation. J. Geophys. Res. 2011, 116, B06210. [Google Scholar] [CrossRef]
- Linckens, J.; Bruijn, R.H.; Skemer, P. Dynamic recrystallization and phase mixing in experimentally deformed peridotite. Earth Planet. Sci. Lett. 2014, 388, 134–142. [Google Scholar] [CrossRef]
- De Bresser, J.; Peach, C.; Reijs, J.; Spiers, C. On dynamic recrystallization during solid state flow: Effects of stress and temperature. Geophys. Res. Lett. 1998, 25, 3457–3460. [Google Scholar] [CrossRef]
- Zhang, G.; Mei, S.; Song, M. Effect of water on the dislocation creep of enstatite aggregates at 300 MPa. Geophys. Res. Lett. 2020, 47, e2019GL085895. [Google Scholar] [CrossRef]
- Zhang, G.; Mei, S.; Song, M.; Kohlstedt, D.L. Diffusion creep of enstatite at high pressures under hydrous conditions. J. Geophys. Res. Solid Earth 2017, 122, 7718–7728. [Google Scholar] [CrossRef]
- Hirth, G. Laboratory constraints on the rheology of the upper mantle. Rev. Mineral. Geochem. 2002, 51, 97–120. [Google Scholar] [CrossRef]
- Cross, A.; Skemer, P. Rates of dynamic recrystallization in geologic materials. J. Geophys. Res. Solid Earth 2019, 124, 1324–1342. [Google Scholar] [CrossRef] [Green Version]
Figure 1.
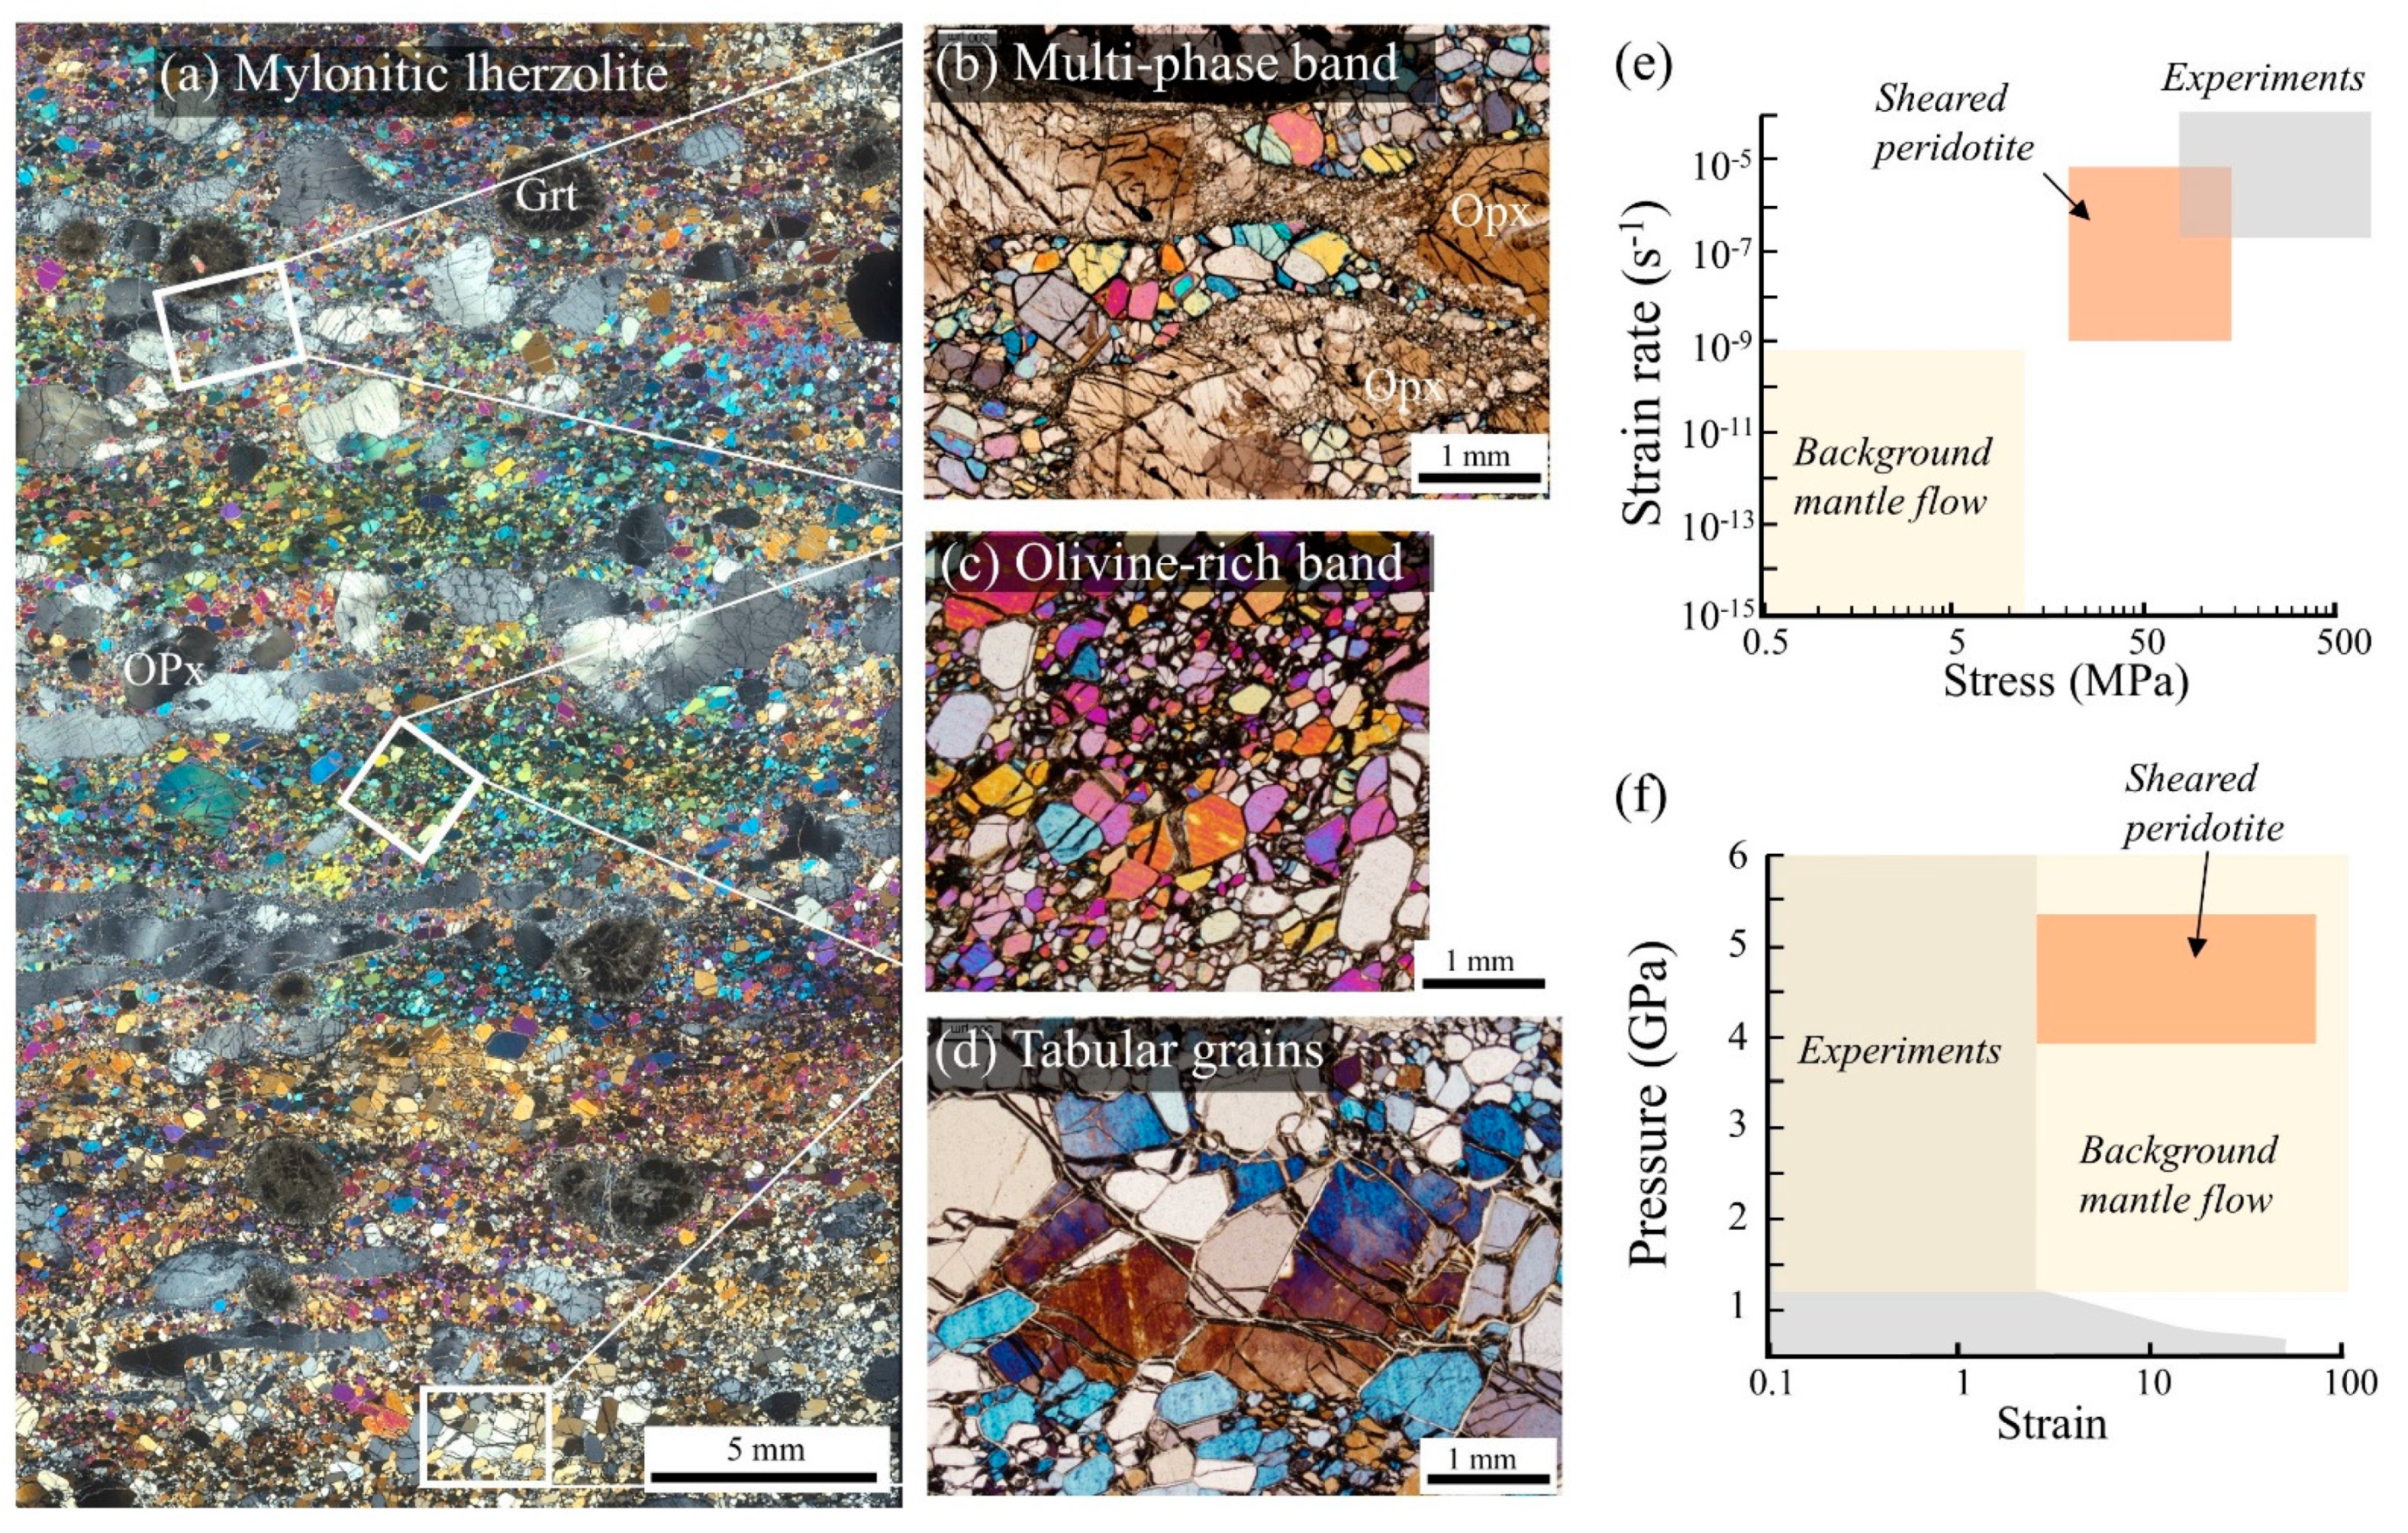
(a) Optical photomicrographs taken with cross-polarized light of sample H69-15F. North-South is normal to the foliation, and East-West is parallel to the lineation. White boxes delineate the main microstructural features in (b–d). (b) Multiphase band comprise olivine, orthopyroxene (Opx), and/or garnet (Grt). (c) Olivine-rich band. (d) post-deformation, tabular-shaped olivine grains growing into deformed grains with undulatory shading. The formation and growth kinetics of the tabular-shaped olivine grains were discussed in Boneh et al. [46]. (e) Microstructural analysis and thermobarometry indicate high stress and high strain rates for the H69-15F sheared lherzolite—comparable to the laboratory conditions. (f) Schematic plot of pressure versus strain illustrating the deformation conditions for the sheared peridotite, along with the common conditions of background mantle flow, which are, for the most part, yet inaccessible in the laboratory.
Figure 1.
(a) Optical photomicrographs taken with cross-polarized light of sample H69-15F. North-South is normal to the foliation, and East-West is parallel to the lineation. White boxes delineate the main microstructural features in (b–d). (b) Multiphase band comprise olivine, orthopyroxene (Opx), and/or garnet (Grt). (c) Olivine-rich band. (d) post-deformation, tabular-shaped olivine grains growing into deformed grains with undulatory shading. The formation and growth kinetics of the tabular-shaped olivine grains were discussed in Boneh et al. [46]. (e) Microstructural analysis and thermobarometry indicate high stress and high strain rates for the H69-15F sheared lherzolite—comparable to the laboratory conditions. (f) Schematic plot of pressure versus strain illustrating the deformation conditions for the sheared peridotite, along with the common conditions of background mantle flow, which are, for the most part, yet inaccessible in the laboratory.

Figure 2.
3-D representation of the microstructure on three orthogonal planes: (a) X-Z plane, (b) X-Y plane, and (c) Y-Z plane. Note that the three planes shown are not spatially connected at their edges. (d,e) Pole figures (area-weighted) of the crystallographic preferred orientation (CPO) for olivine (d) and orthopyroxene (e). Dark outlined polygons delineate the characteristic shape of three groups of grains with self-consistent orientations.

Figure 3.
Electron backscatter diffraction (EBSD) map (X-Z plane) presenting four different microstructural characteristics. (a) Olivine grain orientations are depicted by the inverse pole figure (IPF) parallel to the Y-axis (i.e., normal to the page). Grains of orthopyroxene (opx) and garnet are colored in grey and dark grey, respectively. (b) Intragrain misorientation of olivine grains. Opx and garnet are colored in grey. (c) Intragrain misorientation of opx grains. Olivine and garnet grains are in grey. (d) Misorientation angle at the boundaries between grains. Notice the bands of low (blue arrow) and high (red arrow) misorientation angles (cold and warm colors, respectively).

Figure 4.
High resolution (3 μm step size) orientation map used to characterize the different olivine monophase (b,d,f) and multiphase bands (a,c,e,g), delineated with white lines. Olivine crystallographic preferred orientations (CPO) of each band (area-weighted) are shown through pole figures. Olivine shape preferred orientations (SPO) of each band are shown through inverse pole figures for the long and short axes (left and right sides, respectively). The two red polygons delineate areas shown in Figure 7. Two white squared patches are due to an unfortunate glitch in scanning.

Figure 5.
Microstructural properties of olivine from the different bands delineated by white boundaries in Figure 4. Olivine (a) grain size, (b) texture strength quantified using the M- and J-indices, and (c) intragrain misorientation quantified using the grain orientation spread (GOS) are plotted against the area fraction of olivine grains.

Figure 6.
(a) Comparison of the crystallographic preferred orientation (CPO) strength for olivine and orthopyroxene (opx) porphyroclasts grains (GOS ≥ 0.02 rad) and recrystallized grains (GOS < 0.02 rad). While olivine grains show no change in the CPO strength, recrystallized opx grains show a significant reduction in CPO strength. (b) Opx porphyroclast grain with a characteristic tail structure of recrystallized grains depicted through its intragrain misorientations (blue to red). Olivine grains are shown in grey. Pole figures of the opx grains are shown as both area-weighted (highlighting the porphyroclast grain orientation) and one-point-per-grain (highlighting the contribution of the small recrystallized grains). Notice the dispersion of the recrystallized grains. See Figure S1 in the Supplementary Materials to see more comparisons between the olivine and opx CPO for relict and recrystallized grains and the associated EBSD maps for the data presented in panel (a).

Figure 7.
Analysis of two olivine porphyroclasts with high intragrain misorientation, showing consistent intragrain misorientation and bulk CPO characteristic of A-type fabric (a–e) and E-type fabric (f–j). (a,f) Sections of the orientation map (highlighted in red in Figure 4). (b,g) Crystallographic preferred orientation (CPO) of olivine (area-weighted) for the area in (a,f), respectively. (c,h) Intragrain misorientation in the porphyroclast grain (highlighted in white in maps (a,f)). (d,i) Orientation of the individual porphyroclast where the spread is a trace of the intragrain misorientation. (e,j) Misorientation axis plotted on the crystal (left side), and kinematics (right side) reference frames for the misorientation of the porphyroclast grain. The upper section (a–e) is characterized by (010)[100] slip system (consistent with A-type fabric), and the lower section is characterized by (001)[100] slip system (consistent with E-type fabric).

Figure 8.
Analysis of subgrain boundaries in orthopyroxene (opx) grains. The map (left) highlights opx grain orientations (olivine in grey and garnet in dark grey). The crystallographic orientation spread within the highlighted grains is shown through the pole figures of the [100], [010], and [001] axes. Preferred orientation of the misorientation axis in the crystal references frame (inverse pole figure) and sample reference frame (pole figure) are shown at right.

Figure 9.
Stress versus COH plot showing conditions for olivine A-type and E-type fabric regimes [60]. Sample H69-15F is shown as a red star. Points from the literature are shown (see legend) delineated by the black (for lab studies) and red (for natural samples) outlines. Water content is shown using the Bell et al. [70] calibration (a constant of 3.5 was used when the Paterson [71] calibration was originally used). Inset, classification of olivine crystallographic preferred orientation types on a plot of stress and water content, after Karato et al. [27]; the red box delineates the condition shown on the left side.

Figure 10.
(a) Recrystallized grain size versus stress relations (piezometers) for olivine and opx from Van der Wal et al. [74] and Linckens et al. [75], respectively. The range of grain size for olivine (30–80 μm) and opx (10–20) are shown as the thicker green and blue line segments on the piezometers, respectively. (b) Deformation mechanism map schematically showing the transition from the initial grain-size and stress (grey circle), the deformation mechanism of the porphyroclast microstructure after the stress conditions had changed (dark blue circle), and the deformation mechanism for the induced recrystallized grains of the mylonite (light blue circle). Flow law parameters from Hirth and Kohlstedt [21]. Olivine piezometer from Van der Wal et al. [74]. Lines of percentage represent the percent of dislocation creep compared to the total strain rate of dislocation creep plus diffusion creep.

Figure 11.
Strain rate vs. stress for olivine (red) and orthopyroxene (blue) for dislocation creep (solid lines) and diffusion creep (dashed lines). (a) Strain rates calculated for an assumed pre-deformation grain size (based on the size of porphyroclast grains) of 1 and 2 mm for olivine and orthopyroxene, respectively. The flow law parameters used are given in Table S1, Supplementary Materials. (b) Strain rates calculated for the recrystallized grain size of olivine and opx. (c) Expanded view of (b) for the range of conditions constrained from analysis of the kimberlitic sample; V* is the activation volume in units of (106 m3/mol).


Table 1.
Comparison between high strain rate sheared lherzolite and experimental observations.
| Microstructural Observations (This Study) | Experimental Work | References | ||
|---|---|---|---|---|
| Olivine–orthopyroxene piezometers | ☑ | Grain size of olivine (50 μm) is larger than orthopyroxene (opx) (20 μm). | Existing olivine and opx piezometers give similar stresses and agree with observations that dopx < dolv for a given stress conditions (Figure 10a) | van der Wal et al., 1993; Linckens et al., 2014 |
| Olivine CPO fabric | ☑ | A-type with secondary E-type | The experimentally-based stress-H2O space predicts A-type fabric near the A-E transition (Figure 9). | Karato et al., 2008; Katayama et al., 2004 |
| Olivine mechanism of deformation | ☑ | CPO and grains with high intragrain misorientation suggest dislocation creep. In recrystallized grains, low intragrain misorientation suggests transition to grain size sensitive mechanism. | Flow laws predict dislocation creep in the porphyroclasts and transition to a contribution of both dislocation and diffusion after recrystallization (Figure 10b). | Hirth and Kohlstedt, 2003; De Bresser et al., 1998 |
| Orthopyroxene mechanism of deformation | ☑ ⊠ | Large porphyroclastic grains with high intragrain misorientations suggest dislocation creep. Recrystallized grains with low intragrain misorientation and dispersed CPO suggest diffusion creep. | Existing wet opx flow laws for dislocation creep lack the pressure effect on deformation. Our observations (left column) can be predicted using activation energy of V* > 20 (m3 106/mol) (Figure 11). | Zhang et al., 2020; Zhang et al., 2017 |
| Viscosity ratio Olv/OPx | ☑ ⊠ | High/low recrystallization fraction for olivine and opx, respectively, and olivine-rich bands with stronger CPO suggest that more strain was accommodated by the monophase bands. Tail-shaped structure of recrystallized opx suggest that high strain was accommodated also along opx recrystallized grains. | See cell above. Using high activation volume can result in consistency of flow laws with the observed microstructure-weaker olivine porphyroclasts grains while weaker olivine + opx recrystallized grains (Figure 11c) | Hirth and Kohlstedt, 2003; Zhang et al., 2020; Zhang et al., 2017 |
| Garnet deformation and relative viscosity | ☑ | Garnets have rounded grain morphology with no evidence for recrystallization or intragrain misorientations suggesting that it was not internally deformed. | No existing flow laws for wet garnet (pyrope composition) under high pressures. However, Mg-rich pyrope was showed to be stronger than olivine. | Karato et al., 1995; Katayama and Karato, 2008 |
Publisher’s Note: MDPI stays neutral with regard to jurisdictional claims in published maps and institutional affiliations. |
© 2021 by the authors. Licensee MDPI, Basel, Switzerland. This article is an open access article distributed under the terms and conditions of the Creative Commons Attribution (CC BY) license (https://creativecommons.org/licenses/by/4.0/).
Share and Cite
MDPI and ACS Style
Boneh, Y.; Chin, E.J.; Hirth, G. Microstructural Analysis of a Mylonitic Mantle Xenolith Sheared at Laboratory-like Strain Rates from the Edge of the Wyoming Craton. Minerals 2021, 11, 995. https://doi.org/10.3390/min11090995
AMA Style
Boneh Y, Chin EJ, Hirth G. Microstructural Analysis of a Mylonitic Mantle Xenolith Sheared at Laboratory-like Strain Rates from the Edge of the Wyoming Craton. Minerals. 2021; 11(9):995. https://doi.org/10.3390/min11090995
Chicago/Turabian StyleBoneh, Yuval, Emily J. Chin, and Greg Hirth. 2021. "Microstructural Analysis of a Mylonitic Mantle Xenolith Sheared at Laboratory-like Strain Rates from the Edge of the Wyoming Craton" Minerals 11, no. 9: 995. https://doi.org/10.3390/min11090995
Note that from the first issue of 2016, this journal uses article numbers instead of page numbers. See further details here.