Comminution Effects on Mineral-Grade Distribution: The Case of an MVT Lead-Zinc Ore Deposit


Department of Environmental, Land and Infrastructure Engineering (DIATI), Politecnico di Torino, Corso Duca degli Abruzzi, 24, 10129 Turin, Italy
*
Author to whom correspondence should be addressed.
Minerals 2020, 10(10), 893; https://doi.org/10.3390/min10100893
Submission received: 21 July 2020
/
Revised: 6 October 2020
/
Accepted: 8 October 2020
/
Published: 9 October 2020
(This article belongs to the Special Issue Comminution in the Minerals Industry)
Abstract
:Every mining operation is followed by a beneficiation process aimed at delivering quality materials to the transformation industry. Mainly, in order to separate valuable minerals from gangue in mineral processing, the crushing and grinding of extracted ore are crucial operations for the following separation steps. Comminution is the most energy-consuming operation in mining, and the quality of the results is strictly related to the characteristic of the material under treatment, the type of equipment used in comminution, and the circuit design adopted. A preliminary study was performed in order to understand the crushing behavior under different comminution forces of a high-grade mixed Zn-Pb sulfide ore sample, collected in a Mississippi-Valley Type (MVT) deposit, and the distribution of the target minerals among the products of the process. Ore samples were examined and characterized through thin section observation and SEM analyses for the determination of grain size and texture features, while X-ray powder diffraction (XRPD) quantitative analyses were performed for the definition of target mineral concentrations of comminuted product samples. The selected crushing and grinding circuit comprised lab-scale equipment. For each stage of the process, products below the estimated free-grain size threshold were collected, and particle size analyses were carried out. Comminution products were divided into size distribution classes suitable for further separation operations, and XRPD analyses showed a mineral-grade distribution varying with the dimensions of the products. Characterization of the ore material after crushing and grinding force applications in terms of the distribution of target minerals among different-sized classes was achieved. The important trends highlighted should be considered for further investigation related to an efficient separation.
1. Introduction
The mining industry is characterized by essential operations for a proper transformation process of raw materials into final products. Generally, the exploitation activity in a mine is followed by a beneficiation process designed to increase the quality of the valuable minerals naturally present in the excavated material. The very early stage of the transformation is represented by the comminution and grinding of extracted ore aimed at obtaining different changes in terms of the dimension and shape of the material that will be further treated [1,2,3]. Progressively, separation processes are set up in order to concentrate and separate target minerals from gangue.
Comminution is a highly energy-consuming operation, and it is characterized by very low efficiency [1,4,5,6] and the quality of the final product being strictly related to the physical characteristics of the material under treatment [7,8].
The principal objective of comminution is to liberate valued minerals, which is not an easy and predictable outcome. However, it is important to achieve this, because it affects the efficiency and control of the entire downstream process, especially when the ore has to be delivered to a flotation process [9,10,11,12,13,14]. The shape, dimension, and distribution of minerals also play a strategic role for the achievement of an effective beneficiation process [15,16].
In this study, a representative sample of a specific mineralized area of the Gorno Mining District was comminuted with lab-scale equipment, and the size distribution related to the selected equipment was studied.
Determination of the mineral composition and distribution of the concentration of target minerals among the different-sized classes of the crushing products was the key focus of this work.
The importance of having a clear comprehension of the redistribution of target minerals in mid-processing products could lead to future effective separation designs. Benefits that could be achieved can enhance a reduction in end-process waste, as well as the control of water use, reagents, and machinery utilization during the beneficiation stage.
2. Materials and Methods
2.1. Sampling
The mixed Pb-Zn sulfide ore samples were collected from the Val Vedra mine in the Gorno Mining District, Lombardy, Bergamo, Italy. The Gorno mineralization is defined as MVT [17]; hosted mainly in Triassic shallow water carbonates [18]; and delimited in N-S, E-W, and NW-SE directions by 3 different tectonic faults [19].
About 30 kg of material was grab-sampled in the Pian Bracca extension area at level 1040 m a.s.l., currently under exploration for resource definition by Alta Zinc Ltd. [20]. In the Pian Bracca extension area, the mineralization is developed close to the low-angle Pian Bracca fault, hosted in a graphitic and carbonatic matrix and strongly tectonized, as described in detail by other authors [19].
2.2. Characterization Methods for Samples and Products
2.2.1. Optical Microscopy
Optical microscopy (OM) was performed on uncovered polished 30-μm thin sections, realized from rock sample slices, using a Leica (Wetzlar, Germany) model Ortholux II POL-MK optical polarized-light microscope equipped with a DeltaPix camera and interfaced with DeltaPix software for image acquisition and processing. This was carried out using normal and polarized transmitted lights on polished thin sections for the determination of the main features of the mineralization and the average grain size of the target minerals.
2.2.2. Scanning Electron Microscopy
Scanning electron microscopy (SEM) analyses were performed using a FEI (Hillsboro, OR, USA) model QUANTA INSPECT 200LV microscope equipped with an Energy Dispersive Analysis X-Ray (EDAX) detector and interfaced with xT Microscope Control and an Edax Inc. (Mahwah, NJ, USA) GENESIS Spectrum version 6.04 software. The measurement settings were high vacuum mode, 5.00 kV HV, and backscattered electron detector (BSED). Analyses were performed on uncovered 30-μm thin sections obtained from rock samples.
2.2.3. X-Ray Powder Diffraction Analysis (XRPD)
X-ray powder diffraction (XRPD) analysis was performed using a Rigaku (Tokyo, Japan) model SmartLab SE diffractometer, with Copper K-alpha Radiation (CuKα) at 40 kV and 30 mA, 5–90° 2θ range, 0.01° step width, 1°/min scan speed equipped with a D/teX Ultra 250 (H), and interfaced with the Rigaku (Tokyo, Japan) software SmartLab Studio II package. Quantitative phase analyses were performed by the whole-powder-pattern fitting (WPPF) Rietveld method [21,22,23], as implemented in the software. A pseudo-Voigt peak shape function was selected. The refined parameters were the phase scale factor, peak shape parameters, lattice parameters, preferred orientation, and structure coefficients. The ICDD PDF-4 2020 (International Center for Diffraction Data, Powder Diffraction File™) database [24] was used for phase recognition and refining. Powder samples were manually prepared using an agate mortar from oven-dried samples.
2.3. Crushing and Grinding Equipment
Physical treatments were carried out on a lab-scale, in order to try to reproduce the typical comminution forces and stresses that characterize comminution circuits [1] and control the gradual size reduction of the sample. Using the available equipment, the selected comminution and grinding route takes into account the necessity to provide an input material dimension, for each machine, suitable for feeding hoppers dimensions. Output materials dimensional characteristics have been set up in order to allow the material to fit in the subsequent machine’s hopper. In addition, the equipment arrangement selected for this kind of ore samples was set up taking into account the possibility of the material to be subsequently tested for processing and separation purposes.
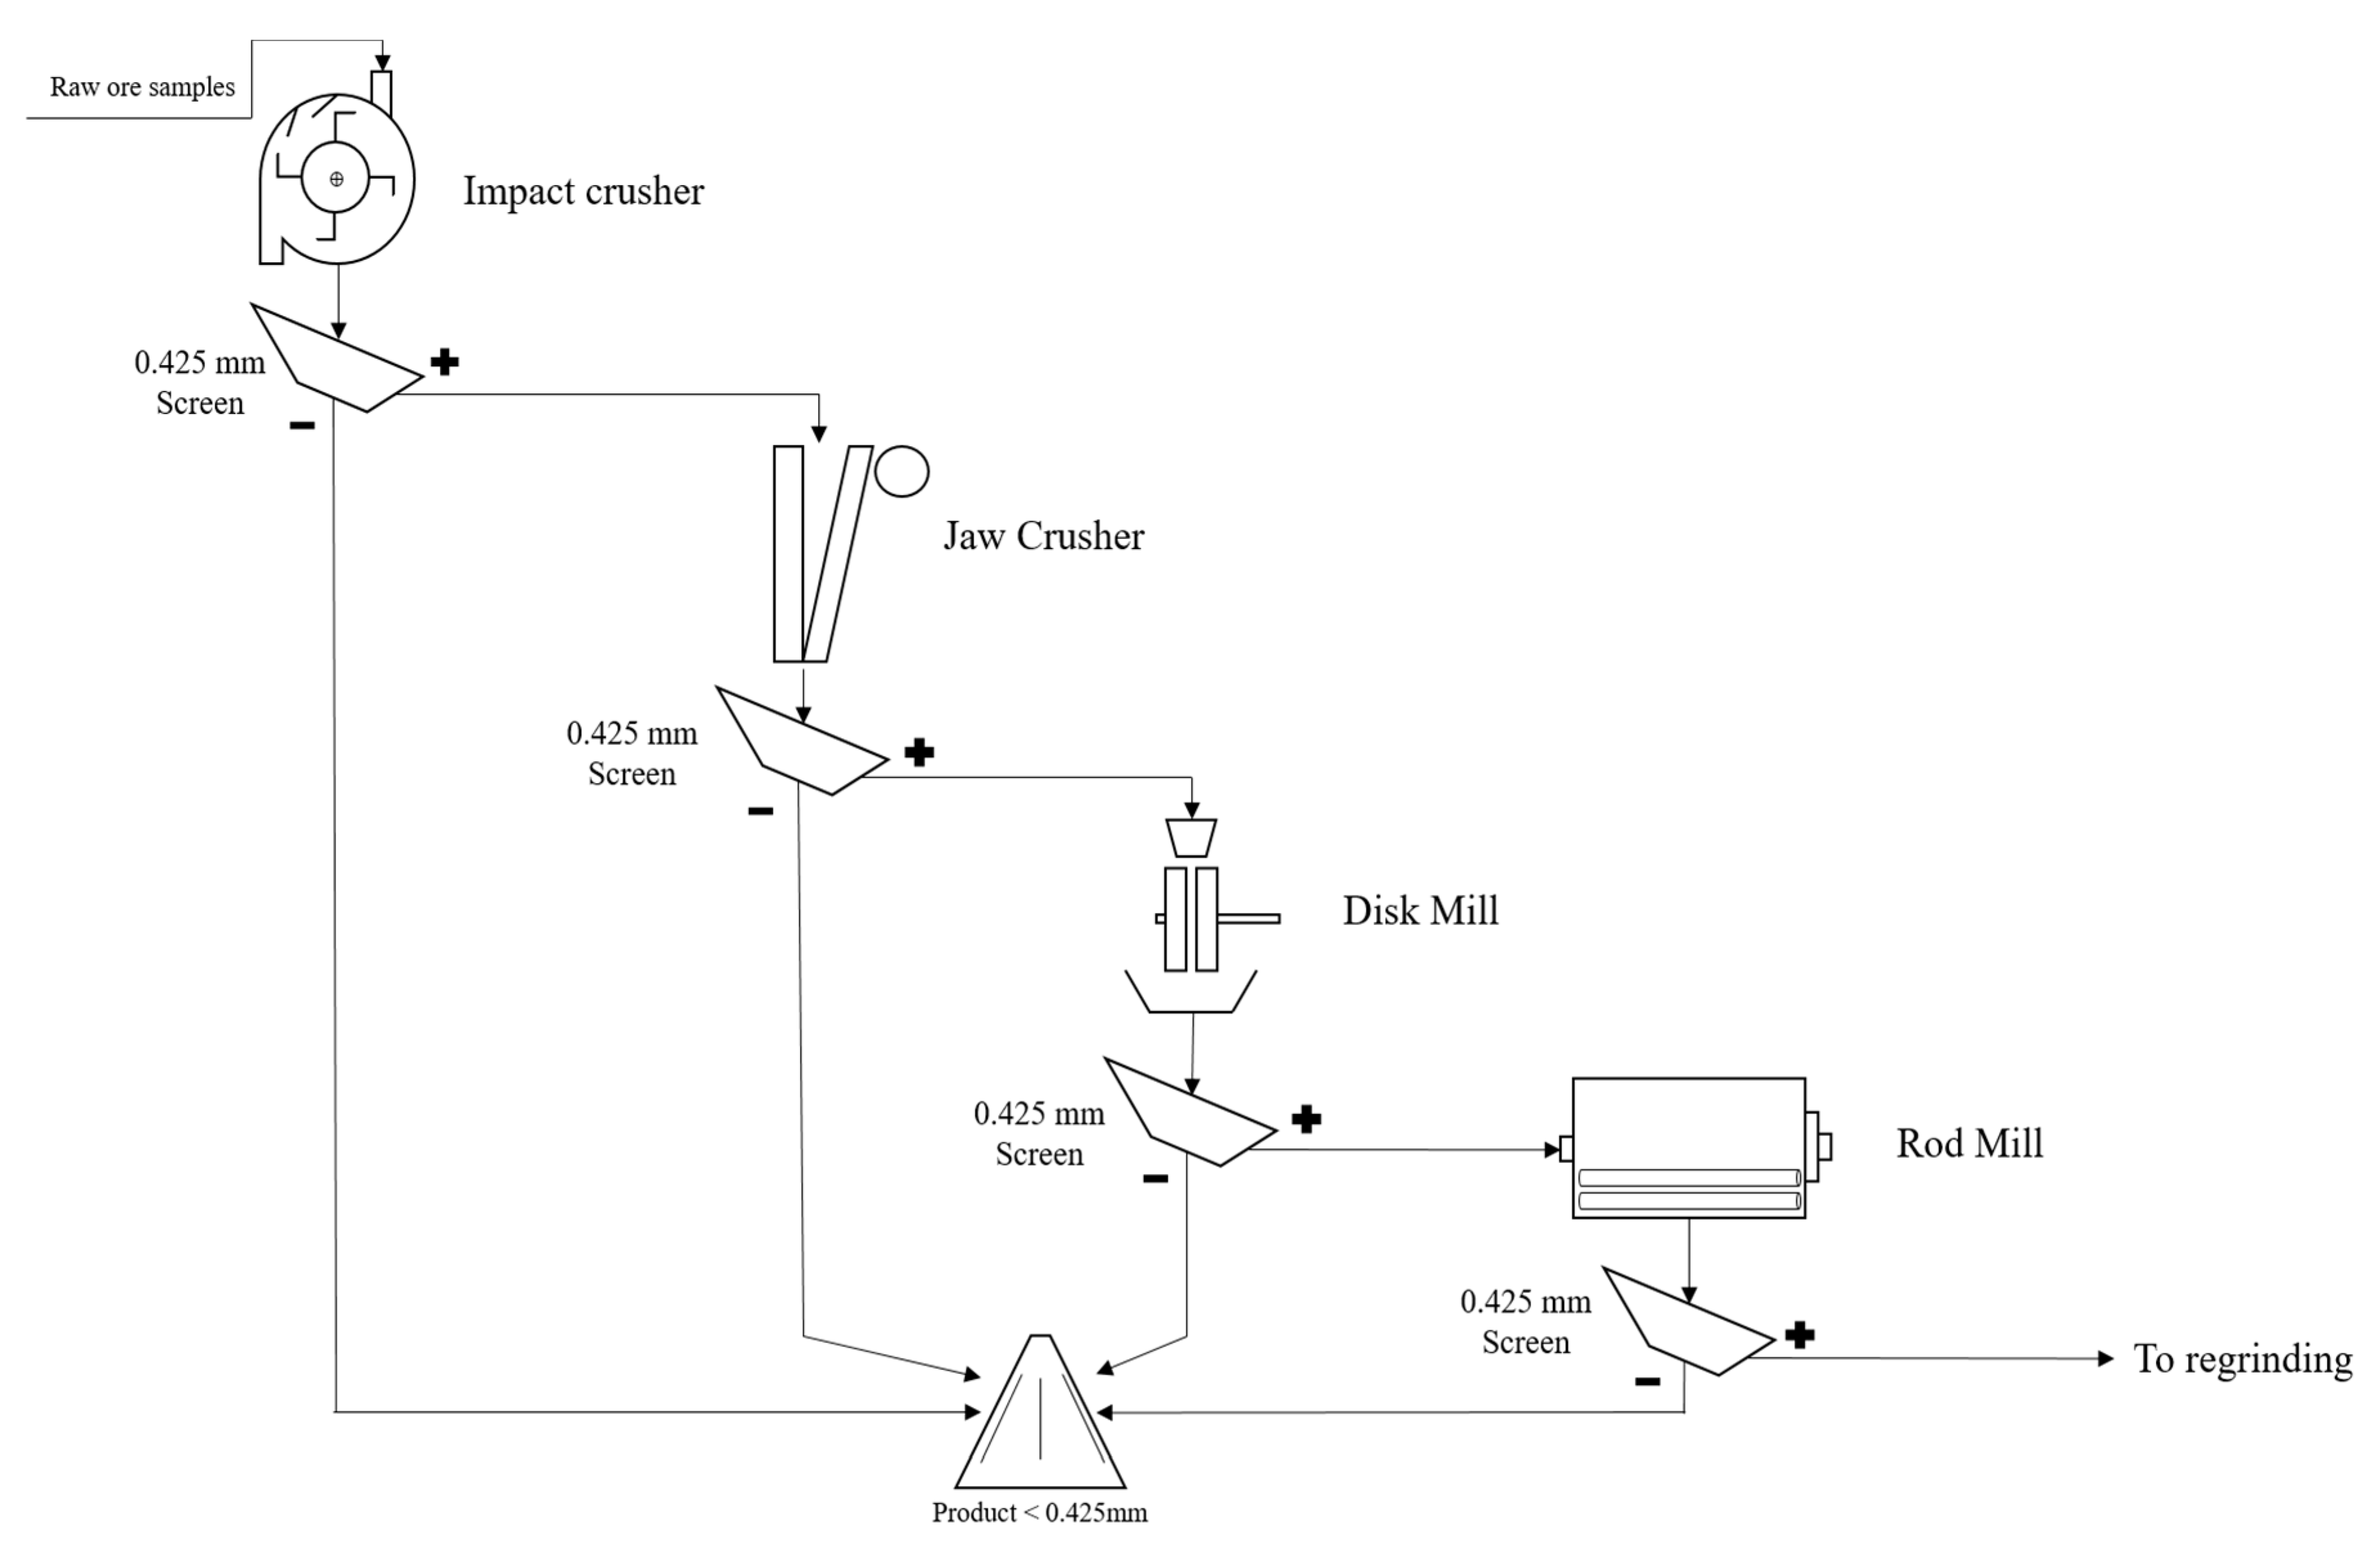
Figure 1 shows the comminution equipment arrangement that was selected in order to test the response in terms of the mineral distribution of the material. A preliminary crushing and grinding test on representative samples of the collected materials was performed. OM observations carried out on the preliminary test outputs showed that, generally, 85% of the grains was free below the 0.425 mm size. Consequently, each machine output was screened at 0.425 mm. At the end of the process, all passing 0.425-mm materials were collected as a composite product.
A Hazemag impact crusher was used as the first crushing stage. This machine has a four-lug bolt rotor, powered by an electrical motor. The running speed was 500 rpm, and the gap width between the bolts and impact elements was set at 10 mm. The feeding hopper has 120 × 120 mm aperture, limiting the maximum input material dimension to 50 mm.
A Magutt-10 jaw crusher was used for the second crushing step. It is powered by a 0.75-kW electric engine at 250 rpm. The selected closed-side setting (CSS) was 5 mm, with an open-side setting (OSS) of 15 mm. Feeding hopper is 120 × 60 mm, limiting input material dimension to d <40 mm.
A S.I.M.A. Milano disk mill was used as the first grinding stage. The disk gap selected was 2 mm. Feeding hopper dimensions allow an input material dimension below 5 mm.
A lab-scale rod mill was used as the final stage of grinding. It is equipped with a 193-mm-diameter, 267-mm-long drum, containing nine steel rods with a diameter of 8 mm inside, powered by a 0.4-kW electrical engine. The drum was filled with 1 kg of material at a 30% v/v filling ratio. The grinding time was 4 min at 50 rpm rotation speed.
2.4. Sieve Analysis
Sizing of the material was performed using different combinations of sieves in dry and wet conditions, in order to know the size distribution of the equipment output materials. Dry sieving was selected for the general output materials resulting from each crushing and comminution machine. A portion of the materials was collected and screened by means of nested screens in decreasing sizes, from the top screen to 0.125–0.075 mm, and shaken for 3 min in the lab screen shaker.
Wet sieving was selected for the grain size distribution definition of the composite comminution product passing 0.425 mm. The sieve sequence consisted of 0.425, 0.355, 0.300, 0.25, 0.212, 0.180, 0.125, 0.090, and 0.063 mm. The materials were oven-dried before XRPD analysis.
3. Results
3.1. Optical Microscopy
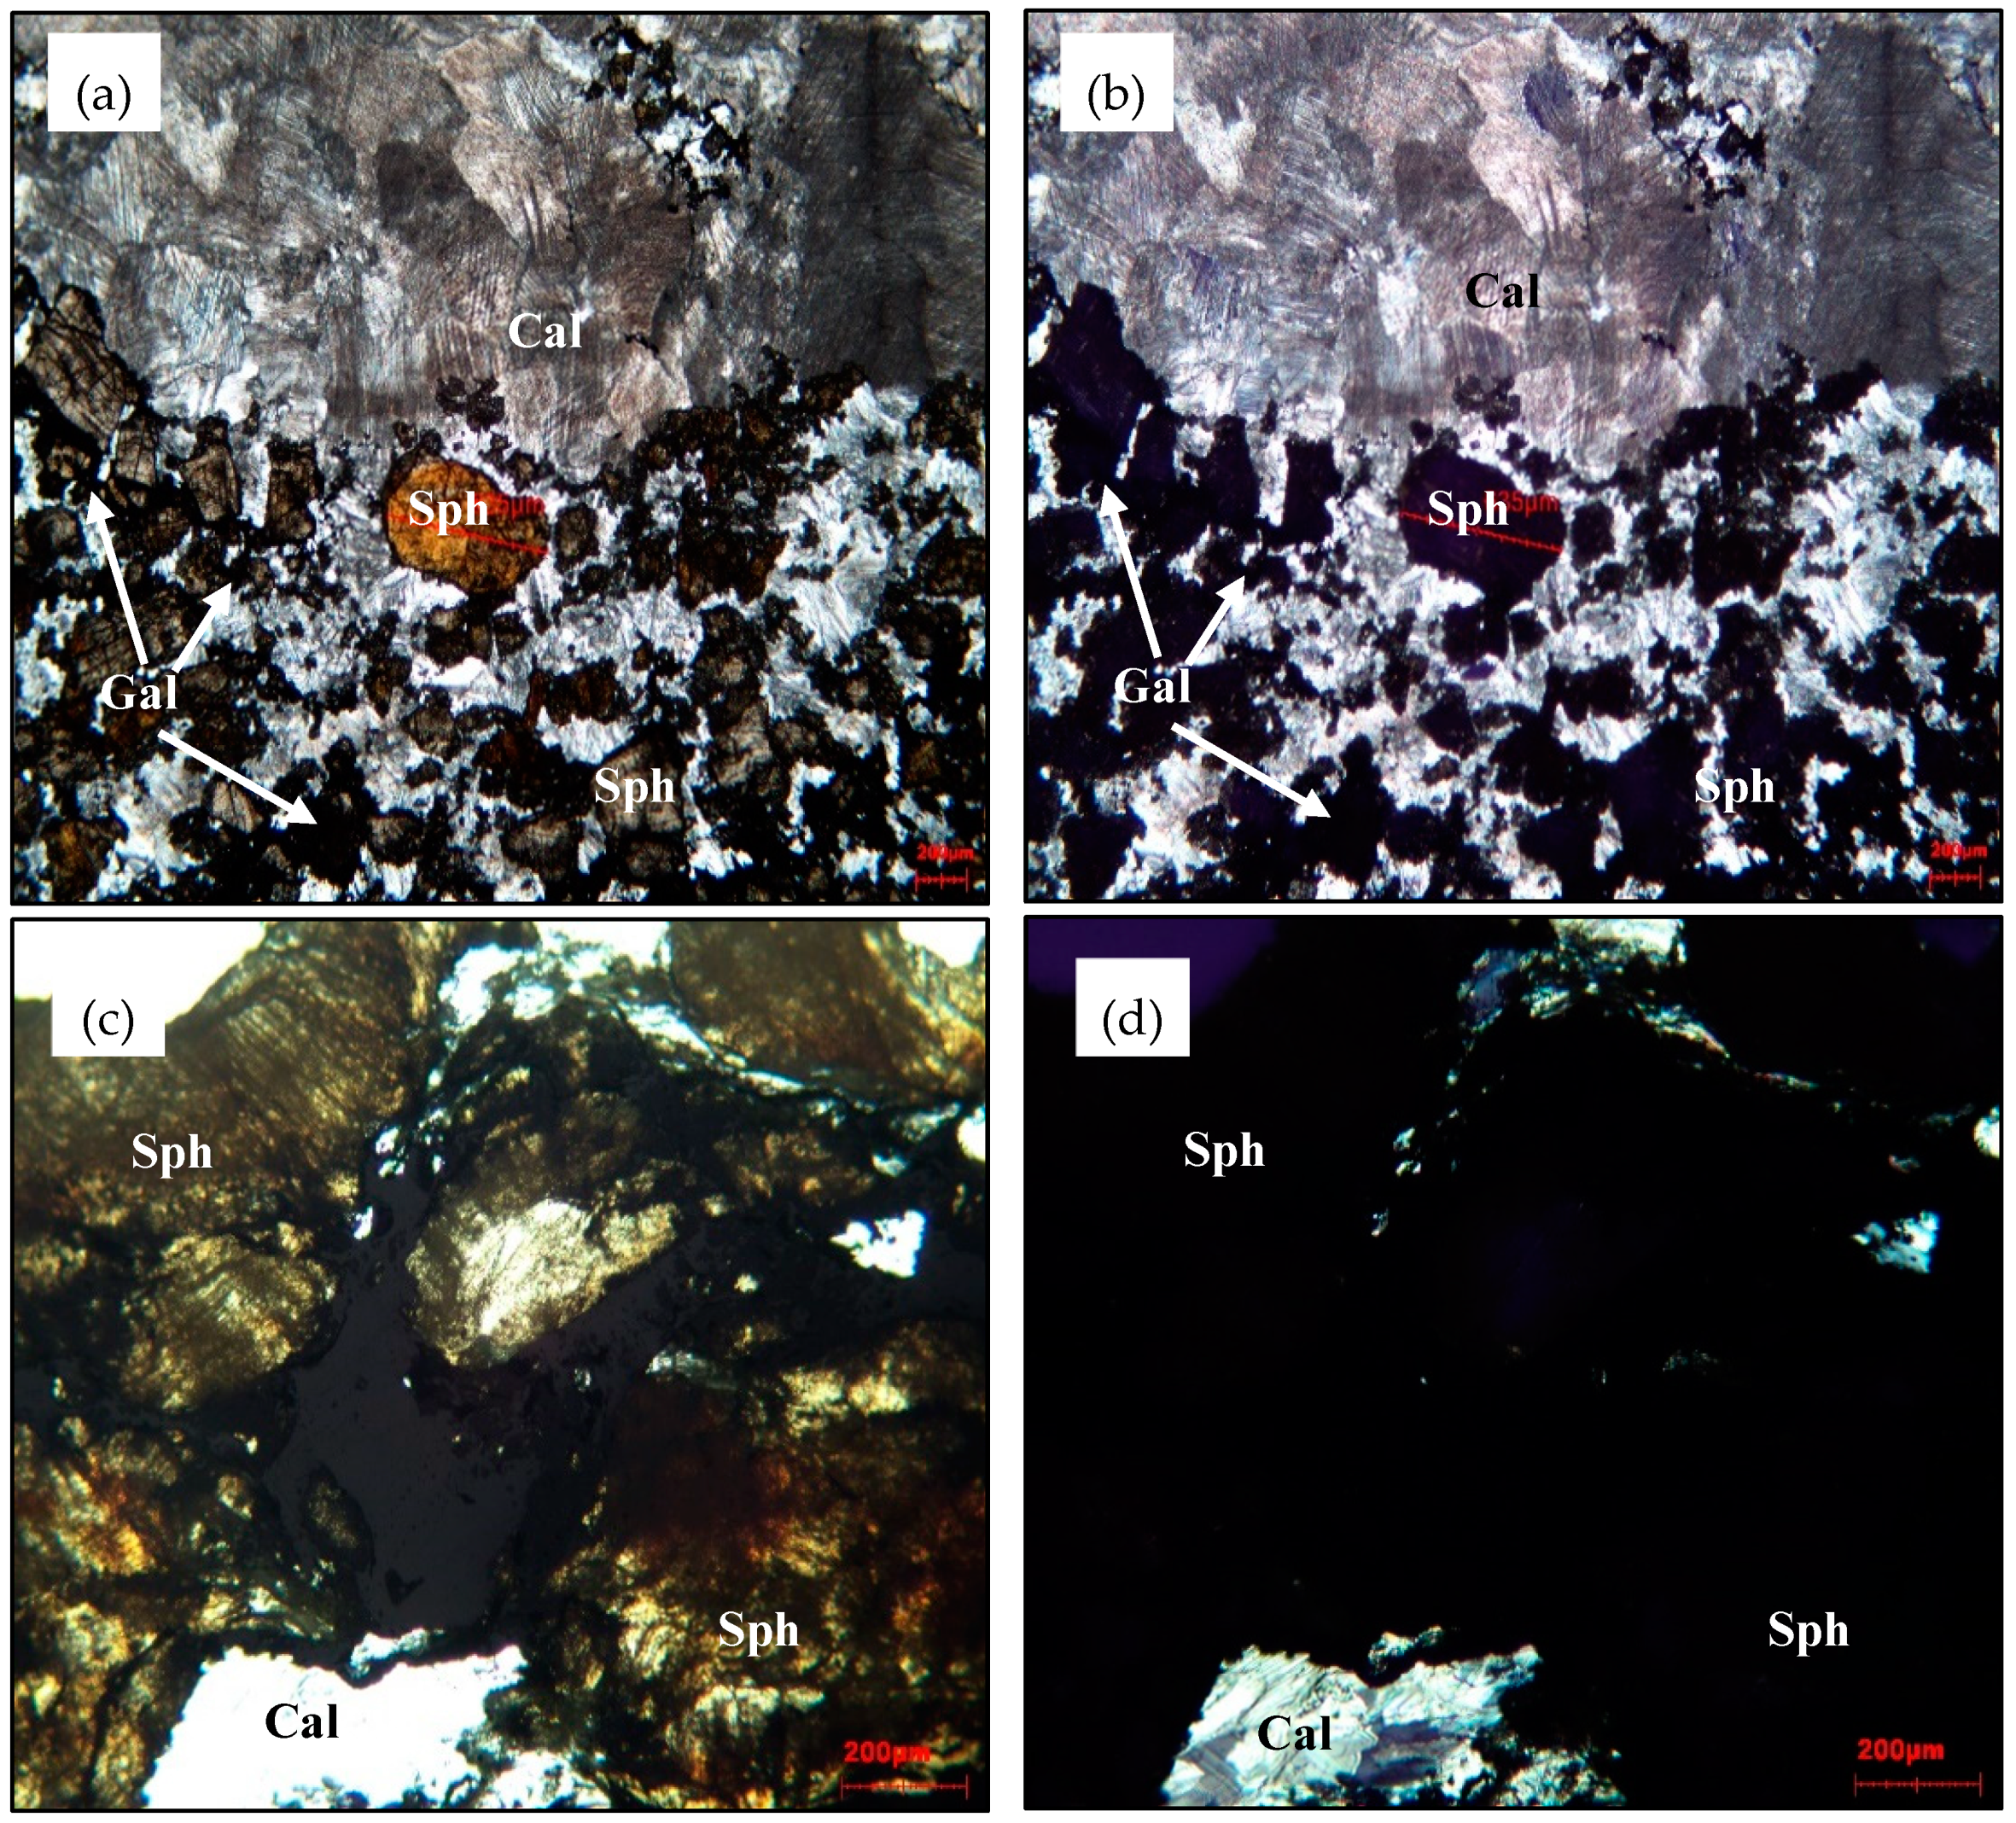
The observation of thin sections, shown in Figure 2, was carried out with OM in parallel transmitted light (PL) and cross-polarized transmitted light (XPL), with objectives between 4× and 10×. There was an abundant presence of sphalerite minerals surrounded by a calcite matrix. Light-opaque mineralization, such as galena and its altered compounds, were found. It was possible to spot some opaque veins filled with black organic material.
Sphalerite grains were massively present in the samples, showing a yellow-brownish and black coloration transparent in PL and opaque in XPL. Calcite appeared as a white and striated matrix, transparent both in PL and XPL. Opaque minerals, like galena and cerussite, were sparse and usually occurred in the surroundings of sphalerite grains.
Coarser sphalerite grain sizes, ranging in average between 0.400 and 0.425 mm, were defined using digital measurements from the OM images.
3.2. Scanning Electron Microscopy
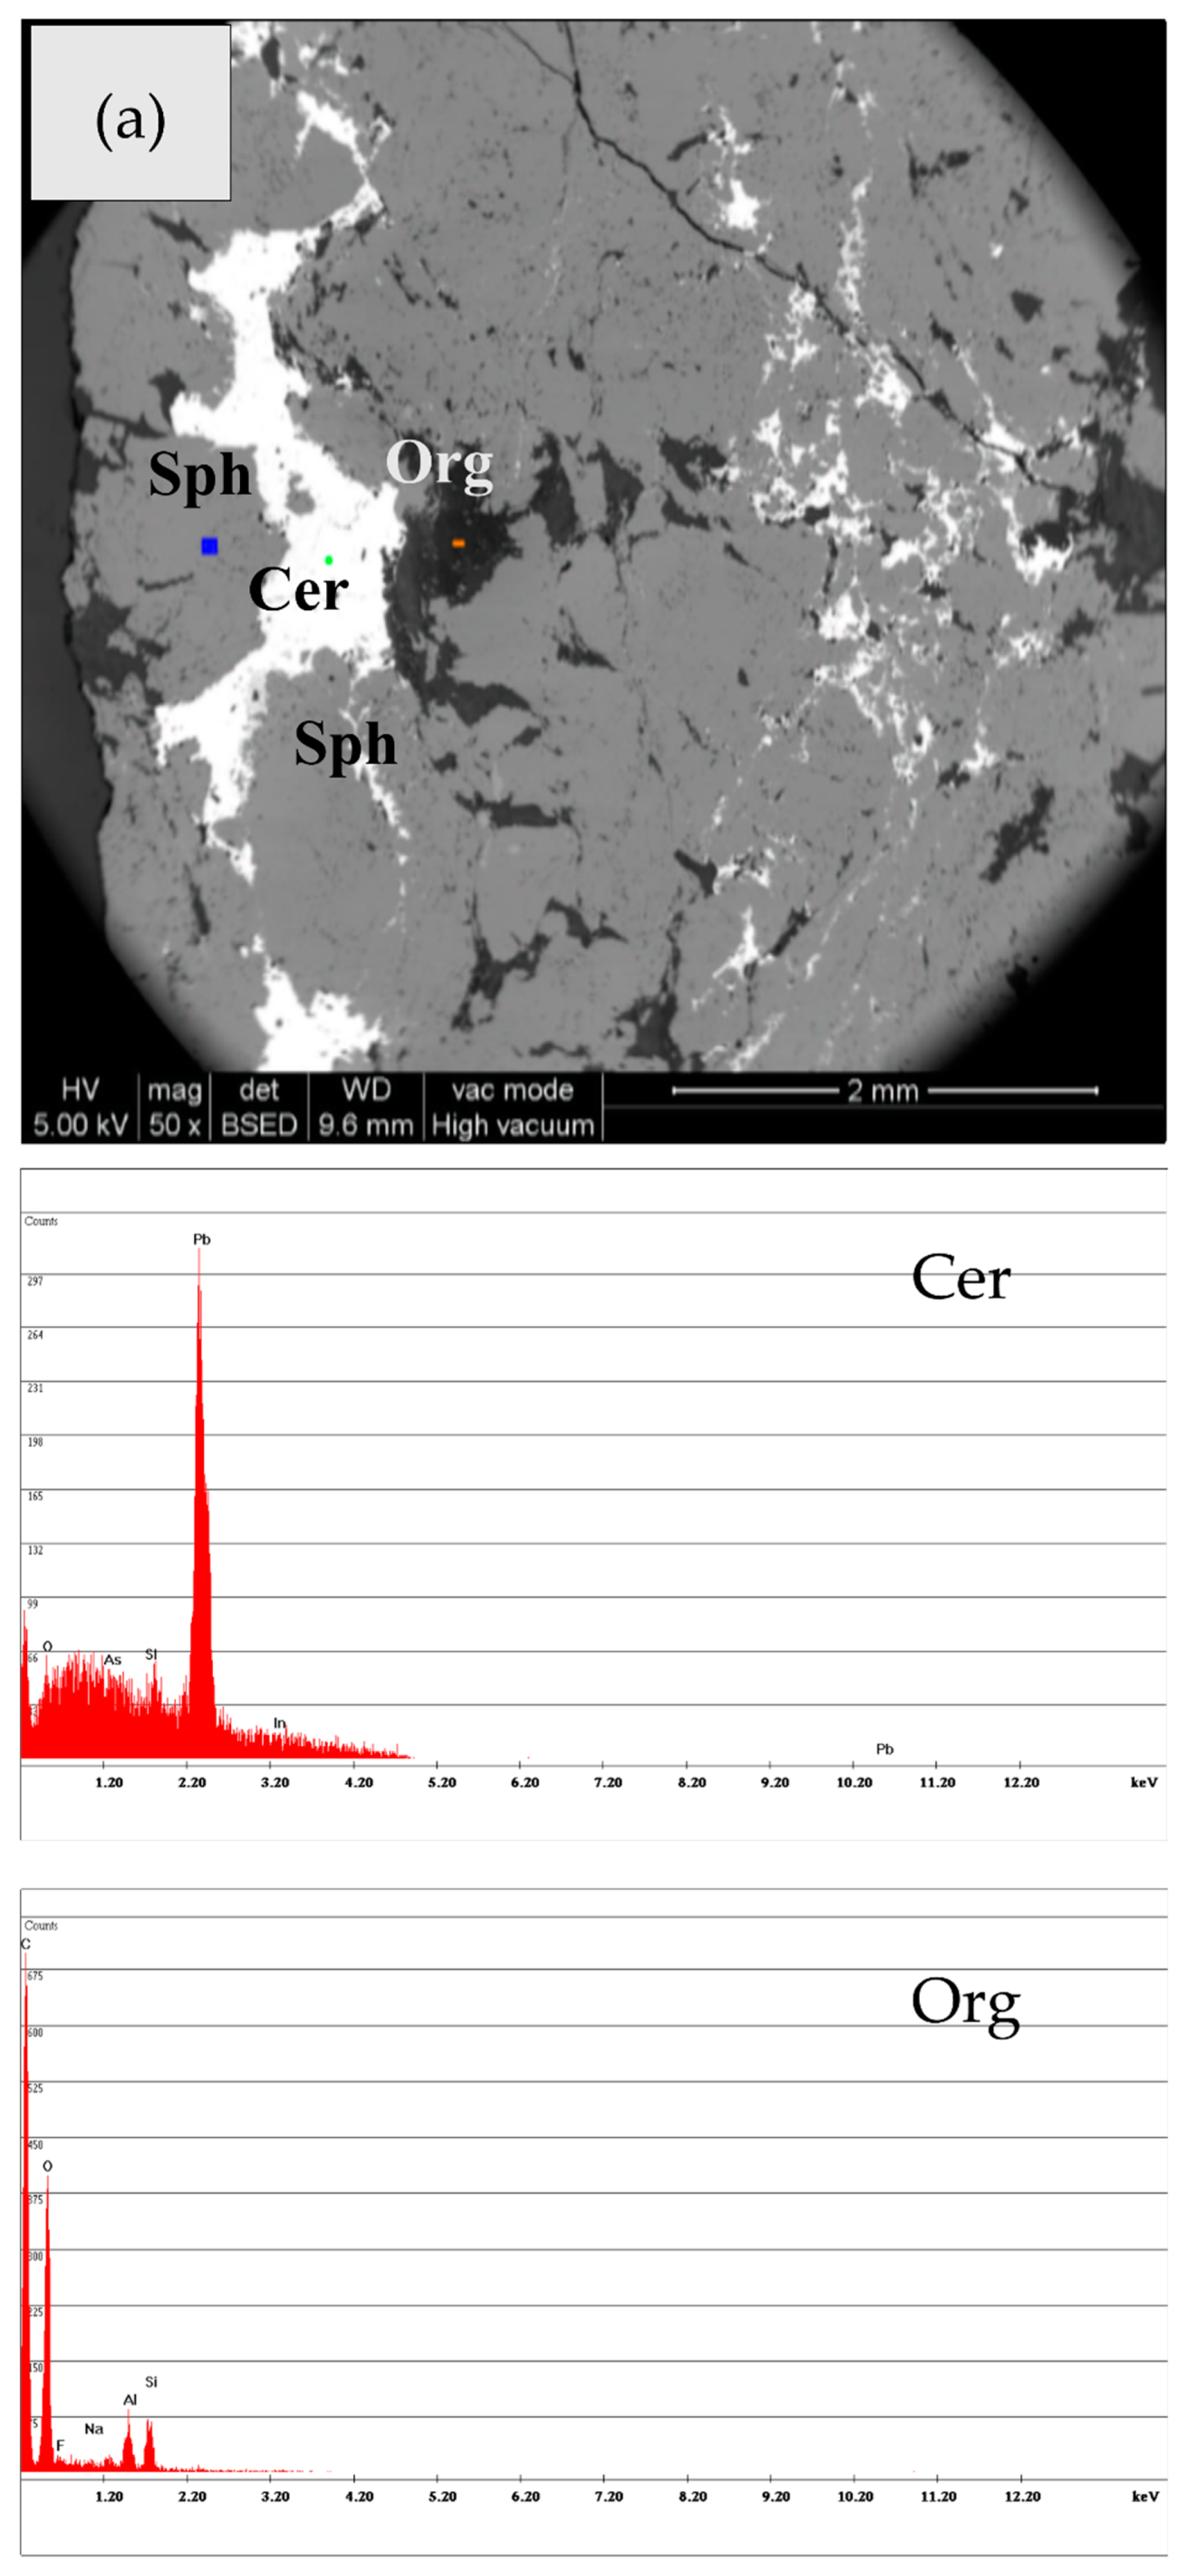
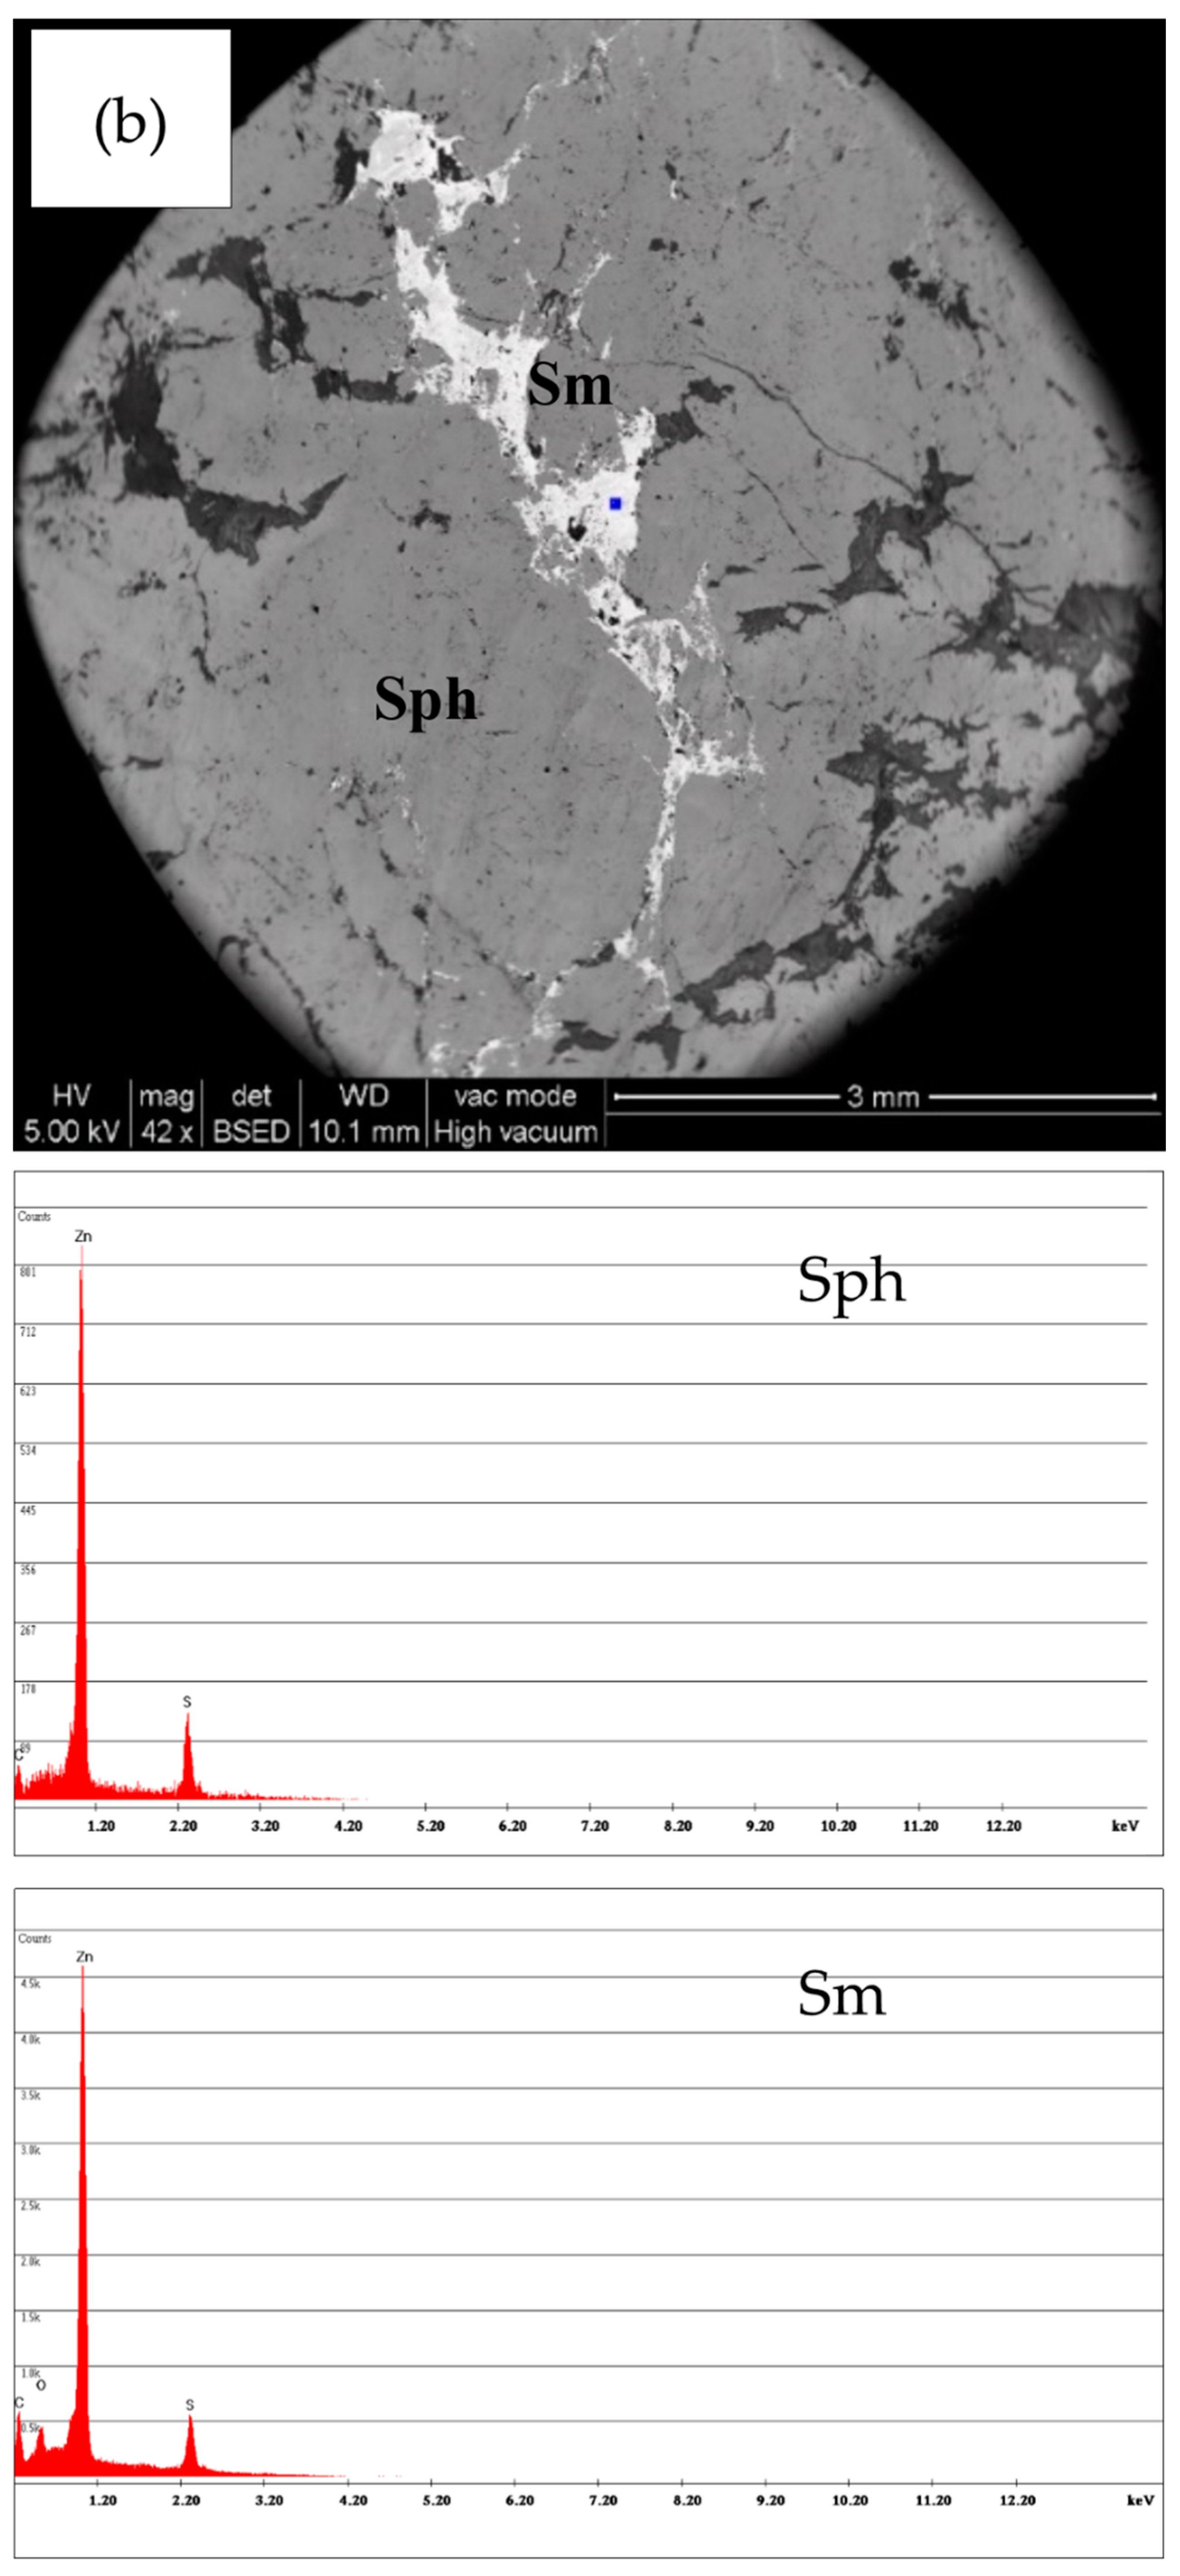
In order to have elemental information related to the mineralization nature, SEM punctual analyses were performed. The investigation targeted those areas difficult to characterize by OM and the intergranular filled voids present. Figure 3 represents the SEM analysis on uncovered rock slices, which was performed in order to confirm the OM outcomes and the total number of mineral phases present in the sample before XRPD analyses.
SEM images and Energy Dispersive Spectroscopy (EDS) spectra, shown in Figure 3, confirmed a widespread presence of sphalerite [25] in the calcite [26] matrix and highlighted the presence of Zn and Pb alteration compounds, mainly cerussite [27], anglesite [28], and smithsonite [29]. The presence of organic matter in the microfractures was detected [30].
3.3. Crushing and Grinding
In the arranged comminution and grinding scheme, samples entered with maximum size of 50 mm and they were reduced to millimetric and sub-millimetric grains. According to first equipment feeding hopper specifications, a preliminary manual size reduction has been performed with a 5-kg hammer. The purpose of this test was to bring most of the material below 0.425 mm, limiting the size fractions that could negatively affect an eventual flotation separation [31,32,33,34]. The process can be divided into two stages:
- crushing using the impact crusher and jaw crusher and
- grinding using a disk mill and rod mill.
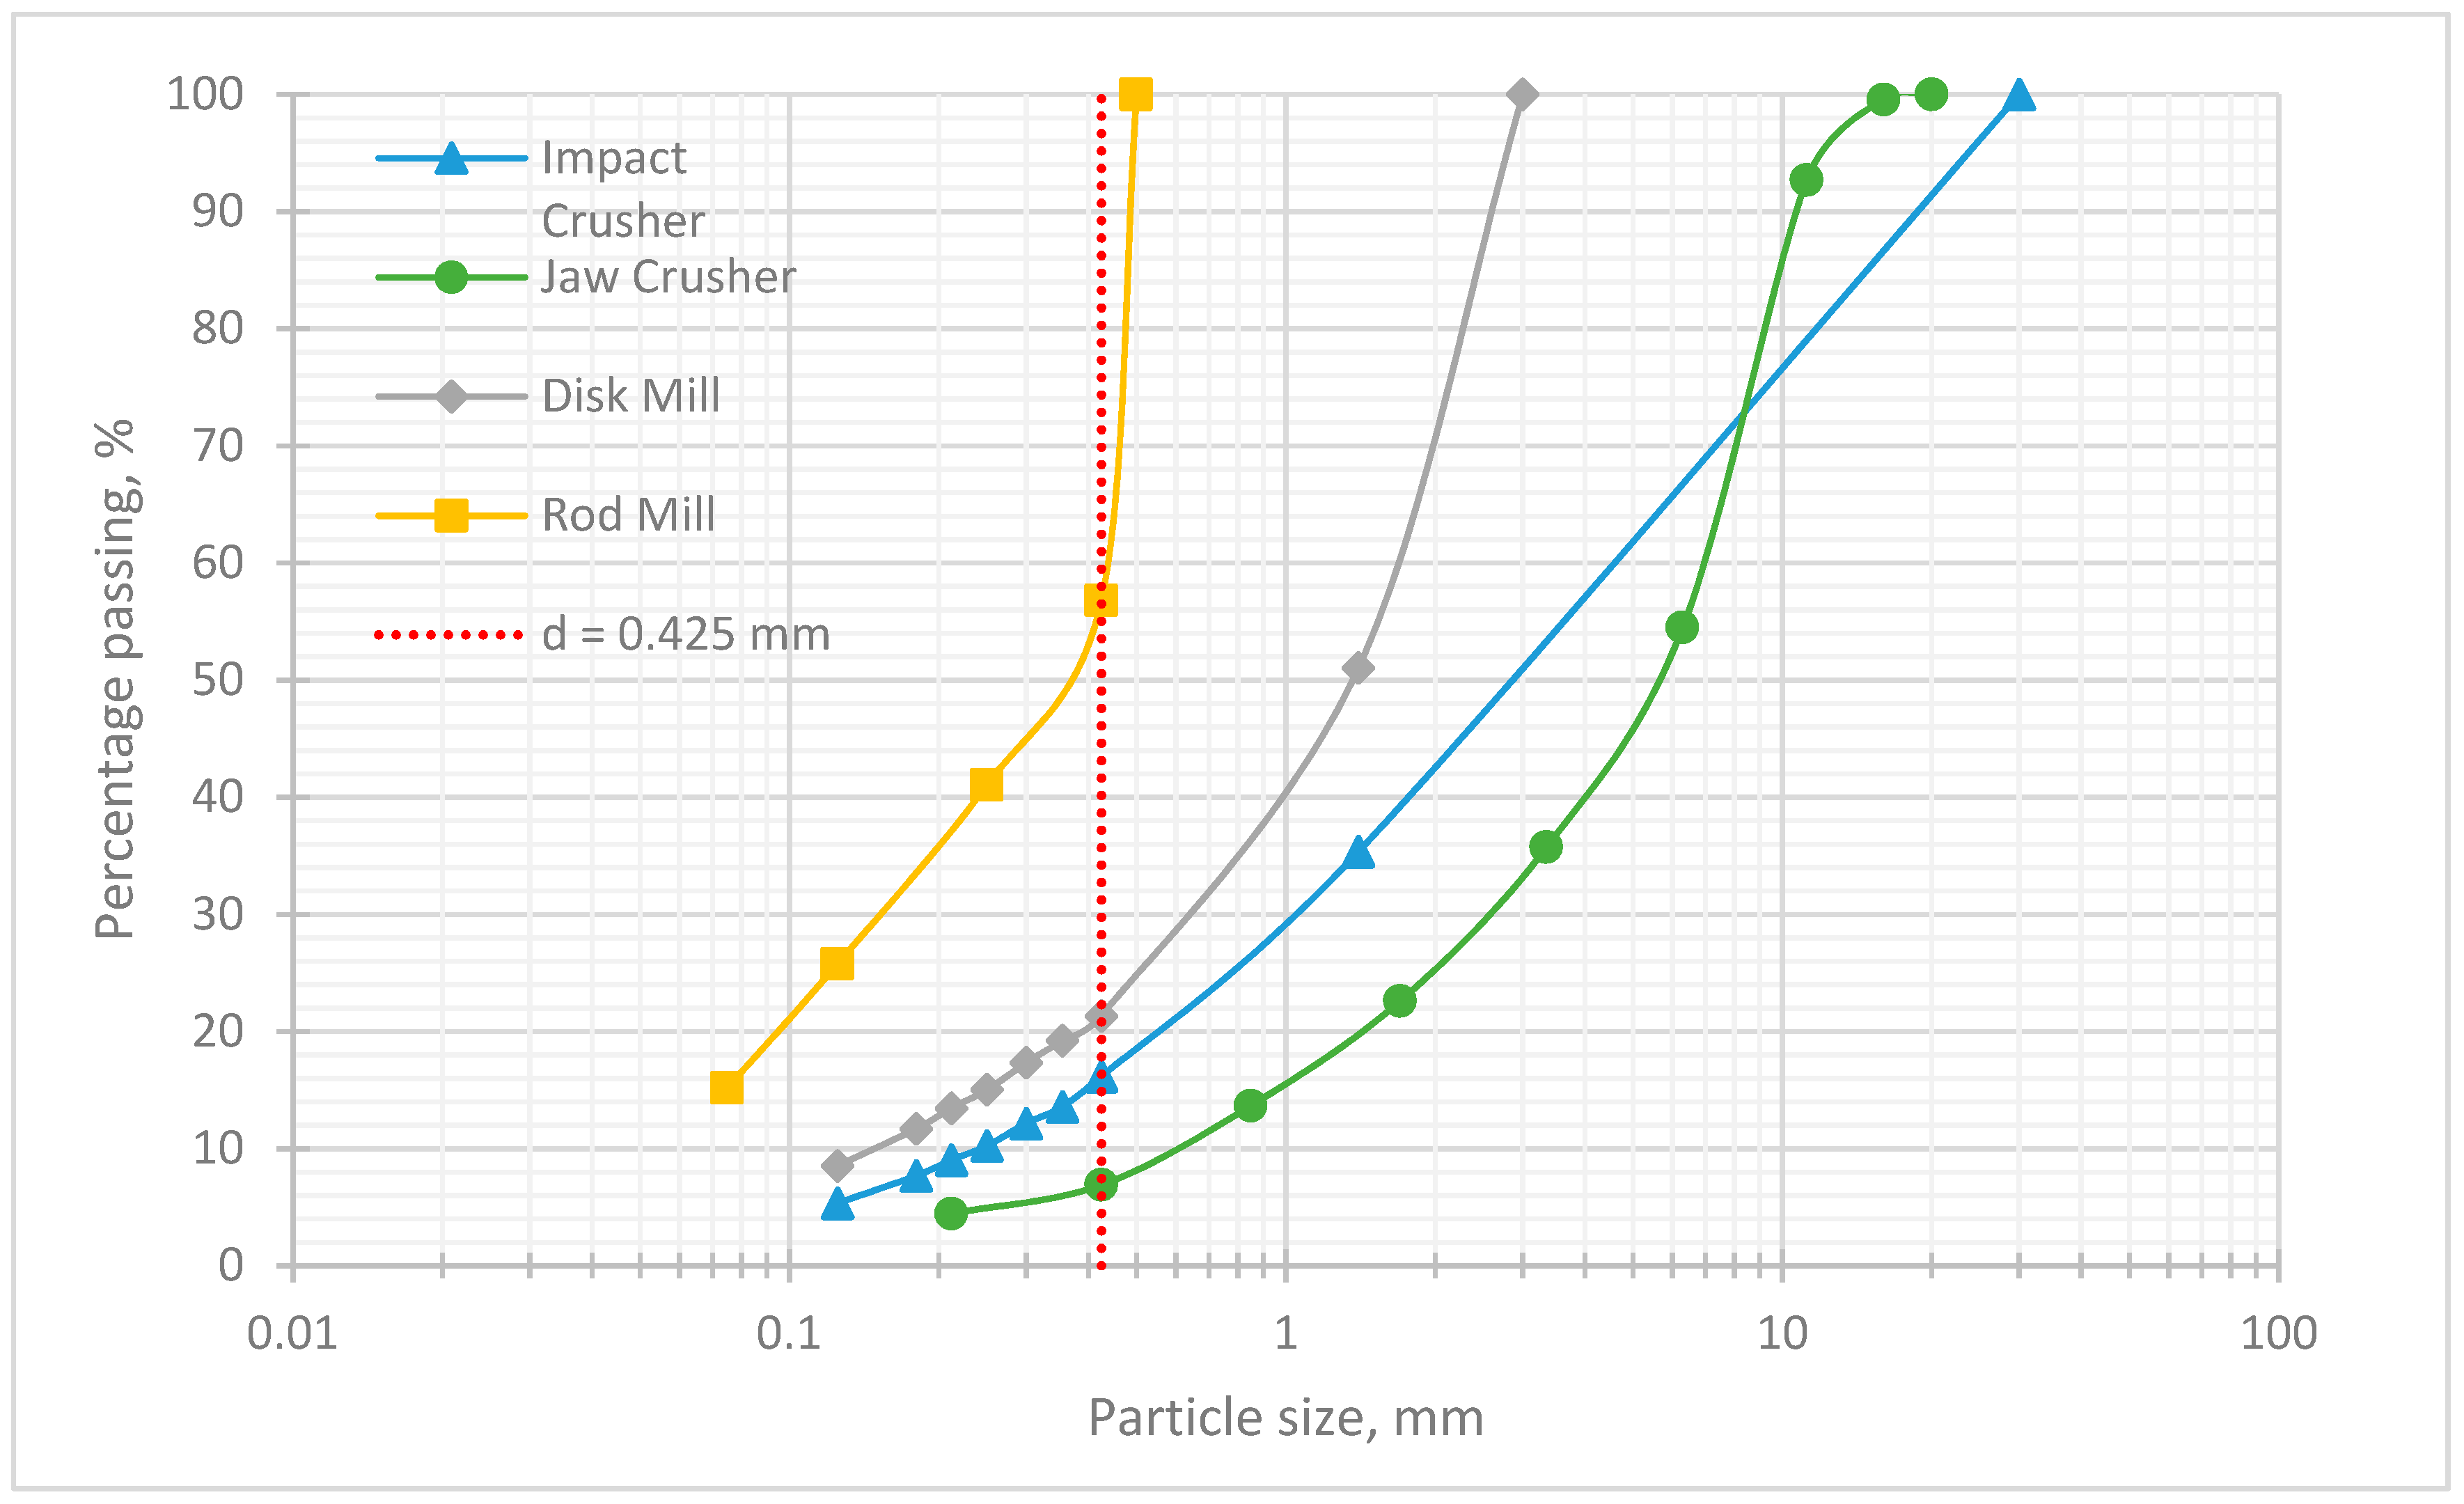
The particle size distribution of the broken products from each comminution was analyzed. Granulometric curves for the output materials are shown in Figure 4.
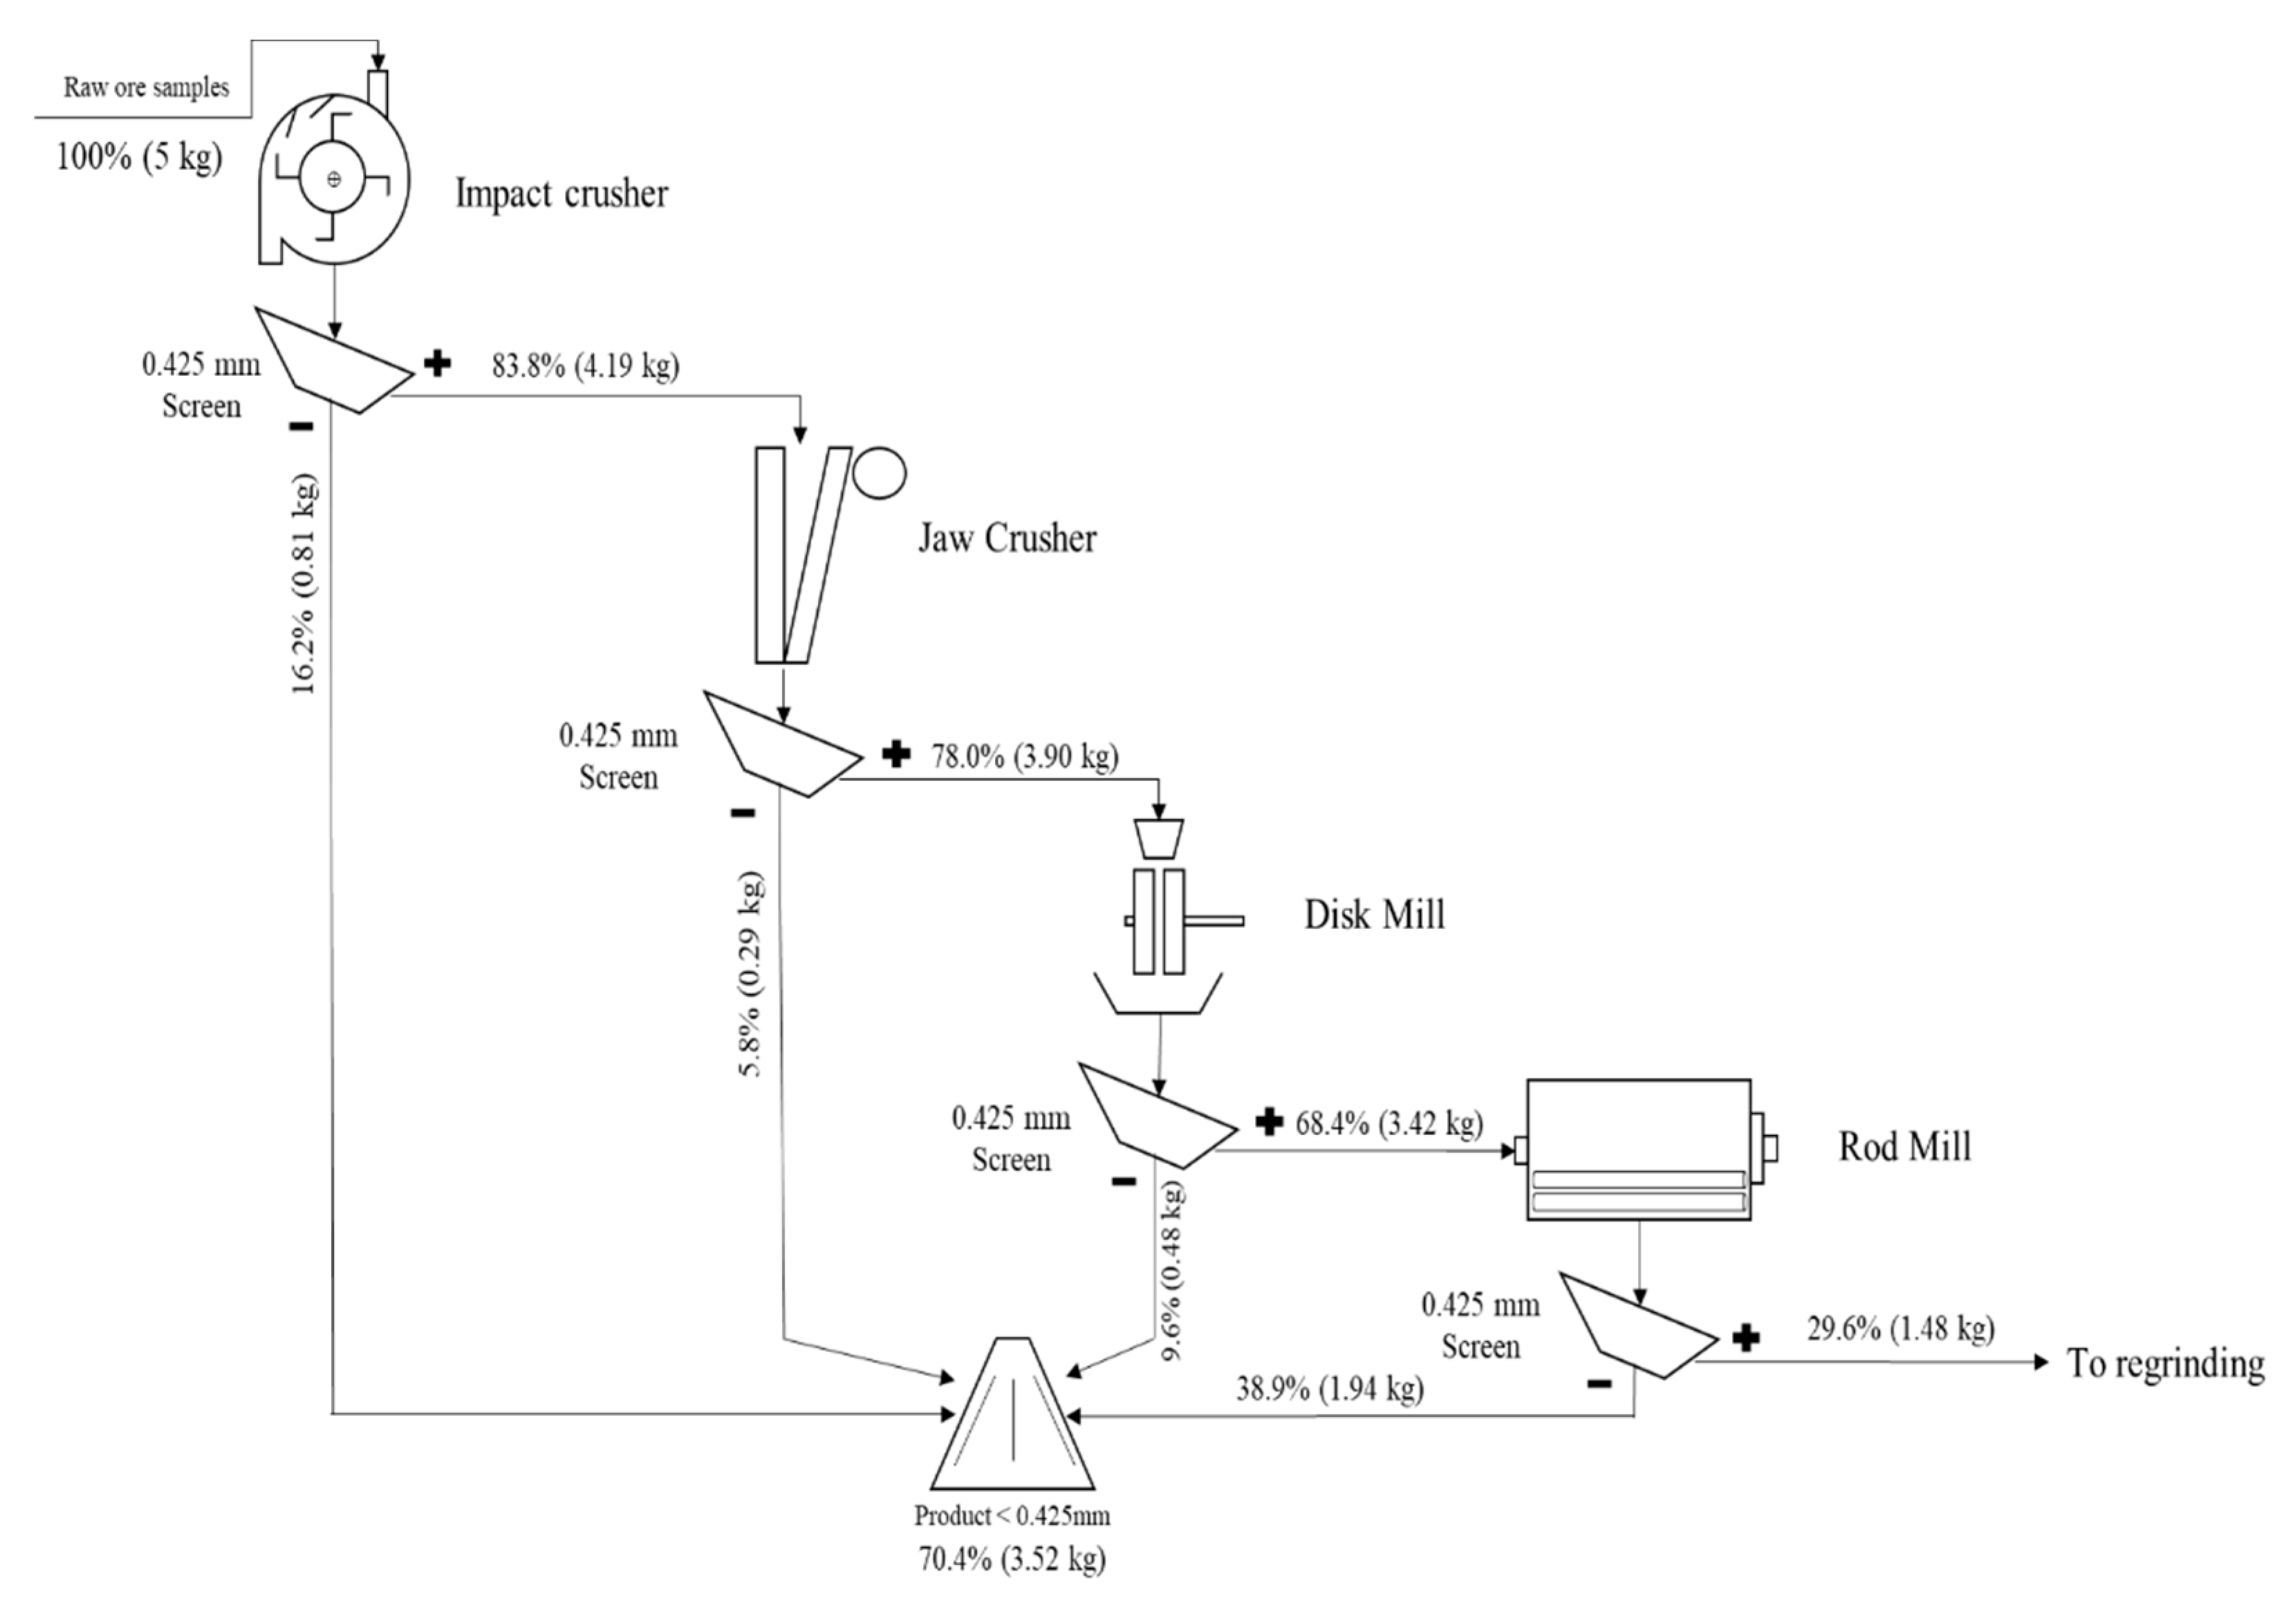
A mass balance, assuming negligible losses, for 5 kg of materials resulting from crushing and grinding is plotted in Figure 5. The impact crusher, selected as the first stage of crushing, resulted in a dimension reduction with a contained fine production <0.425 mm of 16.2 wt %. The jaw crusher, chosen for the second crushing stage, gave a lower production of fines. In fact, only 6.9 wt % of <0.425 mm was obtained. At the end of the crushing stage, the overall fraction having dimensions below a 0.425 mm-size was 22 wt % of the input materials, while the oversized materials sent to the grinding stages were 78 wt %.
For a further size reduction, a disk mill was selected as the first stage of grinding. It resulted in materials characterized by d50 > 1.4 mm, with the fraction of the fines (d < 0.425 mm) being 12.3 wt % The output material was homogeneously sized. Rod milling was selected for the final grinding stage. It was selected aiming at a drastic reduction of the material below the size of 0.425 mm. The results showed how four min of grinding time produced 56.8 wt % of undersized material. At the end of the secondary crushing test, material having d < 0.425 mm was 62.1 wt % of the feed material obtained by primary crushing.
Oversized material, accounting for about 30 wt % of the total output, was not reintroduced in any grinding stage. All the materials passing 0.42–5 mm screens were collected as a composite sample and further analyzed in terms of the granulometric distribution and XRPD.
3.4. Product Material < 0.425-mm Sizing
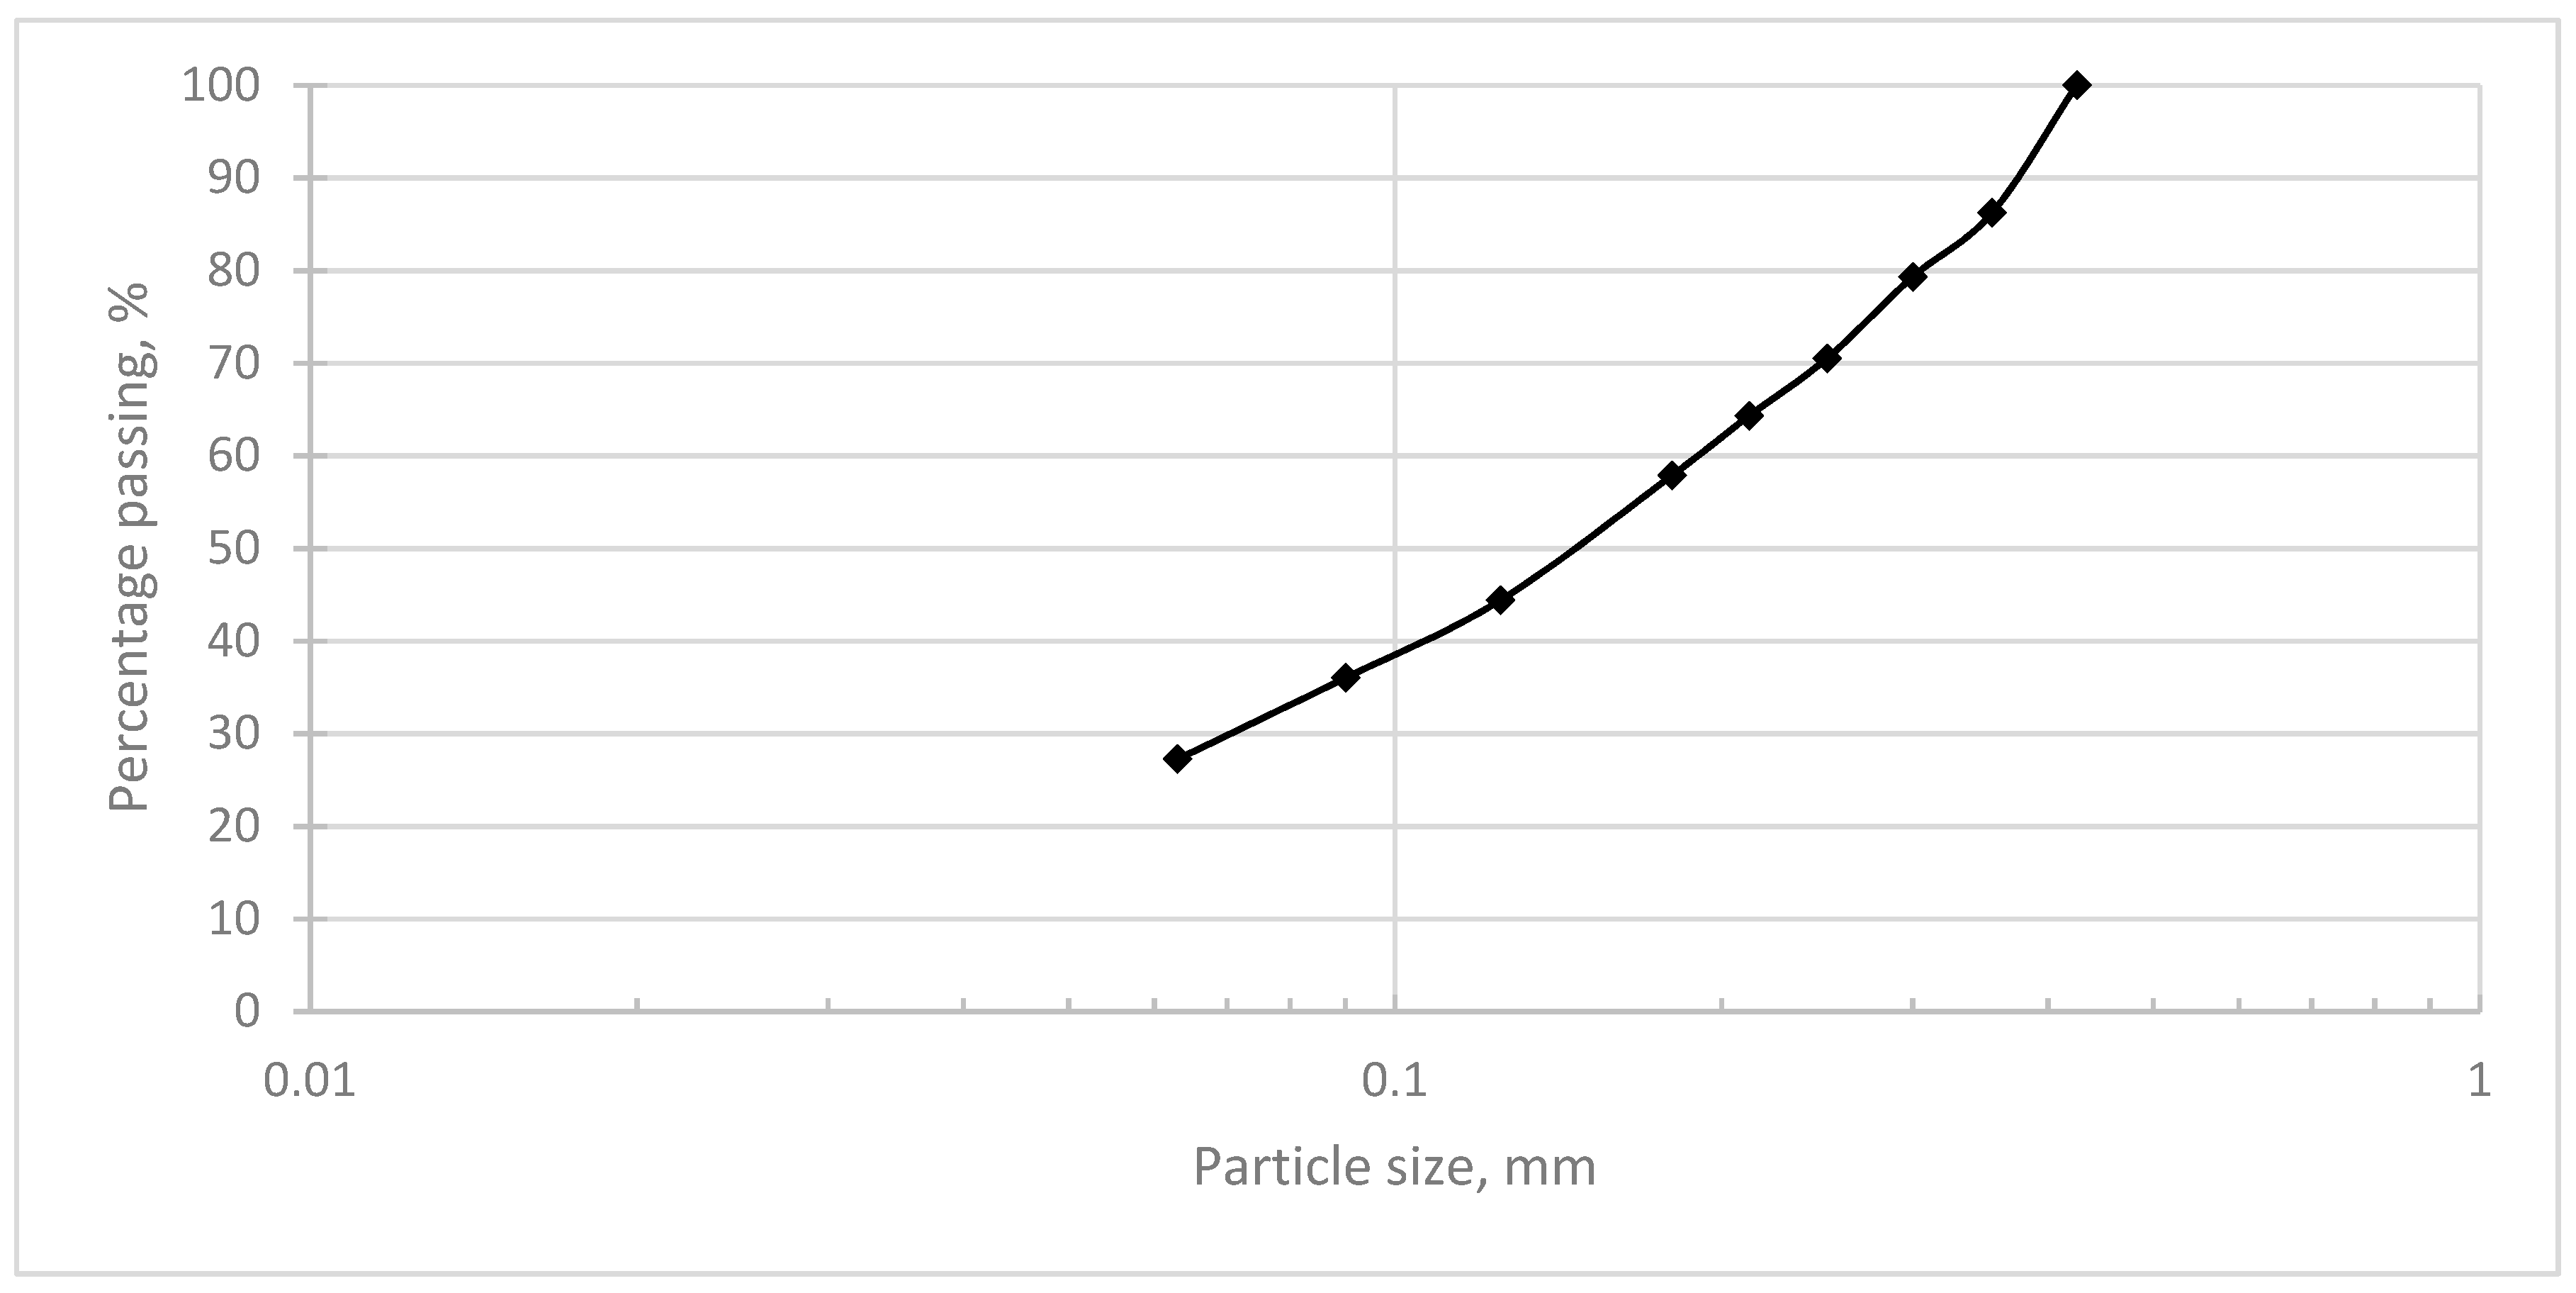
Comminution products passing the 0.425-mm threshold were more specifically analyzed in terms of granulometric distribution. This was necessary for the assessment of the ore behavior under different comminution forces aiming to deliver good quality material for further separation steps.
Wet sieving methodology was selected. Figure 6 shows the granulometric curve obtained resulting in values of d80 = 0.300 mm and d50 = 0.160 mm. These findings show that the presence of fine fractions (d < 0.063 mm) is relevant. In fact, material passing 0.063 mm accounted for 27.2 wt % of the total considered sample.
3.5. X-Ray Powder Diffraction Analyses
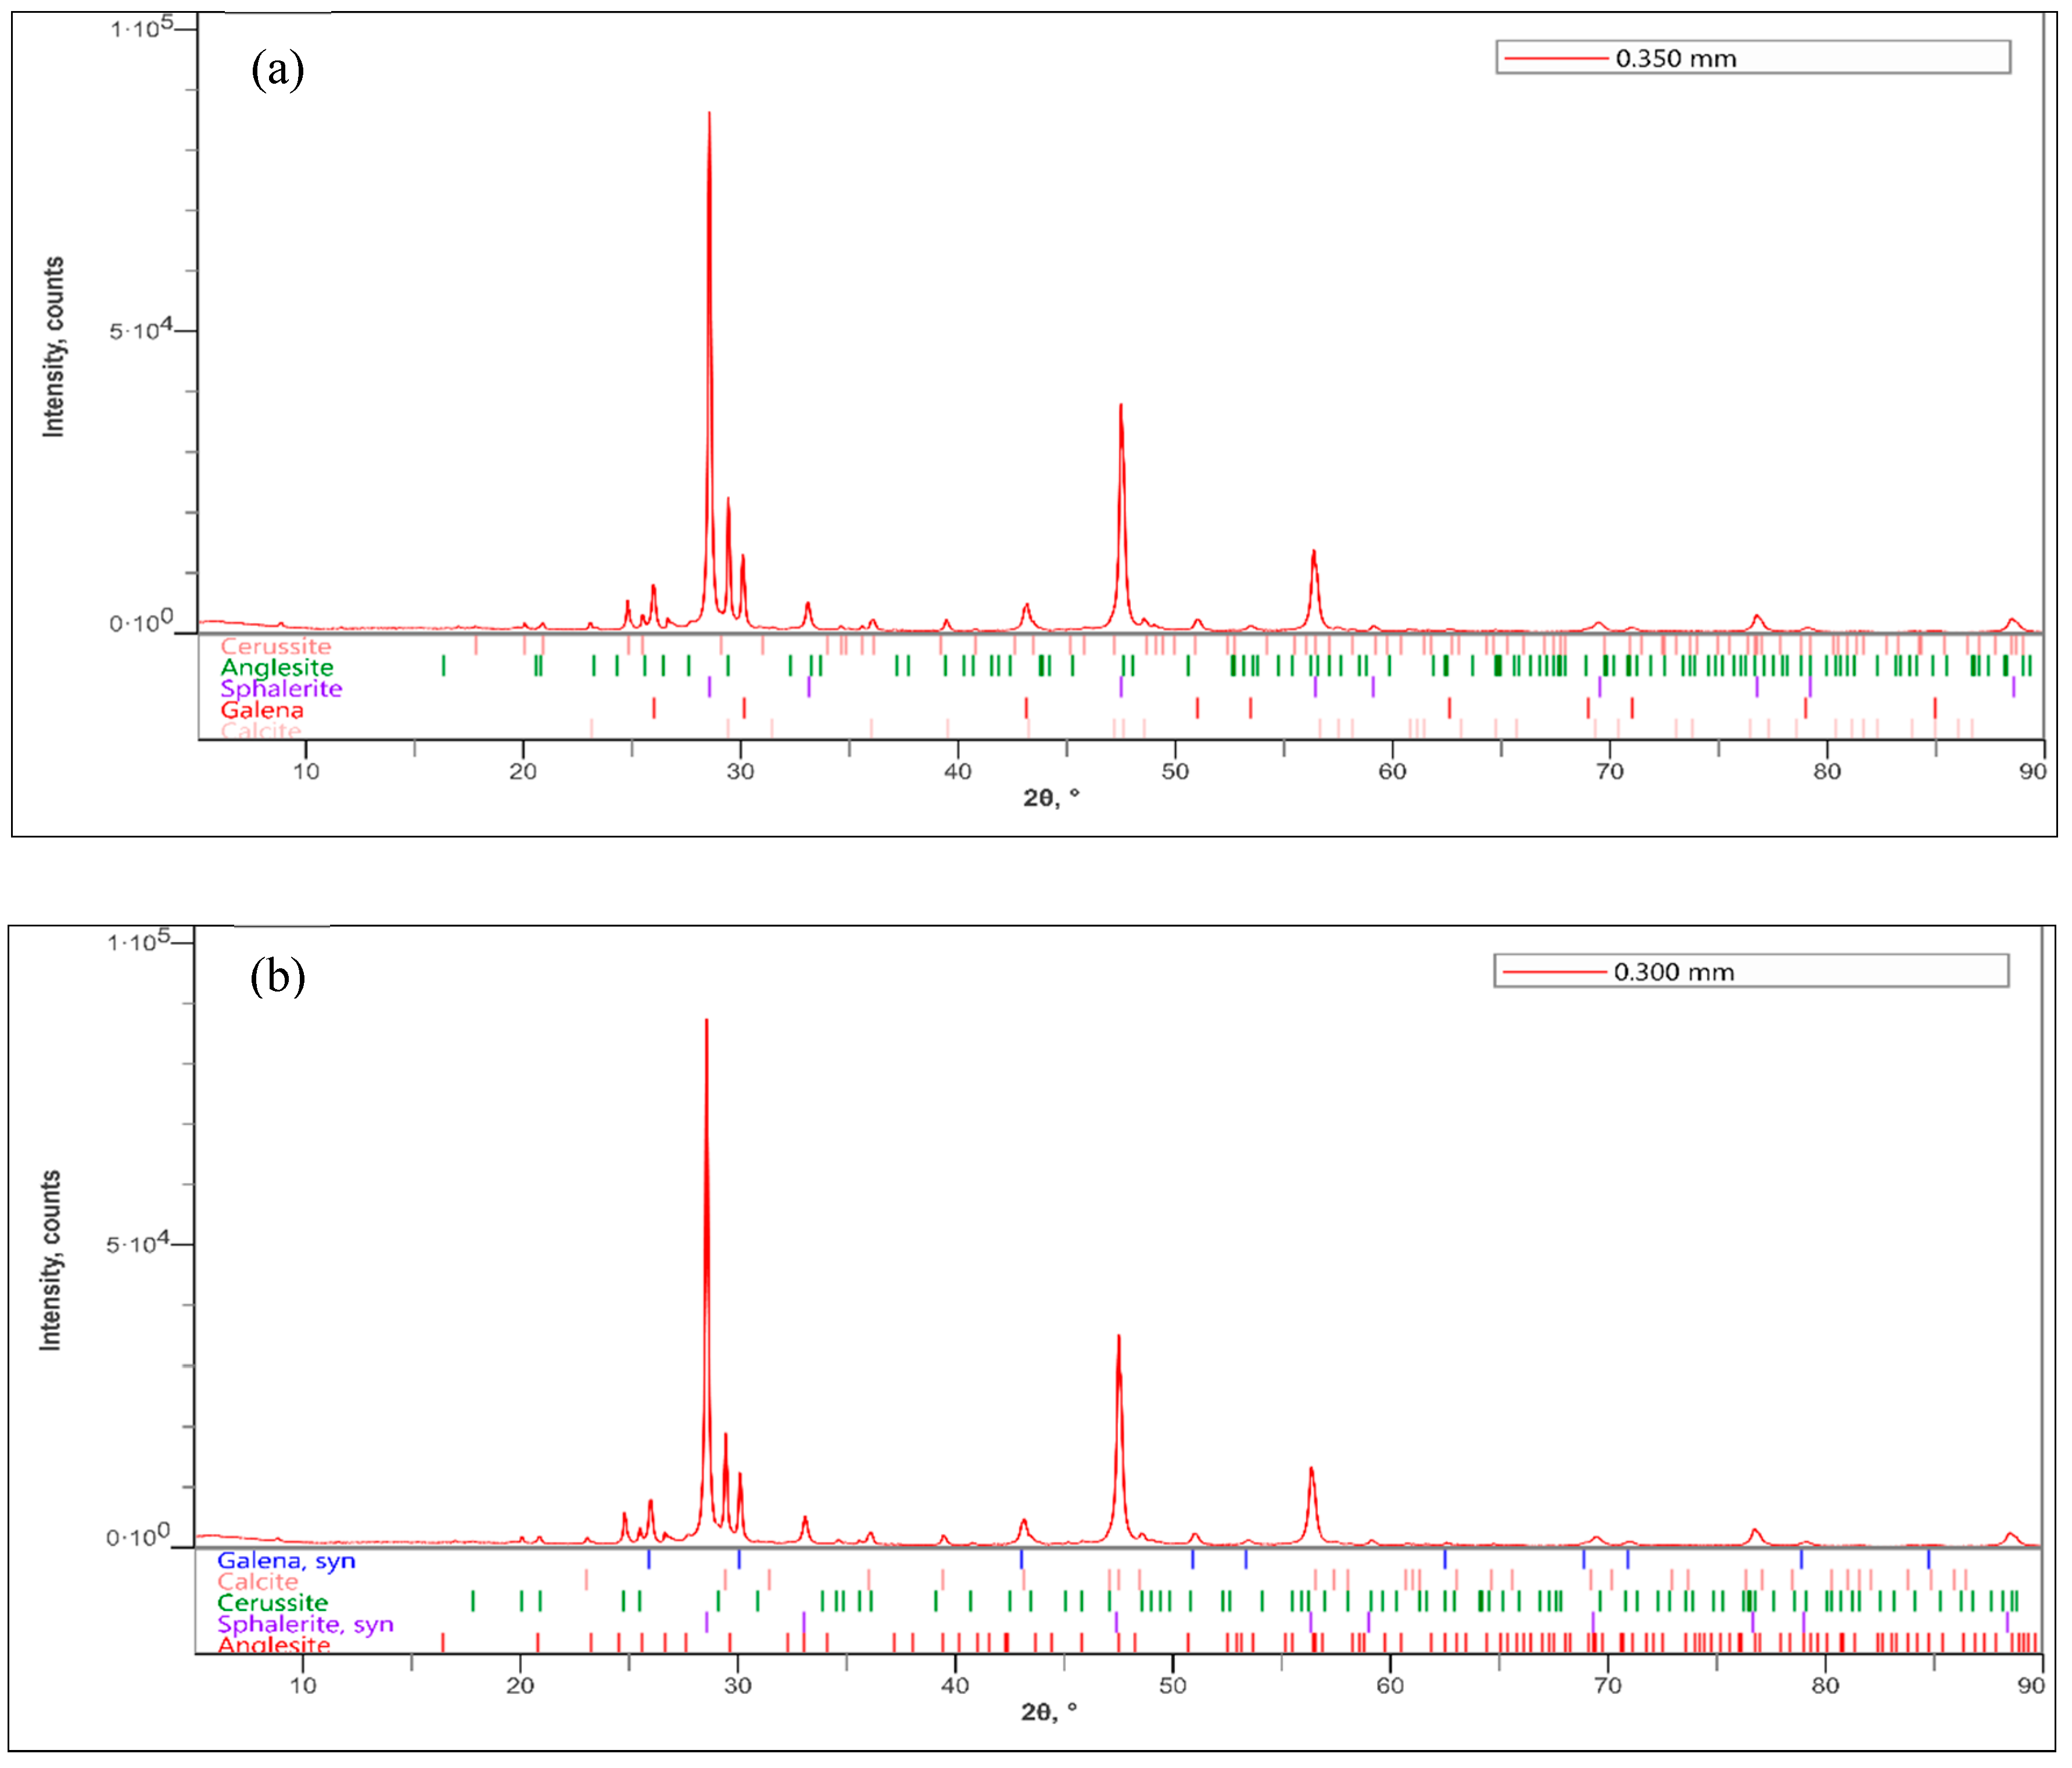
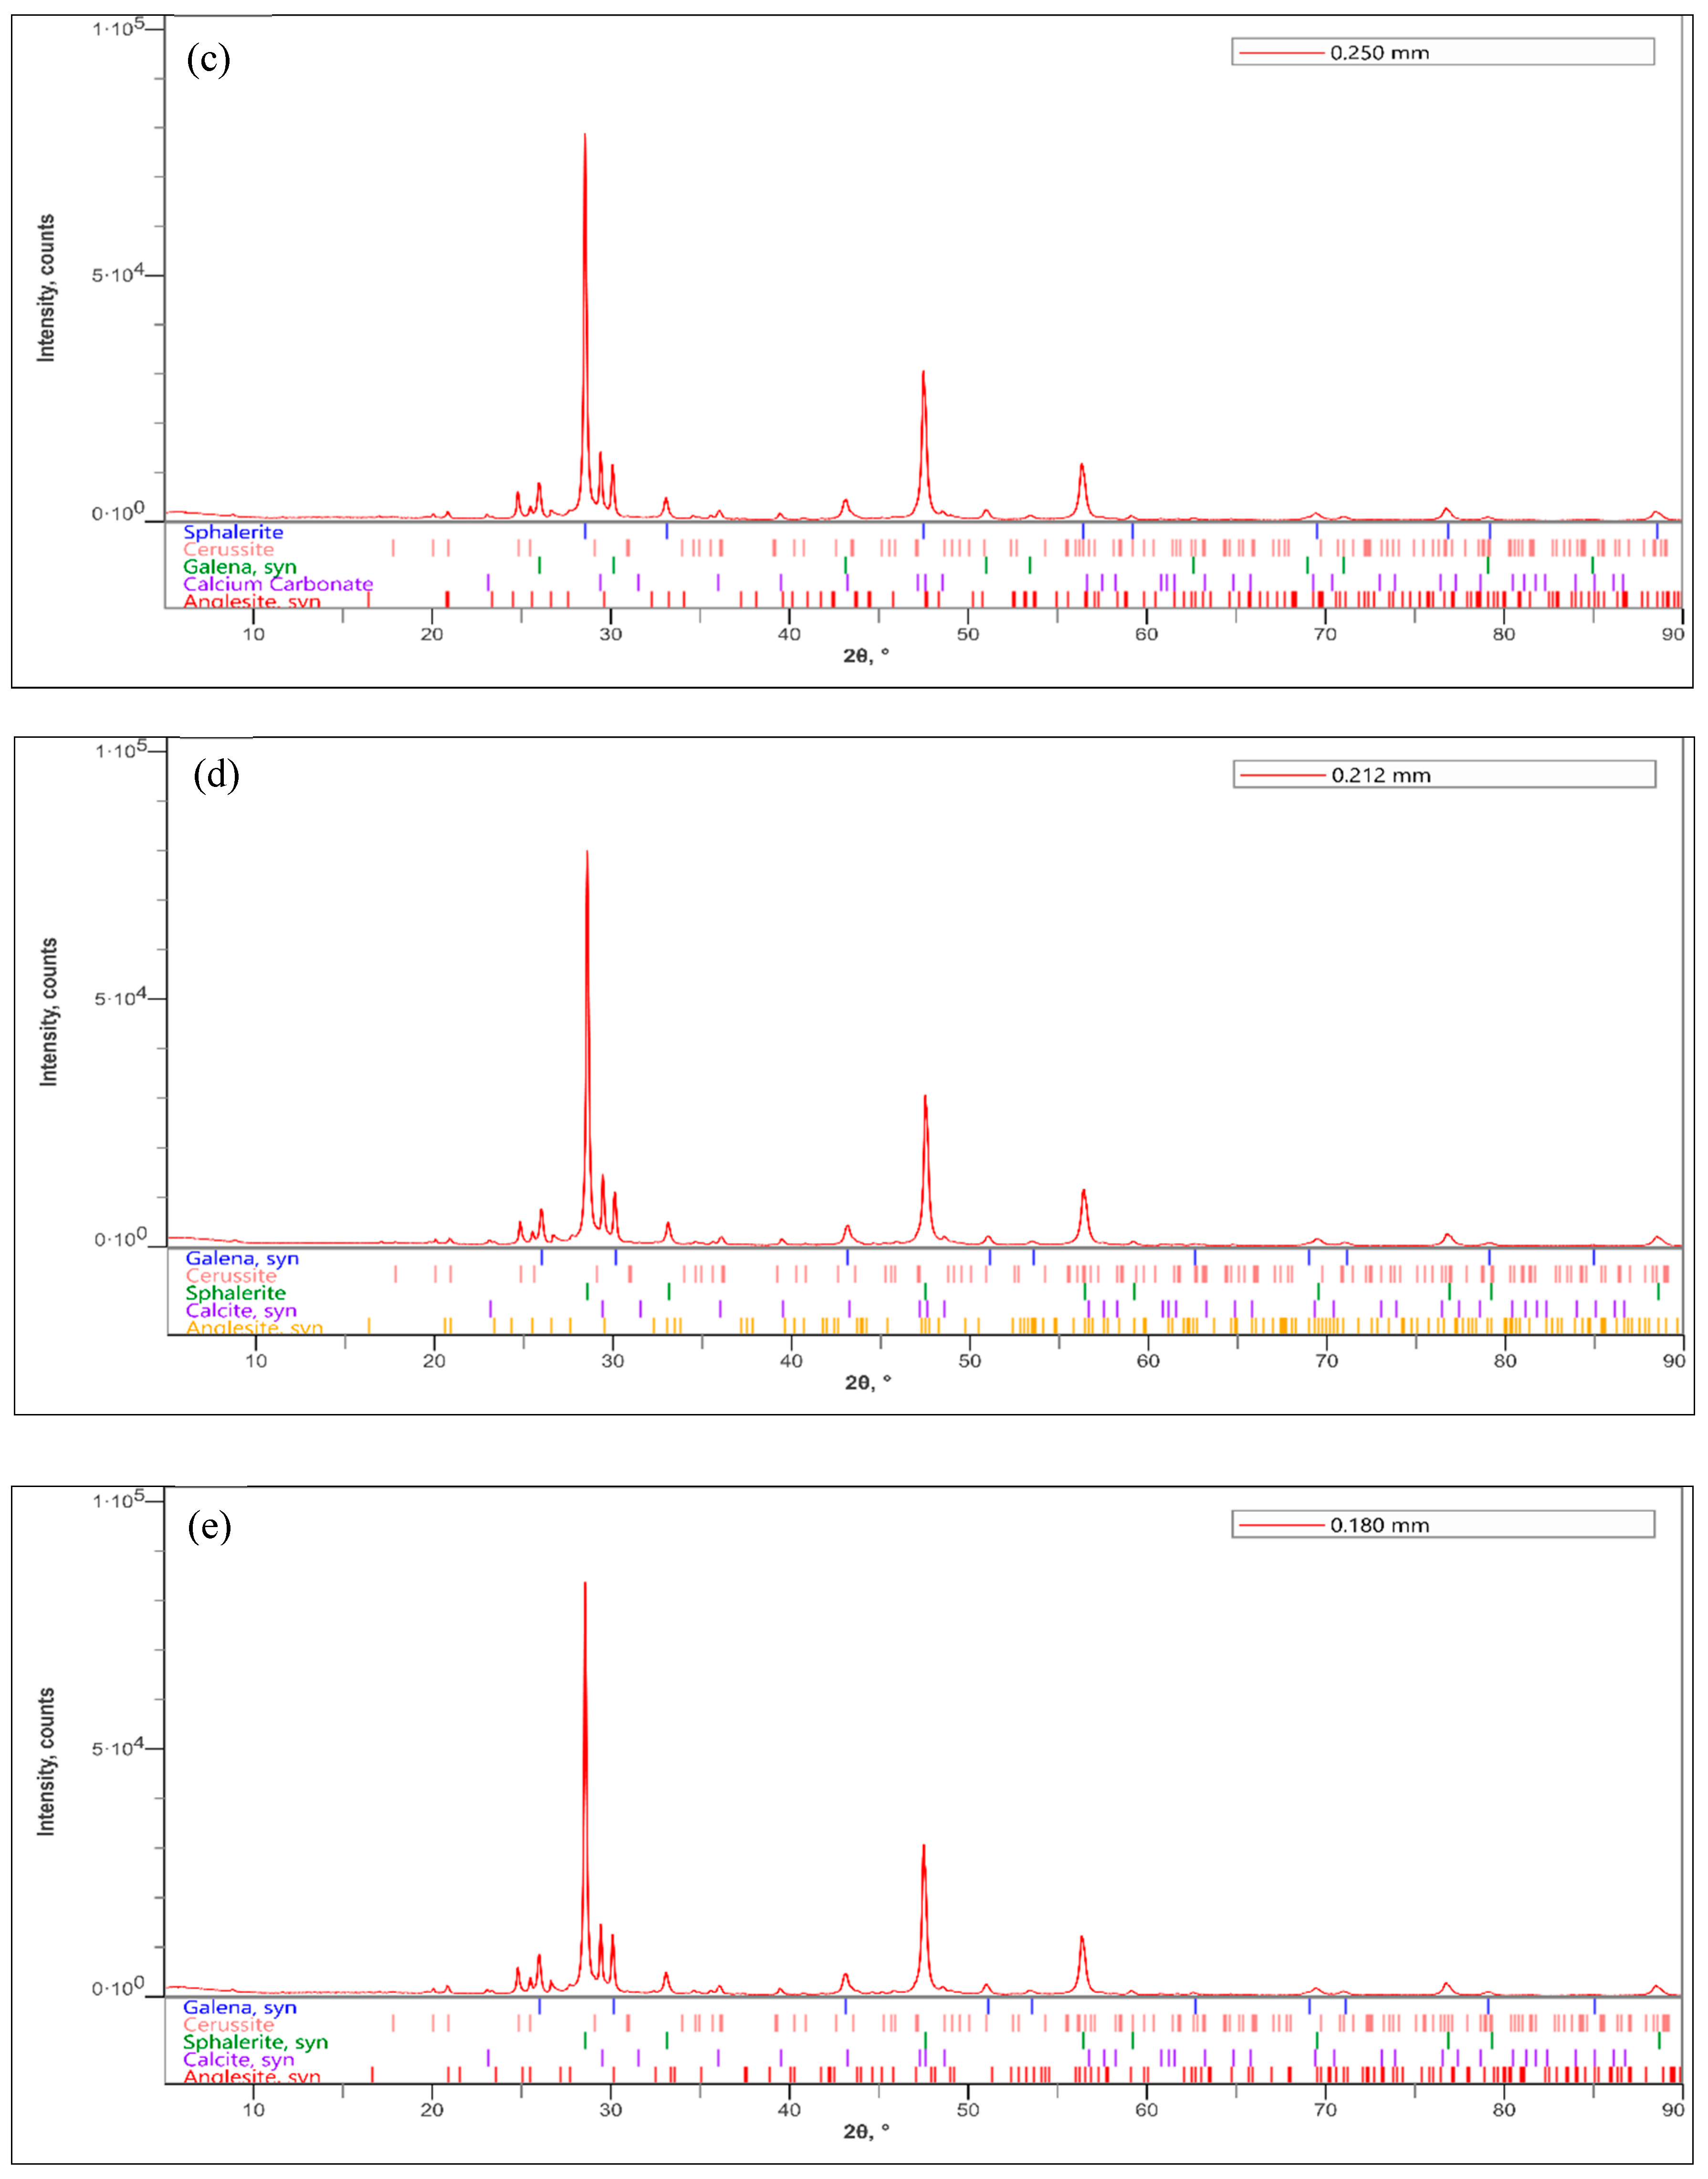
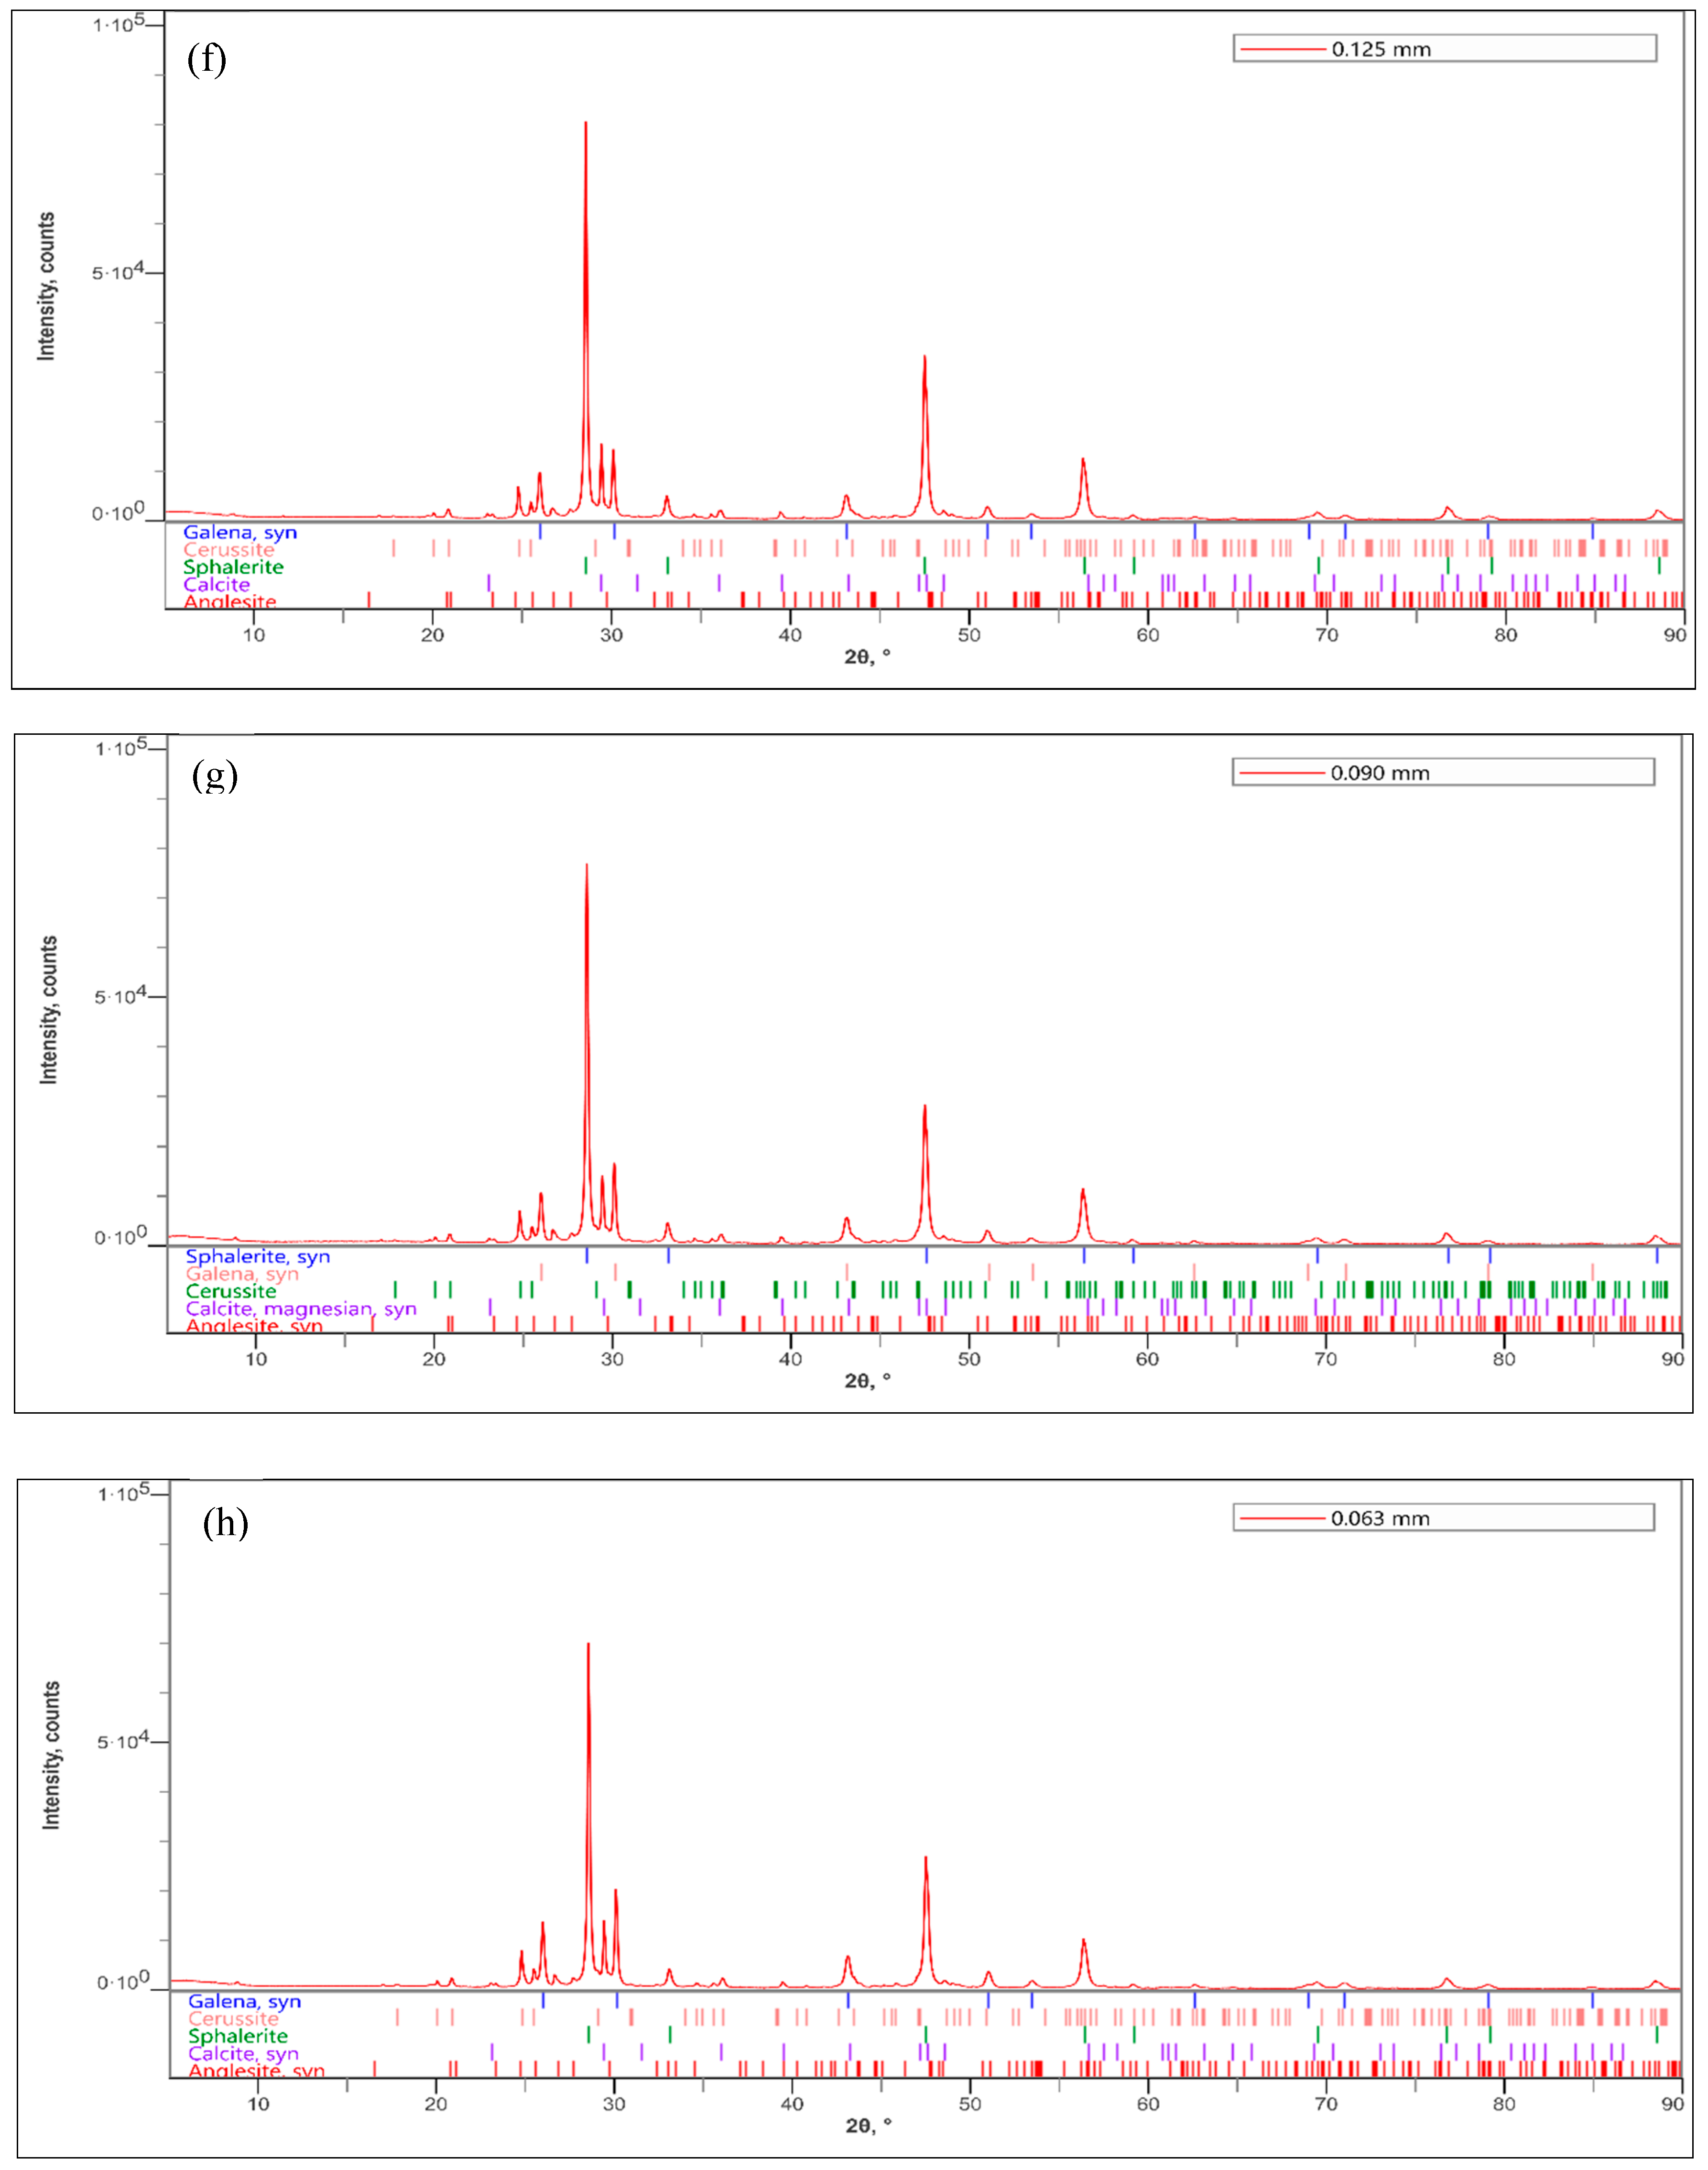
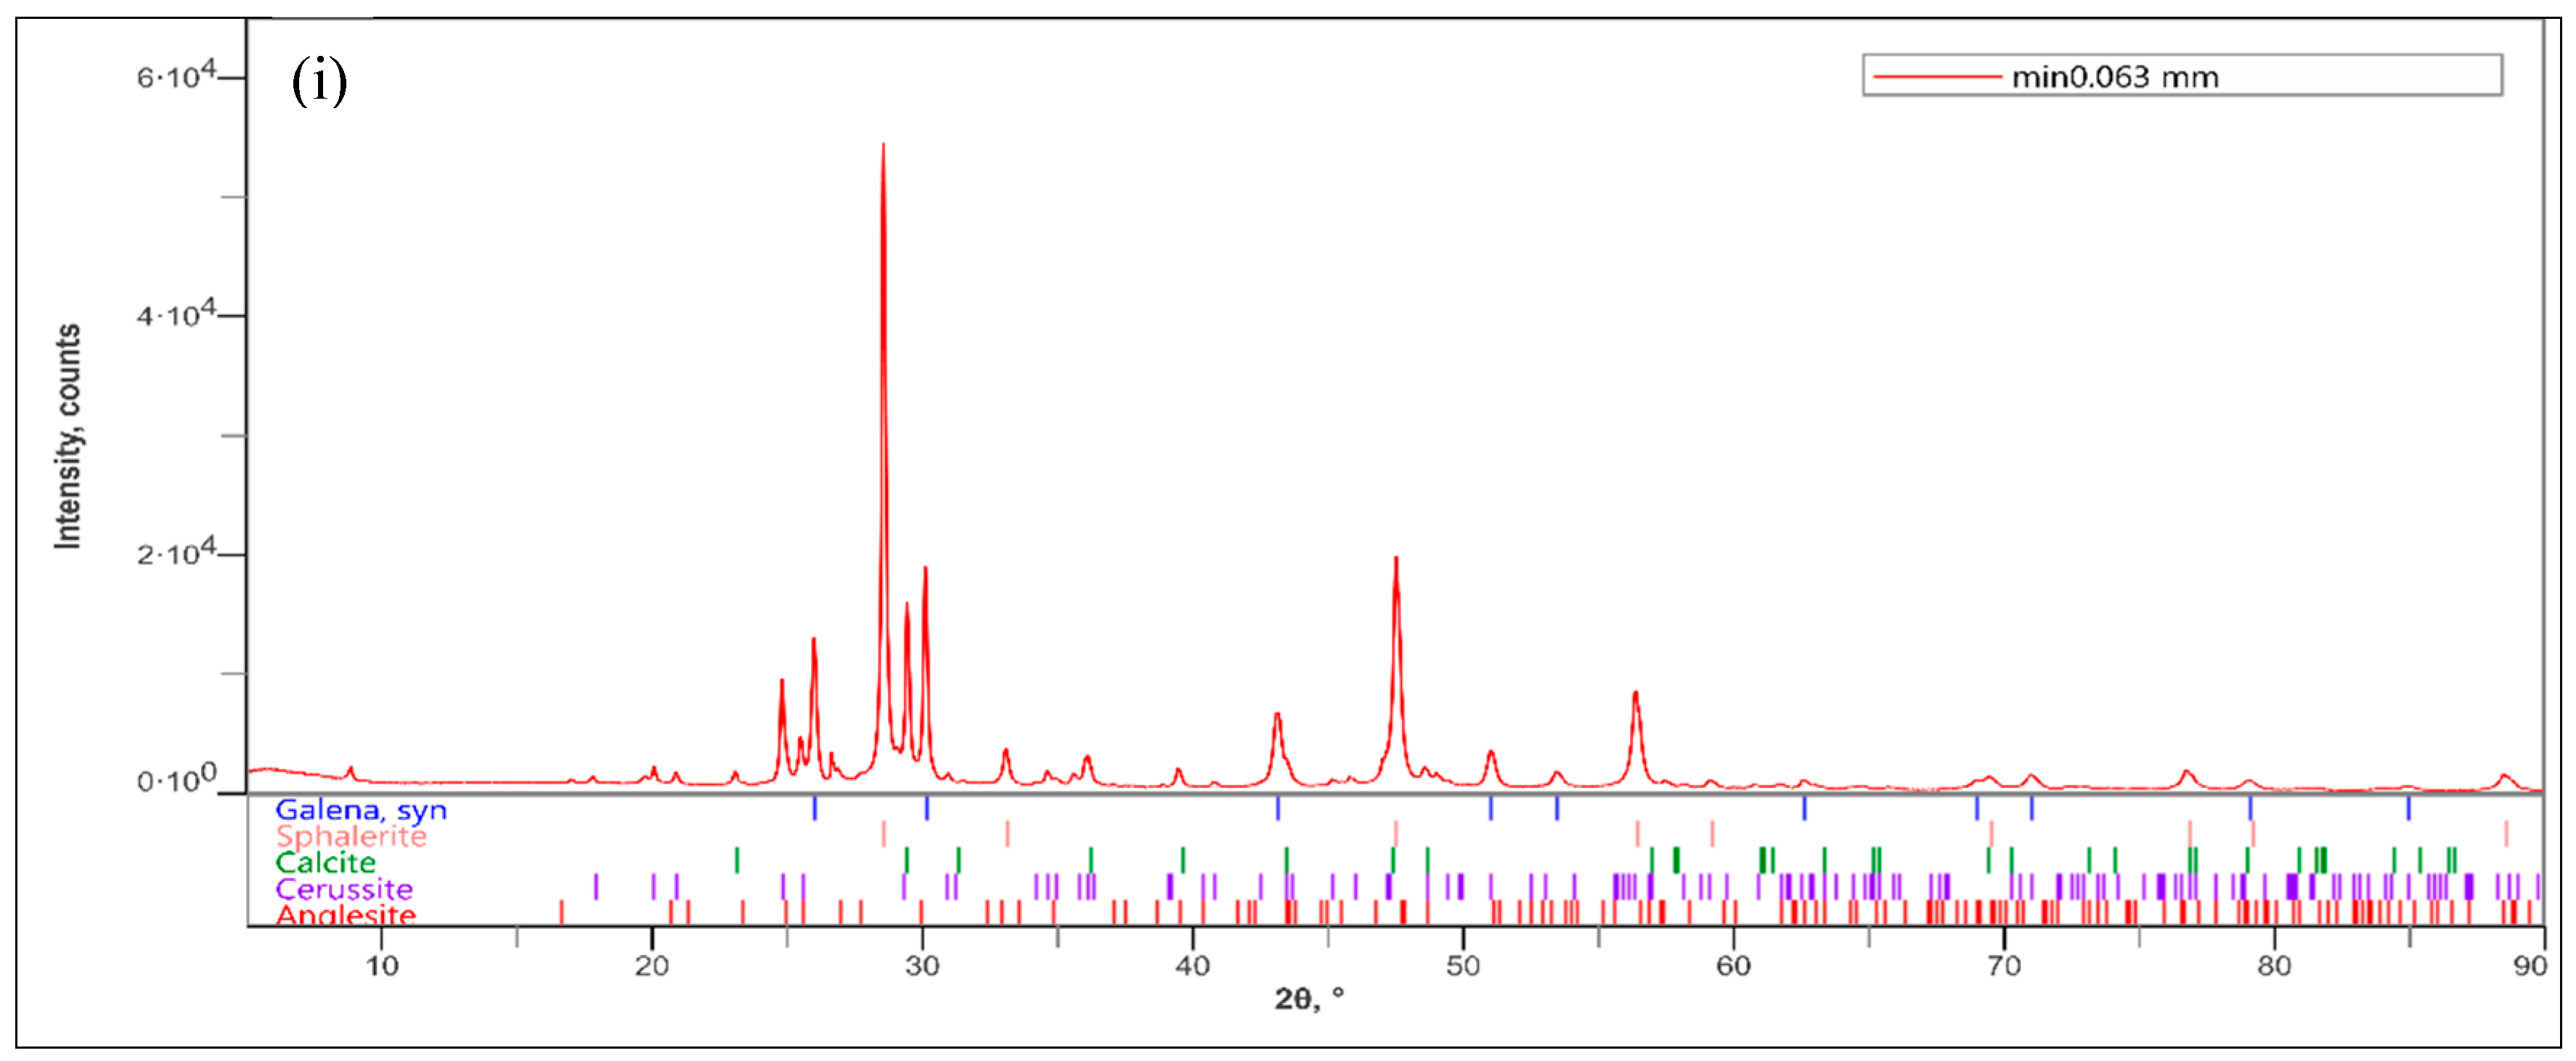
XRPD analyses, performed on each dimension class obtained by wet sieving from comminution composite output products < 0.425 mm, distinguished five different mineral phases: sphalerite, galena, calcite, anglesite, and cerussite, as reported in Figure 7a–i. Sphalerite’s main peaks were observed at 2θ angles of 28,57°, 33.11°, 47.57°, 56.39°, 76.77°, and 88.52° [35]. Calcite’s representative peaks were observed at 2θ angles of 29.44° and 48.58° [36]. Galena’s peaks were observed at 2θ angles of 26°, 30.09°, 43.06°, and 50.98° [37]. Cerussite’s and Anglesite’s characteristic peaks were observed at 2θ angles of 24.80°, 25.49°, and 43.48° and 20.84°, 23.36°, and 26.75° respectively [38,39].
Qualitatively, each class showed a constant presence in terms of the mineral phases. Reference spectra [24,35,36,37,38,39] were compared with the experimental ones. These outcomes generally confirmed what was previously observed by OM and SEM.
Quantitative XRPD analyses obtained by Rietveld [21,22,23] refinement showed residual errors Rwp ranging from 5.50% to 6.49% and goodness-of-fit in the range from 2.06 and 2.41, as shown in Table 1.
According to some authors, a Rietveld refinement showing low Rwp and S values can be considered as reliable, with errors in the weight fraction estimation between 0.5 wt % and 1.5 wt % [40,41]. The quantitative results are shown in Table 2. On average, sphalerite was the most abundant phase in the samples, ranging 50–70 wt %, calcite, defined as the gangue mineral, attained 17–27 wt %, while galena ranged 4–9 wt % The other phases could be considered as minor. The accuracy of the quantitative analyses was not assessed in detail.
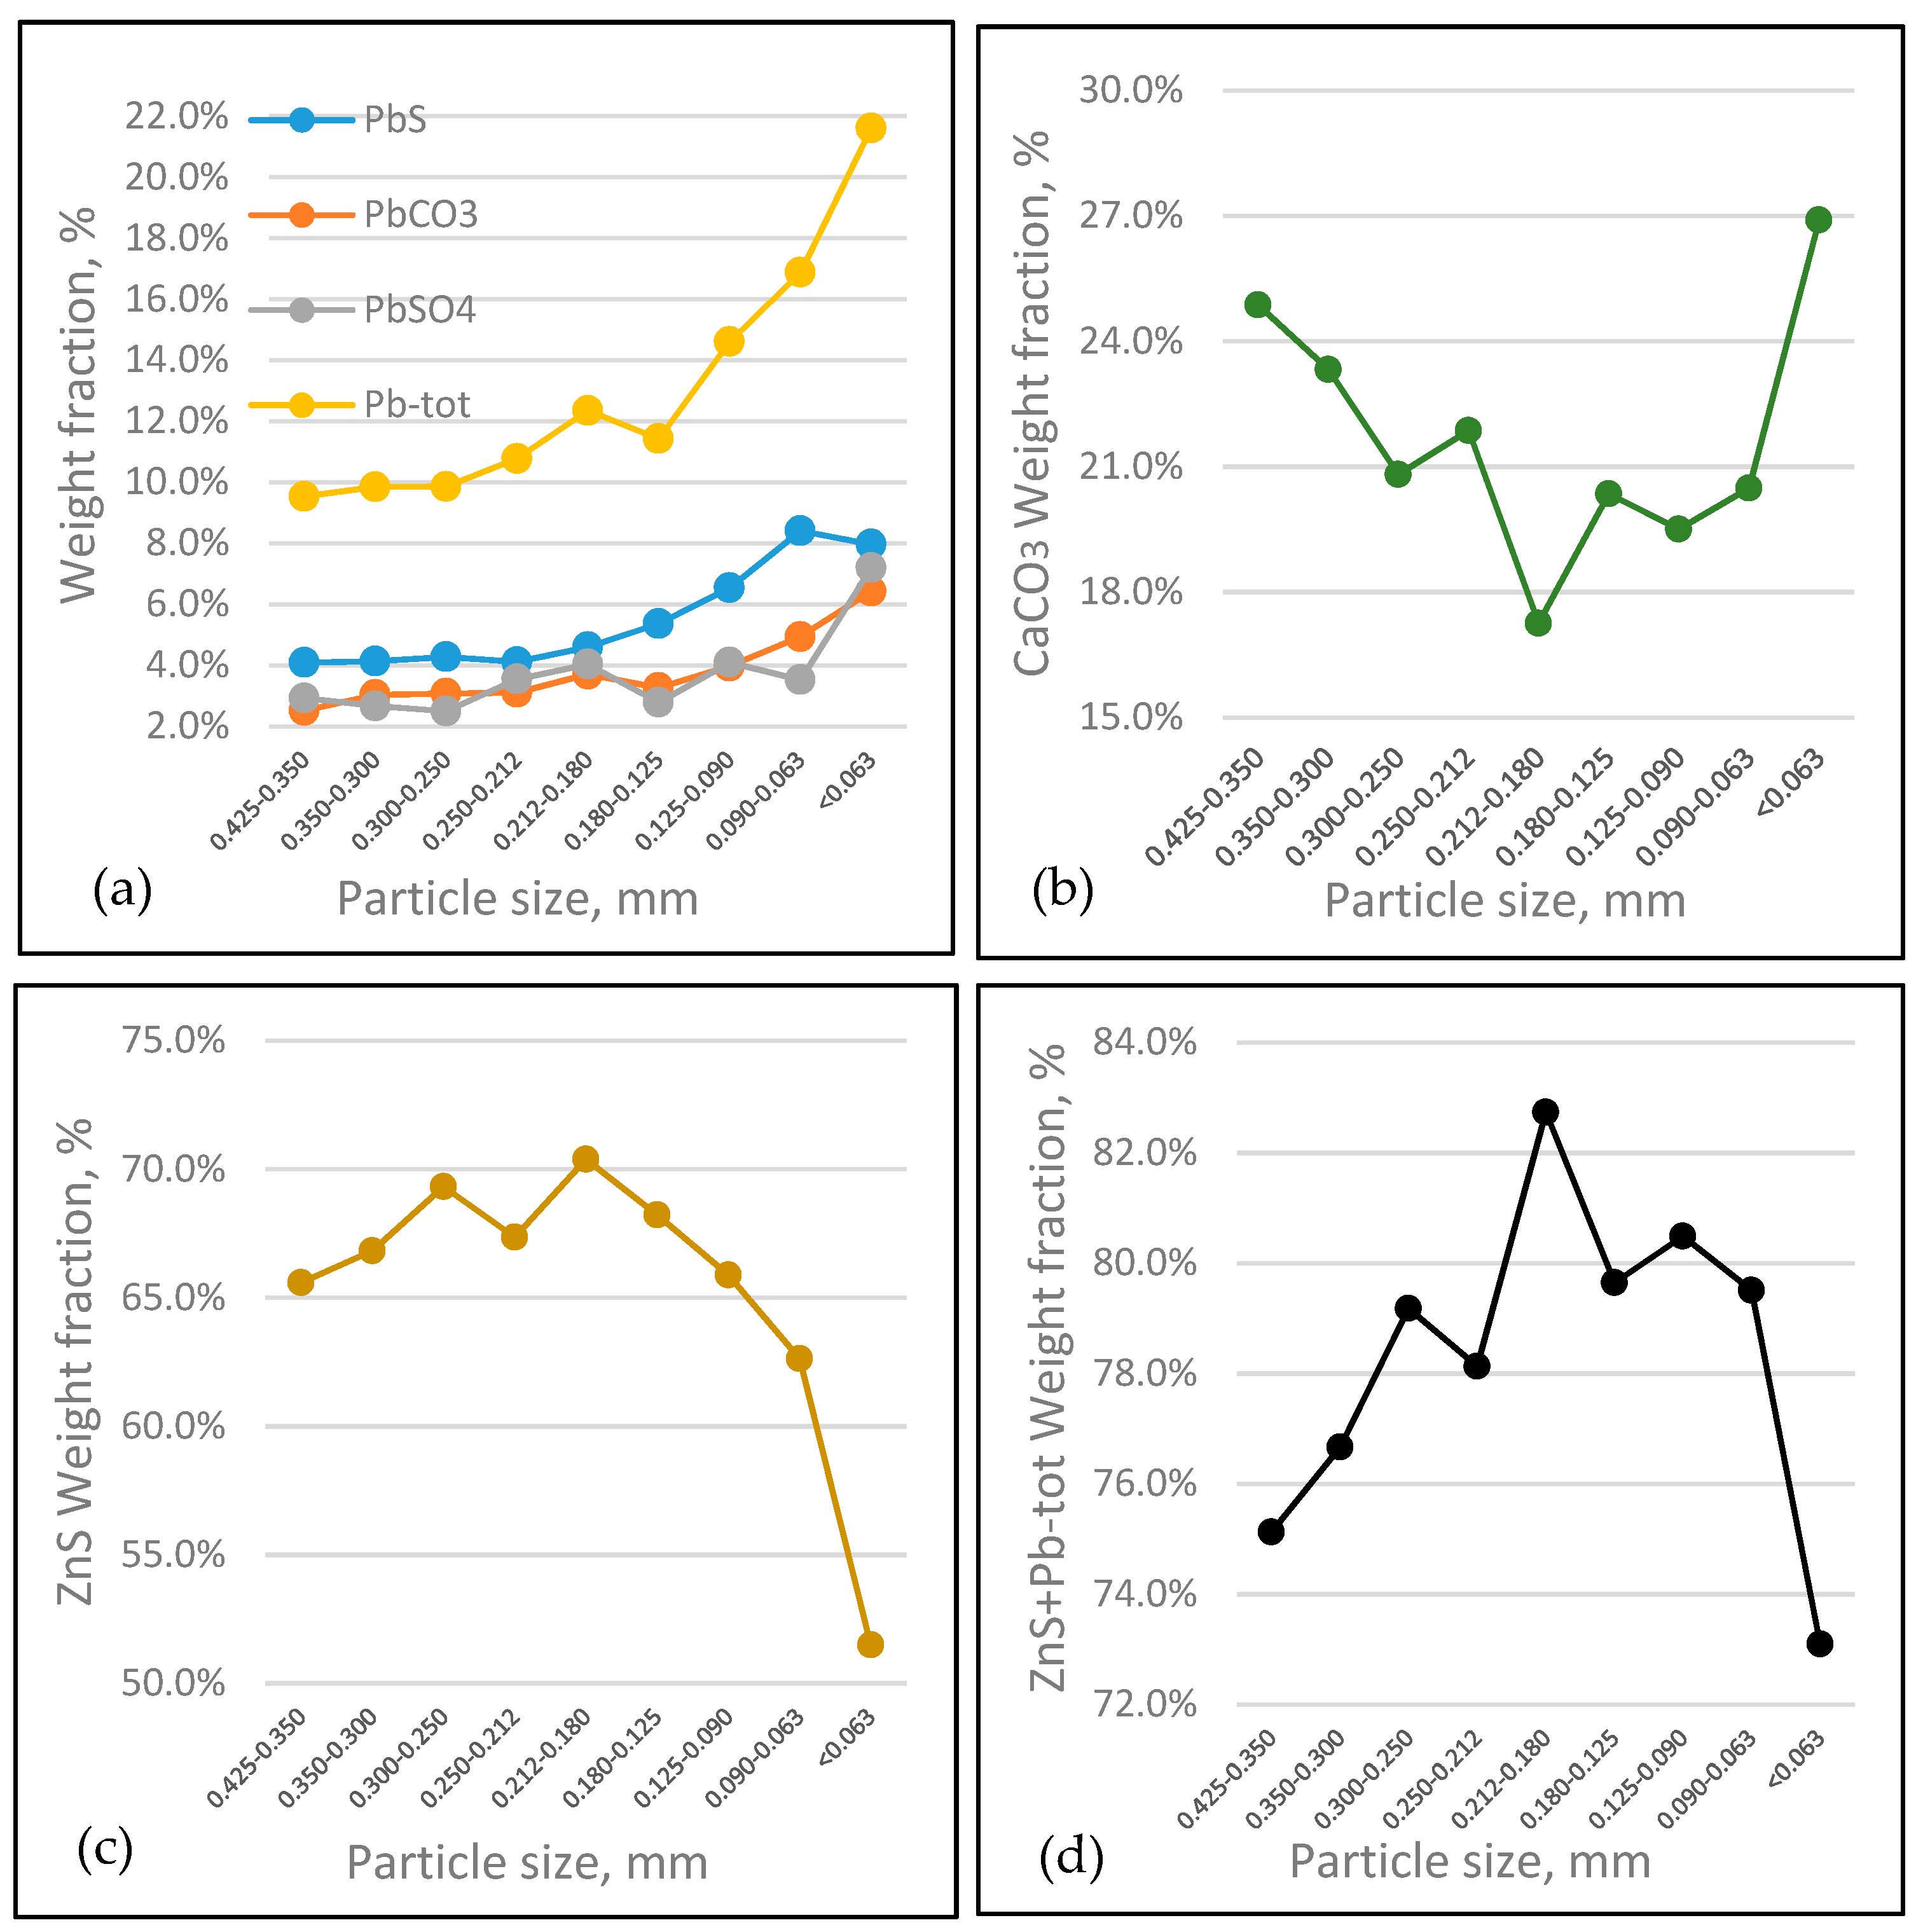
Some of the mineral phases present in the samples showed a different concentration among different granulometric classes. The clearest evidence was the ones linked with galena and Pb-related compounds. Their total concentration was around 9.5 wt % in particle sizes 0.425–0.350 mm and reached 21.6 wt % in particle sizes <0.063 mm, constantly increasing their presence with the decrease of their material dimensions. Galena was the most abundant regarding Pb-related compounds and showed a worthwhile concentration for further recovery.
Sphalerite was the most abundant phase in each size, but its presence decreased from 0.180 mm, where it peaked with 70.4 wt %, toward finer classes. The lowest concentration of ZnS was 62.6 wt %, found in the <0.063-mm class. The calcite phase had its lowest presence in class 0.212–0.180 mm with 17.3 wt %, while its highest concentration of 26.9 wt % was measured in the <0.063-mm class.
In general, high values of valuable minerals were found in the different classes of comminution products, underling the necessity of further separation in order to obtain high-quality concentrates from the ore. In the choice of recovery and separation methods of Pb-related minerals—galena, in particular—the increase of their concentrations in the finest classes should be taken into consideration.
4. Discussion
Ore samples were collected in the Pian Bracca extension area in the Gorno Mining District under an exploration operation by Alta Zinc Ltd. In order to have an overview of the characteristics of the sampled ores uncovered, polished thin sections from rock slices were realized and observed. Petrographic observations were necessary for the determination of the shape, composition, and dimensions of grains present in the mineralized mixed sulfide ores collected. The results showed typical characteristics related to MVT deposits [19,42], with relatively high contents of sphalerite minerals embedded in a calcite matrix. Galena was sparsely present in very small crystals, difficult to be distinguished only by OM.
SEM characterization brought additional information, especially concerning alteration products and the filling of the ore micro-fractures. The presence of cerussite, anglesite, and organic matter was detected, confirming the presence of Pb-related minerals and traces of organic matter, arguably linked with the formational geological environment of the site [19]. The observation made on the dimensional characteristics resulted in estimated sizes of valuable mineral grains below the 0.400 mm and 0.450 mm thresholds. On these parameters, a lab-scale crushing and grinding circuit was arranged, aiming to obtain products <0.425 mm. Ground materials passing the 0.425-mm screening were collected as unique products, accounting for 70 wt % of the initial input quantity. The other 30 wt % of the initial input materials needed to be reground and were not considered for further analysis (Figure 5). Passing 0.425 mm, the material grain size distribution was studied: material <0.063 mm accounted for 27 wt % (Table 1).
XRPD quantitative analyses were realized on oven-dried samples resulting from the wet sieving of <0.425-mm composite product samples. The results highlighted the important presence of sphalerite and galena in dimension classes ranging between the 0.250-mm and 0.063-mm classes, as shown in Figure 8a,d. Target Pb and Zn phase concentrations were observed as fluctuating, varying with the reduction in the dimensions of the products. This phenomenon could be framed as a selective comminution behavior of the ore [43], but further data on mineral liberation grades and comminution efficiency should be collected in order to better define the parameters related to this specific possibility.
Sphalerite was the most abundant mineral phase in the composite product samples <0.425 mm obtained by crushing and grinding; its concentration peaked at class 0.180 mm with 70.4 wt %, as plotted in Figure 8c, assuming a decreasing trend toward finer-grained sizes, whereas galena and Pb-related compound concentrations, plotted in Figure 8a, showed an increasing trend towards finer-grained sizes, peaking at class <0.063 mm with a total concentration of 21.6 wt %
The sum of the ZnS and Pb-related compounds’, corresponding to the valuable mineral phases present in the ore, peak concentration was reached in the 0.212–0.180-mm class with 82.7 wt %, while their lowest occurrence of 73.1 wt % was in the <0.063-mm particle sizes, as shown in Figure 8d. Their trend is mainly dominated by sphalerite concentration oscillations.
The calcite concentration, plotted in Figure 8b, trend appeared as V-shaped, encountering a descending behavior until the 0.212–0.180-mm class, strictly related to the total valuable phase ZnS + Pb-tot peak.
Moreover, according to the quantitative analyses, important information was obtained for the evaluation of the most abundant mineral phases present in the material and their collocation among the grain size classes of the comminuted samples.
5. Conclusions
The purpose of this study was the characterization of ore materials after crushing and grinding force applications in terms of the distribution of target minerals among different-sized classes. Petrographic observations were carried out on polished thin sections by optical microscopy and scanning electron microscopy. Crushing and grinding equipment was used in order to reproduce the comminution forces typically present in a comminution plant, and the output material samples were characterized by means of XRPD quantitative analysis. Important trends in the valuable mineral phase fluctuations among different-sized classes were highlighted from results.
Further detailed studies should be taken into consideration. Comminution configurations should be properly assessed in terms of grindability studies on materials, specific energy consumptions, and industrial-relevant comminution flowsheet set-ups. Mineral liberation studies should also be implemented in order to have a clearer understanding of the comminution behavior of this material under different conditions.
Generally, applicable separation processes for this kind of ore, such as froth flotation or gravity separation methods, should be taken into account [1,44,45]. Concerning the presence of Pb-related compounds in very fine classes, a nonconventional flotation [46,47] should be considered. In general, the amount of valuable minerals present in the sampled area is relevant and worthwhile for industrial purposes.
Author Contributions
Conceptualization, G.B. and P.M.; methodology, G.B. and P.M.; investigation, G.B. and O.B.; resources, P.M.; data curation, G.B.; writing—original draft preparation, G.B.; writing—review and editing, G.B., O.B., and P.M.; and supervision, P.M. All authors have read and agreed to the published version of the manuscript.
Funding
This research received no external funding.
Acknowledgments
The authors are thankful to Alta Zinc Ltd. and Energia Minerals (Italia) s.r.l. for their availability in welcoming access, interest, recovery, and the sharing of relevant information related to their industrial activities.
Conflicts of Interest
The authors declare no conflict of interest.
References
- Wills, B.A. Comminution in the minerals industry—An overview. Miner. Eng. 1990, 3, 3–5. [Google Scholar] [CrossRef]
- Ozgur, O.; Hakan, B. Comparison of different breakage mechanisms in terms of product particle size distribution and mineral liberation. Miner. Eng. 2013, 49, 103–108. [Google Scholar]
- Hoşten, Ç.; Özbay, C. A comparison of particle bed breakage and rod mill grinding with regard to mineral liberation and particle shape effects. Miner. Eng. 1998, 11, 871–874. [Google Scholar] [CrossRef]
- King, R.P. Comminution and liberation of minerals. Miner. Eng. 1994, 7, 129–140. [Google Scholar] [CrossRef]
- Nadolski, S.; Bern, K.; Amit, Z.; Zorigtkhuu, D. An energy benchmarking model for mineral comminution. Miner. Eng. 2014, 65, 178–186. [Google Scholar] [CrossRef]
- Tromans, D. Mineral comminution: Energy efficiency considerations. Miner. Eng. 2008, 21, 613–620. [Google Scholar] [CrossRef]
- Mwanga, A.; Rosenkranz, J.; Lamberg, P. Testing of ore comminution behavior in the geometallurgical context—A review. Minerals 2015, 5, 276–297. [Google Scholar] [CrossRef] [Green Version]
- King, R.P. Modeling and Simulation of Mineral Processing System; Elsevier: Amsterdam, The Netherlands, 2001; pp. 127–212. [Google Scholar]
- Bazin, C.; Grant, R.; Cooper, M.; Tessier, R. A method to predict metallurgical performances as a function of fineness of grind. Miner. Eng. 1994, 7, 1243–1251. [Google Scholar] [CrossRef]
- Moradi, S.; Monhemius, A.J. Mixed sulphide–oxide lead and zinc ores: Problems and solutions. Miner. Eng. 2011, 24, 1062–1076. [Google Scholar] [CrossRef]
- Barnov, N.G.; Lavrinenko, A.A.; Lusinyan, O.G.; Chikhladze, V.V. Effect of a Crushing Technique on Lead–Zinc Ore Processing Performance. J. Min. Sci. 2018, 53, 771–777. [Google Scholar] [CrossRef]
- Palm, N.A.; Shackleton, N.J.; Malysiak, V.; O’Connor, C.T. The effect of using different comminution procedures on the flotation of sphalerite. Miner Eng. 2010, 23, 1053–1057. [Google Scholar] [CrossRef]
- AMMI S.p.A. Impianto di Trattamento per Minerali di Piombo e Zinco (Laveria); AMMI S.p.A.: Milan, Italy, 1971. (In Italian) [Google Scholar]
- Wei, Y.; Sandenbergh, R.F. Effects of grinding environment on the flotation of Rosh Pinah complex Pb/Zn ore. Miner. Eng. 2007, 20, 264–272. [Google Scholar] [CrossRef] [Green Version]
- Mudenda, C.; Mwanza, B.G.; Kondwani, M. Analysis of the effects of grind size on production of copper concentrate: A case study of mining company in Zambia. In Proceedings of the International Conference on Chemical Processes and Green Energy Engineering (ICCPGEE’15), Harare, Zimbabwe, 14–15 July 2015. [Google Scholar]
- Liu, L.; Tan, Q.; Liu, L.; Cao, J. Comparison of different comminution flowsheets in terms of minerals liberation and separation properties. Miner. Eng. 2018, 125, 26–33. [Google Scholar] [CrossRef]
- Leach, D.L.; Bechstädt, T.; Boni, M.; Zeeh, S. Triassic-hosted Mississippi Valley-type zinc-lead ores of Poland, Austria, Slovenia, and Italy. In Europe’s Major Base Metal Deposits; Ashton, J., Boland, M., Cruise, M., Earls, G., Fusciardi, L., Kelly, J., Stanley, G., Andrew, C., Eds.; Irish Association of Economic Geologists (IAEG): Dublin, Ireland, 2003; pp. 169–213. [Google Scholar]
- Brigo, L.; Kostelka, L.; Omenetto, P.; Schneider, H.J.; Schroll, E.; Schulz, O.; Strucl, I. Comparative reflections on four alpine Pb-Zn deposits. In Time and Strata-Bound Ore Deposits; Klemm, D.D., Schneider, H.J., Eds.; Springer: Berlin/Heidelberg, Germany, 1977; pp. 273–293. [Google Scholar]
- Mondillo, N.; Lupone, F.; Boni, M.; Joachimski, M.; Balassone, G.; De Angelis, M.; Zanin, S.; Granitzio, F. From Alpine-type sulfides to nonsulfides in the Gorno Zn project (Bergamo, Italy). Miner. Depos. 2019, 55, 953–970. [Google Scholar] [CrossRef] [Green Version]
- Alta Zinc. Mining in the North of Italy. Available online: http://www.altazinc.com/ (accessed on 21 July 2020).
- Rietveld, H. A profile refinement method for nuclear and magnetic structures. J. Appl. Cryst. 1969, 2, 65–71. [Google Scholar] [CrossRef]
- Young, R.A. The Rietveld Method; Oxford University Press: Oxford, UK, 1993. [Google Scholar]
- McCusker, L.B.; Von Dreele, R.B.; Cox, D.E.; Louer, D.; Scardi, P. Rietveld refinement guidelines. J. Appl. Cryst. 1986, 32, 36–50. [Google Scholar] [CrossRef] [Green Version]
- ICDD. PDF-4/Minerals; International Centre for Diffraction Data: Newtown Square, PA, USA, 2020. [Google Scholar]
- Sphalerite Mineral Data. Available online: http://webmineral.com/data/Sphalerite.shtml (accessed on 21 July 2020).
- Calcite Mineral Data. Available online: http://webmineral.com/data/Calcite.shtml (accessed on 21 July 2020).
- Cerussite Mineral Data. Available online: http://webmineral.com/data/Cerussite.shtml (accessed on 21 July 2020).
- Anglesite Mineral Data. Available online: http://webmineral.com/data/Anglesite.shtml (accessed on 21 July 2020).
- Smithsonite Mineral Data. Available online: http://webmineral.com/data/Smithsonite.shtml (accessed on 21 July 2020).
- Ohkouchi, N.; Kuroda, J.; Taira, A. The origin of Cretaceous black shales: A change in the surface ocean ecosystem and its triggers. Proc. Jpn. Acad. Ser. B Phys. Biol. Sci. 2015, 91, 273–291. [Google Scholar] [CrossRef] [Green Version]
- Pérez-Garibaya, R.; Ramírez-Aguileraa, N.; Bouchardb, J.; Rubio, J. Froth flotation of sphalerite: Collector concentration, gas dispersion and particle size effects. Miner. Eng. 2017, 57, 72–78. [Google Scholar] [CrossRef]
- Duarte, A.C.P.; Grano, S.R. Mechanism for the recovery of silicate gangue minerals in the flotation of ultrafine sphalerite. Miner. Eng. 2007, 20, 766–775. [Google Scholar] [CrossRef]
- Collins, G.L.; Jameson, G.L. Experiments on the flotation of fine particles, the influence of particle size and charge. Chem. Eng. Sci. 1976, 31, 985–991. [Google Scholar] [CrossRef]
- Arbiter, N. Problems in sulfide ore processing. Beneficiation of Mineral Fines—Problems and Research Needs; Somasundaran, P., Arbiter, N., Eds.; AIME: Ann Arbor, MI, USA, 1979; pp. 139–152. [Google Scholar]
- RRUFF. Sphalerite R040136. Available online: https://rruff.info/R040136 (accessed on 21 July 2020).
- RRUFF. Calcite R040070. Available online: https://rruff.info/R040070 (accessed on 21 July 2020).
- RRUFF. Galena R070325. Available online: https://rruff.info/R070325 (accessed on 21 July 2020).
- RRUFF. Cerussite R040069. Available online: https://rruff.info/R040069 (accessed on 21 July 2020).
- RRUFF. Anglesite R040004. Available online: https://rruff.info/R040004 (accessed on 21 July 2020).
- Monecke, T.; Köhler, S.; Kleeberg, R.; Herzig, P.M.; Gemell, J.B. Quantitative phase-analysis by the Rietveld method using X-ray powder-diffraction data: Application to the study of alteration halos associated with volcanic-rock-hosted massive sulfide deposits. Canad. Mineral. 2001, 39, 1617–1633. [Google Scholar] [CrossRef]
- Zhao, P.; Lu, L.; Liu, X.; De la Torre, A.G.; Cheng, X. Error analysis and correction for quantitative phase analysis based on Rietveld-internal standard method: Whether the minor phases can be ignored? Crystals 2018, 8, 110. [Google Scholar] [CrossRef] [Green Version]
- Paradis, S.; Hannigan, P.; Dewing, K. Mississippi Valley-type lead-zinc deposits (MVT). In Mineral Deposits of Canada; Geological Association of Canada: St. John’s, NL, Canada, 2007; pp. 185–203. [Google Scholar]
- Hesse, M.; Popov, O.; Lieberwirth, H. Increasing efficiency by selective comminution. Miner. Eng. 2017, 103–104, 112–126. [Google Scholar] [CrossRef]
- Trahar, W.J.; Warren, L.J. The floatability of very fine particles-a review. Int. J. Miner. Process. 1976, 3, 103–131. [Google Scholar] [CrossRef]
- Gaudin, A.M.; Groh, J.O.; Henderson, H.B. Effect of particle size on flotation. AIME Tech. Pub. 1931, 414, 3–23. [Google Scholar]
- Song, S.; Lopez-Valdivieso, A.; Reyes-Bahena, J.L.; Lara-Valenzuela, C. Floc Flotation of galena and sphalerite fines. Miner. Eng. 2001, 14, 87–98. [Google Scholar] [CrossRef]
- Song, S.; Lopez-Valdivieso, A.; Reyes-Bahena, J.L.; Bermejo-Perez, H.I.; Trass, O. Hydrophobic flocculation of galena fines in aqueous suspensions. J. Colloid Interface Sci. 2000, 227, 272–281. [Google Scholar] [CrossRef] [Green Version]
Figure 1.
Lab-scale crushing and grinding equipment scheme.

Figure 2.
Optical microscopy (OM) thin section images in parallel transmitted light (PL) and cross-polarized transmitted light (XPL) (Sphalerite, Sph; Calcite, Cal; and Galena, Gal): (a) thin section n.1, PL and (b) XPL and (c) thin section n.3, PL and (d) XPL.
Figure 2.
Optical microscopy (OM) thin section images in parallel transmitted light (PL) and cross-polarized transmitted light (XPL) (Sphalerite, Sph; Calcite, Cal; and Galena, Gal): (a) thin section n.1, PL and (b) XPL and (c) thin section n.3, PL and (d) XPL.

Figure 3.
SEM images and spectra of thin sections: (a) sphalerite (Sph, blue dot), cerussite (Cer, green dot), organic matter (Org, orange dot), (b) sphalerite (Sph), and smithsonite (Sm, blue dot).
Figure 3.
SEM images and spectra of thin sections: (a) sphalerite (Sph, blue dot), cerussite (Cer, green dot), organic matter (Org, orange dot), (b) sphalerite (Sph), and smithsonite (Sm, blue dot).


Figure 4.
Output product granulometric curves for each equipment.

Figure 5.
Mass balance resulting from the crushing and grinding stages.

Figure 6.
Particle size distribution obtained by means of wet sieving on comminution products < 0.425 mm.
Figure 6.
Particle size distribution obtained by means of wet sieving on comminution products < 0.425 mm.

Figure 7.
X-ray powder diffraction (XRPD) spectra of different comminution product-sieved classes: (a) 0.425–0.350 mm; (b) 0.350–0.300 mm; (c) 0.300–0.250 mm; (d) 0.250–0.212 mm; (e) 0.212–0.180 mm; (f) 0.180-0.125 mm; (g) 0.125-0.090 mm; (h) 0.090-0.063 mm; (i) <0.063 mm.
Figure 7.
X-ray powder diffraction (XRPD) spectra of different comminution product-sieved classes: (a) 0.425–0.350 mm; (b) 0.350–0.300 mm; (c) 0.300–0.250 mm; (d) 0.250–0.212 mm; (e) 0.212–0.180 mm; (f) 0.180-0.125 mm; (g) 0.125-0.090 mm; (h) 0.090-0.063 mm; (i) <0.063 mm.


Figure 8.
Mineral phase weight fraction variations among the dimension classes in comminution products below 0.425 mm: (a) Pb-related compounds (Pb-tot), (b) calcite (CaCO3), (c) sphalerite (ZnS), and (d) valuable phases assumed as a sum of the sphalerite and Pb-related compounds (ZnS+Pb-tot).
Figure 8.
Mineral phase weight fraction variations among the dimension classes in comminution products below 0.425 mm: (a) Pb-related compounds (Pb-tot), (b) calcite (CaCO3), (c) sphalerite (ZnS), and (d) valuable phases assumed as a sum of the sphalerite and Pb-related compounds (ZnS+Pb-tot).


Table 1.
Observed residual errors (Rwp) and goodness-of-fit (S) from the quantitative X-ray powder diffraction (XRPD) analysis.
Table 1.
Observed residual errors (Rwp) and goodness-of-fit (S) from the quantitative X-ray powder diffraction (XRPD) analysis.
| Particle Size (mm) | Rwp (%) | S |
|---|---|---|
| 0.425–0.350 | 5.90 | 2.20 |
| 0.350–0.300 | 5.54 | 2.07 |
| 0.300–0.250 | 5.55 | 2.07 |
| 0.250–0.212 | 5.55 | 2.06 |
| 0.212–0.180 | 6.21 | 2.33 |
| 0.180–0.125 | 5.50 | 2.05 |
| 0.125–0.090 | 5.86 | 2.20 |
| 0.090–0.063 | 5.87 | 2.21 |
| <0.063 | 6.49 | 2.41 |
Table 2.
Quantitative XRPD results for each particle size.
| Particle Size (mm) | Weight Fraction (%) (1) | ||||
|---|---|---|---|---|---|
| ZnS | PbS | PbCO3 | PbSO4 | CaCO3 | |
| 0.425–0.350 | 65.59 | 4.09 | 2.52 | 2.93 | 24.87 |
| 0.350–0.300 | 66.82 | 4.14 | 3.04 | 2.67 | 23.33 |
| 0.300–0.250 | 69.32 | 4.28 | 3.08/ | 2.50 | 20.82 |
| 0.250–0.212 | 67.35 | 4.12 | 3.11 | 3.55 | 21.87 |
| 0.212–0.180 | 70.39 | 4.60 | 3.71 | 4.04 | 17.26 |
| 0.180–0.125 | 68.22 | 5.37 | 3.27 | 2.79 | 20.35 |
| 0.125–0.090 | 65.88 | 6.54 | 3.97 | 4.10 | 19.51 |
| 0.090–0.063 | 62.63 | 8.41 | 4.94 | 3.53 | 20.49 |
| <0.063 | 51.50 | 7.97 | 6.43 | 7.20 | 26.90 |
© 2020 by the authors. Licensee MDPI, Basel, Switzerland. This article is an open access article distributed under the terms and conditions of the Creative Commons Attribution (CC BY) license (http://creativecommons.org/licenses/by/4.0/).
Share and Cite
MDPI and ACS Style
Baldassarre, G.; Baietto, O.; Marini, P. Comminution Effects on Mineral-Grade Distribution: The Case of an MVT Lead-Zinc Ore Deposit. Minerals 2020, 10, 893. https://doi.org/10.3390/min10100893
AMA Style
Baldassarre G, Baietto O, Marini P. Comminution Effects on Mineral-Grade Distribution: The Case of an MVT Lead-Zinc Ore Deposit. Minerals. 2020; 10(10):893. https://doi.org/10.3390/min10100893
Chicago/Turabian StyleBaldassarre, Gabriele, Oliviero Baietto, and Paola Marini. 2020. "Comminution Effects on Mineral-Grade Distribution: The Case of an MVT Lead-Zinc Ore Deposit" Minerals 10, no. 10: 893. https://doi.org/10.3390/min10100893
Note that from the first issue of 2016, this journal uses article numbers instead of page numbers. See further details here.