Article

Magmatic PGE Sulphide Mineralization in Clinopyroxenite from the Platreef, Bushveld Complex, South Africa

1
GeoZentrum Nordbayern, Universität Erlangen-Nürnberg, Schlossgarten 5a, 91054 Erlangen, Germany
2
Department of Earth Science, University of Bergen, Allégaten 41, 5007 Bergen, Norway
3
Institut für Geo- und Umweltwissenschaften Mineralogie-Petrologie, Universität Freiburg, Alberstr.23b, 79104 Freiburg, Germany
4
Centre for Microscopy, Characterization and Analysis (CMCA), The University of Western Australia, Verdun Street, Perth, WA 6009, Australia
5
Minerals to Metals Initiative, Department of Chemical Engineering, University of Cape Town; Rondebosch 7103, South Africa
6
Department of Geology, University of the Free State, Bloemfontein 9301, South Africa
*
Author to whom correspondence should be addressed.
Minerals 2020, 10(6), 570; https://doi.org/10.3390/min10060570
Submission received: 25 May 2020 / Revised: 15 June 2020 / Accepted: 23 June 2020 / Published: 25 June 2020
(This article belongs to the Special Issue Feature Papers in Mineral Deposits 2020)

Abstract

:
The Platreef, at the base of the northern limb of the Bushveld Complex in South Africa, hosts platinum-group element (PGE) mineralization in association with base-metal sulphides (BMS) and platinum-group minerals (PGM). However, whilst a magmatic origin of the stratiform mineralization of the upper Platreef has been widely confirmed, the processes responsible for the PGE and BMS mineralization and metasomatism of the host rocks in the Platreef are still under discussion. In order to contribute to the present discussion, we present an integrated petrographical, mineral-chemical, whole-rock trace- and major-element, sulphur- and neodymium-isotope, study of Platreef footwall clinopyroxenite drill core samples from Overysel, which is located in the northern sector of the northern Bushveld limb. A metasomatic transformation of magmatic pyroxenite units to non-magmatic clinopyroxenite is in accordance with the petrography and whole-rock chemical analysis. The whole-rock data display lower SiO2, FeO, Na2O and Cr (<1700 ppm), and higher CaO, concentrations in the here-studied footwall Platreef clinopyroxenite samples than primary magmatic Platreef pyroxenite and norite. The presence of capped globular sulphides in some samples, which display differentiation into pyrrhotite and pentlandite in the lower, and chalcopyrite in the upper part, is attributed to the fractional crystallization of a sulphide liquid, and a downward transport of the blebs. In situ sulphur (V-CDT) isotope BMS data show isotopic signatures (δ34S = 0.9 to 3.1 ‰; Δ33S = 0.09 to 0.32‰) close to or within the pristine magmatic range. Elevated (non-zero) Δ33S values are common for Bushveld magmas, indicating contamination by older, presumably crustal sulphur in an early stage chamber, whereas magmatic δ34S values suggest the absence of local crustal contamination during emplacement. This is in accordance with the εNd (2.06 Ga) (chondritic uniform reservoir (CHUR)) values, of −6.16 to −6.94, which are similar to those of the magmatic pyroxenite and norite of the Main Zone and the Platreef in the northern sector of the northern Bushveld limb. Base-metal sulphide textures and S–Se-ratios give evidence for a secondary S-loss during late- to post-magmatic hydrothermal alteration. The textural evidence, as well as the bulk S/Se ratios and sulphide S isotopes studies, suggest that the mineralization in both the less and the pervasively hydrothermally altered clinopyroxenite samples of Overysel are of magmatic origin. This is further supported by the PPGE (Rh, Pt, Pd) concentrations in the BMS and mass-balance calculations, in both of which large proportions of the whole-rock Pd and Rh are hosted by pentlandite, whereas Pt and the IPGE (Os, Ir, Ru) were interpreted to mainly occur in discrete PGM. However, the presence of pentlandite with variable PGE concentrations on the thin section scale may be related to variations in the S content, already at S-saturation during magmatic formation, and/or post-solidification mobilization and redistribution.

1. Introduction

The PGE-mineralization of the Platreef is thought to be much more diverse and complex than that of the other two major PGE deposits in the Bushveld Complex of South Africa, the narrow stratabound Merensky reef and the UG-2 chromitite (e.g., [1,2]). For instance, recent studies revealed that the syn- and post-solidification of fluids, and the country-rock assimilation, played a decisive role in concerning the PGE-mineralization along the strike [3,4,5,6]. Furthermore, the mineralizations at the top and the base of the Platreef are inconsistent in grade and thickness along the strike. Nevertheless, the PGE concentrations hosted by base-metal sulphides (BMS) are in general agreement with those of the Merensky Reef and the UG-2 [7,8,9,10,11,12,13,
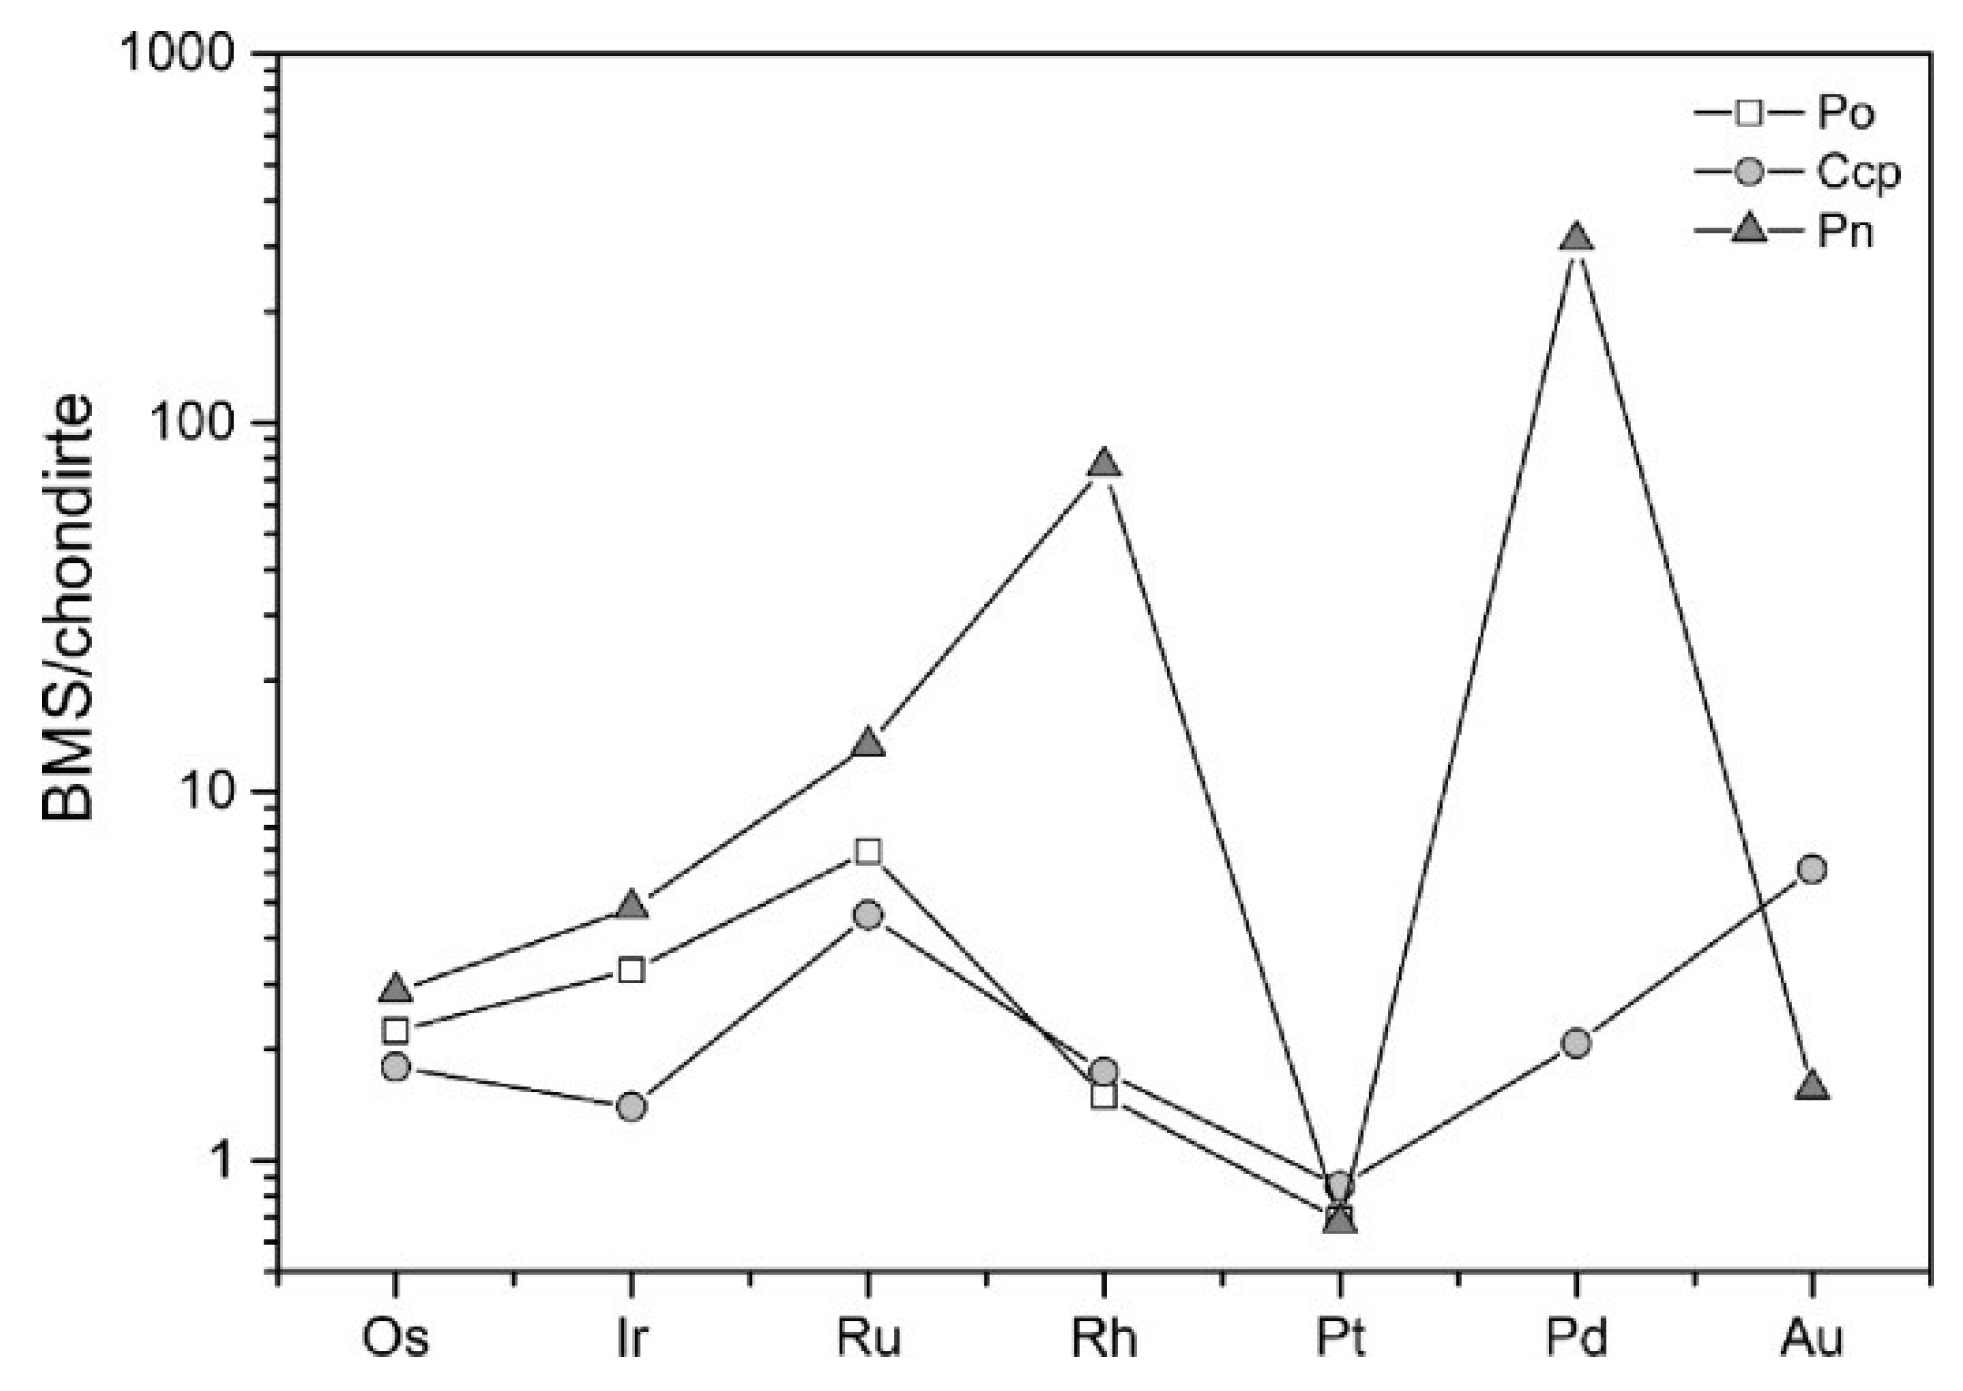
14]. Large proportions of the whole-rock Pd and Rh are hosted by pentlandite, while Pt and the IPGE (Ir, Ru, Os) mainly occur in platinum-group minerals (PGM), rather than being hosted by BMS. However, when comparing the Platreef’s pentlandite contents to those of the Merensky reef and the UG-2, the average Pd and Rh concentrations are distinctly lower in the Platreef [9,10,12,13,14].
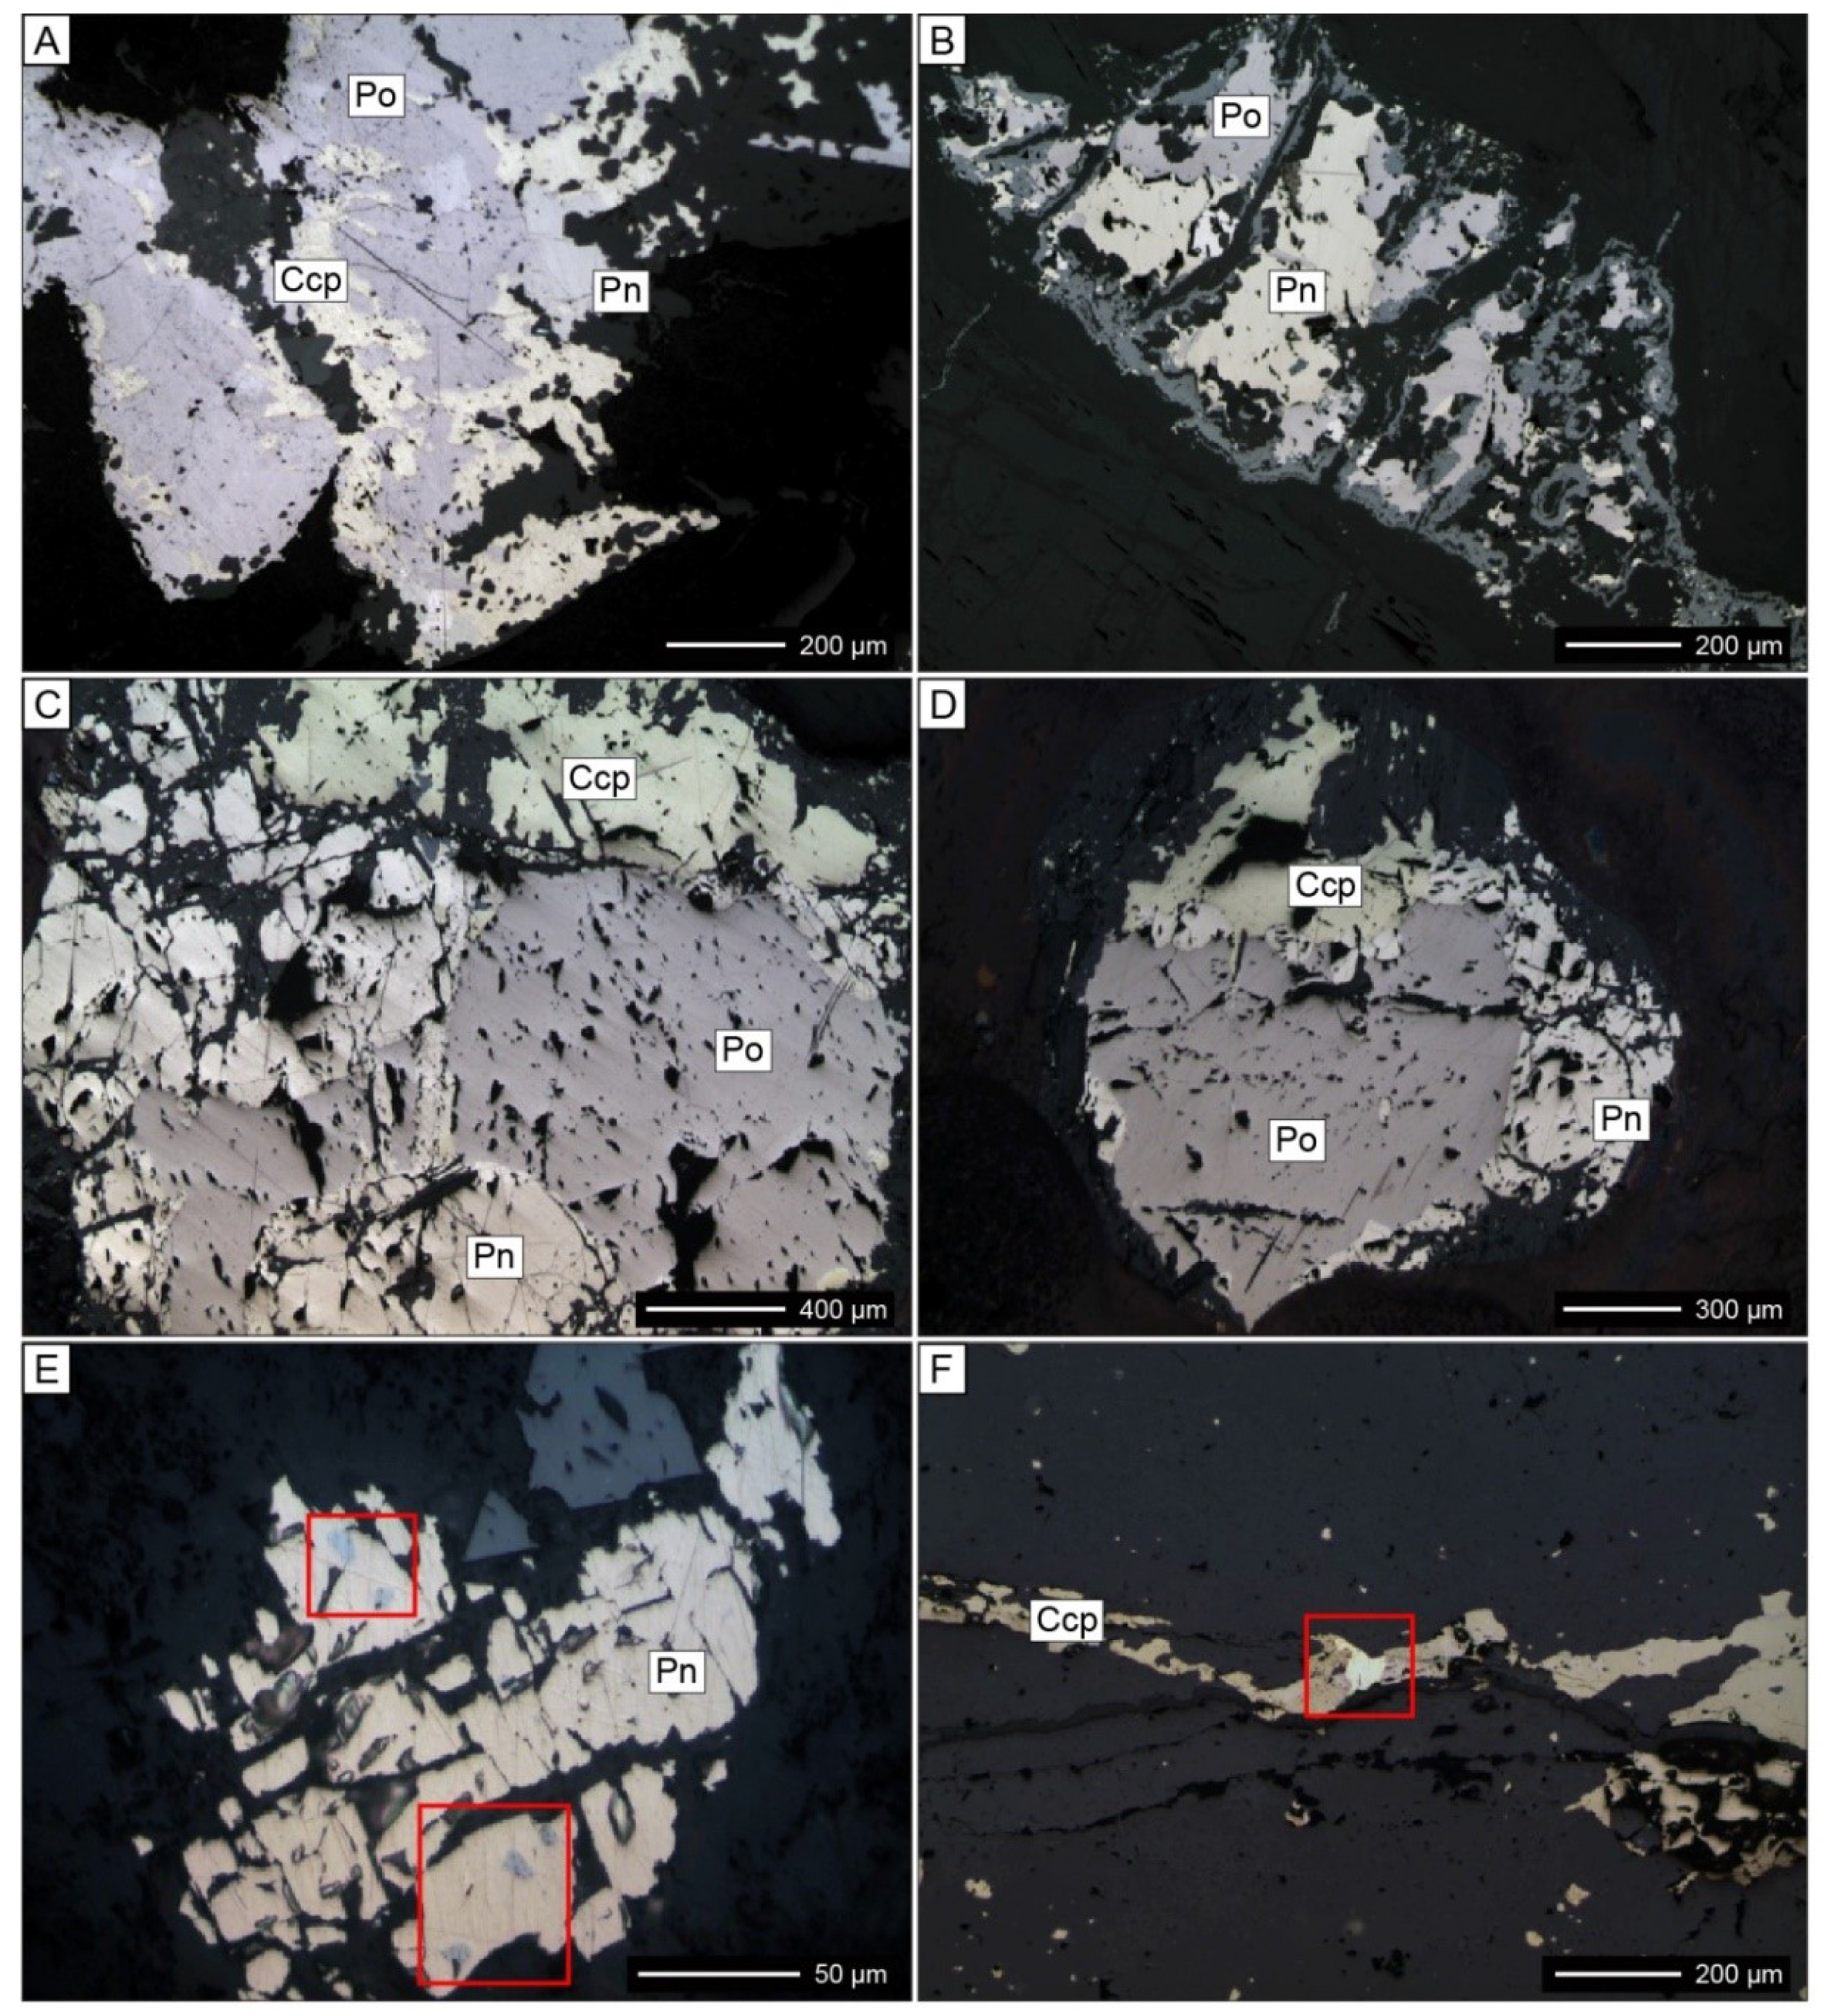
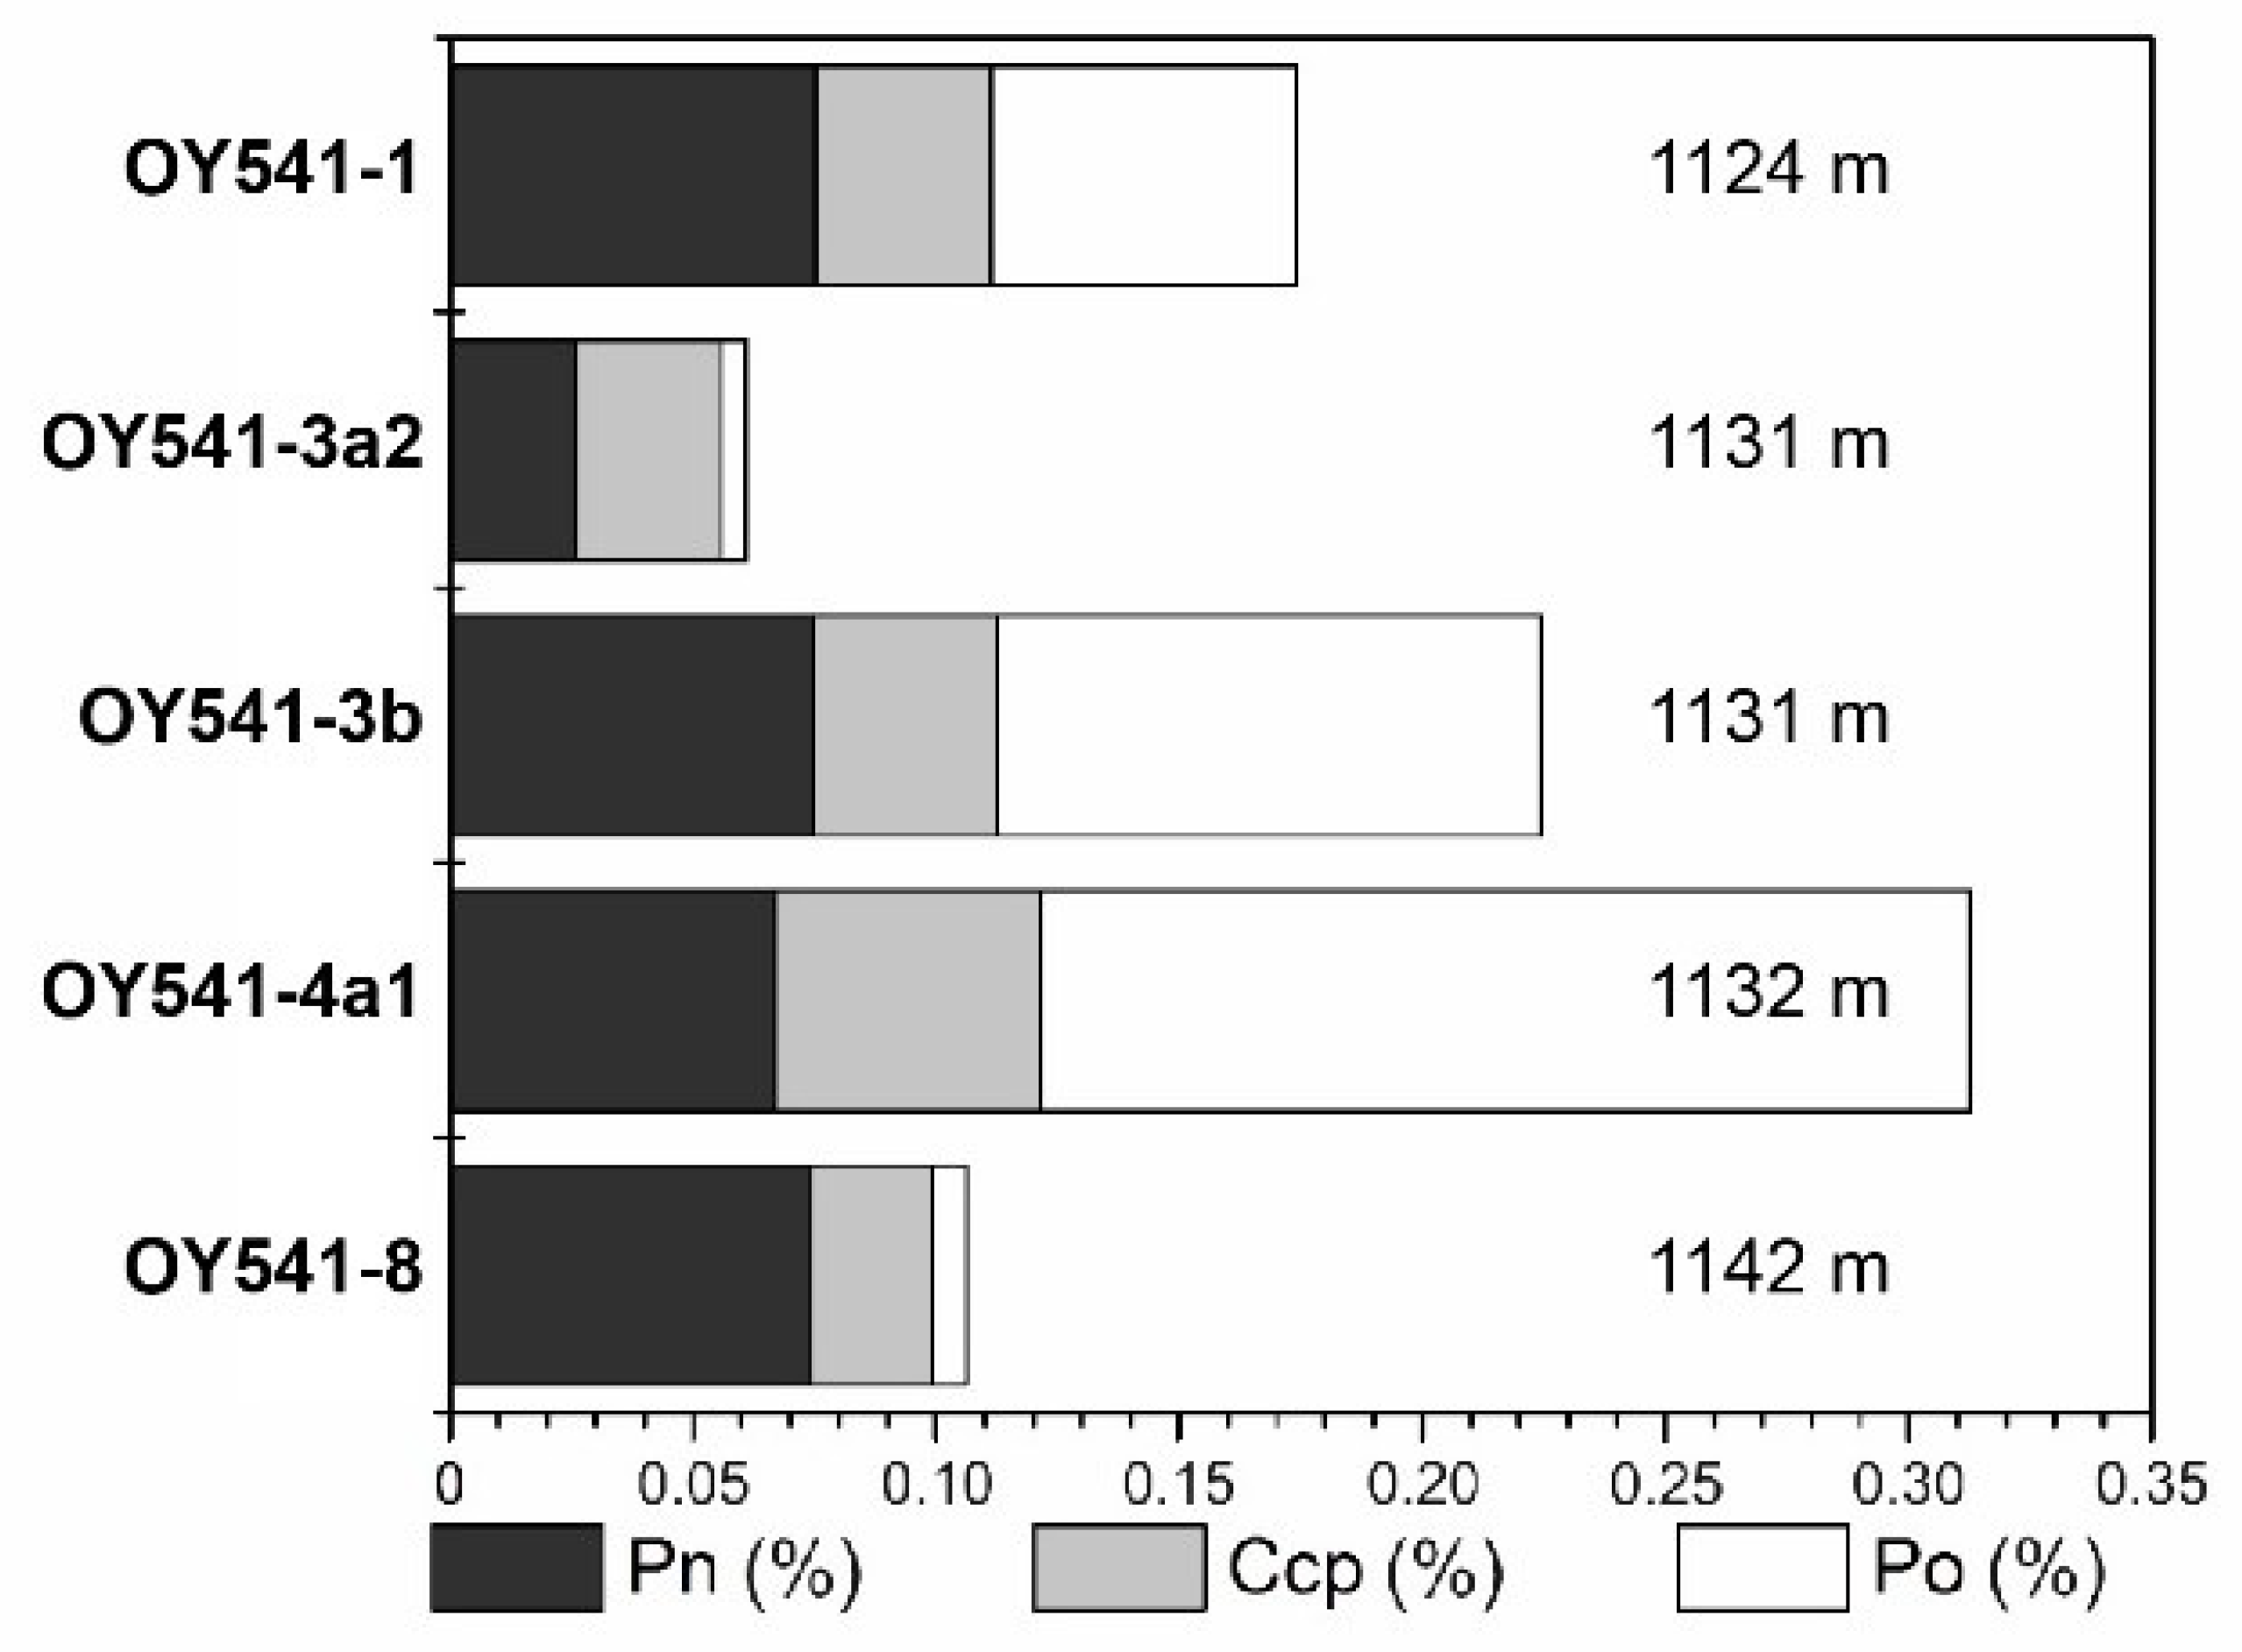
Pentlandite, pyrrhotite and chalcopyrite mostly occur as disseminated interstitial blebs, but in places also occur as massive sulphides or net-textured ores in the Platreef [5,15]. At the top of the Platreef, a magmatic origin of the stratiform mineralization, similar to that of the Merensky reef, seems to be confirmed by pyroxene mineral-chemistry, Re-Os and S-isotope studies (e.g., [12,16,17,18,19]). The mineralization of the footwall of the Platreef, which displays variable degrees of the incorporation, assimilation and reaction of the footwall lithologies with the basic magma, and pervasive hydrothermal alteration, also shows different degrees of redistribution and S assimilation [19,20,21,22,23,24,25,26,27].
Sporadic mineralization ranging, over tens of meters, also occurs in footwall lithologies such as clinopyroxenite (also called diopsidic clinopyroxenite or parapyroxenite) and serpentinite [15,
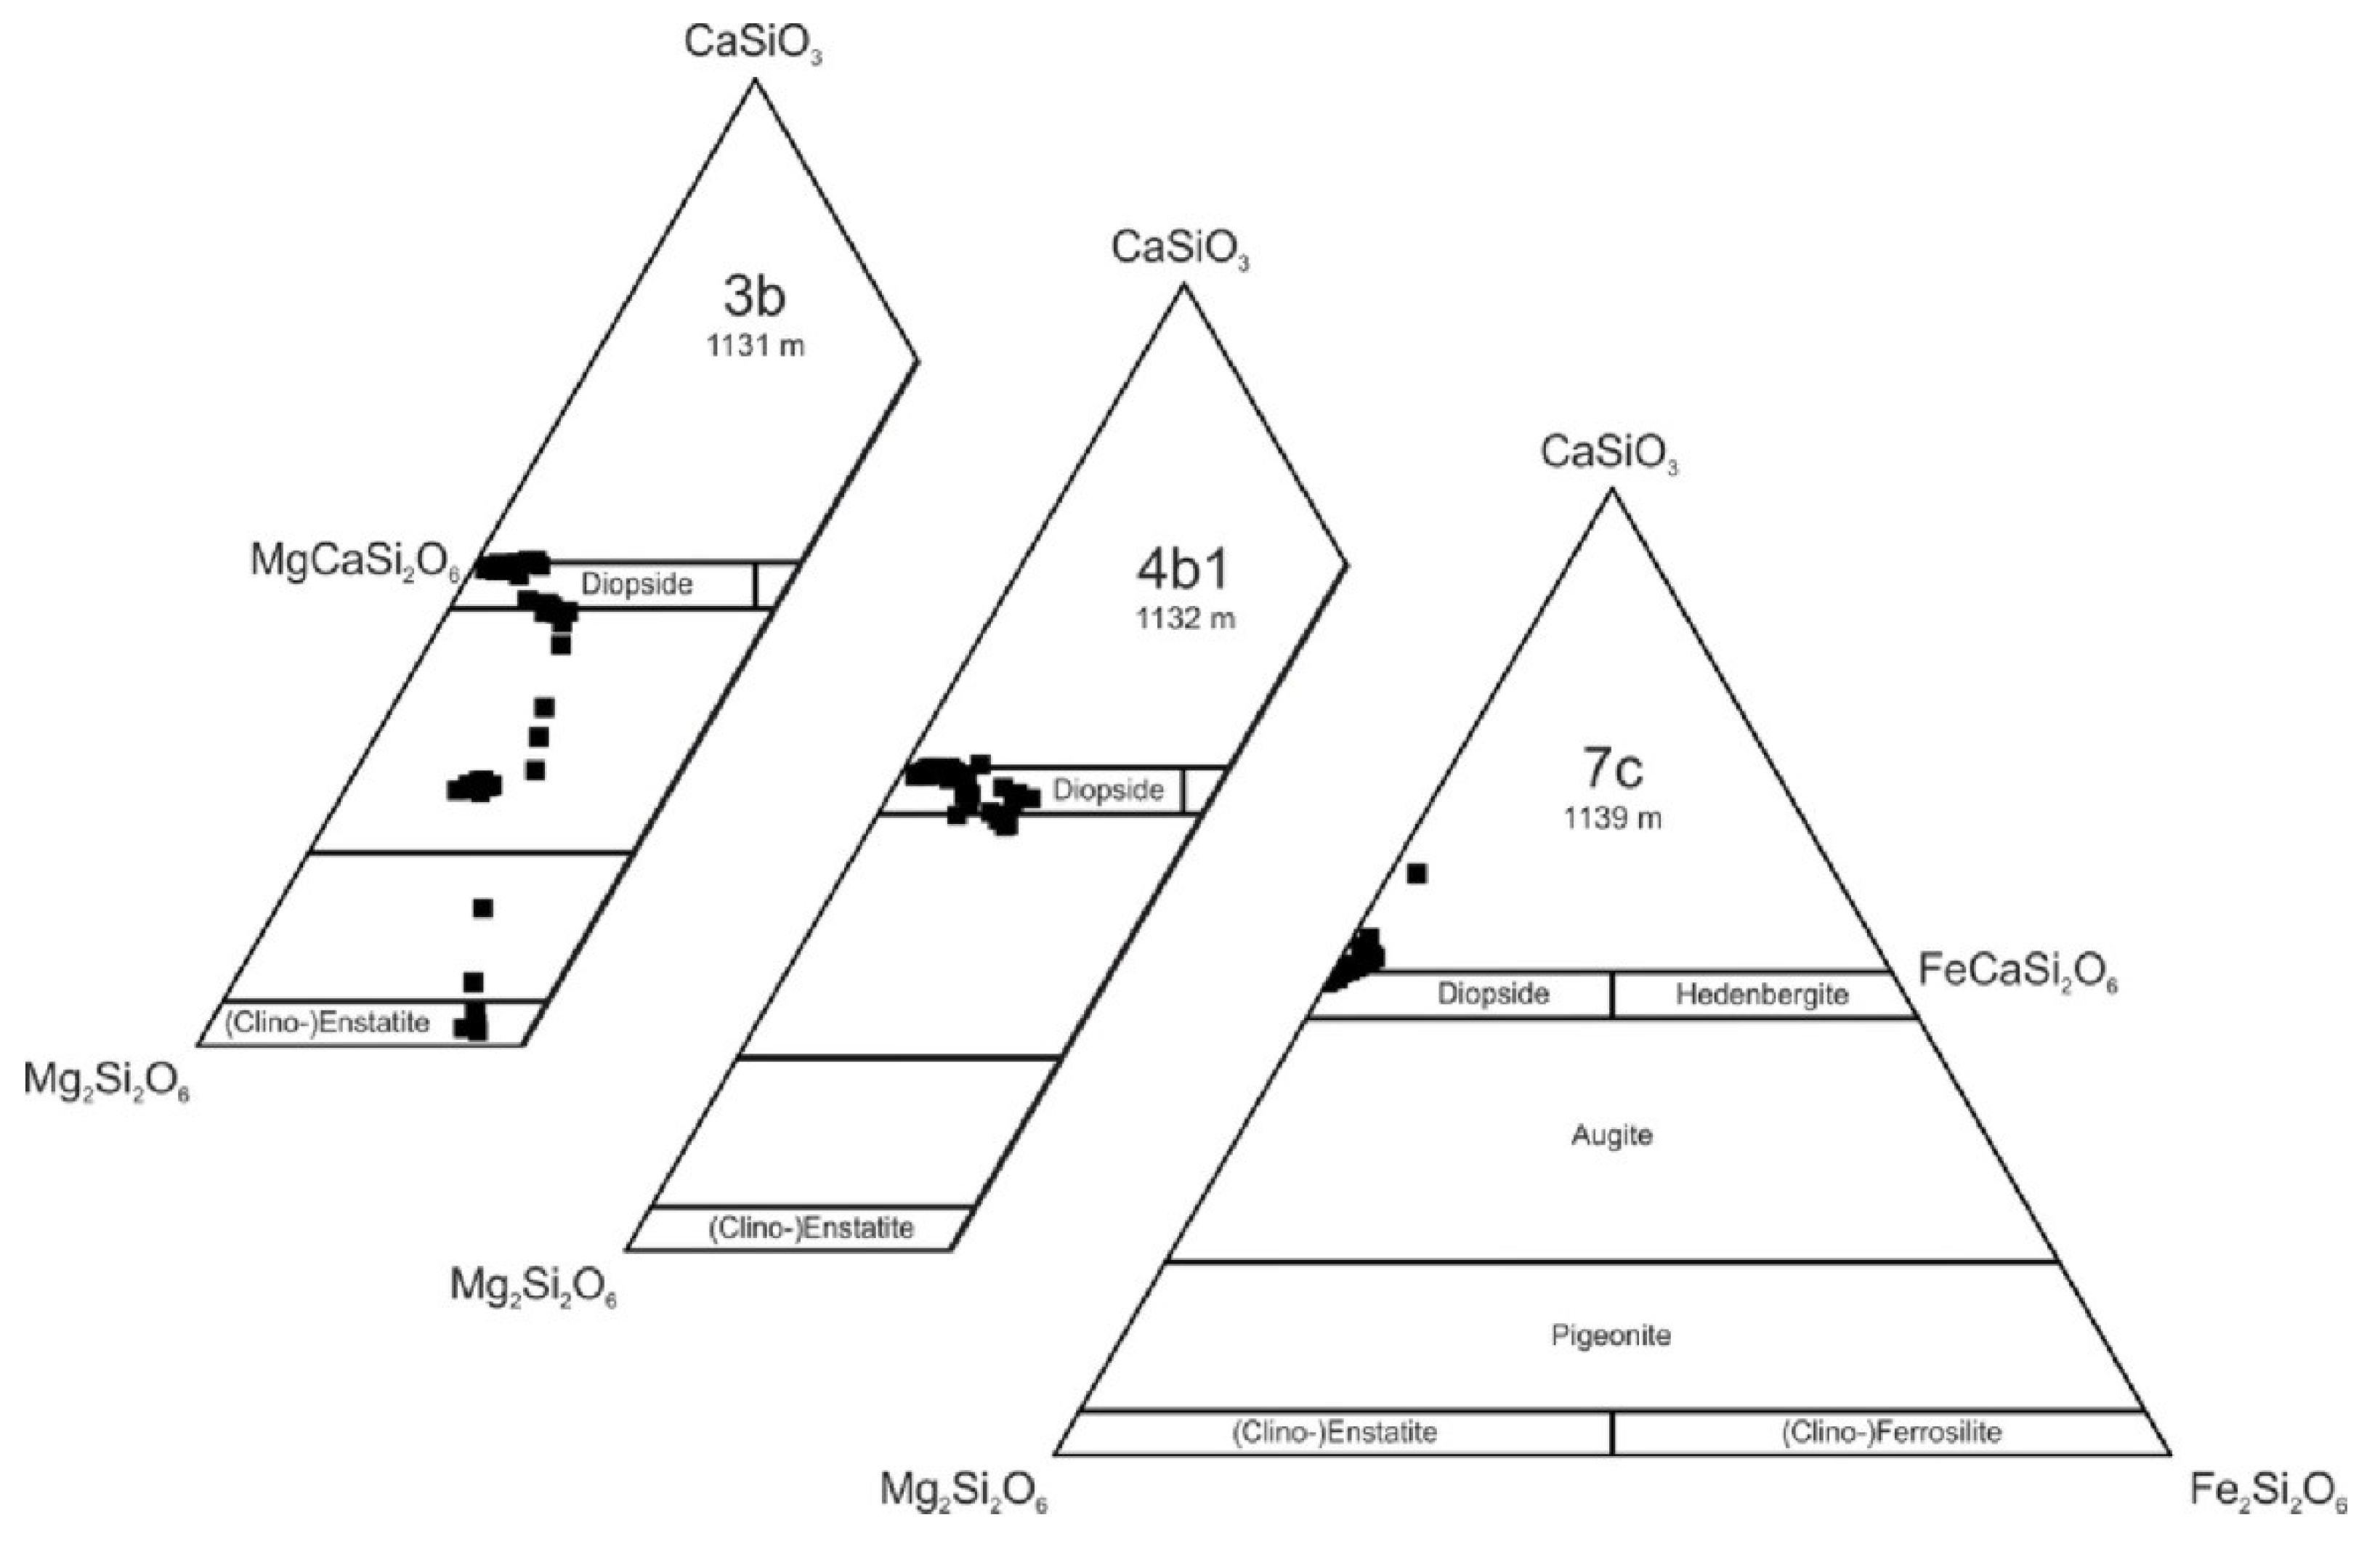
28]. The Platreef clinopyroxenites are diopside-rich calcsilicate rocks, which were interpreted to be of metamorphic/metasomatic origin [3,6,20]. The term clinopyroxenite is used throughout the paper for calcsilicate rocks of the drill core studied here.
Within the upper, unaltered sections of the Platreef, the PGE mineralization shows a close spatial association with the BMS, while conversely, within pervasively altered footwall rocks, the fluid–rock interaction was interpreted to display decoupling of the PGE from the BMS. Thus, low BMS contents associated with high PGE grades, and high BMS contents with low PGE grades, are currently explained by late-stage hydrothermal mobilization and redistribution of PGE (and/or BMS) throughout the footwall of the Platreef (e.g., [5,9] cf. [12,20,29]).
This investigation aims to provide new observations on the distribution and controls of PGE sulphide mineralization, developed within the footwall clinopyroxenite of the Platreef at Overysel, by using petrographical, mineral-chemical, whole-rock trace- and major-element, and sulphur- and neodymium-isotope, data. In addition, the findings are complemented by quantification of the composition of the associated BMS and their textural behaviour during these processes, which, in particular, has implications for the future exploration potential of the Platreef footwall rocks in the investigated area.

2. Geological Setting

The 2.054 Ga Bushveld Complex in South Africa represents the largest layered igneous complex in the world, covering an area >66,000 km2, and varying in thickness between 7 and 8 km [30,31,32,33,34]. The Bushveld Complex, which is located in the northern Kaapvaal Craton, consists of five limbs, namely, the western and eastern limbs, which are roughly symmetric, a largely eroded far western limb, a sediment-covered southern (Bethal) limb, and the northern limb [35]. The Bushveld Complex is further subdivided into the mafic rocks of the Rustenburg Layered Suite (RLS), the Lebowa Granite Suite, the Rashoop Granophyre Suite and the siliceous rocks of the Rooiberg Group [36,37].
The Bushveld Complex contains the world’s largest and economically most important resource of platinum-group elements (PGE), as well as other important elements, such as chromium, vanadium, copper and fluorine [30,38,39,40]. The economic PGE mineralization, which is hosted within the RLS, mainly occurs in three ore bodies; the thin (ca. 1 m thick) but extensive (>100 km strike length) Merensky reef, the UG-2 chromitite (with 5 to 8 ppm PGE), and the thicker (>30 m thick) Platreef, with 3 to 4 ppm PGE, which comprise the world’s three largest PGE ore horizons [35,41,42].
The RLS is usually subdivided into the Marginal, Lower, Critical, Main and Upper Zones, and the Basal Ultramafic Sequence [43]. This subdivision is also applied to the northern limb, but differs in several aspects. For instance, the Platreef was interpreted to represent a northern facies of the Merensky reef, or an analogue of the Critical Zone (e.g., [18,22,44,45,46,47,48]). Furthermore, it was suggested that the emplacement of the Main Zone magma, which is thought to have supplied Ni, Cu and PGE to the Merensky reef and the UG-2, in the northern Bushveld limb significantly post-dates the Platreef, and thus cannot have contributed Ni, Cu and PGE to the Platreef [49,50]. This seems to be in contrast with the eastern and western limbs of the Bushveld, where the Main Zone magma is thought to have been involved in the formation of the Merensky reef [51,52,53,54,55].
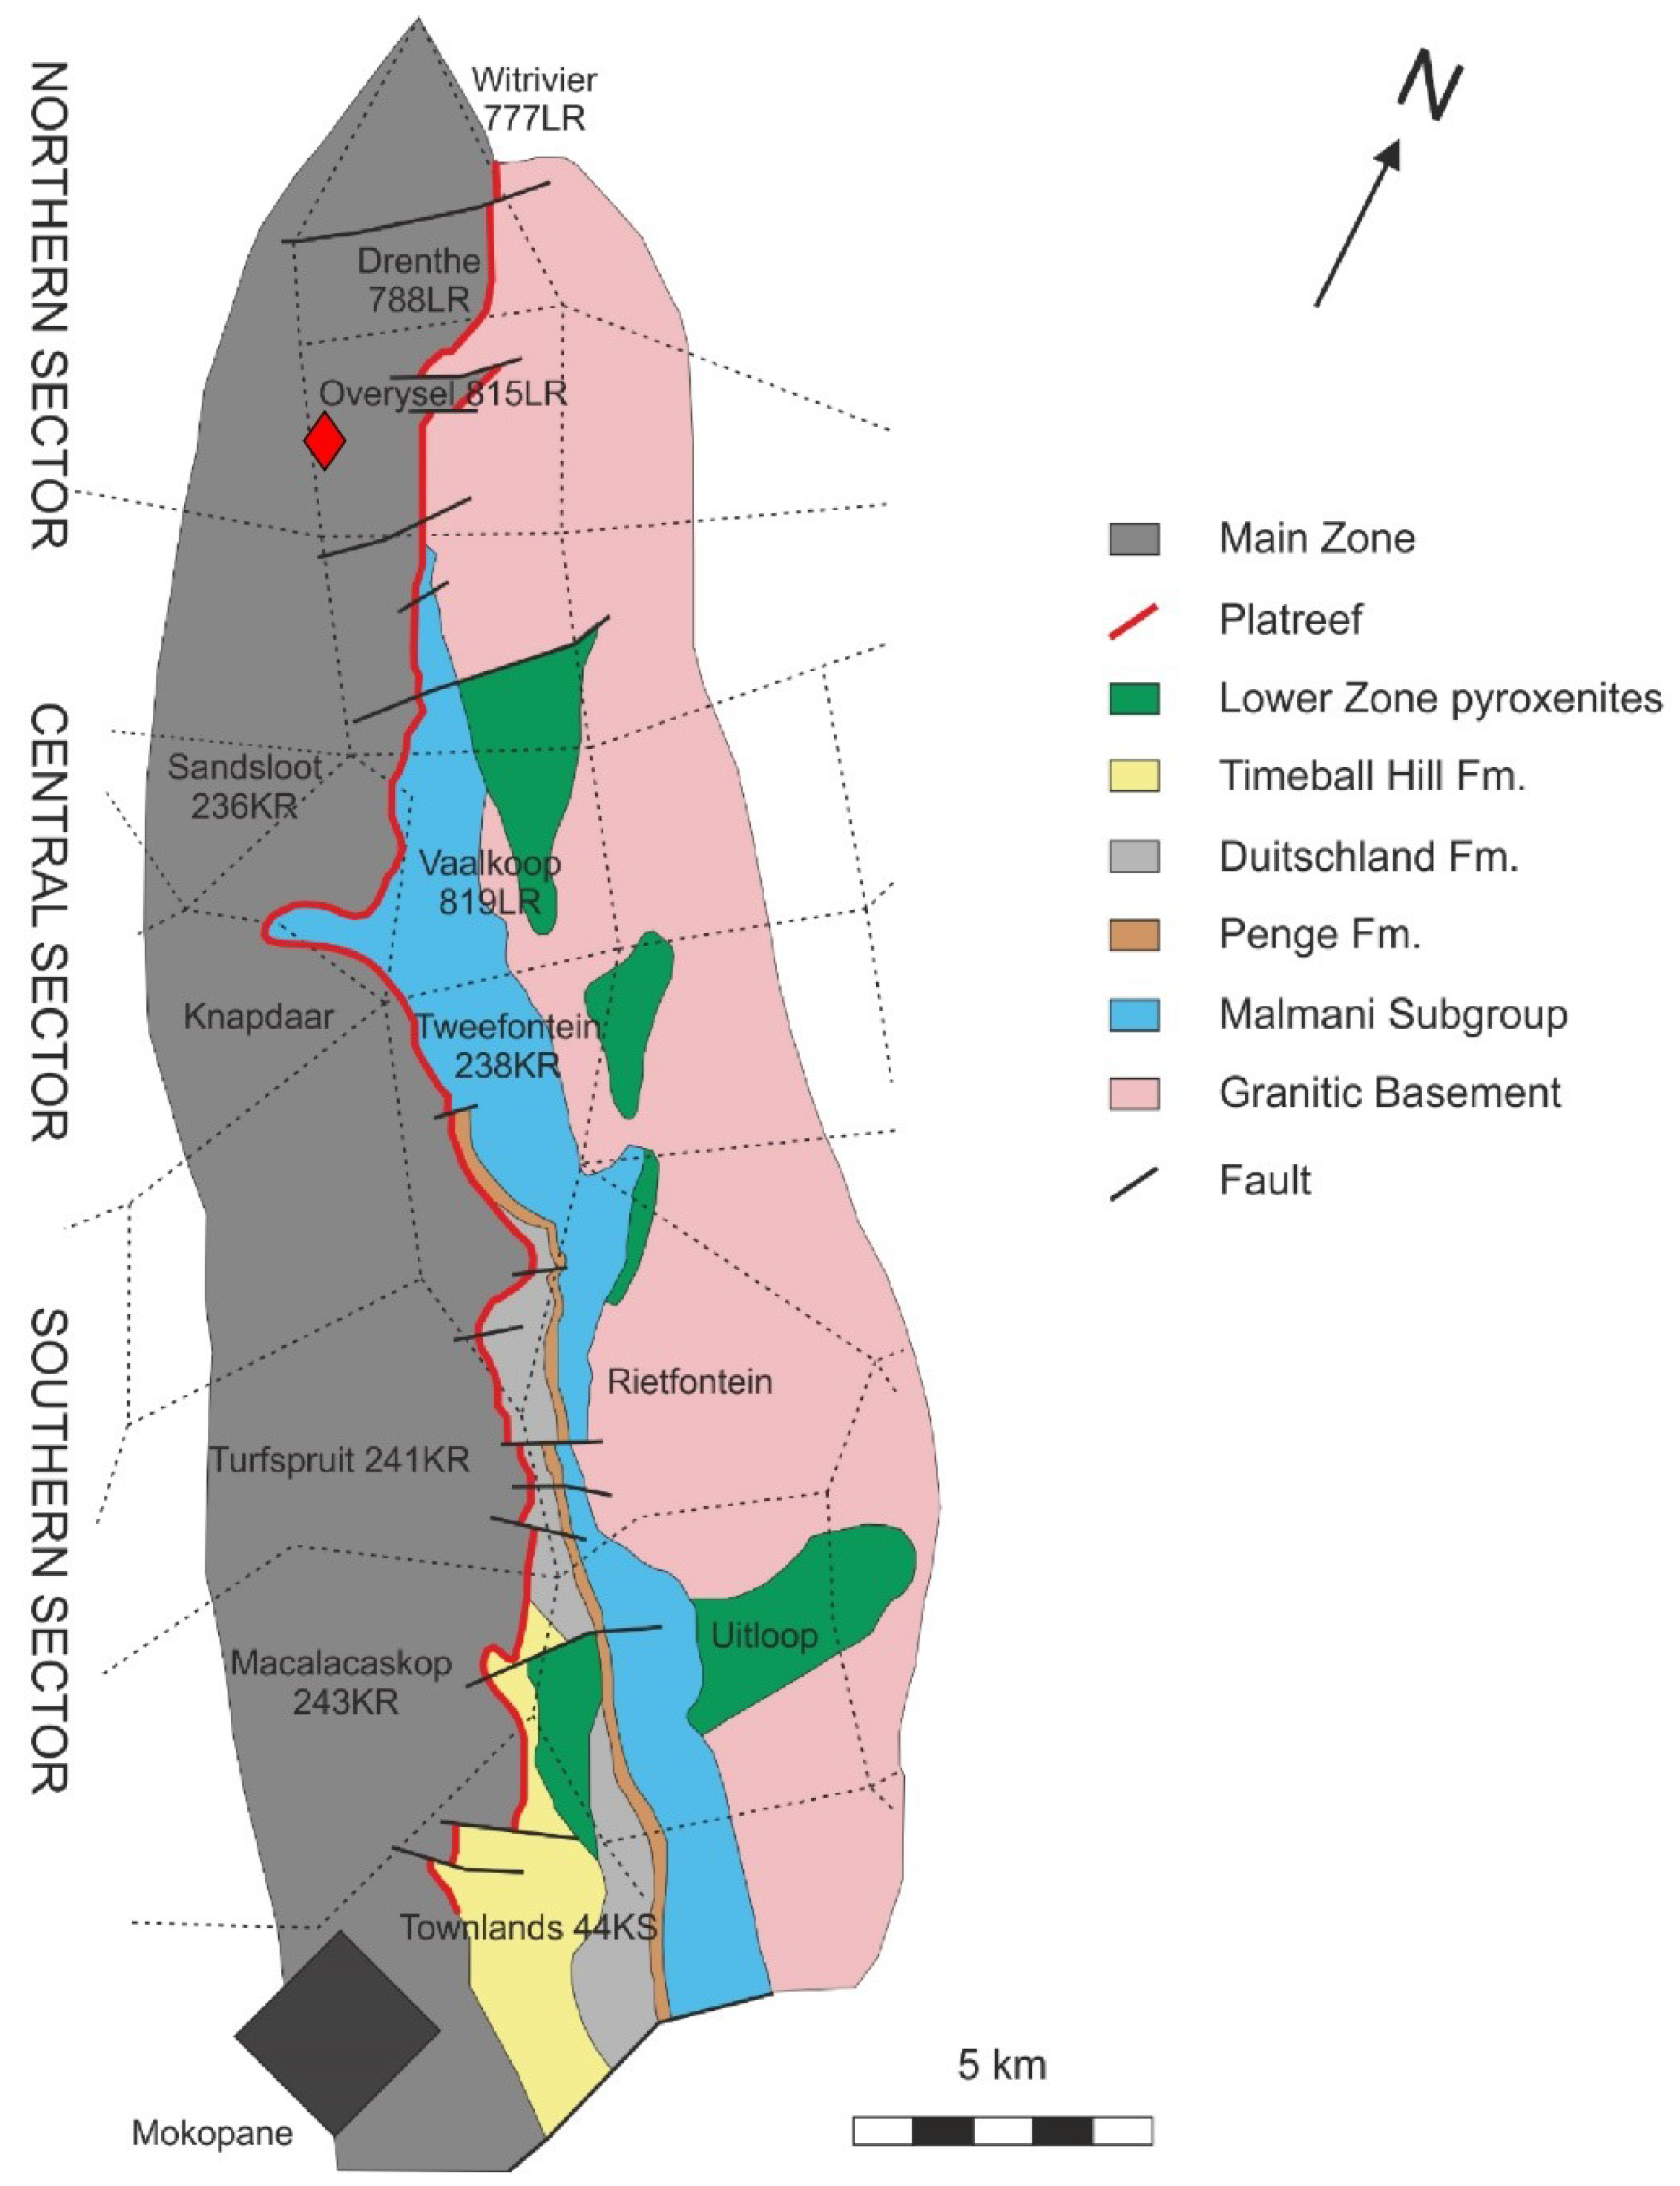
The northern limb of the Bushveld Complex is situated around 300 km NNW of Johannesburg. The 100-km long and 15-km wide sinuous outcrop (Figure 1) strikes N–S and dips ~WSW. The layered mafic rocks of the Platreef overlie a succession of progressively older sedimentary suites of the Transvaal Supergroup and Archean basement, comprising basement granites and gneisses [20,48,56].
The thickness of the Platreef varies, from 30 m up to 400 m [15,22]. It is interpreted to represent a sill or complex that intruded as a crystal mush into the basement granite–gneiss and sediments of the Transvaal Supergroup (e.g., [28]). The Platreef is further subdivided based on the variation of the footwall lithologies along the strike (Figure 1): (a) a northern sector underlain by an Archean granite basement on the Overysel and Drenthe farms; (b) a central sector with Malmani Dolomite as footwall on the Zwartfontein, Sandsloot, Vaalkop and Tweefontein farms; and (c) a southern sector comprising Transvaal shale, banded ironstone, mudstone and siltstone as footwall rocks, reaching from Tweefontein Hill to Townlands [22]. Recently, several Main Zone Ni-Cu-PGE magmatic sulphide deposits, like Aurora, Waterberg and Moordrift, were discovered in the northern Bushveld limb [29,51,54,57,58,59,60]. One of the most significant discoveries has been the down-dip extension of the Platreef (called Flatreef) at Turfspruit, which was interpreted to be related to the Critical Zone of the western and eastern limbs of the Bushveld Complex [44].
Detailed descriptions of the Platreef lithologies are given in Armitage, McDonald, Edwards and Manby [15]; Harris and Chaumba [3]; Kinnaird, Hutchinson, Schurmann, Nex and de Lange [22]; McDonald, Holwell and Armitage [62]; Holwell, McDonald and Armitage [20]; Kinnaird, Yudovskaya, McCreesh, Huthmann and Botha [58]; McDonald, Harmer, Holwell, Hughes and Boyce [54] and Grobler, Brits, Maier and Crossingham [44]. The footwall lithologies beneath the primary igneous Platreef at Overysel comprise Archean gneiss, banded granulite (local term: granofelses), footwall clinopyroxenite (historically called parapyroxenite), calcsilicate rocks, dolomite and serpentinite. The Platreef contains >4 g/t PGE where the footwall is made of Malmani Dolomite, and 1 to 2 g/t elsewhere, with sporadically elevated values up to 10 g/t [5]. The clinopyroxenites are described to occur in the footwall of the Platreef below the igneous pyroxenites and above the Malmani Dolomite, and comprise diopside and bulk-rock Cr contents of <2000 ppm, while the igneous pyroxenite mainly consists of orthopyroxene and cumulus Ca-poorer clinopyroxene, and contains bulk-rock Cr contents of > 2000 ppm, according to the definitions of Harris and Chaumba [3], Armitage, McDonald, Edwards and Manby [15], and Holwell, McDonald and Armitage [20]. The actual calcsilicate rocks or xenoliths within the Platreef, however, are described as a mixture of dolomite and igneous reef pyroxenites, and have lower SiO2 (<40 wt %), lower FeO/MgO, and (much) higher CaO/MgO than the non-igneous clinopyroxenites [3]. Most of these lithologies underwent, or were the product of, thermal metamorphism and hydrothermal alteration, as well as sediment assimilation, which was thought to have led to a significant change in the bulk-rock chemistry and thus mineralogy of the footwall rock types. However, the exact cause of the post-magmatic processes, and the impact on the primary igneous mineralization, is still a matter of discussion [3,5,15,18,19,49]. In order to understand the nature of these processes and their influence on the sulphide-associated PGE mineralization of the clinopyroxenites, the present study is focused on characterizing the mineralization within drill core clinopyroxenite samples from Overysel.

3. Samples and Analytical Methods

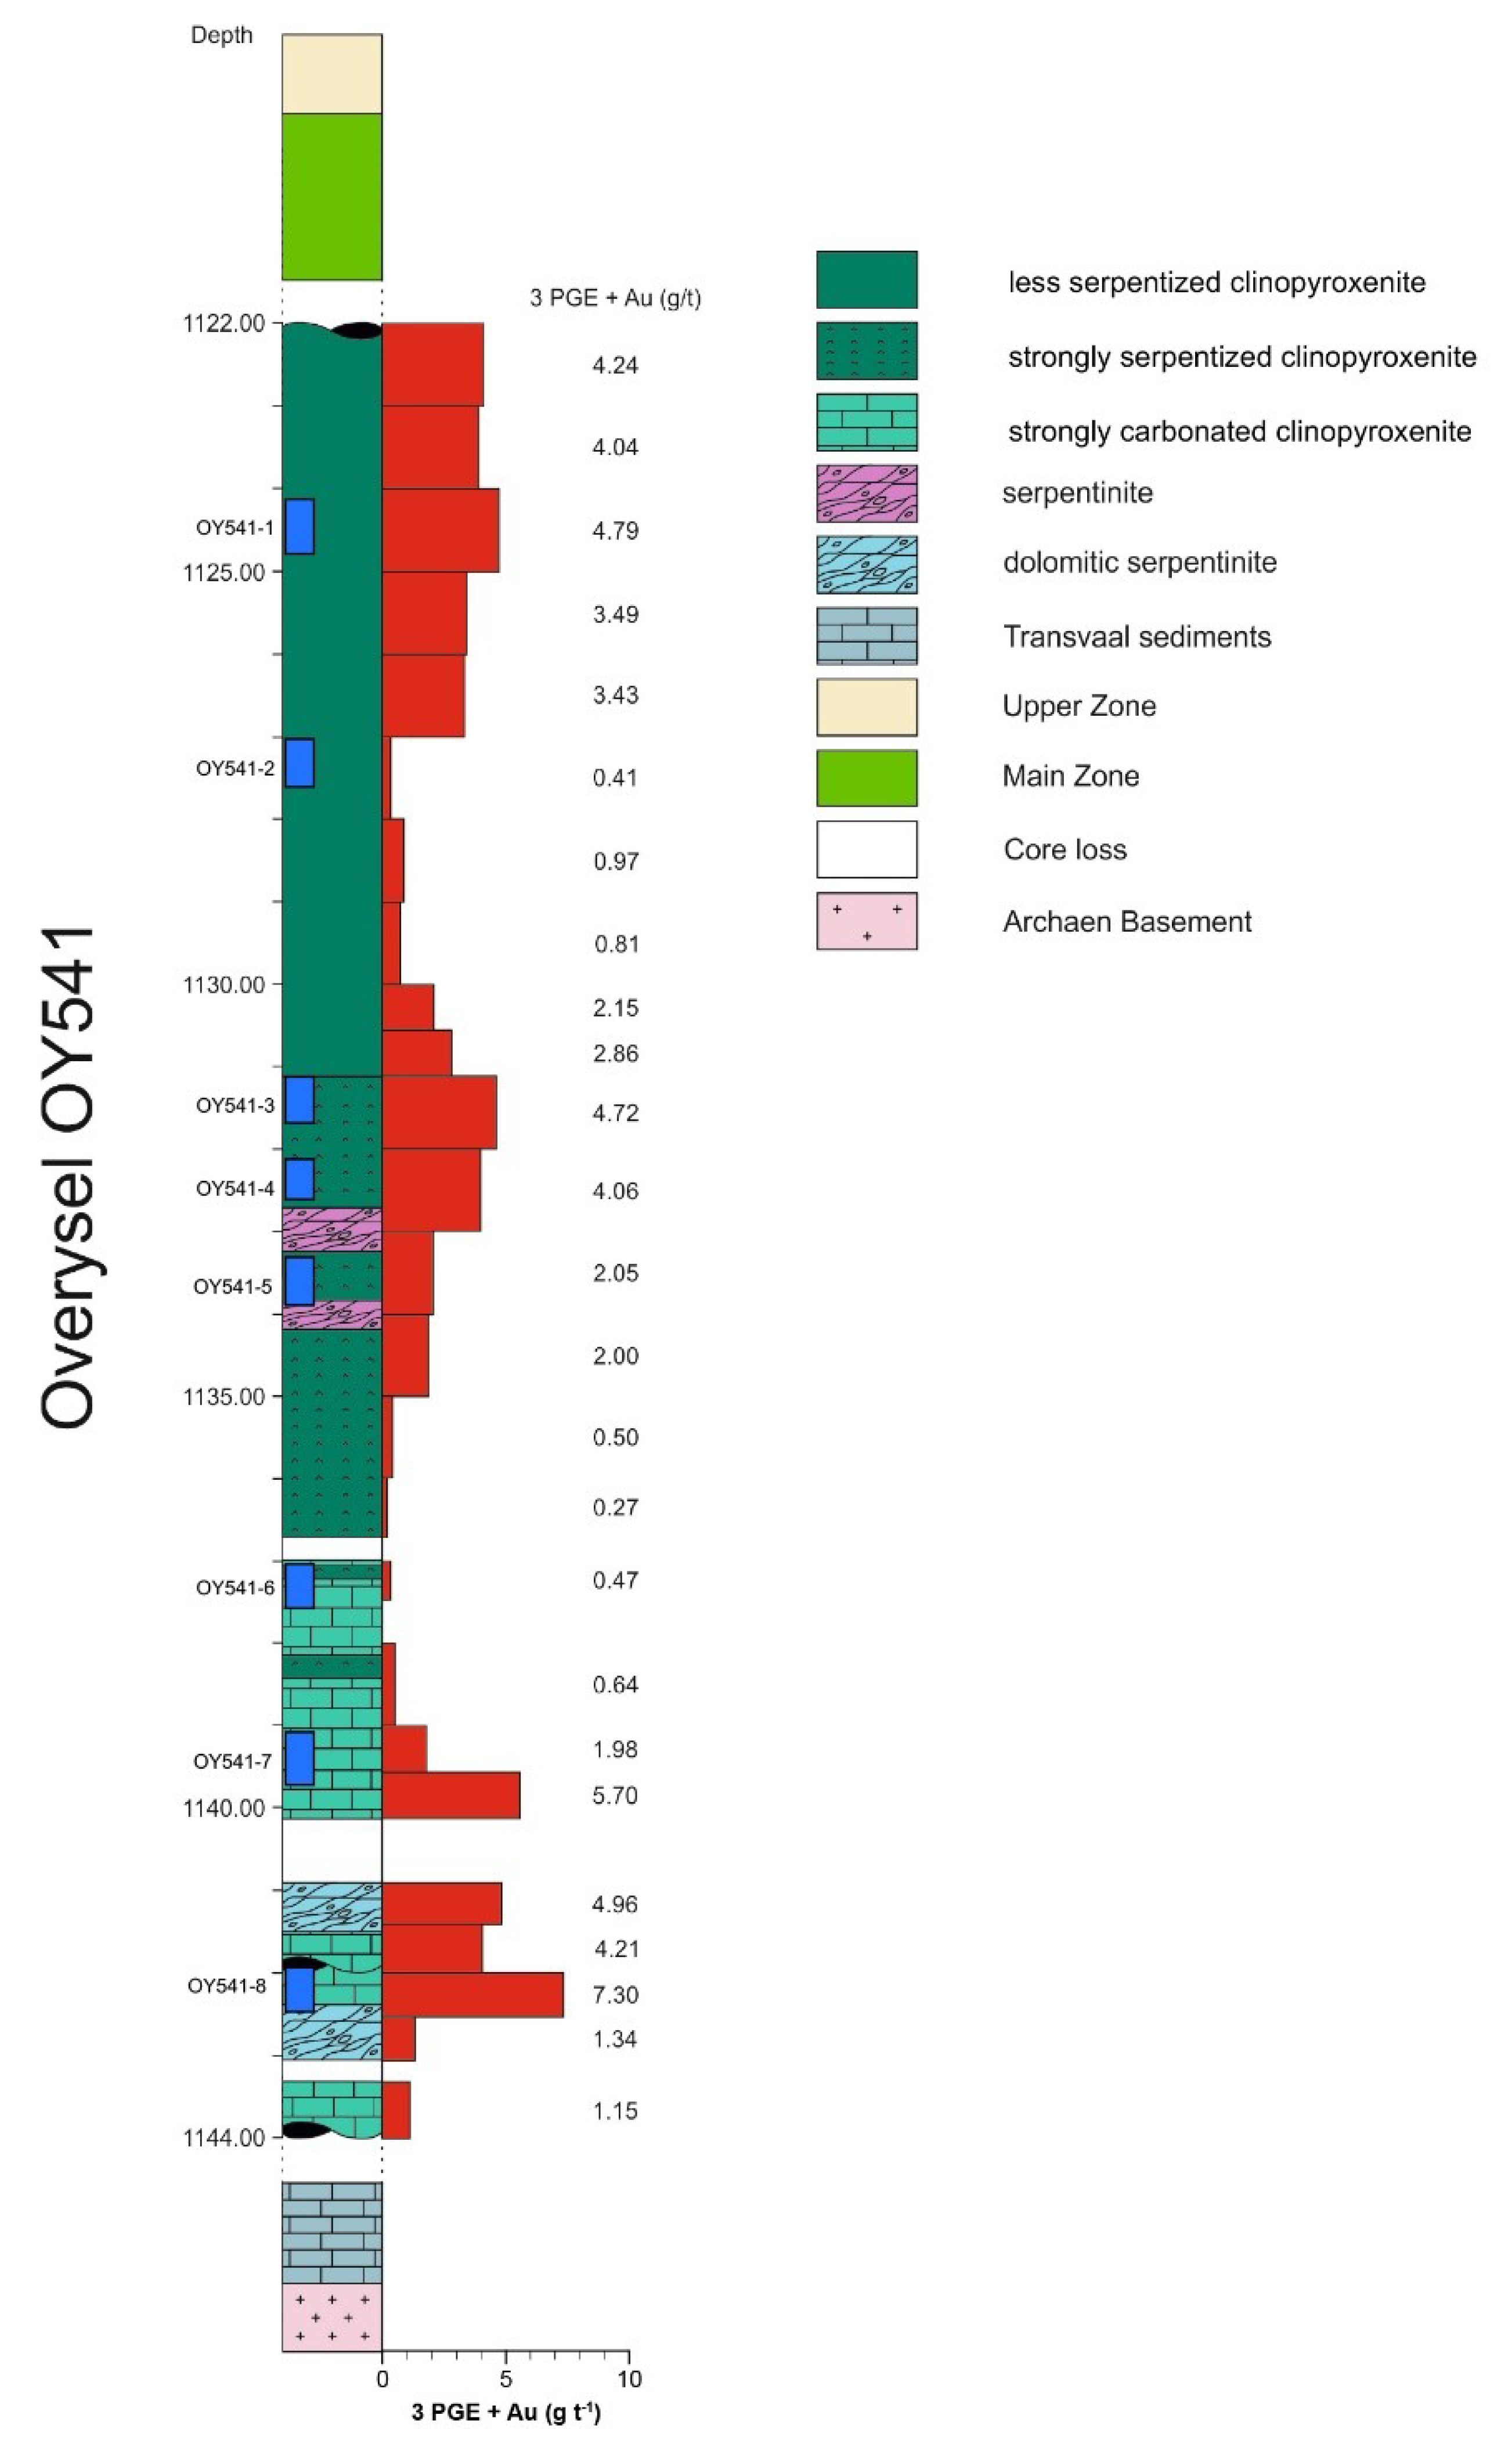
A total of 54 samples for this study were collected from two drill cores of OY541 at Overysel 815LR (Anglo American Platinum), with corresponding coordinates referring to the WGS84 (South African Grid) Lo.29 grid (X: 50187.18; Y: 13091.78). Drill core OY541 was chosen for the present study, because it covers a typical section of clinopyroxenite between the magmatic Platreef and Malmani Dolomite (Figure 1) [6]. Preferably high-grade samples were chosen for the present study.
A total of 16 representative clinopyroxenite drill core samples were analyzed for bulk-rock Pt, Pd, Au and S, as well as major and trace-element contents (Table 1). All analyses were done by ACTLABS (Canada), using fusion coupled ICP-MS and combined fire assay ICP-MS methods. Major elements were determined with analytical uncertainties of less than 5%. Trace elements were analyzed with analytical uncertainties of mostly less than 10%.
Scanning electron microscope (SEM) investigations, which were primarily used for the detection and semi-quantitative analyses of PGM, were undertaken at the Bundesanstalt für Geowissenschaften und Rohstoffe (BGR) in Hannover, Germany, using a MLA 650F SEM (FEI Company, Hillsboro, OR, USA).
Quantitative mineral chemical analyses of sulphides and pyroxenes (Table 2 and Table 3) were carried out on three polished thin sections and five polished ore sections, using a JEOL JXN-8200 electron microprobe (EMP) at the GeoZentrum Nordbayern, University of Erlangen. The JEOL JXN-8200 was operated with an acceleration voltage of 20 kV, a 3-µm beam diameter and a probe current of 20 nA (for further analytical details see [13]).
Neodymium isotope (CHUR) measurements and Sm and Nd concentrations were determined in Class 1000 metal-free laboratories at the GeoZentrum Nordbayern. For Nd isotope measurements (Table 4), approximately 100 mg of sample powder was digested in 0.5 mL 15 M HNO3 and 2 mL 12 M HF in sealed Teflon beakers overnight at 80 °C. A quantity of 0.2 mL of HClO4 was then added to the sample solution, which was evaporated to near dryness at 130 °C. The sample was taken up in 2 mL 15 M HNO3, and evaporated to complete dryness at 150 °C. This step was repeated 3 times, until the sample was completely in solution, before redissolving the sample in 2 mL 3.5 M HNO3. The rare-earth elements were separated from the rock matrix using 0.2 mL of Eichrom TRU-spec resin. The sample in 3.5 M HNO3 was loaded onto the resin, which was washed 3 times with 2 mL 3.5 M HNO3 to remove major elements, and the rare earth elements (REE) were selectively eluted with 2 mL 2.5 M HCl. This solution was evaporated, the residue redissolved in 0.5 mL 0.25 M HCl, and Nd was then separated from the other REE using 1.5 mL Eichron LN-spec resin in 0.25 M HCl. All reagents used were Teflon distilled, and the Nd blank was below 20 pg.
Nd isotope measurements were carried out using a Thermo Triton thermal ionization mass spectrometer in static mode. Nd was loaded in 3 µL 0.1 M H3PO4 onto the Ta filament of a double Ta-Re filament assembly and analyzed as the metal. Interference of 144Sm on 144Nd was corrected for by measuring 147Sm, but was negligible for all samples. Instrumental mass fractionation was corrected for, assuming a 144Nd/146Nd ratio of 0.7219. An in-house Nd standard yielded 143Nd/144Nd = 0.511541 ± 0.000008 (n = 6), equivalent to 0.511852 for the La Jolla Nd standard.
Sm and Nd concentrations were measured on a separate dissolution of rock powder using a Thermo Scientific X-Series 2 quadrupole inductively coupled plasma mass spectrometer. Approximately 0.05 g of sample was accurately weighed into a Teflon beaker, and digested in 1 mL 15 M HNO3 and 3 mL 12 M HF for 12 h in sealed beakers on a hotplate at 80 °C. After cooling, 0.2 mL of HClO4 was added to the sample, and the solution evaporated to incipient dryness at 120 °C. 2 mL of 15 M HNO3 was added to the sample, and evaporated to near dryness, and this step was repeated twice before increasing the hotplate temperature to 150 °C and fuming off excess HClO4. The sample was then redissolved in 4 mL 15 M HNO3 and 4 mL H2O, 2 drops of 12 M HF were added, and the sealed beakers left on a hotplate at 80 °C for 12 h. The samples were then placed in an ultrasonic bath for 30 min, before heating at 80 °C for another 12 h. At this stage, all samples were completely in solution. The sample solutions were then quantitatively transferred to 250 mL HDPE bottles and diluted to 200 g with MQ water to obtain a final solution of 2% HNO3 + 0.002 M HF with a sample dilution factor of about 4000 and total dissolved solids of 250 µg/mL. All reagents used were distilled in Teflon stills, and diluted with MQ 18.2 MΩ water. Sample solutions were introduced into the ICP-MS through a Cetac Aridus 2 desolvating nebulizer system in order to reduce molecular interferences. An ESI SC-2 DX FAST autosampler was used to reduce washout times between samples. The instrument was tuned using a 5-ppb solution of Be, In and U; the typical sensitivity for 238U was 2 × 10⁶ counts per second for a sample uptake rate of 50 µL/min. The Ce/CeO ratio was typically > 4500. The instrument was calibrated using multielement solutions covering the relevant concentration range. A mixed Be, Rh, In and Bi solution (30, 10, 10 and 5 ppb) was mixed with the sample online and these elements used as internal standards to correct for instrumental drift. Procedural blanks analyzed during this work were negligible for all elements measured. The uncertainty for Sm and Nd concentrations is typically 2–5%, and the uncertainty for the Sm/Nd ratio approximately 1% based on repeated analysis of standards. The initial Nd isotope ratios in Table 4 were calculated assuming an age of 2.061 Ga, using the 147Sm/144Nd ratios for individual samples determined by quadrupole ICP-MS. Errors on the initial Nd isotope ratios in Table 4 are calculated by propagating errors on both 143Nd/144Nd and 147Sm/144Nd through the age correction. For more analytical details see [63].
Trace-element concentrations of BMS were conducted by LA-ICP-MS at the GeoZentrum Nordbayern (Erlangen, Germany) using an Agilent 7500c Q-ICP-MS equipped with an UP 193nm FX New Wave Research Excimer Laser. The concentrations of the PGE (99Ru, 101Ru, 103Rh, 105Pd, 108Pd, 189Os, 193Ir, 195Pt) as well as 197Au, 107Ag, 185Re, 59Co, 60Ni, 61Ni, and 63Cu in BMS were determined by in situ spot analyses on sulphides in three polished thin sections and five polished ore sections. He and Ar functioned as carrier gas with a flux of 0.9 l/min. The plasma power was 1100 W and Ar was used as plasma gas with a flux of 14.9 l/min. Measurements were undertaken with a repetition rate of 19 Hz for 25 s after a background scanning for 20 s. The laser energy settings are configured at 0.45 GW/cm2 (fluence: 2.24 J/cm2). Beam diameters were varied between 15 µm and 50 µm depending on grain size. External standard materials include PO724 B2 SRM (Sulphide-standard Memorial University Newfoundland), (Fe,Ni)1-xS [64] and Mass1 (USGS) for BMS. S was analyzed by EMP and was used as internal standard for sulphide analysis. Reproducibility for SRM was <9% and the accuracy, tested by ablating the PGE SRM FeNiS standard, was <15%. The data were processed using GLITTER 4.4.4 software (Macquarie Research Ltd., Sydney, Australia, 2000). Detection limits for the analyses of sulphide minerals are given in Table 5. Various interferences caused by the carrier and plasma gas Ar lead to falsified results for Ru, Rh and Pd, if not corrected. 99Ru is interfered by 63Cu36Ar and 59Co40Ar, 101Ru by 63Cu38Ar, 65Cu36Ar and 61Ni40Ar, 103Rh by 63Cu40Ar, 65Cu38Ar and 67Zn36Ar, 105Pd by 65Cu40Ar and 108Pd by 68Zn40Ar. 108Pd is additionally interfered by 108Cd. Due to the extremely low relative isotope abundance of 36Ar (0.337%) and 38Ar (0.063%), their effect on 99Ru, 101Ru and 103Rh is negligible. Only a few counts per second for Zn were recorded for the sulphides in this study, thus excluding a significant influence. However, a remarkable impact occurs for CuAr on 103Rh and 105Pd when analyzing chalcopyrite. The argide-unaffected 108Pd for chalcopyrite was used, which nonetheless required a correction for the elemental interference from 108Cd. A PGE-free hydrothermal chalcopyrite was analyzed to check the 63Cu40Ar and the 65Cu40Ar production. Since the interference of 61Ni40Ar lead to an overestimation of 101Ru in pentlandite, 99Ru was used instead to obtain the correct concentration. Numerous measurements of pentlandite yielded ~0.5 ppm as the lowest concentration for Ru, indicating that this value solely originated from the Ni-argide. This concentration was always within the 1σ error margin for every analysis.
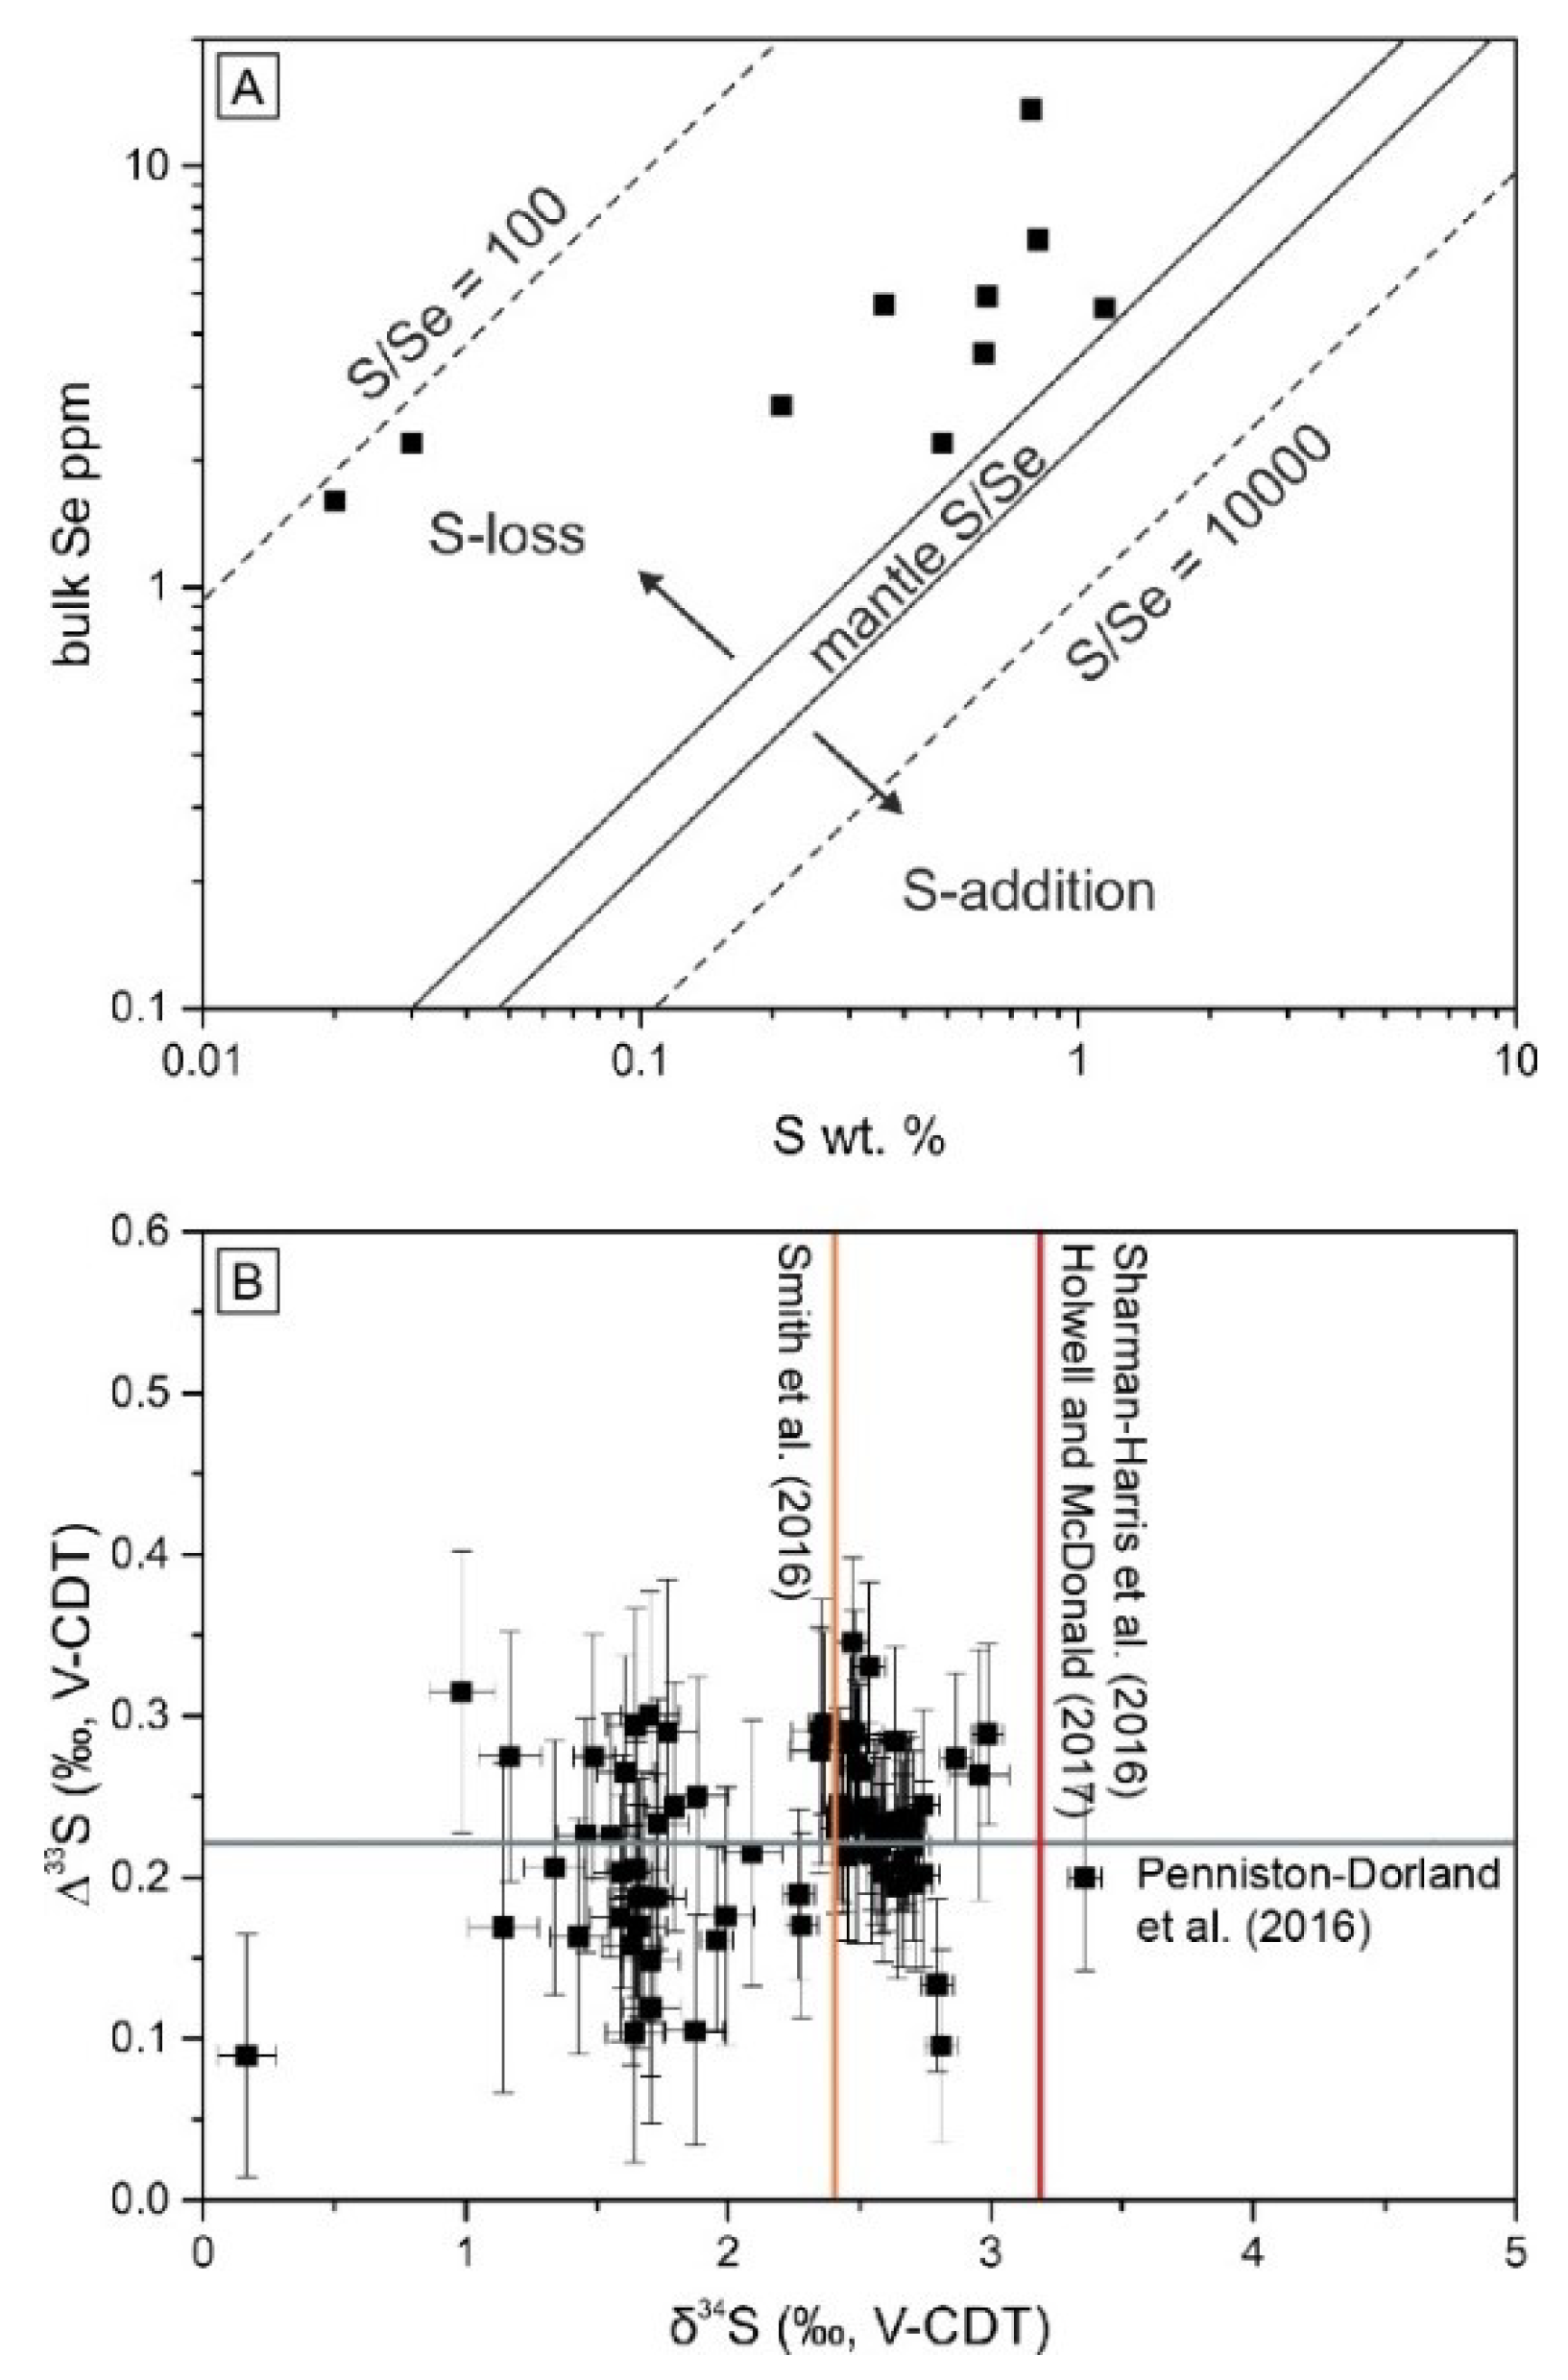
In situ quadruple sulphur isotope ratios (V-CDT) were measured using a CAMECA IMS1280 large-geometry ion microprobe at the Center for Microscopy, Characterization and Analysis (CMCA), The University of Western Australia (Table 6). The ion microprobe was operated in multicollection mode using a Cs+ primary beam with an intensity of ~3–4 nA in Gaussian mode that interacted with the sample at 20 keV during the quadruple sulphur isotope analyses. Each analysis consists of a 25 four-second cycles acquisition. The analytical session was monitored in terms of drift using two bracketing standards every 6 sample analyses. Instrumental mass fractionation (IMF) was corrected using the matrix matched reference materials for pentlandite (VMSO), pyrrhotite (Alexo), and chalcopyrite (Nifty-b); reference values can be found in [65]. IMF correction follows the procedure described in [66].

4. Results

4.1. Petrography and Mineral Chemistry

The drill core OY541 at Overysel comprises mineralized, serpentinized and carbonated clinopyroxenites (Figure 2). The least altered granoblastic clinopyroxenite (samples OY541-2, -3a) contains 90–95 vol % idioblastic diopside (Figure 3A; Table 2). Clinopyroxene of the uppermost part of the sampled succession contains enstatite relic inclusions (Figure 3B; Table 3). The compositions of clinopyroxene are chemically not perfectly homogeneous, but do not reveal any consistent pattern from core to rim (Table 2). The rim and core compositions, and the standard deviations, for three samples are given in Table 2 and Figure 4. Diopside from sample 3b additionally contains exsolution lamellae of augite and/or pigeonite (Figure 4). Some clinopyroxenite samples also display slight ductile and/or brittle deformation overprints, as is reflected by kinked clinopyroxene bands and subsequent crosscutting fractures filled with serpentine and carbonate. Pyroxene grains display varying degrees of patchy serpentinization and chloritization, which are in places associated with actinolite. Accessory phases comprise biotite, relic olivine as well as secondary calcite and dolomite usually occurs with serpentine and talc along crosscutting veinlets.
Highly altered clinopyroxenite (samples OY541-1, -3b, -4a, b, -5, -6, -7a, b, c, -8), which is often intimately interlayered with less-altered clinopyroxenite, is characterized by pervasive serpentinization, chloritization and/or carbonation, accompanied by serpentine, talc, chlorite and carbonate veining. In some places, clinopyroxene is replaced by tremolite fibroblasts. In the most pervasively altered samples clinopyroxene only occurs as relic phase.

4.2. Ore Petrography

According to the terminology of Barnes, Mungall, Le Vaillant, Godel, Lesher, Holwell, Lightfoot, Krivolutskaya and Wei [67], sulphide mineralization within the footwall clinopyroxenites is heterogeneous in its distribution, and occurs as “disseminated” (up to about 5 vol % sulphides), poly-phased interstitial millimetre- to centimetre-sized grains, which locally grade into patchy “net-textured” ore (between 30 and 70 vol % sulphides), displaying sulphide-rich and sulphide-poor domains on the cm-scale. The main ore minerals are pentlandite, pyrrhotite and chalcopyrite, with accessory (titano) magnetite, cubanite and mackinawite. Pyrrhotite shows rare pentlandite exsolution lamellae, while chalcopyrite shows cubanite exsolution in places. Interstitial blebs and accumulations of the disseminated and patchy net-textured sulphides usually range from 200 to 600 µm, but may locally reach several centimetres in size (Figure 5A). Almost all BMS throughout the drill core are sub- to anhedral, with serrated grain boundaries, indicating post-solidification dissolution and replacement by secondary silicates and magnetite (Figure 5 A,B).
Figure 3. (A) Euhedral recrystallized clinopyroxenes displaying a granoblastic texture 1; (B) Twinned diopside with an enstatite inclusion (mineral abbreviations follow [68]).
Minerals 10 00570 g003
Figure 4. Calculated pyroxene endmembers (from EMP analysis). The analyses that plot between enstatite and diopside in samples 3B (top left) are across exsolution lamellae.
Minerals 10 00570 g004
Figure 5. Sulphide textures. (A) Disseminated sulphides with serrated grain boundaries; (B) Sulphide relics displaying replacement along the rim and fractures by magnetite and serpentinite indicating post-solidification replacement. (C) Differentiated globular sulphide characteristically showing pyrrhotite and pentlandite at the base separated by a smooth meniscus from chalcopyrite at the top of the bleb. (D) Clinopyroxene-capped differentiated sulphide globule with a flat base. (E) Pentlandite relics within a serpentine matrix displaying inclusions of Pd-bismuthotellurides (within red boxes). (F) Chalcopyrite bearing veinlet with gold grain (Mineral abbreviations follow [68]).
Minerals 10 00570 g005
In addition, rare globular sulphides, which to our knowledge have not been reported from the Platreef sulphide ore before, occur as rounded, interstitial aggregates, which are 100 to ca. 1000 µm in diameter (Figure 5C,D). The differentiated globules display chalcopyrite in its upper part, separated by a smooth meniscus from pentlandite and pyrrhotite occupying the lower portion of the sulphide blebs. The globules may or may not have silicate caps, which comprise variable proportions of clinopyroxene, serpentine and magnetite, above the sulphide aggregates (Figure 5C,D). Moreover, the BMS infrequently show a crimped angular habit due to the recrystallization of the surrounding clinopyroxene. The BMS assemblage of the deeper core section is dominated by pentlandite, while pyrrhotite is rather rare. The pentlandite in the strongly altered samples is partly replaced by secondary alteration phases, such as serpentine and carbonates, and also occurs embedded along the cleavage planes of clinopyroxene, and along veins associated with secondary serpentine and carbonates (Figure 5E). Veinlet-controlled mineralization is dominated by chalcopyrite, and is usually associated with carbonate minerals, magnetite or secondary serpentine (Figure 5F). Thus, these textures reflect a complex multistage mineralization history.
The identified PGM were bismuthotellurides, sperrylite and stibiopalladinite, which were found to be almost always associated or enclosed within the BMS blebs (Figure 5E) and, in addition, one grain of gold was identified on a late fracture filled with chalcopyrite (Figure 5F).

4.3. Bulk-Rock Chemistry

The major- and trace-element compositions of the Platreef clinopyroxenite were described in detail by Harris and Chaumba [3]; Armitage, McDonald, Edwards and Manby [15]; McDonald, Holwell and Armitage [62]; Holwell, McDonald and Armitage [20]; and Kinnaird, Hutchinson, Schurmann, Nex and de Lange [22], and thus only the characteristics relevant for this study are discussed here.
Binary variation diagrams of CaO vs. MgO, and SiO2 vs. MgO (Figure 6), are consistent with the clinopyroxene-dominated mineralogy and distinct from the “magmatic trend”, representing magmatic variations due to varying plagioclase and orthopyroxene proportions, commonly found in the pyroxenitic units (Figure 6A) [6,48]. The clinopyroxenite samples investigated in this study plot off the “magmatic trend” and define a steeper slope in the CaO vs. MgO diagram (Figure 6A). Furthermore, the low Cr (<1700 ppm; Table 1) contents are in accordance with a non-magmatic origin of the clinopyroxenites [3] (see also Figure 4 in [6]). This is further supported by their lower SiO2, FeO, Na2O and Cr, but higher CaO concentrations, than those of primary magmatic Platreef pyroxenites and norite (see [6]).
Multi-element diagrams of the clinopyroxenite samples display a slight negative slope, with negative anomalies of Ba, Nb, Ta, Sr, Ti and Y, while an Eu anomaly is absent (Figure 7). All investigated clinopyroxenite samples display a similar REE pattern, involving a slight enrichment of light REE (LREE) relative to heavy REE (HREE) (LaN/YbN ranging from 1.6 to 7.0; DyN/YbN ranging from 0.9 to 2.4). These patterns are similar to those of other clinopyroxenite and norite samples from Overysel and Sandsloot, as reported by Harris and Chaumba [3], Pronost, Harris and Pin [6] and McDonald and Holwell [28].

4.4. Nd-Isotopes

The bulk rock neodymium isotope ratios (143Nd/144Nd) for five selected samples representing clinopyroxenite from the whole drill core section range between 0.511513 and 0.511797, with an initial 143Nd/144Nd range between 0.509615 and 0.509655 (recalculated for 2.061 Ga), and the εNd (2.06 Ga) varies from −6.16 to −6.94 (Table 4). These values are slightly higher than those of previously studied clinopyroxenite [εNd (2.06 Ga) = −6.65 to −8.47; [6]], but similar to those of the magmatic pyroxenites and norites at Sandsloot and Overysel (average εNd = −6.8 ± 1.25; [57]), as well as the Main Zone [average εNd (2.06 Ga) = −6.76 ± 0.47; [71]].

4.5. PGE Mineralization

The variable PGE distribution throughout the clinopyroxenite samples is related to the heterogeneous distribution of BMS. Furthermore, the Pt/Pd of samples with bulk PGE concentrations > 400 ppm are between 0.5 and 0.8, and match the known Platreef ratios of 0.7 to 0.8 at Overysel [72]. Samples (OY541-7, 8) from the deepest part of the core yield Pt/Pd ratios from 0.5 to 0.7, whereas sample OY541-4a1 displays an unusually high ratio of 2.8.

4.6. PGE in BMS

A total of 450 spots on 72 sulphide grains (pyrrhotite, pentlandite, chalcopyrite) were analyzed by LA-ICP-MS (Table 5). In the following, the distributions of Os, Ir, Ru, Rh, Pt and Pd in pentlandite, pyrrhotite and chalcopyrite are described using median values of the different rock samples from the Overysel drill core (Table 5; Figure 8). The here-investigated pentlandite grains display several compositional populations (I, II, III) with different PGE contents at the thin section scale (Table 5), while replicate analysis of individual grains revealed a homogeneous trace element distribution. These chemically defined populations do not correlate with the textural occurrences of the pentlandite (see discussion below). Table 7 provides S, Ni and Cu median values (EMP analyses), as well as Pd and Pt contents of pentlandite, pyrrhotite and chalcopyrite, measured by LA-ICP-MS.
Pentlandite displays the highest median PGE concentrations of all BMS in the clinopyroxenite (Table 4), with median values of 218 ppm Pd, 9.9 ppm Rh, 9.5 ppm Ru, 1.4 ppm Os, 2.2 ppm Ir and 0.7 ppm Pt. Furthermore, pentlandite commonly exhibits high Ru, Rh and Pd, and low Pt contents (Figure 9), whereas chalcopyrite and pyrrhotite display only slightly elevated Ru (~4 ppm) contents and low Os, Ir, Rh, Pt and Pd contents, similar to previous datasets (cf. [9,12,21]). The PGE patterns of the pentlandite from Overysel are similar to those from Sandsloot, and are characterized by Pt concentrations < 1 ppm, and concentrations of Ru and Rh ranging from 28 ppm to 19 ppm, respectively (cf. [9,12]). In contrast, pentlandite PGE concentrations from Turfspruit are commonly below the detection limit, except for Pd, which often has concentrations of ~10 ppm [22]. The pentlandite PGE concentrations from Aurora display values below tens of ppm for Pt, Rh, Ru, Os and Ir, and 30 ppm for Pd [29], whereas Pd concentrations in pentlandite for the Flatreef can range up to 500 ppm [19]. The pentlandite Pd concentrations display a broad range concerning the location (i.e., Overysel, Sandsloot and Aurora) and the host rock type (cf. [9,12]). The clinopyroxenite and calcsilicate rock samples from Sandsloot show high average values of ca. 360 ppm, whereas the clinopyroxenite at Overysel displays lower average values of ca. 218 ppm (this study) and 120 ppm [12].

4.7. Mass-Balance Calculation

The relative quantities of BMS-hosted PGE in individual bulk samples can be constrained using a mass-balance based on BMS and whole-rock Pd, Pt, S, Cu and Ni concentrations (Table 7) [8,12,74]. The weight fraction (in %) of the PGE in BMS (Psuli) is calculated using:
P s u l i = ( F s u l × C s u l i C w r i ) × 100
where Fsul denotes the BMS weight fraction per sample, Csul and Cwr are the median concentrations of the element i in the BMS and whole rock, respectively. The weight fractions of pentlandite, chalcopyrite and pyrrhotite are calculated based on the assumption that Ni is exclusively hosted by pentlandite, Cu is exclusively hosted by chalcopyrite, and that residual S represents the pyrrhotite content [8]:
FPn = (Niwr/NiPn)
FCcp = (Cuwr/CuCcp)
FPo = (Swr − (SCcp × FCcp) − (SPn × FPn))/SPo
Cubanite and mackinawite were excluded from the calculation due to their low modal abundance. The whole-rock Ni content was adjusted to account for the Ni hosted in clinopyroxene. Further, mass-balance results are still error-prone, considering their dependency on (1) the assumption that all Ni is as pentlandite and clinopyroxene, neglecting other Ni-bearing phases such as serpentine, relic olivine, pyrrhotite, Ni-alloys and millerite, (2) uncertainties of the analytical chemistry, (3) the nugget effect and (4) a calculation based on median values for the PGE concentrations, which show clustering.
The calculated sulphide weight fractions and the petrography of five representative clinopyroxenite samples revealed a relatively constant pentlandite content throughout the drill core samples (Figure 10, Table 8). Chalcopyrite contents show minor variations, while pyrrhotite contents distinctly vary down-hole.
The calculated proportions (%) of Pt and Pd hosted by pentlandite are given in Table 8. Due to the clustering of the Pd contents in individual pentlandite grains, different populations were calculated to account for the possible range of the PGE distribution. Furthermore, the clustering of the Pd concentrations also results in high standard deviations for each population (Table 8). The mass-balance indicates that the pentlandite hosts variable fractions of the bulk-rock Pd—between ~110% (sample OY 541-1) and ~21% (OY 541-8a) throughout the drill core (Figure 11). In addition, chalcopyrite and pyrrhotite host only minor Pd contents, with maximum median values of 0.72 ppm each (Table 7).

4.8. S-Isotopes

Sulphur isotope ratios (Table 6) were measured in situ in chalcopyrite, pyrrhotite and pentlandite from four representative clinopyroxenite samples (OY 541-1, -3b, -4a and -8). However, in sample OY 541-8 sulphur isotope ratios (Table 6) were measured in situ only in chalcopyrite and pentlandite, since pyrrhotite is absent in this sample. Chalcopyrite consistently shows higher δ34S isotopic ratios (+3.81‰ to +2.95‰) than pyrrhotite and pentlandite. However, the relative difference in the δ34S (0.7‰ to 1.0‰ ± 0.5‰) between pyrrhotite and pentlandite is consistent with that inferred for equilibrium S-isotope fractionation [65].
The analyzed pentlandite and pyrrhotite show δ34S signatures within or close to the pristine magmatic range of −1.8‰ to +3.2‰ [16,75,76,77]. The Δ33S range, from +0.11‰ to +0.38‰, may indicate the assimilation of sedimentary sulphur in an early stage chamber prior to emplacement (Figure 12B and Figure 13) [78].

5. Discussion

5.1. Origin of the Clinopyroxenitic Units

Formation models of the Platreef clinopyroxenite vary, and current interpretations include magmatic and metamorphic processes, skarn-type contact metasomatism of the footwall dolostone, and formation of “hybrid-lithologies” by assimilation of sedimentary rocks in the magma. The described clinopyroxenite differs in modal compositions, and comprise strongly Ca-enriched units, which is reflected by the presence of a calcsilicate assemblage consisting of varying amounts of diopside, wollastonite, olivine, garnet (andradite), calcite, amphiboles and spinel [5,6,20,22,36,62,79]. The distinct mineral assemblage—the common occurrence of dolostone xenoliths in the clinopyroxenite—and its contact with footwall Malmani Dolomite at Overysel and Sandsloot suggests that magma–carbonate interaction has played an important role in clinopyroxenite formation (e.g., [3,6,80]). Additionally, the clinopyroxenite is often pervasively carbonated and serpentinized, indicating post-solidification alteration by (hydrothermal) fluids [5,6,20,22,62,79].
The here-studied clinopyroxenite samples from hole OY541 contain a less diverse mineral assemblage than that documented at Sandsloot and Tweefontein (cf. [3,15,20,36,81]), and mainly comprise clinopyroxene, orthopyroxene and serpentine, and additional carbonates in the deeper part of the drill core. The occurrence of orthopyroxene inclusions and pigeonite exsolution lamellae in diopside supports a metasomatic formation of clinopyroxene at the expense of magmatic orthopyroxene, consistent with the observation at Sandsloot [20,82]. In addition, preliminary oxygen– and carbon–isotope ratios that were determined for the dolomite grains separated from two pervasively altered clinopyroxenite samples (OY541-7b and 7c), revealing δ13C values of −4.96‰ and −5.88‰, and δ18O values of 20.35‰ and 21.88‰, respectively (unpublished data). This stable isotope data is consistent with late hydrothermal alteration of these Platreef clinopyroxenite samples (cf. [3,6]).
The clinopyroxenite paragenesis is in accordance with the whole-rock chemical composition. The clinopyroxenite samples studied here, like those from Sandsloot, plot off the “magmatic trend” (Figure 6A) due to higher CaO/MgO, and lower SiO2, FeO and Na2O contents, compared to the typical magmatic Platreef pyroxenite and norite from Sandsloot, further supporting the non-magmatic origin of the clinopyroxenite (cf. [3,6,28]). This is also consistent with an overall relatively low Cr concentration (<1700 ppm). Moreover, clinopyroxenite εNd(2.06 Ga) values between −6.16 and −6.94 are similar to those of the magmatic pyroxenite and norite of the Platreef at Sandsloot and Overysel (average εNd = −6.8 ± 1.25; [6]), and also the Main Zone [average εNd(2.06 Ga) = −6.76 ± 0.47; [71]], indicating that clinopyroxenite formation at Overysel is unlikely to be related to the emplacement of a compositionally distinct melt. The clinopyroxenite was previously interpreted as indicating the assimilation of country rock, such as Malmani Dolomite (cf. [3,6,28]). However, dolostone assimilation and Ca-enrichment during ongoing pyroxene crystallization would have promoted the co-crystallization of orthopyroxene and clinopyroxene, and pyroxene–pyroxene exsolution, upon cooling, instead of the formation of clinopyroxene containing orthopyroxene relics (cf. [54]). Thus, these results rather support a post-magmatic metasomatic formation of clinopyroxenite, at the expense of former cumulate orthopyroxene.

5.2. Sulphide Mineralization and Distribution of PGEs

Even though there is broad agreement on the magmatic origin of the Platreef, its sulphide mineralization mechanism is still at the centre of the scientific debate [1,2,19,44]. In particular, the composition of the Platreef footwall’s clinopyroxenite (and thus the associated sulphide mineralization) fails to reconcile with a purely magmatic evolution, and suggests modification by country rock assimilation and/or interaction with hydrothermal fluids. Crustal contamination may have modified (cf. [3,6,56]), or even triggered, mineralization by increasing the S-saturation of the magma, via the assimilation of S-rich country rocks [36,75,83], while fluid infiltration may have redistributed mineralization (e.g., [20]).
We contribute to this ongoing discussion by presenting sulphide and silicate textural observations in combination with novel geochemical data. The described globular sulphides display a characteristic distribution of chalcopyrite, pyrrhotite and pentlandite in relation to the consistently flat base of the globules (Figure 4C,D). These observations are consistent with recrystallization from the former monosulphide solid solution, which crystallized from a sulphide liquid during downward transport of the blebs (e.g., [38,84]). The silicate caps that overlie the sulphide globules comprise variable proportions of clinopyroxene, and secondary magnetite and serpentine.
LA-ICP-MS results reveal pentlandite as the major carrier of Pd (Table 5; Figure 9), whereas chalcopyrite and pyrrhotite host almost no PGE [8,11,12,16,21,29,85]. High Pt and IPGE contents were interpreted to be due to discrete micro-inclusions in pentlandite, or due to the substitution of PGM for Ni and/or Fe in BMS (cf. Figure 4E) [11,12,21]. In case of the detection of micro-inclusions of PGM, individual analyses were removed from the median values. However, the PGE substitution for Ni and/or Fe is heterogeneous at the scale of a single sample (Table 8), but homogeneous at the single-grain scale. The variability of PGE concentrations may be related to variations in the S content at S-saturation, resulting in relatively diluted PGE concentrations during the abundant formation of BMS at high sulphur saturation (cf. [38]) (Figure 10). Therefore, the variations of pentlandite grain PGE concentrations on a thin section scale could be due to the presence of different generations of pentlandite. We cannot rule out that this variation in pentlandite PGE contents reflects a complex multistage mineralization, even though the chemically defined populations do not correlate with observed distinct pentlandite textures. Detailed 3D textural analysis by X-ray-computed tomography would be necessary to gain unambiguous textural evidence (cf. [67]). Furthermore, as indicated by the sulphide reaction-textures (i.e., their replacement by the late secondary carbonates and serpentine, as well as dissolution along the grain boundaries), post-solidification mobilization and redistribution may have contributed to the generation of the different pentlandite grain PGE populations.
S/Se ratios and S isotopes often provide important constraints for the source of S and the role of crustal contamination in triggering sulphide saturation in magmatic Ni–Cu–PGE sulphide deposits (Figure 12B and Figure 13). Most Ni–Cu–PGE deposits show S/Se within or close to the mantle range of 2859 to 4350, whereas S/Se in crustal rocks is typically above 3500 [36,86,87,88]. Recent investigations on the Aurora limb show a wide range of BMS-S/Se ratios between 774 and 23384 (cf. [29]). However, the here-investigated bulk-samples show S/Se between 454 and 2500, i.e., lower than typical values of mantle and crustal rocks (Figure 12A and Figure 13). Thus, S/Se ratios provide no evidence for a significant effect of crustal contamination on the mineralization, but contamination by sedimentary country rocks (for which we have no evidence in the investigated drill core) may be masked by syn- or post-magmatic processes. However, the BMS reaction-textures, and their frequent association with hydrothermal alteration products in the studied clinopyroxenite, suggest that the low S/Se results from secondary S-loss (cf. [29,88,89]). This is supported by a S/Se and S isotope study of primary and secondary sulphides from the Grasvally Norite–Pyroxenite–Anorthosite (GNPA) member of the northern Bushveld limb [72,76]. These data revealed minor to no assimilation of crustal rock during the emplacement (based on δ34S values), and S-loss due to secondary processes, such as hydrothermal alteration, metamorphism and serpentinization [76,90,91]. Additional constraints on the sulphur origin may be derived from sulphur isotope ratios. The isotope ratios of the three analyzed sulphide phases in OY541 (chalcopyrite, pentlandite, pyrrhotite) are indicative of the mass-independent fraction of sulphur (MIFS), expressed as Δ33S (Figure 12B). MIFS is almost exclusively found in rocks older than the great oxidation event, i.e., older than 2.45 Ga [19,92,93,94]. This implies that the sulphide phases crystallized from pristine Bushveld magmas (i.e., 2.054 Ga) are not expected to show MIFS, unless sulphur was assimilated from a significantly older source.

6. Conclusions

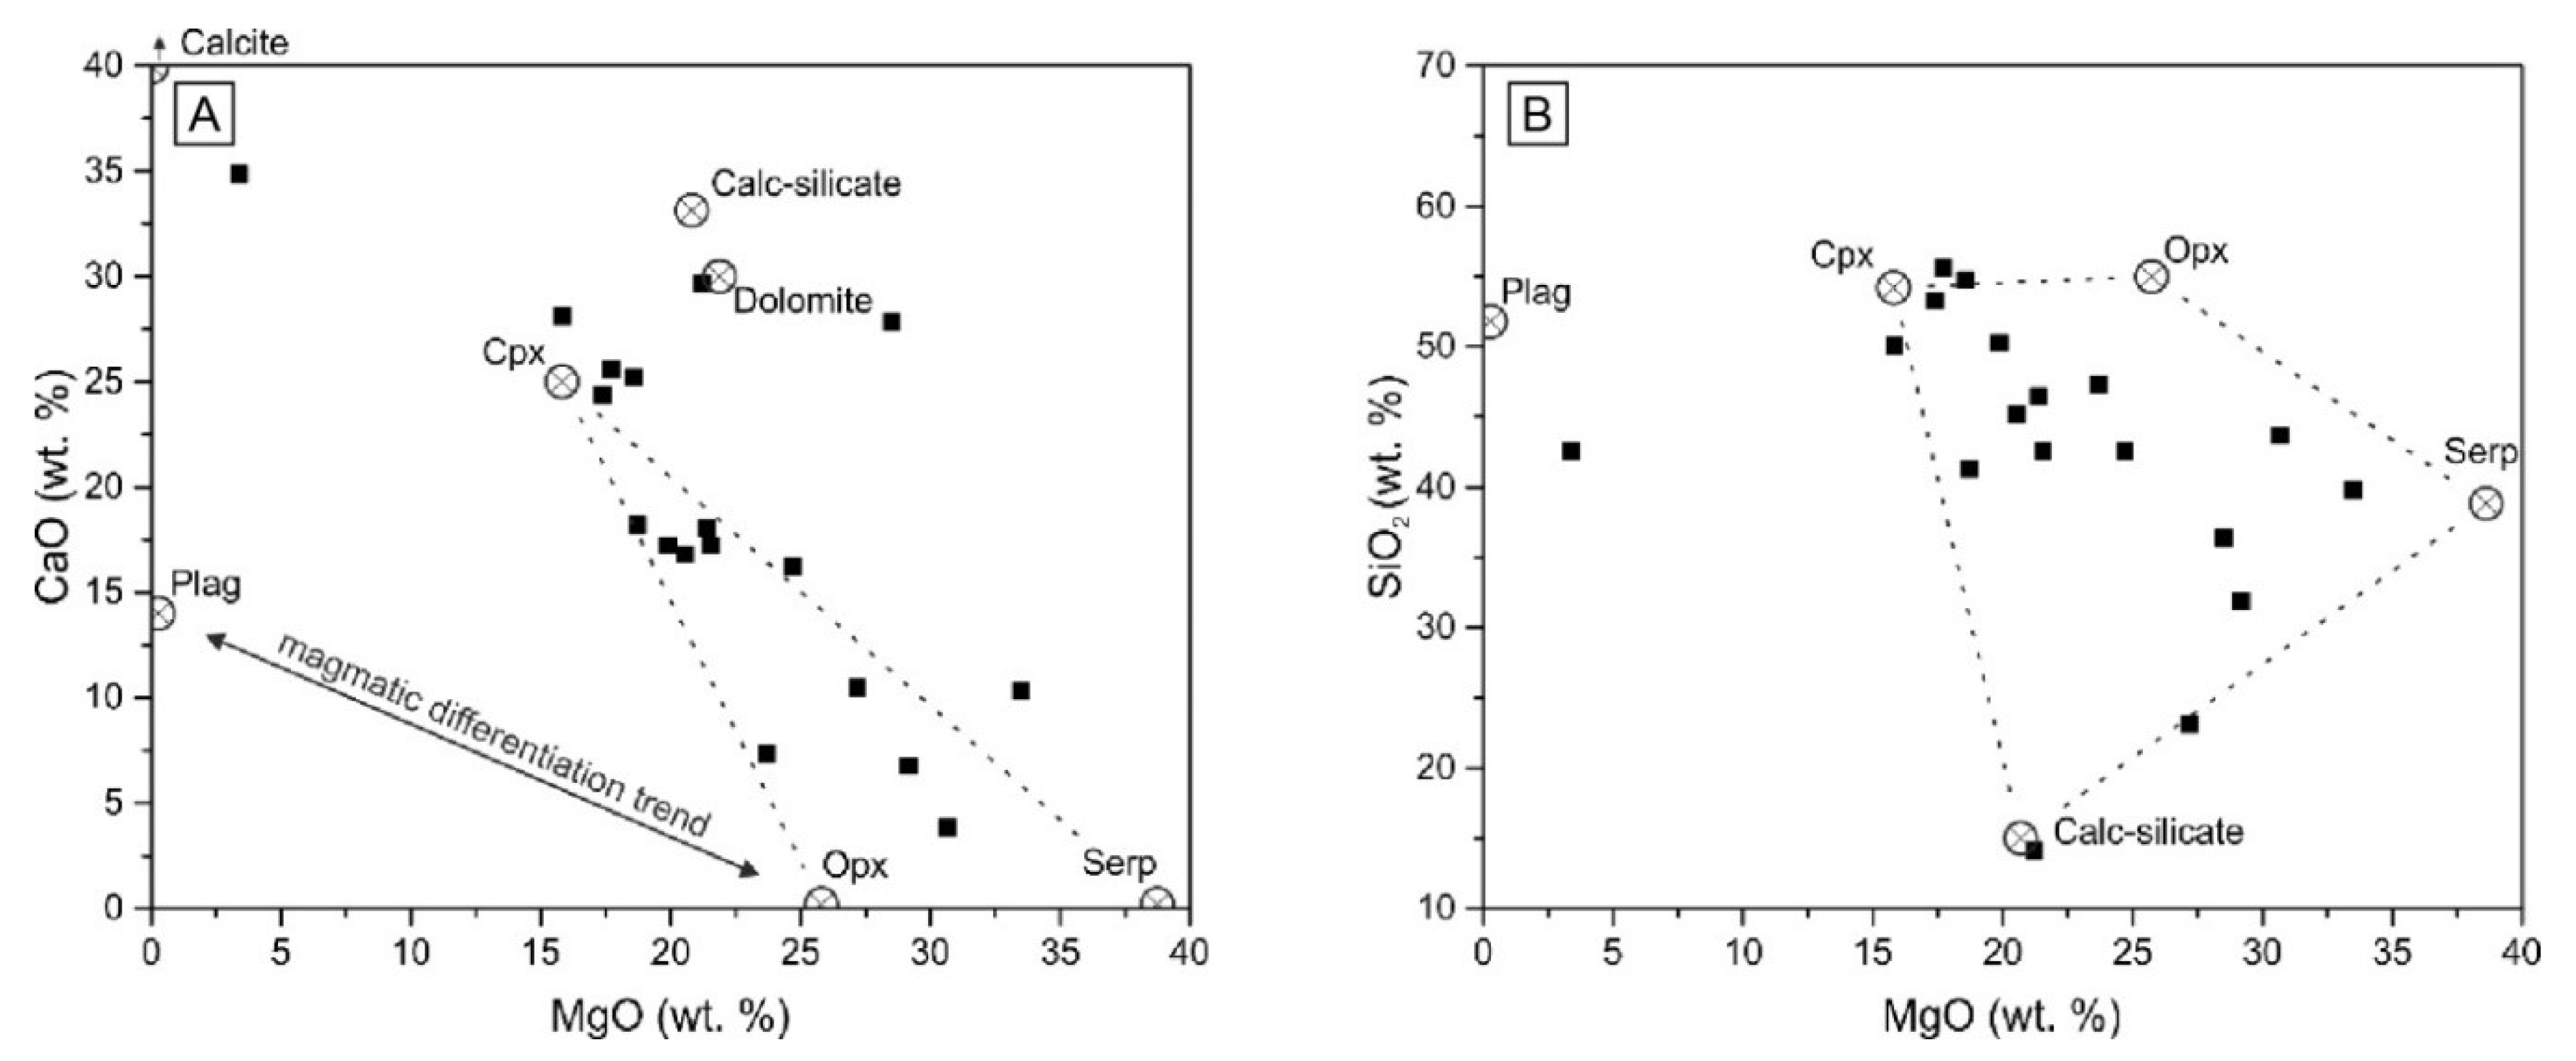
The major- and trace-element characteristics of this clinopyroxenite, in conjunction with higher CaO/MgO ratios and lower SiO2, FeO and Na2O contents in comparison to those of typical igneous Platreef pyroxenites and norite from elsewhere, are not in accordance with a magmatic trend, and rather appear to be the result of a metasomatic origin, which is in accordance with the findings of Harris and Chaumba [3]; Pronost, Harris and Pin [6]; and McDonald and Holwell [28]. Fluid-precipitated dolomite, and (pervasive) serpentinization and chloritization, suggest a subsolidus (hydrothermal) fluid alteration of the clinopyroxenite. As revealed by the petrographical and sulphur and Sm-Nd isotope evidence, the sulphur-saturation, as well as the formation of an orthopyroxene-bearing melt, was established before emplacement, and subsequently formed a heterogeneous orthomagmatic PGE–BMS-assemblage with evidence of crustal contamination in an early stage chamber [3,6,56,
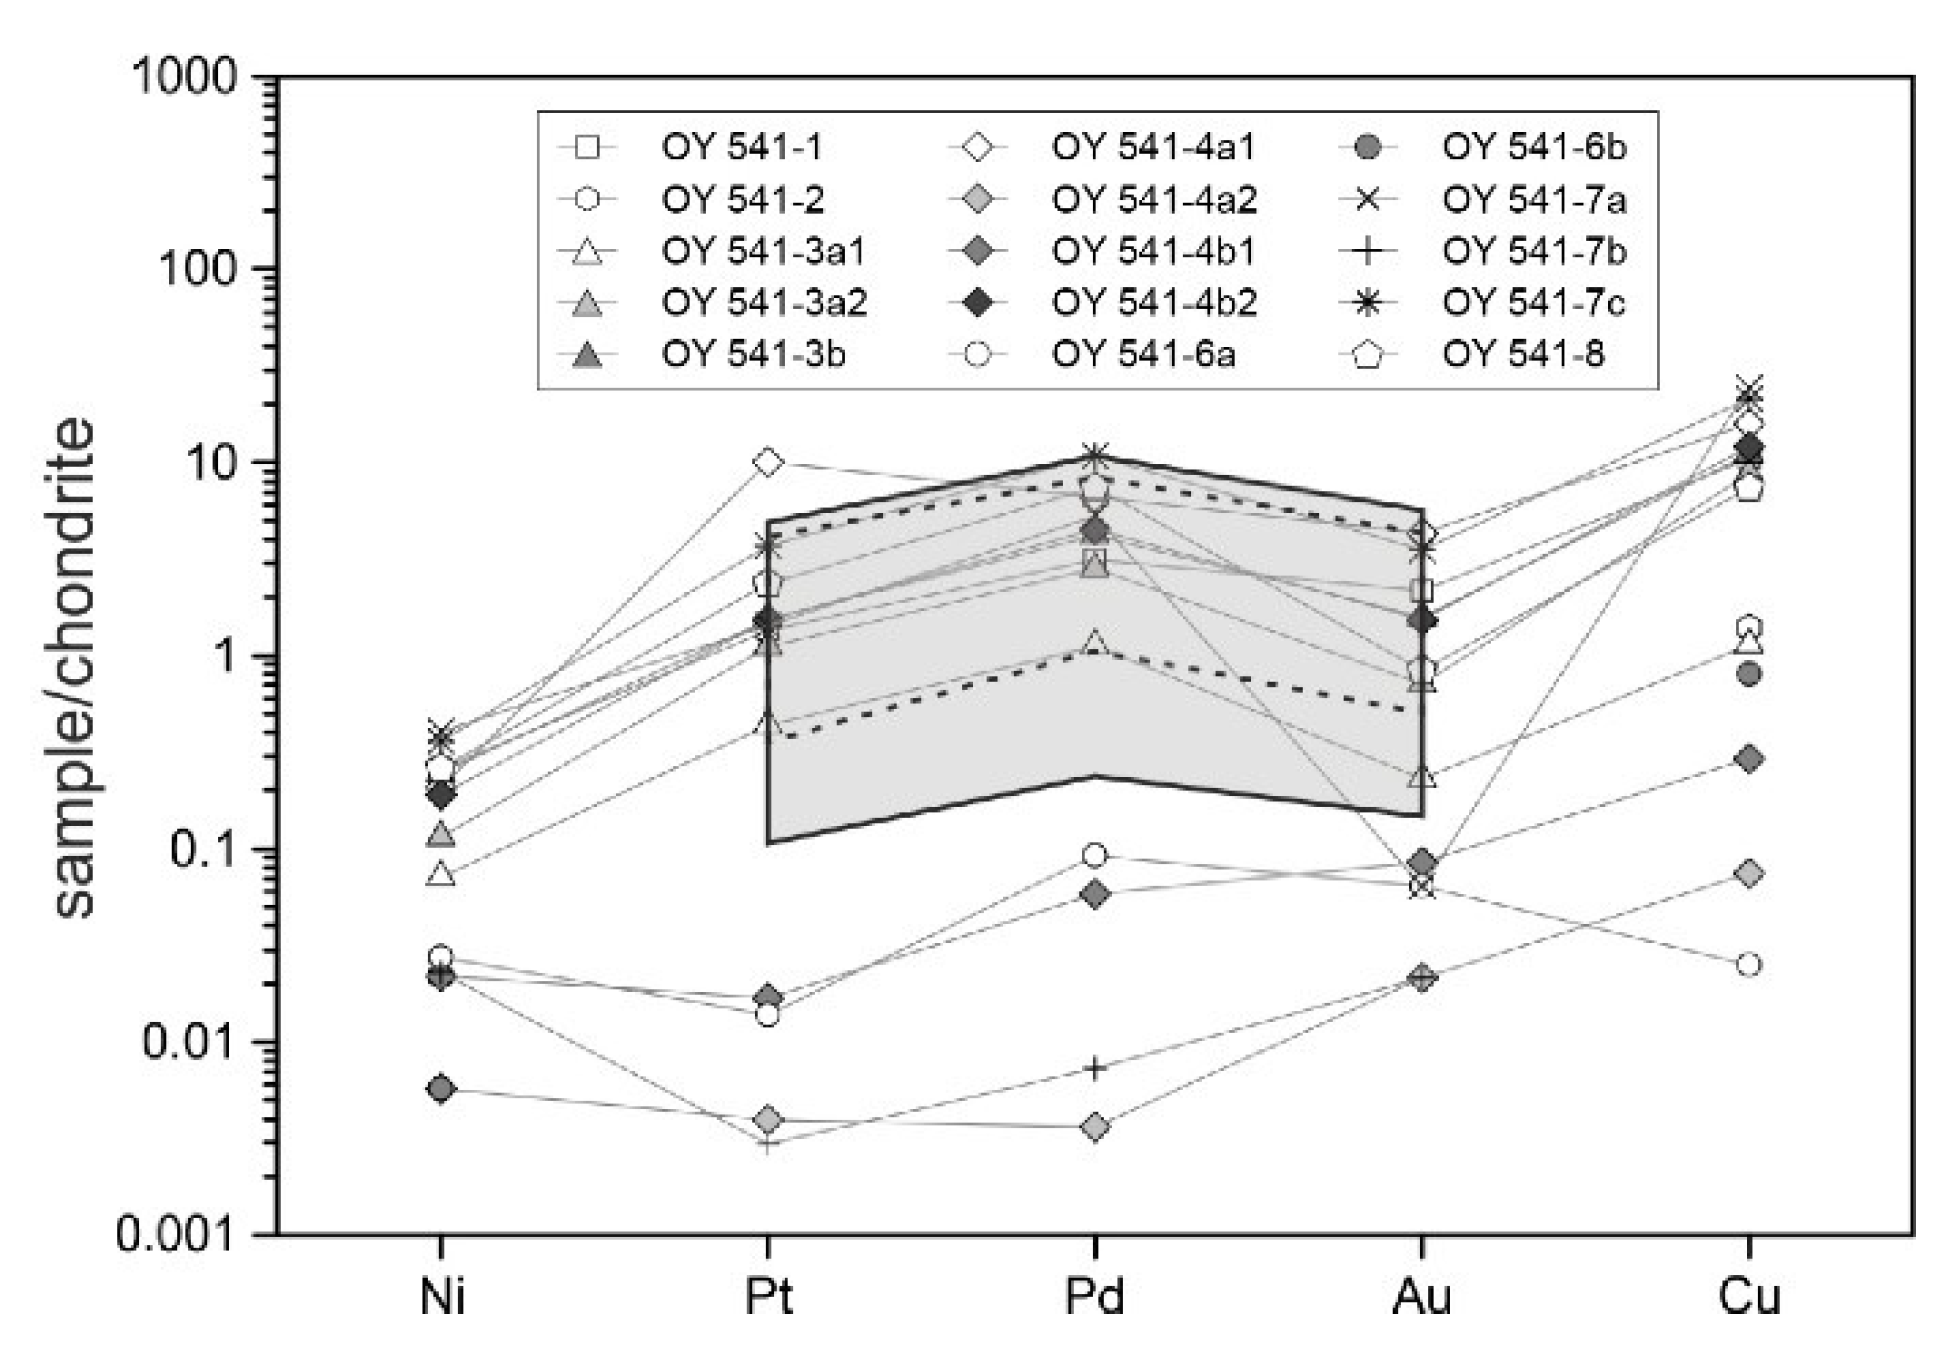
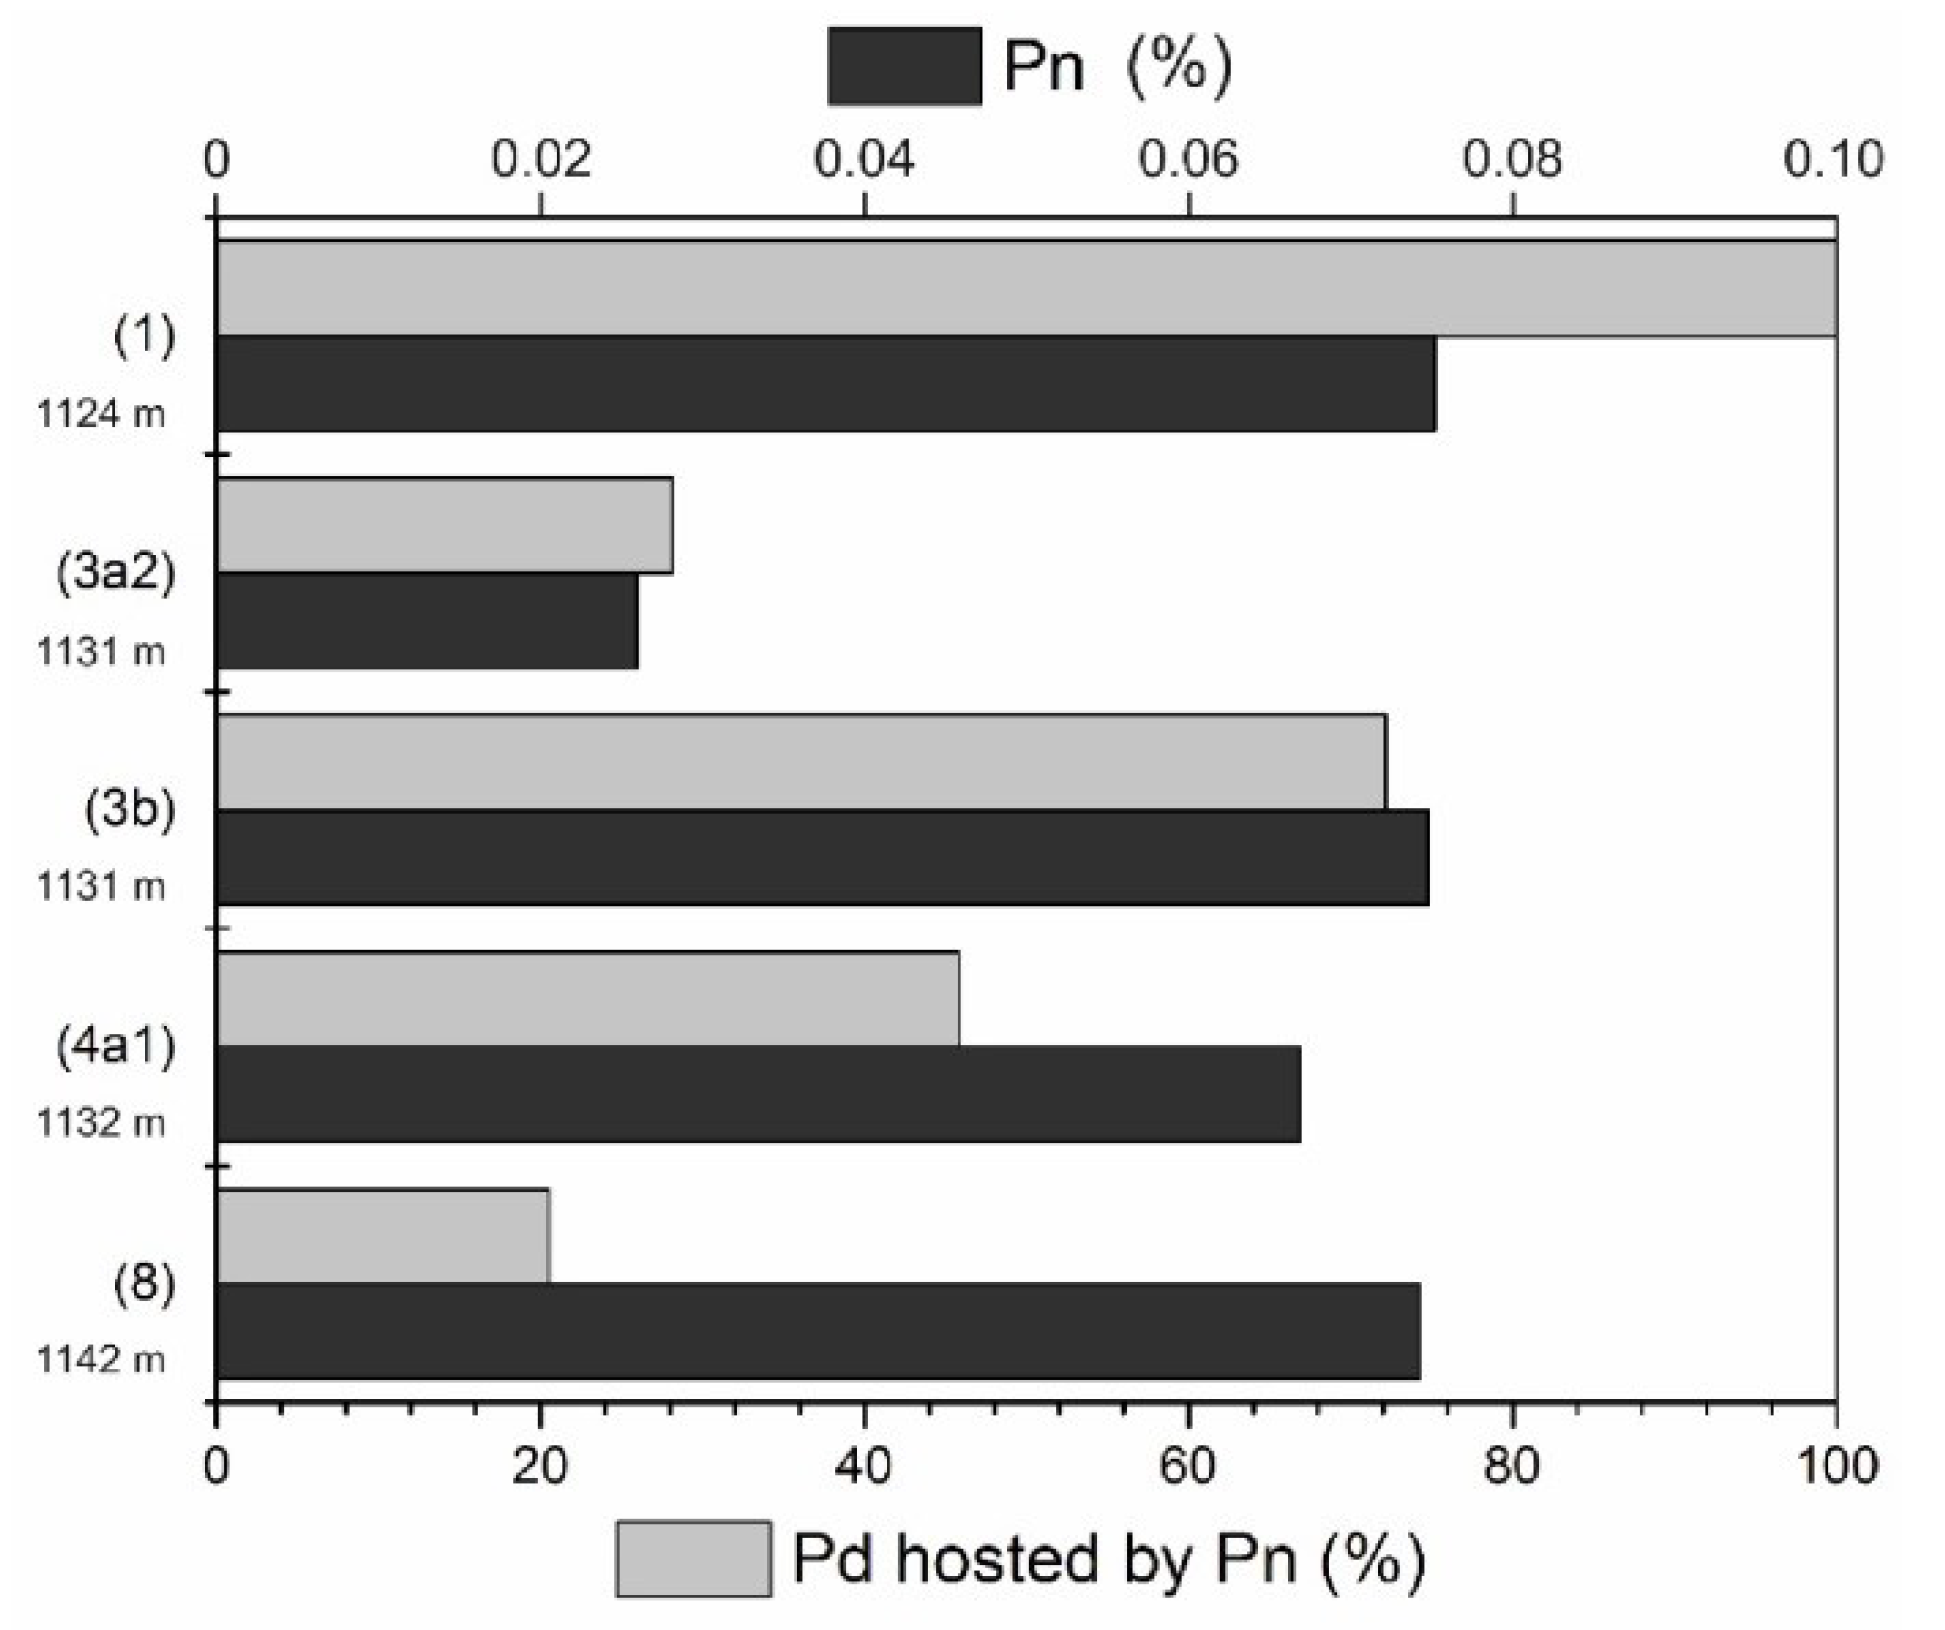
76]. This is further supported by the PPGE (Rh, Pt, Pd) concentrations in the BMS and mass-balance calculations, which are in general agreement with those of the Merensky reef and the UG-2, in both of which large proportions of the whole-rock Pd and Rh are hosted by pentlandite, whereas Pt and the IPGE were interpreted to mainly occur in discrete PGM, rather than being hosted by BMS. Pentlandite is a major carrier of Pd in the Platreef clinopyroxenite, which is in agreement with the observations of Junge, Oberthür, Kraemer, Melcher, Piña, Derrey, Manyeruke and Strauss [17] and Klemd, Herderich, Junge, Oberthür, Schouwstra and Roberts [12]. However, the presence of pentlandite with variable PGE concentrations on the thin section scale may be related to variations in the S content at S-saturation, resulting in relatively diluted PGE concentrations during abundant formation of BMS at high sulphur saturation (cf. [38]). Thus, the variations of pentlandite grain PGE concentrations on a thin section scale could be due to the presence of different generations of pentlandite. In addition, as indicated by the sulphide reaction-textures (i.e., their replacement by the late secondary carbonate and serpentine, as well as dissolution along the grain boundaries), mobilization and redistribution may have contributed to the generation of the different pentlandite grain PGE populations.

Author Contributions

Conceptualization, R.K.; Data curation, M.K., R.K. and A.B.; Investigation, M.K., A.B.; L.M.; R.K. and M.J; Methodology, R.K., M.K., A.B., L.M., M.R. and M.J.; Validation, R.K. and A.B.; Writing—original draft, R.K., A.B., and M.K. Writing—review & editing, R.K., A.B., M.K., M.J., L.M. and R.S. All authors have read and agreed to the published version of the manuscript.

Funding

This research received no external funding.

Acknowledgments

Anglo American Platinum is thanked for access to the drill core and the logistic support. The authors would like to thank Drs. Helene Brätz, Thomas Günther and Sönke Brandt for assisting in LA-ICP-MS analyses and EMPA at the GeoZentrum Nordbayern. We further appreciate the reviews of the two journal referees. Furthermore, the authors acknowledge the facilities, and the scientific and technical assistance of the Australian Microscopy & Microanalysis Research Facility at the Centre for Microscopy, Characterization & Analysis (CMCA), The University of Western Australia, a facility funded by the University, State and Commonwealth Governments. Moreover, special thanks go to Michael Joachimski for providing oxygen- and carbon-isotope analyses.

Conflicts of Interest

The authors declare no conflict of interest.

References

  1. Ihlenfeld, C.; Keays, R.R. Crustal contamination and PGE mineralization in the Platreef, Bushveld Complex, South Africa: Evidence for multiple contamination events and transport of magmatic sulfides. Miner. Depos. 2011, 46, 813–832. [Google Scholar] [CrossRef]
  2. Kinnaird, J.A.; McDonald, I. The Northern Limb of the Bushveld Complex: A New Economic Frontier. In Metals, Minerals, and Society; Arribas R, A.M., Mauk, J.L., Eds.; Society of Economic Geologists (SEG): Littleton, CO, USA, 2018; Volume 21, pp. 157–176. [Google Scholar]
  3. Harris, C.; Chaumba, J.B. Crustal contamination and fluid–rock interaction during the formation of the Platreef, Northern Limb of the Bushveld Complex, South Africa. J. Pet. 2001, 42, 1321–1347. [Google Scholar] [CrossRef] [Green Version]
  4. Holwell, D.A. The Roles of Magmatism, Contamination and Hydrothermal Processes in the Development of the Platreef Mineralization, Bushveld Complex, South Africa. Ph.D. Thesis, Cardiff University, Wales, UK, 2006. [Google Scholar]
  5. Hutchinson, D.; Kinnaird, J.A. Complex multistage genesis for the Ni–Cu–PGE mineralisation in the southern region of the Platreef, Bushveld Complex, South Africa. Appl. Earth Sci. 2005, 114, 208–224. [Google Scholar] [CrossRef]
  6. Pronost, J.; Harris, C.; Pin, C. Relationship between footwall composition, crustal contamination, and fluid–rock interaction in the Platreef, Bushveld Complex, South Africa. Miner. Depos. 2008, 43, 825–848. [Google Scholar] [CrossRef]
  7. Dare, S.A.S.; Barnes, S.-J.; Prichard, H.M. The distribution of platinum group elements (PGE) and other chalcophile elements among sulfides from the Creighton Ni–Cu–PGE sulfide deposit, Sudbury, Canada, and the origin of palladium in pentlandite. Miner. Depos. 2010, 45, 765–793. [Google Scholar] [CrossRef]
  8. Godel, B.; Barnes, S.-J.; Maier, W.D. Platinum-group elements in sulphide minerals, platinum-group minerals, and whole-rocks of the Merensky Reef (Bushveld Complex, South Africa): Implications for the formation of the reef. J. Pet. 2007, 48, 1569–1604. [Google Scholar] [CrossRef] [Green Version]
  9. Holwell, D.A.; McDonald, I. Distribution of platinum-group elements in the Platreef at Overysel, northern Bushveld Complex: A combined PGM and LA-ICP-MS study. Contrib. Miner. Pet. 2007, 154, 171–190. [Google Scholar] [CrossRef]
  10. Holwell, D.A.; McDonald, I. A Review of the Behaviour of Platinum Group Elements within Natural Magmatic Sulfide Ore Systems. Platin. Met. Rev. 2010, 54, 26–36. [Google Scholar] [CrossRef]
  11. Junge, M.; Wirth, R.; Oberthür, T.; Melcher, F.; Schreiber, A. Mineralogical siting of platinum-group elements in pentlandite from the Bushveld Complex, South Africa. Miner. Depos. 2015, 50, 41–54. [Google Scholar] [CrossRef] [Green Version]
  12. Klemd, R.; Herderich, T.; Junge, M.; Oberthür, T.; Schouwstra, R.; Roberts, J. Platinum-group element concentrations in base-metal sulphides from the Platreef, Mogalakwena Platinum Mine, Bushveld Complex, South Africa. S. Afr. J. Geol. 2016, 119, 623–638. [Google Scholar] [CrossRef]
  13. Osbahr, I.; Klemd, R.; Oberthür, T.; Brätz, H.; Schouwstra, R. Platinum-group element distribution in base-metal sulfides of the Merensky Reef from the eastern and western Bushveld Complex, South Africa. Miner. Depos. 2013, 48, 211–232. [Google Scholar] [CrossRef]
  14. Osbahr, I.; Oberthür, T.; Klemd, R.; Josties, A. Platinum-group element distribution in base-metal sulfides of the UG2 chromitite, Bushveld Complex, South Africa—A reconnaissance study. Miner. Depos. 2014, 49, 655–665. [Google Scholar] [CrossRef]
  15. Armitage, P.E.B.; McDonald, I.; Edwards, S.J.; Manby, G.M. Platinum-group element mineralization in the Platreef and calc-silicate footwall at Sandsloot, Potgietersrus District, South Africa. Appl. Earth Sci. 2002, 111, 36–45. [Google Scholar] [CrossRef]
  16. Holwell, D.A.; Boyce, A.J.; McDonald, I. Sulfur isotope variations within the Platreef Ni-Cu-PGE deposit: Genetic implications for the origin of sulfide mineralization. Econ. Geol. 2007, 102, 1091–1110. [Google Scholar] [CrossRef]
  17. Junge, M.; Oberthür, T.; Kraemer, D.; Melcher, F.; Piña, R.; Derrey, I.T.; Manyeruke, T.; Strauss, H. Distribution of platinum-group elements in pristine and near-surface oxidized Platreef ore and the variation along strike, northern Bushveld Complex, South Africa. Miner. Depos. 2019, 54, 885–912. [Google Scholar] [CrossRef]
  18. Maier, W.D.; de Klerk, L.; Blaine, J.; Manyeruke, T.; Barnes, S.J.; Stevens, M.V.A.; Mavrogenes, J.A. Petrogenesis of contact-style PGE mineralization in the northern lobe of the Bushveld Complex: Comparison of data from the farms Rooipoort, Townlands, Drenthe and Nonnenwerth. Miner. Depos. 2008, 43, 255–280. [Google Scholar] [CrossRef]
  19. Yudovskaya, M.; Belousova, E.; Kinnaird, J.; Dubinina, E.; Grobler, D.F.; Pearson, N. Re-Os and S isotope evidence for the origin of Platreef mineralization (Bushveld Complex). Geochim. Cosmochim. Acta 2017, 214, 282–307. [Google Scholar] [CrossRef]
  20. Holwell, D.A.; McDonald, I.; Armitage, P.E.B. Platinum-group mineral assemblages in the Platreef at the Sandsloot Mine, northern Bushveld Complex, South Africa. Miner. Mag. 2006, 70, 83–101. [Google Scholar] [CrossRef]
  21. Hutchinson, D.; McDonald, I. Laser ablation ICP-MS study of platinum-group elements in sulphides from the Platreef at Turfspruit, northern limb of the Bushveld Complex, South Africa. Miner. Depos. 2008, 43, 695. [Google Scholar] [CrossRef]
  22. Kinnaird, J.A.; Hutchinson, D.; Schurmann, L.; Nex, P.A.M.; de Lange, R. Petrology and mineralisation of the southern Platreef: Northern limb of the Bushveld Complex, South Africa. Miner. Depos. 2005, 40, 576–597. [Google Scholar] [CrossRef]
  23. McDonald, I.; Holwell, D.A.; Wesley, B. Assessing the potential involvement of an early magma staging chamber in the generation of the Platreef Ni–Cu–PGE deposit in the northern limb of the Bushveld Complex: A pilot study of the Lower Zone Complex at Zwartfontein. Appl. Earth Sci. 2009, 118, 5–20. [Google Scholar] [CrossRef]
  24. White, J.A. The Potgietersrus Prospect—Geology and Exploration History; South African Institute of Mining and Metallurgy: Johannesburg, South Africa, 1994; pp. 173–182. [Google Scholar]
  25. Ariskin, A.; Danyushevsky, L.; Nikolaev, G.; Kislov, E.; Fiorentini, M.; McNeill, A.; Kostitsyn, Y.; Goemann, K.; Feig, S.T.; Malyshev, A. The Dovyren Intrusive Complex (Southern Siberia, Russia): Insights into dynamics of an open magma chamber with implications for parental magma origin, composition, and Cu-Ni-PGE fertility. Lithos 2018, 302, 242–262. [Google Scholar] [CrossRef]
  26. Ariskin, A.A.; Kislov, E.V.; Danyushevsky, L.V.; Nikolaev, G.S.; Fiorentini, M.L.; Gilbert, S.; Goemann, K.; Malyshev, A. Cu–Ni–PGE fertility of the Yoko-Dovyren layered massif (northern Transbaikalia, Russia): Thermodynamic modeling of sulfide compositions in low mineralized dunite based on quantitative sulfide mineralogy. Miner. Depos. 2016, 51, 993–1011. [Google Scholar] [CrossRef]
  27. Wenzel, T.; Baumgartner, L.P.; Brügmann, G.E.; Konnikov, E.G.; Kislov, E.V. Partial Melting and Assimilation of Dolomitic Xenoliths by Mafic Magma: The Ioko-Dovyren Intrusion (North Baikal Region, Russia). J. Pet. 2002, 43, 2049–2074. [Google Scholar] [CrossRef]
  28. McDonald, I.; Holwell, D.A. Geology of the Northern Bushveld Complex and the Setting and Genesis of the Platreef Ni-Cu-PGE Deposit. In Magmatic Ni-Cu and PGE Deposits: Geology, Geochemistry, and Genesis; Li, C., Ripley, E.M., Eds.; Society of Economic Geologists: Littleton, CO, USA, 2011; Volume 17, pp. 297–327. [Google Scholar]
  29. McFall, K.; McDonald, I.; Tanner, D.; Harmer, R.E. The mineralogy and mineral associations of platinum-group elements and precious metals in the Aurora Cu-Ni-Au-PGE deposit, Northern Limb, Bushveld Complex. Ore Geol. Rev. 2019, 106, 403–422. [Google Scholar] [CrossRef]
  30. Cawthorn, R.G. The platinum and palladium resources of the Bushveld Complex. S. Afr. J. Sci. 1999, 95, 481. [Google Scholar]
  31. Cawthorn, R.G.; Eales, H.V.; Walraven, F.; Uken, R.; Watkeys, M.K. The Bushveld Complex. In The Geology of South Africa; Johnson, M.R., Anhaeusser, C.R., Thomas, R.J., Eds.; Geological Society of South Africa: Johannesburg, South Africa, 2006; pp. 261–281. [Google Scholar]
  32. Olsson, J.R.; Söderlund, U.; Klausen, M.B.; Ernst, R.E. U–Pb baddeleyite ages linking major Archean dyke swarms to volcanic-rift forming events in the Kaapvaal craton (South Africa), and a precise age for the Bushveld Complex. Precambrian Res. 2010, 183, 490–500. [Google Scholar] [CrossRef]
  33. Scoates, J.S.; Friedman, R.M. Precise age of the platiniferous Merensky Reef, Bushveld Complex, South Africa, by the U-Pb zircon chemical abrasion ID-TIMS technique. Econ. Geol. 2008, 103, 465–471. [Google Scholar] [CrossRef]
  34. Walraven, F.; Armstrong, R.A.; Kruger, F.J. A chronostratigraphic framework for the north-central Kaapvaal craton, the Bushveld Complex and the Vredefort structure. Tectonophysics 1990, 171, 23–48. [Google Scholar] [CrossRef]
  35. Hall, A.L. The Bushveld Igneous Complex of the Central Transvaal. Geol. Soc. S. Afr. Mem. 1932, 28, 544. [Google Scholar]
  36. Buchanan, D.L.; Nolan, J.; Suddaby, P.; Rouse, J.E.; Viljoen, M.J.; Davenport, J.W.J. The genesis of sulfide mineralization in a portion of the Potgietersrus Limb of the Bushveld Complex. Econ. Geol. 1981, 76, 568–579. [Google Scholar] [CrossRef]
  37. Hatton, C.J.; Schweitzer, J.K. Evidence for synchronous extrusive and intrusive Bushveld magmatism. J. Afr. Earth Sci. 1995, 21, 579–594. [Google Scholar] [CrossRef]
  38. Barnes, S.J.; Holwell, D.A.; Le Vaillant, M. Magmatic sulfide ore deposits. Elements 2017, 13, 89–95. [Google Scholar] [CrossRef] [Green Version]
  39. Brandt, S.; Klemd, R.; Haase, K.M.; Fassbender, M.L.; Vennemann, T. Formation of the Vergenoeg F–Fe–REE Deposit (South Africa) by Accumulation from a Ferroan Silicic Magma. J. Pet. 2020. [Google Scholar] [CrossRef]
  40. Vermaak, C.F. The Platinum Group Metals: A Global Perspective; Mintek: Randburg, South Africa, 1995. [Google Scholar]
  41. Barnes, S.-J.; Maier, W.D. Platinum-group element distributions in the Rustenberg Layered Suite of the Bushveld Complex, South Africa. In The Geology, Geochemistry, Mineralogy and Mineral Beneficiation of Platinum-Group Elements; Cabri, L.J., Ed.; Canadian Institute of Mining, Metallurgy and Petroleum: Montreal, QC, Canada, 2002; Special Volume 54, pp. 431–458. [Google Scholar]
  42. Eales, H.V.; Cawthorn, R.G. The Bushveld Complex. In Developments in Petrology; Cawthorn, R.G., Ed.; Elsevier: Amsterdam, The Netherlands, 1996; Volume 15, pp. 181–229. [Google Scholar]
  43. Wilson, A.H. The earliest stages of emplacement of the eastern Bushveld Complex: Development of the Lower Zone, Marginal Zone and Basal Ultramafic Sequence. J. Pet. 2015, 56, 347–388. [Google Scholar] [CrossRef] [Green Version]
  44. Grobler, D.F.; Brits, J.A.N.; Maier, W.D.; Crossingham, A. Litho- and chemostratigraphy of the Flatreef PGE deposit, northern Bushveld Complex. Miner. Depos. 2019, 54, 3–28. [Google Scholar] [CrossRef] [Green Version]
  45. Mitchell, A.A.; Scoon, R.N. The Platreef of the Bushveld Complex, South Africa: A new hypothesis of multiple, non-sequential magma replenishment based on observations at the Akanani project, north-west of Mokopane. S. Afr. J. Geol. 2012, 115, 535–550. [Google Scholar] [CrossRef]
  46. Naldrett, T.; Kinnaird, J.; Wilson, A.; Chunnett, G. Concentration of PGE in the Earth’s crust with special reference to the Bushveld Complex. Earth Sci. Front. 2008, 15, 264–297. [Google Scholar] [CrossRef]
  47. Van Der Merwe, M.J. The geology and structure of the Rustenburg Layered Suite in the Potgietersrus/Mokopane area of the Bushveld Complex, South Africa. Miner. Depos. 2008, 43, 405–419. [Google Scholar] [CrossRef]
  48. Yudovskaya, M.A.; Kinnaird, J.A.; Sobolev, A.V.; Kuzmin, D.V.; McDonald, I.; Wilson, A.H. Petrogenesis of the Lower Zone olivine-rich cumulates beneath the Platreef and their correlation with recognized occurrences in the Bushveld Complex. Econ. Geol. 2013, 108, 1923–1952. [Google Scholar] [CrossRef]
  49. Holwell, D.A.; Armitage, P.E.B.; McDonald, I. Observations on the relationship between the Platreef and its hanging wall. Appl. Earth Sci. 2005, 114, 199–207. [Google Scholar] [CrossRef]
  50. Holwell, D.A.; Jordaan, A. Three-dimensional mapping of the Platreef at the Zwartfontein South mine: Implications for the timing of magmatic events in the northern limb of the Bushveld Complex, South Africa. Appl. Earth Sci. 2006, 115, 41–48. [Google Scholar] [CrossRef]
  51. Huthmann, F.M.; Yudovskaya, M.A.; Frei, D.; Kinnaird, J.A. Geochronological evidence for an extension of the Northern Lobe of the Bushveld Complex, Limpopo Province, South Africa. Precambrian Res. 2016, 280, 61–75. [Google Scholar] [CrossRef]
  52. Kruger, F.J. Filling the Bushveld Complex magma chamber: Lateral expansion, roof and floor interaction, magmatic unconformities, and the formation of giant chromitite, PGE and Ti-V-magnetitite deposits. Miner. Depos. 2005, 40, 451–472. [Google Scholar] [CrossRef]
  53. Maier, W.D.; Bowen, M.P. The UG2–Merensky Reef interval of the Bushveld Complex northwest of Pretoria. Miner. Depos. 1996, 31, 386–393. [Google Scholar]
  54. McDonald, I.; Harmer, R.E.; Holwell, D.A.; Hughes, H.S.R.; Boyce, A.J. Cu-Ni-PGE mineralisation at the Aurora Project and potential for a new PGE province in the Northern Bushveld Main Zone. Ore Geol. Rev. 2017, 80, 1135–1159. [Google Scholar] [CrossRef] [Green Version]
  55. Seabrook, C.L.; Cawthorn, R.G.; Kruger, F.J. The Merensky Reef, Bushveld Complex: Mixing of minerals not mixing of magmas. Econ. Geol. 2005, 100, 1191–1206. [Google Scholar] [CrossRef]
  56. McDonald, I.; Holwell, D.A. Did lower zone magma conduits store PGE-rich sulphides that were later supplied to the Platreef? S. Afr. J. Geol. 2007, 110, 611–616. [Google Scholar] [CrossRef]
  57. Holwell, D.A.; Jones, A.; Smith, J.W.; Boyce, A.J. New mineralogical and isotopic constraints on Main Zone-hosted PGE mineralisation at Moorddrift, northern Bushveld Complex. Miner. Depos. 2013, 48, 675–686. [Google Scholar] [CrossRef]
  58. Kinnaird, J.A.; Yudovskaya, M.; McCreesh, M.; Huthmann, F.; Botha, T.J. The Waterberg platinum group element deposit: Atypical mineralization in mafic-ultramafic rocks of the Bushveld Complex, South Africa. Econ. Geol. 2017, 112, 1367–1394. [Google Scholar] [CrossRef]
  59. Maier, W.D.; Barnes, S.-J. The petrogenesis of platinum-group element reefs in the Upper Main Zone of the Northern Lobe of the Bushveld Complex on the farm Moorddrift, South Africa. Econ. Geol. 2010, 105, 841–854. [Google Scholar] [CrossRef]
  60. McCreesh, M.J.G.; Yudovskaya, M.A.; Kinnaird, J.A.; Reinke, C. Platinum-group minerals of the F and T zones, Waterberg Project, far northern Bushveld Complex: Implication for the formation of the PGE mineralization. Miner. Mag. 2018, 82, 539–575. [Google Scholar] [CrossRef]
  61. Nex, P.A.M. The structural setting of mineralisation on Tweefontein Hill, northern limb of the Bushveld Complex, South Africa. Appl. Earth Sci. 2005, 114, 243–251. [Google Scholar] [CrossRef]
  62. McDonald, I.; Holwell, D.A.; Armitage, P.E.B. Geochemistry and mineralogy of the Platreef and “Critical Zone” of the northern lobe of the Bushveld Complex, South Africa: Implications for Bushveld stratigraphy and the development of PGE mineralisation. Miner. Depos. 2005, 40, 526–549. [Google Scholar] [CrossRef]
  63. Günther, T.; Haase, K.M.; Klemd, R.; Teschner, C. Mantle sources and magma evolution of the Rooiberg lavas, Bushveld Large Igneous Province, South Africa. Contrib. Miner. Pet. 2018, 173, 51. [Google Scholar] [CrossRef]
  64. Wohlgemuth-Ueberwasser, C.C.; Ballhaus, C.; Berndt, J.; Stotter née Paliulionyte, V.; Meisel, T. Synthesis of PGE sulfide standards for laser ablation inductively coupled plasma mass spectrometry (LA-ICP-MS). Contrib. Miner. Pet. 2007, 154, 607–617. [Google Scholar] [CrossRef]
  65. LaFlamme, C.; Martin, L.; Jeon, H.; Reddy, S.M.; Selvaraja, V.; Caruso, S.; Bui, T.H.; Roberts, M.P.; Voute, F.; Hagemann, S.; et al. In situ multiple sulfur isotope analysis by SIMS of pyrite, chalcopyrite, pyrrhotite, and pentlandite to refine magmatic ore genetic models. Chem. Geol. 2016, 444, 1–15. [Google Scholar] [CrossRef] [Green Version]
  66. Kita, N.T.; Ushikubo, T.; Fu, B.; Valley, J.W. High precision SIMS oxygen isotope analysis and the effect of sample topography. Chem. Geol. 2009, 264, 43–57. [Google Scholar] [CrossRef]
  67. Barnes, S.J.; Mungall, J.E.; Le Vaillant, M.; Godel, B.; Lesher, C.M.; Holwell, D.; Lightfoot, P.C.; Krivolutskaya, N.; Wei, B. Sulfide-silicate textures in magmatic Ni-Cu-PGE sulfide ore deposits: Disseminated and net-textured ores. Am. Miner. 2017, 102, 473–506. [Google Scholar] [CrossRef] [Green Version]
  68. Whitney, D.L.; Evans, B.W. Abbreviations for names of rock-forming minerals. Am. Miner. 2010, 95, 185–187. [Google Scholar] [CrossRef]
  69. Deer, W.A.; Howie, R.A.; Zussman, J. An Introduction to the Rock-Forming Minerals; Mineralogical Society of Great Britain and Ireland: London, UK, 2013. [Google Scholar]
  70. McDonough, W.F.; Sun, S.S. The composition of the Earth. Chem. Geol. 1995, 120, 223–253. [Google Scholar] [CrossRef]
  71. Maier, W.D.; Arndt, N.T.; Curl, E.A. Progressive crustal contamination of the Bushveld Complex: Evidence from Nd isotopic analyses of the cumulate rocks. Contrib. Miner. Pet. 2000, 140, 316–327. [Google Scholar] [CrossRef]
  72. Holwell, D.A.; McDonald, I. Petrology, geochemistry and the mechanisms determining the distribution of platinum-group element and base metal sulphide mineralisation in the Platreef at Overysel, northern Bushveld Complex, South Africa. Miner. Depos. 2006, 41, 575. [Google Scholar] [CrossRef]
  73. Taylor, S.R.; McLennan, S.M. The Continental Crust: Its Composition and Evolution; Blackwell Scientific: Oxford, UK, 1985. [Google Scholar]
  74. Barnes, S.-J.; Prichard, H.M.; Cox, R.A.; Fisher, P.C.; Godel, B. The location of the chalcophile and siderophile elements in platinum-group element ore deposits (a textural, microbeam and whole rock geochemical study): Implications for the formation of the deposits. Chem. Geol. 2008, 248, 295–317. [Google Scholar] [CrossRef]
  75. Sharman-Harris, E.R.; Kinnaird, J.A.; Harris, C.; Horstmann, U.E. A new look at sulphide mineralisation of the northern limb, Bushveld Complex: A stable isotope study. Appl. Earth Sci. 2005, 114, 252–263. [Google Scholar] [CrossRef]
  76. Smith, J.W.; Holwell, D.A.; McDonald, I.; Boyce, A.J. The application of S isotopes and S/Se ratios in determining ore-forming processes of magmatic Ni–Cu–PGE sulfide deposits: A cautionary case study from the northern Bushveld Complex. Ore Geol. Rev. 2016, 73, 148–174. [Google Scholar] [CrossRef] [Green Version]
  77. Westerlund, K.J.; Gurney, J.J.; Carlson, R.W.; Shirey, S.B.; Hauri, E.H.; Richardson, S.H. A metasomatic origin for late Archean eclogitic diamonds: Implications from internal morphology of diamonds and Re-Os and S isotope characteristics of their sulfide inclusions from the late Jurassic Klipspringer kimberlites. S. Afr. J. Geol. 2004, 107, 119–130. [Google Scholar] [CrossRef]
  78. Penniston-Dorland, S.C.; Wing, B.A.; Nex, P.A.M.; Kinnaird, J.A.; Farquhar, J.; Brown, M.; Sharman, E.R. Multiple sulfur isotopes reveal a magmatic origin for the Platreef platinum group element deposit, Bushveld Complex, South Africa. Geology 2008, 36, 979–982. [Google Scholar] [CrossRef]
  79. Buick, I.S.; Gibson, R.L.; Cartwright, I.; Maas, R.; Wallmach, T.; Uken, R. Fluid flow in metacarbonates associated with emplacement of the Bushveld Complex, South Africa. J. Geochem. Explor. 2000, 69–70, 391–395. [Google Scholar] [CrossRef]
  80. Schouwstra, R.P. Further development of a chemistry proxy for geometallurgical modelling at the Mogalakwena mine. J. S. Afr. Inst. Min. Met. 2017, 117. [Google Scholar] [CrossRef] [Green Version]
  81. McCutcheon, S. Platinum Group Mineral Assemblages in the Platreef on Tweefontein, Northern Bushveld Complex, South Africa. Master’s Thesis, University of the Witwatersrand, Johannesburg, South Africa, 2013. [Google Scholar]
  82. Ashwal, L.D.; Webb, S.J.; Knoper, M.W. Magmatic stratigraphy in the Bushveld Northern Lobe: Continuous geophysical and mineralogical data from the 2950 m Bellevue drillcore. S. Afr. J. Geol. 2005, 108, 199–232. [Google Scholar] [CrossRef]
  83. Gain, S.B.; Mostert, A.B. The geological setting of the platinoid and base metal sulfide mineralization in the Platreef of the Bushveld Complex in Drenthe, North of Potgietersrus. Econ. Geol. 1982, 77, 1395–1404. [Google Scholar] [CrossRef]
  84. Barnes, S.-J.; Cox, R.A.; Zientek, M.L. Platinum-group element, gold, silver and base metal distribution in compositionally zoned sulfide droplets from the Medvezky Creek Mine, Noril’sk, Russia. Contrib. Miner. Pet. 2006, 152, 187–200. [Google Scholar] [CrossRef]
  85. Trubač, J.; Ackerman, L.; Gauert, C.; Ďurišová, J.; Hrstka, T. Platinum-group elements and gold in base metal sulfides, platinum-group minerals, and Re-Os isotope compositions of the Uitkomst Complex, South Africa. Econ. Geol. 2018, 113, 439–461. [Google Scholar] [CrossRef]
  86. Barnes, S.-J.; Savard, D.; Bédard, L.P.; Maier, W.D. Selenium and sulfur concentrations in the Bushveld Complex of South Africa and implications for formation of the platinum-group element deposits. Miner. Depos. 2009, 44, 647. [Google Scholar] [CrossRef]
  87. Eckstrand, O.R.; Hulbert, L.J. Selenium and the source of sulfur in magmatic nickel and platinum deposits. In Geological Association of Canada-Mineralogical Association Canada Program with Abstracts; Geological Association of Canada: St. John’s, NL, Canada, 1987; Volume 12, p. 40. [Google Scholar]
  88. Yamamoto, M. Relationship between Se/S and sulfur isotope ratios of hydrothermal sulfide minerals. Miner. Depos. 1976, 11, 197–209. [Google Scholar] [CrossRef]
  89. Howard, H.J. Geochemistry of selenium: Formation of ferroselite and selenium behavior in the vicinity of oxidizing sulfide and uranium deposits. Geochim. Cosmochim. Acta 1977, 41, 1665–1678. [Google Scholar] [CrossRef]
  90. Beinlich, A.; von Heydebrand, A.; Klemd, R.; Martin, L.; Hicks, J. Desulphurisation, chromite alteration, and bulk rock PGE redistribution in massive chromitite due to hydrothermal overprint of the Panton Intrusion, east Kimberley, Western Australia. Ore Geol. Rev. 2020, 118, 103288. [Google Scholar] [CrossRef]
  91. Hidalgo, T.; Verrall, M.; Beinlich, A.; Kuhar, L.; Putnis, A. Replacement reactions of copper sulphides at moderate temperature in acidic solutions. Ore Geol. Rev. 2020, 123, 103569. [Google Scholar] [CrossRef]
  92. Allègre, C.J. Isotope Geology; Cambridge University Press: Cambridge, UK, 2008. [Google Scholar]
  93. Farquhar, J.; Bao, H.; Thiemens, M. Atmospheric influence of Earth’s earliest sulfur cycle. Science 2000, 289, 756–758. [Google Scholar] [CrossRef] [Green Version]
  94. White, W.M. Isotope Geochemistry; Wiley Blackwell: Hoboken, NJ, USA, 2015; p. 478. [Google Scholar]
Figure 1. Geological map of the northern limb of the Bushveld Complex, showing the Platreef north of Mokopane modified after [61]. The borehole location (OY541) is indicated by the red diamond.
Minerals 10 00570 g001
Figure 2. Simplified stratigraphy of the borehole (OY541) showing the clinopyroxenite package, which forms the footwall to the Platreef at Overysel based on the present study and core log information provided by Anglo Platinum. Grade and distribution of mineralization is indicated by red boxes (3PGE + Au). The numbers attached on the left give the sample depth in meters. The blue rectangles mark the sections studied here.
Minerals 10 00570 g002
Figure 6. Binary variation diagrams of (A) CaO vs. MgO; (B) SiO2 vs. MgO (black squares represent the bulk chemistry of the samples studied here). Fields framed by stippled lines display the range of clinopyroxenite composition from Sandsloot (modified after [3]). The plagioclase, dolomite, calcite, serpentine and calcsilicate compositions are compiled from Pronost, Harris and Pin [6]; McDonald and Holwell [28]; and Deer, Howie and Zussman [69]. The “magmatic trend” is a correlation between CaO and MgO, displaying a magmatic variation due to varying plagioclase and orthopyroxene proportions cf. [3,6].
Minerals 10 00570 g006
Figure 7. Multi-element diagram of trace elements (median values from LA-ICP-MS) of clinopyroxenite samples normalized against primitive mantle after McDonough and Sun [70]. D.L. = detection limit.
Minerals 10 00570 g007
Figure 8. Multi-element diagram of median Ni, Pt, Pd, Au and Cu values (from LA-ICP-MS) normalized against chondrite after McDonough and Sun [70]. The grey polygon represents the bulk Pt, Pd and Au range from Sandsloot, the dashed black line represents the bulk Pt, Pd and Au range from Overysel reef pyroxenites [72], both normalized [73].
Minerals 10 00570 g008
Figure 9. Chondrite normalized median PGE concentrations (from LAICP-MS) hosted by BMS. Normalization values were taken from McDonough and Sun [70].
Minerals 10 00570 g009
Figure 10. Calculated change of the base-metal sulphide content down-hole (data from Table 8).
Minerals 10 00570 g010
Figure 11. Calculated Pd proportion hosted by calculated pentlandite (data from Table 8).
Minerals 10 00570 g011
Figure 12. (A) Sulphur wt % vs. bulk Se (ppm) from samples with S contents associated with substantial amounts of mineralization; (B) Sulphur isotope compositions of measured pyrrhotite and pentlandite. The grey line represents the Δ33S range of the pristine magma, whereas the orange and red lines represent the δ34S range of the pristine magma. Error bars are 1σ [16,75,77,78].
Minerals 10 00570 g012
Figure 13. δ34S and bulk rock S/Se systematics of sample OY541-1, OY541-3b and OY541-4a. Red squares represent median values of the samples. Horizontal lines represent different suggested δ34S ranges for a pristine Bushveld magma.
Minerals 10 00570 g013
Table 1. Bulk rock compositions of the clinopyroxenite samples from drill core OY541.
Sample IDOY541-1OY541-2OY541-3a1OY541-3a2OY541-3bOY541-4a1OY541-4a2OY541-4b1OY541-4b2OY541-5OY541-6aOY541-6bOY541-7aOY541-7bOY541-7cOY541-8
Depth top (m)1124.411127.021131.105 1132.135 1133.9751137.04 1139.56 1142.01
Depth bottom (m)1124.651127.211131.44 1132.425 1133.111137.49 1139.13 1142.19
SiO2(wt %)43.750.355.650.147.345.254.853.346.442.641.342.632.131.942.639.8
TiO2(wt %)0.650.130.050.050.170.160.050.130.150.030.320.420.310.320.050.2
Al2O3(wt %)1.324.730.570.764.544.161.131.324.7317.6108.8818.518.53.591.32
FeO(wt %)115.552.322.7112.97.481.423.485.931.426.065.032.322.714.133.99
MgO(wt %)30.719.917.815.823.720.618.617.421.43.3218.821.627.229.224.733.5
CaO(wt %)3.7817.225.628.17.2816.825.224.418.134.918.217.210.56.7216.210.4
K2O(wt %)<0.10<0.10<0.10<0.10<0.10<0.10<0.10<0.10<0.10<0.10<0.10<0.10<0.100.2<0.10<0.10
S(wt %)0.610.030.050.210.811.150.020.030.49BDL0.020.260.780.030.620.36
Seppm3.61.51.12.76.74.61.31.52.221.61.513.62.24.94.7
Nippm2710230750121025802170602301990BDL290604260240378030
Cuppm12601671361050133019109351450BDL3962920BDL2560882
Mnppm102012801380128017901380185018601490972185015003710407022902190
Pdppb17301617155023103640232248015132890459404090
Ptppb1360BDL43811201550102004171550BDL1431440337502370
Auppb302BDL3210022160031221479BDL93496117
BappmBDLBDLBDLBDL4BDLBDLBDLBDLBDL947BDLBDLBDLBDL
Thppm0.10.20.30.30.412.93.50.420.21.41.30.2BDL0.29.7
UppmBDLBDLBDLBDLBDLBDLBDL0.4BDL110.20.20.5BDLBDL1.5
NbppmBDLBDLBDLBDLBDLBDLBDL2.5BDL4.8BDLBDLBDLBDLBDLBDL
TappmBDLBDLBDLBDLBDLBDLBDLBDLBDL0.2BDLBDLBDLBDLBDL0.4
Srppm812122361025249BDL1314228129
Yppm3.18.25.74.95.911.86.313.59.611.711.119.34.72.67.116.9
Crppm133033060BDL17201170BDL50060BDL41070160BDLBDLBDL
Pbppm3.94.45.214.94.93.91.42.23.535.13.3102.2BDL7.75.1
Lappm12.312.22.14.71.95.31.93.66.93.83.12.82.84.4
Ceppm2.36.735.34.711.94.913.44.97.214.110.885.46.710.2
Prppm0.310.40.60.61.70.61.70.70.81.81.610.60.91.3
Ndppm1.24.71.82.62.47.22.57.63.53.187.542.13.75.3
SmppmBDL1.20.20.20.41.80.41.70.70.81.82.10.70.20.91.4
Euppm0.10.40.10.10.20.30.20.40.30.30.80.60.10.20.30.3
Gdppm0.51.60.80.90.92.31.12.61.51.62.33.11.10.51.32.1
TbppmBDL0.30.20.20.10.30.30.50.30.30.30.60.2BDL0.20.4
Dyppm0.51.61.21.112.21.52.71.91.92.13.51.10.41.32.9
HoppmBDL0.40.2BDL0.20.50.30.60.40.40.50.80.2BDL0.30.7
Erppm0.40.90.40.40.71.30.51.511.21.22.10.60.30.71.9
TmppmBDL0.1BDLBDL0.10.2BDL0.20.10.20.20.3BDLBDL0.10.3
Ybppm0.30.70.40.30.71.10.41.20.81.311.60.30.30.61.6
AsppmBDLBDL8BDLBDL5BDLBDLBDLBDLBDLBDLBDLBDLBDLBDL
BippmBDLBDLBDLBDLBDLBDLBDLBDLBDLBDLBDLBDLBDLBDLBDLBDL
TeppmBDLBDLBDLBDLBDLBDLBDLBDLBDLBDLBDLBDLBDLBDLBDLBDL
BDL: below detection limit.
Table 2. Representative rim and core compositions of clinopyroxene measured by electron microprobe.
Sample IDOY541-3bOY541-3b1σ * (n = 55)OY541-4b1OY541-4b11σ * (n = 51)OY541-7cOY541-7c1σ * (n = 33)
Spot#105109 5075 4433
Locationrimcore rimcore rimcore
SiO254.1154.570.9254.6653.680.7955.9455.621.7
TiO20.050.080.150.020.150.14000.16
Al2O30.750.470.880.761.450.60.140.062.29
FeO(tot)2.110.984.081.742.972.280.180.090.61
MnO0.120.150.080.190.240.060.960.641.19
MgO17.0817.593.3216.9216.181.0118.0318.321.25
CaO24.8224.627.8124.5124.431.3824.4924.860.65
NiO0.050.050.0300.030.0200.010.01
Na2O0.0200.240.030.050.180.010.010.03
Total99.1198.51 98.8399.18 99.7599.61
Structural formulae in atoms per formula unit (6 oxygens)
Si1.992.01 2.011.98 2.032.02
Ti0.000.00 0.000.00 0.000.00
Al0.030.02 0.030.06 0.010.00
Fe2+0.070.03 0.050.09 0.010.00
Mn0.000.01 0.010.01 0.030.02
Mg0.930.97 0.930.89 0.980.99
Ca0.980.97 0.970.96 0.950.97
Ni0.000.00 0.000.00 0.000.00
Na0.000.00 0.000.00 0.000.00
Sum4.004.00 4.004.00 4.004.00
* The standard deviation is based on both core and rim concentrations.
Table 3. Representative compositions of orthopyroxene relics in clinopyroxene measured by electron microprobe.
Sample IDOY541-3bOY541-3bOY541-3bOY541-7c
Spot#129138145146
SiO255.1754.7254.1954.07
TiO20.050.210.090.18
Al2O31.111.131.551.43
FeO(tot)15.1415.1815.6915.50
MnO0.330.340.360.34
MgO26.8226.6826.7126.77
CaO1.651.610.741.16
NiO0.070.090.060.11
Na2O0.030.020.030.02
Total100.499.9899.4299.58
Structural formulae in atoms per formula unit (6 oxygens)
Si1.981.981.971.96
Ti0.000.010.000.01
Al0.050.050.070.06
Fe2+0.460.460.480.46
Mn0.010.010.010.01
Mg1.441.441.451.45
Ca0.060.060.030.05
Ni0.000.000.000.01
Na0.000.000.000.00
Sum4.004.004.004.00
Table 4. Sm-Nd isotope data of Platreef clinopyroxenites.
Sample ID143Nd/144Nd (Measured)Error (2 s.d.)Nd (ppm)Sm (ppm)147Sm/144Nd143Nd/144Nd (initial) aError beNd (CHUR) c
OY541-10.5117970.0000041.1980.3130.15790.5096550.000027−6.16
OY541-3a0.5115130.0000041.7090.3890.13750.5096470.000024−6.32
OY541-3b0.5116620.0000042.2710.5670.15090.5096150.000026−6.94
OY541-4a0.5116380.0000046.5191.590.14740.5096380.000026−6.49
OY541-80.5117590.0000045.4811.4190.15640.5096360.000027−6.52
a Initial isotope data are calculated assuming an age of 2061 Ma; b The errors on initial 143Nd/144Nd ratios are propagated from the uncertainty on the measured (present-day) 143Nd/144Nd and 147Sm/144Nd ratios; c Assuming CHUR values of 0.512638 and 0.1967 for 143Nd/144Nd and 147Sm/144Nd respectively.
Table 5. Minimum, maximum and median PGE concentrations (in ppm) in the BMS (from LA-ICP-MS).
Sample IDnOsIrRuRhPtPd
Mineral MinMaxMedianMinMaxMedianMinMaxMedianMinMaxMedianMinMaxMedianMinMaxMedian
OY541-1serpentinized clinopyroxenite
Pyrrhotite39BDL1.430.65BDL2.370.81BDL7.102.00BDLBDLBDLBDL0.760.56BDL0.930.93
Chalcopyrite33BDL0.940.94BDL0.250.20BDLBDLBDLBDLBDLBDLBDL0.810.55BDL0.980.21
Pentlandite30BDL3.801.37BDL3.101.86BDL27.76.76BDL16.94.39BDL2.720.6527.4566252
OY541-3aclinopyroxenite
Pyrrhotite18BDL2.231.52BDL3.782.68BDL22.86.98BDL0.350.35BDL0.890.62BDL0.740.72
Chalcopyrite43BDL3.771.14BDL7.481.05BDL27.63.28BDLBDLBDLBDL7.300.68BDL21.210.29
Pentlandite (I)10BDL0.550.550.751.800.912.984.693.418.559.919.12BDL1.481.4874.785.683.0
Pentlandite (II)210.4221.73.111.6012.24.710.8098.716.80.3555.016.60.425.161.21162198175
OY541-3bserpentinized clinopyroxenite
Pyrrhotite36BDL3.741.09BDL4.721.96BDL38.64.87BDL0.080.08BDL1.110.72BDL0.270.15
Chalcopyrite18BDLBDLBDLBDL0.570.40BDL0.660.66BDLBDLBDLBDL0.290.290.052.650.13
Pentlandite (I)111.841.911.191.842.722.247.4512.88.389.3724.511.9BDL0.600.52192227214
Pentlandite (II)8BDL0.460.46BDLBDLBDL0.902.811.231.373.621.94BDL0.490.49496631538
Pentlandite (III)28BDL3.411.830.657.553.370.4223.412.34.5362.614.1BDLBDLBDL100169134
OY541-4aserpentinized clinopyroxenite
Pyrrhotite58BDL1.490.90BDL3.281.18BDL20.755.60BDL2.310.19BDL2.001.00BDL3.600.12
Chalcopyrite9BDLBDLBDLBDLBDLBDLBDLBDLBDLBDLBDLBDLBDLBDLBDLBDLBDLBDL
Pentlandite39BDL2.951.24BDL26.12.65BDL34.211.7BDL65.418.8BDL0.160.16125341246
OY541-8bserpentinized clinopyroxenite
Chalcopyrite2BDLBDLBDLBDLBDLBDLBDLBDLBDLBDLBDLBDLBDLBDLBDLBDLBDLBDL
Pentlandite47BDL8.281.26BDL12.50.800.7341.59.980.1367.51.26BDL5.400.8489.2185112
BDL: below detection limit.
Table 6. Median values and standard deviations of sulphur isotope compositions.
Titleδ33S (‰, V-CDT)δ34S (‰, V-CDT)Δ33S
SampleMineralMedian1σMedian1σMedian1σn
OY541-1Ccp2.190.053.780.120.250.039
Po1.700.122.800.210.260.024
Pn1.510.032.420.070.280.024
OY541-3bCcp1.680.092.950.170.160.048
Po1.550.162.520.340.270.0416
Pn1.040.111.660.220.190.0619
OY541-4aCcp1.680.022.960.030.160.024
Po1.560.112.600.200.210.0421
Pn1.030.371.600.640.230.0611
OY541-8bCcp2.250.063.810.130.300.043
Pn1.810.522.980.950.240.108
Table 7. Median values for S, Ni, and Cu (EMP), and Pd and Pt (LA-ICP-MS) in Pn, Po and Ccp, as a basis for the mass-balance calculation.
Sample IDS Pn (%)S Po (%)S Ccp (%)Ni Pn (%)Cu Ccp (%)Pd in PnPd in PoPd in CcpPt in PnPt in PoPt in Ccp
(%)(%)(%)(%)(%)(ppm ± 1σ)(ppm)(ppm)(ppm)(ppm)(ppm)
OY541-133.337.334.630.434.7252.34 ± 131b. d. l.0.210.640.560.55
OY541-3a33.338.434.73235167.99 ± 550.720.291.250.620.68
OY541-3b33.338.334.931.535308.88 ± 1580.150.130.50.720.29
OY541-4a33.338.634.63235246.00 ± 540.12b. d. l.0.1641b. d. l.
OY541-8b33.2n. c.34.636.835.2111.87 ± 14n. p.b. d. l.0.84n. p.b. d. l.
n. p.: not present; b. d. l.: below the detection limit.
Table 8. Calculated proportions of pentlandite, pyrrhotite, chalcopyrite and Pt, and Pd proportions (in %) hosted by pentlandite in Overysel clinopyroxenite samples.
Population 1Population 1Population 2Population 2Population 3Population 3Median
Sample IDPn (%)Po (%)Ccp (%)Pd (%)Pt (%)Pd (%)Pt (%)Pd (%)Pt (%)Pd (%)
OY541-10.0750.0620.0381060.91n. c.n. c.n. c.n. c.106
OY541-3a0.0250.0050.02913.70.3430.20.28n. c.n. c.28.1
OY541-3b0.0740.1110.03863.20.231660.2139.2n. c.72.2
OY541-4a0.0670.190.05445.80.01n. c.n. c.n. c.n. c.45.8
OY541-8b0.0740.0060.02520.50.26n. c.n. c.n. c.n. c.20.5
n. c.: not calculated.

