Processing of Waste Copper Converter Slag Using Organic Acids for Extraction of Copper, Nickel, and Cobalt

 , , and
Abstract
:
1. Introduction
2. Materials and Methods
2.1. Materials
2.2. Methods
3. Results
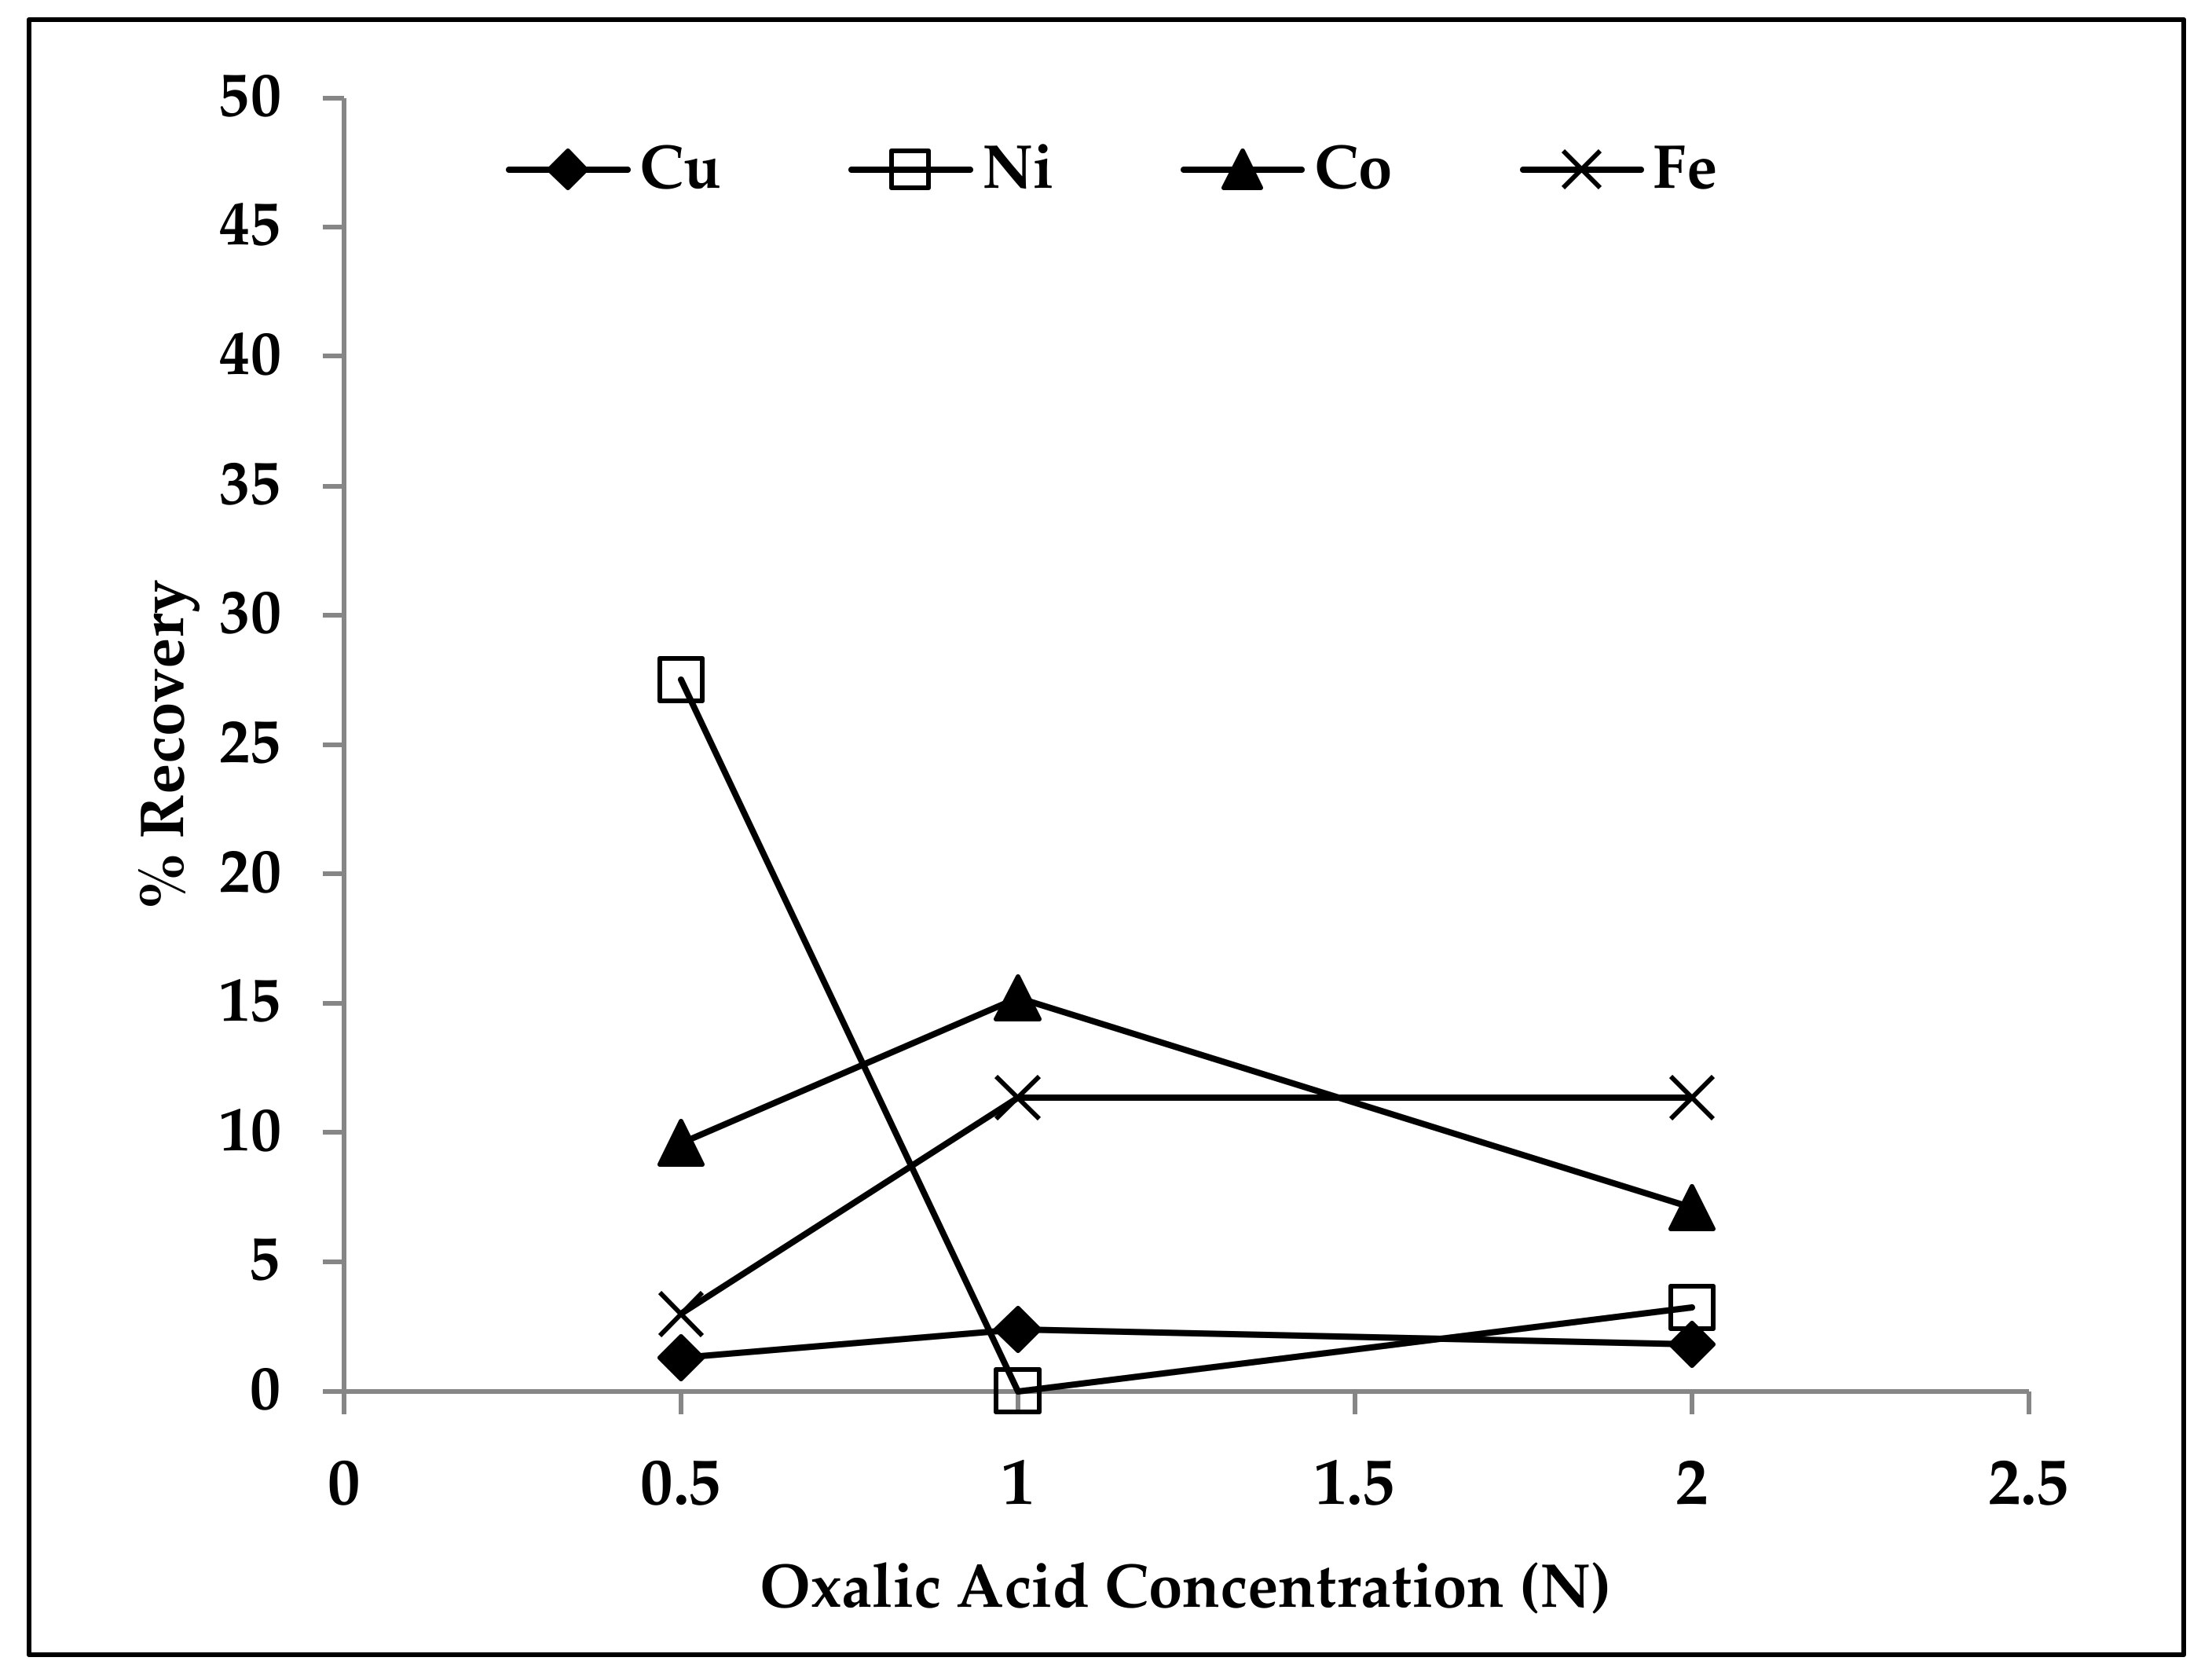
3.1. Oxalic Acid Leaching of Copper Converter Slag
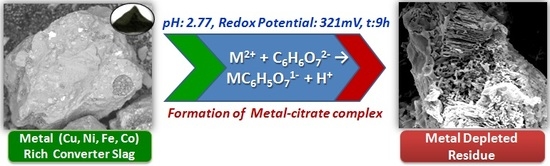
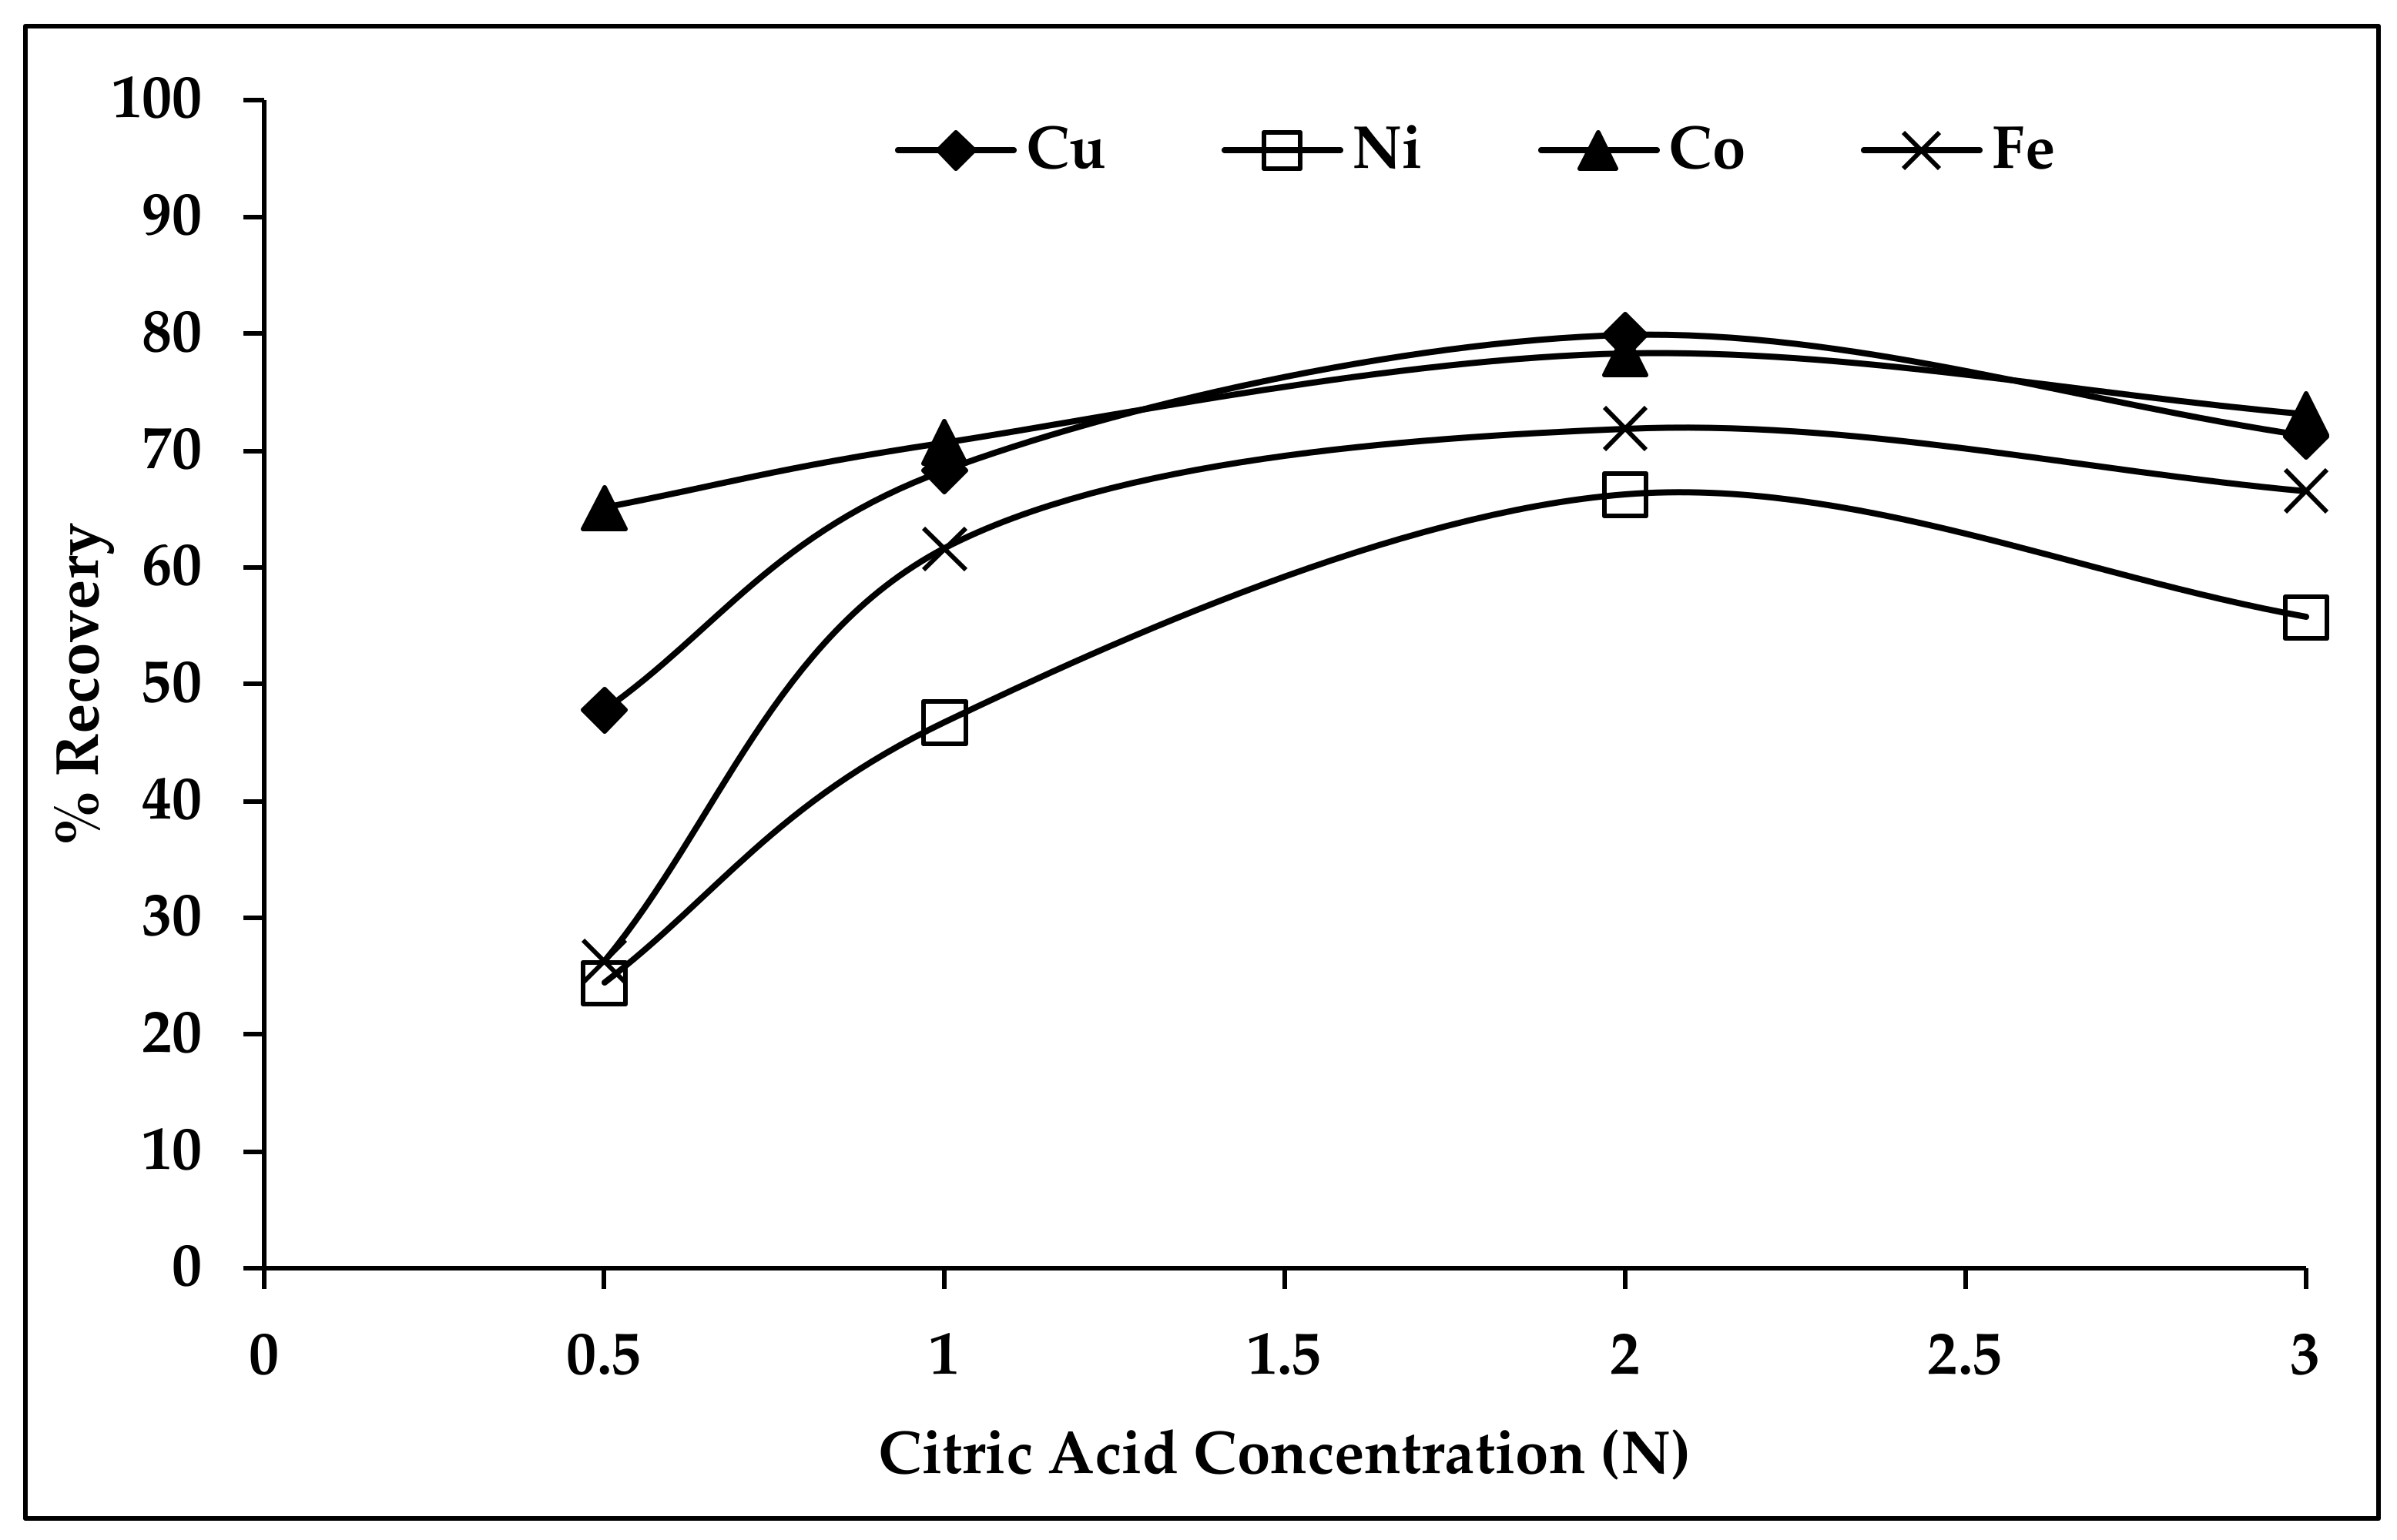
3.2. Citric Acid Leaching of Copper Converter Slag
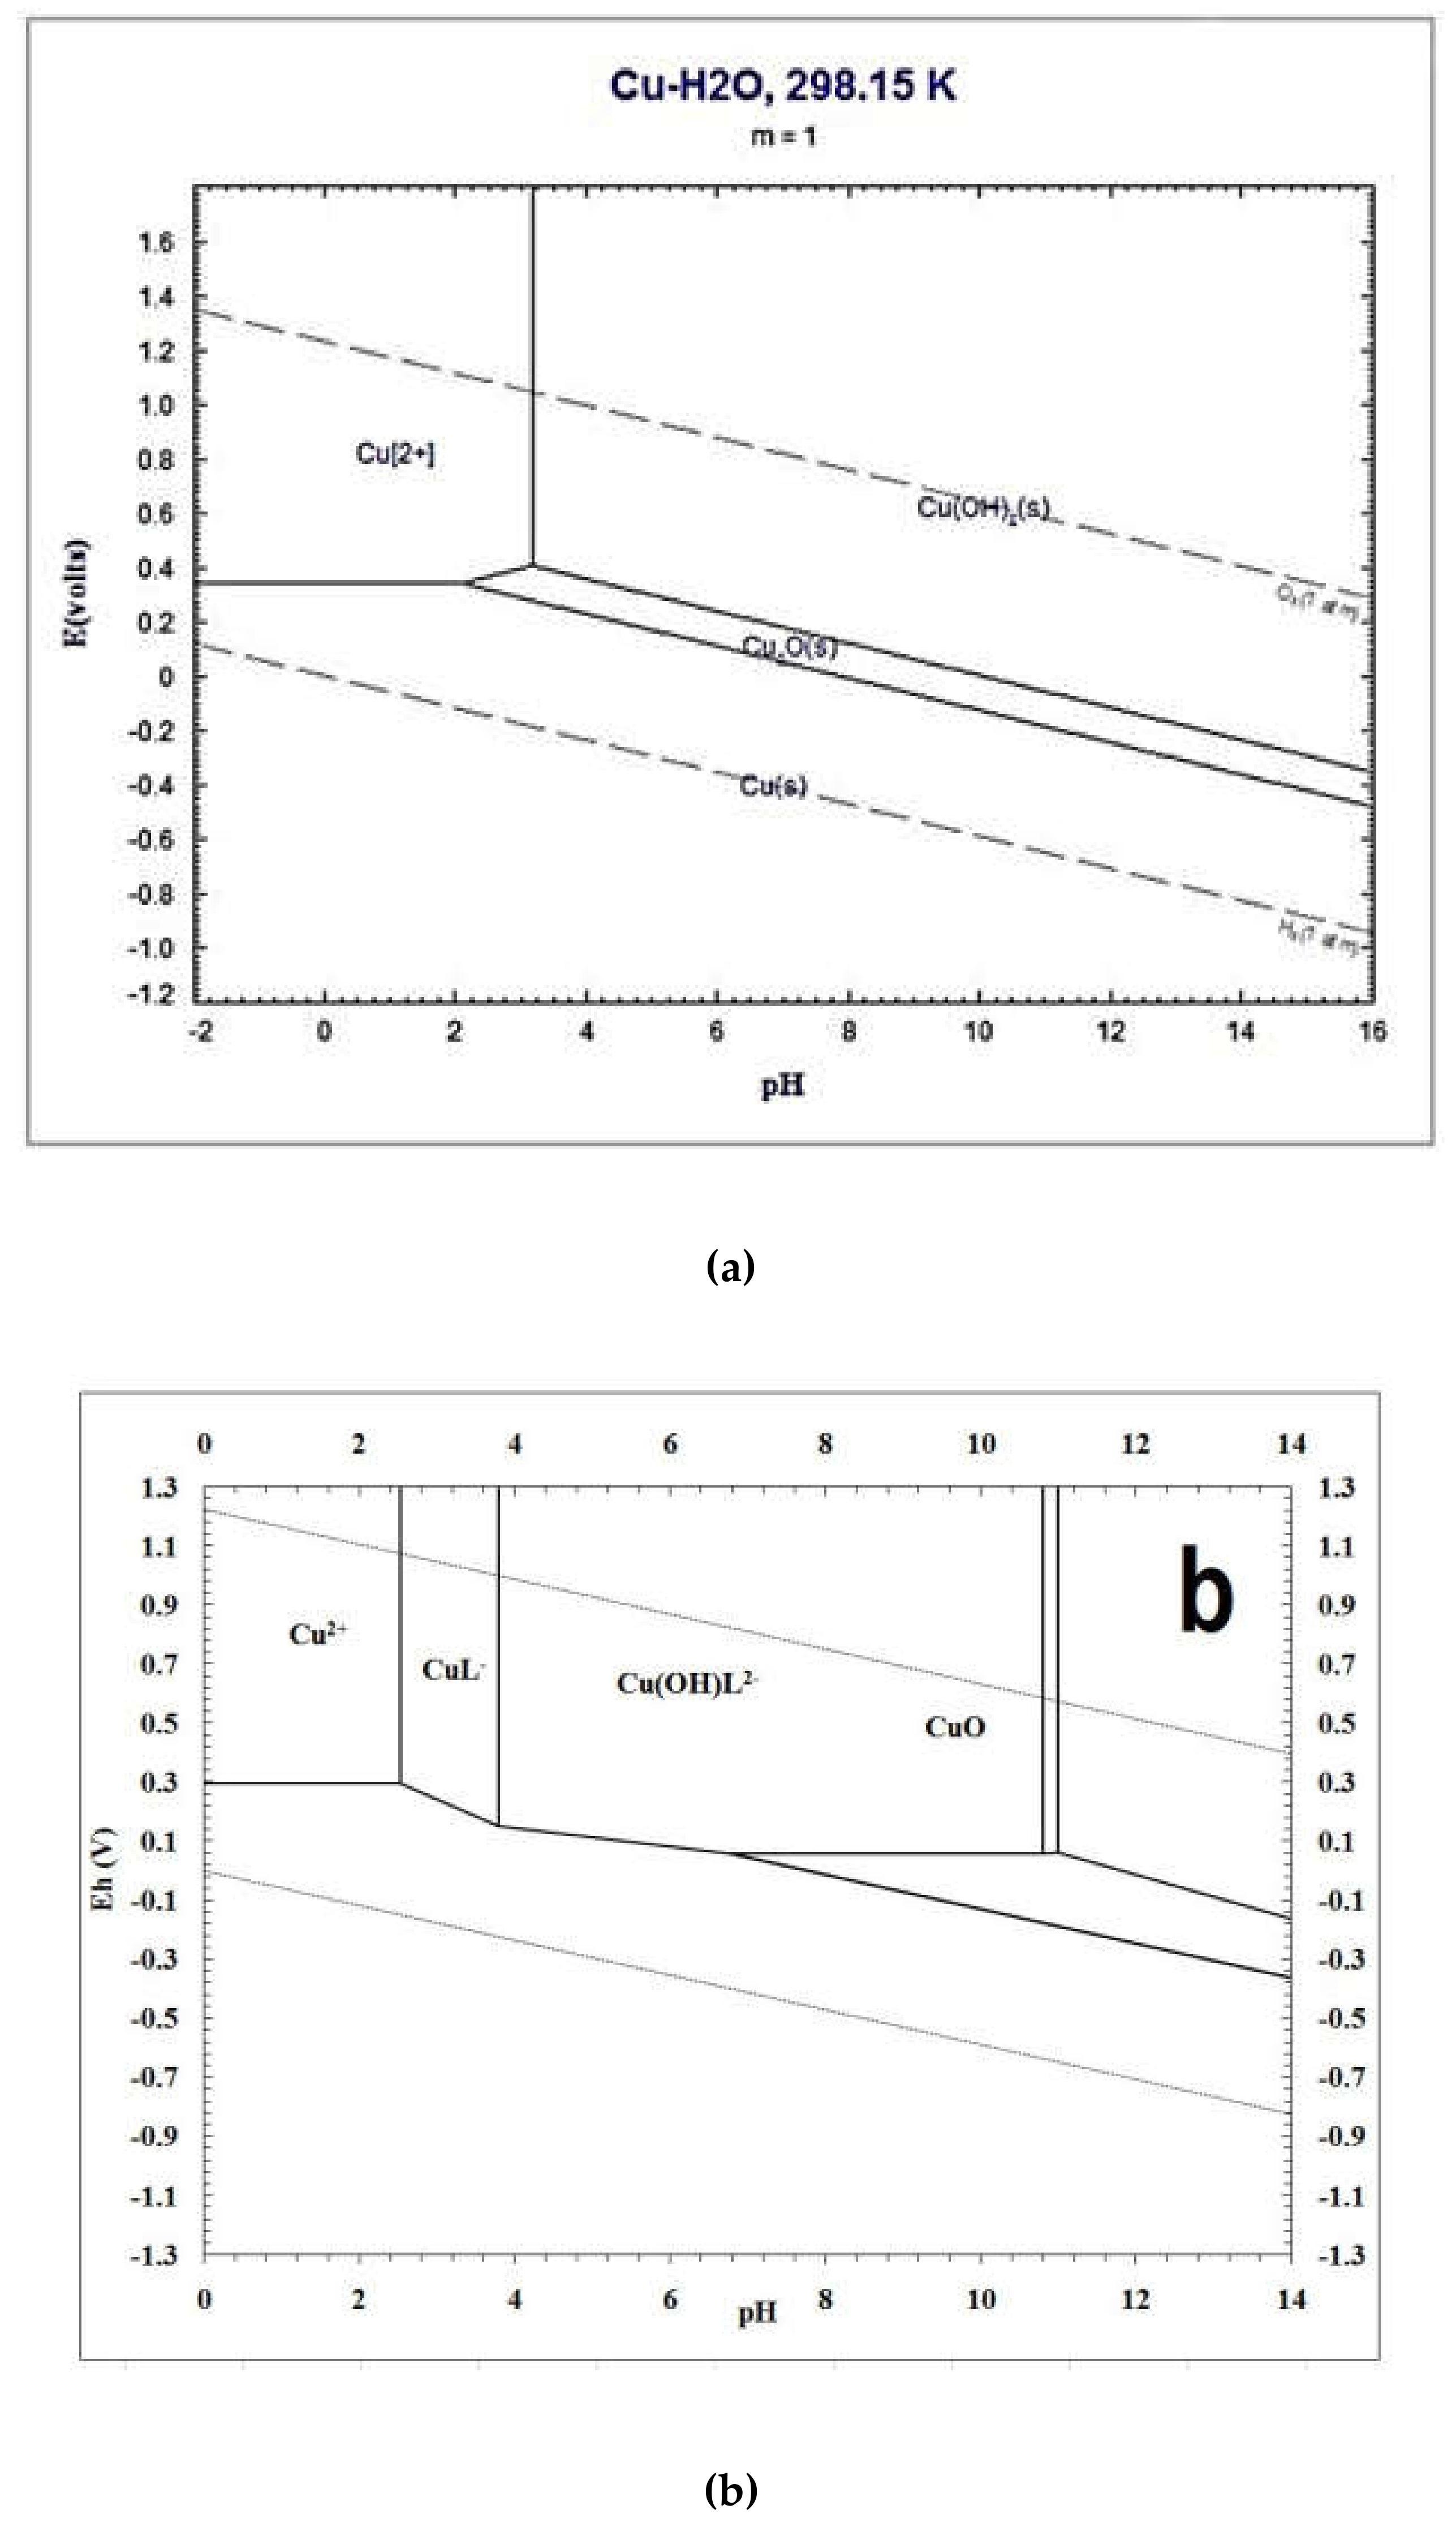
3.3. Pourbaix Diagram of Copper-Citrate System
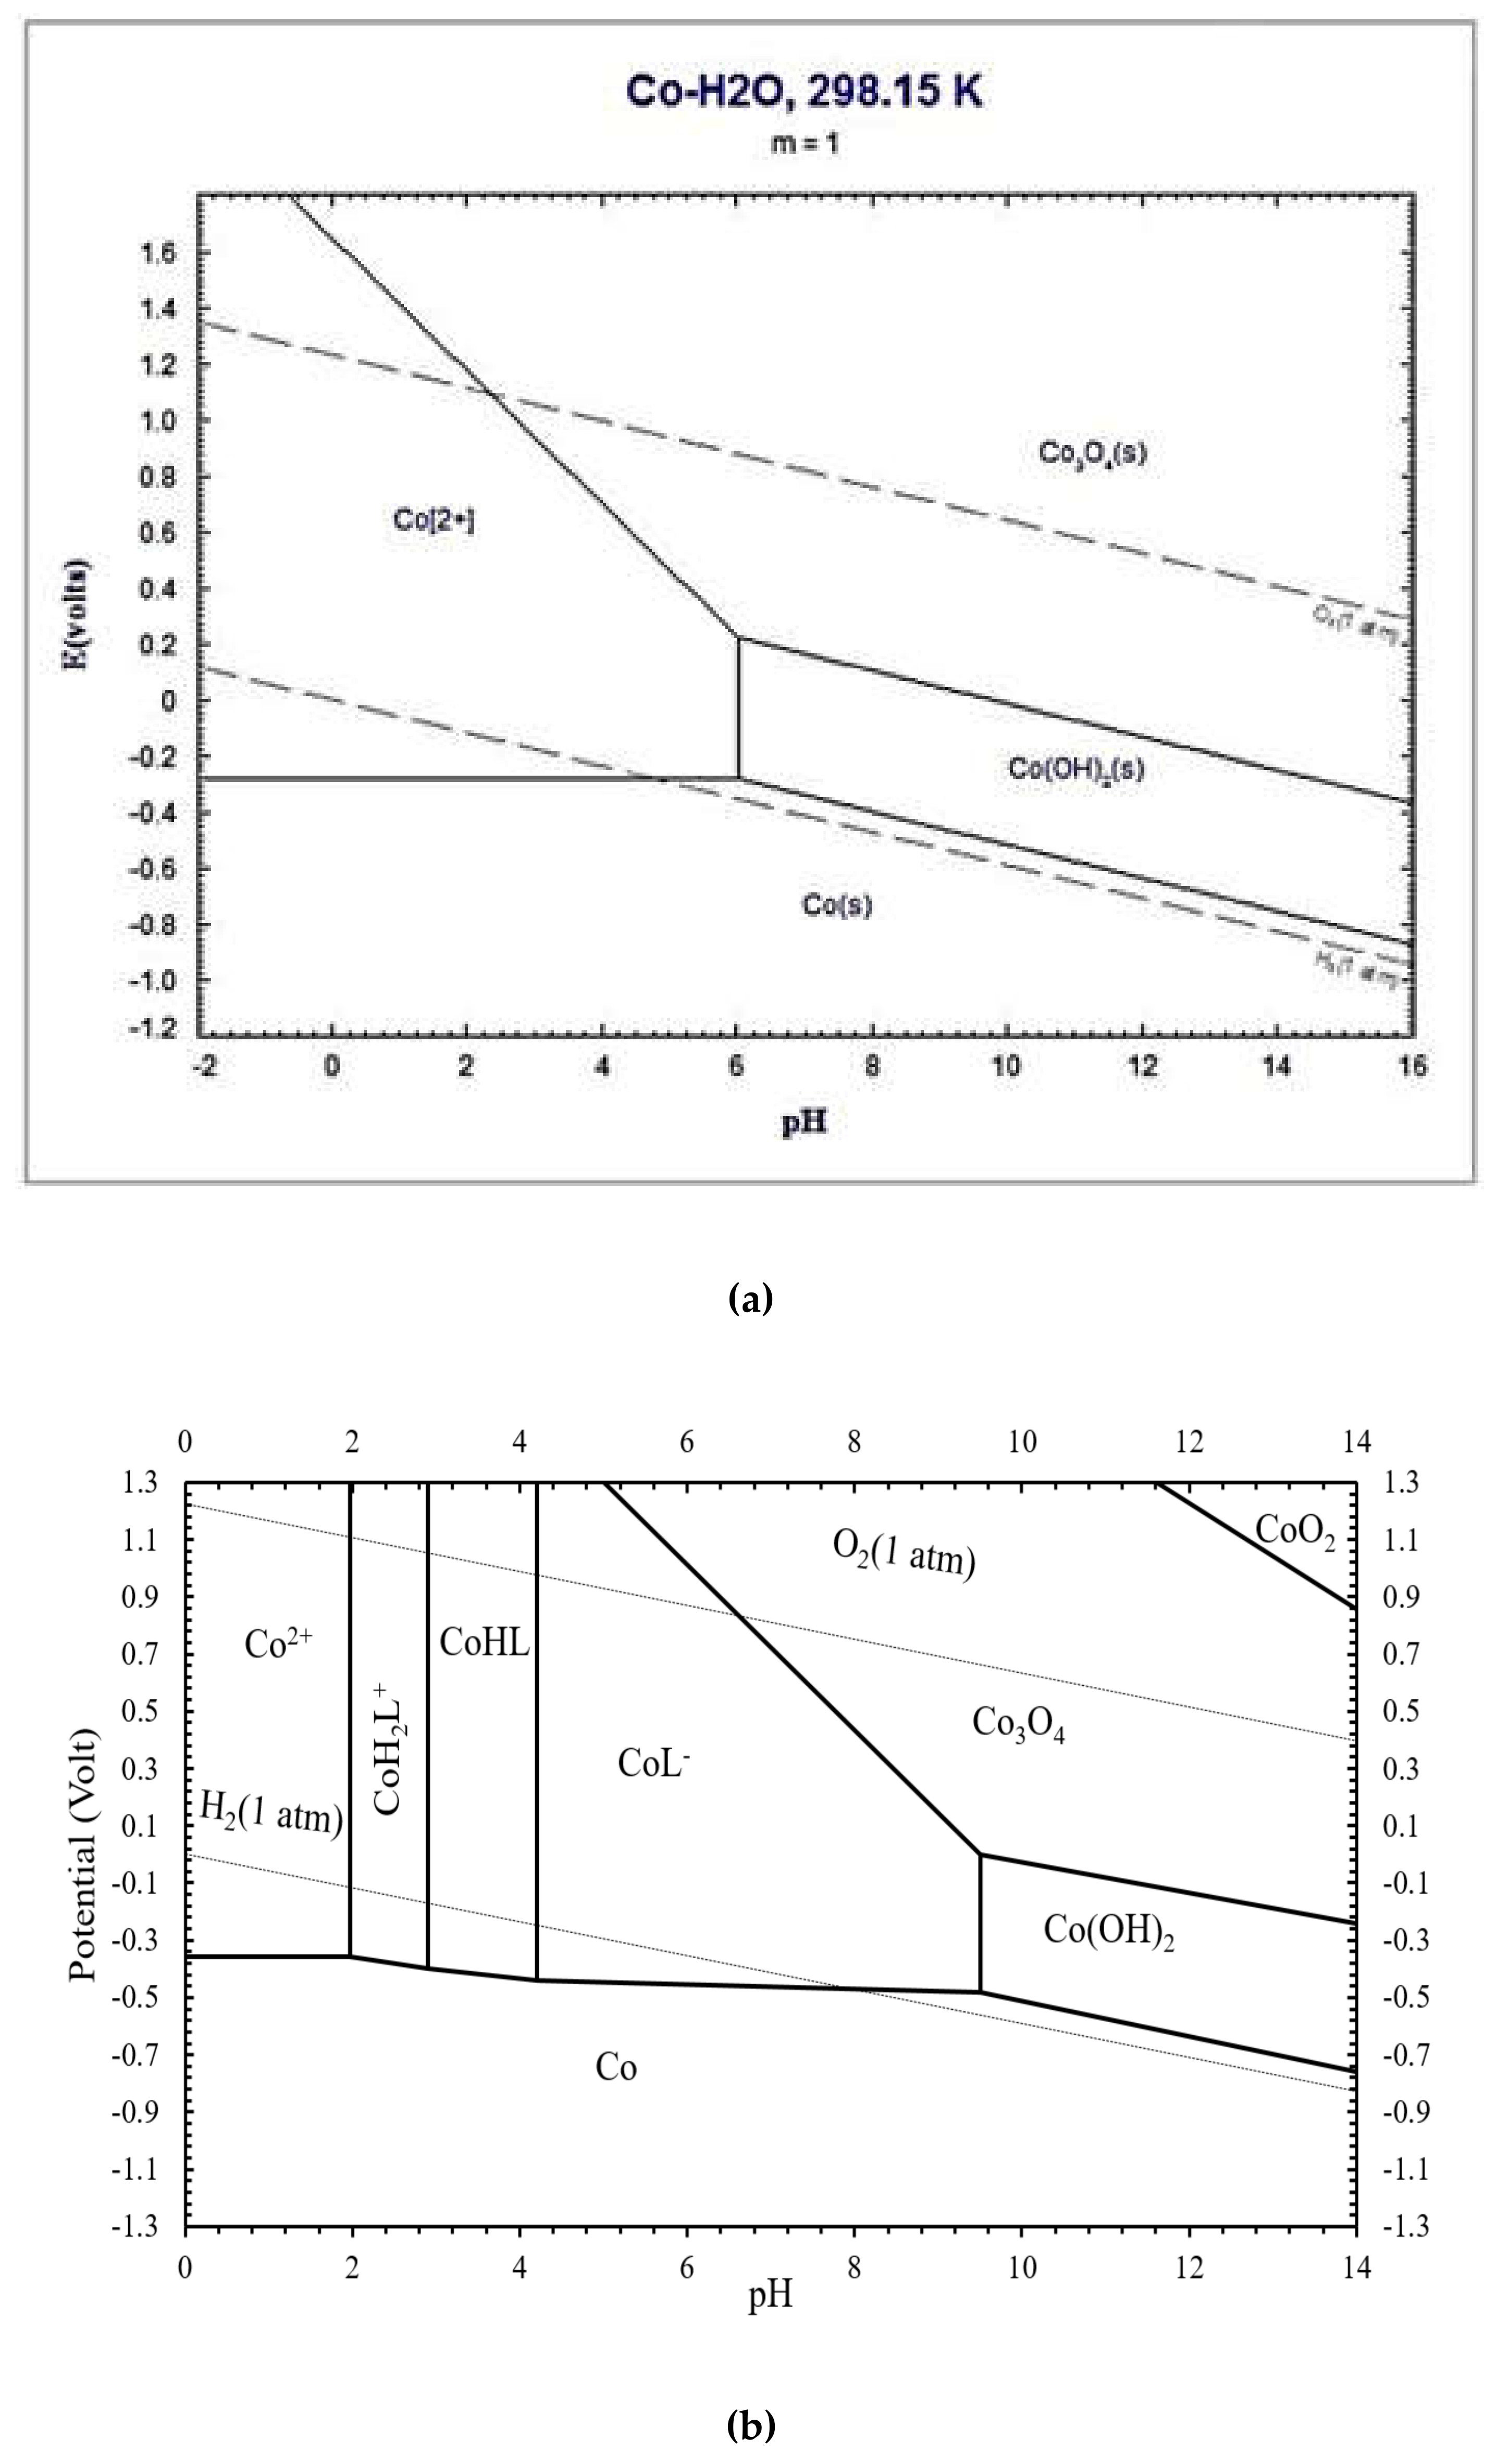
3.4. Pourbaix Diagram of Cobalt-Citrate System
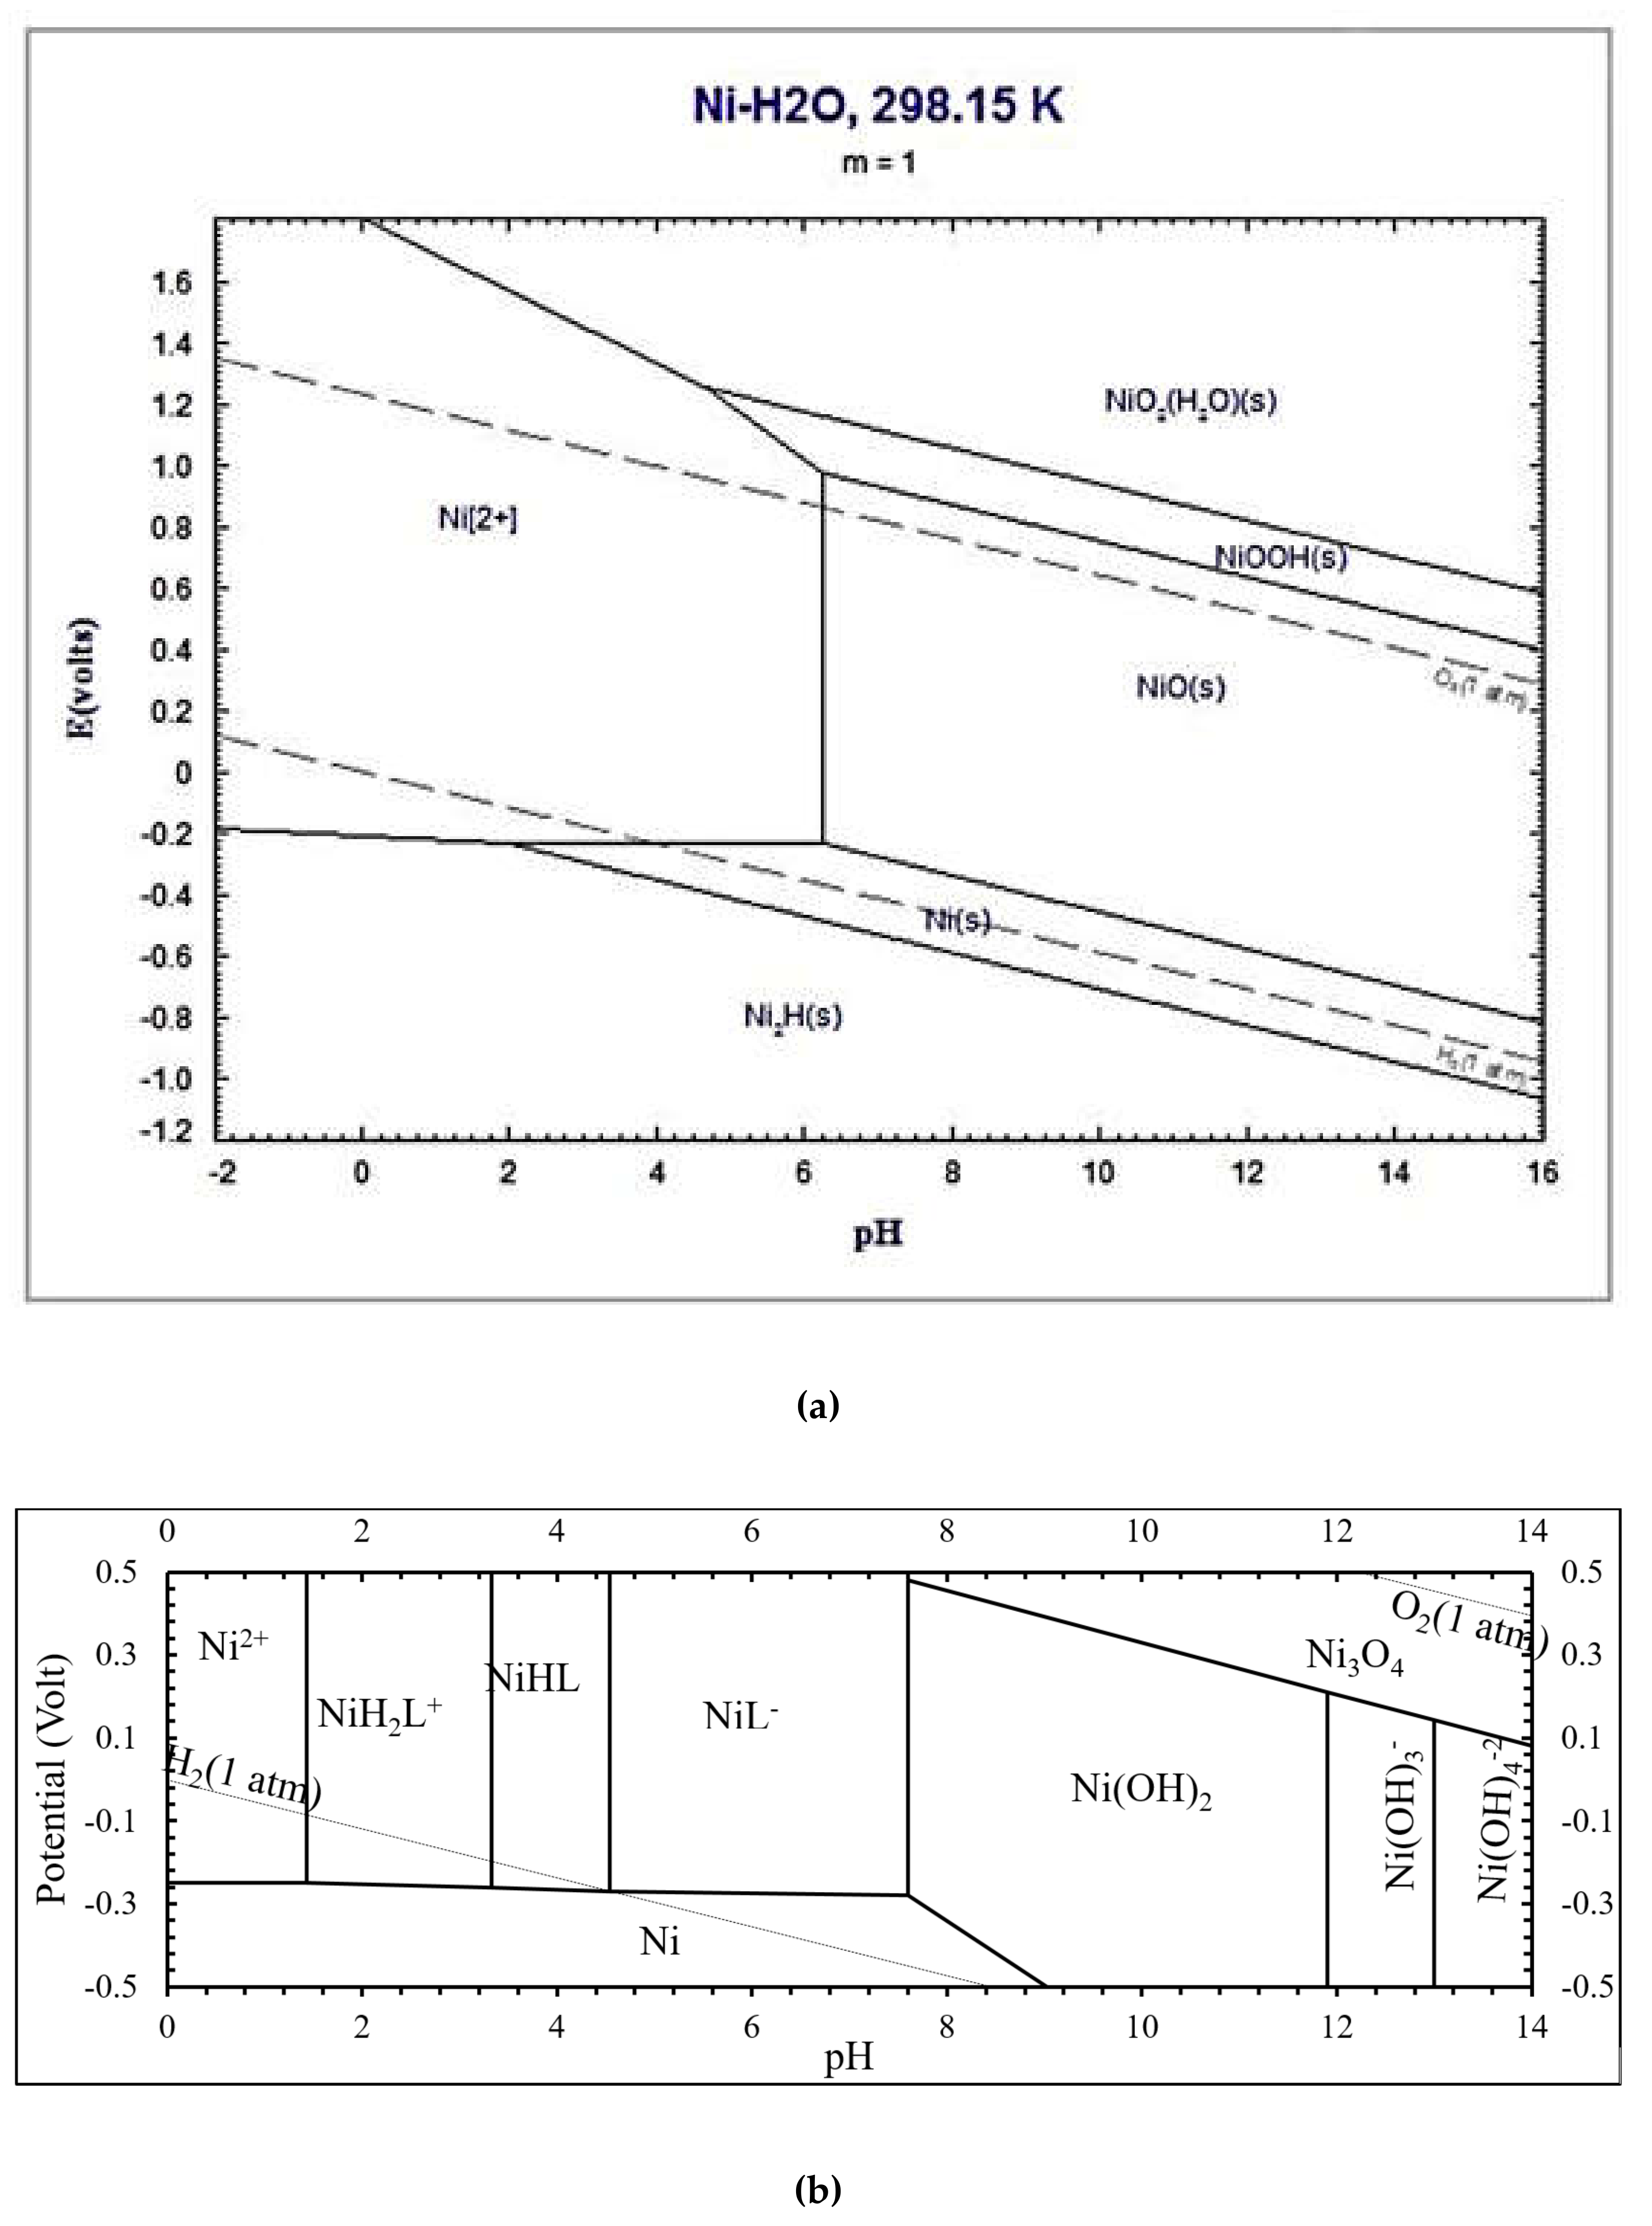
3.5. Pourbaix Diagram of Nickel-Citrate System
3.6. Pourbaix Diagram of Iron-Citrate System
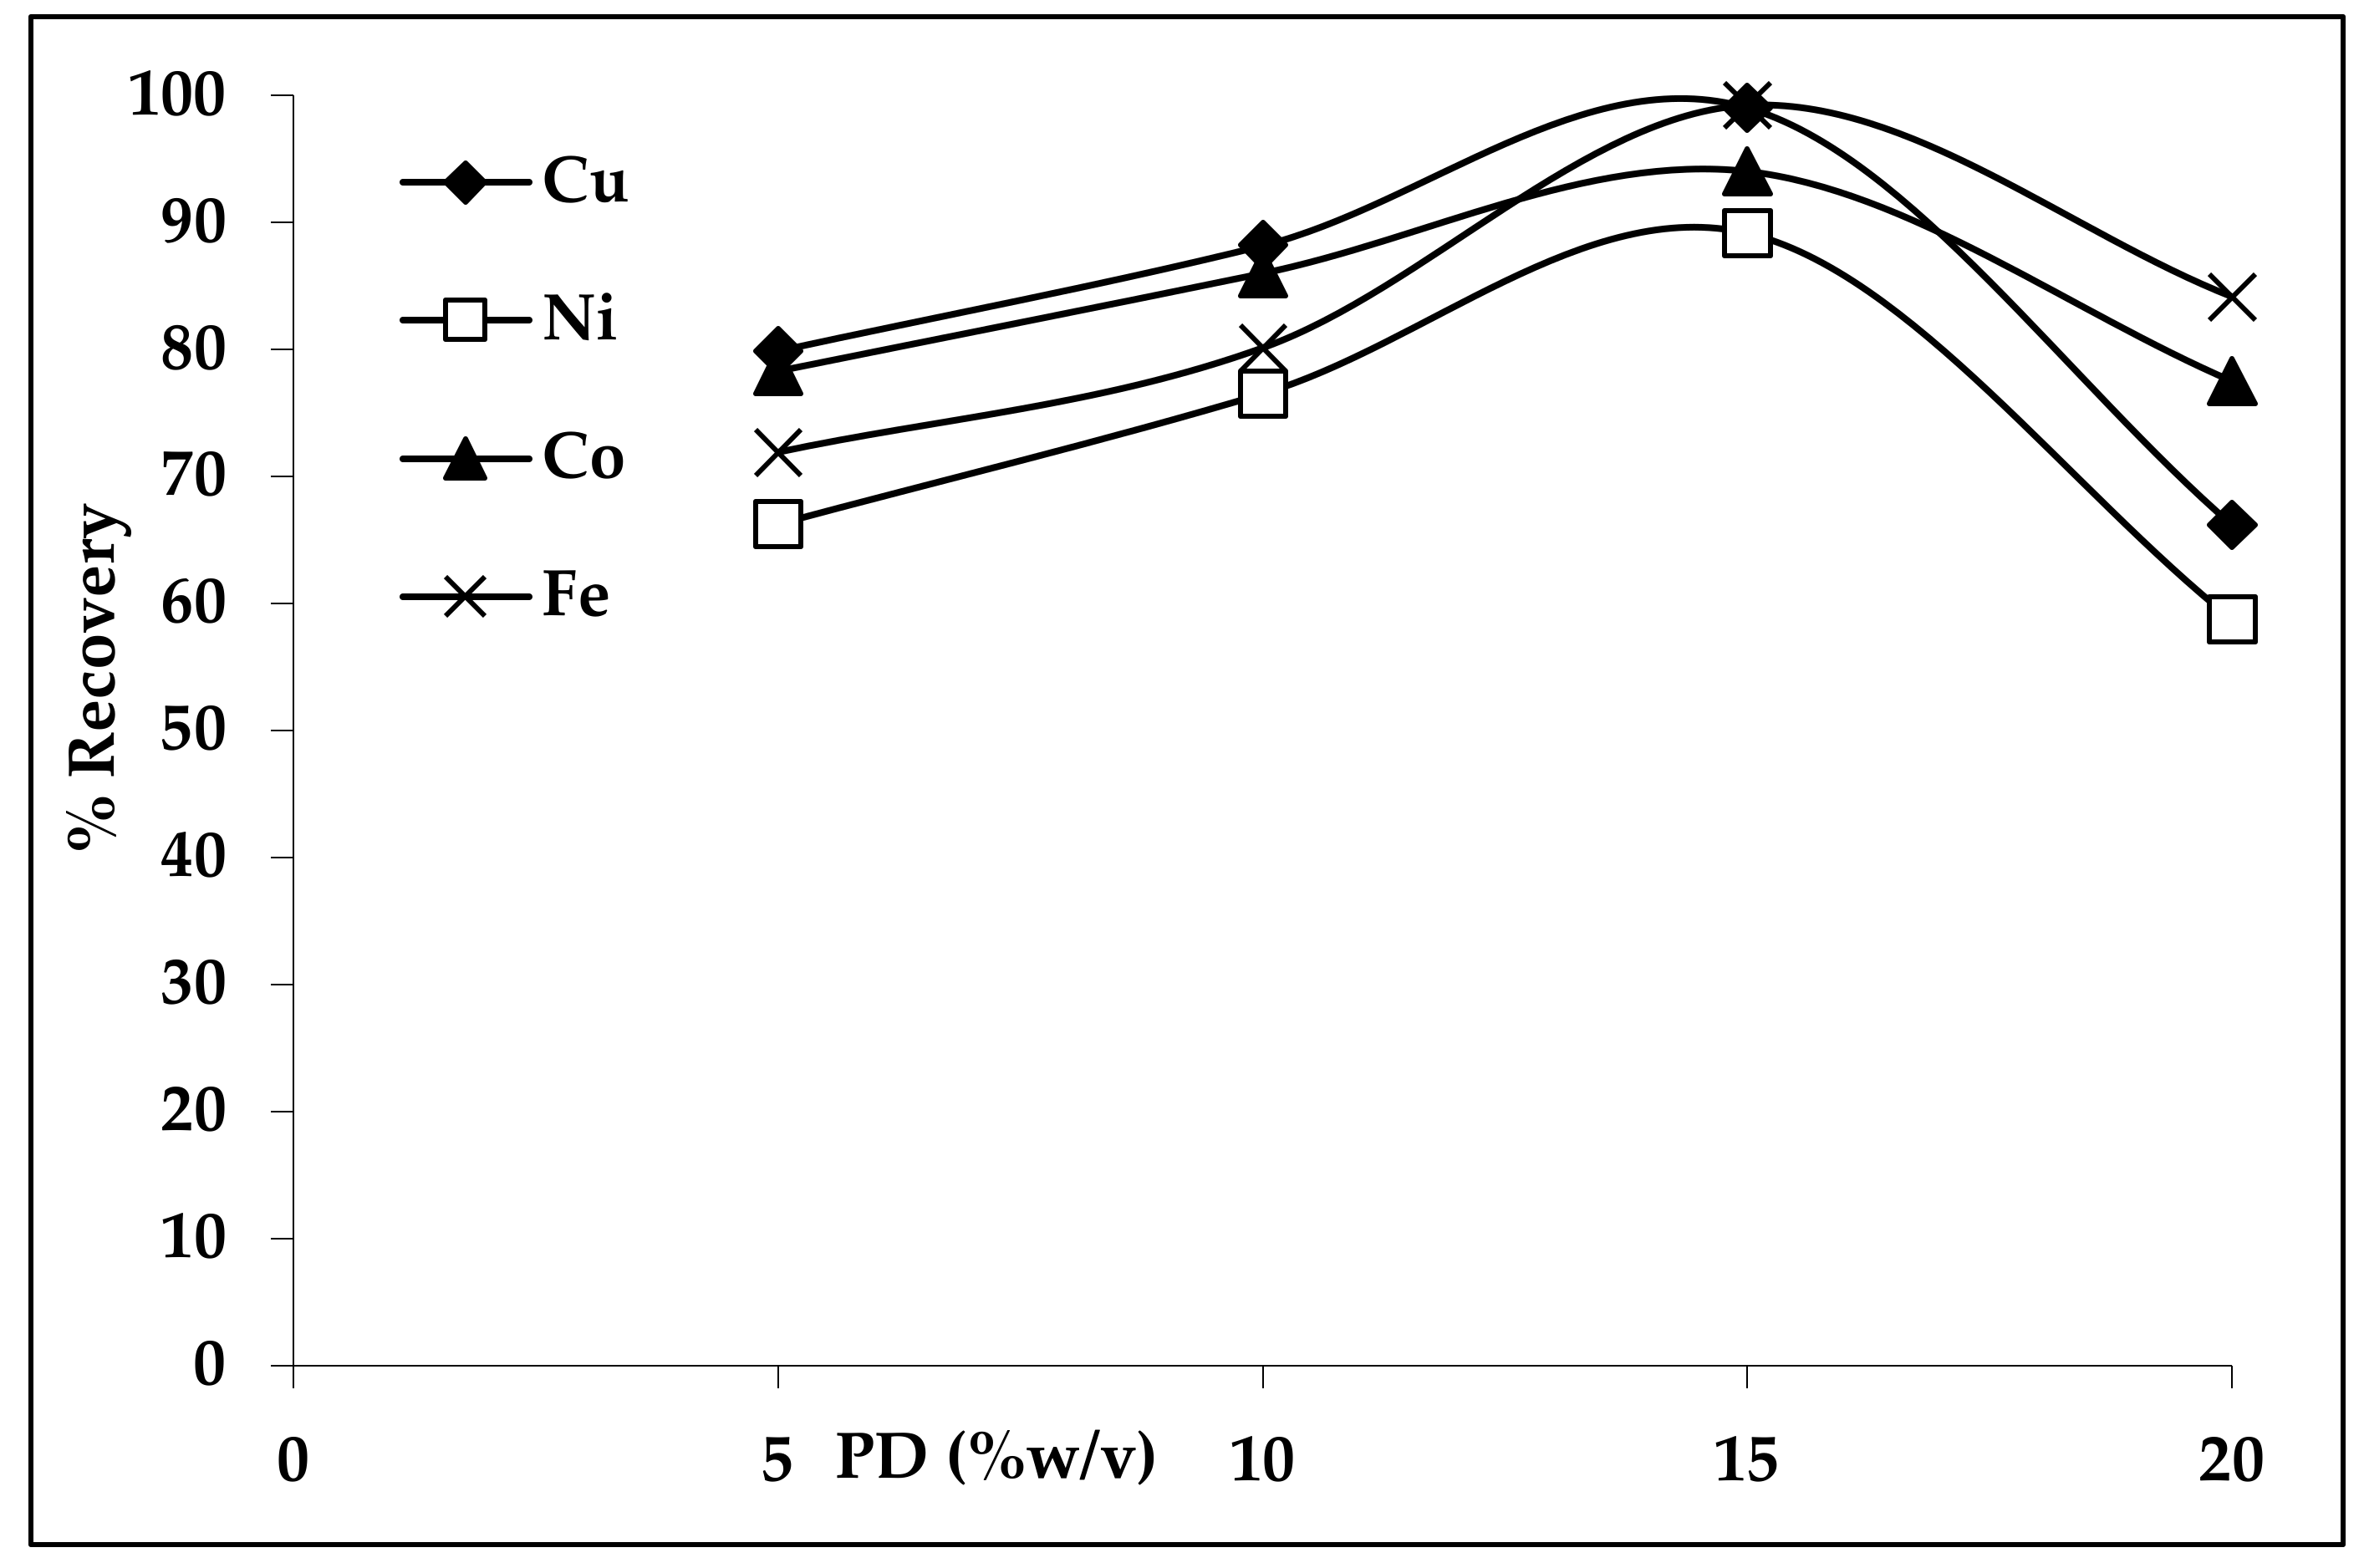
3.7. Effect of Pulp Density
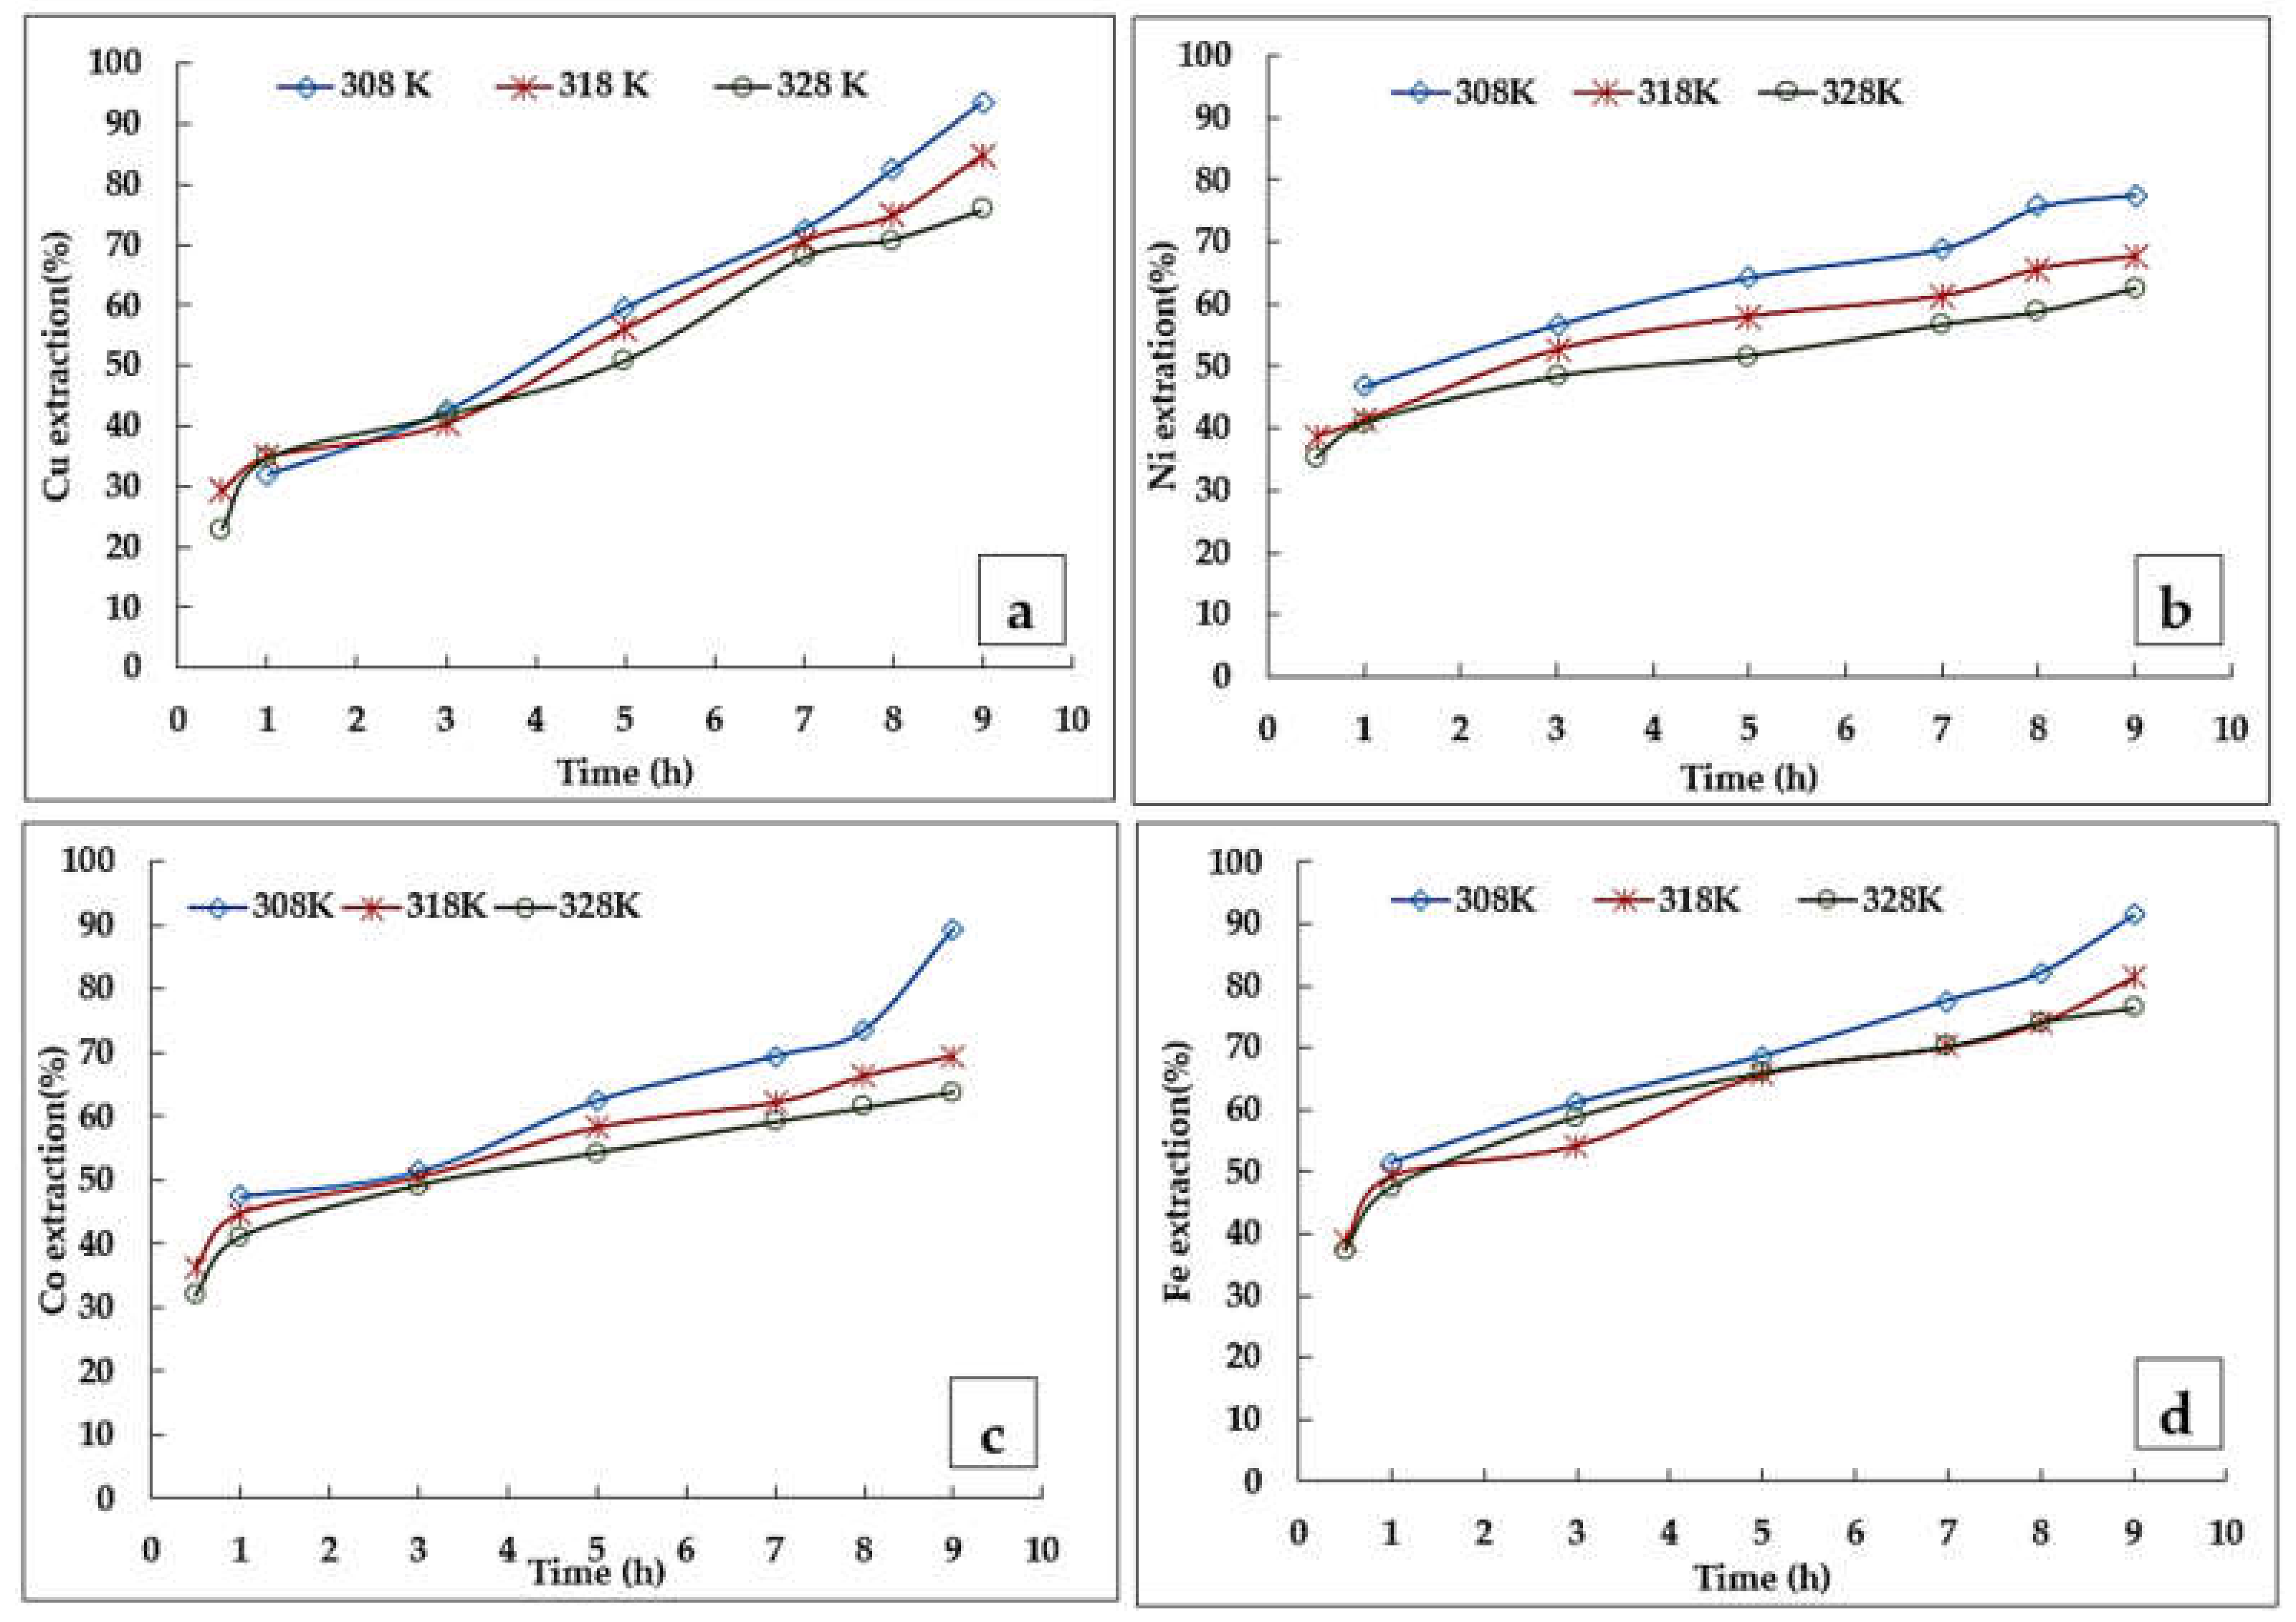
3.8. Effect of Time
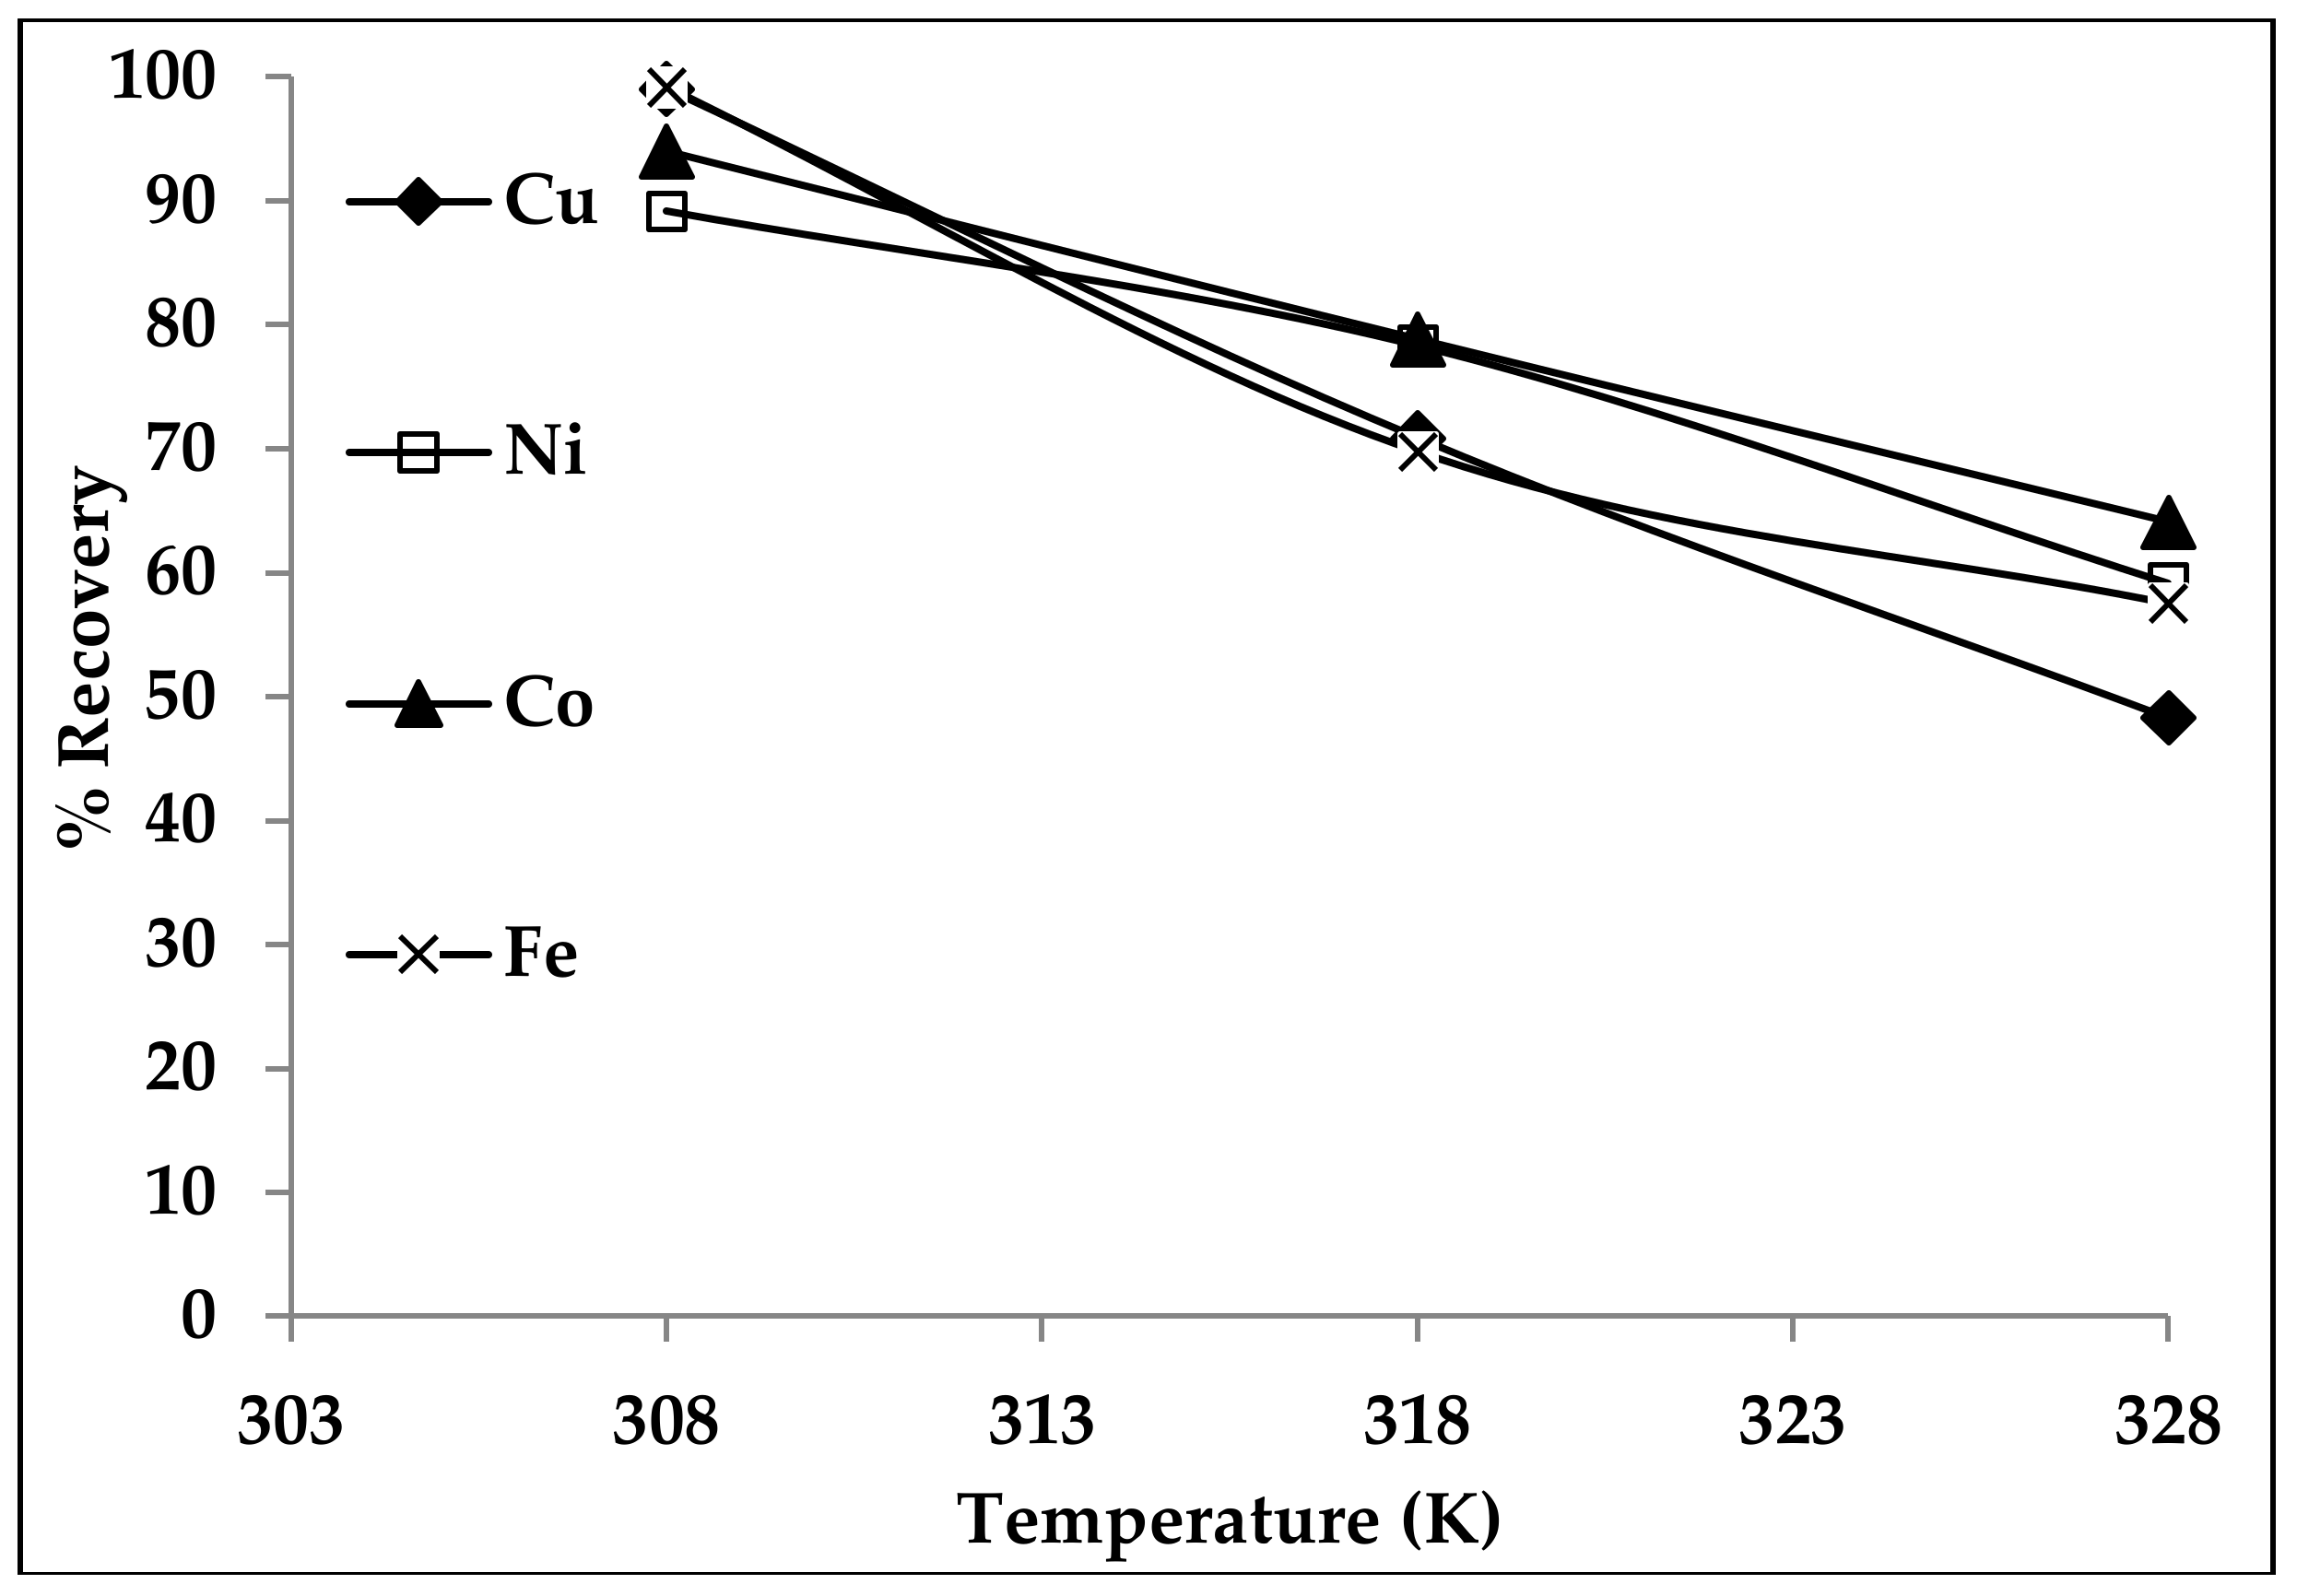
3.9. Effect of Temperature
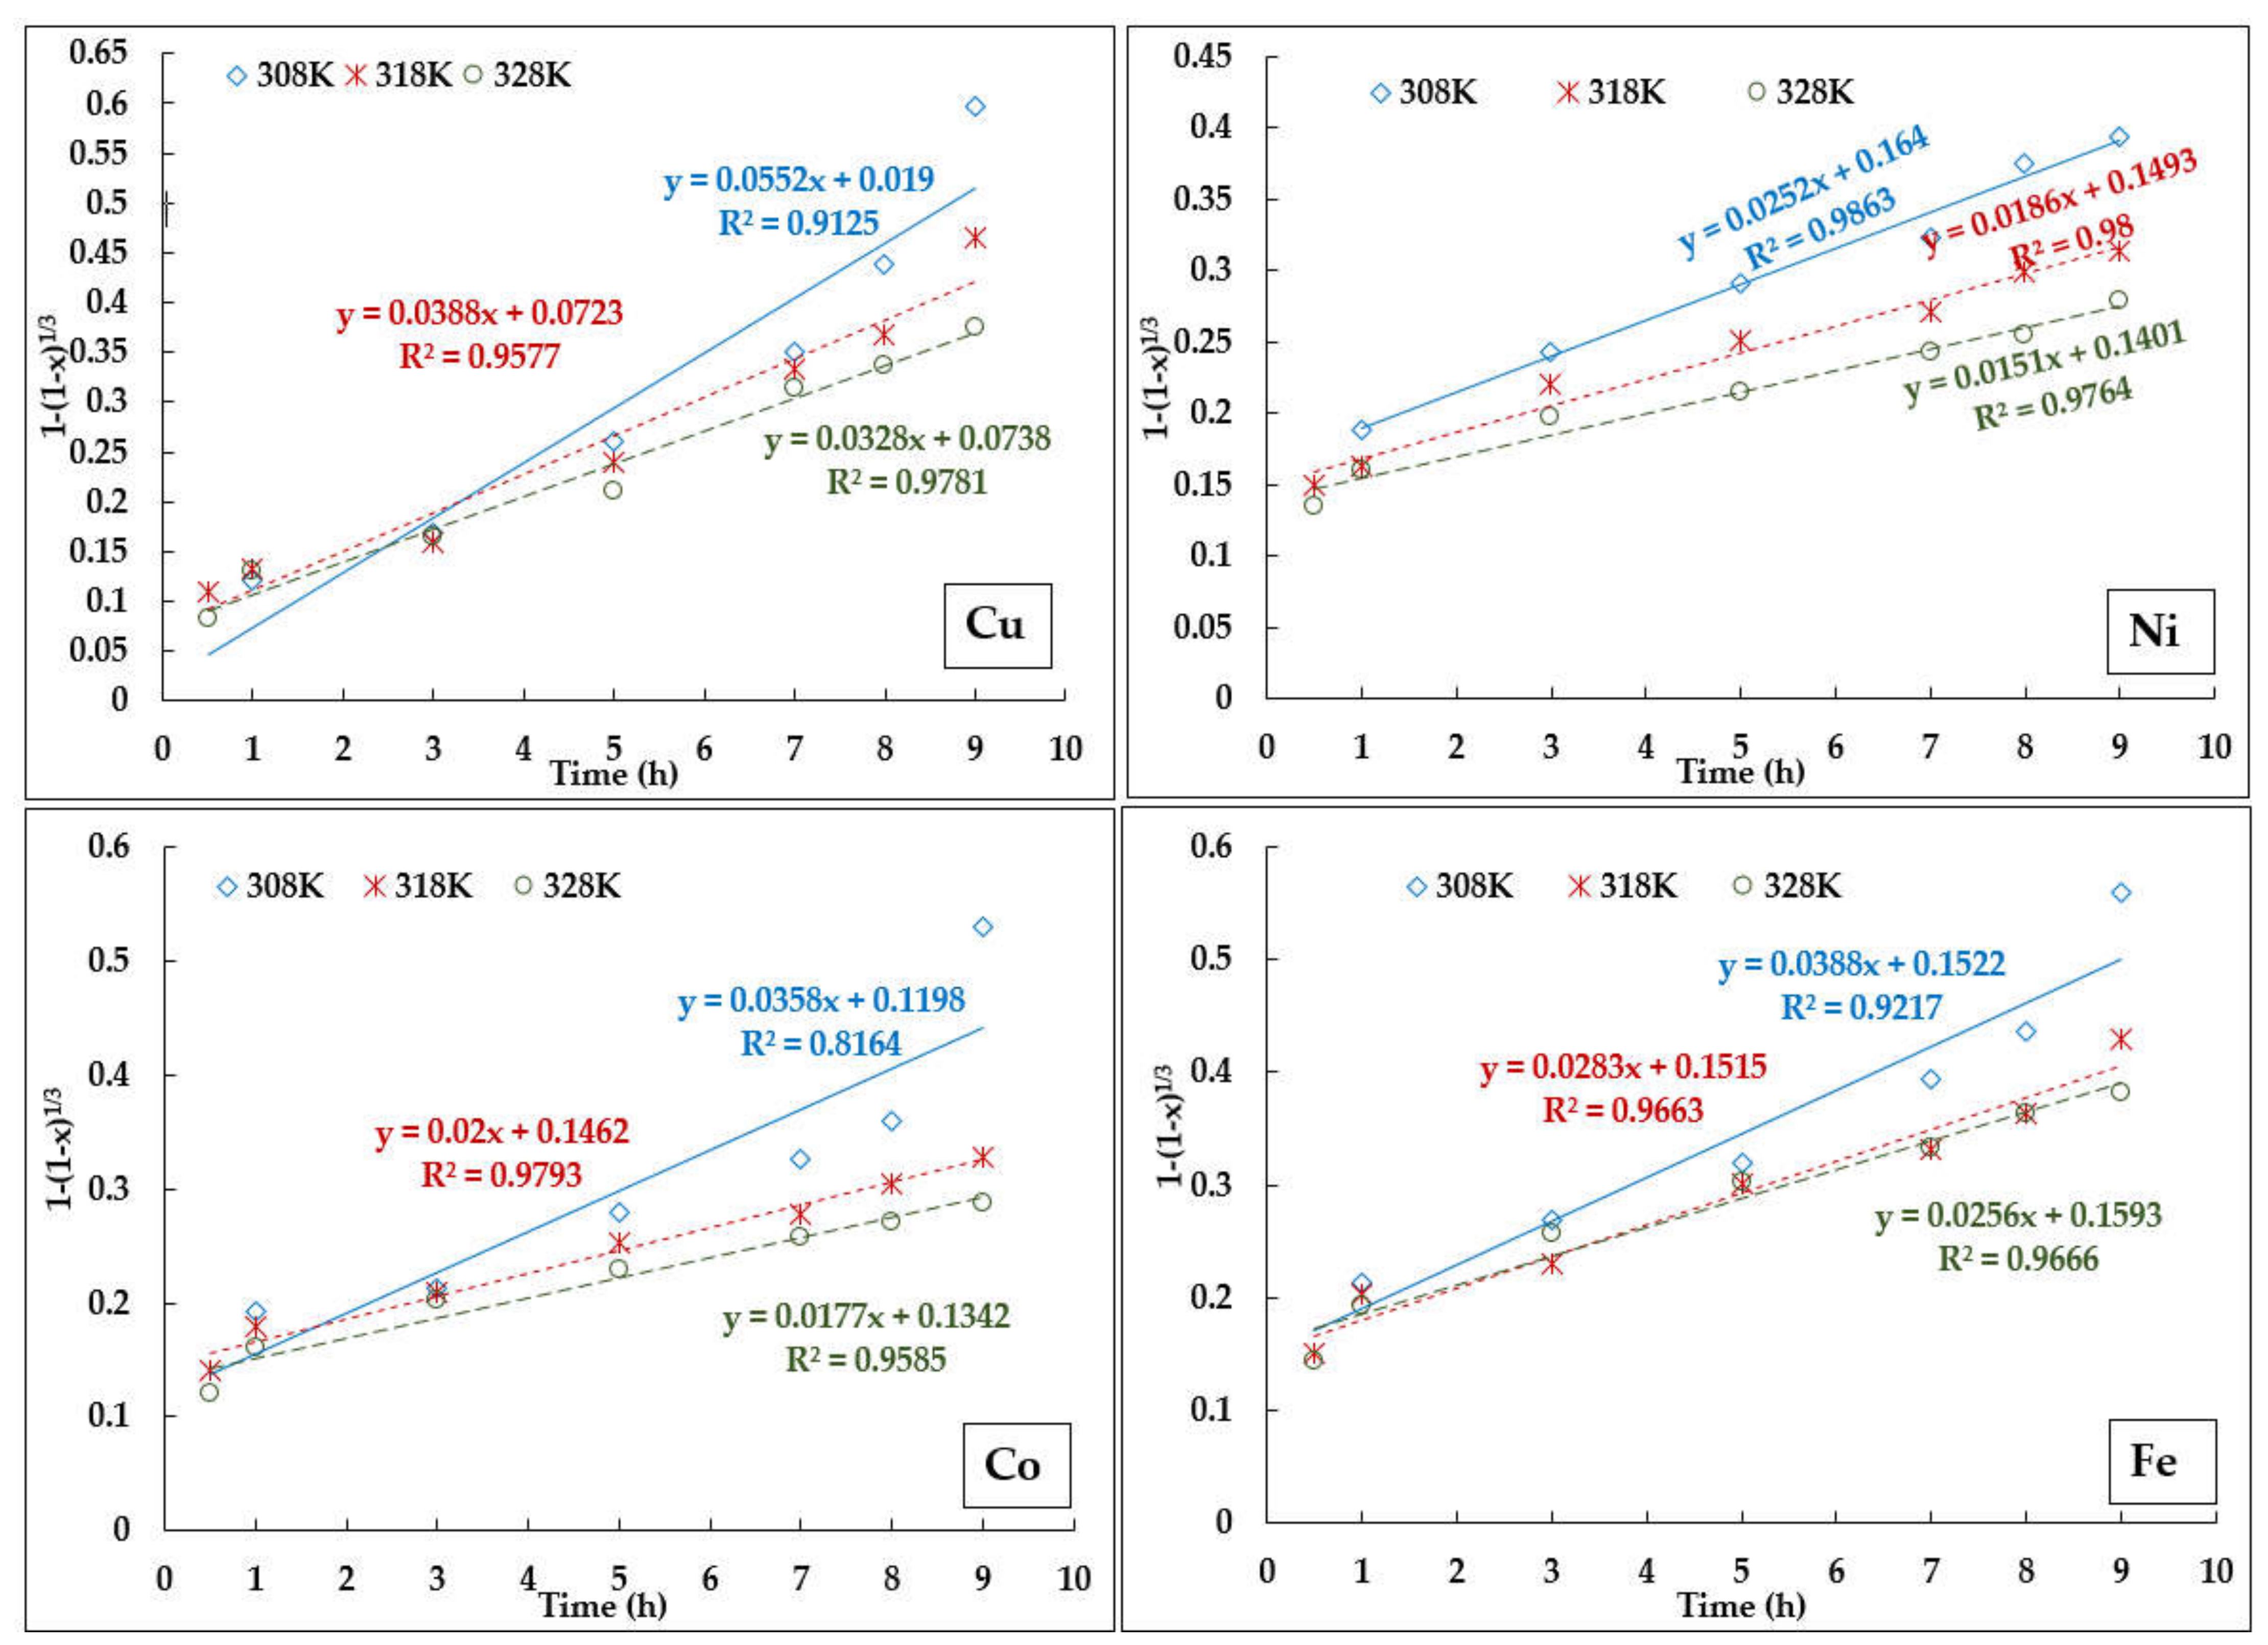
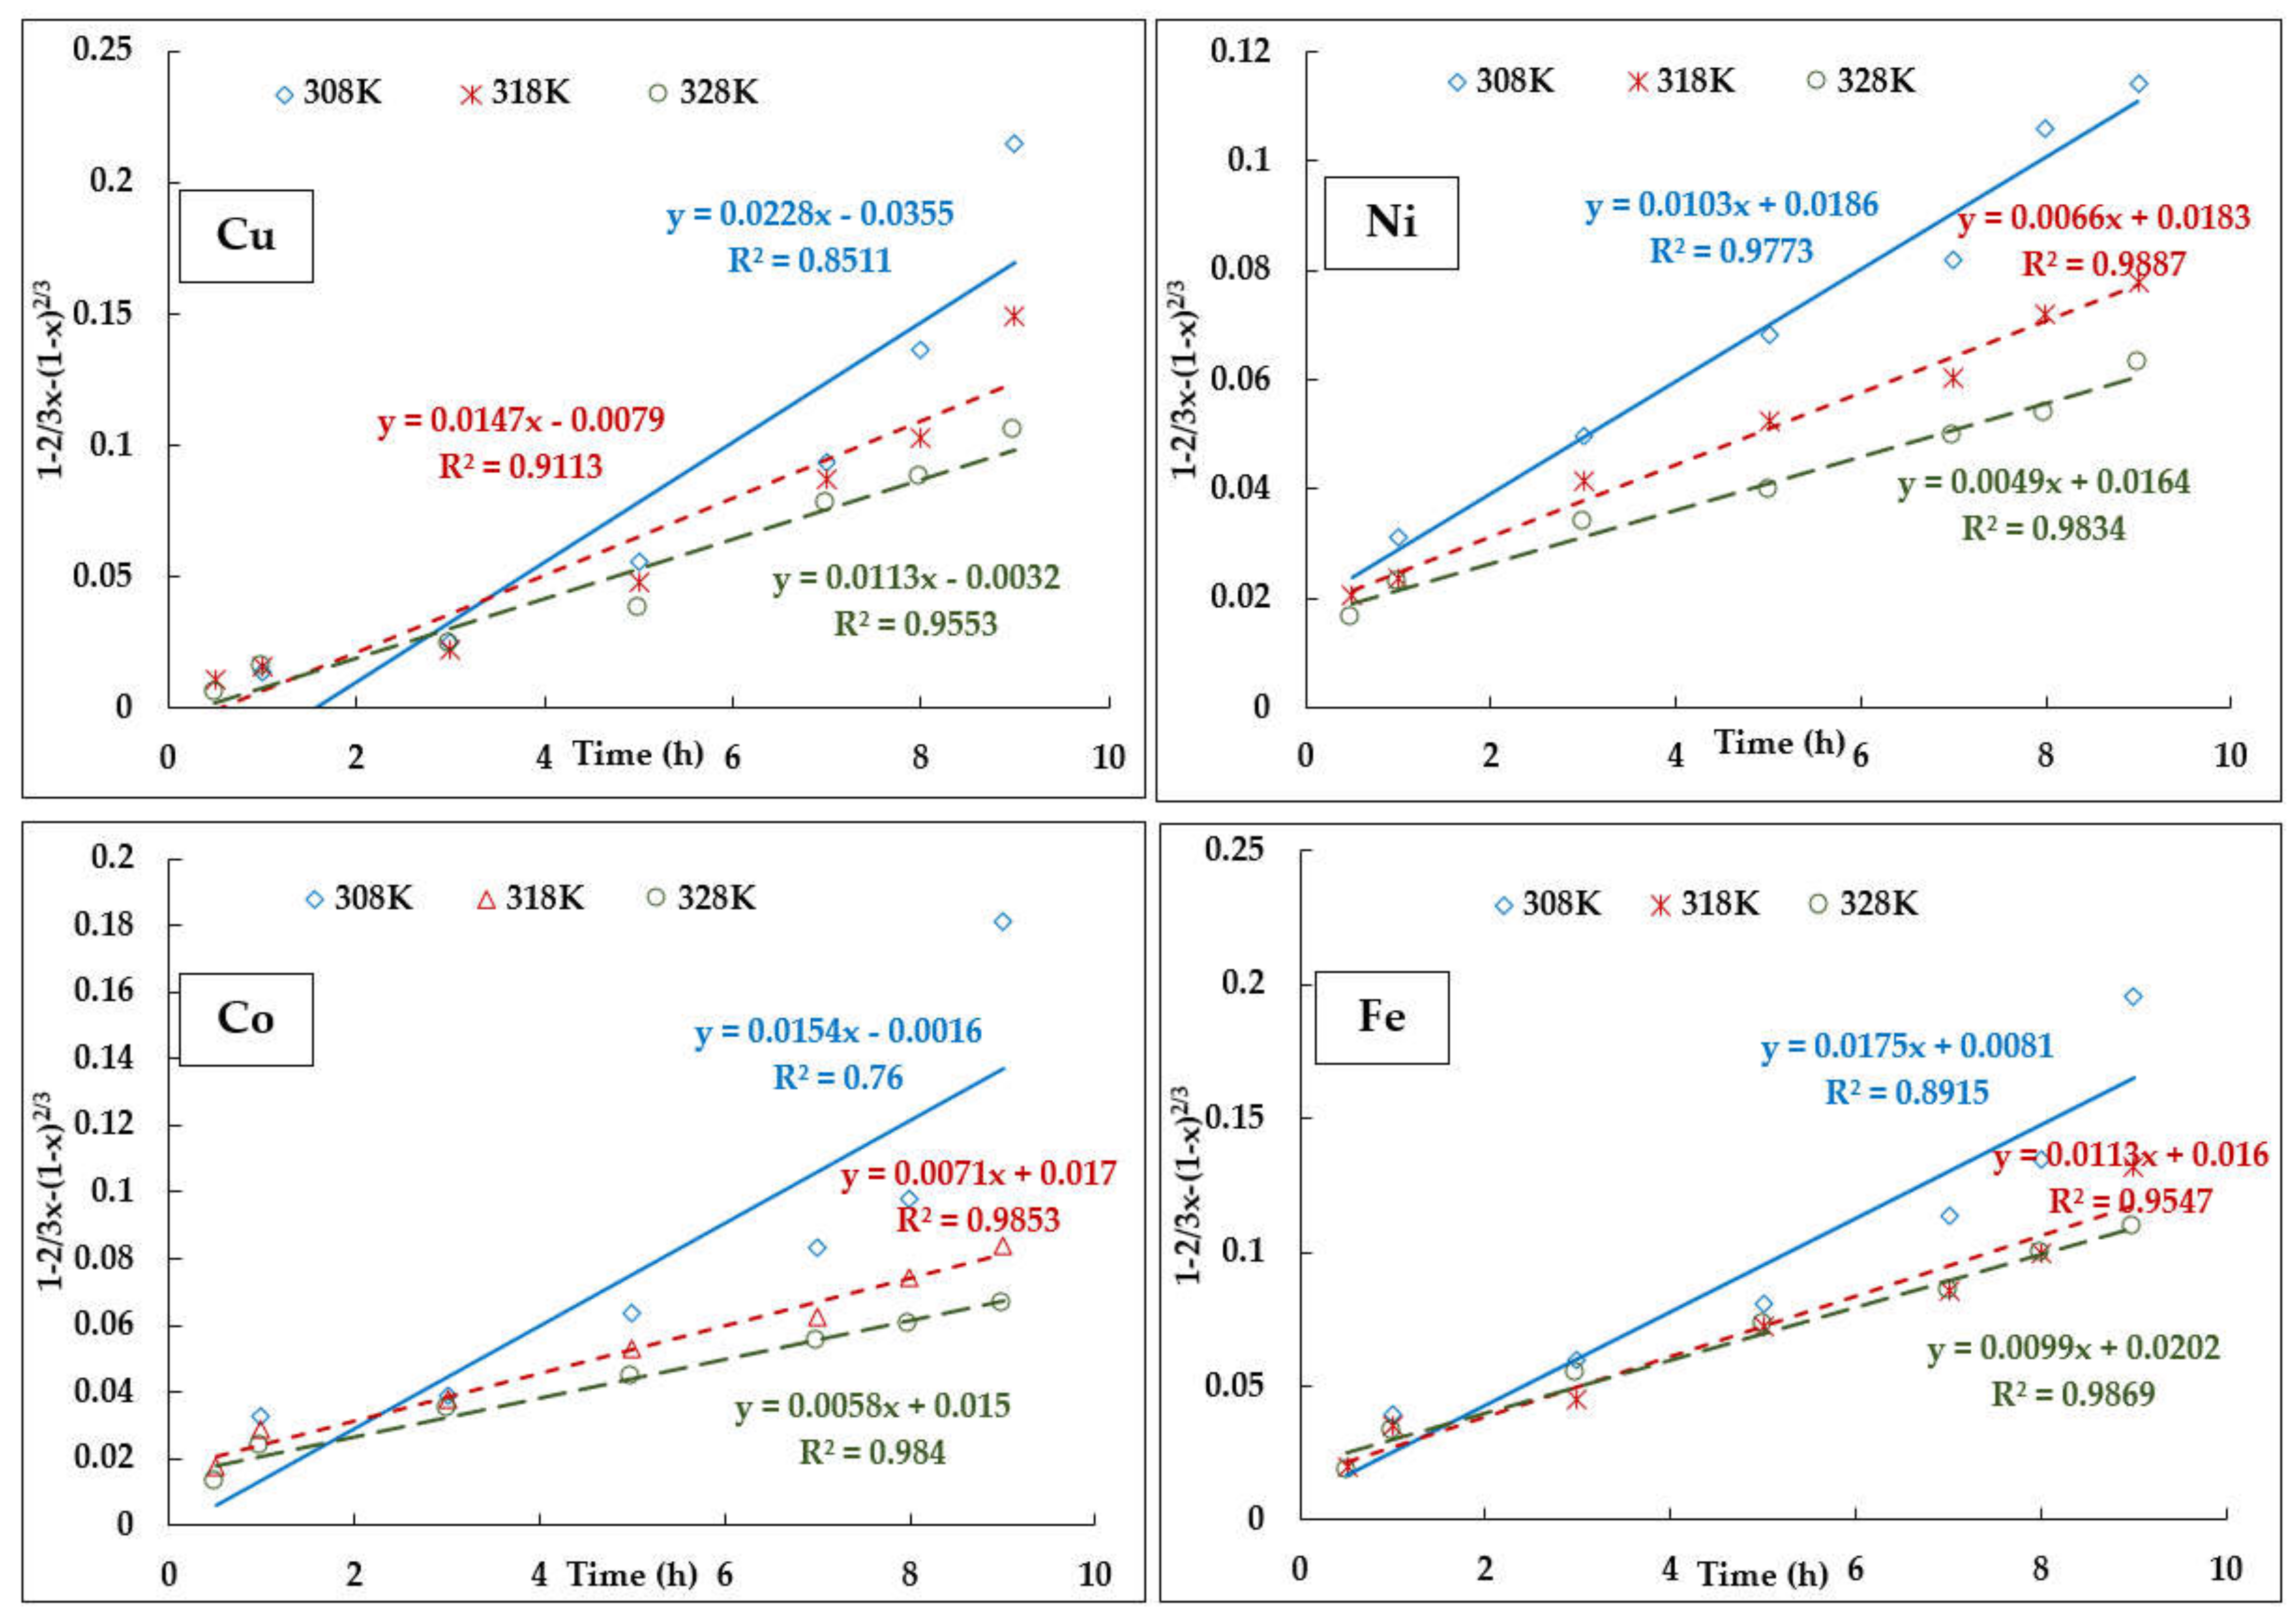
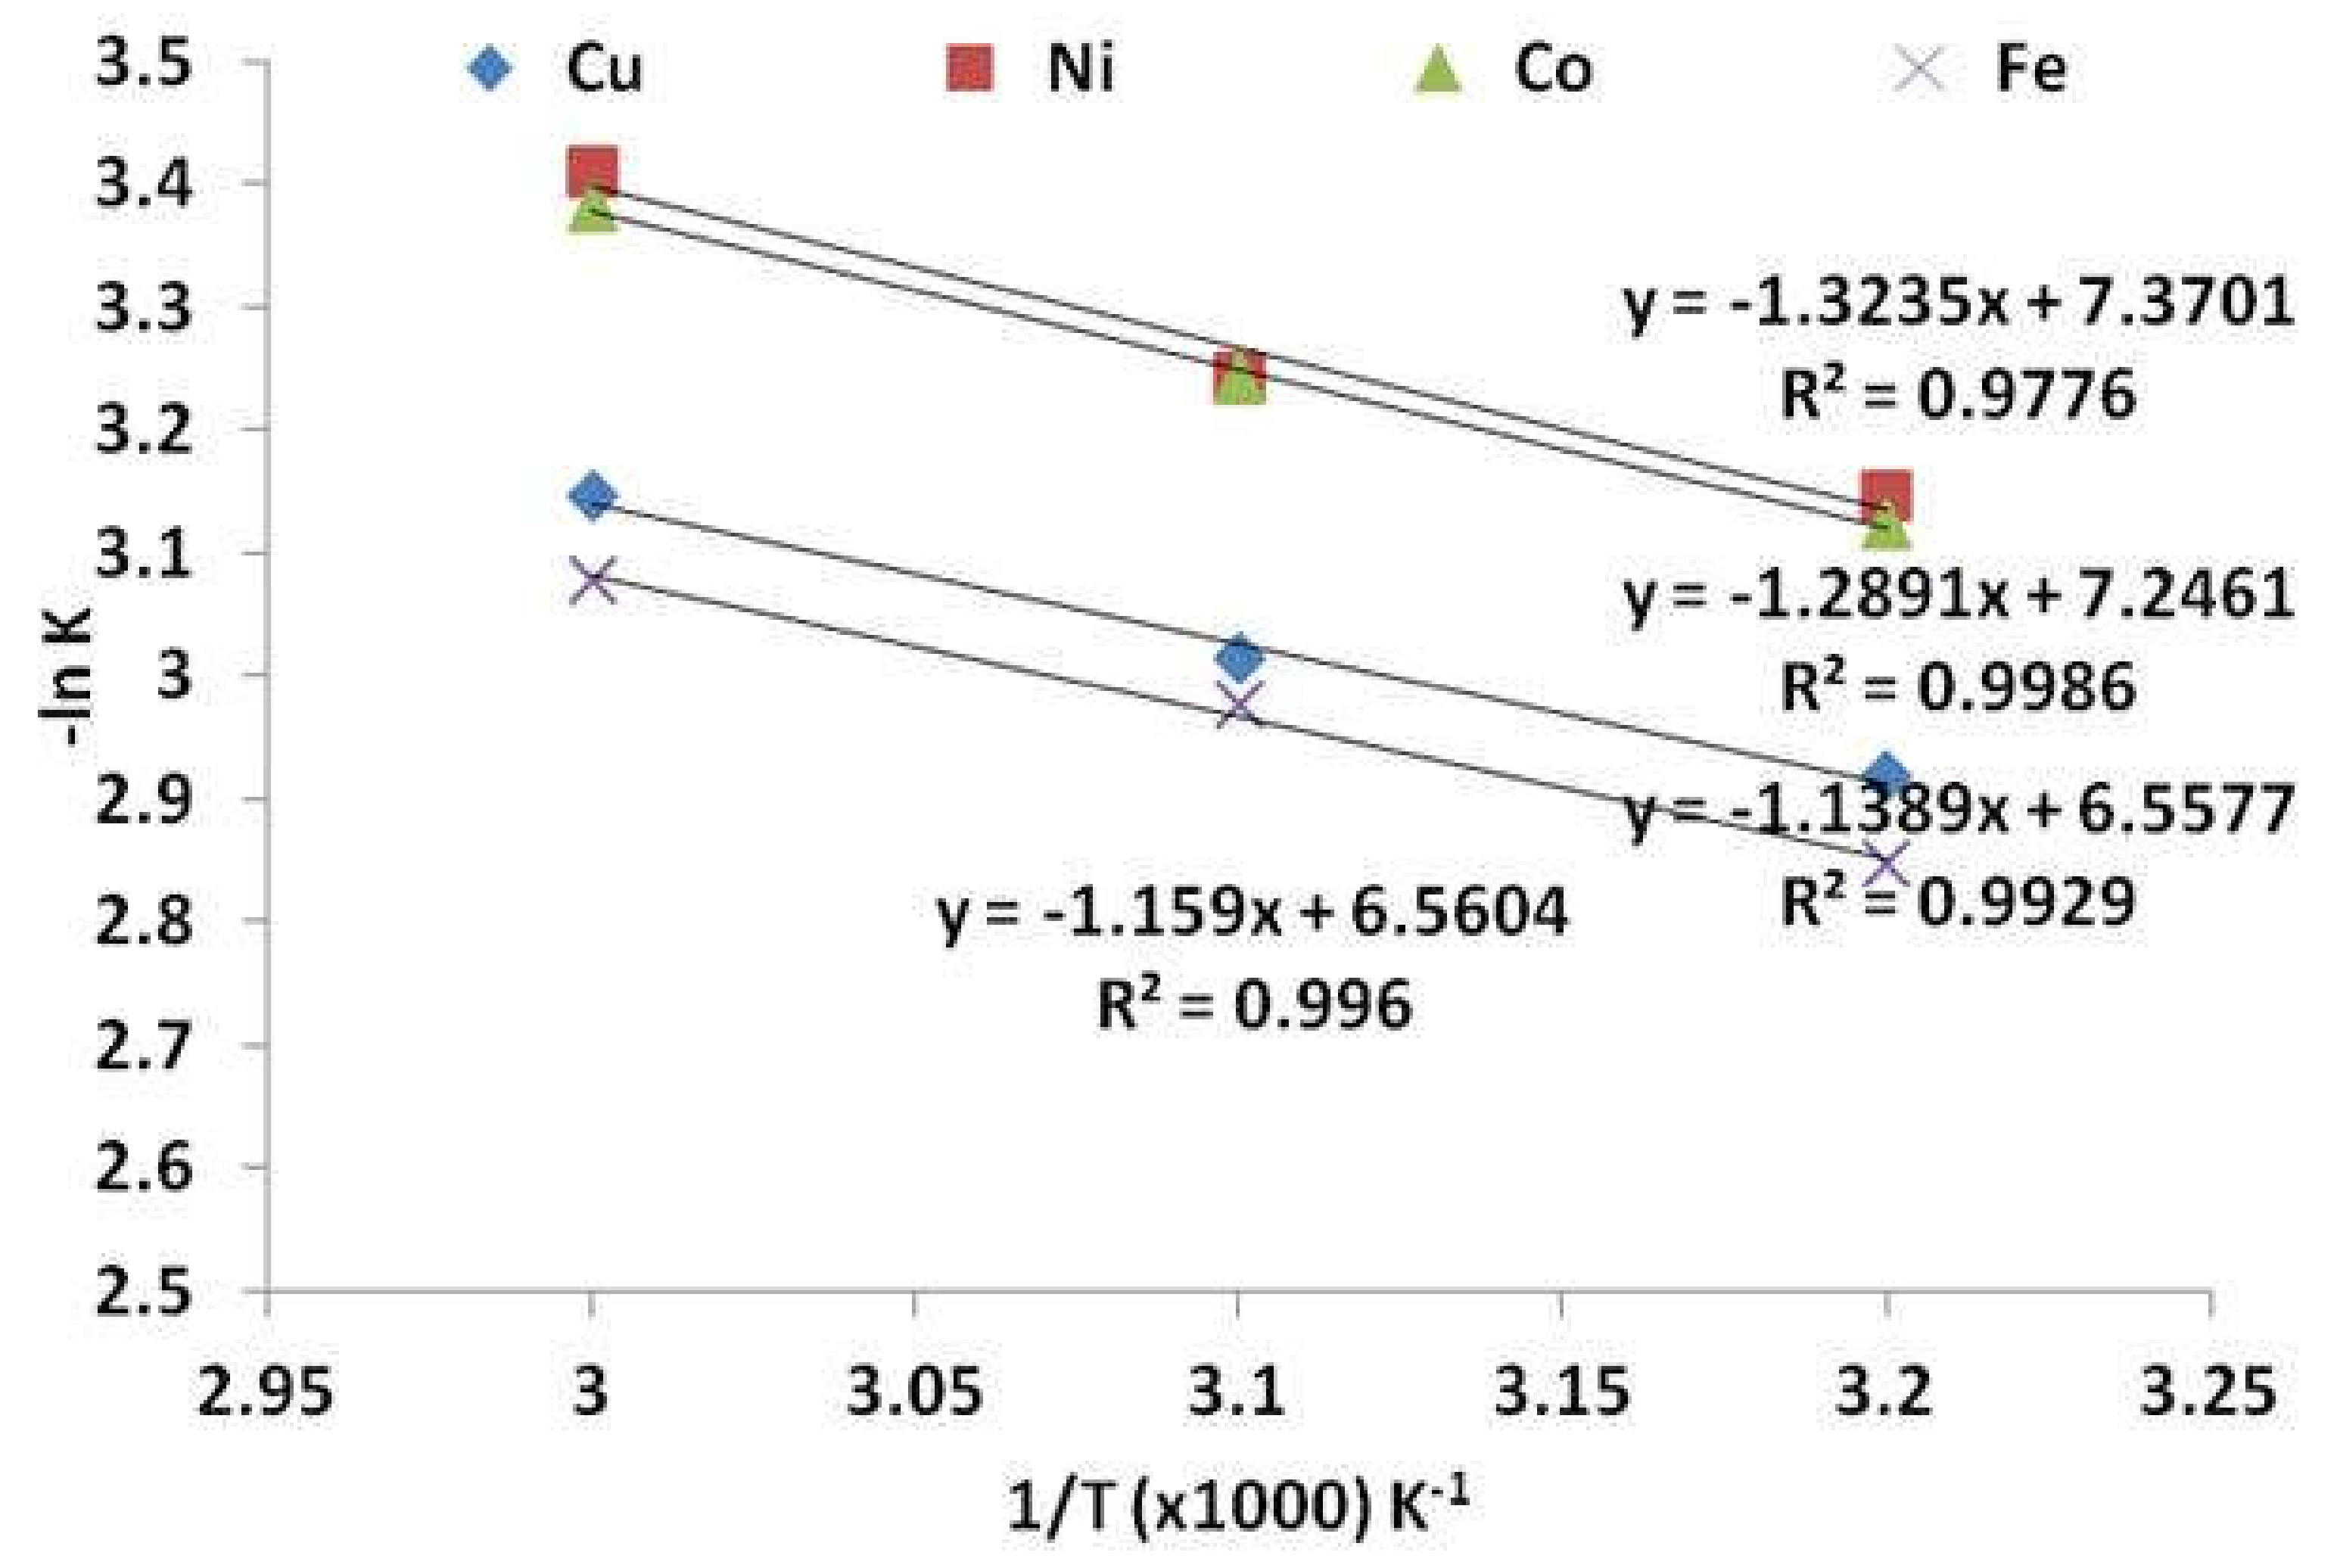
3.10. Kinetic Models for Leaching of Metals
4. Discussion
5. Conclusions
Author Contributions
Funding
Acknowledgments
Conflicts of Interest
References
- Gorai, B.; Jana, R.K.; Premchand. Characteristics and utilisation of copper slag: A review. Resour. Conserv. Recycl. 2003, 39, 299–313. [Google Scholar]
- Agrawal, A.; Sahu, K.K.; Pandey, B.D. Solid waste management in nonferrous industries in India. Resour. Conserv. Recycl. 2003, 42, 99–120. [Google Scholar] [CrossRef]
- Song, S.; Sun, W.; Wang, L.; Liu, R.; Han, H.; Hu, Y.; Yang, Y. Recovery of cobalt and zinc from the leaching solution of zinc smelting slag. J. Environ. Chem. Eng. 2019, 7, 102777. [Google Scholar] [CrossRef]
- Altundogan, H.S.; Boyrazli, M.; Tumen, F. A study on the sulphuric acid leaching of copper converter slag in the presence of dichromate. Miner. Eng. 2004, 17, 465–467. [Google Scholar] [CrossRef]
- Banza, A.N.; Gock, E.; Kongolo, K. Base metals recovery from copper smelter slag by oxidising leaching and solvent extraction. Hydrometallurgy 2002, 67, 63–69. [Google Scholar] [CrossRef]
- Altundogan, H.S.; Tumen, F. Metal recovery from copper converter slag by roasting with ferric sulphate. Hydrometallurgy 1997, 44, 261–267. [Google Scholar] [CrossRef]
- Deng, T.; Ling, Y. Processing of copper converter slag for metal reclamation: Part I: Extraction and recovery of copper and cobalt. Waste Manag. Res. 2007, 25, 440–448. [Google Scholar] [CrossRef] [PubMed]
- Khalid, M.K.; Hamuyuni, J.; Agarwal, V.; Pihlasalo, J.; Haapalainen, M.; Lundström, M. Sulfuric acid leaching for capturing value from copper rich converter slag. J. Clean. Prod. 2019, 215, 1005–1013. [Google Scholar] [CrossRef]
- Mehta, K.D.; Pandey, B.D.; Premchand. Bio-leaching of copper, nickel, and cobalt from copper converter slag by Thiobacillus ferrooxidans. NML Tech. J. 1997, 39, 59–70. [Google Scholar]
- Potysz, A.; Kierczak, J. Prospective (bio)leaching of historical copper slags as an alternative to their disposal. Minerals 2019, 9, 542. [Google Scholar] [CrossRef] [Green Version]
- Sukla, L.B.; Kar, R.N.; Panchanadikar, V.V. Bioleaching of copper converter slag using Aspergillus niger isolated from lateritic nickel ore. Int. J. Environ. Stud. 1995, 47, 81–86. [Google Scholar] [CrossRef]
- Potysz, A.; Lens, P.N.; van de Vossenberg, J.; Rene, E.R.; Grybos, M.; Guibaud, G.; van Hullebusch, E.D. Comparison of Cu, Zn and Fe bioleaching from Cu-metallurgical slags in the presence of Pseudomonas fluorescens and Acidithiobacillus thiooxidans. Appl. Geochem. 2016, 68, 39–52. [Google Scholar] [CrossRef]
- Yang, Z.; Rui-lin, M.; Wang-dong, N.; Hui, W. Selective leaching of base metals from copper smelter slag. Hydrometallurgy 2010, 103, 25–29. [Google Scholar] [CrossRef]
- Gargul, K.; Jarosz, P.; Małecki, S. Leaching of Lead and Copper by Citric Acid from Direct-to-Blister Copper Flash Smelting Slag. Preprints 2018, 2018110209. [Google Scholar] [CrossRef]
- Meshram, P.; Bhagat, L.; Prakash, U.; Pandey, B.D.; Abhilash. Organic acid leaching of base metals from copper granulated slag and evaluation of mechanism. Can. Metall. Q. 2017, 56, 168–178. [Google Scholar] [CrossRef]
- Lowalekar, V.P. Oxalic Acid-Based Chemical Systems for Electrochemical Mechanical Planarization of Copper. Ph.D. Thesis, University of Arizona, Tucson, AZ, USA, 2006. [Google Scholar]
- Adam, F.I.; Bounds, P.L.; Kissner, R.; Koppenol, W.H. Redox properties and activity of iron-citrate complexes: Evidence for redox cycling. Chem. Res. Toxicol. 2015, 28, 604–614. [Google Scholar] [CrossRef] [PubMed]
- Saidan, M.; Linkson, P.; Valix, M. Secondary reaction in the e-waste bioleaching. In Proceedings of the Chemeca 2011, Sydney, Australia, 18–21 September 2011; pp. 575–586. [Google Scholar]
- Abhilash; Mehta, K.D.; Pandey, B.D. Bacterial leaching kinetics for copper dissolution from a low-grade Indian chalcopyrite ore. Rev. Esc. Minas 2013, 66, 245–250. [Google Scholar] [CrossRef] [Green Version]


| Sieve Size (μm) | Cu | Ni | Co | Fe | SiO2 | |
|---|---|---|---|---|---|---|
| wt% | wt% | wt% | wt% | wt% | ||
| <150 | 0.96 | 0.009 | 0.01 | 36.49 | 6.98 | |
| 150–105 | 0.99 | 0.01 | 0.02 | 38.41 | 8.33 | |
| 105–75 | 1.08 | 0.01 | 0.03 | 43.16 | 9.88 | |
| 75–45 | 1.19 | 0.015 | 0.04 | 46.33 | 10.47 | |
| <45 | 1.38 | 0.02 | 0.05 | 49.92 | 11.82 | |
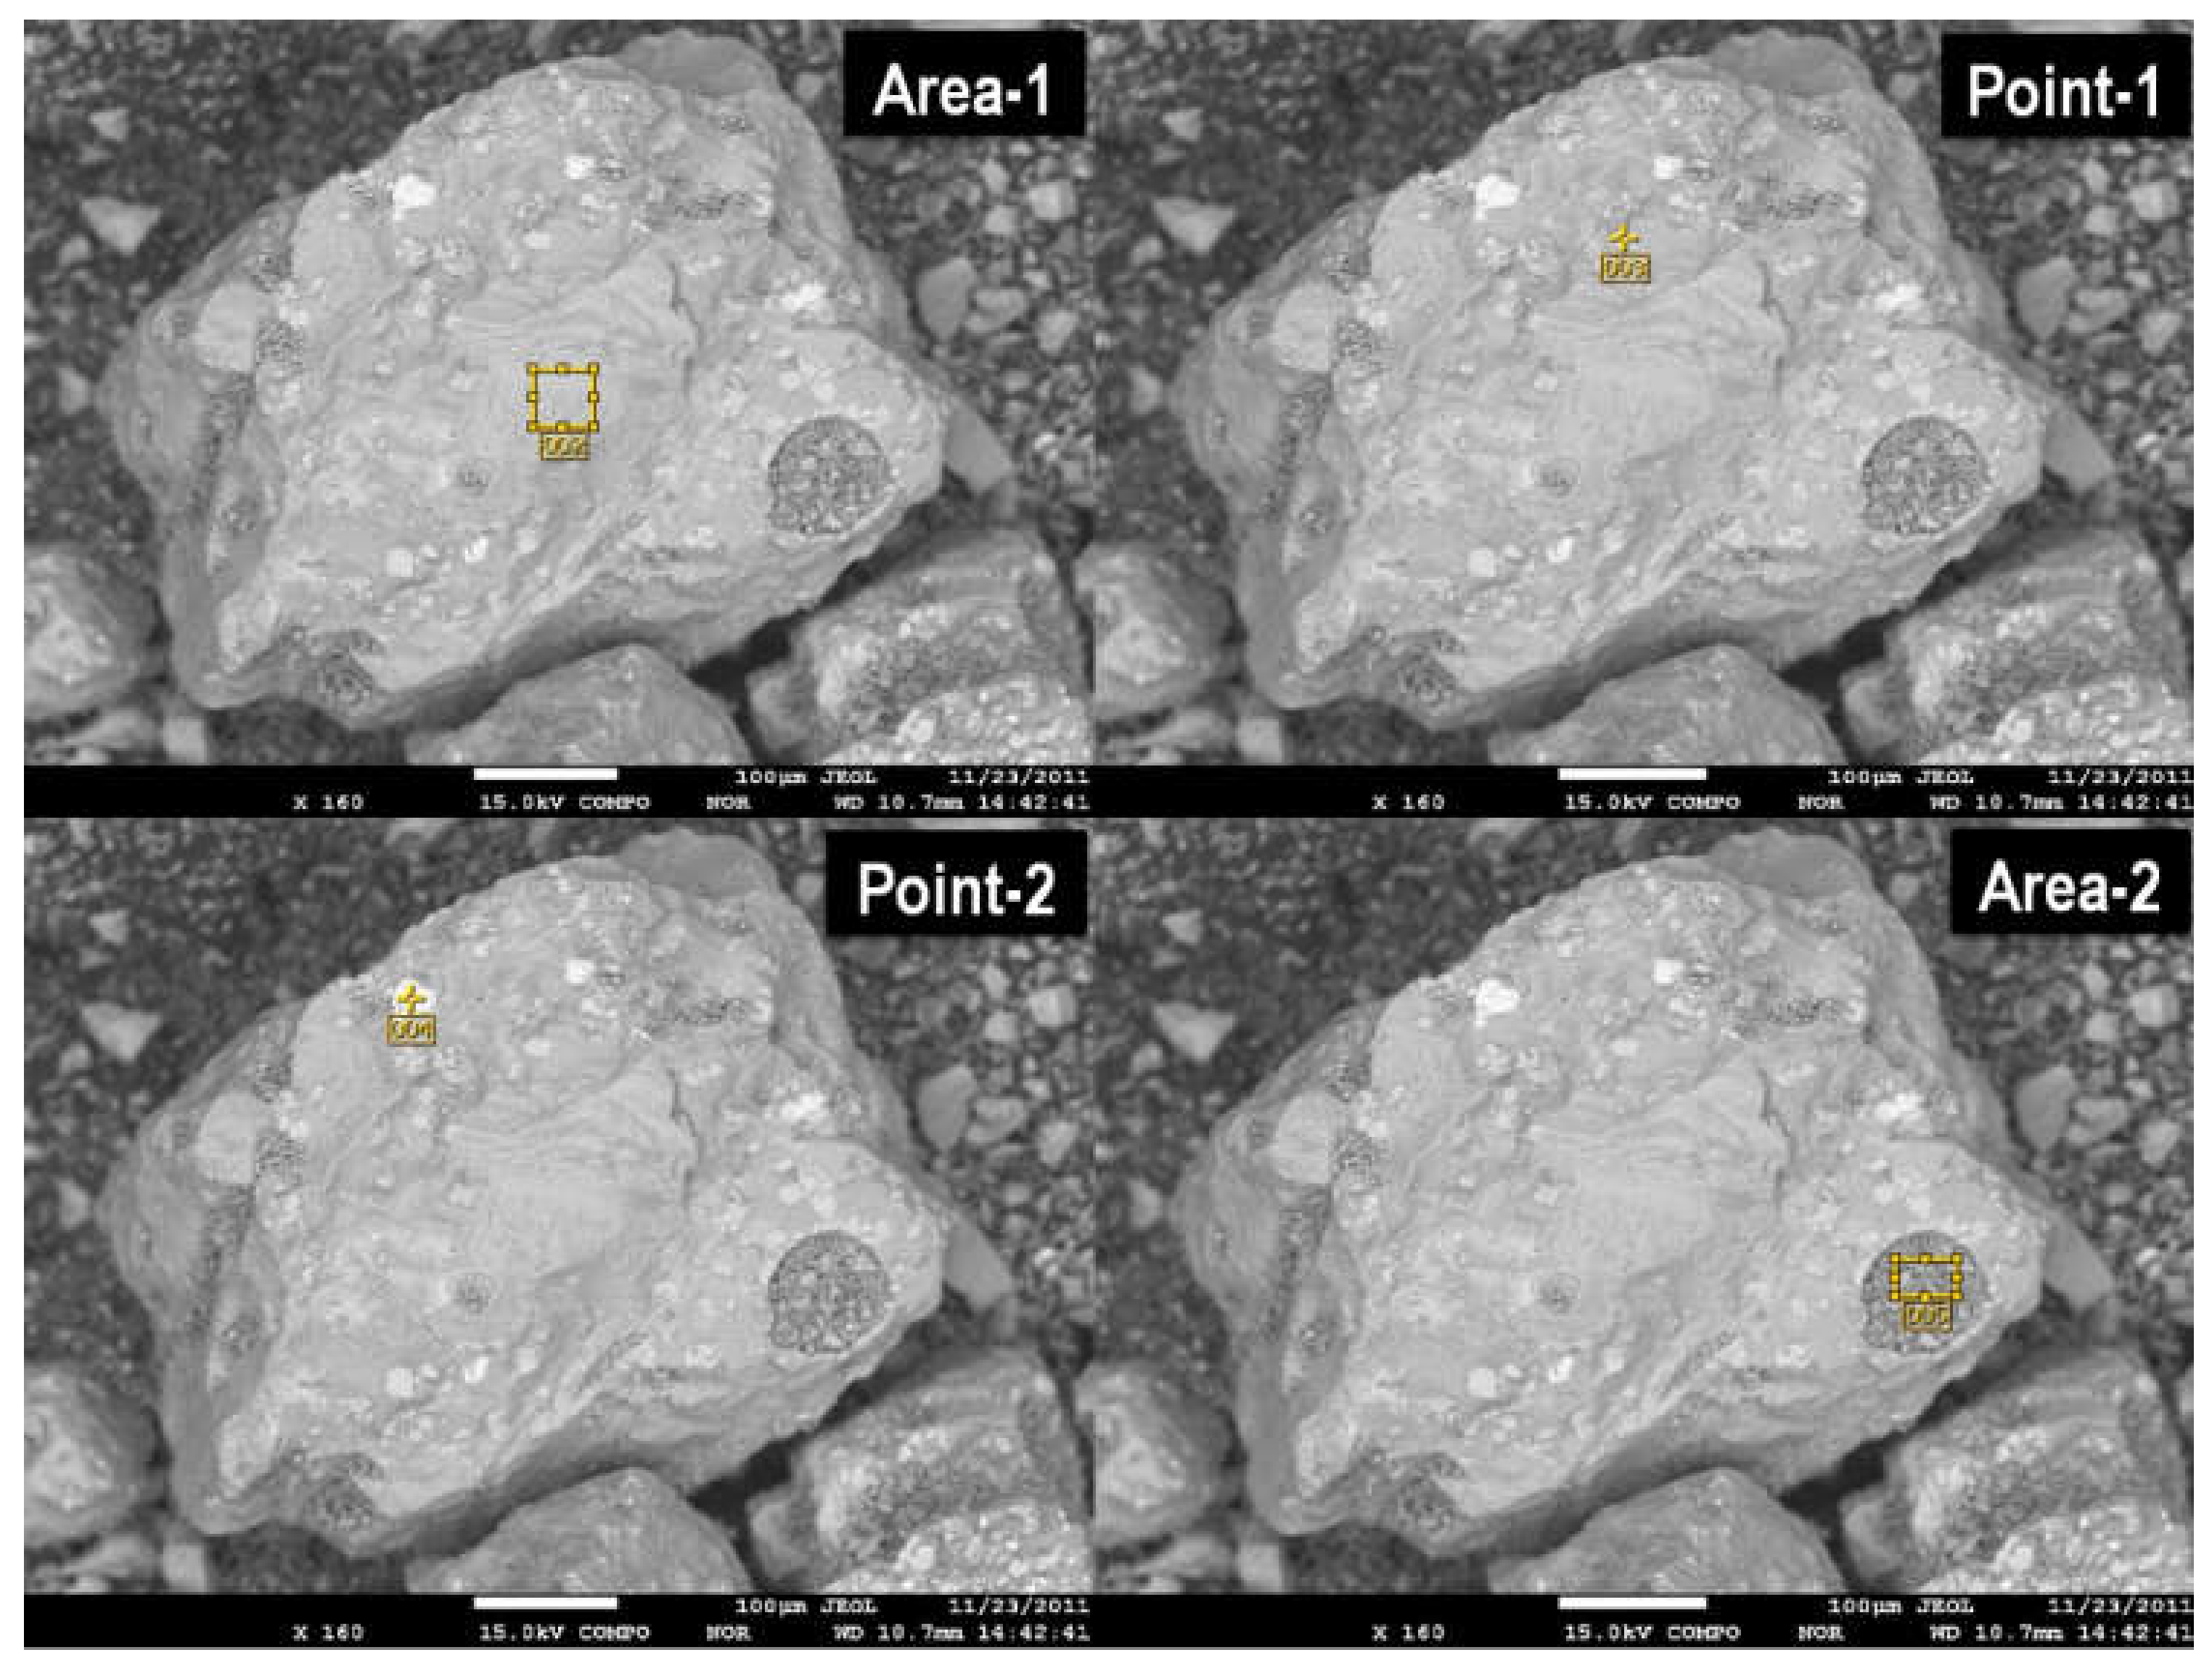
| Chemical Formula | Area 1 | Point 1 | Point 2 | Area 2 | |
|---|---|---|---|---|---|
| ms% | ms% | ms% | ms% | ||
| O | 29.01 | 34.68 | 35.43 | 26.64 | |
| Fe | 55.16 | 50.71 | 47.17 | 58.41 | |
| Si | 14.11 | 13.28 | 14.96 | 13.16 | |
| Cu | 0.6 | 0.27 | 0.35 | 0.22 | |
| Ni | 0.11 | 0.14 | 0.17 | 0.09 | |
| S | 0.1 | 0.12 | 0.91 | 0.59 | |
| Co | 1.11 | 1..08 | 1.10 | 1.09 | |
| Total | 100 | 100 | 100 | 100 | |
| Reaction | Log K |
|---|---|
| H+ + L3– ↔ HL2– | 6.29 |
| 2H+ + L3– ↔ H2L1– | 11.23 |
| 3H+ + L3– ↔ H3L | 14.41 |
| Cu2+ + L3– ↔ CuL1– | 5.95 |
| Cu2+ + H+ + L3– ↔ CuHL0 | 8.68 |
| Cu2+ + 2H+ + L3– ↔ CuH2L+ | 11.34 |
| Cu2+ + H2O + L3– ↔ Cu(OH)L2– + H+ | 2.16 |
| Conditions | Final pH | |||||
|---|---|---|---|---|---|---|
| 1 h | 3 h | 6 h | 9 h | 12 h | 15 h | |
| 5% PD | 1.98 | 2.08 | 2.13 | 2.26 | 2.38 | 2.49 |
| 10% PD | 2.12 | 2.23 | 2.42 | 2.55 | 2.76 | 2.82 |
| 15% PD | 2.21 | 2.39 | 2.44 | 2.69 | 2.81 | 2.98 |
| 20% PD | 2.33 | 2.76 | 3.03 | 3.75 | 4.19 | 4.26 |
| Sample | Major Phases | Minor Phases |
|---|---|---|
| Head sample | Fayalite | Copper silicate |
| Magnetite | Wüstite | |
| Kyanite | Oxides of Cu, Ni, Co | |
| Leach residue | Fayalite | Fe.O.OH |
| Pyrite | Iron silicate |
© 2020 by the authors. Licensee MDPI, Basel, Switzerland. This article is an open access article distributed under the terms and conditions of the Creative Commons Attribution (CC BY) license (http://creativecommons.org/licenses/by/4.0/).
Share and Cite
Meshram, P.; Prakash, U.; Bhagat, L.; Abhilash; Zhao, H.; van Hullebusch, E.D. Processing of Waste Copper Converter Slag Using Organic Acids for Extraction of Copper, Nickel, and Cobalt. Minerals 2020, 10, 290. https://doi.org/10.3390/min10030290
Meshram P, Prakash U, Bhagat L, Abhilash, Zhao H, van Hullebusch ED. Processing of Waste Copper Converter Slag Using Organic Acids for Extraction of Copper, Nickel, and Cobalt. Minerals. 2020; 10(3):290. https://doi.org/10.3390/min10030290
Chicago/Turabian StyleMeshram, Pratima, Uday Prakash, Lalit Bhagat, Abhilash, Hongbo Zhao, and Eric D. van Hullebusch. 2020. "Processing of Waste Copper Converter Slag Using Organic Acids for Extraction of Copper, Nickel, and Cobalt" Minerals 10, no. 3: 290. https://doi.org/10.3390/min10030290