Using Microstructures and Composition to Decipher the Alterations of Rodent Teeth in Modern Regurgitation Pellets—A Good News-Bad News Story

1
ISYEB Institut de Systématique, Evolution, Biodiversité, UMR 7205 CNRS, Sorbonne-Université, EPHE, Muséum National d’Histoire Naturelle, 75005 Paris, France
2
Department of Biomaterials, Max-Planck Institute of Colloids and Interfaces, 14476 Potsdam, Germany
Minerals 2020, 10(1), 63; https://doi.org/10.3390/min10010063
Submission received: 16 December 2019
/
Revised: 4 January 2020
/
Accepted: 7 January 2020
/
Published: 12 January 2020
(This article belongs to the Special Issue Fake News in Paleoenvironmental and Paleophysiological Interpretations: Diagenetic Changes of Biominerals)
Abstract
:Rodent accumulations are widely used for palaeoenvironmental reconstructions. But these accumulations are created through the activity of predators (carnivorous mammals, birds of prey), the predation and digestion of which modify the preservation of bones and teeth. The microstructures of dentine and enamel, as well as the mineralogy and composition of non-digested and digested Rodent teeth extracted from modern regurgitation pellets collected at Olduvai (Tanzania) from a bird of prey (Bubo sp.) are compared. Scanning electron microscopy (SEM), Electron Probe Micro Analysis (EPMA) and Raman spectrometry were used. The modifications induced by the digestion process are variable and depend on the tissue (enamel, dentine), tooth (incisor, molar) and the predator. For a given tissue of a tooth, the estimation of the intensity of the alteration varies according to the selected criteria. To classify the digested teeth in categories based on a single parameter to reconstruct environment is still subjective, even for modern accumulations. Moreover, to identify the interplay of diverse parameters to avoid biases in reconstructions is difficult.
1. Introduction
Micromammals (e.g., Rodents) sensitive to environmental conditions and changes are widely used to reconstruct paleoenvironments. Moreover, in many fossil sites, they are more abundant than large Mammals and this offers the potential for employing statistical analyses.
Numerous factors play a role in the preservation of vertebrate fossil remains. One of them is the heterogeneity of the mineralized tissues. Bone, enamel and dentine (the three major tissues) have different structures and compositions, despite they share a common mineralogy (apatite). Also to be considered is the shape of the teeth and the distribution of enamel and dentine. For example, the rodent incisor is only partially covered by enamel, rapidly worn so that the dentine is visible in mature teeth.
Another factor is that fossil microvertebrates have generally undergone a pre-burial process: digestion by a predator. Many carnivorous birds regurgitate pellets containing indigestible materials such as bones, teeth, furs or feathers. Every predator has a characteristic ingestion behavior and different digestive processes. Differences in the effects of digestion on small bones extracted from pellets were first showed by Mayhew [1]. As soon as 1981, Shipman [2] demonstrates the advantages of the scanning electron microscope (SEM) over the optical microscope to detect the bone and teeth surface alterations. Andrews [3] and Fernandez-Jalvo & Andrews [4] recognized 5 categories of modern predators, based on several factors including the micro-morphological analysis of the surfaces of bones and teeth and the fragmentation of bones. Using similar criteria provided by light microscopy, Matthews [5] identified 5 digestion categories for isolated and in situ rodent incisors. Erosion and digestion were compared and differences between various avian predators detected [6,7]. Nevertheless, experimental data confirm that it may be difficult to separate abrasion and digestion features on bone surfaces [8]. Additionally, other taphonomic features resulting from weathering, trampling... or from soil and sediment interaction (compaction, concretions…) may hide the digestion traces [9].
Electron microprobe elemental and infrared analyses of rodent bones and teeth extracted from recent regurgitation pellets and carnivorous feces show that they are chemically altered and some changes can be correlated with the predator. Moreover, different parts of the skeleton (i.e., bone and dentine and enamel in teeth) are affected differently when submitted to the same predator [10,11,12,13]. Early studies on the chemical composition of fossil bones and teeth were applied to paleodietary reconstruction involving trace elements, mainly Sr [14]. However, Wyckoff and Doberenz [15] demonstrated that the Sr concentrations in bone could be affected by post-mortem diagenesis. It was subsequently also shown that the original composition of bone could be modified by the incorporation or loss, of a wide range of chemical elements for example, [16,17,18,19,20,21,22,23,24,25,26]. Thomas et al. [27] tried and failed, to correlate mineralization categories and elemental chemical content of fossils bones, despite a multi parameter approach.
Thus, any compositional changes observed in the fossilized samples of an assemblage would be controlled by two main factors: predation (pre-burial) and diagenesis (post-digestion to post-burial conditions). The interplay between these factors is complex [28] and unraveling the whole processes is challenging.
In this paper, we investigate the structural and chemical changes induced by digestion to both enamel and dentine. Modern pellets collected at Olduvai Gorge (Tanzania) provide an opportunity to obtain detailed information on the preservation of rodent incisors and molars. The likely bird of prey was Bubo sp. Rodent remains were extracted from these regurgitation pellets and teeth were selected to understand the damage due to the first step of the fossilization process: the pre-burial digestion. The aim of the study is to underline the differences in the estimation of the quality of preservation of digested teeth and the consequences of the choice of the criteria for environmental reconstructions.
2. Materials and Methods
2.1. Materials
Pellets of Bubo sp. were collected in the main gorge at Olduvai by Pr. J.J. Jaeger (now at Université de Poitiers, France) in 1976. Olduvai is a famous fossil site in northern Tanzania (Figure S1A–C). Gerbillus, Tatera and Taterillus are the most common species in these modern pellets [29], but some bird and reptile bones are also present. There are only two potential predators for these pellets: the large Bubo lacteus (or Verreaux eagle owl) and the small Bubo africanus (or Spotted eagle owl). Bubo lacteus is the largest African owl, a nocturnal opportunistic bird of prey and its digestion induces low modifications (category 1, [3]). Bubo africanus is also a nocturnal predator and induces moderate alterations (category 2, [3]).
2.2. Methods
Isolated teeth and teeth still inserted in bones were extracted manually from the pellets and ultrasonically cleaned in water containing a few mL of a commercial detergent for 3 min. After rinsing in de-ionized water and air dried, teeth were examined using scanning electron microscopy (SEM) for surface modifications, Raman spectrometry and electron probe microanalysis (EPMA) for compositional information. For comparison, samples of fresh (i.e., not from pellets) teeth were obtained from the Bassin de Paris (France), from Morocco (Meriones) and from Peninj area close to the Natron alkaline lake (Tanzania) (for details, see Reference [11]).
2.2.1. Scanning Electron Microscopy (SEM)
Morphology and surficial features of rodent teeth were observed on samples cleaned using a moderate ultrasonic bath in water to remove sedimentary particles and dust, then air dried. Additionally, to observe the microstructures, teeth were embedded in epoxy resin, polished using various grades of diamond paste and then the surface lightly etched by immersing in 5% formic acid for 15 s. This light etching reveals any structural details within the sample, for example, cracks filled with sediment. Samples were rinsed, air dried and subsequently coated with gold for SEM observations. A Philips 505 SEM, a XL 30 SEM and a Quanta 600 FEI (Philips, Amsterdam, The Netherlands) were used to obtain secondary electron images of the fractures and microstructures. Details of the preparative processes are given in the legends of figures.
2.2.2. Raman Spectrometry
Raman spectra were collected using a InVia Raman micro-spectrometer (Renishaw, Wotton-under-Edge, Gloucestershire, UK) combined with a 785 nm laser and controlled by the WiRE software (Renishaw). Measurements on polished sections of non-digested teeth and teeth extracted from regurgitation pellets were performed using a 1200 lines/mm grating. Data were collected within the spectral window, 100–1600 cm−1, using 1% of the laser power. For each analyzed spot, data were scanned for the acquisition of up to 20 spectra and 10 s laser exposure time. Spot positioning was made using a 50× objective lens, giving an analytical spot size of approximately 2 µm in diameter. 2 or 3 spots were done for every tissue of molars and incisors. Spectra were then normalized and averaged. Spectral peak positions were calibrated with a silicon standard. Spectra baseline was corrected using the Crystal Sleuth routine and the wavenumbers were identified by Spectragryph (F. Menges, optical spectroscopy software, https://www.effemm2.de/spectragryph/).
The main constituent of dentine and enamel is a calcium phosphate mineral belonging to the apatite group. Organic components are also present and more abundant in dentine. Collagen is present in both tissues [30] but is a minor component in enamel. Keratins have been detected in enamel [31]. Several peaks are assigned to PO43−: ν1 at 960 cm−1, ν2 at about 430 cm−1, ν3 at 1030 cm−1 and ν4 at 580 cm−1. Amide III band is assigned at about 1240 cm−1. Band at about 865 cm−1 is assigned to the hydroxyproline of collagen, the band at 1030 cm−1 to proline and the band at about 1450 cm−1 to δ(CH2) [32,33,34]. Spectra of dentine and bone are similar.
2.2.3. Chemical Analyses
Information was obtained from both energy-dispersive spectroscopy (EDS) and wavelength-dispersive spectroscopy (WDS). EDS microanalysis was undertaken on carbon-coated samples using a Philips 505 SEM equipped with a solid state Si(Li) detector and a Philips XL30 SEM equipped with a PGT Ge solid state X-ray detector (Philips, Amsterdam, Netherlands). A pure metal cobalt standard provided the instrument calibration and measurements were made using a live time of 100 or 200 s. Operating conditions for EDS were: 15 kV accelerating voltage, nominally 2 nA beam current and 20 µm spot size. X-ray elemental analyses were also performed using wavelength-dispersive spectrometry (CAMECA SX50, Ametek, Gennevilliers, France). Operating conditions for WDS, 20 kV, 20 nA and 20 µm spot size were employed.
A minimum of 10 analyses was obtained on each tissue type (i.e., dentine and enamel) within the sample. Elements determined were Na, Mg, P, S, Cl, K, Ca, Fe and Sr. In the samples of fresh teeth, some elements (i.e., K, Fe) were routinely below the microprobe detection limit but are included in the tables because these elements may be good indicators of the presence of diagenesis.
2.2.4. Statistical Analyses
Several (>10) microprobe analyses were made at various locations on individual samples. In this study the mean values are used as being representative of the sample. Several digested and non-digested incisors and molars were analysed. Principal component analysis (PCA) was based on correlation matrices, so that the statistical weights of elements with high concentrations (i.e., P, Ca) were moderated within the software (Statgraphics centurion XVI, Statpoint Technologies Inc., Warrenton, VA, USA). Non-parametric tests (Mann-Whitney, Kolmogorov-Smirnov) were used to estimate the similarity of the samples.
3. Results
3.1. Microstructures and Composition of Fresh Teeth (i.e., Not Extracted from Pellets)
In rodent incisors, the enamel does not form a complete layer enclosing the entire surface of the growing tooth but it is present only on the buccal face (Figure S2).
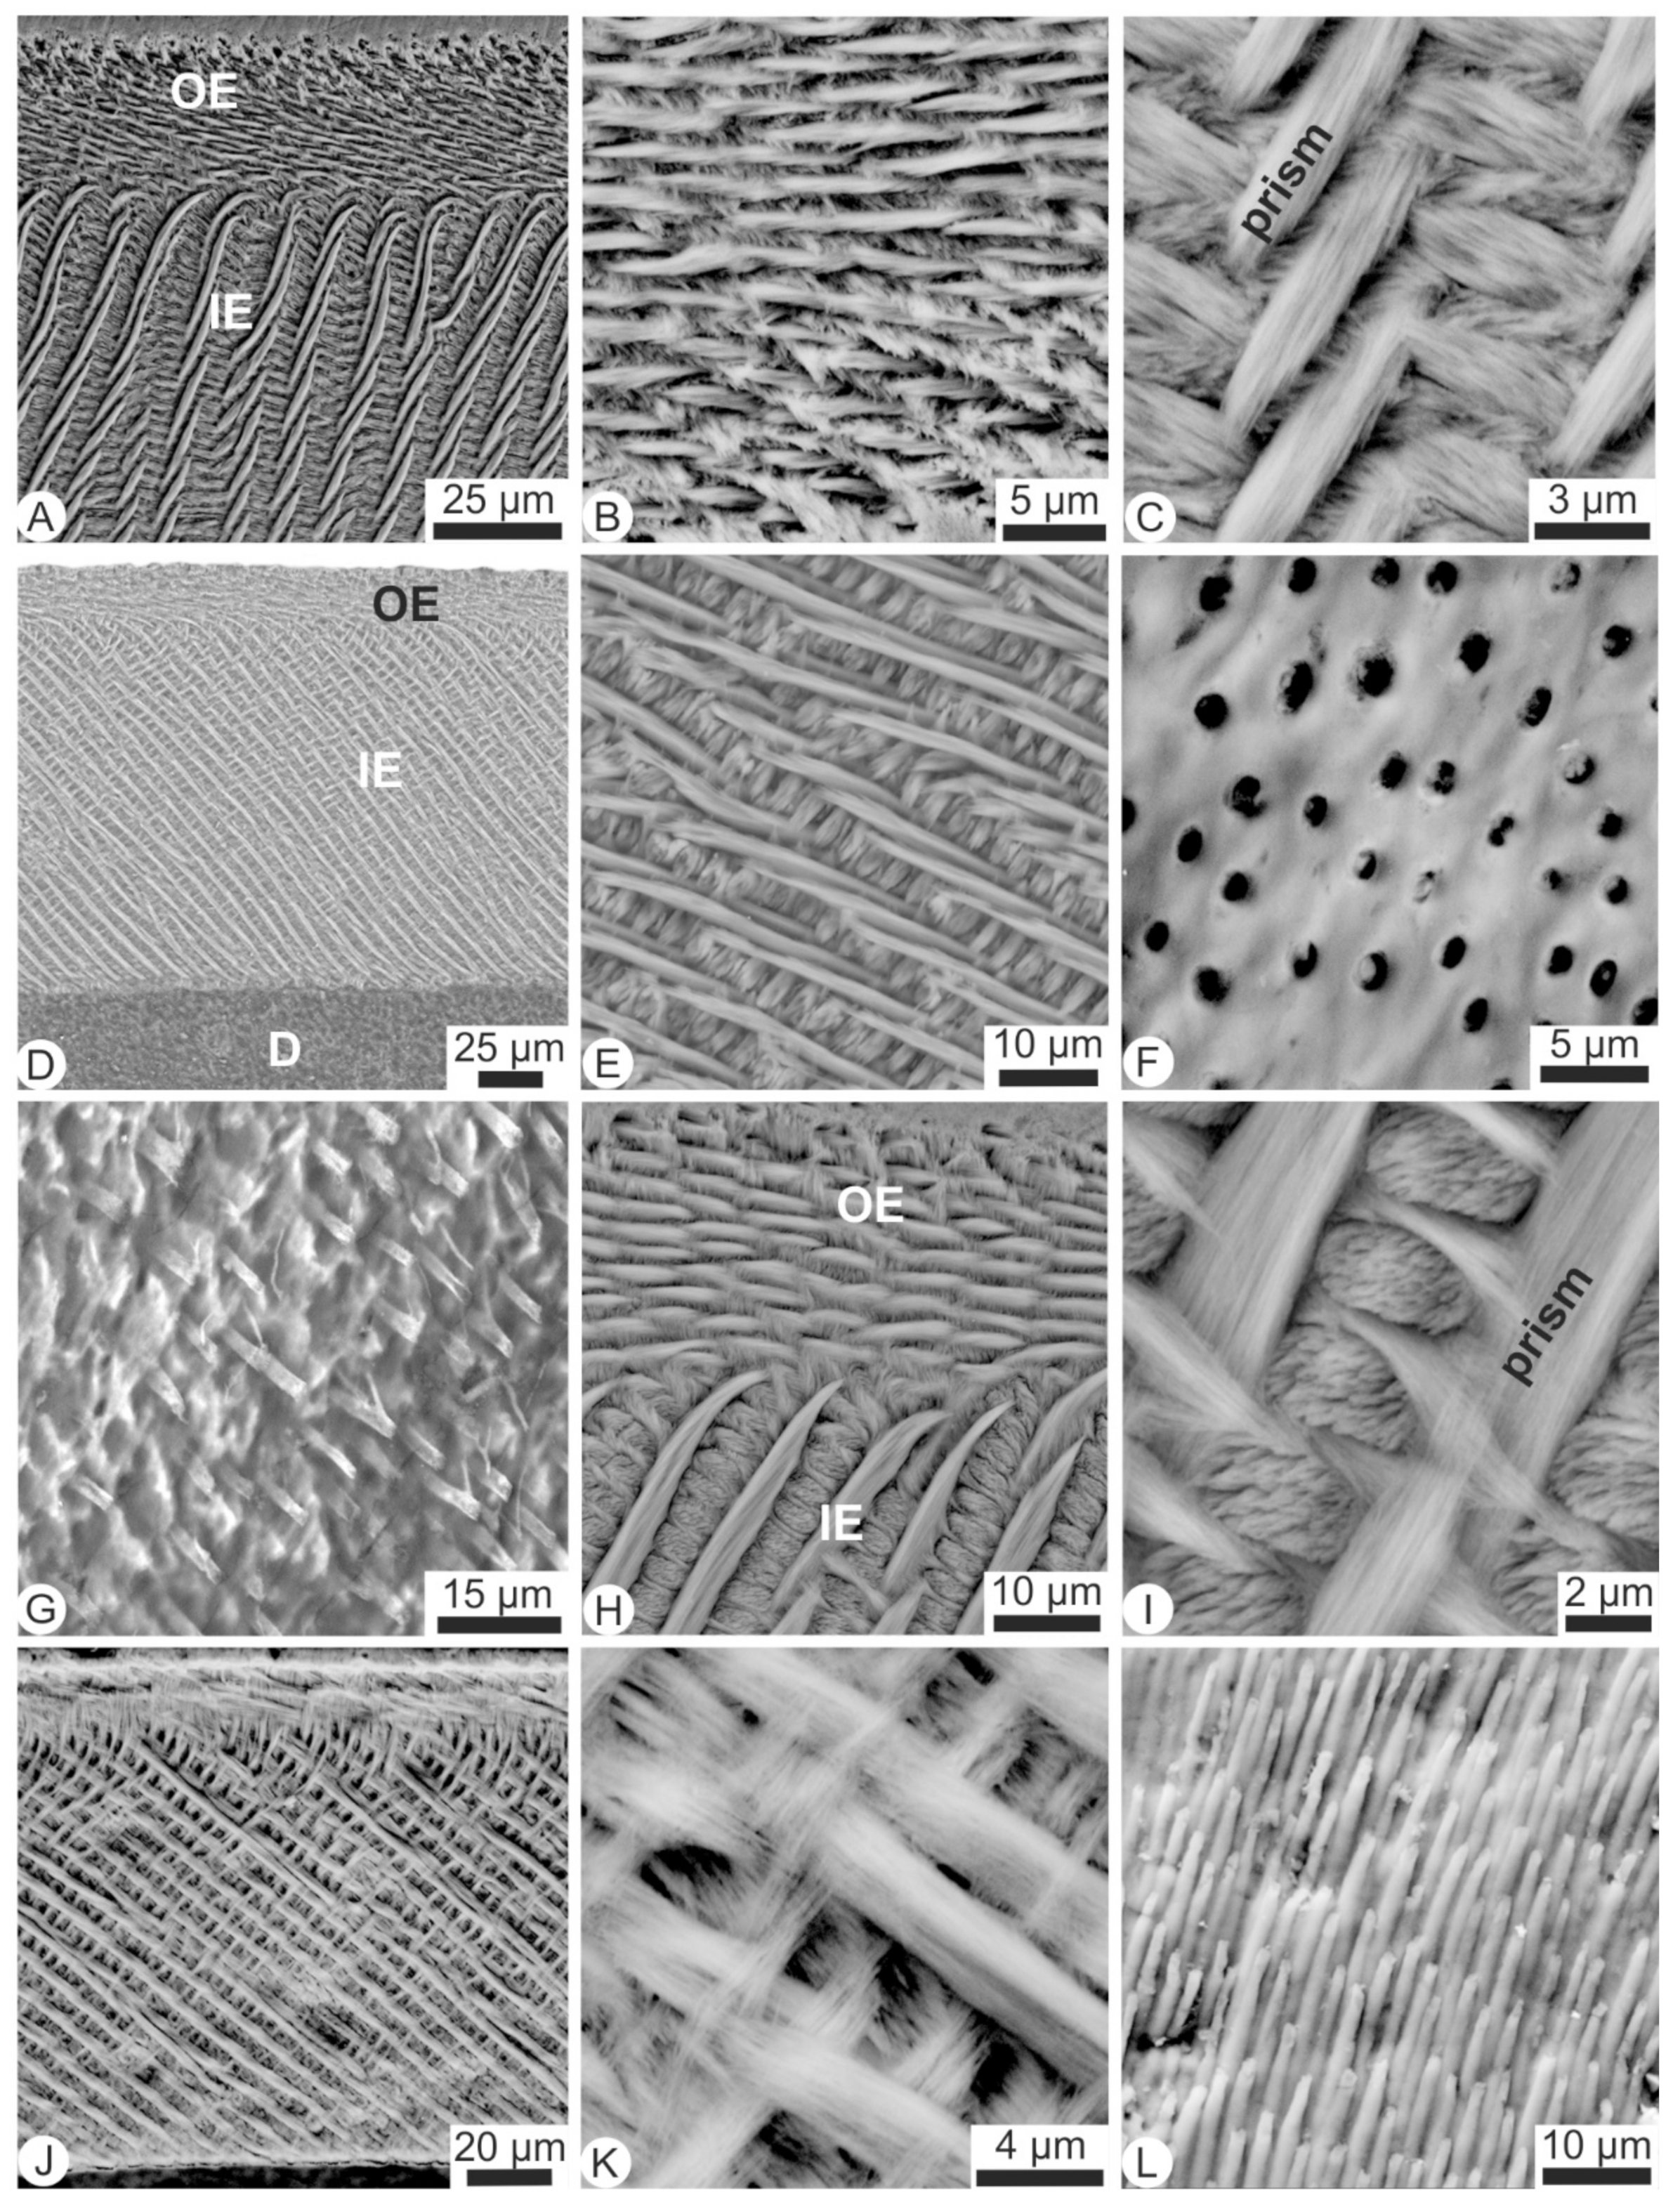
Polished and etched sections show that two sublayers in the enamel of Rattus incisors, both being prismatic (Figure 1a): a thin outer sublayer (portio externa) and a thick inner sublayer (portio interna) showing the classical pattern of prism decussation called uniserial lamellar [35,36]. According to Risnes [37] lamellae composed of two prisms are a common feature of the Rattus incisor. But only perfectly oriented sagittal sections show the uniserial pattern. Most often, sections are somewhat oblique, so that several prisms are visible in the lamella. Prisms of the outer layer are parallel to the outer surface of the tooth (Figure 1B). Prisms are cylindrical bundles of parallel elongated (Figure 1C). A similar pattern is visible in the mouse incisor (Figure 1D,E). In polished and etched sections, the tubules of the dentine are empty (Figure 1F) or still with organic remains (Figure 1G). Another Muridae (Meriones) incisor also exhibits two enamel sublayers and uniserial pattern (Figure 1H,I). Two sublayers exist in the enamel of a molar of Mus (Figure 1J) and the inner structure of the prisms is similar to that of the incisor (Figure 1K). The parallel tubules of orthodentine of the molar are clearly visible depending on the orientation of the section (Figure 1L).
3.2. Mineralogy and Bulk Composition of Fresh Teeth
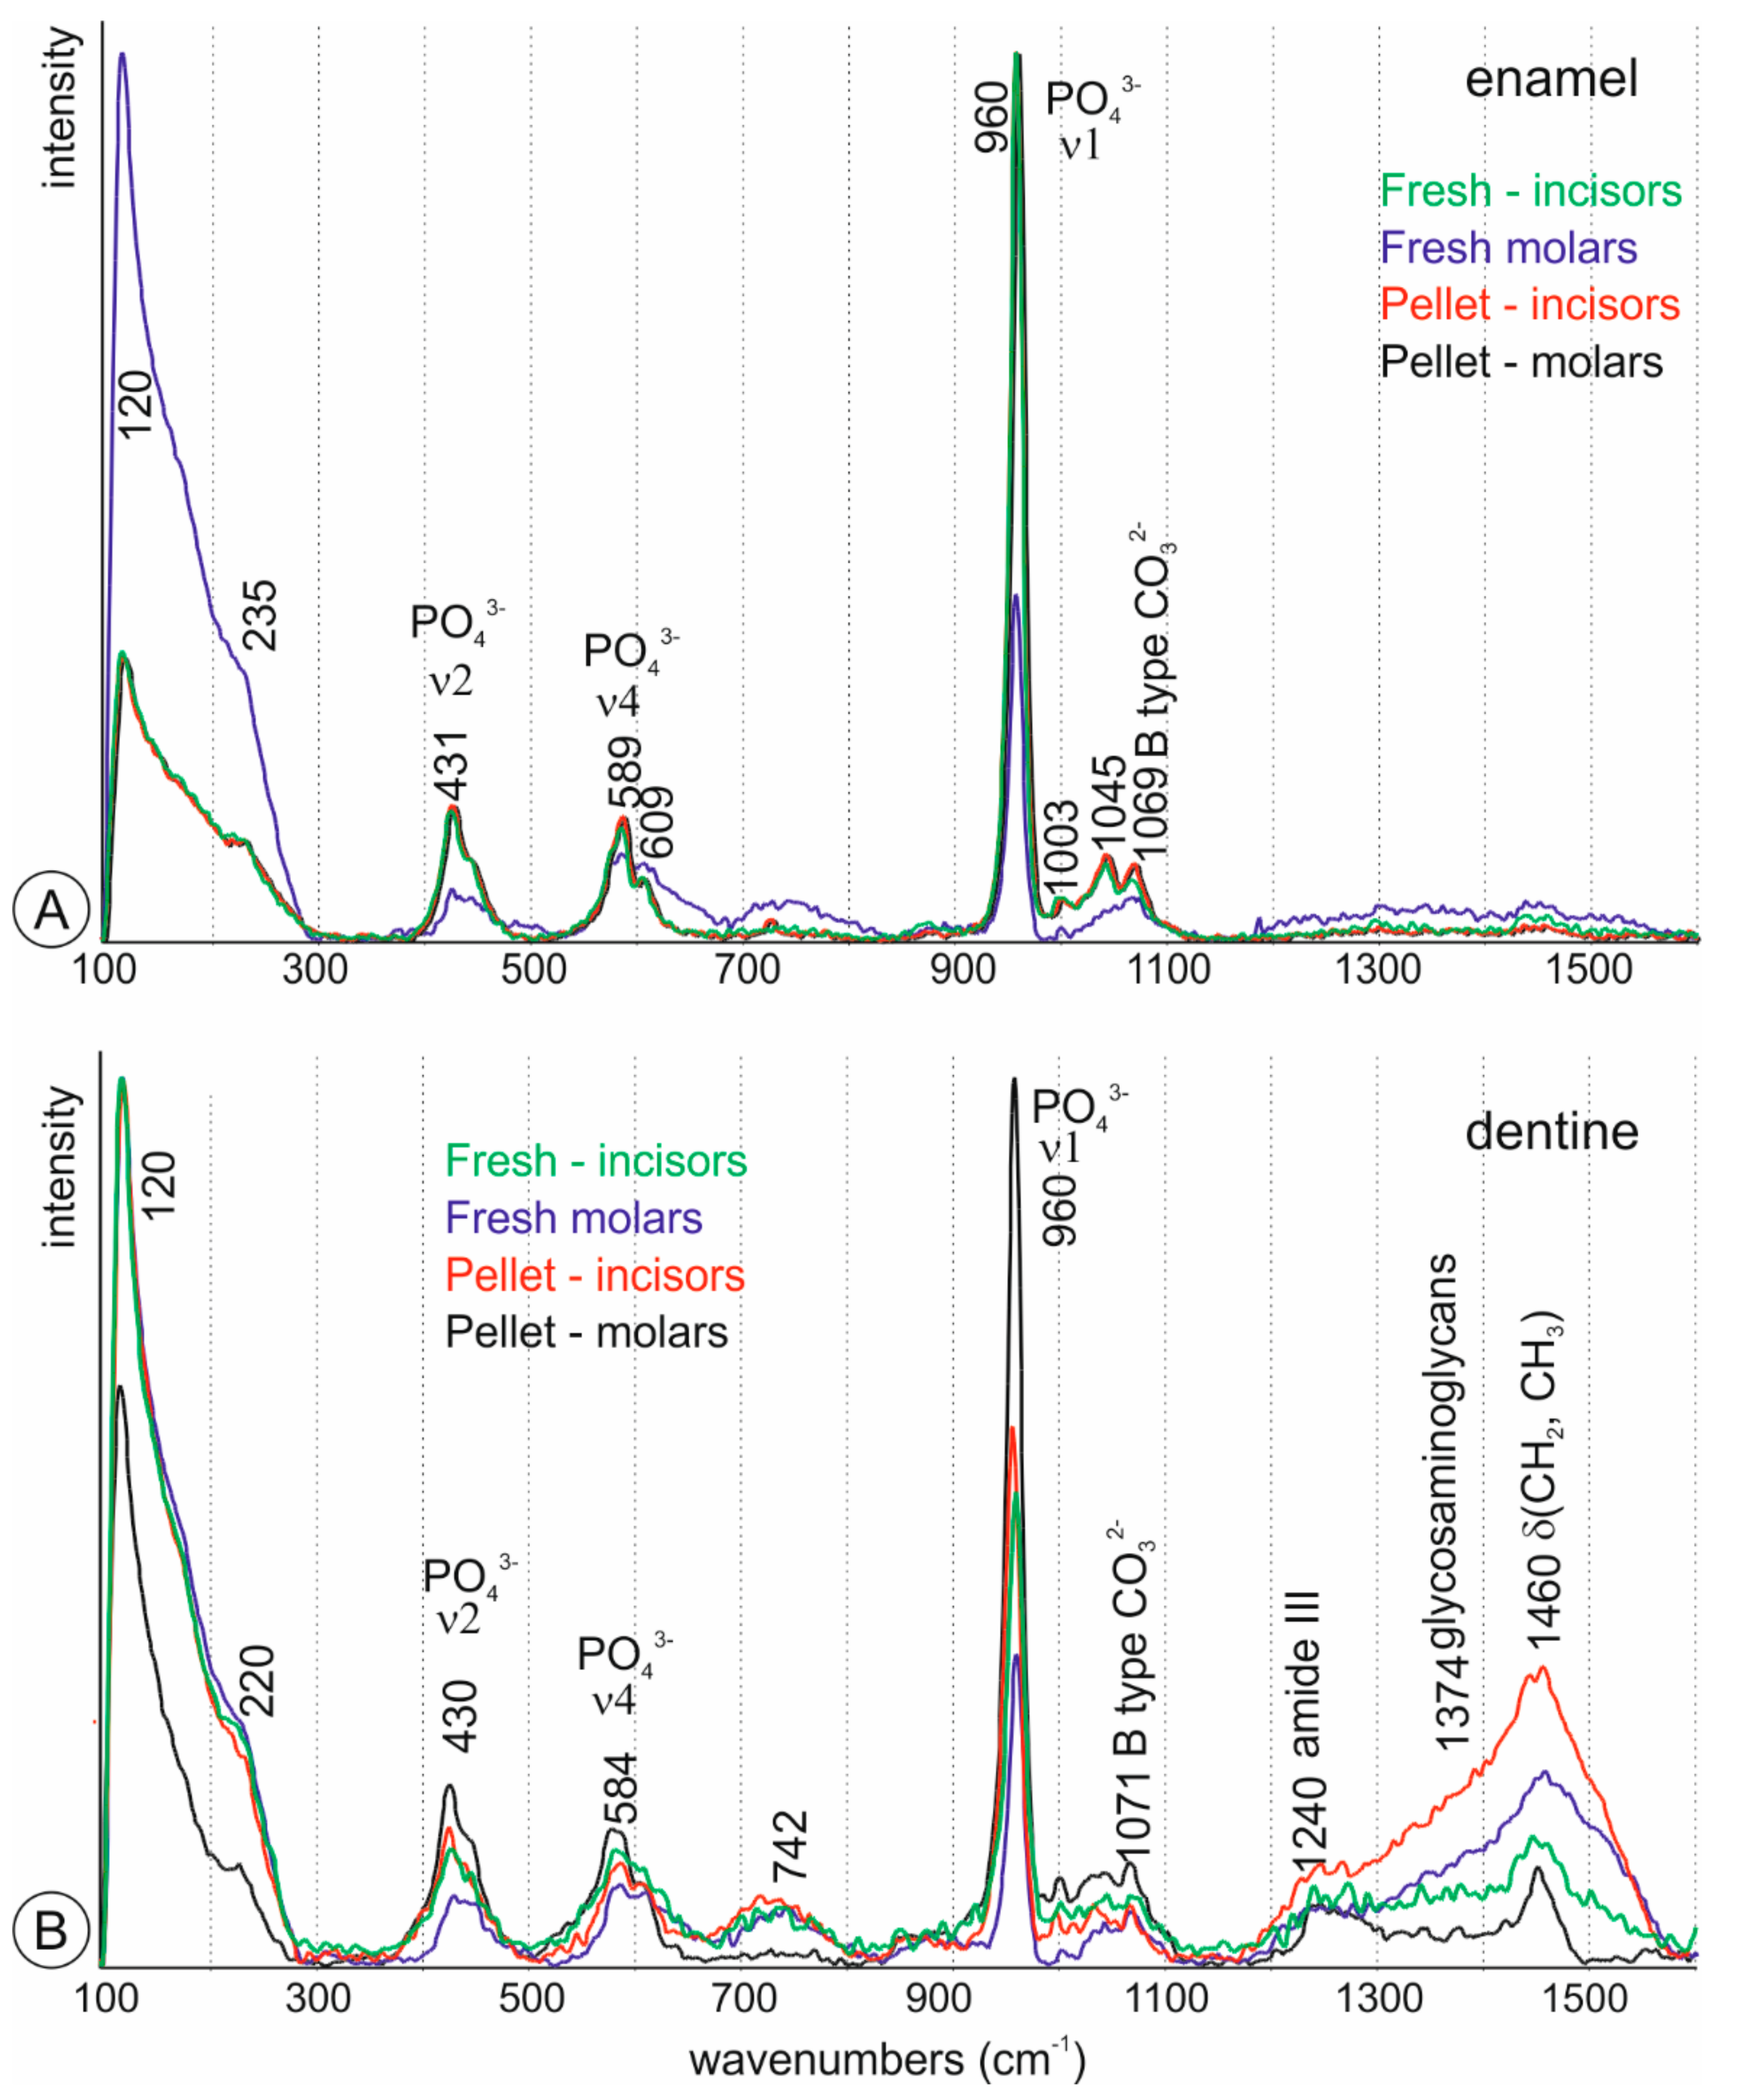
Figure 2 illustrates average Raman spectra from dentine and enamel of fresh incisors and molars. All samples were apatite. The enamel contains the strongest mineral features, in particular the ν1(PO43−) peak at 961 cm−1. v2 and v4 phosphate peaks can be seen at 433 cm−1 and 562 cm−1. Dentine has a less intense ν1 peak compared with enamel but contains peaks associated with the organic components. The peaks at 1250 cm−1 and 1450 cm−1 assigned respectively to amide III and δ(CH2) wag are absent in enamel. The carbonate peak at 1070 cm−1, more intense in enamel, is representative of B-type substituted carbonate in the hydroxyapatite. Molars and incisors are similar.
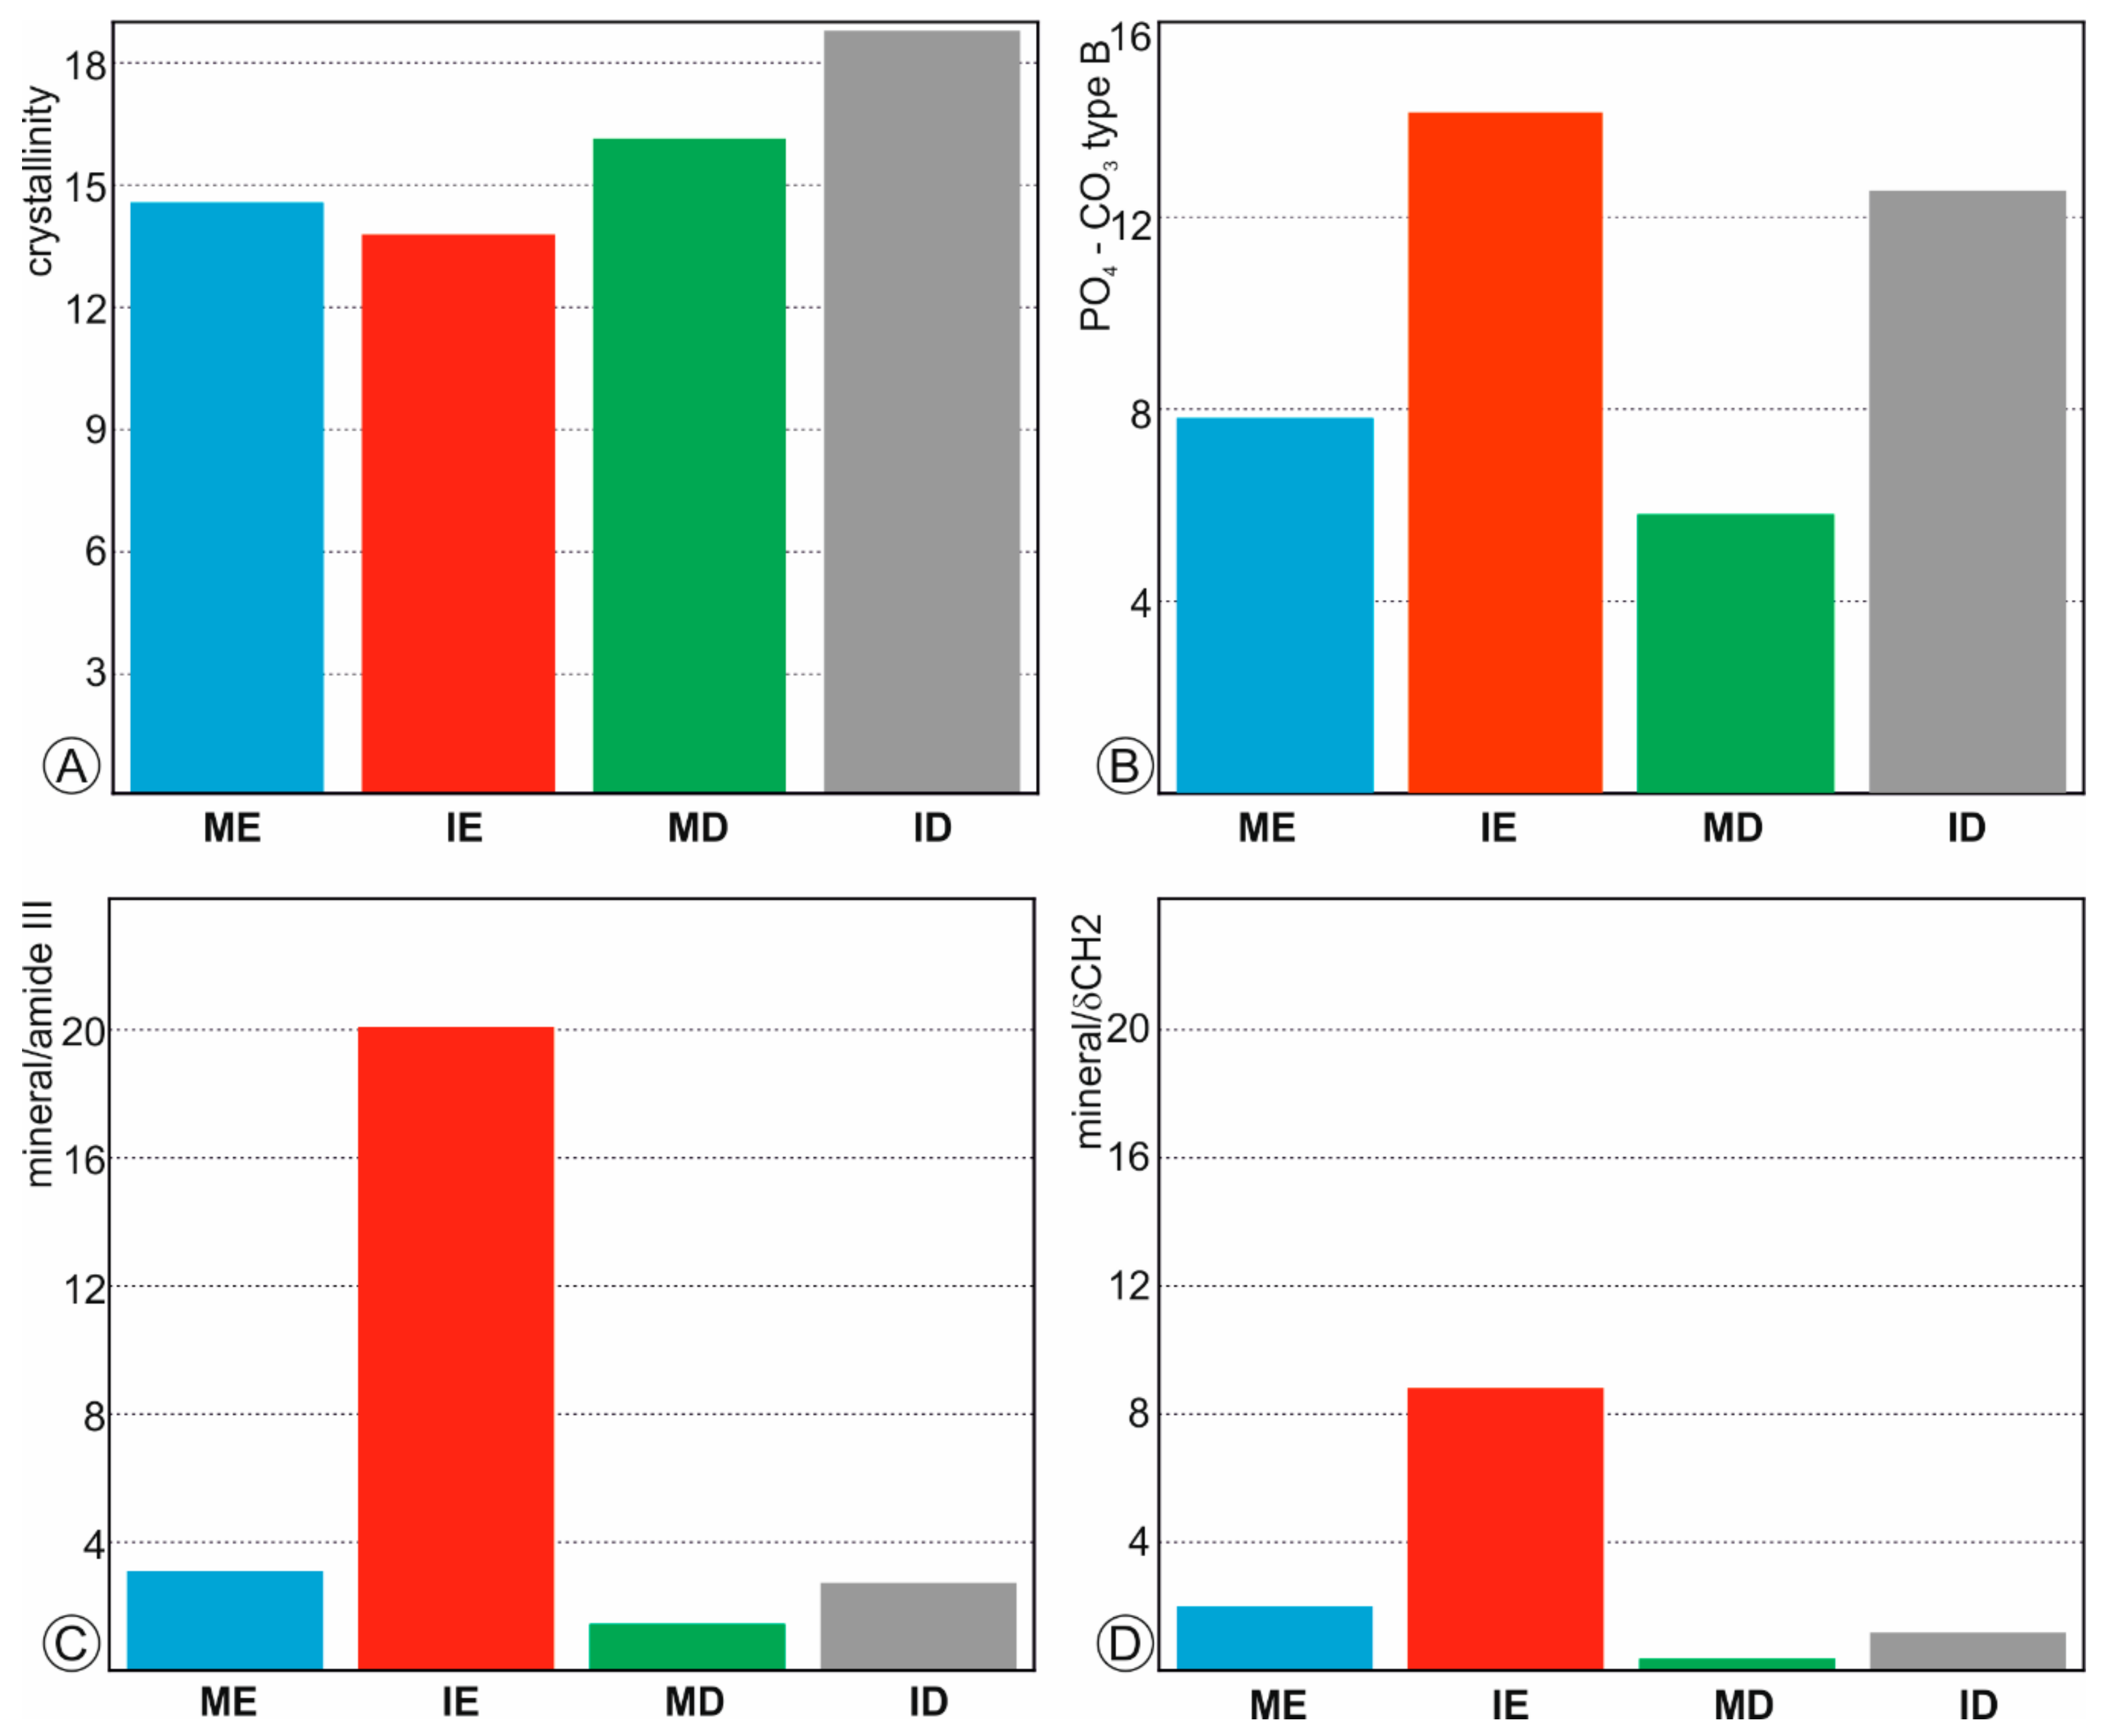
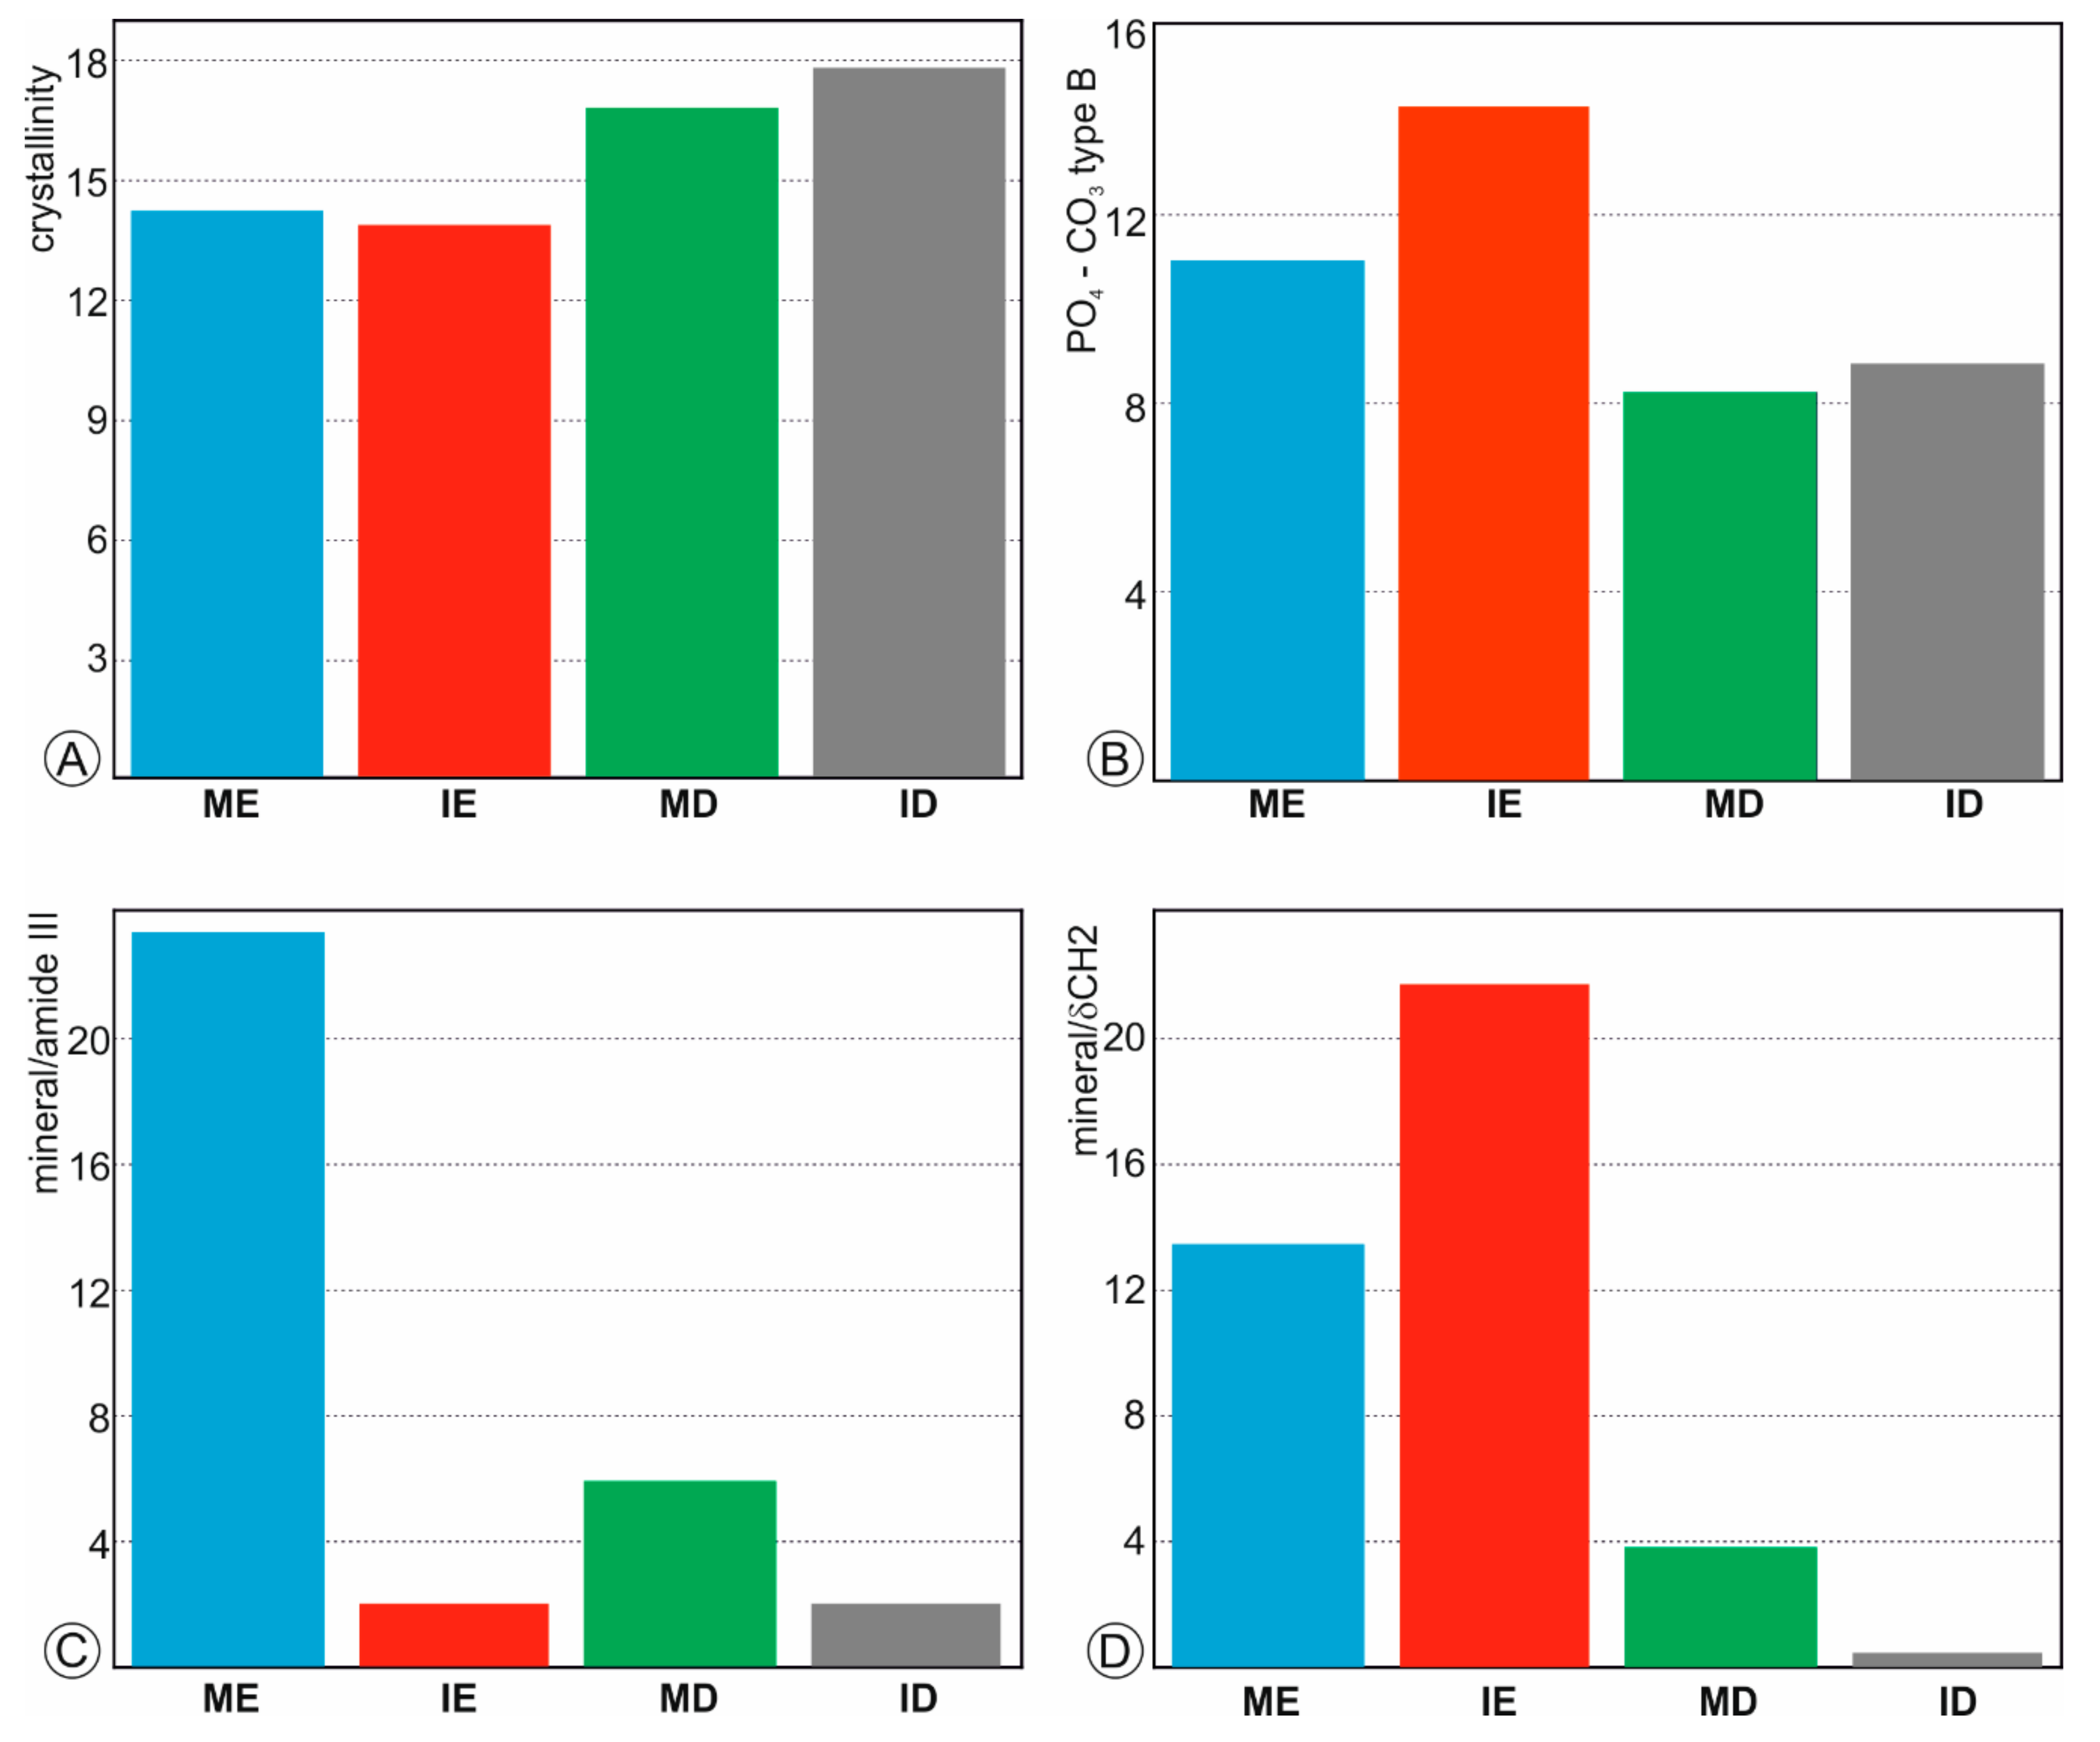
Crystallinity index and mineral/organic ratios can be estimated from Raman spectra. Usually, the Full Width at Half Maximum (FWHM) of the ν1 PO43− is selected as a crystallinity index [38,39]. FWHM of fresh dentine in molar and incisor is higher than that of enamel (Figure 3A), so that enamel is better crystallized than dentine. The substitution of PO43− to CO32− B type is estimated from the ratios of the intensities of 961 to 1070 cm−1 peaks [40]. This ratio shows that the CO32− content is lower in incisors than in molars (Figure 3B).
The mineral/organic component was estimated using two ratios: (1) the surface of the peak ν1 PO43− between 930 and 980 cm−1 divided by the surface of the amide III band between 1170 and 1270 cm−1 (Figure 3C) and (2) the surface of the peak ν1 PO43− between 930 and 980 cm−1 divided by the surface of the δ(CH2) between 1400 and 1500 cm−1 (Figure 3D). Despite the values differ, the profiles are similar. Enamel in incisors is the poorest organic tissue, whereas the molar dentine has the highest organic content.
3.3. Elemental Composition of Fresh Teeth
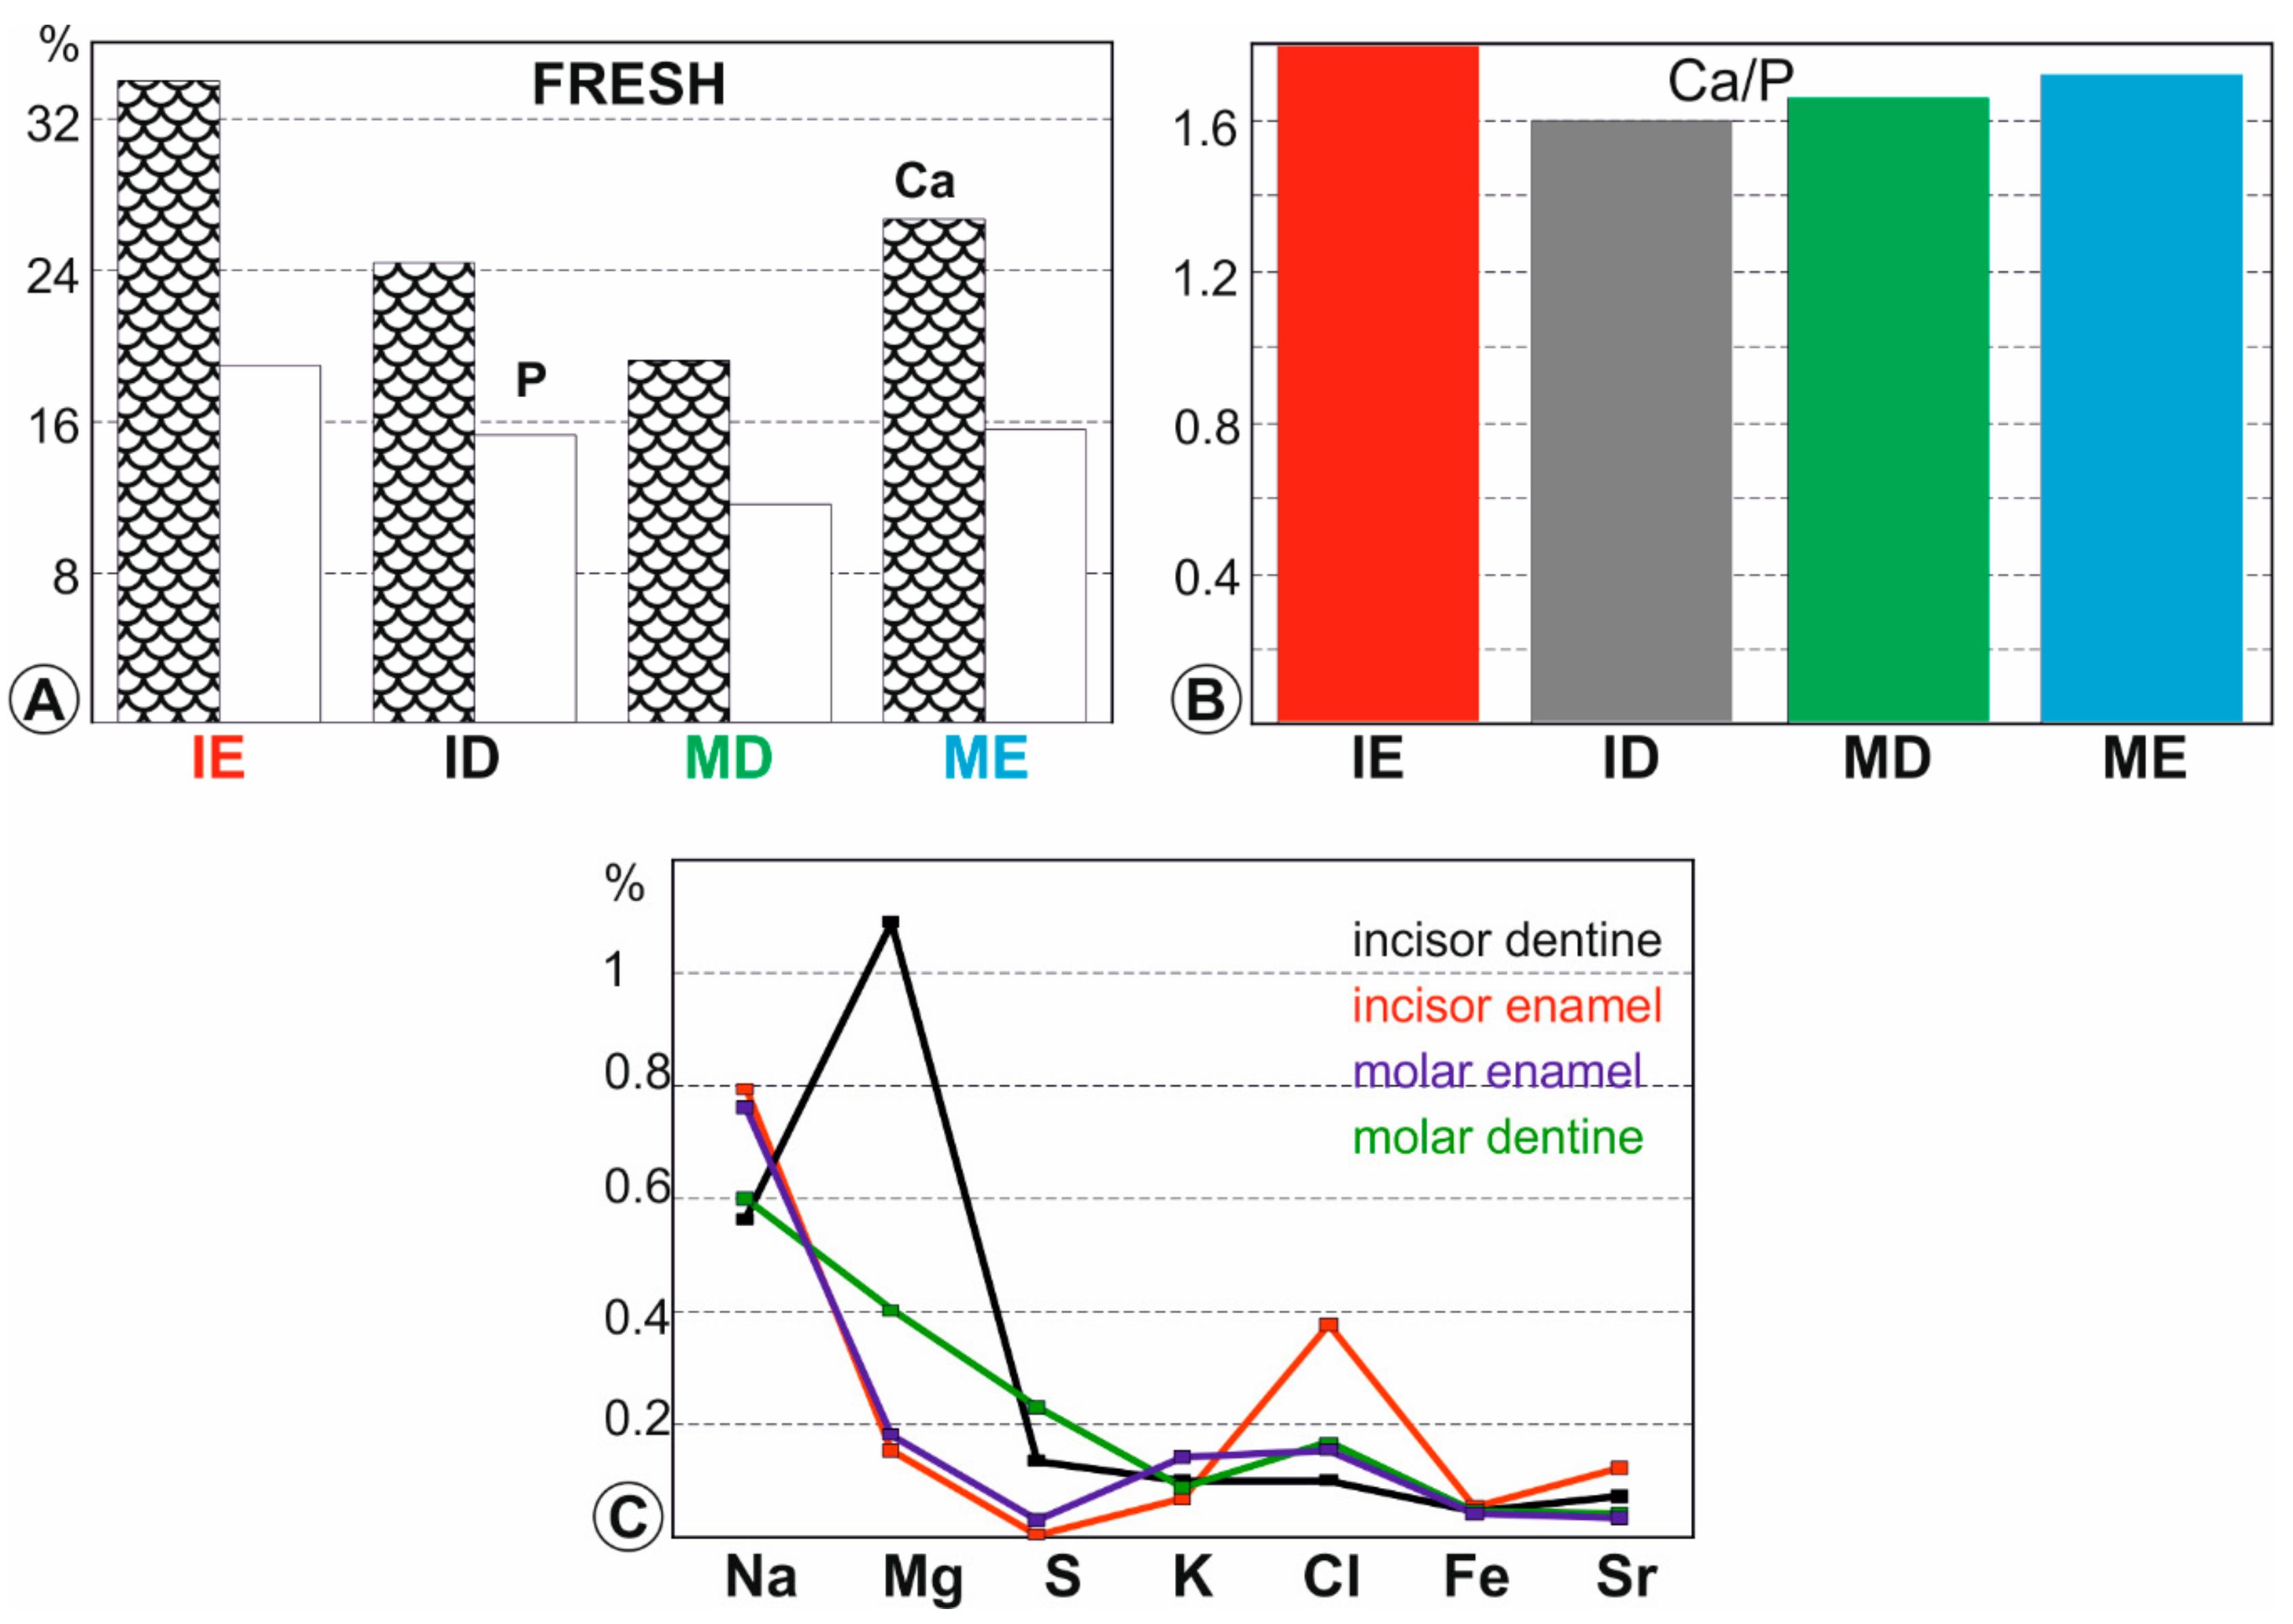
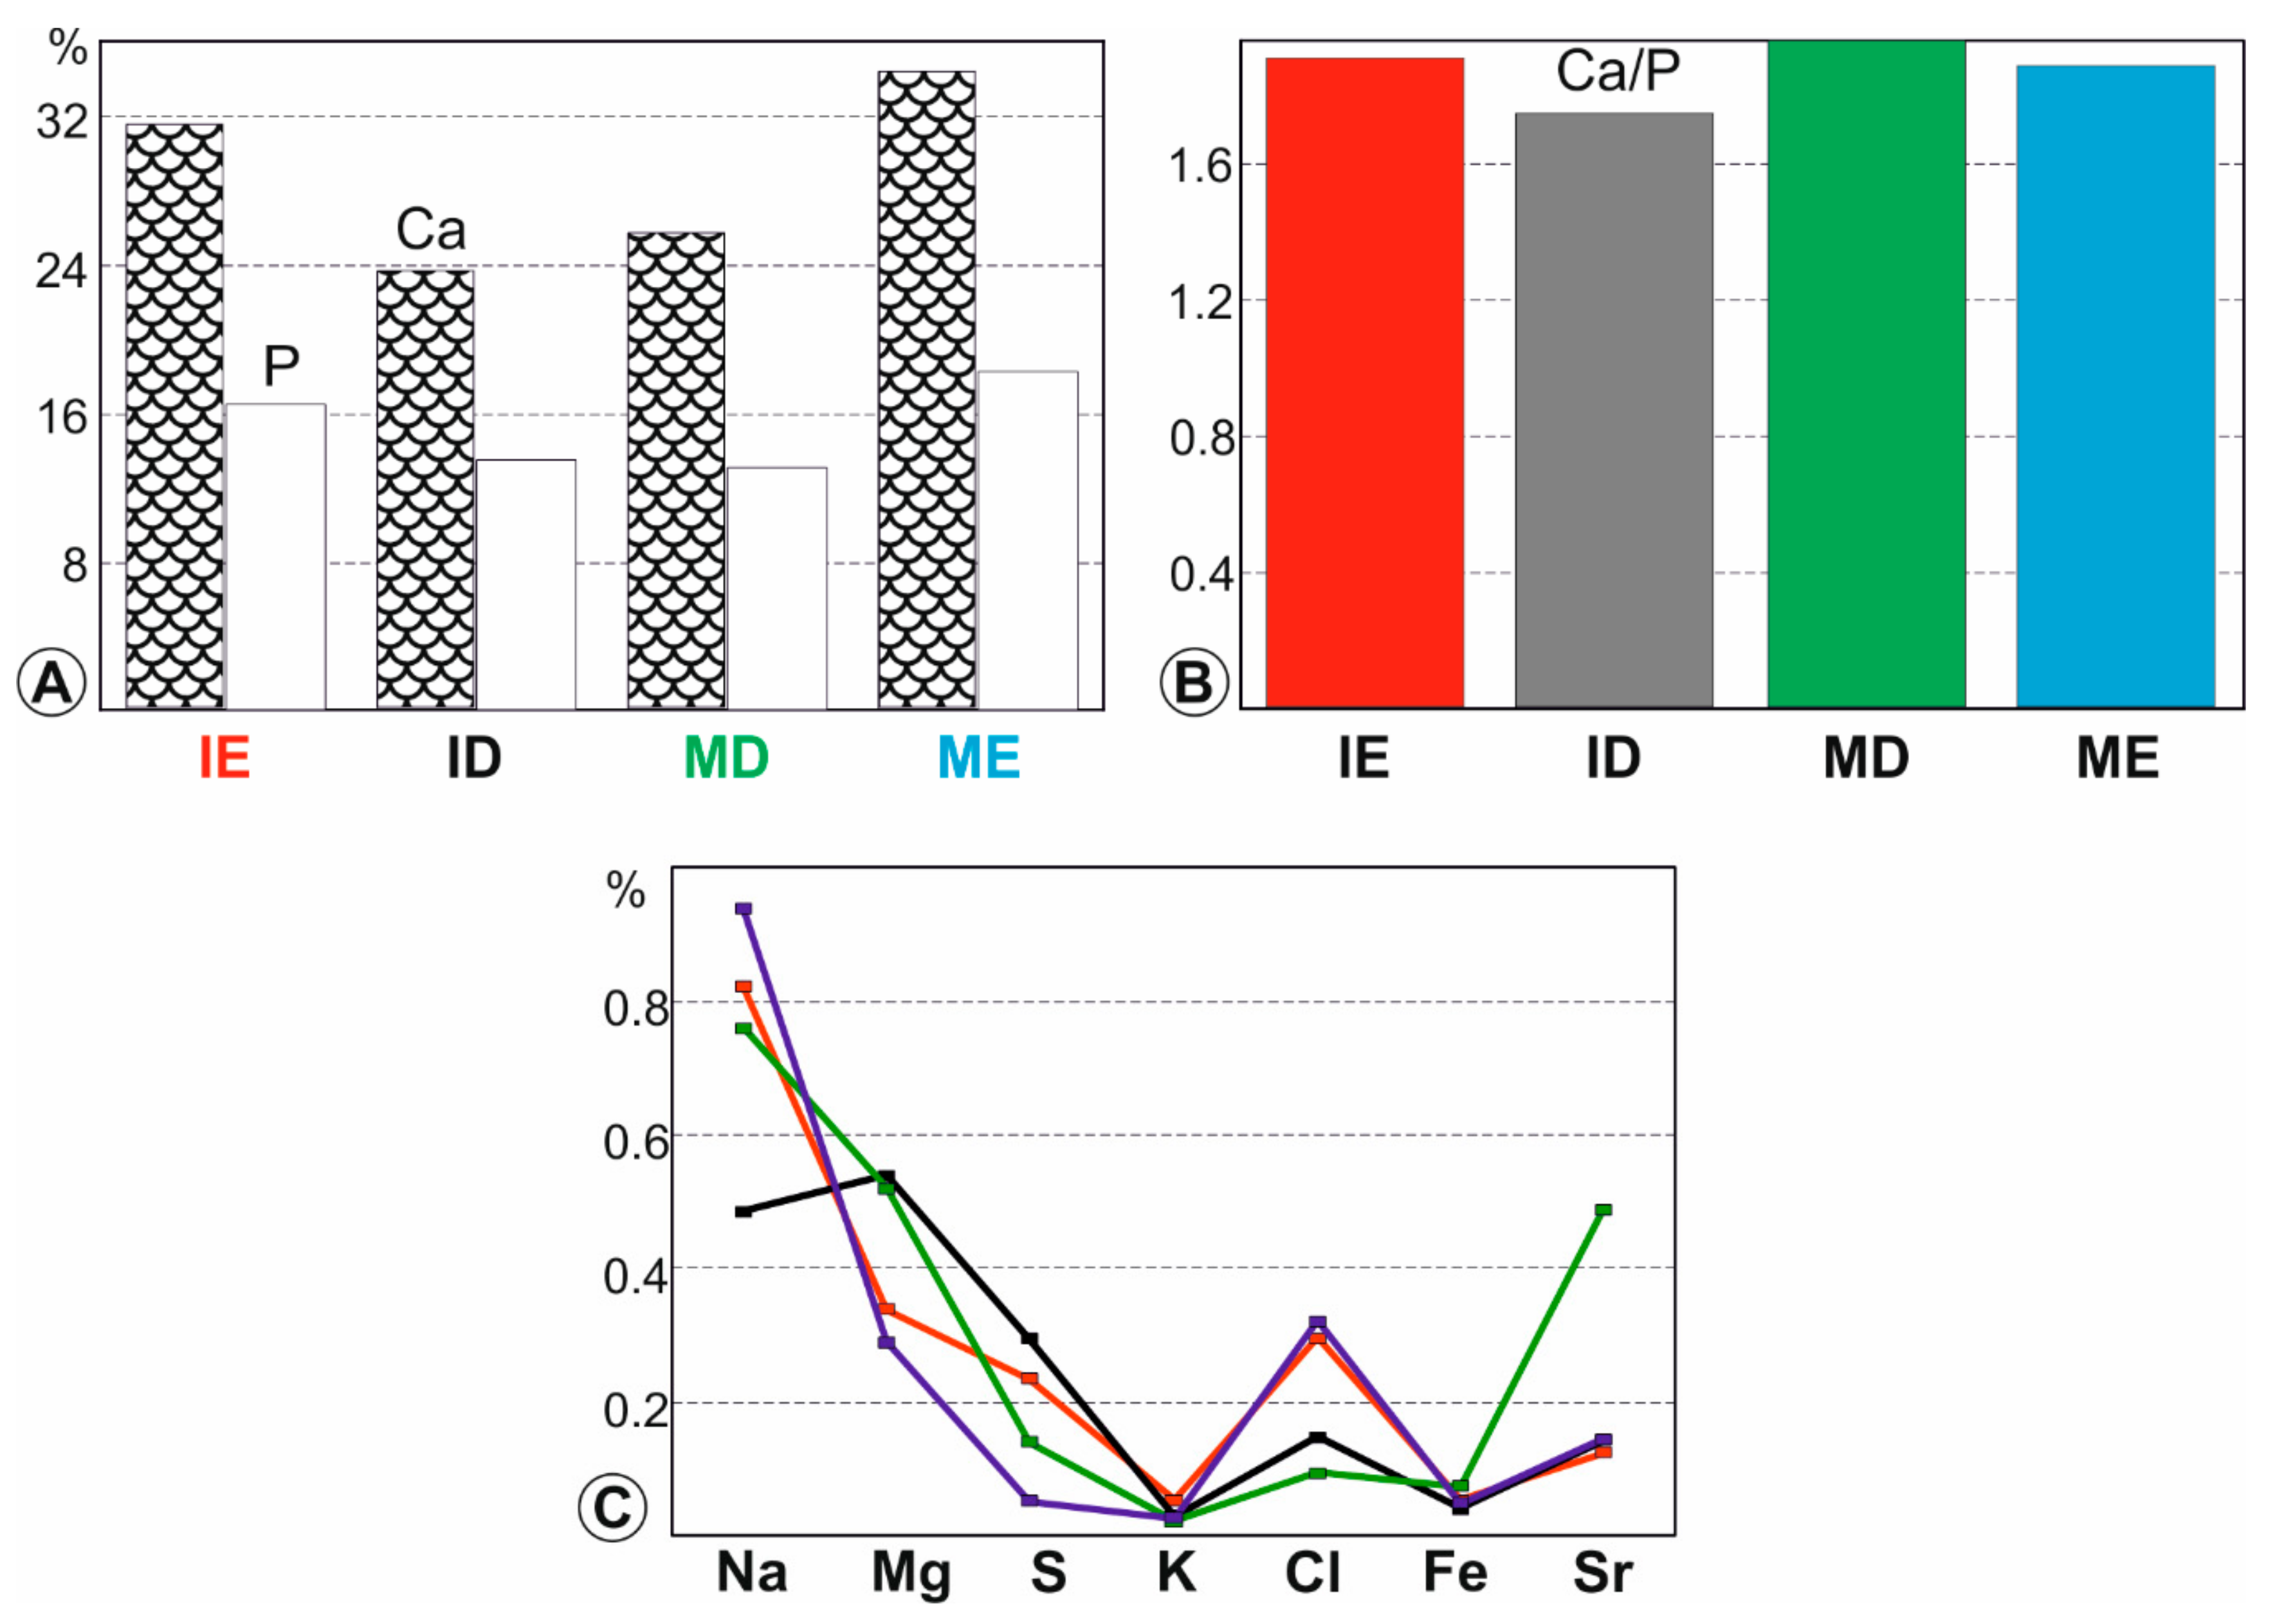
Apatite crystals in bones and teeth are far from being stoichiometric. Averages and standard deviations for both major and minor elements in fresh (not digested, not extracted from pellets) rodent teeth are given in Table S1 (Supplementary materials) and displayed graphically in Figure 4. The highest contents in Ca and P and the highest Ca/P ratios (in weight) are in enamel (Figure 4A,B). The high Mg content of the incisor dentine is usual in ever growing teeth. Depending upon the taxa, rodent molars are brachyodont (e.g., Arvicantis) or hypsodont (e.g., Arvicola), so that the Mg content is lower than that of the incisors (Figure 4A). Both enamels (incisors and molars) are rich in Na but only the incisor tissue is rich in Cl (Figure 4A). Iron gives the surface of rodent incisors a yellowish appearance [41,42].
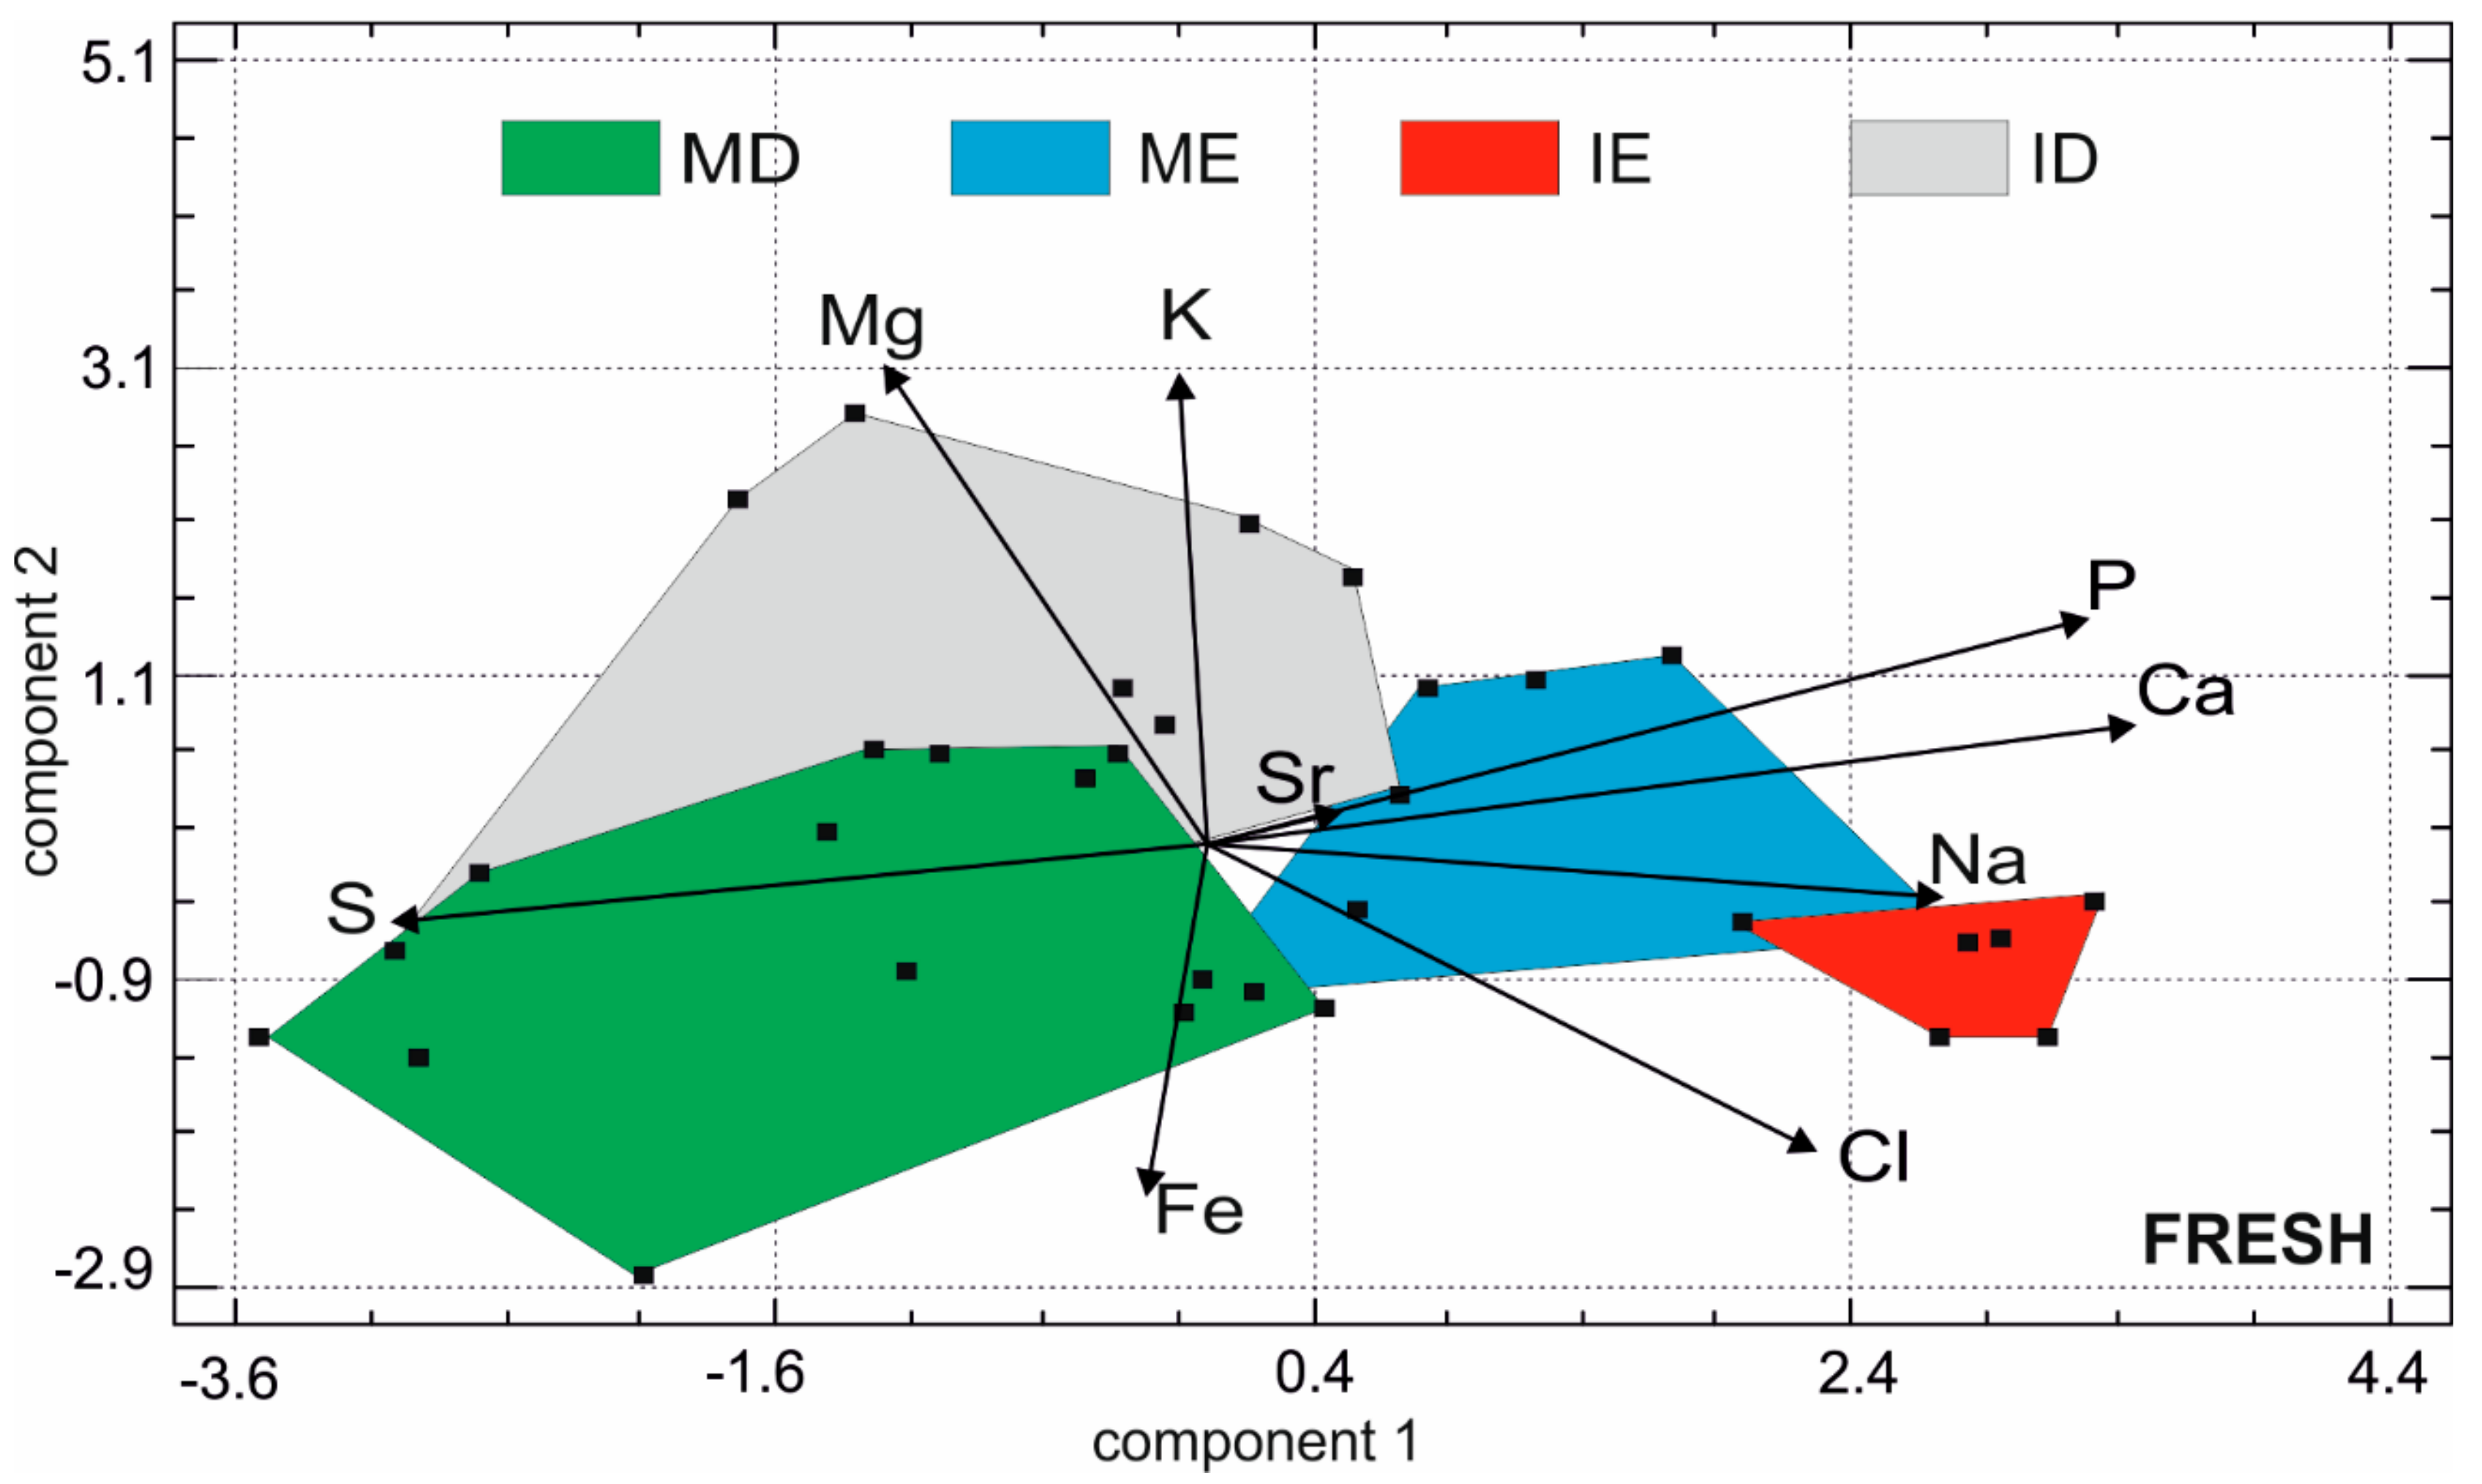
Multivariate analysis was performed on these data using principal components analysis (Figure 5). The first principal component represents 38.8% of the total variance, component 2 = 17.4% and component 3 = 12.6%. In the first principal component, the samples are sorted with higher Ca and P, diametrically opposed to S. Mg and K are opposed to Fe in the second principal component. Small overlaps are visible. They are probably due to the presence of brachydont and hypsodont molars, the Mg and S contents of which are variable. The sizes of the domains of the dentine are larger than those of enamels, illustrating that the dentine has a more variable composition than the enamel.
3.4. Surficial, Microstructural Alterations of Digested Teeth
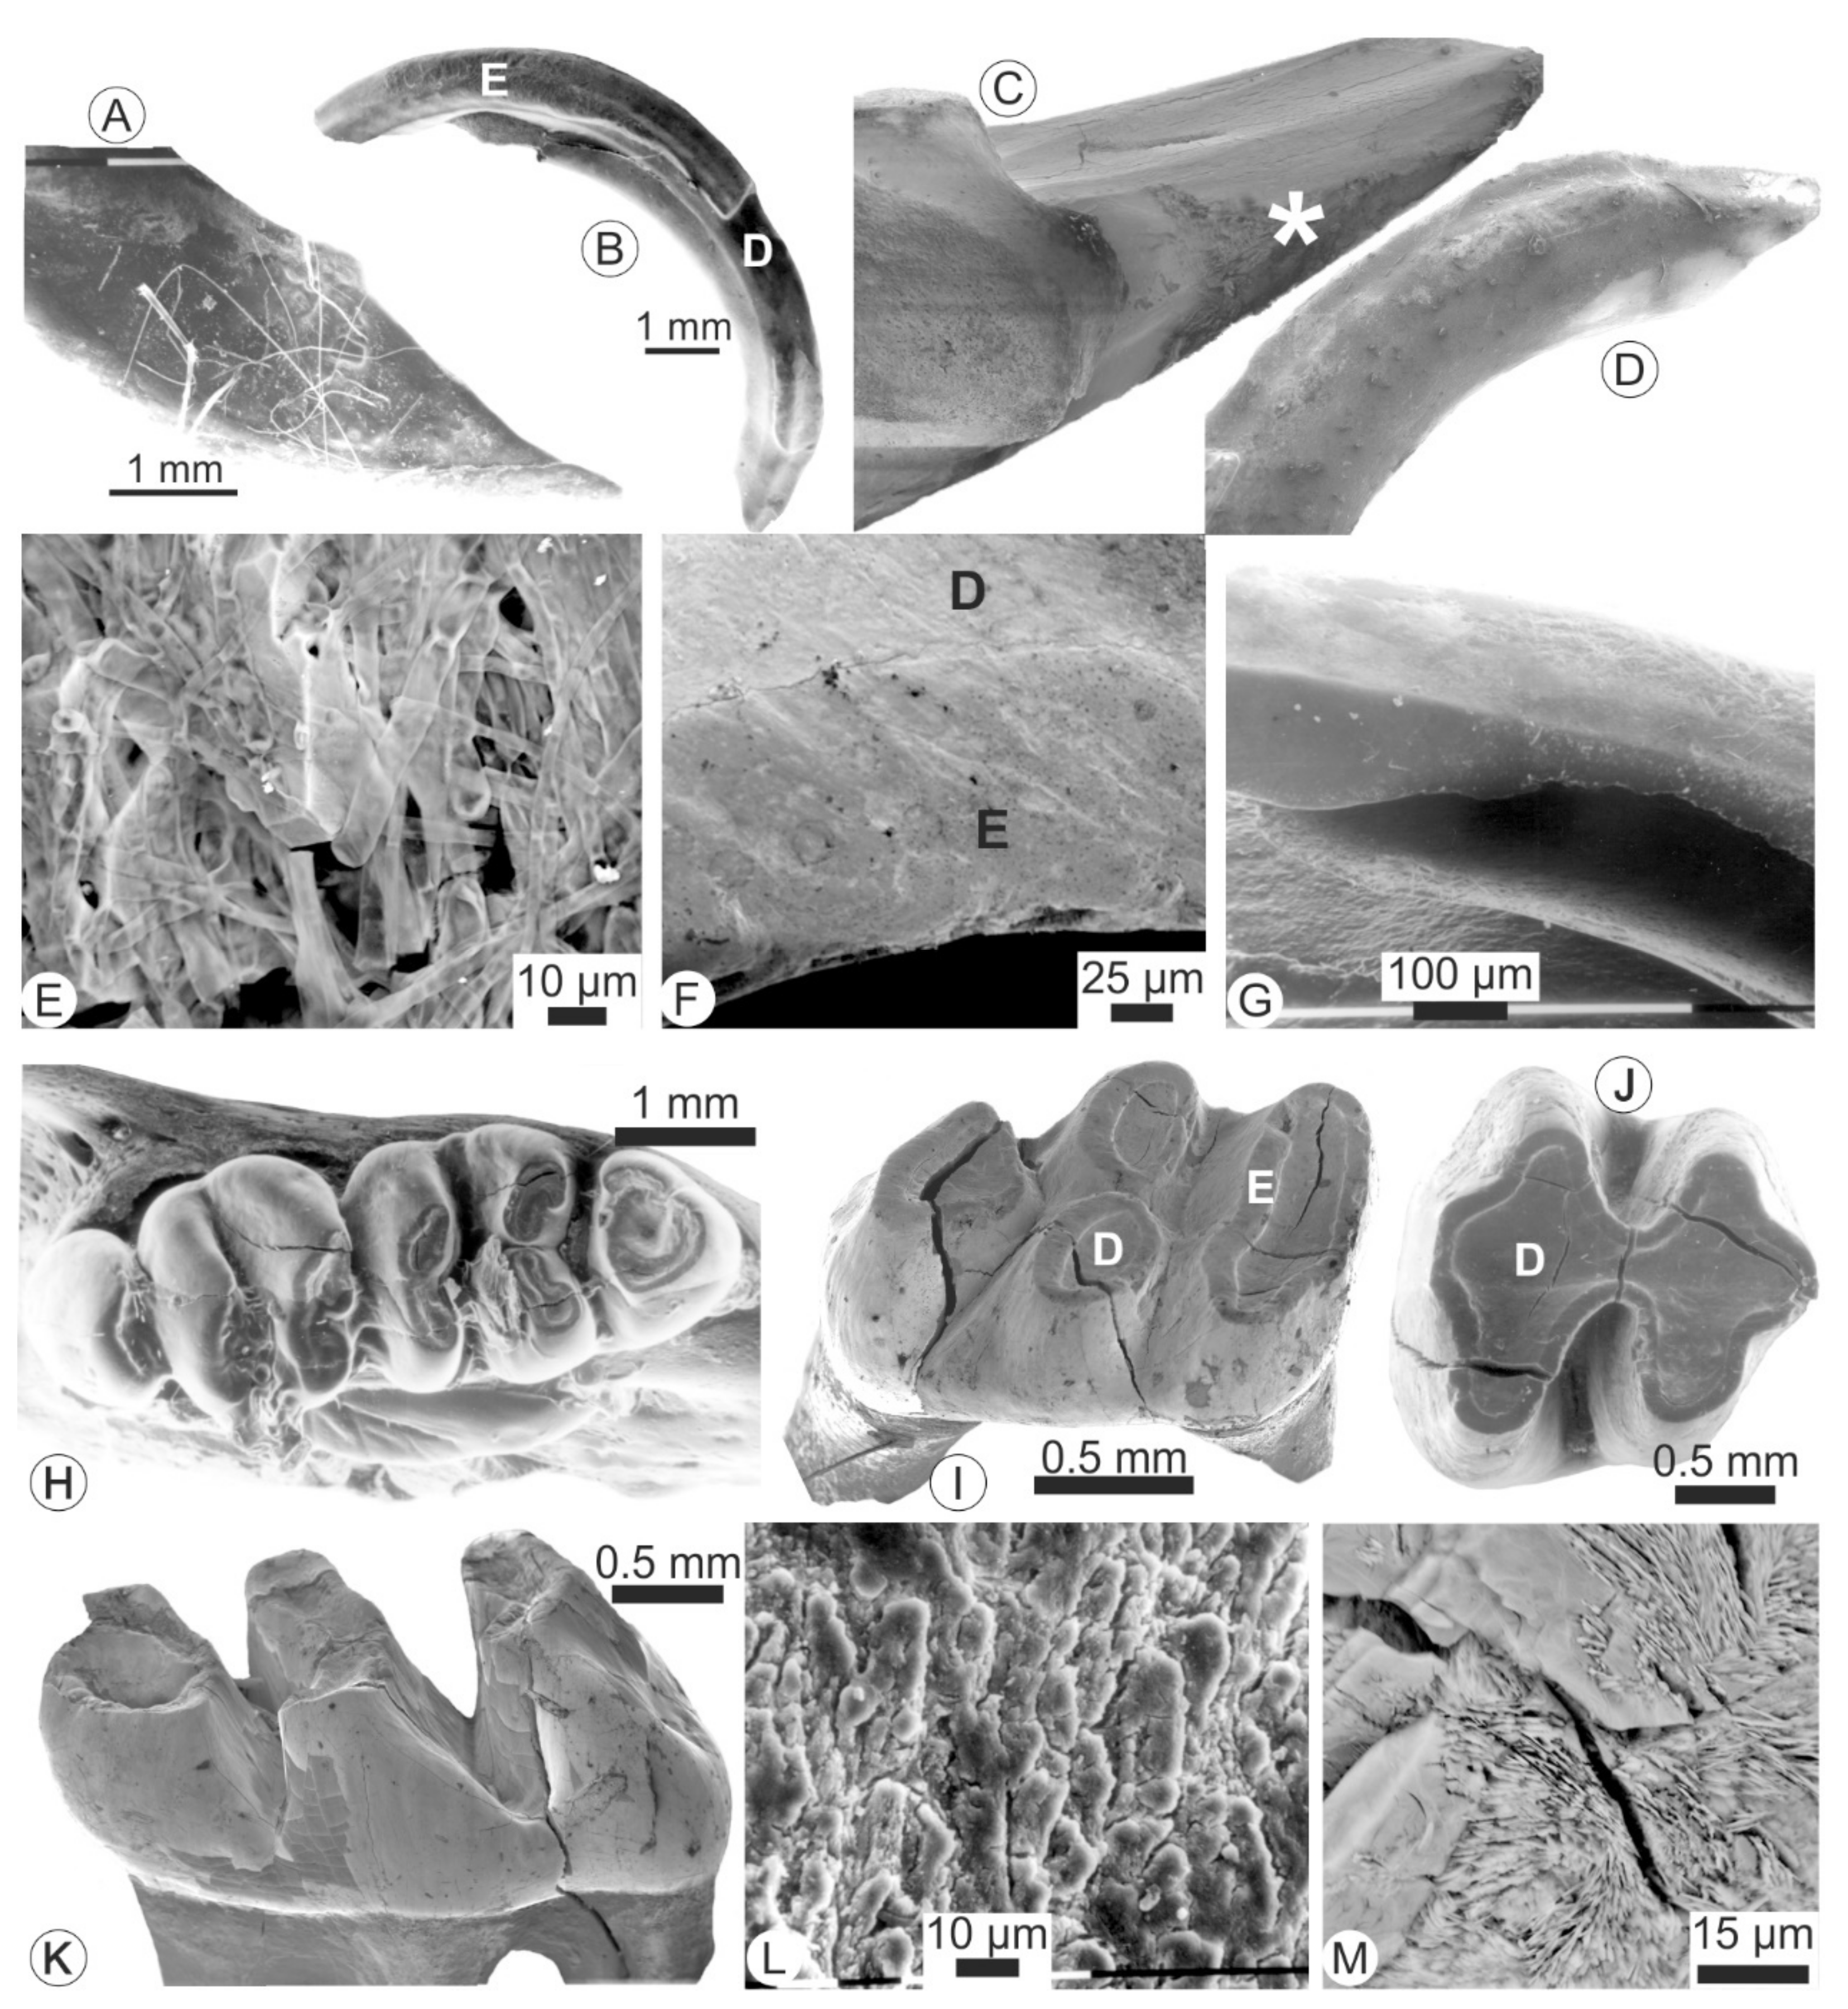
The digestion by a bird of prey is visible on the outer surfaces of the teeth (Figure 6). Tips of isolated incisors show signs of alteration (Figure 6A–D) and despite the ultrasonic cleaning, small organic fibers remain attached to the teeth (Figure 6A,E). At low magnifications, the surface of the tooth appears smooth and polished, so that the structure of the enamel is barely visible (Figure 6F,G). Locally, the dentine is destroyed and the tooth is hollow (Figure 6G), although numerous organic fragments are present inside the hole. In situ and isolated molars show cracks probably due to dehydration of the pellet prior to sampling (Figure 6H–K). The outer surface is smooth and polished and sometimes covered with allochthonous organic filaments or fragments. The lateral faces of the crown have secondary unidentified deposits (Figure 6L) but it may be suggested that bacteria play a role. Secondary crystals fill some cracks (Figure 6M).
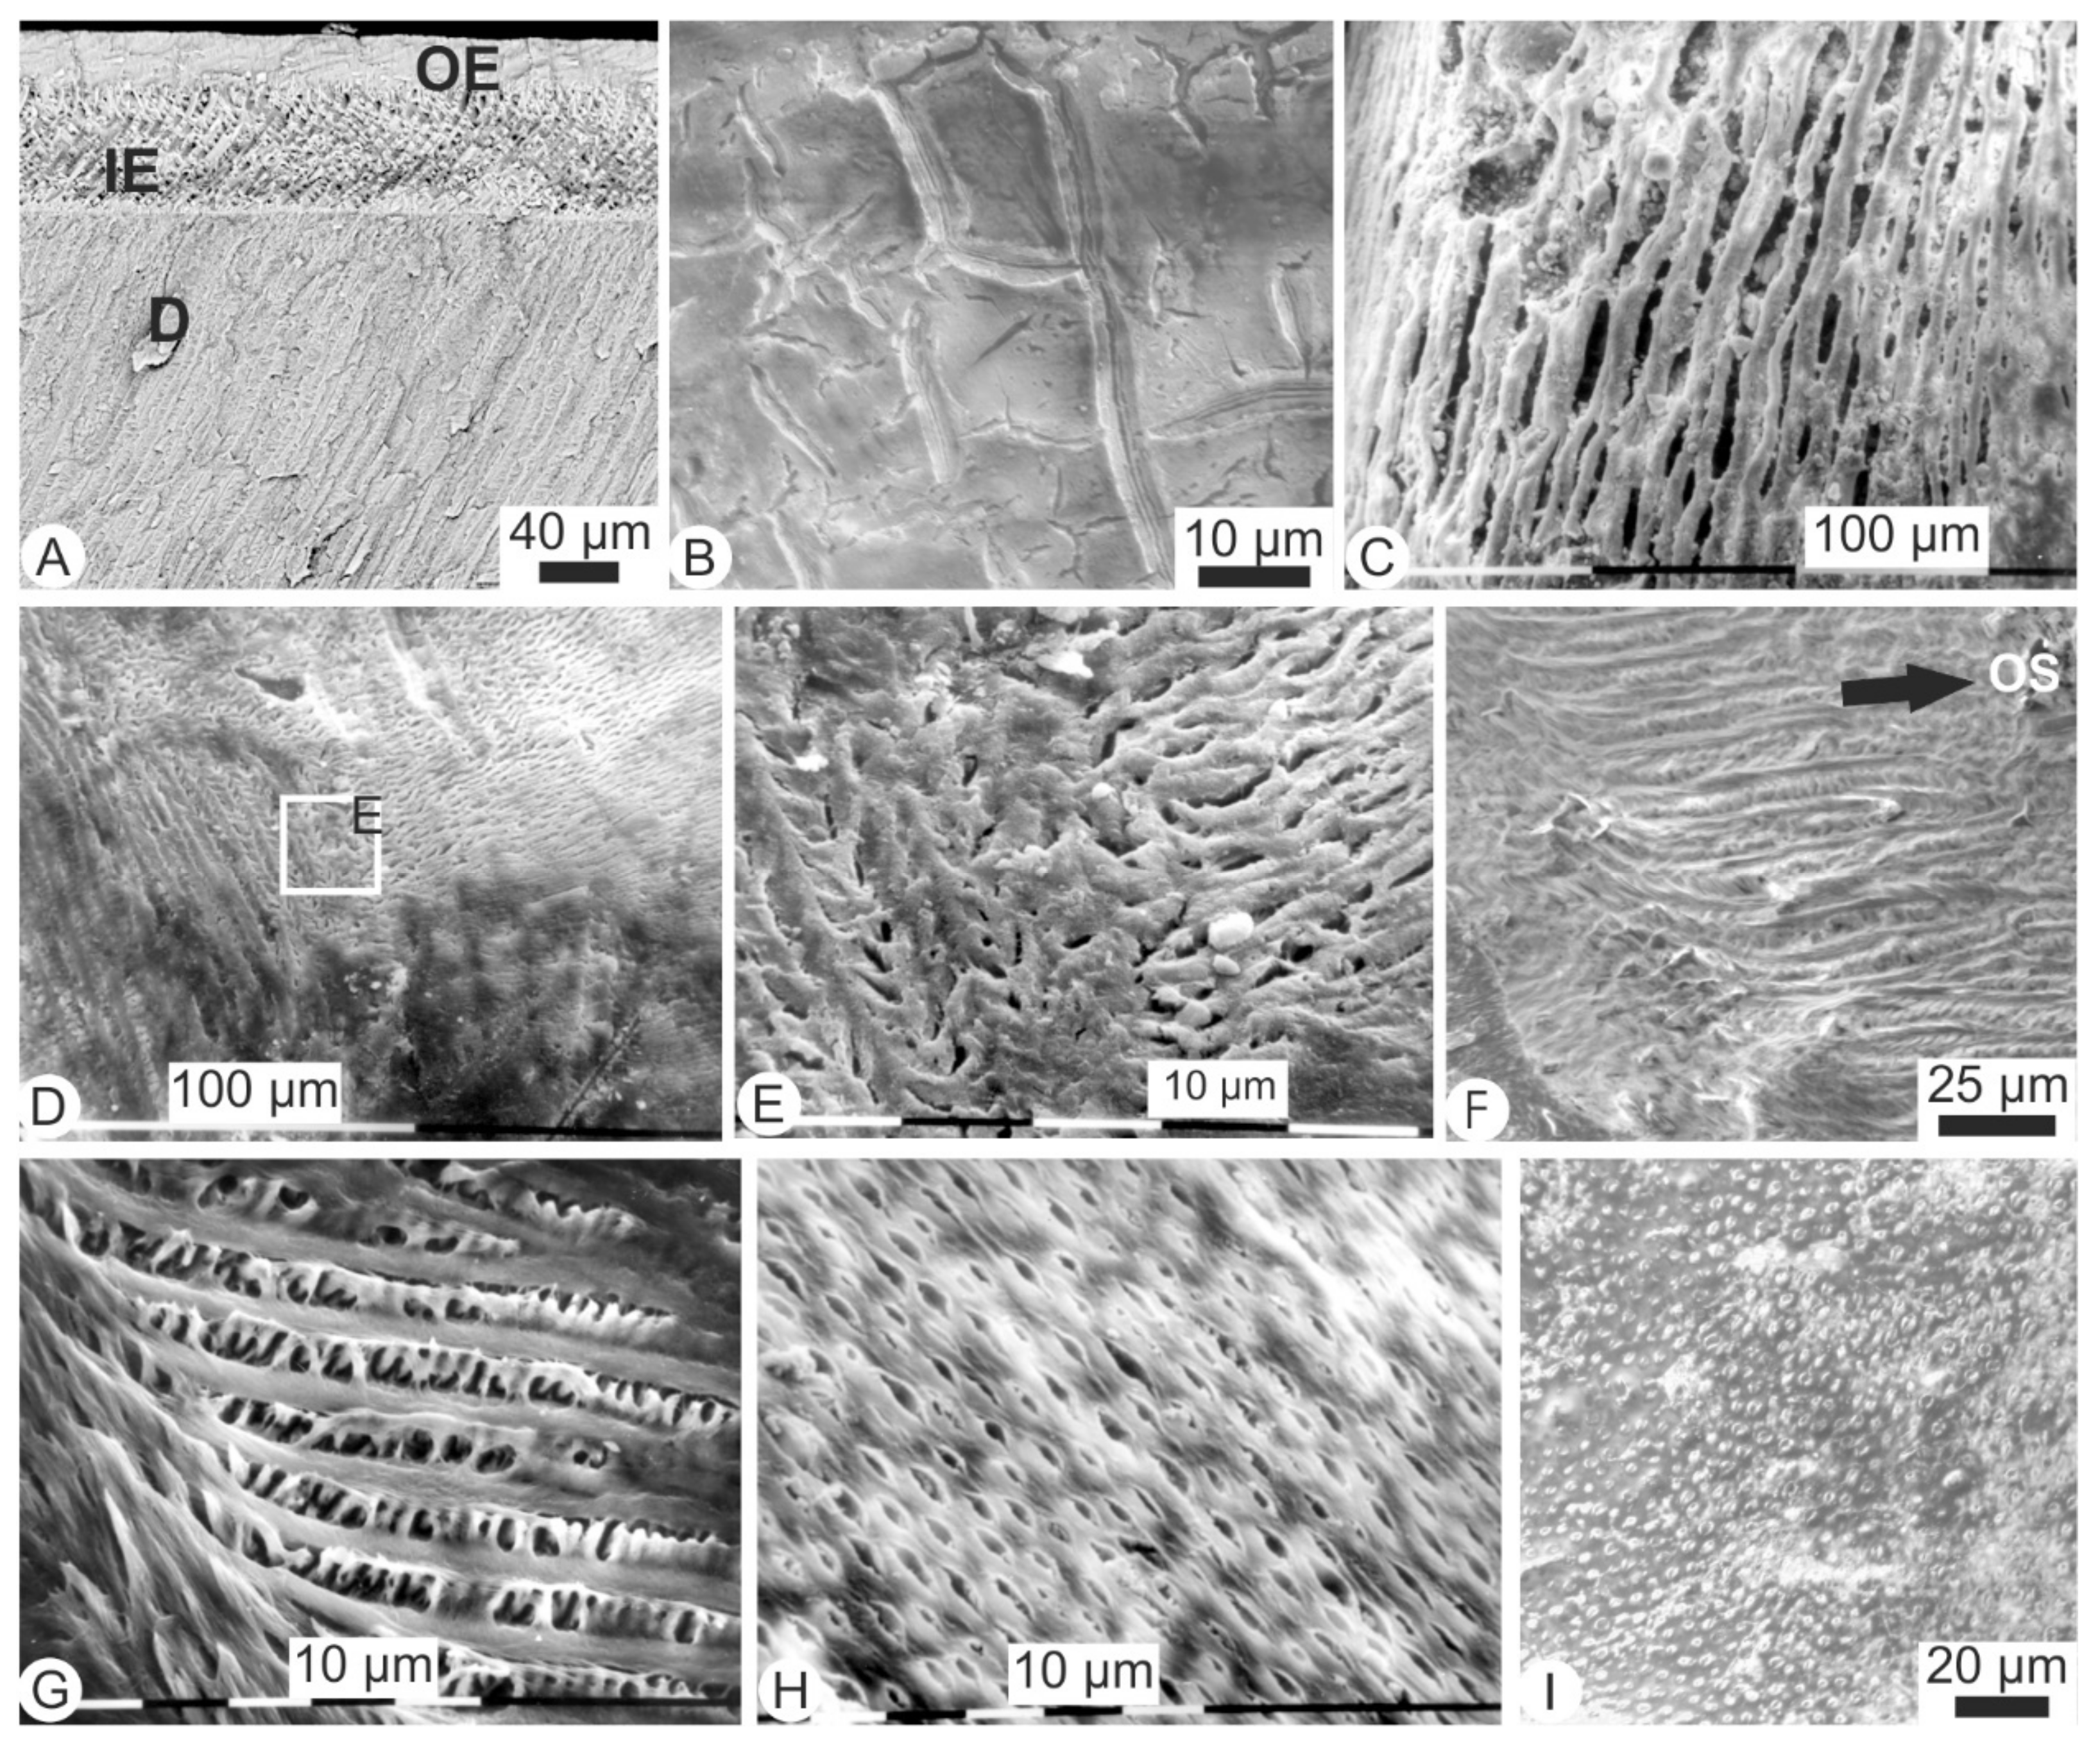
The variability of the preservation is also shown by the microstructures of the dentine and enamel. In broken teeth extracted from the pellets, images clearly identify the two layers of the enamel and the uniserial structure (Figure 7A). Nevertheless, the structure of the outer enamel sublayer is not well preserved and the orientation of the prisms is not apparent. The parallel tubules of the dentine are also visible. Polygonal figures and numerous small cracks with no preferential direction exist (Figure 7B). In some incisors, enamel is strongly digested (Figure 7C). The alteration is variable, as shown by the surface of a molar (Figure 7D,E). In polished sections, the prismatic pattern of the inner enamel layer is preserved (Figure 7F).
Sections also show that the alteration of the enamel not only occurs at the surface but in some in situ molars, the enamel is etched and appears partly dissolved (Figure 7G). Similarly, the state of preservation of the content of dentinal tubules varies (Figure 7H,I). Thus, SEM observations of isolated and in situ teeth show varying degrees of surficial and internal alterations of both the enamel and dentine, with both crowns and roots being altered.
3.5. Compositional Alterations of Digested Teeth
Average Raman spectra of digested teeth show that dentine and enamel are still in apatite (Figure 2B). Enamel spectra of incisors and molars are almost identical. Both teeth are poor in organic components. From the height of the δ(CH2) peak, dentine of incisors is rich in organic components. Dentine in molars is the poorest tissue in organic components and shows the highest ν2, ν4 and ν1 PO43− peaks (Figure 2B).
The crystallinity index of enamel in molars and incisors is higher than that of dentine (Figure 8A). The substitution of PO43− to CO32− B type shows that the CO32− content is lower in enamel than in dentine (Figure 8B). Depending upon the ratio, the mineral organic content of the enamel in molar is the highest (when calculated using the amide III band surface) (Figure 8C) and that of the enamel of incisor (using the δCH2 surface) (Figure 8D). On the other hand, for both ratios the mineral content of the dentine of molar is higher than that of the incisor.
Averages and standard deviations for both major and minor elements in the teeth from pellets are given in Table S1 and displayed graphically in Figure 9. Enamels have the highest Ca and P contents (Figure 9A). Dentines are still rich in Mg but depleted relative to the fresh tissues. Enamels are rich in Cl and Na (Figure 9C). The highest Ca/P ratio is that of the dentine of molar (Figure 9B). A molar extracted from the pellet samples was mapped for a range of elements using WDS to display the distribution of major and minor elements (Figure S3). A secondary electron image (Figure S3A) shows the structure of the molar, where enamel (E) and dentine (D) are clearly identified (“R” is the resin used to prepare the polished section of the molar sample). Both the Ca (Figure S3B) and P (Figure S3C) maps illustrate the differences between enamel and dentine in the molar (enamel having higher concentrations of both these elements). However, of the minor elements, it can be seen that Mg and S have higher concentrations in the dentine relatively to the enamel (Figure 9C and Figure S3D,F).
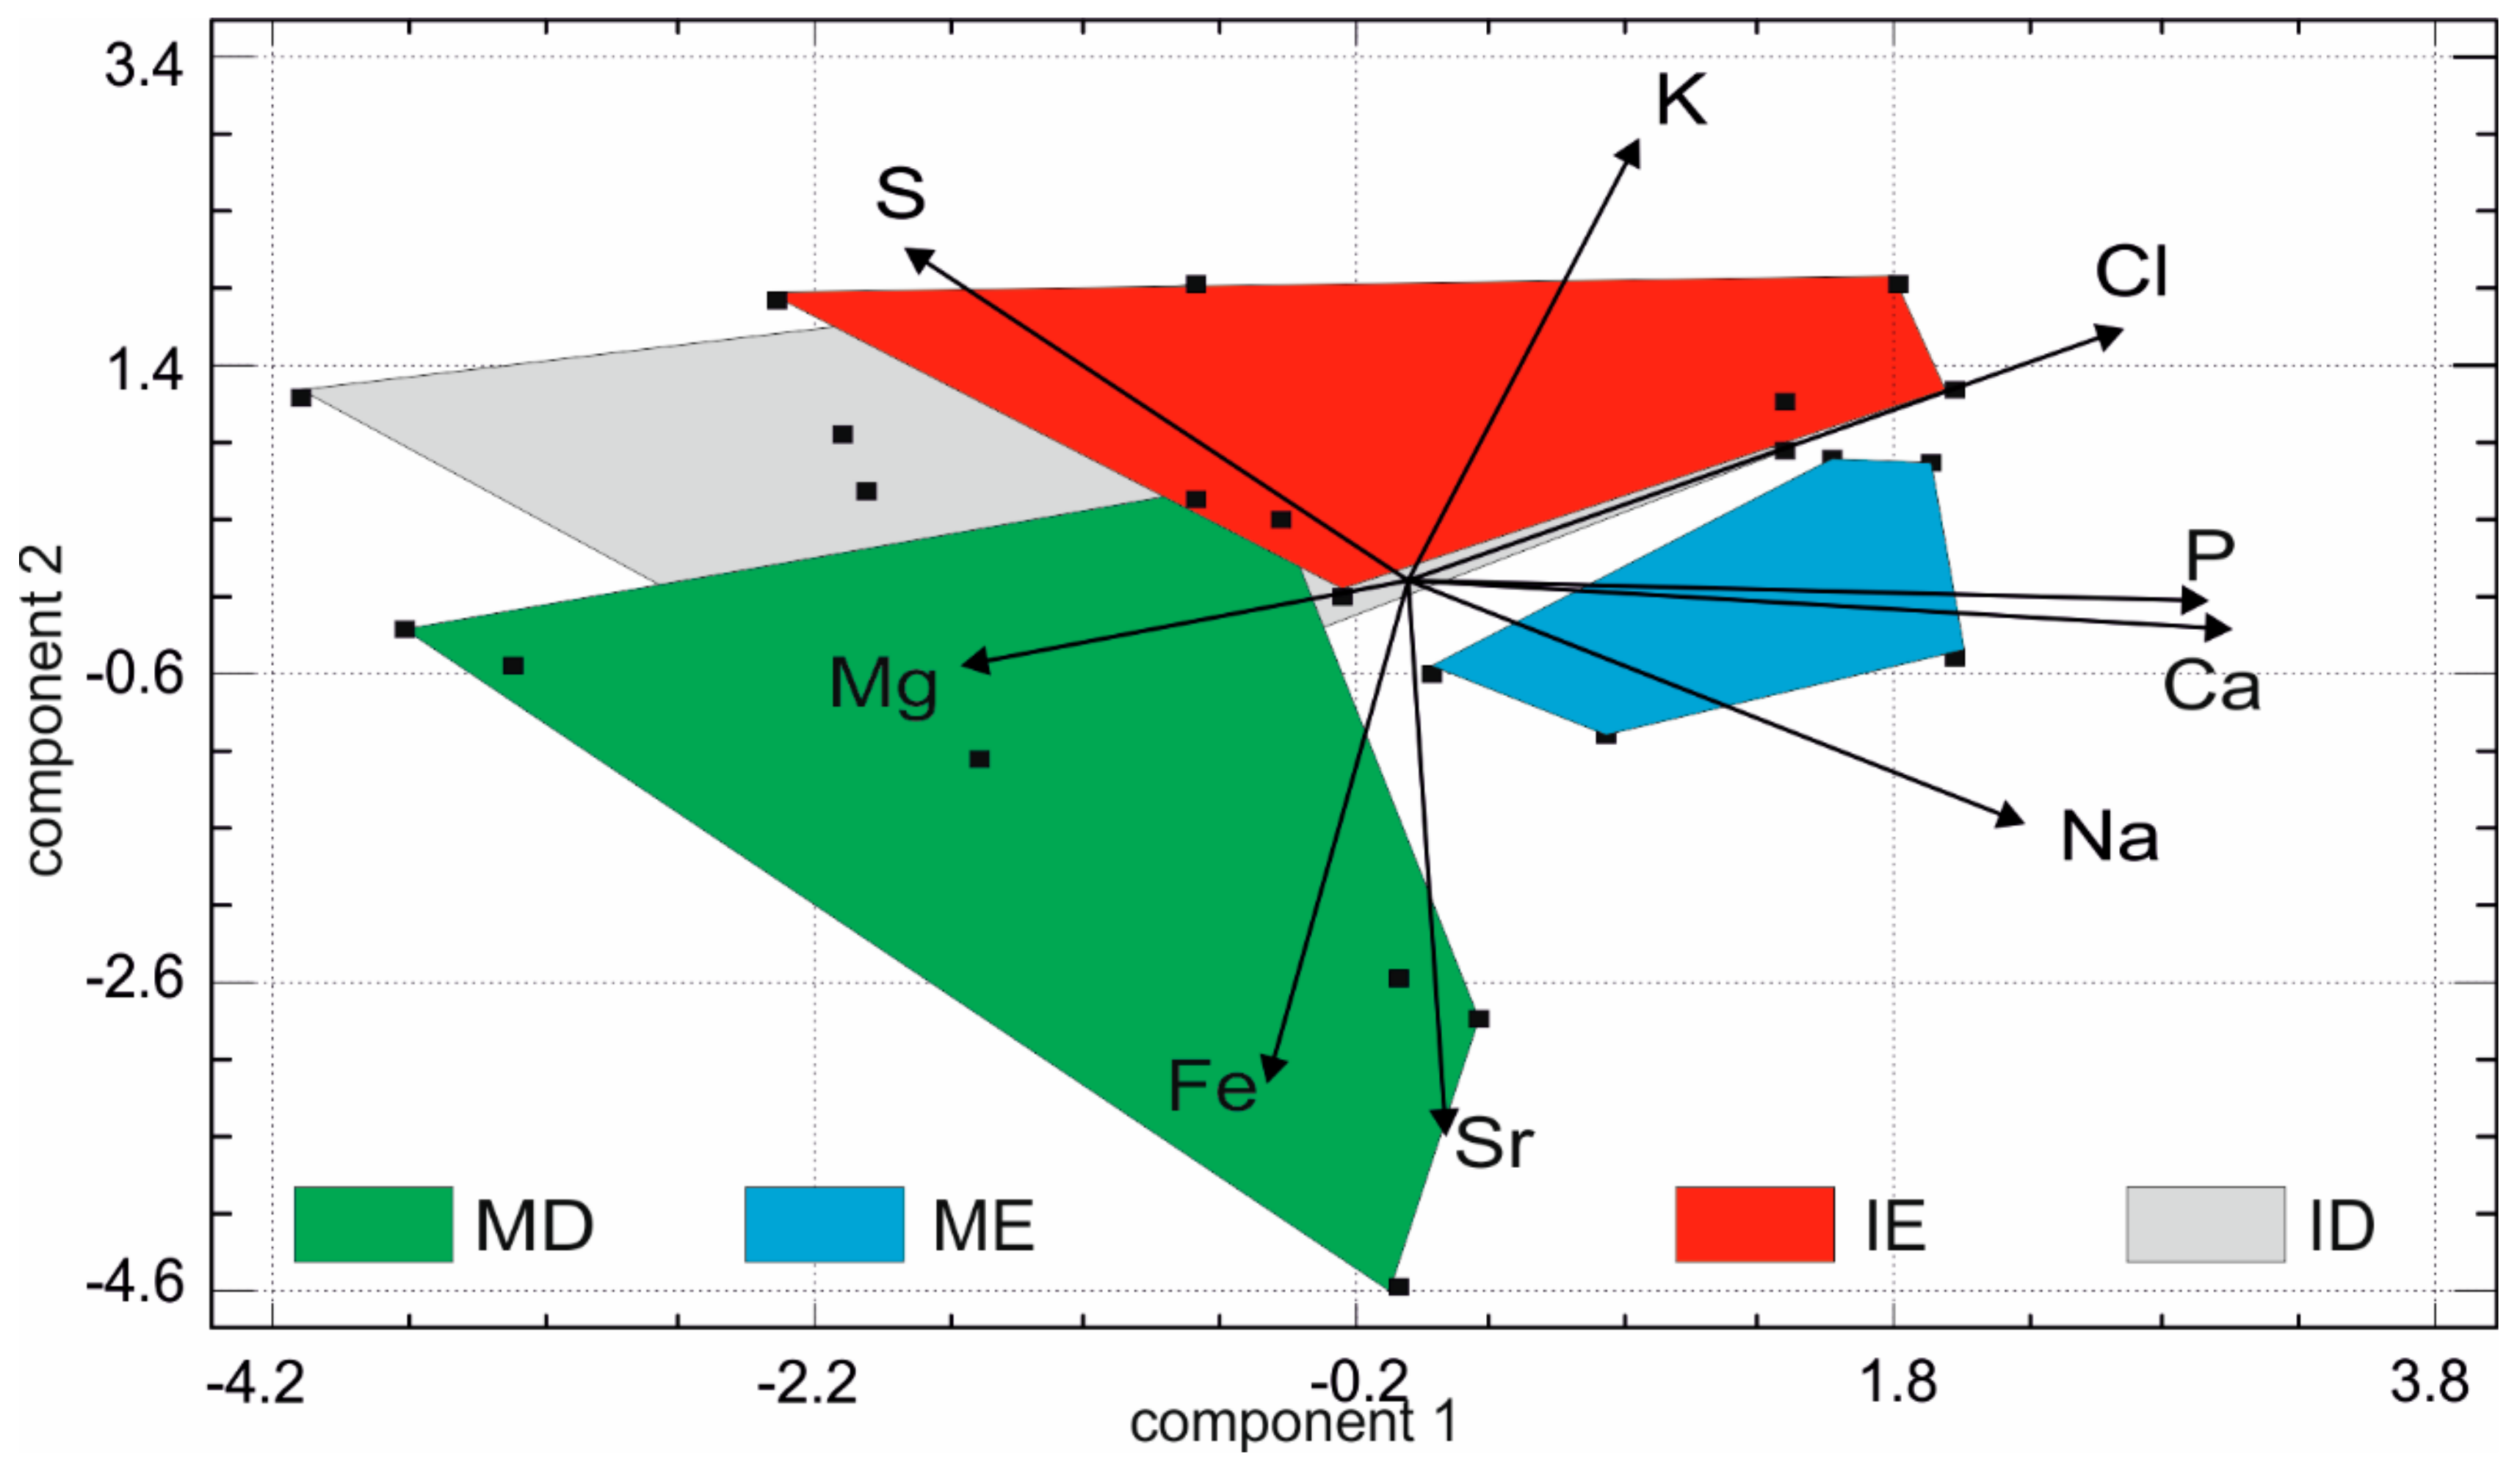
In the multivariate analyses (Figure 10), the first principal component contains 39.5% of the total variance, component 2 = 24.5% and component 3 = 11.3%. As with the fresh teeth, the first principal component comprises higher Ca, P and Na but instead of S, has higher Cl values. In the second principal component, the samples are sorted with Sr and Fe values, opposed to K values. The plot of the first two principal components shows that there is only a moderate discrimination between the tissue types with some degree of overlap and also the presence of larger domains suggesting some variability between samples.
4. Discussion
4.1. The Used Techniques
Several parameters have been used to estimate the degree of alterations of both enamel and dentine in digested teeth extracted from pellets: teeth surface modifications, mineralogy and elemental compositions.
Most studies on surface modifications have been done on archaeological bones observed through binocular microscopes at low magnifications. Several experiments cast doubts on our ability to correctly identify the origins of the marks on bone [43]. Despite similar tests have not yet been done on rodent teeth, misleading identifications between erosion versus digestion have been shown [6,8]. Thus, such necessary observations are not sufficient to identify predation. Surface alterations sometimes reveal the inner structure of enamel and dentine. Such observations clearly invalidate the current opinion that enamel does not undergo diagenetic modifications. Nevertheless, bone and dentine are more affected by diagenesis [44]. It must be noted that when brachyodont teeth are still in situ, dentine is protected by the enamel layer.
A second parameter could be the color of the bones or teeth. Up to now, such studies are scarce [45] so that there is no color alteration index similar to what is used in conodonts [46], despite color measurement is a non-destructive and fast technique.
Few studies are dedicated to Raman spectroscopy of rodent teeth. Both dentine and enamel are apatite but the composition of these tissues differs. It is well known that dentine is rich in organic component, similar to that of bone, whereas this content is very low in enamel. Using several criteria such as color, density and texture, Conard et al. [47] have established 5 mineralization categories in fossil bones, from not mineralized (category MC1) to highly mineralized (category MC5). Unfortunately, they do not find an agreement between categories and elemental chemical analyses [27].
From FTIR and Raman spectra, numerous ratios have been used to compare enamel and dentine in modern and fossil teeth [48,49,50,51,52,53,54,55]. For example, the crystallinity index depends upon the methods and results are more or less consistent [56]. This index also depends upon the CO32− content. Moreover, the abundance of small crystals is induced by CO32− type B substitution [57]. Some parameters are still poorly known: the presence of amorphous phases has been shown in rodent enamel [58]. Nevertheless, only one species has been studied. Similar problems exist for dentine. A correlation between the size of the crystallites and the incorporation of OH into the apatite crystal lattice has been detected using Raman spectroscopy [59]: OH band is weak in dentine and strong in enamel. The presence of peritubular dentine within a tooth is variable and most taxa are not described. As for other techniques, a possible bias is induced by the selected criteria to define categories. It is clearly shown by the ratios obtained from the Raman spectra (Figure S4): no trend in the compositional modifications is visible in the studied samples.
4.2. Comparisons between Fresh and Pellet Teeth
The surface microstructures and the chemical compositions of the pellet teeth show significant differences from fresh teeth. Enamel, the outer layer of the tooth, is strongly mineralized and compact. However, it displays varying degrees of alteration in both incisors and molars during the digestion processes. In dentine, the degree and extent of alteration are greater due to the presence of tubules and a higher organic matrix content. Andrews [3] observed that in a given category, the incisors are more altered than the molars. In the modern Olduvai pellets, although the molars have some cracks, the incisor enamel is sometimes digested.
The comparison of the crystallinity index of fresh and digested does not show a regular trend, neither for the tissue (enamel, dentine) nor for the tooth (molar, incisor) (Figure S3A). On the opposite, the substitution ratio PO4–CO3 type B of all digested teeth is higher than that of the non-digested teeth (Figure S3B). Depending upon the selected bands, the mineral/organic ratios differ (Figure S3C,D), showing the complexity of the modifications due to the digestion by the bird of prey.
Concentrations in enamel of human teeth are 200–300 ppm for Mg, 7000–7700 ppm for Na and 300 for K [60,61]. In dentine, they are about 7400 ppm for Mg, 7600 ppm for Na and 240 for K [61]. In the fresh rodent enamel, the values are not very different. In both taxa, S content is higher in dentine. The main difference is that of the Mg content in the ever-growing incisors of rodents.
All of the pellet tissues are enriched in Sr but the highest concentration is in the molar dentine (Table S1). The Ca/P ratios are also increased in pellets (Table S1). Of note is that all the pellet tissues are also enriched in S, except for the molar dentine. Thus, it can be said that teeth (incisor or molar) of either tissue (enamel or dentine) are affected by the digestion processes. Mann-Whitney and Kolmogorov-Smirnov tests show that the modifications depend upon the tissue and the chemical elements (Table S2). S content is the most modified, in both incisor dentine and molar enamel. It must be noted that the dentine of incisor is not surrounded by the enamel, so that the exposed surface is large, especially when the tooth is out of its alveolus. On the other hand, the enamel of molars is the outer layer, directly affected by the digestive fluids. The Ca–P correlation in every fresh tissue is 0.98 or 0.99, higher than 0.95 for pellets samples, except for the enamel of molar in which it is only 0.46. It is well-known that the enamel structures are diverse in rodent teeth. The number of prisms and their spatial arrangements have been described and classified previously [35,61]. However, the effect of the acidic and proteolytic etchings of the digestion processes on the diffe2ent orientations and 3D relationships of the prisms are still unknown.
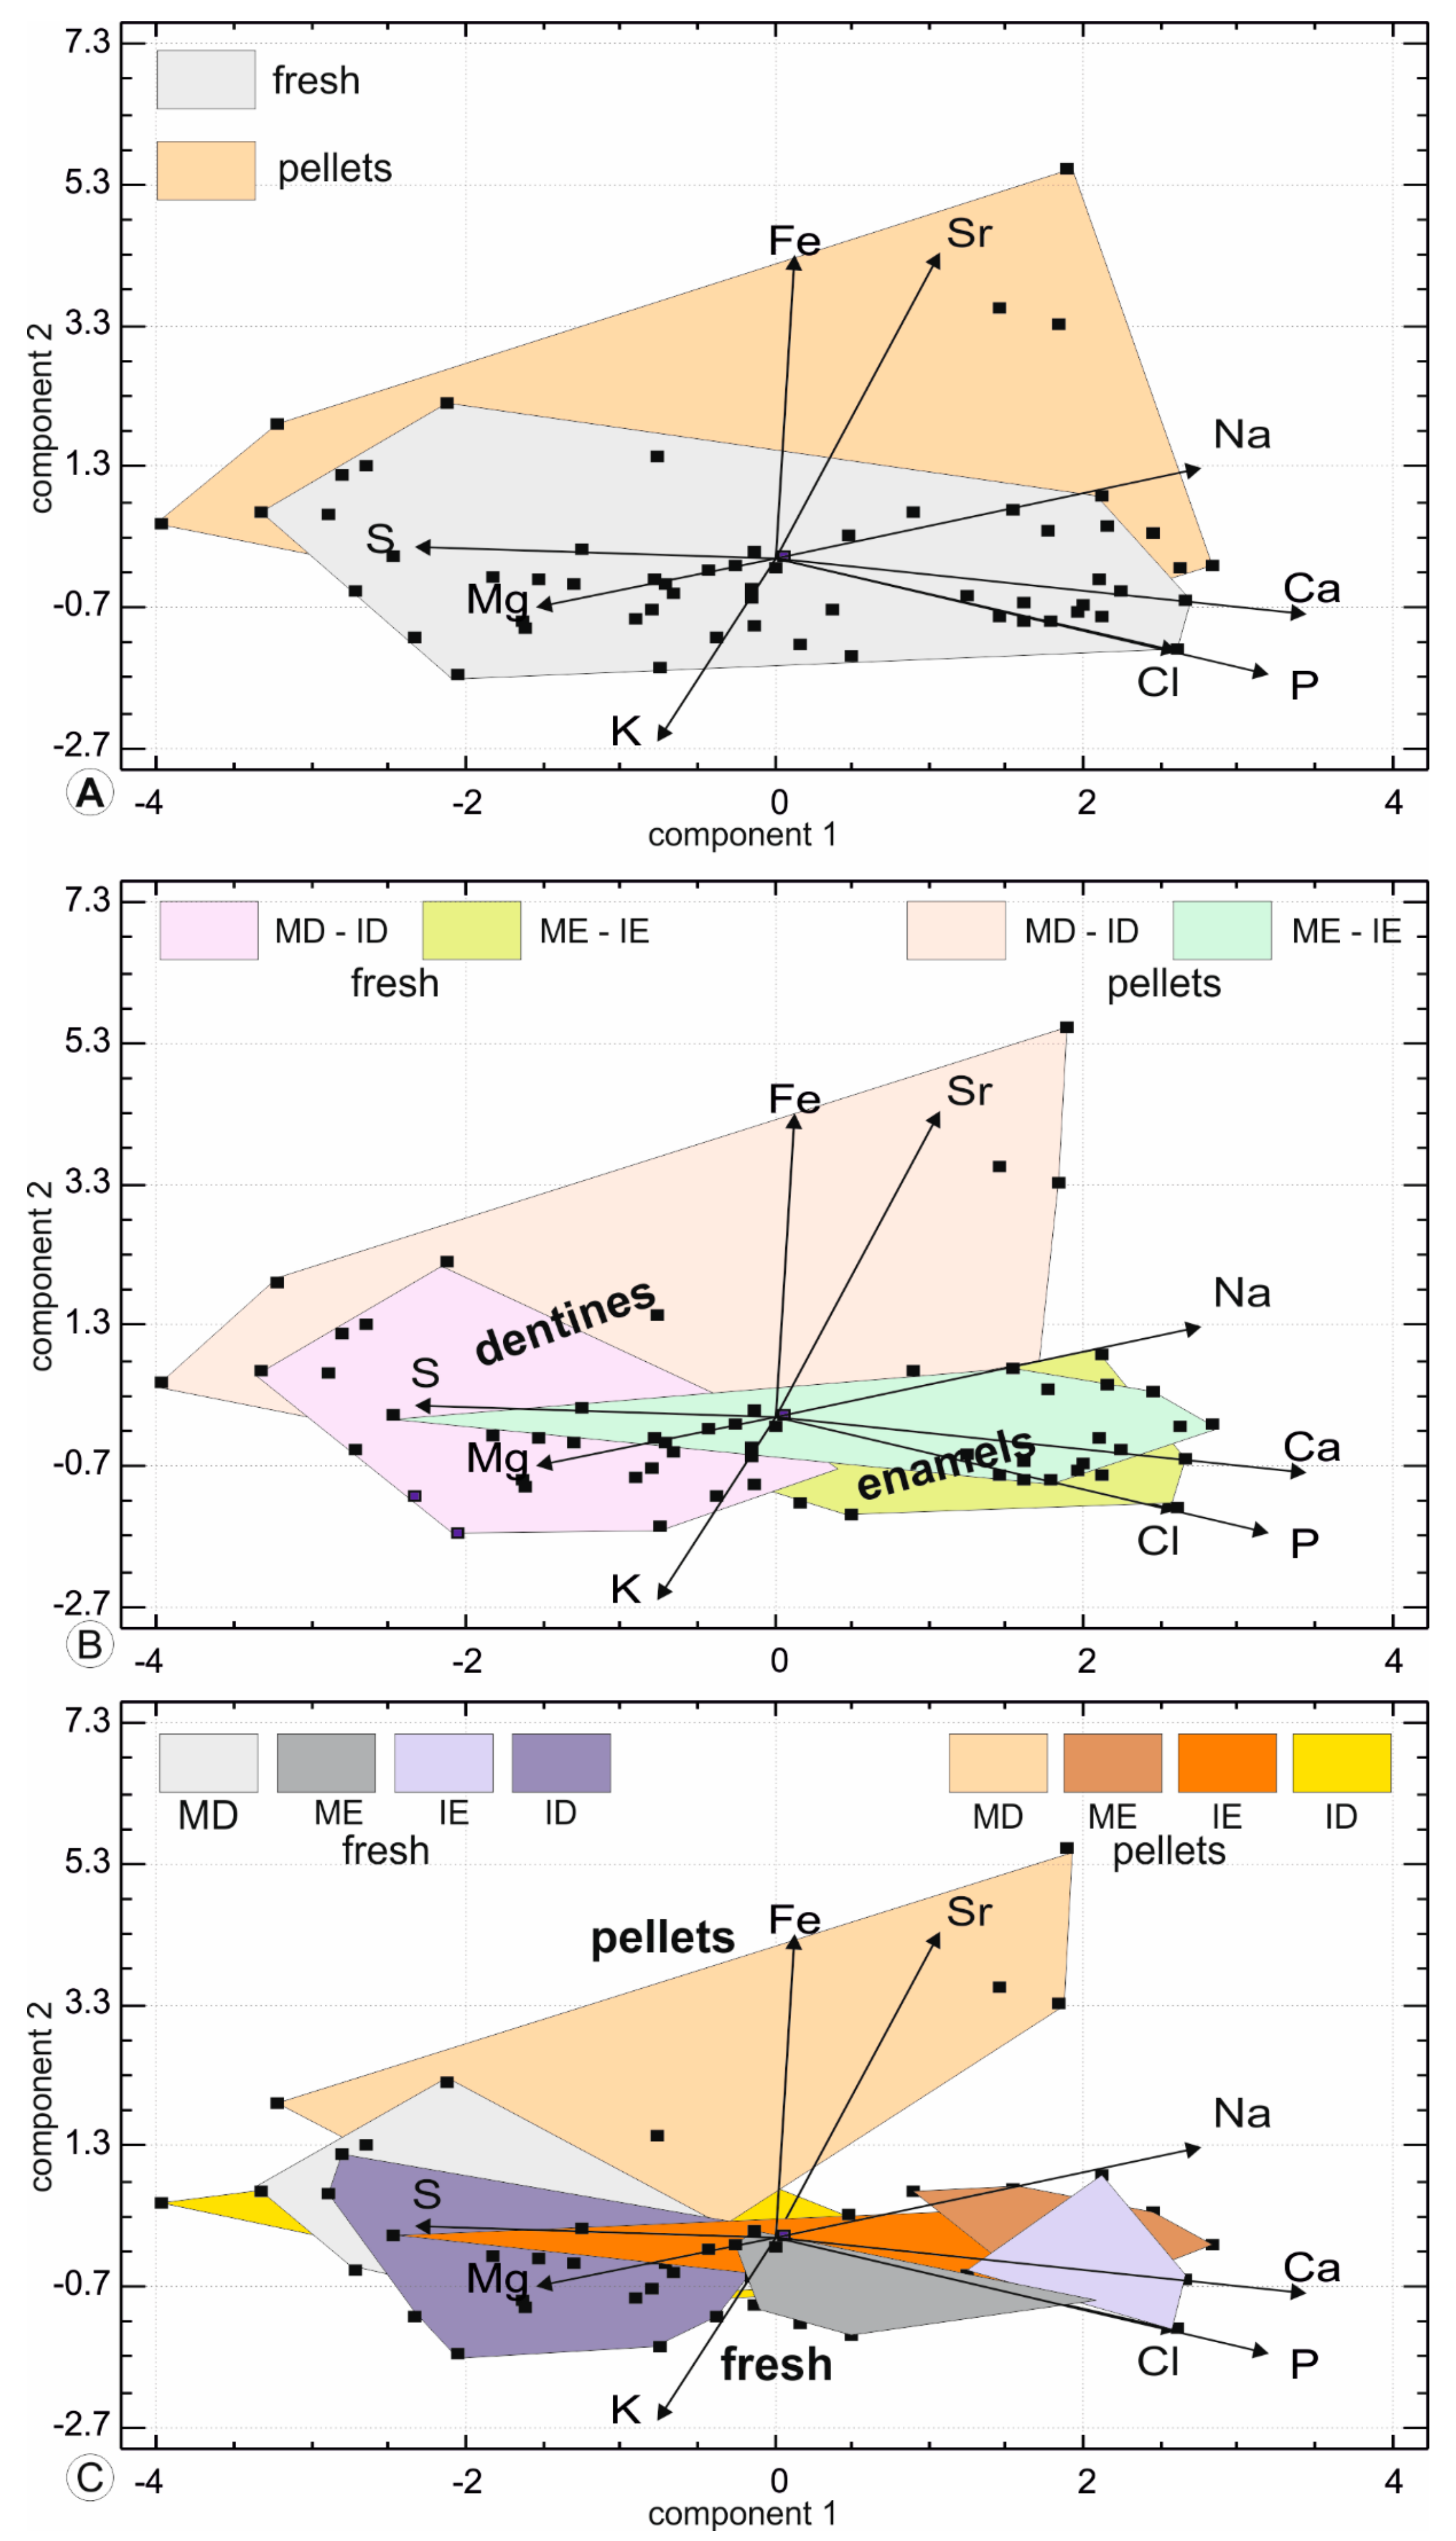
Another approach to compare the chemical compositions of fresh and digested teeth is based on the principal component analysis, which illustrates the differences between the fresh and digested teeth (Figure 11). In such analyses, the size of the domain corresponding to a tissue or site, is indicative of the variability of the teeth. Moreover, the role of the variable (here the chemical composition) is well illustrated. The first principal component contains 37.8% of the total variance, component 2 represents 17.9% and component 3: 14.5%. It comprises higher Ca, P and Na values. In the second principal component, the samples are sorted with higher Sr, Fe values opposed to K values. A large overlap between fresh and digested teeth is visible and the pellets are more variable, as shown by the size of the surface (Figure 11). When the tissues are identified as dentine and enamel but are not separated between molars and incisors, the large size of the domains of dentine is displayed, along with the high content in Mg and S (Figure 11B).
The length of weather exposure for regurgitation pellets is not known; so it can be suggested that the enrichment is due to dripping and/or drinking waters on the alkaline lava, rich in Sr and Na. Water and heat favor bacteria, able to accumulate Fe. Enamel is a hard and compact tissue, poor in organic matrix. Thus, fresh and digested tissues are similar, except for one sample with a high S content (6000 ppm) (Figure 11B). When the samples are identified by the origin (fresh, digested), the tissue (enamel, dentine) and the tooth (incisor, molar), the S rich enamel is that of an incisor (Figure 11C). SEM images have shown that in incisors, the enamel is sometimes dissolved, and the cavity filled with secondary deposits, some of them organic (Figure 1I,J).
4.3. Comparisons between Fresh and Digested Bones from the Same Site
Surfaces of the teeth extracted from the modern pellets of Olduvai are modified, showing secondary deposits, dissolution and organic filaments but these alterations are weak. These results are in accordance with those obtained from the taphonomic criteria and chemical composition of the bones from the same set of regurgitation pellets. A comparison of the taphonomic analyses of the surfaces of bones extracted from pellets of Bubo africanus and B. lacteus and those from Olduvai, suggests that Bubo lacteus was the main predator at Olduvai [62]. Chemical alterations due to the digestion of these two birds of prey are not known, so that a comparison has not been done.
Previous studies of fresh and fossil bones from Olduvai have shown that the alterations of the surface (weathering, trampling, digestion...) depend upon the pre-burial history, whereas chemical modifications are more dependent upon the post-burial step of the fossilization processes [63,64].
The organic/mineral ratio is variable but the amino acid composition is similar to that of modern fresh rodents. The chemical composition is also altered, even when analyses are done in sections, that is, inside the teeth. Dentine has lost a large part of Mg, especially in incisors but is enriched in Sr. Enamel is also depleted in Mg. All pellets are enriched in S.
5. Conclusions
The first degree of results of this study shows that the digestion by a bird of prey alters the external aspect, the microstructure and the composition of rodent teeth. From published data, such results are expected.
The second degree is to compare the results obtained using different techniques. Chemical composition of bones and teeth are used in paleoenvironmental reconstructions. However, Rink et al. [65] have shown that the macroscopic aspect of samples is not a reliable criterion for the choice of suitable samples for geochemical analyses. The used criteria are a source of bias, as shown for example in Figure S3: mineral/organic ratios calculated from Raman spectra differ. Both ratios are correct but the organic matrix bands used in the ratios correspond to different structure and composition. The results of the digestion on lipids, proteins or sugars of the organic matrix differ, so the apparently inconsistent ratios used to estimate the mineral/organic components preservation. To assign the skeletal remains to a strong or weak digestion is difficult when several criteria are used, even when a single technique is used.
Few taphonomic studies combine a variety of statistical and other factors including fragmentation percentage, number of specimens, molar/incisor ratios and so forth. Nevertheless, they show that in any one site, these criteria depend on the size, the shape… of the skeletal parts of the prey and on the age, size… of the predator (Table S3). For example, in a given sample of rodent jaw found in a regurgitation pellet, some teeth are still inserted in the bone, whereas others are isolated. Effects of the digestion are different: for isolated teeth, the dentine is no more protected by the enamel and the digestive juices can penetrate the tubules of the dentine. Similarly, large bones are probably less broken than small bones.
Third point: data on the microstructures and composition of the skeletal remains found in regurgitation pellets are still scarce, so that the influence of the predation and digestion stages on the post-predation phase, is not well-known. Thus, a classification scheme, similar to that of Andrews [3] based on the surface aspect, is not yet possible. The interplay between the factors involved in the alteration of skeletal remains are not known.
The individual effects of each biological or non-biological factor are not yet deciphered and the results of the combination of all these parameters are not yet predictable. It is clear that concentrating on a single parameter to assign a category of digestion (weak, strong…) is not sufficient to understand alteration processes. So, reconstructions of environments from micromammals found in regurgitation pellets or carnivores feces are more or less biased. It is worth noting that for fossil sites, geological history increases the modifications.
This study, involving multivariate analyses based on microstructural and chemical composition has provided useful information that can be used to identify some taphonomic features. This approach lends itself to other recent and fossil sites, although any interpretations from modern and fossil sites must include as many variables as possible in the multivariate dataset to reduce “fake news” in paleoenvironmental reconstructions.
Supplementary Materials
The following are available online at https://www.mdpi.com/2075-163X/10/1/63/s1, Figure S1: Location of Olduvai, Figure S2: Incisor structure, Figure S3: Chemical distribution maps, Figure S4: Evaluation of the preservation from Raman data, Table S1: Chemical analyses of teeth, Table S2: Statistical tests, Table S3: Some taphonomic factors.
Funding
This research received no external funding.
Acknowledgments
The author wishes to thank J.-J. Jaeger (Université de Poitiers) and C. Denys (Museum national d’Histoire naturelle, Paris), who kindly provided samples of fresh teeth and pellets; C.T. Williams for granting access to laboratory analytical equipment at Natural History Museum (London); A. Denis (Université Paris Sud) for his help to prepare and to analyse samples; O. Belhadj and V. Rouchon (Museum National d’Histoire naturelle, Paris) for granting access at the Raman spectrometer.
Conflicts of Interest
The authors declare no conflict of interest.
References
- Mayhew, D.F. Avian predators as accumulators of fossil mammal material. Boreas 1977, 6, 25–31. [Google Scholar] [CrossRef]
- Shipman, P. Applications of scanning electron microscopy to taphonomic problems. Ann. N. Y. Acad. Sci. 1981, 376, 357–385. [Google Scholar] [CrossRef] [PubMed]
- Andrews, P. Owls, Caves and Fossils; Natural History Museum Publications: London, UK, 1990. [Google Scholar]
- Fernandez-Jalvo, Y.; Andrews, P. Small mammal taphonomy of Gran Dolina, Atapuerca (Burgos), Spain. J. Archaeol. Sci. 1992, 19, 407–428. [Google Scholar] [CrossRef]
- Matthews, T. Taphonomic characteristics of micromammals predated by small mammalian carnivores in South Africa: Application to fossil accumulations. J. Taphon. 2006, 4, 143–161. [Google Scholar]
- Bochensky, Z.M.; Tomek, T. Preservation of bird bones: Erosion versus digestion by owls. Int. J. Osteoarchaeol. 1997, 7, 372–387. [Google Scholar] [CrossRef]
- Bochensky, Z.M.; Korodin, V.A.; Nekrasov, A.E.; Tomek, T. Fragmentation of bird bones in food remains of imperial eagles (Aquila heliaca). Int. J. Osteoarchaeol. 1997, 7, 165–171. [Google Scholar] [CrossRef]
- Fernandez-Jalvo, Y.; Andrews, P.; Sevilla, P.; Requejo, V. Digestion versus abrasion features in rodent bones. Lethaia 2017, 47, 323–336. [Google Scholar] [CrossRef]
- Fernandez-Jalvo, Y.; Andrews, P. Atlas of Taphonomic Identifications; Springer: Dordrecht, The Netherlands; Heidelberg, Germany; New York, NY, USA; London, UK, 2016. [Google Scholar]
- Dauphin, Y.; Denis, A.; Denys, C. Les mécanismes de formation des gisements de microvertébrés: Modifications de la composition chimique des os et dents de rongeurs issus de pelotes de régurgitation de rapaces. C. R. Acad. Sci. Paris 1988, 307, 603–608. [Google Scholar]
- Dauphin, Y.; Denys, C.; Denis, A. Les mécanismes de formation des gisements de microvertébrés. 2. Composition chimique élémentaire des os et dents de rongeurs provenant de pelotes de régurgitation. Bull. Mus. Natl. Hist. Nat. Paris 1989, 11, 253–269. [Google Scholar]
- Dauphin, Y.; Denys, C.; Kowalski, K. Analysis of accumulations of rodent remains: Role of the chemical composition of skeletal elements. N. Jahrb. Geol. Paläontol. Abh. 1997, 203, 295–315. [Google Scholar] [CrossRef]
- Dauphin, Y.; Castillo-Michel, H.; Farre, B.; Mataame, A.; Rbii, K.; Rihane, A.; Stoetzel, E.; Denys, C. Identifying predation on rodent teeth through structure and composition: A case from Morocco. Micron 2015, 75, 34–44. [Google Scholar] [CrossRef] [PubMed]
- Toots, H.; Voorhies, M.R. Strontium in fossil bones and the reconstruction of food chains. Science 1965, 149, 545–855. [Google Scholar] [CrossRef] [PubMed]
- Wyckoff, R.W.G.; Doberenz, A.R. The strontium content of fossil teeth and bones. Geochim. Cosmochim. Acta 1968, 32, 109–115. [Google Scholar] [CrossRef]
- Henderson, P.; Marlow, C.A.; Molleson, T.I.; Williams, C.T. Patterns of chemical change during bone fossilization. Nature 1983, 306, 358–360. [Google Scholar] [CrossRef]
- Williams, C.T. Trace elements in fossil bone. Appl. Geochem. 1989, 4, 247–248. [Google Scholar] [CrossRef]
- Williams, C.T.; Marlow, C.A. Uranium and thorium distribution in fossil bones from Olduvai Gorge, Tanzania and Kanam, Kenya. J. Archaeol. Sci. 1987, 14, 297–309. [Google Scholar] [CrossRef]
- Williams, C.T.; Potts, P.J. Element distribution maps in fossil bones. Archaeometry 1988, 30, 237–247. [Google Scholar] [CrossRef]
- Dauphin, Y.; Denys, C. Diagenèse différentielle chez les rongeurs fossiles—Validité des paramètres géochimiques pour les reconstitutions des régimes alimentaires. Palaeogeogr. Palaeoclimatol. Palaeoecol. 1992, 99, 213–223. [Google Scholar] [CrossRef]
- Kendall, C.; Høier Eriksen, A.M.; Kontopoulos, I.; Collins, M.J.; Turner-Walker, G. Diagenesis of archaeological bone and tooth. Palaeogeogr. Palaeoclimatol. Palaeoecol. 2018, 491, 21–37. [Google Scholar] [CrossRef] [Green Version]
- Garcia-Alix, A.; Minwer-Barakat, R.; Martin Suarez, E.; Matthijs Freudenthal, M.; Delgado Huertas, A. Cinnabar mineralization in fossil small mammal remains as a consequence of diagenetic processes. Lethaia 2013, 46, 1–6. [Google Scholar] [CrossRef]
- Dauphin, Y.; Massard, P. Diagenèse des os de rongeurs fossiles d’El Harhoura 2 (Maroc): Microstructure versus composition globale. Trav. Inst. Sci. Sér. Gén. 2015, 8, 31–42. [Google Scholar]
- Keenan, S.W.; Engel, A.D. Early diagenesis and recrystallization of bone. Geoch. Cosmoch. Acta 2017, 196, 209–223. [Google Scholar] [CrossRef]
- McMillan, R.; Weis, D.; Amini, M.; Bonjean, D. Identifying the reworking and stratigraphic provenance of bones by exploring multivariate geochemical relationships with the ‘Perio-spot’ technique. J. Archaeol. Sci. 2017, 88, 1–13. [Google Scholar] [CrossRef]
- Dauphin, Y.; Castillo-Michel, H.; Denys, C.; El Hajiraoui, M.A.; Nespoulet, R.; Stoetzel, E. Diagenetic alterations of Meriones incisors (Rodentia) of El Harhoura 2 cave, Morocco (Late Pleistocene-middle Hococene). PalZ 2018, 92, 163–177. [Google Scholar] [CrossRef]
- Thomas, D.B.; Chinsamy, A.; Conard, N.J.; Kandel, A.W. Chemical investigation of mineralisation categories used to assess taphonomy. Palaeogrogr. Palaeoclimatol. Palaeoecol. 2012, 361, 104–110. [Google Scholar] [CrossRef]
- Williams, J.P. Bones of comprehension—The analysis of small mammal predator-prey interactions. In Predator-Prey Interactions in the Fossil Record; Kelley, P.H., Kowalewski, M., Hansen, T.A., Eds.; Kluwer Acad Plenum: New York, NY, USA, 2003. [Google Scholar]
- Jaeger, J.J.; Université de Poitiers, Poitiers, France. Personal communication, 1989.
- Açil, Y.; Mobasseri, A.E.; Warnke, P.H.; Terheyden, H.; Wiltfang, J.; Springer, I. Detection of mature collagen in human dental enamel. Calc. Tissue Intern. 2005, 76, 121–126. [Google Scholar]
- Duverger, O.; Beniash, E.; Morasso, M.I. Keratins as components of the enamel organic matrix. Matrix Biol. 2016, 52–54, 260–265. [Google Scholar] [CrossRef] [Green Version]
- Edwards, H.G.M.; Nik Hassan, N.F.; Arya, N. Evaluation of Raman spectroscopy and application of chemometric methods for the differentiation of contemporary ivory specimens I: Elephant and mammalian species. J. Raman Spectr. 2006, 37, 353–360. [Google Scholar] [CrossRef]
- France, C.A.M.; Thomas, D.B.; Doney, C.R.; Madden, O. FT-Raman spectroscopy as a method for screening collagen diagenesis in bone. J. Archaeol. Sci. 2014, 42, 346–355. [Google Scholar] [CrossRef]
- Coello, B.; Lopez-Alvarez, M.; Rodriguez-Dominguez, M.; Serra, J.; Gonzalez, P. Quantitative evaluation of the mineralization level of dental tissues by Raman spectroscopy. Biomed. Phys. Eng. Express 2015, 1, 045204. [Google Scholar] [CrossRef]
- Korvenkontio, V.A. Mikroskopische Untersuchungen an Nagerincisiven, unter Hinweis auf die Schmelzstruktur der Backenzahne. Ann. Zool. Soc. Zool. Bot. Fenn. Vanamo 1934, 2, i-xiv: 1–274. [Google Scholar]
- Wahlert, J.H. Variability of rodent incisor enamel as viewed in thin section, and the microstructure of the enamel in fossil and recent rodent groups. Breviora 1968, 309, 1–18. [Google Scholar]
- Risnes, D. A scanning electron microscope study of aberrations in the prism pattern of rat incisor inner enamel. Am. J. Anat. 1979, 54, 419–436. [Google Scholar] [CrossRef] [PubMed]
- Freeman, J.J.; Wopenka, B.; Silva, M.J.; Pasteris, J.D. Raman spectroscopic detection of changes in bioapatite in mouse femora as a function of age and in vitro fluoride treatment. Calcif. Tissue Int. 2002, 68, 156–162. [Google Scholar] [CrossRef] [PubMed]
- Slimani, A.; Nouioua, F.; Desoutter, A.; Levallois, B.; Cuisinier, F.J.G.; Tassery, H.; Terrer, E.; Salehia, H. Confocal Raman mapping of collagen cross-link and crystallinity of human dentin-enamel junction. J. Biomed. Opt. 2017, 22, 086003. [Google Scholar] [CrossRef] [PubMed]
- Timchenko, E.V.; Timchenko, P.E.; Volova, J.T.; Rosenbaum, A.Y.; Kulabukhova, A.Y. Analysis of tooth tissues using Raman spectroscopy. J. Phys. Conf. Ser. 2016, 769, 012047. [Google Scholar] [CrossRef]
- Pindborg, J.J. The pigmentation of the rat incisor as an index of metabolic disturbances. Oral Surg. Oral Med. Oral Pathol. 1953, 6, 780–789. [Google Scholar] [CrossRef]
- McKee, M.D.; Zerounian, C.; Martineau-Doizé, B.; Warshawsky, H. Specific binding sites for transferrin on ameloblasts of the enamel maturation zone in the rat incisor. Anat. Rec. 1987, 218, 123–127. [Google Scholar] [CrossRef]
- Soulier, M.C.; Costamagno, S. Let the cutmarks speak! Experimental butcheries to reconstruct carcass processing. J. Archaeol. Sci. Rep. 2017, 11, 782–802. [Google Scholar] [CrossRef]
- Weiner, S. Microarchaeology—Beyond the Visible Archaeological Record; Cambridge University Press: Cambridge, UK, 2010. [Google Scholar]
- Dauphin, Y.; Nespoulet, R.; Stoetzel, E.; el Haijraoui, M.A.; Denys, C. Can colour be used as a proxy for paleoenvironmental reconstuctions based on archaeological bones? El Harhoura 2 (Morocco) case study. J. Taphon. 2012, 10, 69–84. [Google Scholar]
- Epstein, A.G.; Epstein, J.B.; Harris, L.D. Conodont color alteration: An index to organic metamorphism. Geol. Survey Profes. Paper 1977, 995, 1–27. [Google Scholar]
- Conard, N.J.; Walker, S.J.; Kandel, A.W. How heating and cooling and wetting and drying can destroy dense faunal elements and lead to differential preservation. Palaeogeogr. Palaeoclimatol. Palaeoecol. 2008, 266, 236–245. [Google Scholar] [CrossRef]
- Termine, J.D.; Posner, A.S. Infra-red determination of the percentage of crystallinity in apatitic calcium phosphates. Nature 1966, 211, 268–270. [Google Scholar] [CrossRef] [PubMed]
- LeGeros, R.; Trautz, O.R.; Klein, E.; LeGeros, J.P. Two types of carbonate substitution in the apatite structure. Experientia 1969, 25, 5–7. [Google Scholar] [CrossRef] [PubMed]
- Sillen, A. Biogenic and diagenetic Sr/Ca in Plio-Pleistocene fossils of the Omo Shungura formation. Paleobiology 1986, 12, 311–323. [Google Scholar] [CrossRef]
- Shemesh, A. Crystallinity and diagenesis of sedimentary apatites. Geochim. Cosmochim. Acta 1990, 545, 2433–2438. [Google Scholar] [CrossRef]
- Weiner, S.; Bar-Yosef, O. States of preservation of bones from prehistoric sites in the near East: A survey. J. Archaeol. Sci. 1990, 17, 187–196. [Google Scholar] [CrossRef]
- El Feki, H.; Rey, C.; Vignoles, M. Carbonate ions in apatites: Infrared investigations in the 4 CO3 domain. Calcif. Tissue Int. 1991, 49, 269–274. [Google Scholar] [CrossRef]
- Rey, C.; Renugopalakrishnan, V.; Collins, B.; Glimcher, M.J. Fourier transform infrared spectroscopic study of the carbonate ions in bone mineral during aging. Calcif. Tissue Int. 1991, 46, 251–258. [Google Scholar] [CrossRef]
- Botha, J.; Lee-Thorp, J.; Sponheimer, M. An examination of Triassic cynodont tooth enamel chemistry using Fourier Transform infrared spectroscopy. Calcif. Tissue Int. 2004, 74, 163–169. [Google Scholar] [CrossRef]
- Farre, B.; Massard, P.; Nouet, J.; Dauphin, Y. Preservation of rodent bones from El Harhoura 2 cave (Morocco, Neolithic-Middle Palaeolithic): Microstructure, mineralogy, crystallinity and composition. J. Afr. Earth Sci. 2014, 92, 1–13. [Google Scholar] [CrossRef]
- Wright, L.E.; Schwarcz, H.P. Infrared and isotopic evidence for diagenesis of bone apatite at Dos Pilas, Guatemala: Palaeodietary implications. J. Archaeol. Sc. 1996, 23, 933–944. [Google Scholar] [CrossRef]
- Gordon, L.M.; Cohen, M.J.; MacRenaris, K.W.; Pasteris, J.D.; Seda, T.; Joester, D. Amorphous intergranular phases control the properties of rodent tooth enamel. Science 2015, 347, 746–750. [Google Scholar] [CrossRef] [PubMed] [Green Version]
- Pasteris, J.D.; Wopenka, B.; Freeman, J.J.; Rogers, K.; Valsami-Jones, E.; van der Houwen, J.A.M.; Silva, M.J. Lack of OH in nanocrystalline apatite as a function of degree of atomic order: Implications for bone and biomaterials. Biomaterials 2004, 25, 229–238. [Google Scholar] [CrossRef]
- Young, H.A. Implications of atomic substitutions and other structural details in apatite. J. Dent. Res. 1974, 53, 193–203. [Google Scholar] [CrossRef]
- Combes, C.; Cazalbou, S.; Rey, C. Apatite biominerals. Minerals 2016, 6, 34. [Google Scholar] [CrossRef] [Green Version]
- Dauphin, Y.; Andrews, P.; Denys, C.; Fernandez-Jalvo, Y.; Williams, C.T. Structural and chemical bone modifications in a modern owl pellet assemblage from Olduvai Gorge (Tanzania). J. Taphon. 2003, 1, 209–231. [Google Scholar]
- Denys, C.; Williams, C.T.; Dauphin, Y.; Andrews, P.; Fernandez-Jalvo, Y. Diagenetical changes in Pleistocene small mammal bones from Olduvai Bed, I. Palaeogeogr. Palaeoclimatol. Palaeoecol. 1996, 126, 121–134. [Google Scholar] [CrossRef]
- Dauphin, Y.; Williams, C.T.; Andrews, P.; Denys, C.; Fernandez-Jalvo, Y. Diagenetic alterations of micromammal fossil bones from Olduvai Bed I of the Lower Pleistocene sequence at Olduvai Gorge, Tanzania. J. Sedim. Res. 1999, 69, 612–621. [Google Scholar] [CrossRef]
- Rink, W.J.; Schwarcz, H.P.; Weiner, S.; Goldberg, P.; Meignen, L.; Bar-Yosef, O. Age of the Mousterian industry at Hayonim Cave, Northern Israel, using electron spin resonance and 230Th/234U methods. J. Archaeol. Sci. 2004, 31, 953–964. [Google Scholar] [CrossRef]
Figure 1.
Polished and etched sections of incisors (A–I) and molars (J–L) of recent fresh (not digested) rodent teeth. (A)—Rattus, showing an outer prismatic sublayer (OE) (also called portio externa) and a thick inner prismatic sublayer (IE) (or portio interna), formic acid 5% for 10 s.; (B)—Detail of the prismatic outer sublayer; (C)—Detail of the prisms of the inner sublayer showing elongated crystallites; (D)—Mus, showing two prismatic sublayers (OE); (E)—Detail of the enamel inner sublayer; (F)—Empty tubules of dentine of the same tooth; (G)—Mus, showing tubules still filled with cellular processes; (H)—Parasagittal section of Meriones, showing an enamel arrangement similar to those of Rattus and Mus, HCl 1% for 15 s.; (I)—Detail of the structure of the inner sublayer of enamel; (J)—Uniserial pattern of the inner enamel sublayer and the thin outer sublayer in a molar of Mus, HCl 1% for 15 s.; (K)—Detail of inner structure of the prisms; (L)—Parallel tubules of the dentine in a Mus molar.

Figure 2.
Raman spectra of fresh and digested teeth. (A)—Average spectra of enamel; (B)—Average spectra of dentine.
Figure 2.
Raman spectra of fresh and digested teeth. (A)—Average spectra of enamel; (B)—Average spectra of dentine.

Figure 3.
Bulk composition of fresh teeth. (A)—Crystallinity index calculated from the FWMH of the ν1 PO43− peak. (B)—Substitution of ions PO43− (961 cm−1 peak) to CO32− B type (1070 cm−1 peak); (C)—Mineral-organic ratios calculated from the surface of ν1 PO43− divided by the surface of amide III band. (D)—Mineral-organic ratios calculated from the surface of ν1 PO43− divided by the surface of δ(CH2) band. ME: molar enamel, IE: incisor enamel, MD: molar dentine, ID: incisor dentine.

Figure 4.
Chemical composition of fresh teeth. (A)—Average major elements (P and Ca) contents; (B)—Average Ca/P ratios; (C)—Average minor element contents. ME: molar enamel, IE: incisor enamel, MD: molar dentine, ID: incisor dentine.
Figure 4.
Chemical composition of fresh teeth. (A)—Average major elements (P and Ca) contents; (B)—Average Ca/P ratios; (C)—Average minor element contents. ME: molar enamel, IE: incisor enamel, MD: molar dentine, ID: incisor dentine.

Figure 5.
Principal component plot based on the chemical compositions of the fresh teeth. ME: molar enamel, IE: incisor enamel, MD: molar dentine, ID: incisor dentine.
Figure 5.
Principal component plot based on the chemical compositions of the fresh teeth. ME: molar enamel, IE: incisor enamel, MD: molar dentine, ID: incisor dentine.

Figure 6.
Morphological and microstructural alterations in the teeth extracted from regurgitation pellets of Bubo sp. at Olduvai. (A)—Tip of an isolated incisor showing numerous organic filaments; (B)—Isolated incisor showing the strongly eroded enamel layer and the underlying dentine. (C)—In situ incisor the enamel of which is partly destroyed (white star); (D)—Isolated incisor with a smooth surface and rounded tip; (E)—Organic remains on the surface of an incisor; (E)—Outer surface of an isolated molar showing that the surfaces of both enamel and dentine are smooth; (G)—Detail of an isolated incisor showing the destroyed enamel and the underlying dentine; (H)—In situ molar with desiccation cracks; (I–K)—Isolated molars showing cracks in the roots and crowns; (L)—Outer surface of an in situ molar showing secondary deposits; (M)—Cracks filled with secondary acicular crystallites. D: dentine; E: enamel.

Figure 7.
Teeth extracted from modern regurgitation pellets from Bubo sp. at Olduvai. (A)—Fracture of an incisor showing the different arrangement of the two sublayers of the enamel (OE: outer enamel or portio externa), IE: inner enamel or portio interna) and dentine (D); (B)—Surface of a molar showing polygonal marks; (C)—Surface of an incisor showing the enamel is etched by the digestive process; (D)—Lateral surface of an isolated molar showing different degrees of alteration of the enamel; (E)—Detail of D showing the etched enamel; (F)—Polished and etched section showing the uniserial pattern of the inner enamel sublayer; (G)—Etched enamel of an in situ molar; (H)—Surface of the dentine of an isolated incisor showing empty tubules; (I)—Another surface of the same tooth, with empty and filled tubules.

Figure 8.
Bulk composition of teeth extracted from regurgitation pellets. (A)—Crystallinity index calculated from the FWMH of the ν1 PO43- peak. (B)—Substitution of ions PO43− (961 cm−1 peak) to CO32− B type (1070 cm−1 peak); (C)—Mineral-organic ratios calculated from the surface of ν1 PO43− divided by the surface of amide III band. (D)—Mineral-organic ratios calculated from the surface of ν1 PO43− divided by the surface of δ(CH2) band. ME: molar enamel, IE: incisor enamel, MD: molar dentine, ID: incisor dentine.

Figure 9.
Chemical composition of digested teeth. (A)—Average major elements (P and Ca) contents; (B)—Average Ca/P ratios; (C)—Average minor element contents. ME: molar enamel, IE: incisor enamel, MD: molar dentine, ID: incisor dentine.
Figure 9.
Chemical composition of digested teeth. (A)—Average major elements (P and Ca) contents; (B)—Average Ca/P ratios; (C)—Average minor element contents. ME: molar enamel, IE: incisor enamel, MD: molar dentine, ID: incisor dentine.

Figure 10.
Principal component plot based on the chemical compositions of the digested teeth. ME: molar enamel, IE: incisor enamel, MD: molar dentine, ID: incisor dentine.
Figure 10.
Principal component plot based on the chemical compositions of the digested teeth. ME: molar enamel, IE: incisor enamel, MD: molar dentine, ID: incisor dentine.

Figure 11.
Principal component plot based on the chemical compositions of fresh and digested teeth. (A)—Samples differentiated following their origin (fresh, digested). (B)—Samples differentiated following their origin and tissue (dentine, enamel). (C)—Samples differentiated following their origin and tissue (dentine, enamel) and tooth (incisor, molar). ME: molar enamel, IE: incisor enamel, MD: molar dentine, ID: incisor dentine.

© 2020 by the author. Licensee MDPI, Basel, Switzerland. This article is an open access article distributed under the terms and conditions of the Creative Commons Attribution (CC BY) license (http://creativecommons.org/licenses/by/4.0/).
Share and Cite
MDPI and ACS Style
Dauphin, Y. Using Microstructures and Composition to Decipher the Alterations of Rodent Teeth in Modern Regurgitation Pellets—A Good News-Bad News Story. Minerals 2020, 10, 63. https://doi.org/10.3390/min10010063
AMA Style
Dauphin Y. Using Microstructures and Composition to Decipher the Alterations of Rodent Teeth in Modern Regurgitation Pellets—A Good News-Bad News Story. Minerals. 2020; 10(1):63. https://doi.org/10.3390/min10010063
Chicago/Turabian StyleDauphin, Yannicke. 2020. "Using Microstructures and Composition to Decipher the Alterations of Rodent Teeth in Modern Regurgitation Pellets—A Good News-Bad News Story" Minerals 10, no. 1: 63. https://doi.org/10.3390/min10010063
Note that from the first issue of 2016, this journal uses article numbers instead of page numbers. See further details here.