
Effect of Nutrition on Age-Related Metabolic Markers and the Gut Microbiota in Cats


1
Pet Nutrition Center, Hill’s Pet Nutrition, Inc., Topeka, KS 66617, USA
2
Department of Grain Science and Industry, Kansas State University, Manhattan, KS 66506, USA
*
Author to whom correspondence should be addressed.
Microorganisms 2021, 9(12), 2430; https://doi.org/10.3390/microorganisms9122430
Submission received: 19 October 2021
/
Revised: 8 November 2021
/
Accepted: 24 November 2021
/
Published: 25 November 2021
(This article belongs to the Special Issue The Effect of Nutrition on the Fecal Microbiome in Animals)
Abstract
:Age-related changes in the gut microbiota and metabolites are associated with the increased risk of detrimental conditions also seen with age. This study evaluated whether a test food with potential anti-aging benefits results in favorable changes in plasma and fecal metabolites and the fecal microbiota in senior cats. Forty healthy domestic cats aged 8.3–13.5 years were fed a washout food for 30 days, then control or test food for 30 days. After another 30-day washout, cats were switched to the other study food for 30 days. Assessment of plasma and fecal metabolites showed lower levels of metabolites associated with detrimental processes (e.g., uremic toxins) and higher levels of metabolites associated with beneficial processes (e.g., tocopherols) after cats consumed the test food compared with the control food. A shift toward proteolysis with the control food is supported by higher levels of amino acid metabolites and lower levels of carbohydrate metabolites. Operational taxonomic units of greater abundance with the test food positively correlated with carbohydrate and nicotinic acid metabolites, and negatively correlated with uremic toxins, amino acid metabolism, secondary bile salts, and branched-chain fatty acids. Taken together, the test food appears to result in greater levels of metabolites and microbiota associated with a healthier state.
1. Introduction
Research into the microbiota of humans and animals has expanded at a rapid pace over the last several years. Dietary factors direct the composition and metabolic output of the gastrointestinal microbiota, which in turn influences the health of the host through the production of postbiotics [1]. Aging has a profound effect on the composition and diversity of the gastrointestinal microbiota [2], as has been shown in humans [3,4] and dogs [5,6]. Prior work has characterized the feline fecal microbiota at various stages of life, and also demonstrated shifts in its composition with age and food [7,8,9].
Age-related changes in the gut microbiota may be associated with immunosenescence, or age-related dysfunction of the immune system, in humans [3]. Immunosenescence may lead to “inflammaging,” low-grade chronic inflammation that contributes to age-related diseases [10]. Indeed, detrimental effects of aging in cats include an increased risk of a variety of conditions associated with inflammation such as chronic kidney disease (CKD), diabetes, gastrointestinal disease, cancer, and cognitive decline [11,12].
With an average life expectancy of about 12 years for pet cats [13] and consideration of cats > 10 years of age as senior [12], it is of great interest to investigate foods that mitigate the adverse effects of aging. Previous research on foods with a similar formulation to the one tested here [14] showed benefits in kidney parameters in senior cats, including increased glomerular filtration rate (GFR); decreased serum levels of symmetric dimethylarginine (SDMA), a biomarker for early CKD [15]; and lower serum levels of 3-indoxyl sulfate, a uremic toxin. The goal of this study was to evaluate the effect of a test food with potential anti-aging benefits on plasma and fecal metabolites and the gut microbial composition of senior cats.
2. Materials and Methods
2.1. Animals, Study Foods, and Experimental Design
Forty domestic shorthair cats between 8–16 years of age, owned by Hill’s Pet Nutrition, Inc., all spayed or neutered, were included in this study. Those with chronic disease conditions such as inflammatory bowel disease, dermatitis, food allergy, cancer/tumor, kidney disease, liver disease, or chronic urinary tract infections were excluded. Cats were to be removed from the study if they lost more than 15% of their body weight or had a low intake that could result in that weight loss. All cats were individually housed at the Hill’s Pet Nutrition Center and were provided with regular opportunities to exercise and socialize with other cats. The Hill’s Institutional Animal Care and Use Committee (permit CP632) and Animal Welfare Committee approved this study protocol in accordance with the National Research Council guide [16].
The ingredient preponderance for the control food was wheat, corn gluten meal, rice, pork fat, chicken, egg, beet pulp, flax seed, wheat gluten, fish oil, carnitine, soybean oil, and oat fiber. For the test food, the preponderance was brown rice, corn gluten meal, pea, chicken, oat groats, fiber blend (broccoli and tomato pomace), soybean oil, beet pulp, fish oil, and carnitine. Oat groats were added to the test food to serve as a source of beta-glucan that could reach the colon and be fermented by saccharolytic microbes. The fiber blend of broccoli and tomato pomace was to serve as a source of natural antioxidant polyphenols known to have a protective effect against age-associated cognitive decline [17,18]. Both foods were supplemented with vitamins, minerals, and palatability enhancers. The amount of fish oil in the control food was almost double the amount in the test food. The washout food contained similar ingredients to the control food but did not contain beet pulp, oat groats, or the fiber blend, so that the effects of those ingredients would be observable. Food analytical measurements were determined using Association of Analytical Communities methods by Eurofins Scientific Inc. (Des Moines, IA, USA). Digestibility assays were performed as previously described [19].
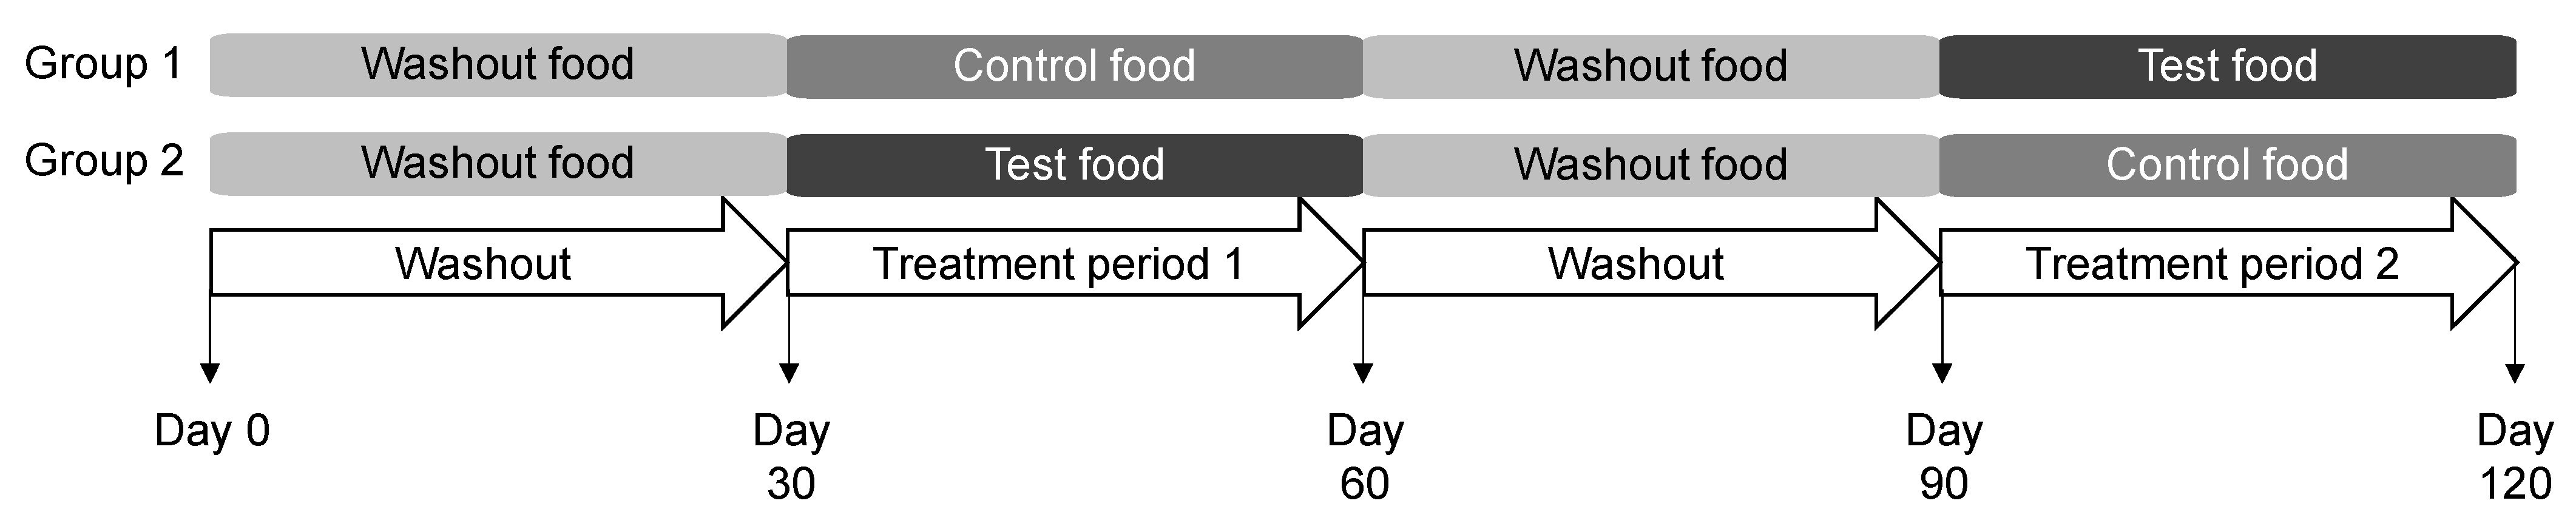
After a 30-day period during which all cats consumed the washout food, cats were split into two equal groups in which one group consumed the control food and the other the test food for 30 days (Figure 1). Next, all 40 cats were fed washout food for 30 days before they were switched to the other food for 30 days. This crossover design controls for the time effect and also allows each cat to serve as its own control, especially important in studies of microbiota to account for inter-individual variation [20]. The washout period between each study food was to eliminate a carryover effect from the food consumed in the first treatment feeding period [21]. Cats had unlimited access to water throughout the day. All cats were offered fresh food with amounts available for consumption to maintain body weight. Daily food intake was recorded. Blood and fecal samples were collected at the end of each 30-day period for analyses. Blood chemistry was analyzed as described by Hall et al. [15].
2.2. Stool Collection, Scoring, and Sample Processing
On stool collection days, caretakers inspected the litter boxes every 15 min for stool production. Upon observation of a stool, it was scored on a scale ranging from 1 (not solid, > 75% liquid) to 5 (cylindrical, > 80% firm) as previously described [22]. Fresh fecal samples were homogenized (Thinky Mixer, Thinky USA Inc., Laguna Hills, CA, USA), and were frozen as aliquots at −80 °C as previously described [23].
2.3. Metabolite Analysis
Plasma and fecal metabolites were analyzed by Metabolon, Inc. (Morrisville, NC, USA). SCFAs were extracted, acidified with methyl-t-butyl ether, and resolved by capillary gas chromatography as previously described [24]. Maximum and minimum detection levels were used for fecal SCFA measurements below or above the detection limits.
2.4. Bioinformatics Processing
Microbiome analysis of frozen fecal samples was conducted as described by Hall et al. [25]. The Qiagen MagAttract Power Microbiome DNA/RNA EP DNA isolation kit (Qiagen Cat. No. ID:27500–4-EP; Germantown, MD, USA), optimized for use with the Eppendorf epMotion 5075 TMX platform (Eppendorf, AG, Hamburg, Germany), was used for total DNA extraction. PCR amplification spanned the V3–V4 hypervariable regions of the 16S rRNA gene. Amplicon sequencing was performed using the Illumina library preparation protocol (15044223 Rev. A); sequences were de-multiplexed to obtain FASTQ Files, and bacterial taxonomic classification was per the GreenGenes reference taxonomy. Centered log-ratio (CLR) transformation of the copy-corrected operational taxonomic units (OTU) count data was performed to enable appropriate statistical analysis.
2.5. Statistical Analysis
Data were analyzed by treatment food, and data for both groups were combined as appropriate for the control and test foods. Statistical analyses were performed in JMP, version Pro 15 (SAS Institute, Cary, NC, USA). Metabolomics data were log-transformed prior to matched-pair analysis, performed to test whether means were different between treatments. Linear regression analyses are reported by the square of Pearson’s correlation coefficient (r2) and p-values. Log transformation was applied to non-normally distributed variables. Statistical significance was established with p ≤ 0.05 and FDR-corrected p ≤ 0.1.
3. Results
3.1. Food, Study Design, and Animals
The major differences between the control and test foods were that the test food contained brown rice as well as a fiber blend of broccoli and tomato pomace. Fish oil levels in the control food were almost twice that of the test food. The control and test foods had similar levels of ash, crude fiber, and crude protein as seen via proximate analyses (Table 1). Higher levels of crude fat, moisture, and omega-3 fatty acids were observed in the control food compared with the test food.
Digestibility parameters were similar between the two foods, with slightly higher apparent and true protein digestibility in the test food (Table 2). Apparent fiber digestibility was about twice as high in the control food as in the test food. Only true protein digestibility was significantly different between the foods (p = 0.001).
Cats were divided into two groups of 20, with Group 1 receiving the control food during the first 30-day feeding period and the test food during the second 30-day feeding period, and Group 2 receiving the foods in the reverse order, with a 30-day washout between the feeding periods. The mean ± standard deviation age at the start of the study was 11.5 ± 1.6 years in Group 1 (7 males, 13 females) and 11.3 ± 1.6 years in Group 2 (6 males, 14 females). No adverse events were encountered during the study period, and no cats needed to be removed from the study.
Body weights increased following consumption of the control and test foods. However, these increases were not significantly different between the two foods, despite a significantly higher daily intake with the test food (Table 3). The average stool score was slighter higher, indicating greater firmness, in the control food group compared with the test food group, though both were in the acceptable range.
3.2. Effect of the Control and Test Foods on Blood Chemistry and Plasma Metabolites in Senior Cats
Following consumption of the study foods, blood concentrations of both creatinine and blood urea nitrogen (BUN) were significantly higher when cats had consumed the control food compared with the test food (Table 4).
Several significant differences in plasma metabolites of interest were observed between the two food types (Table 5; Supplemental Table S1). A number of uremic toxins, including 3-indoxyl sulfate, 5-hydroxyindole sulfate, 6-hydroxyindole sulfate, 3-hydroxyhippurate, 3-hydroxyphenylacetate sulfate, urea, dimethylarginine (SDMA + ADMA), 1-methylguanidine, 4-ethylphenyl sulfate, and 2-oxindole-3-acetate were higher with the control food. The advanced glycation end product (AGE) pyrraline and several gamma-glutamyl amino acids were also found at greater plasma levels following consumption of the control food. In contrast, tocopherols, which are antioxidant markers, and some products of nicotinate and nicotinamide metabolism, were higher in the test food.
3.3. Effect of Control and Test Foods on Fecal Metabolites in Senior Cats
Similar to the plasma metabolites, higher levels of uremic toxins and lower levels of tocopherols and products of nicotinate and nicotinamide metabolism were observed in feces after cats consumed the control food compared with the test food (Table 6; Supplemental Table S2). Generally, levels of amino acid metabolites were higher and levels of carbohydrate metabolites in feces were lower with the control food. In addition, several secondary cholate-derivative bile salts increased with the control food, while the primary bile salt cholate decreased.
Fecal SCFA analysis showed significantly higher levels of butyric acid and lower levels of propionic acid with the test food compared with the control food (Table 7). Levels of the BCFAs isobutyric acid and isovaleric acid were significantly higher with the control food.
3.4. Effect of Control and Test Foods on Fecal Microbiota in Senior Cats
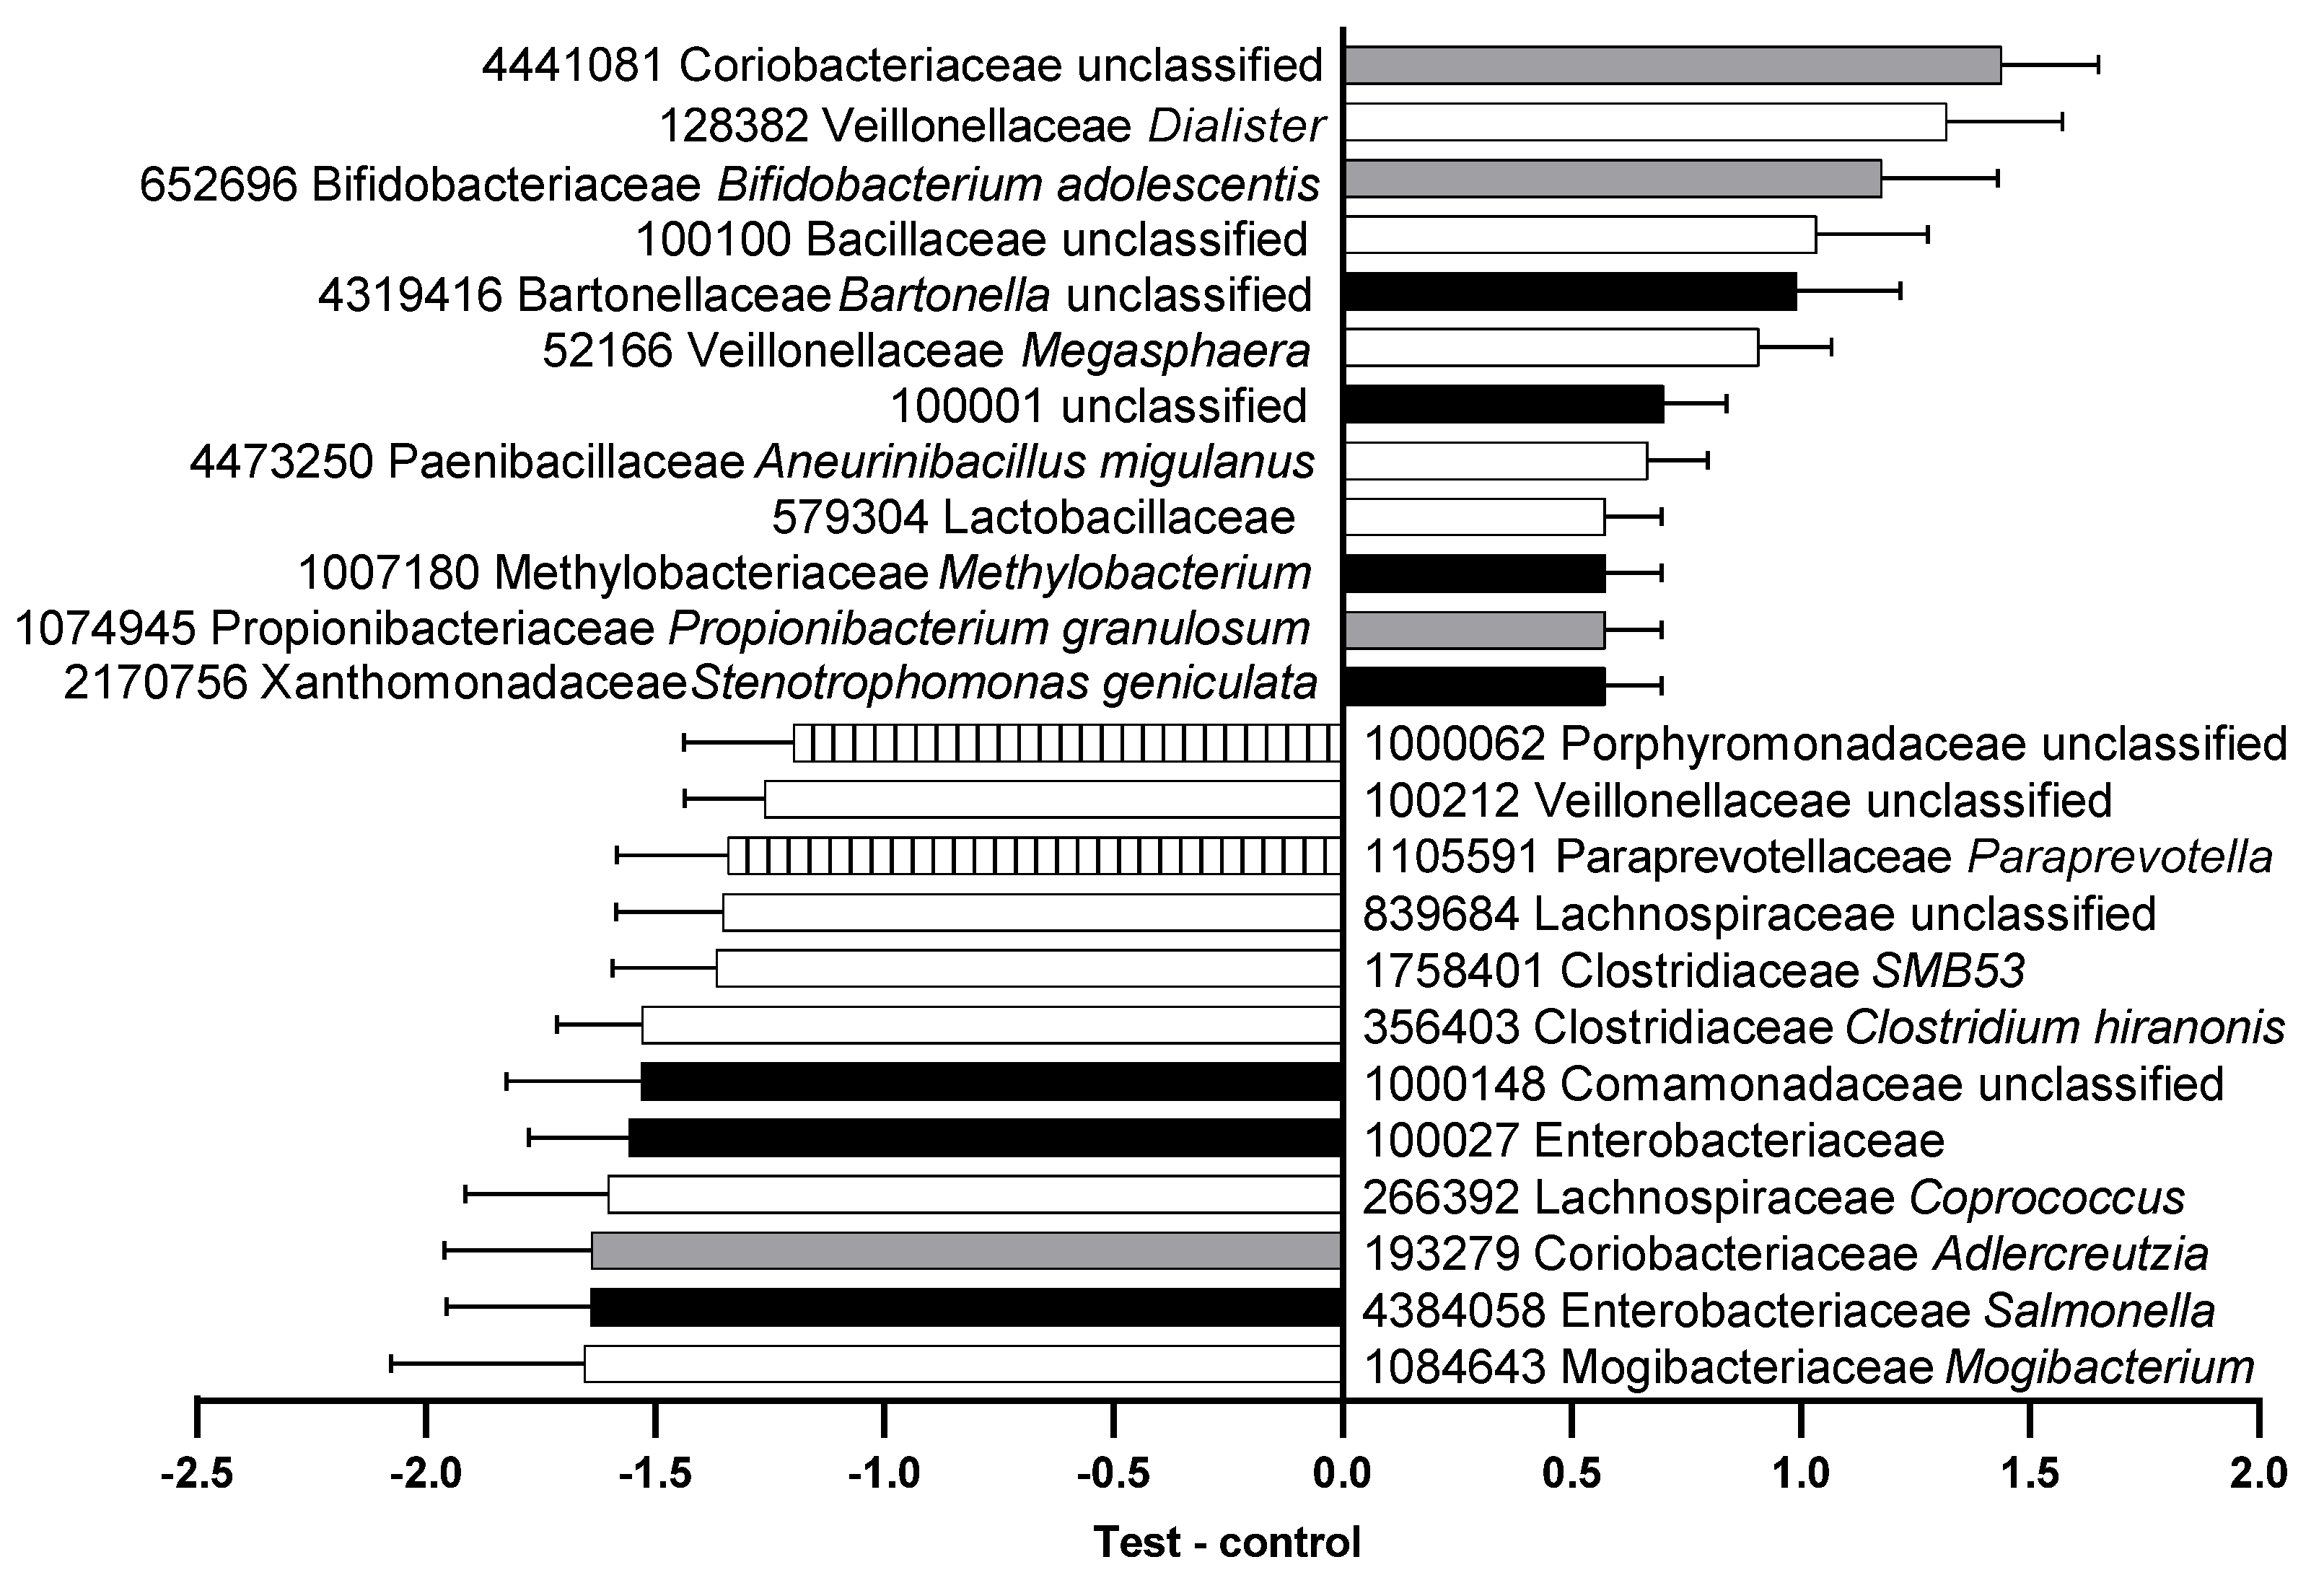
Seventy-seven OTUs significantly differed in feces from cats fed the control versus test foods, 26 of which were more abundant following consumption of the control food and 51 more abundant after the test food (Supplemental Table S3). Several families of saccharolytic bacteria such as Coriobacteriaceae, Veillonellaceae, Bifidobacteriaceae, and Lactobacillaceae were more abundant after cats consumed the test food (Figure 2).
3.5. Correlations among Plasma and Fecal Metabolites and OTUs
Several plasma indoles correlated with OTUs that were significantly different between the control and test foods (Table 8; Supplemental Table S4). Of note, the OTUs that were of greater abundance after cats consumed the control food positively correlated with these uremic toxins, while those of greater abundance with the test food were negatively correlated.
In correlation analyses of fecal metabolites with OTUs, the indolic uremic toxins positively correlated with OTUs that were increased with the control food and negatively correlated with those that were increased with the test food (Table 9), similar to the observation with the plasma metabolites. OTUs that were of higher abundance with the test food were positively correlated with the primary bile salt cholate but negatively correlated with the secondary bile salts. In addition, OTUs that were increased with the test food were positively correlated with carbohydrate metabolites and negatively correlated with dipeptides, while the reverse was observed with the OTUs of greater abundance with the control food (Supplemental Table S4). Positive correlations with several metabolites of nicotinate and nicotinamide, such as NAD+, NaMN, and trigonelline, were observed with the OTUs of greater abundance after consumption of the test food (Supplemental Table S4).
In correlation analyses of fecal SCFAs and OTUs, positive correlations were observed with acetic acid and butyric acid for the OTUs that were of greater abundance following consumption of the test food, and negative correlations with propionic acid, isobutyric acid, and isovaleric acid (Table 10). The opposite trend was seen with SCFAs and OTUs that were higher with the control food.
4. Discussion
In this study, lower levels of metabolites associated with detrimental processes and higher levels of metabolites associated with beneficial processes were seen after senior cats consumed the test food compared with the control food. Levels of amino acid metabolites were higher and levels of carbohydrate metabolites in feces were lower with the control food, indicating a possible shift in metabolism. A relatively small number of OTUs differed in the feces from cats fed the control and test foods. Generally, much greater differences in gut microbiota have been observed when comparing disease states with healthy controls than when comparing consumption of different food types in humans or animals [9]. Despite these relatively small differences between food types in the present study, many of the OTUs of greater abundance with the test food have been associated with healthier states, particularly in prior studies focused on CKD or aging. Notably, OTUs of greater abundance with the test food were positively correlated with carbohydrate metabolites, several nicotinic acid metabolites, and were negatively correlated with uremic toxins, amino acid metabolism, secondary bile salts, and BCFAs. The opposite effects were observed with the OTUs that were greater following consumption of the control food.
Digestibility parameters were similar in both study foods and to those from another study in cats [26], though nutrient digestibility decreases with old age in cats [27]. The apparent fiber digestibility was about twice as high in the control food compared with the test food, which is likely due to the presence of brown rice, known to have low digestibility, in the test food. The significantly higher true protein digestibility with the test food may have contributed to the observed benefits.
A number of metabolites associated with renal dysfunction were lower in plasma and/or feces from cats fed the test food compared with the control food in this study. This is of particular interest since reduced kidney function with age has been observed in cats as measured by GFR [28]. Increased inflammation likely greatly contributes to this, as both oxidative stress and inflammation are greater with normal aging and in CKD [29].
Tryptophan is converted by gut microbes to indole, which then enters circulation and is converted into indoxyl sulfate by the liver [30]. Indoxyl sulfate is normally cleared by the kidneys but is increased in the circulation in those with CKD and is an indicator of decreased renal function in humans and companion animals. Indoxyl sulfate negatively correlated with estimated GFR in people with early renal function decline [31], suggesting that it may contribute to further decline [32]. In addition, cats with stage 2–4 CKD had significantly higher levels of serum indoxyl sulfate compared with healthy older cats [33]. In the present study, plasma levels of 3-indoxyl sulfate were lower with the test food, consistent with a prior study of foods of a similar formulation to the one tested here [14]. Indoxyl sulfate, along with several other metabolites in this study, are among the uremic solutes that were found in patients on hemodialysis in at least 2.4-times higher levels compared with controls [34]. These included 3-hydroxyhippurate, 3-hydroxyphenylacetate sulfate, urea, dimethylarginine (SDMA + ADMA), 1-methylguanidine, 2-oxindole-3-acetate, 5-hydroxyindole sulfate, 6-hydroxyindole sulfate, and 4-ethylphenyl sulfate. In addition, 3-indoxyl sulfate, 5-hydroxyindole sulfate, 6-hydroxyindole sulfate, 3-hydroxyhippurate, 4-ethylphenyl sulfate, phenylpropionylglycine, and 3-phenylpropionate (hydrocinnamate) were all found at higher levels in cats with CKD compared with healthy controls [25]. As in the present study, lower levels of SDMA were also seen in the prior study of similarly formulated foods [14]. Serum SDMA can be used to identify CKD in cats, allowing earlier detection of CKD than serum creatinine [15], and its levels also increase with age in cats [28]. Both creatinine and BUN were significantly lower following consumption of the test food, and these were lower in healthy cats compared with those with CKD [25].
Several other metabolites that were at lower levels with the test food are also associated with kidney dysfunction, such as the urea cycle metabolites citrulline, urea, and dimethylarginine. Others include tryptophan and tyrosine metabolites, some of which can act as uremic toxins [35], and methylguanidine, which was seen at higher levels in plasma and urinary excretion in dogs with chronic renal failure [36]. Plasma levels of guanidinoacetate, a precursor to creatinine, were also lower following consumption of the test food in the present study. Erythronate, which was higher in people with CKD compared with those without CKD [37], was lower in plasma from cats fed the test food compared with the control food. Higher median concentrations of erythronate were also observed with older age [37].
Metabolites of tocopherols, which are vitamin E compounds with antioxidant activity [38], were higher in both serum and feces from cats fed the test food compared with the control food. A prior study showed that levels of vitamin E were lower in patients with CKD compared with healthy controls [39]. Similarly, significantly lower concentrations of gamma-tocopherol/beta-tocopherol were observed in cats with CKD compared with healthy cats [25].
Several of the OTUs that were of greater abundance with the test food in this study may have beneficial health effects concerning renal function. Megasphaera were at greater abundance in healthy controls than in people with CKD or idiopathic nephrotic syndrome [40]. Lactobacillaceae were significantly decreased in rats with chronic renal failure [41] and in people with end-stage renal disease [42] compared with healthy controls. Dialister was one of several genera that negatively correlated with CKD severity in humans, and also negatively correlated with the uremic toxins indoxyl sulfate and p-cresyl sulfate [43]. Consistent with those results, Dialister negatively correlated with 3-indoxyl sulfate in the present study. Similarly, Bifidobacterium was present at lower levels in feces from patients with ESRD compared with healthy controls and was negatively correlated with several renal parameters (cystatin C, BUN, creatinine, and estimated GFR) [44]. Bifidobacterium and Lactobacillaceae may confer beneficial effects on kidney function by upregulating IL-10, leading to decreased inflammation [32]. Lactobacillus salivarius prevented acute kidney injury in a cisplatin-induced rat model and lowered serum levels of the uremic toxins indoxyl sulfate and p-cresol sulfate [45]. It also improved intestinal permeability and led to an increase in fecal SCFAs. A mix of L. paracasei and L. plantarum showed reduced serum levels of the uremic toxins p-cresol, indoxyl sulfate, and p-cresyl sulfate in a CKD mouse model [46]. In addition, these probiotics appeared to improve intestinal barrier integrity, prevented kidney structural damage, decreased inflammation, and remediated CKD-related gut dysbiosis. A similar study on humans on hemodialysis who were given L. rhamnosus as a probiotic in a four-week clinical trial showed significantly decreased levels of the serum uremic toxins phenol and p-cresol compared with patients in the placebo group [47].
In contrast, a number of the OTUs that were of greater abundance with the control food appear to be associated with kidney dysfunction. Paraprevotella were at greater levels in the fecal microbiota of patients with CKD compared with healthy controls, and also correlated with estimated GFR, an indicator of CKD severity [48]. Similarly, Enterobacteriaceae was one of several families of greater abundance in the gut microbiota in people with kidney disease compared with healthy controls [42,49].
Advanced glycation end product (AGE) accumulation in body tissues is a characteristic of aging, as well as in diabetes and CKD [50]. In addition, oxidative stress is related to AGE accumulation, which is associated with age-related complications such as osteoarthritis and likely contributes to age-related loss of muscle mass [51]. Here, the AGE pyrraline was lower in serum and feces of cats fed the test food in this study compared with the control food.
Greater levels of dipeptides seen here in feces from cats fed the control food may indicate a shift toward proteolytic metabolism in the gut microbiota. In this study, true protein digestibility was 4% higher with the test food, so this, along with the presence of the fiber blend, could have contributed to the increased saccharolysis observed with the test food. Although the cats in the present study were all healthy, excess protein in CKD is delivered to the large intestine, which leads to a shift from saccharolytic to proteolytic bacteria. The resultant increased protein fermentation produces potentially detrimental metabolites such as indoles, phenols, ammonia, and amines [52]. As noted above, many detrimental uremic metabolites were lower with the test food, and were inversely correlated with OTUs that were of greater abundance with the test food. Cats with CKD showed higher levels of plasma indole sulfates and other uremic toxins with increased protein consumption [53]. Like the uremic metabolites, the same trend of lower levels with the test food and inverse correlation with OTUs of greater abundance with the test food was observed with dipeptides. Several bacterial families that were at greater levels in feces in cats fed the control food compared with the test food have been shown to generate phenolic compounds in vitro, including Clostridiaceae, Enterobacteriaceae, Lachnospiraceae, Porphyromonadaceae, and Veillonellaceae [54].
The SCFA butyric acid was higher and the BCFAs isobutryic acid and isovaleric acid were lower with the test food in this study. Lower levels of SCFAs and higher levels of BCFAs have been observed with greater levels of proteolysis and gut microbe-mediated putrefaction [24], further supporting the idea of a shift to proteolysis with the control food in the present study. SCFAs, including butyrate, provide several important functions such as serving as a major energy source for colonocytes [55]), protecting the integrity of the intestinal barrier [56,57], and inhibiting histone deacetylases, thus modulating oncologic and inflammatory functions [58]. While BCFAs have some beneficial properties as well, fecal isovaleric acid levels were significantly higher in cats with CKD compared with healthy controls, and fecal isovaleric acid was also found to correlate with creatinine levels [59].
In addition, a number of gamma-glutamyl amino acids were present at higher levels in plasma and feces from cats fed the control food. Their higher levels may indicate greater gamma-glutamyl transferase activity, which has been linked with increased oxidative stress and higher risk of cardiovascular disease [60].
Increases in metabolism of several amino acids, including tryptophan, tyrosine, valine, and lysine, have been associated with aging in humans [61]. Greater levels of metabolites of all of these pathways were observed in the present study in plasma and/or feces in cats fed the control food, contributing to the idea that the test food promoted anti-aging.
Some OTUs in this study have previously been associated with aging and/or cognition. B. adolescentis is of lower abundance in the gut microbiome of older adult humans [62,63], so it is of particular interest that feeding the test food in the present study appeared to increase the levels of this age-related species. Coprococcus, here at lower abundance with the test food, was present at significantly higher levels in feces from elderly (aged > 60 years) compared with middle-aged (aged 50–59 years) people [3], perhaps implying that the control food is associated with an increase in an age-associated microbe. Several Lactobacillus strains showed benefits in aging and age-induced metabolism by inhibition of telomere shortening and improving lipid, renal, and liver profiles in rats [64]. Porphyromonadaceae and Enterobacteriaceae, both of lower abundance with the test food, have been associated with cognitive decline in elderly humans [65]. The abundance of Enterobacteriaceae in the gut microbiome was higher in patients with post-stroke cognitive impairment and could distinguish between patients with and without cognitive impairment following a stroke [66]. In addition, aged mice showed higher anxiety-like behavior compared with younger mice, which directly correlated with the higher levels of Porphyromonadaceae in the ceca of older mice [67].
In the present study, levels of NAD+ were higher in feces from cats fed the test food, and nicotinate ribonucleoside, a precursor in the production of NAD+, was found at greater levels in plasma from cats fed the test food. NAD+ is an important coenzyme that carries out redox reactions in all cells and is particularly important for the generation of ATP. NAD+ also serves non-redox roles, including as a cofactor for poly (ADP-ribose) polymerase, which repairs oxidative damage to DNA. Decreased levels of NAD+, along with increased oxidative stress, have been seen in children with autism [68].
Bile salts also showed distinct patterns in this study, with the primary bile salt cholate at higher levels while several secondary bile salts were lower in feces from cats fed the test food. Notably, OTUs that were of greater abundance with the test food showed positive correlations with cholate and negative correlations with the secondary bile salts. C. hiranonis, of greater abundance with the control food, exhibits bile salt 7α-dehydroxylating activity [69], which also corresponds with the higher levels of deoxycholate and lithocholate seen in feces from cats fed the control food in this study.
Whether the levels of primary and secondary bile salts are beneficial or detrimental may be dependent upon situational differences. While secondary bile salts have been correlated with markers of colorectal cancer in humans [70], they also inhibit the growth of pathogens such as Clostridioides difficile [71,72]. Further, in dogs with chronic inflammatory enteropathy that experienced remission with nutritional therapy, higher levels of the secondary bile salts deoxycholate and lithocholate were observed along with elevated abundance of C. hiranonis during remission [73]. The authors of that study suggest that food therapy may have differential effects determined by the state of the gut microbiota.
Along this line of thought, not all of the OTUs of higher abundance following consumption of the control food are associated with detrimental functions. For example, Adlercreutzia equolifaciens can convert the isoflavone daidzein to equol [74], an isoflavan with beneficial health effects. Although the species of the Adlercreutzia OTU was not identified in the present study, equol was significantly higher in feces from cats fed the control food. In addition, Porphyromonadaceae and Enterobacteriaceae were positively correlated with albumin in a study of the gut microbiota of people with idiopathic nephrotic syndrome [75]. Porphyromonadaceae were also enriched in the gut microbiota of some elderly people and may modulate adiposity [76]. Further, although a number of metabolites and OTUs associated with poor health were higher with the control food, it is important to note that no adverse effects on body condition or general health were seen with either the control or test food in the senior cats in this study. However, it would be of interest to evaluate the test food in cats with a condition such as CKD to examine whether it would confer positive health effects.
Limitations of this study include the relatively short, 30-day feeding periods. While a number of changes in the plasma and fecal metabolites were observed, perhaps there would have been greater changes in the fecal microbiota with a longer feeding period. In addition, since the control and test foods differed in several ingredients, it is not possible to attribute the observed effects to a single ingredient. Rather, the conclusions must be drawn from the combined benefits of the ingredients (brown rice, oat groats, fiber blend with broccoli and tomato pomace) used together. Future studies may further investigate the individual effects of these ingredients.
5. Conclusions
This study showed that consumption of the test food resulted in higher levels of metabolites and microbiota associated with beneficial health states compared with the control food. Metabolism with the test food appeared to favor saccharolysis in contrast with proteolysis favored with the control food. Positive correlations with metabolites involved in saccharolysis and negative correlations with uremic toxins, amino acid metabolism, and BCFAs support the idea that the test food may support the health of senior cats.
Supplementary Materials
The following are available online at https://www.mdpi.com/article/10.3390/microorganisms9122430/s1: Table S1: Plasma metabolomic data; Table S2: Fecal metabolomic data; Table S3: Fecal microbiota data; Table S4: Correlations of metabolomic and microbiota data.
Author Contributions
Conceptualization, E.E. and D.E.J.; methodology, E.E. and D.E.J.; formal analysis, E.E.; investigation, E.E.; resources, E.E. and D.E.J.; data curation, E.E.; writing—review and editing, E.E. and D.E.J.; supervision, E.E. and D.E.J.; project administration, E.E. and D.E.J.; funding acquisition, E.E. and D.E.J. All authors have read and agreed to the published version of the manuscript.
Funding
This research was funded by Hill’s Pet Nutrition, Inc.
Institutional Review Board Statement
The study was conducted according to the guidelines of the Hill’s Institutional Animal Care and Use Committee and Animal Welfare Committee and was approved by both on January 9, 2015 (CP632b.0.0.0-A-F-D-ADH-MULTI-150-MULTI).
Data Availability Statement
The data presented in this study are available in the Supplementary Materials.
Acknowledgments
Jennifer L. Giel assisted with the writing and development of the manuscript.
Conflicts of Interest
Although the funder (Hill’s Pet Nutrition, Inc.) provided support in the form of salaries for the authors, the funder had no role in the design of the study; in the collection, analyses, or interpretation of data; in the writing of the manuscript; or in the decision to publish the results. The research was performed at the Pet Nutrition Center, Topeka, KS, where the authors currently work (E.E.) or formerly worked (D.E.J.).
References
- Wernimont, S.M.; Radosevich, J.; Jackson, M.I.; Ephraim, E.; Badri, D.V.; MacLeay, J.M.; Jewell, D.E.; Suchodolski, J.S. The effects of nutrition on the gastrointestinal microbiome of cats and dogs: Impact on health and disease. Front. Microbiol. 2020, 11, 1266. [Google Scholar] [CrossRef] [PubMed]
- Woodmansey, E.J. Intestinal bacteria and ageing. J. Appl. Microbiol. 2007, 102, 1178–1186. [Google Scholar] [CrossRef]
- Shen, X.; Miao, J.; Wan, Q.; Wang, S.; Li, M.; Pu, F.; Wang, G.; Qian, W.; Yu, Q.; Marotta, F.; et al. Possible correlation between gut microbiota and immunity among healthy middle-aged and elderly people in southwest China. Gut Pathog. 2018, 10, 4. [Google Scholar] [CrossRef] [Green Version]
- Kumar, M.; Babaei, P.; Ji, B.; Nielsen, J. Human gut microbiota and healthy aging: Recent developments and future prospective. Nutr. Healthy Aging 2016, 4, 3–16. [Google Scholar] [CrossRef] [Green Version]
- Kubinyi, E.; Rhali, S.B.; Sa ndor, S.; Szabo, A.; Felfoldi, T. Gut microbiome composition is associated with age and memory performance in pet dogs. Animals 2020, 10, 1488. [Google Scholar] [CrossRef]
- Mizukami, K.; Uchiyama, J.; Igarashi, H.; Murakami, H.; Osumi, T.; Shima, A.; Ishiahra, G.; Nasukawa, T.; Une, Y.; Sakaguchi, M. Age-related analysis of the gut microbiome in a purebred dog colony. FEMS Microbiol. Lett. 2019, 366, fnz095. [Google Scholar] [CrossRef] [PubMed]
- Masuoka, H.; Shimada, K.; Kiyosue-Yasuda, T.; Kiyosue, M.; Oishi, Y.; Kimura, S.; Ohashi, Y.; Fujisawa, T.; Hotta, K.; Yamada, A.; et al. Transition of the intestinal microbiota of cats with age. PLoS ONE 2017, 12, e0181739. [Google Scholar] [CrossRef] [PubMed] [Green Version]
- Bermingham, E.N.; Young, W.; Butowski, C.F.; Moon, C.D.; Maclean, P.H.; Rosendale, D.; Cave, N.J.; Thomas, D.G. The fecal microbiota in the domestic cat (Felis catus) is influenced by interactions between age and diet; a five year longitudinal study. Front. Microbiol. 2018, 9, 1231. [Google Scholar] [CrossRef]
- Pilla, R.; Suchodolski, J.S. The gut microbiome of dogs and cats, and the influence of diet. Vet. Clin. N. Am. Small Anim. Pract. 2021, 51, 605–621. [Google Scholar] [CrossRef]
- Santoro, A.; Bientinesi, E.; Monti, D. Immunosenescence and inflammaging in the aging process: Age-related diseases or longevity? Ageing Res. Rev. 2021, 71, 101422. [Google Scholar] [CrossRef]
- Ray, M.; Carney, H.C.; Boynton, B.; Quimby, J.; Robertson, S.; St Denis, K.; Tuzio, H.; Wright, B. 2021 AAFP feline senior care guidelines. J. Feline Med. Surg. 2021, 23, 613–638. [Google Scholar] [CrossRef] [PubMed]
- Quimby, J.; Gowland, S.; Carney, H.C.; DePorter, T.; Plummer, P.; Westropp, J. 2021 AAHA/AAFP feline life stage guidelines. J. Feline Med. Surg. 2021, 23, 211–233. [Google Scholar] [CrossRef] [PubMed]
- Banfield Pet Hospital. State of Pet Health 2013 Report. 2013. Available online: https://www.banfield.com/en/pet-health/State-of-pet-health (accessed on 16 September 2021).
- Hall, J.A.; Jackson, M.I.; Farace, G.; Yerramilli, M.; Jewell, D.E. Influence of dietary ingredients on lean body percent, uremic toxin concentrations, and kidney function in senior-adult cats. Metabolites 2019, 9, 238. [Google Scholar] [CrossRef] [PubMed] [Green Version]
- Hall, J.A.; Yerramilli, M.; Obare, E.; Yerramilli, M.; Jewell, D.E. Comparison of serum concentrations of symmetric dimethylarginine and creatinine as kidney function biomarkers in cats with chronic kidney disease. J. Vet. Intern. Med. 2014, 28, 1676–1683. [Google Scholar] [CrossRef] [Green Version]
- National Research Council Committee update of the guide for the care and use of laboratory animals. In The National Academies Collection: Reports Funded by National Institutes of Health; National Academies Press (US), National Academy of Sciences: Washington, DC, USA, 2011.
- Baroni, L.; Sarni, A.R.; Zuliani, C. Plant foods rich in antioxidants and human cognition: A systematic review. Antioxidants 2021, 10, 714. [Google Scholar] [CrossRef]
- Porter, Y. Antioxidant properties of green broccoli and purple-sprouting broccoli under different cooking conditions. Biosci. Horiz. 2012, 5, hzs004. [Google Scholar] [CrossRef] [Green Version]
- Golder, C.; Weemhoff, J.L.; Jewell, D.E. Cats have increased protein digestibility as compared to dogs and improve their ability to absorb protein as dietary protein intake shifts from animal to plant sources. Animals 2020, 10, 541. [Google Scholar] [CrossRef] [Green Version]
- Jarett, J.K.; Kingsbury, D.D.; Dahlhausen, K.E.; Ganz, H.H. Best practices for microbiome study design in companion animal research. Front. Vet. Sci. 2021, 8, 644836. [Google Scholar] [CrossRef]
- Sibbald, B.; Roberts, C. Understanding controlled trials. Crossover trials. BMJ 1998, 316, 1719. [Google Scholar] [CrossRef]
- Hall, J.A.; Melendez, L.D.; Jewell, D.E. Using gross energy improves metabolizable energy predictive equations for pet foods whereas undigested protein and fiber content predict stool quality. PLoS ONE 2013, 8, e54405. [Google Scholar] [CrossRef] [Green Version]
- Hall, J.A.; Jewell, D.E.; Ephraim, E. Changes in the fecal metabolome are associated with feeding fiber not health status in cats with chronic kidney disease. Metabolites 2020, 10, 281. [Google Scholar] [CrossRef]
- Jackson, M.I.; Jewell, D.E. Balance of saccharolysis and proteolysis underpins improvements in stool quality induced by adding a fiber bundle containing bound polyphenols to either hydrolyzed meat or grain-rich foods. Gut Microbes 2019, 10, 298–320. [Google Scholar] [CrossRef] [PubMed] [Green Version]
- Hall, J.A.; Jackson, M.I.; Jewell, D.E.; Ephraim, E. Chronic kidney disease in cats alters response of the plasma metabolome and fecal microbiome to dietary fiber. PLoS ONE 2020, 15, e0235480. [Google Scholar] [CrossRef]
- Jackson, M.I.; Waldy, C.; Jewell, D.E. Dietary resistant starch preserved through mild extrusion of grain alters fecal microbiome metabolism of dietary macronutrients while increasing immunoglobulin A in the cat. PLoS ONE 2020, 15, e0241037. [Google Scholar] [CrossRef]
- Teshima, E.; Brunetto, M.A.; Vasconcellos, R.S.; Goncalves, K.N.; De-Oliveira, L.D.; Valerio, A.G.; Carciofi, A.C. Nutrient digestibility, but not mineral absorption, is age-dependent in cats. J. Anim. Physiol. Anim. Nutr. 2010, 94, e251–e258. [Google Scholar] [CrossRef] [PubMed]
- Hall, J.A.; Yerramilli, M.; Obare, E.; Yerramilli, M.; Yu, S.; Jewell, D.E. Comparison of serum concentrations of symmetric dimethylarginine and creatinine as kidney function biomarkers in healthy geriatric cats fed reduced protein foods enriched with fish oil, L-carnitine, and medium-chain triglycerides. Vet. J. 2014, 202, 588–596. [Google Scholar] [CrossRef] [PubMed]
- Vlassara, H.; Torreggiani, M.; Post, J.B.; Zheng, F.; Uribarri, J.; Striker, G.E. Role of oxidants/inflammation in declining renal function in chronic kidney disease and normal aging. Kidney Int. Suppl. 2009, 76, S3–S11. [Google Scholar] [CrossRef] [Green Version]
- Leong, S.C.; Sirich, T.L. Indoxyl sulfate-review of toxicity and therapeutic strategies. Toxins 2016, 8, 358. [Google Scholar] [CrossRef]
- Barrios, C.; Beaumont, M.; Pallister, T.; Villar, J.; Goodrich, J.K.; Clark, A.; Pascual, J.; Ley, R.E.; Spector, T.D.; Bell, J.T.; et al. Gut-microbiota-metabolite axis in early renal function decline. PLoS ONE 2015, 10, e0134311. [Google Scholar] [CrossRef] [Green Version]
- Panickar, K.S.; Jewell, D.E. The benefit of anti-inflammatory and renal-protective dietary ingredients on the biological processes of aging in the kidney. Biology 2018, 7, 45. [Google Scholar] [CrossRef] [PubMed] [Green Version]
- Summers, S.C.; Quimby, J.M.; Isaiah, A.; Suchodolski, J.S.; Lunghofer, P.J.; Gustafson, D.L. The fecal microbiome and serum concentrations of indoxyl sulfate and p-cresol sulfate in cats with chronic kidney disease. J. Vet. Intern. Med. 2019, 33, 662–669. [Google Scholar] [CrossRef] [PubMed]
- Mair, R.D.; Sirich, T.L.; Plummer, N.S.; Meyer, T.W. Characteristics of colon-derived uremic solutes. Clin. J. Am. Soc. Nephrol. 2018, 13, 1398–1404. [Google Scholar] [CrossRef] [PubMed] [Green Version]
- Ziese, A.L.; Suchodolski, J.S. Impact of changes in gastrointestinal microbiota in canine and feline digestive diseases. Vet. Clin. N. Am. Small Anim. Pract. 2021, 51, 155–169. [Google Scholar] [CrossRef] [PubMed]
- Brooks, D.P.; Rhodes, G.R.; Woodward, P.; Boppana, V.K.; Mallon, F.M.; Griffin, H.E.; Kinter, L.B. Production of methylguanidine in dogs with acute and chronic renal failure. Clin. Sci. 1989, 77, 637–641. [Google Scholar] [CrossRef]
- Sekula, P.; Goek, O.N.; Quaye, L.; Barrios, C.; Levey, A.S.; Römisch-Margl, W.; Menni, C.; Yet, I.; Gieger, C.; Inker, L.A.; et al. A metabolome-wide association study of kidney function and disease in the general population. J. Am. Soc. Nephrol. 2016, 27, 1175–1188. [Google Scholar] [CrossRef]
- Szewczyk, K.; Chojnacka, A.; Gornicka, M. Tocopherols and tocotrienols-bioactive dietary compounds; what is certain, what is doubt? Int. J. Mol. Sci. 2021, 22, 6222. [Google Scholar] [CrossRef]
- Karamouzis, I.; Sarafidis, P.A.; Karamouzis, M.; Iliadis, S.; Haidich, A.B.; Sioulis, A.; Triantos, A.; Vavatsi-Christaki, N.; Grekas, D.M. Increase in oxidative stress but not in antioxidant capacity with advancing stages of chronic kidney disease. Am. J. Nephrol. 2008, 28, 397–404. [Google Scholar] [CrossRef]
- Zhang, J.; Luo, D.; Lin, Z.; Zhou, W.; Rao, J.; Li, Y.; Wu, J.; Peng, H.; Lou, T. Dysbiosis of gut microbiota in adult idiopathic membranous nephropathy with nephrotic syndrome. Microb. Pathog. 2020, 147, 104359. [Google Scholar] [CrossRef] [PubMed]
- Vaziri, N.D.; Wong, J.; Pahl, M.; Piceno, Y.M.; Yuan, J.; DeSantis, T.Z.; Ni, Z.; Nguyen, T.H.; Andersen, G.L. Chronic kidney disease alters intestinal microbial flora. Kidney Int. 2013, 83, 308–315. [Google Scholar] [CrossRef] [Green Version]
- Wong, J.; Piceno, Y.M.; DeSantis, T.Z.; Pahl, M.; Andersen, G.L.; Vaziri, N.D. Expansion of urease- and uricase-containing, indole- and p-cresol-forming and contraction of short-chain fatty acid-producing intestinal microbiota in ESRD. Am. J. Nephrol. 2014, 39, 230–237. [Google Scholar] [CrossRef] [Green Version]
- Wu, I.W.; Lin, C.Y.; Chang, L.C.; Lee, C.C.; Chiu, C.Y.; Hsu, H.J.; Sun, C.Y.; Chen, Y.C.; Kuo, Y.L.; Yang, C.W.; et al. Gut microbiota as diagnostic tools for mirroring disease progression and circulating nephrotoxin levels in chronic kidney disease: Discovery and validation study. Int. J. Biol. Sci. 2020, 16, 420–434. [Google Scholar] [CrossRef] [PubMed] [Green Version]
- Jiang, S.; Xie, S.; Lv, D.; Wang, P.; He, H.; Zhang, T.; Zhou, Y.; Lin, Q.; Zhou, H.; Jiang, J.; et al. Alteration of the gut microbiota in Chinese population with chronic kidney disease. Sci. Rep. 2017, 7, 2870. [Google Scholar] [CrossRef] [Green Version]
- Lee, T.H.; Park, D.; Kim, Y.J.; Lee, I.; Kim, S.; Oh, C.T.; Kim, J.Y.; Yang, J.; Jo, S.K. Lactobacillus salivarius BP121 prevents cisplatin-induced acute kidney injury by inhibition of uremic toxins such as indoxyl sulfate and p-cresol sulfate via alleviating dysbiosis. Int. J. Mol. Med. 2020, 45, 1130–1140. [Google Scholar] [CrossRef] [Green Version]
- Huang, H.; Li, K.; Lee, Y.; Chen, M. Preventive effects of Lactobacillus mixture against chronic kidney disease progression through enhancement of beneficial bacteria and downregulation of gut-derived uremic toxins. J. Agric. Food Chem. 2021, 69, 7353–7366. [Google Scholar] [CrossRef]
- Eidi, F.; Poor-Reza Gholi, F.; Ostadrahimi, A.; Dalili, N.; Samadian, F.; Barzegari, A. Effect of Lactobacillus rhamnosus on serum uremic toxins (phenol and p-Cresol) in hemodialysis patients: A double blind randomized clinical trial. Clin. Nutr. ESPEN 2018, 28, 158–164. [Google Scholar] [CrossRef] [PubMed]
- Li, F.; Wang, M.; Wang, J.; Li, R.; Zhang, Y. Alterations to the gut microbiota and their correlation with inflammatory factors in chronic kidney disease. Front. Cell. Infect. Microbiol. 2019, 9, 206. [Google Scholar] [CrossRef] [Green Version]
- Stanford, J.; Charlton, K.; Stefoska-Needham, A.; Ibrahim, R.; Lambert, K. The gut microbiota profile of adults with kidney disease and kidney stones: A systematic review of the literature. BMC Nephrol. 2020, 21, 215. [Google Scholar] [CrossRef] [PubMed]
- Sharma, C.; Kaur, A.; Thind, S.S.; Singh, B.; Raina, S. Advanced glycation end-products (AGEs): An emerging concern for processed food industries. J. Food Sci. Technol. 2015, 52, 7561–7576. [Google Scholar] [CrossRef] [Green Version]
- Dozio, E.; Vettoretti, S.; Lungarella, G.; Messa, P.; Corsi Romanelli, M.M. Sarcopenia in chronic kidney disease: Focus on advanced glycation end products as mediators and markers of oxidative stress. Biomedicines 2021, 9, 405. [Google Scholar] [CrossRef]
- Nallu, A.; Sharma, S.; Ramezani, A.; Muralidharan, J.; Raj, D. Gut microbiome in chronic kidney disease: Challenges and opportunities. Transl. Res. 2017, 179, 24–37. [Google Scholar] [CrossRef] [Green Version]
- Ephraim, E.; Jewell, D.E. High protein consumption with controlled phosphorus level increases plasma concentrations of uremic toxins in cats with early chronic kidney disease. J. Food Sci. Nutr. 2021, 7, 096. [Google Scholar] [CrossRef]
- Gryp, T.; Vanholder, R.; Vaneechoutte, M.; Glorieux, G. p-Cresyl Sulfate. Toxins 2017, 9, 52. [Google Scholar] [CrossRef] [PubMed] [Green Version]
- Donohoe, D.R.; Garge, N.; Zhang, X.; Sun, W.; O’Connell, T.M.; Bunger, M.K.; Bultman, S.J. The microbiome and butyrate regulate energy metabolism and autophagy in the mammalian colon. Cell Metab. 2011, 13, 517–526. [Google Scholar] [CrossRef] [Green Version]
- Diao, H.; Jiao, A.R.; Yu, B.; Mao, X.B.; Chen, D.W. Gastric infusion of short-chain fatty acids can improve intestinal barrier function in weaned piglets. Genes Nutr. 2019, 14, 4. [Google Scholar] [CrossRef] [PubMed]
- Chen, T.; Kim, C.Y.; Kaur, A.; Lamothe, L.; Shaikh, M.; Keshavarzian, A.; Hamaker, B.R. Dietary fibre-based SCFA mixtures promote both protection and repair of intestinal epithelial barrier function in a Caco-2 cell model. Food Funct. 2017, 8, 1166–1173. [Google Scholar] [CrossRef]
- Koh, A.; De Vadder, F.; Kovatcheva-Datchary, P.; Bäckhed, F. From dietary fiber to host physiology: Short-chain fatty acids as key bacterial metabolites. Cell 2016, 165, 1332–1345. [Google Scholar] [CrossRef] [Green Version]
- Summers, S.; Quimby, J.M.; Phillips, R.K.; Stockman, J.; Isaiah, A.; Lidbury, J.A.; Steiner, J.M.; Suchodolski, J. Preliminary evaluation of fecal fatty acid concentrations in cats with chronic kidney disease and correlation with indoxyl sulfate and p-cresol sulfate. J. Vet. Intern. Med. 2020, 34, 206–215. [Google Scholar] [CrossRef]
- Ndrepepa, G.; Kastrati, A. Gamma-glutamyl transferase and cardiovascular disease. Ann. Transl. Med. 2016, 4, 481. [Google Scholar] [CrossRef]
- Rampelli, S.; Candela, M.; Turroni, S.; Biagi, E.; Collino, S.; Franceschi, C.; O’Toole, P.W.; Brigidi, P. Functional metagenomic profiling of intestinal microbiome in extreme ageing. Aging 2013, 5, 902–912. [Google Scholar] [CrossRef] [Green Version]
- Kato, K.; Odamaki, T.; Mitsuyama, E.; Sugahara, H.; Xiao, J.Z.; Osawa, R. Age-related changes in the composition of gut Bifidobacterium species. Curr. Microbiol. 2017, 74, 987–995. [Google Scholar] [CrossRef]
- La-Ongkham, O.; Nakphaichit, M.; Nakayama, J.; Keawsompong, S.; Nitisinprasert, S. Age-related changes in the gut microbiota and the core gut microbiome of healthy Thai humans. 3 Biotech 2020, 10, 276. [Google Scholar] [CrossRef]
- Hor, Y.Y.; Ooi, C.H.; Khoo, B.Y.; Choi, S.B.; Seeni, A.; Shamsuddin, S.; Oon, C.E.; Ong, K.L.; Jeong, W.S.; Liong, M.T. Lactobacillus strains alleviated aging symptoms and aging-induced metabolic disorders in aged rats. J. Med. Food 2019, 22, 1–13. [Google Scholar] [CrossRef] [PubMed]
- Bajaj, J.S.; Ahluwalia, V.; Steinberg, J.L.; Hobgood, S.; Boling, P.A.; Godschalk, M.; Habib, S.; White, M.B.; Fagan, A.; Gavis, E.A.; et al. Elderly patients have an altered gut-brain axis regardless of the presence of cirrhosis. Sci. Rep. 2016, 6, 38481. [Google Scholar] [CrossRef] [PubMed]
- Ling, Y.; Gong, T.; Zhang, J.; Gu, Q.; Gao, X.; Weng, X.; Liu, J.; Sun, J. Gut microbiome signatures are biomarkers for cognitive impairment in patients with ischemic stroke. Front. Aging Neurosci. 2020, 12, 511562. [Google Scholar] [CrossRef] [PubMed]
- Scott, K.A.; Ida, M.; Peterson, V.L.; Prenderville, J.A.; Moloney, G.M.; Izumo, T.; Murphy, K.; Murphy, A.; Ross, R.P.; Stanton, C.; et al. Revisiting Metchnikoff: Age-related alterations in microbiota-gut-brain axis in the mouse. Brain Behav. Immun. 2017, 65, 20–32. [Google Scholar] [CrossRef] [PubMed]
- Essa, M.M.; Subash, S.; Braidy, N.; Al-Adawi, S.; Lim, C.K.; Manivasagam, T.; Guillemin, G.J. Role of NAD+, oxidative stress, and tryptophan metabolism in autism spectrum disorders. Int. J. Tryptophan Res. 2013, 6, 15–28. [Google Scholar] [CrossRef]
- Kitahara, M.; Takamine, F.; Imamura, T.; Benno, Y. Clostridium hiranonis sp. nov., a human intestinal bacterium with bile acid 7alpha-dehydroxylating activity. Int. J. Syst. Evol. Microbiol. 2001, 51, 39–44. [Google Scholar] [CrossRef] [Green Version]
- Ocvirk, S.; O’Keefe, S.J. Influence of bile acids on colorectal cancer risk: Potential mechanisms mediated by diet—gut microbiota interactions. Curr. Nutr. Rep. 2017, 6, 315–322. [Google Scholar] [CrossRef] [PubMed]
- Sorg, J.A.; Sonenshein, A.L. Bile salts and glycine as cogerminants for Clostridium difficile spores. J. Bacteriol. 2008, 190, 2505–2512. [Google Scholar] [CrossRef] [Green Version]
- Theriot, C.M.; Bowman, A.A.; Young, V.B. Antibiotic-induced alterations of the gut microbiota alter secondary bile acid production and allow for Clostridium difficile spore germination and outgrowth in the large intestine. mSphere 2016, 1, e00045-15. [Google Scholar] [CrossRef] [Green Version]
- Wang, S.; Martins, R.; Sullivan, M.C.; Friedman, E.S.; Misic, A.M.; El-Fahmawi, A.; De Martinis, E.C.P.; O’Brien, K.; Chen, Y.; Bradley, C.; et al. Diet-induced remission in chronic enteropathy is associated with altered microbial community structure and synthesis of secondary bile acids. Microbiome 2019, 7, 126. [Google Scholar] [CrossRef] [PubMed] [Green Version]
- Maruo, T.; Sakamoto, M.; Ito, C.; Toda, T.; Benno, Y. Adlercreutzia equolifaciens gen. nov., sp. nov., an equol-producing bacterium isolated from human faeces, and emended description of the genus Eggerthella. Int. J. Syst. Evol. Microbiol. 2008, 58, 1221–1227. [Google Scholar] [CrossRef] [PubMed]
- He, H.; Lin, M.; You, L.; Chen, T.; Liang, Z.; Li, D.; Xie, C.; Xiao, G.; Ye, P.; Kong, Y.; et al. Gut microbiota profile in adult patients with idiopathic nephrotic syndrome. Biomed. Res. Int. 2021, 2021, 8854969. [Google Scholar] [CrossRef] [PubMed]
- Tavella, T.; Rampelli, S.; Guidarelli, G.; Bazzocchi, A.; Gasperini, C.; Pujos-Guillot, E.; Comte, B.; Barone, M.; Biagi, E.; Candela, M.; et al. Elevated gut microbiome abundance of Christensenellaceae, Porphyromonadaceae and Rikenellaceae is associated with reduced visceral adipose tissue and healthier metabolic profile in Italian elderly. Gut Microbes 2021, 13, 1–19. [Google Scholar] [CrossRef] [PubMed]
Figure 1.
Study design in which cats consumed the washout, control, and test foods.

Figure 2.
Relative abundance (center log-ratio) of the difference between feces from the test and control food groups in operational taxonomic units (OTU) that were significantly different. OTU number, family, and genus are shown with species where available. Black, phylum Proteobacteria; gray, phylum Actinobacteria; white, phylum Firmicutes; striped, phylum Bacteroidetes.


Table 1.
Proximate analysis of foods used in this study.
| Analyte (%) | Control Food | Test Food |
|---|---|---|
| Ash | 4.66 | 5.18 |
| Crude fat | 19.08 | 16.80 |
| Crude fiber | 1.40 | 1.30 |
| Crude protein | 32.71 | 31.18 |
| Moisture | 6.43 | 5.17 |
| Omega-3, sum | 1.05 | 0.44 |
| Omega-6, sum | 3.64 | 3.82 |
Table 2.
Digestibility analyses.
| Control Food | Test Food | |
|---|---|---|
| Apparent dry matter digestibility | 84.1 | 85.6 |
| Apparent protein digestibility | 85.2 | 88.5 |
| True protein digestibility | 91.8 | 95.8 |
| Apparent fat digestibility | 93.1 | 92.2 |
| Apparent fiber digestibility | 31.2 | 15.5 |
| Apparent carbohydrate digestibility | 88.0 | 88.0 |
| Apparent vital nutrient digestibility | 90.4 | 91.4 |
| Apparent energy digestibility | 86.6 | 87.9 |
| Gross energy, kcal/kg | 5129 | 5088 |
| Digestible energy, kcal/kg | 4442 | 4471 |
| Metabolizable energy, kcal/kg | 4207 | 4236 |
| Neutral detergent fiber calories | 31.8 | 35.4 |
| Protein calories | 29.6 | 29.1 |
| Fat calories | 38.6 | 35.5 |
Data are presented as mean percentage unless otherwise indicated.
Table 3.
Body weight, intake, and stool score.
| Mean Difference | ||||||
|---|---|---|---|---|---|---|
| Baseline | Control Food | Test Food | Control Food−Baseline | Test Food−Baseline | Test Food−Control Food | |
| Body weight, kg | 4.40 ± 0.12 | 4.57 ± 0.13 | 4.59 ± 0.13 | 0.13 ± 0.04 p = 0.001 | 0.16 ± 0.03 p < 0.001 | 0.02 ± 0.04 p = 0.600 |
| Average daily intake, g | 49.3 ± 2.17 | 51.5 ± 1.98 | 59.4 ± 2.6 | 2.18 ± 0.9 p = 0.02 | 10.1 ± 1.1 p = 0.001 | 7.9 ± 1.2 p < 0.001 |
| Average stool score | 4.9 ± 0.04 | 4.9 ± 0.04 | 4.6 ± 0.12 | 0 ± 0.06 p = 0.500 | −0.33 ± 0.11 p = 0.006 | −0.33 ± 0.13 p = 0.010 |
Data are presented as mean ± standard error for all 40 cats. Stool was scored on a 1–5 scale.
Table 4.
Blood chemistry parameters.
| Control Food | Test Food | p Value | |
|---|---|---|---|
| Creatinine, mg/dL | 1.22 | 1.15 | <0.001 |
| BUN, mg/dL | 25.44 | 23.92 | <0.001 |
| Albumin, g/dL | 2.98 | 3.05 | 0.060 |
| Total protein, g/dL | 7.18 | 7.31 | 0.190 |
BUN, blood urea nitrogen.
Table 5.
Plasma metabolites of interest following consumption of study foods by senior cats.
| Plasma Metabolite | Control Food–Test Food | p Value |
|---|---|---|
| Amino acid metabolism | ||
| Creatinine metabolism | ||
| guanidinoacetate | 0.43 ± 0.07 | <0.001 |
| Dipeptide derivative | ||
| N-acetylcarnosine | 0.25 ± 0.07 | 0.001 |
| Gamma-glutamyl amino acid | ||
| gamma-glutamylglutamine | 0.11 ± 0.02 | <0.001 |
| gamma-glutamylglycine | 0.22 ± 0.03 | <0.001 |
| gamma-glutamylleucine | 0.17 ± 0.03 | <0.001 |
| gamma-glutamylmethionine | 0.19 ± 0.04 | <0.001 |
| gamma-glutamylvaline | 0.12 ± 0.03 | <0.001 |
| Guanidino and acetamido metabolism | ||
| 1-methylguanidine | 0.25 ± 0.07 | 0.001 |
| Leucine, isoleucine, and valine metabolism | ||
| alpha-hydroxyisovalerate | 0.10 ± 0.03 | <0.001 |
| Methionine, cysteine, SAM, taurine metabolism | ||
| S-methylcysteine sulfoxide | 0.17 ± 0.2 | <0.001 |
| Tryptophan metabolism | ||
| 3-indoxyl sulfate | 0.84 ± 0.17 | <0.001 |
| 5-hydroxyindole sulfate | 0.82 ± 0.21 | <0.001 |
| 6-hydroxyindole sulfate | 0.92 ± 0.19 | <0.001 |
| Tyrosine metabolism | ||
| dopamine-3-O-sulfate | 0.19 ± 0.06 | 0.001 |
| 3-hydroxyphenylacetate sulfate | 0.48 ± 0.14 | 0.001 |
| Urea cycle; arginine and proline metabolism | ||
| citrulline | 0.13 ± 0.04 | 0.001 |
| dimethylarginine (sdma + adma) | 0.07 ± 0.02 | <0.001 |
| urea | 0.08 ± 0.02 | 0.001 |
| Carbohydrate metabolism | ||
| Aminosugar metabolism | ||
| erythronate | 0.11 ± 0.03 | <0.001 |
| Glycolysis, gluconeogenesis, and pyruvate metabolism | ||
| 1,5-anhydroglucitol | 0.24 ± 0.06 | 0.001 |
| glycerate | 0.12 ± 0.03 | <0.001 |
| Pentose metabolism | ||
| arabitol/xylitol | 0.21 ± 0.05 | <0.001 |
| Cofactors and vitamins | ||
| Nicotinate and nicotinamide metabolism | ||
| nicotinate ribonucleoside | −1.27 ± 0.12 | <0.001 |
| trigonelline (N’-methylnicotinate) | −1.95 ± 0.02 | <0.001 |
| Tocopherol metabolism | ||
| alpha-CEHC sulfate | −0.44 ± 0.08 | <0.001 |
| gamma-tocopherol/beta-tocopherol | −0.66 ± 0.05 | <0.001 |
| Lipid metabolism | ||
| Secondary bile salt metabolism | ||
| taurolithocholate-3-sulfate | 0.50 ± 0.08 | <0.001 |
| ursocholate | −1.03 ± 0.22 | <0.001 |
| Xenobiotics | ||
| Benzoate metabolism | ||
| 3-hydroxyhippurate | 0.58 ± 0.16 | 0.001 |
| 3-phenylpropionate (hydrocinnamate) | 0.97 ± 0.21 | <0.001 |
| 4-ethylphenyl sulfate | 1.51 ± 0.18 | <0.001 |
| phenylpropionylglycine | 1.10 ± 0.24 | <0.001 |
| Food component/plant | ||
| 2-oxindole-3-acetate | 0.58 ± 0.17 | 0.001 |
| indolin-2-one | 0.70 ± 0.17 | <0.001 |
| pyrraline | 0.32 ± 0.09 | 0.001 |
Values are the mean of the difference of the control and test foods ± standard error. ADMA, asymmetric dimethylarginine; CEHC, 2-(β-carboxyethyl)-6-hydroxychroman; SAM, S-adenosyl methionine; SDMA, symmetric dimethylarginine.
Table 6.
Fecal metabolites of interest following consumption of study foods by senior cats.
| Fecal Metabolite | Control Food–Test Food | p Value |
|---|---|---|
| Amino acid metabolism | ||
| Alanine and aspartate metabolism | ||
| N-methylalanine | 0.73 ± 0.12 | <0.001 |
| N-propionylalanine | 0.76 ± 0.10 | <0.001 |
| propionylglutamine | 0.92 ± 0.13 | <0.001 |
| Dipeptide | ||
| glycylisoleucine | 0.79 ± 0.13 | <0.001 |
| glycylleucine | 0.51 ± 0.10 | <0.001 |
| glycylvaline | 0.65 ± 0.11 | <0.001 |
| isoleucylglycine | 0.97 ± 0.18 | <0.001 |
| leucylglycine | 1.00 ± 0.20 | <0.001 |
| threonylphenylalanine | 0.95 ± 0.20 | <0.001 |
| valylleucine | 1.04 ± 0.20 | <0.001 |
| Gamma-glutamyl amino acid | ||
| gamma-glutamylleucine | 0.78 ± 0.15 | <0.001 |
| Glutamate metabolism | ||
| carboxyethyl-GABA | 0.89 ± 0.03 | <0.001 |
| propionylglycine | 0.78 ± 0.17 | <0.001 |
| Histidine metabolism | ||
| cis-urocanate | 0.85 ± 0.16 | <0.001 |
| trans-urocanate | 0.95 ± 0.18 | <0.001 |
| Leucine, isoleucine, and valine metabolism | ||
| 3-methylglutaconate | 0.36 ± 0.07 | < 0.001 |
| Lysine metabolism | ||
| N,N,N-trimethyl-5-aminovalerate | 0.40 ± 0.07 | <0.001 |
| Polyamine metabolism | ||
| N-acetyl-isoputreanine | 0.61 ± 0.05 | <0.001 |
| spermidine | 1.20 ± 0.15 | <0.001 |
| Tryptophan metabolism | ||
| indolelactate | −0.91 ± 0.17 | <0.001 |
| serotonin | 0.58 ± 0.09 | <0.001 |
| tryptamine | 0.74 ± 0.12 | <0.001 |
| tryptophan betaine | 0.68 ± 0.13 | <0.001 |
| Carbohydrate metabolism | ||
| Aminosugar metabolism | ||
| erythronate | −0.79 ± 0.15 | <0.001 |
| glucuronate | −0.62 ± 0.12 | <0.001 |
| N-acetylglucosaminylasparagine | −1.27 ± 0.24 | <0.001 |
| Disaccharides and oligosaccharides | ||
| Lactose | −1.35 ± 0.26 | <0.001 |
| Fructose, mannose, and galactose metabolism | ||
| galactonate | −1.47 ± 0.23 | <0.001 |
| mannitol/sorbitol | −1.90 ± 0.34 | <0.001 |
| Glycogen metabolism | ||
| maltol | −2.10 ± 0.15 | <0.001 |
| maltose | −1.05 ± 0.19 | <0.001 |
| maltotetraose | −1.71 ± 0.28 | <0.001 |
| maltotriose | −1.14 ± 0.20 | <0.001 |
| Glycolysis, gluconeogenesis, and pyruvate metabolism | ||
| glucose | −0.71 ± 0.10 | <0.001 |
| lactate | −1.24 ± 0.25 | <0.001 |
| Pentose metabolism | ||
| arabitol/xylitol | −1.21 ± 0.25 | <0.001 |
| arabinose | −1.20 ± 0.15 | <0.001 |
| arabonate/xylonate | −1.11 ± 0.24 | <0.001 |
| ribonate (ribonolactone) | −1.11 ± 0.19 | <0.001 |
| ribulose/xylulose | −1.10 ± 0.17 | <0.001 |
| sedoheptulose | −0.43 ± 0.09 | <0.001 |
| xylose | 2.18 ± 0.13 | <0.001 |
| Cofactors and vitamins | ||
| Ascorbate and aldarate metabolism | ||
| threonate | −1.26 ± 0.17 | <0.001 |
| Nicotinate and nicotinamide metabolism | ||
| NAD+ | −1.27 ± 0.23 | <0.001 |
| nicotinate | 0.32 ± 0.07 | 0.020 |
| NaMN | −0.57 ± 0.12 | <0.001 |
| trigonelline (N’-methylnicotinate) | −0.90 ± 0.10 | <0.001 |
| Riboflavin metabolism | ||
| flavin adenine dinucleotide (FAD) | −0.57 ± 0.11 | <0.001 |
| riboflavin (vitamin B2) | −1.03 ± 0.09 | <0.001 |
| Thiamine metabolism | ||
| hydroxymethylpyrimidine | −0.65 ± 0.10 | <0.001 |
| thiamin (vitamin b1) | −0.44 ± 0.06 | <0.001 |
| thiamin monophosphate | −0.96 ± 0.13 | <0.001 |
| Tocopherol metabolism | ||
| alpha-CEHC sulfate | −1.68 ± 0.31 | <0.001 |
| alpha-tocotrienol | −0.34 ± 0.05 | <0.001 |
| delta-tocopherol | −0.22 ± 0.03 | <0.001 |
| gamma-CEHC sulfate | −1.87 ± 0.24 | <0.001 |
| gamma-tocopherol/beta-tocopherol | −0.69 ± 0.03 | <0.001 |
| Vitamin B6 metabolism | ||
| pyridoxate | −0.51 ± 0.04 | <0.001 |
| pyridoxine (vitamin b6) | −1.12 ± 0.16 | <0.001 |
| Lipid metabolism | ||
| Primary bile salt metabolism | ||
| cholate | −0.77 ± 0.16 | <0.001 |
| Secondary bile salt metabolism | ||
| 7-alpha-hydroxycholestenone | 1.05 ± 0.06 | <0.001 |
| dehydrolithocholate | 1.95 ± 0.23 | <0.001 |
| deoxycholate | 1.06 ± 0.14 | <0.001 |
| isoursodeoxycholate | 0.83 ± 0.10 | <0.001 |
| lithocholate | 1.76 ± 0.17 | <0.001 |
| ursodeoxycholate | 0.78 ± 0.13 | <0.001 |
| Xenobiotics | ||
| Food component/plant | ||
| 2-oxindole-3-acetate | 0.38 ± 0.06 | <0.001 |
| indolin-2-one | 1.70 ± 0.24 | <0.001 |
| pyrraline | 0.47 ± 0.09 | <0.001 |
Values are the mean of the difference of the control and test foods ± standard error. CEHC, 2-(β-carboxyethyl)-6-hydroxychroman; FAD, flavin adenine dinucleotide; GABA, gamma aminobutyric acid; NAD, nicotinamide adenine dinucleotide; NaMN, nicotinic acid mononucleotide.
Table 7.
Fecal short-chain fatty acids following consumption of the study foods.
| Control Food | Test Food | p Value | |
|---|---|---|---|
| Short-chain fatty acids, ppm | |||
| Acetic acid | 3646.7 | 3889.5 | 0.410 |
| Butyric acid | 2641.8 | 4807.8 | <0.001 |
| Propionic acid | 1529.7 | 850.7 | <0.001 |
| Branched-chain fatty acids, ppm | |||
| Isobutryic acid | 214.6 | 147.5 | <0.001 |
| Isovaleric acid | 300.9 | 212.2 | <0.001 |
ppm, parts per million.
Table 8.
Correlations between plasma indoles and OTUs.
| Estimate ± SE | p Value | r2 | |
|---|---|---|---|
| 2-oxindole-3-acetate | |||
| 1084643 Mogibacteriaceae Mogibacterium | 0.93 ± 0.29 | 0.002 | 0.14 |
| 839684 Lachnospiraceae unclassified | 0.90 ± 0.27 | 0.001 | 0.15 |
| 100212 Veillonellaceae | 0.79 ± 0.26 | 0.003 | 0.13 |
| 4384058 Enterobacteriaceae Salmonella | 0.75 ± 0.25 | 0.004 | 0.12 |
| 193279 Coriobacteriaceae Adlercreutzia | 0.72 ± 0.25 | 0.006 | 0.11 |
| 266392 Lachnospiraceae Coprococcus | 0.68 ± 0.25 | 0.008 | 0.10 |
| 100027 Enterobacteriaceae | 0.47 ± 0.19 | 0.019 | 0.08 |
| 356403 Clostridiaceae Clostridium hiranonis | 0.44 ± 0.18 | 0.020 | 0.08 |
| 100001 unclassified | −0.26 ± 0.11 | 0.026 | 0.07 |
| 3-indoxyl sulfate | |||
| 193279 Coriobacteriaceae Adlercreutzia | 0.94 ± 0.18 | <0.001 | 0.29 |
| 266392 Lachnospiraceae Coprococcus | 0.87 ± 0.18 | <0.001 | 0.26 |
| 4384058 Enterobacteriaceae Salmonella | 0.66 ± 0.20 | 0.002 | 0.14 |
| 1084643 Mogibacteriaceae Mogibacterium | 0.52 ± 0.24 | 0.036 | 0.07 |
| 1000148 Comamonadaceae unclassified | 0.46 ± 0.15 | 0.004 | 0.12 |
| 356403 Clostridiaceae Clostridium hiranonis | 0.44 ± 0.14 | 0.004 | 0.12 |
| 4319416 Bartonellaceae Bartonella unclassified | −0.25 ± 0.12 | 0.035 | 0.07 |
| 100001 unclassified | −0.25 ± 0.09 | 0.007 | 0.11 |
| 128382 Veillonellaceae Dialister | −0.46 ± 0.15 | 0.004 | 0.12 |
| 4441081 Coriobacteriaceae unclassified | −0.47 ± 0.14 | 0.001 | 0.16 |
| 52166 Veillonellaceae Megasphaera | −0.53 ± 0.16 | 0.001 | 0.15 |
| 652696 Bifidobacteriaceae Bifidobacterium adolescentis | −0.58 ± 0.23 | 0.014 | 0.09 |
| 5-hydroxyindole sulfate | |||
| 193279 Coriobacteriaceae Adlercreutzia | 0.71 ± 0.16 | <0.001 | 0.24 |
| 266392 Lachnospiraceae Coprococcus | 0.68 ± 0.15 | <0.001 | 0.24 |
| 4384058 Enterobacteriaceae Salmonella | 0.51 ± 0.17 | 0.003 | 0.12 |
| 1000148 Comamonadaceae unclassified | 0.36 ± 0.13 | 0.005 | 0.11 |
| 356403 Clostridiaceae Clostridium hiranonis | 0.29 ± 0.12 | 0.021 | 0.08 |
| 100001 unclassified | −0.19 ± 0.07 | 0.011 | 0.10 |
| 4319416 Bartonellaceae Bartonella unclassified | −0.24 ± 0.09 | 0.014 | 0.09 |
| 4441081 Coriobacteriaceae unclassified | −0.40 ± 0.11 | 0.001 | 0.16 |
| 128382 Veillonellaceae Dialister | −0.41 ± 0.12 | 0.001 | 0.15 |
| 52166 Veillonellaceae Megasphaera | −0.43 ± 0.13 | 0.002 | 0.14 |
| 652696 Bifidobacteriaceae Bifidobacterium adolescentis | −0.50 ± 0.19 | 0.010 | 0.10 |
| 6-hydroxyindole sulfate | |||
| 193279 Coriobacteriaceae Adlercreutzia | 0.77 ± 0.16 | <0.001 | 0.28 |
| 266392 Lachnospiraceae Coprococcus | 0.76 ± 0.15 | <0.001 | 0.28 |
| 4384058 Enterobacteriaceae Salmonella | 0.56 ± 0.17 | 0.002 | 0.14 |
| 1084643 Mogibacteriaceae Mogibacterium | 0.46 ± 0.20 | 0.027 | 0.07 |
| 1000148 Comamonadaceae unclassified | 0.41 ± 0.13 | 0.002 | 0.14 |
| 356403 Clostridiaceae Clostridium hiranonis | 0.34 ± 0.12 | 0.006 | 0.11 |
| 100001 unclassified | −0.20 ± 0.08 | 0.011 | 0.10 |
| 4319416 Bartonellaceae Bartonella unclassified | −0.23 ± 0.10 | 0.021 | 0.08 |
| 4441081 Coriobacteriaceae unclassified | −0.41 ± 0.11 | 0.001 | 0.16 |
| 128382 Veillonellaceae Dialister | −0.42 ± 0.13 | 0.002 | 0.14 |
| 52166 Veillonellaceae Megasphaera | −0.43 ± 0.13 | 0.002 | 0.14 |
| 652696 Bifidobacteriaceae Bifidobacterium adolescentis | −0.51 ± 0.19 | 0.009 | 0.10 |
| Indolin-2-one | |||
| 193279 Coriobacteriaceae Adlercreutzia | 0.84 ± 0.23 | <0.001 | 0.17 |
| 266392 Lachnospiraceae Coprococcus | 0.80 ± 0.23 | 0.001 | 0.16 |
| 4384058 Enterobacteriaceae Salmonella | 0.68 ± 0.24 | 0.006 | 0.11 |
| 356403 Clostridiaceae Clostridium hiranonis | 0.51 ± 0.17 | 0.004 | 0.12 |
| 1000148 Comamonadaceae unclassified | 0.39 ± 0.18 | 0.034 | 0.07 |
| 100001 unclassified | −0.25 ± 0.10 | 0.019 | 0.08 |
| 4441081 Coriobacteriaceae unclassified | −0.53 ± 0.16 | 0.001 | 0.15 |
| 128382 Veillonellaceae Dialister | −0.55 ± 0.18 | 0.003 | 0.13 |
| 652696 Bifidobacteriaceae Bifidobacterium adolescentis | −0.56 ± 0.27 | 0.042 | 0.06 |
Operational taxonomic unit (OTU) number, family, and genus are shown; species are also shown when indicated. r2, square of Pearson’s correlation coefficient; SE, standard error.
Table 9.
Correlations between fecal metabolites and OTUs.
| Estimate ± SE | p Value | r2 | ||
|---|---|---|---|---|
| Indoles | ||||
| 2-oxindole-3-acetate | ||||
| 839684 Lachnospiraceae unclassified | 2.38 ± 0.68 | 0.001 | 0.16 | |
| 356403 Clostridiaceae Clostridium hiranonis | 2.37 ± 0.38 | <0.001 | 0.37 | |
| 4384058 Enterobacteriaceae Salmonella | 2.34 ± 0.62 | <0.001 | 0.18 | |
| 1084643 Mogibacteriaceae Mogibacterium | 2.32 ± 0.74 | 0.003 | 0.13 | |
| 100027 Enterobacteriaceae | 1.85 ± 0.46 | <0.001 | 0.20 | |
| 266392 Lachnospiraceae Coprococcus | 1.70 ± 0.63 | 0.009 | 0.10 | |
| 1000148 Comamonadaceae unclassified | 1.43 ± 0.48 | 0.004 | 0.12 | |
| 1758401 Clostridiaceae SMB53 | 1.30 ± 0.37 | 0.001 | 0.16 | |
| 100001 unclassified | −0.87 ± 0.28 | 0.002 | 0.14 | |
| 4441081 Coriobacteriaceae unclassified | −1.22 ± 0.44 | 0.007 | 0.11 | |
| 52166 Veillonellaceae Megasphaera | −1.41 ± 0.52 | 0.009 | 0.10 | |
| 128382 Veillonellaceae Dialister | −1.41 ± 0.48 | 0.005 | 0.12 | |
| 100100 Bacillaceae unclassified | −1.43 ± 0.49 | 0.004 | 0.12 | |
| Indolelactate | ||||
| 128382 Veillonellaceae Dialister | 0.55 ± 0.16 | 0.001 | 0.16 | |
| 1007180 Methylobacteriaceae Methylobacterium | 0.22 ± 0.07 | 0.003 | 0.13 | |
| 1074945 Propionibacteriaceae Propionibacterium granulosum | 0.22 ± 0.07 | 0.003 | 0.13 | |
| 2170756 Xanthomonadaceae Stenotrophomonas geniculata | 0.22 ± 0.07 | 0.003 | 0.13 | |
| 579304 Lactobacillaceae | 0.22 ± 0.07 | 0.003 | 0.13 | |
| 356403 Clostridiaceae Clostridium hiranonis | −0.41 ± 0.15 | 0.010 | 0.10 | |
| 1105591 Paraprevotellaceae Paraprevotella | −0.45 ± 0.13 | 0.001 | 0.15 | |
| 1000148 Comamonadaceae unclassified | −0.51 ± 0.16 | 0.002 | 0.14 | |
| 266392 Lachnospiraceae Coprococcus | −0.60 ± 0.21 | 0.006 | 0.11 | |
| 4384058 Enterobacteriaceae Salmonella | −0.64 ± 0.21 | 0.004 | 0.12 | |
| 839684 Lachnospiraceae unclassified | −0.69 ± 0.23 | 0.004 | 0.12 | |
| 193279 Coriobacteriaceae Adlercreutzia | −0.84 ± 0.20 | <0.001 | 0.21 | |
| 1084643 Mogibacteriaceae Mogibacterium | −0.90 ± 0.24 | <0.001 | 0.18 | |
| Indolin-2-one | ||||
| 1084643 Mogibacteriaceae Mogibacterium | 1.00 ± 0.16 | <0.001 | 0.39 | |
| 193279 Coriobacteriaceae Adlercreutzia | 0.99 ± 0.12 | <0.001 | 0.52 | |
| 4384058 Enterobacteriaceae Salmonella | 0.73 ± 0.15 | <0.001 | 0.28 | |
| 1000148 Comamonadaceae unclassified | 0.72 ± 0.09 | <0.001 | 0.48 | |
| 266392 Lachnospiraceae Coprococcus | 0.70 ± 0.14 | <0.001 | 0.27 | |
| 356403 Clostridiaceae Clostridium hiranonis | 0.52 ± 0.10 | <0.001 | 0.28 | |
| 839684 Lachnospiraceae unclassified | 0.47 ± 0.18 | 0.010 | 0.10 | |
| 1105591 Paraprevotellaceae Paraprevotella | 0.32 ± 0.10 | 0.002 | 0.14 | |
| 1000062 Porphyromonadaceae unclassified | 0.29 ± 0.10 | 0.004 | 0.12 | |
| 4473250 Paenibacillaceae Aneurinibacillus migulanus | −0.18 ± 0.06 | 0.004 | 0.12 | |
| 1007180 Methylobacteriaceae Methylobacterium | −0.21 ± 0.05 | <0.001 | 0.22 | |
| 1074945 Propionibacteriaceae Propionibacterium granulosum | −0.21 ± 0.05 | <0.001 | 0.22 | |
| 2170756 Xanthomonadaceae Stenotrophomonas geniculata | −0.21 ± 0.05 | <0.001 | 0.22 | |
| 579304 Lactobacillaceae | −0.21 ± 0.05 | <0.001 | 0.22 | |
| 100001 unclassified | −0.32 ± 0.06 | <0.001 | 0.28 | |
| 4319416 Bartonellaceae Bartonella unclassified | −0.40 ± 0.08 | <0.001 | 0.28 | |
| 52166 Veillonellaceae Megasphaera | −0.43 ± 0.13 | 0.001 | 0.15 | |
| 4441081 Coriobacteriaceae unclassified | −0.52 ± 0.10 | <0.001 | 0.30 | |
| 652696 Bifidobacteriaceae Bifidobacterium adolescentis | −0.57 ± 0.18 | 0.002 | 0.14 | |
| 128382 Veillonellaceae Dialister | −0.63 ± 0.10 | <0.001 | 0.37 | |
| Bile salts | ||||
| Cholate | ||||
| 128382 Veillonellaceae Dialister | 0.78 ± 0.18 | <0.001 | 0.22 | |
| 4441081 Coriobacteriaceae unclassified | 0.66 ± 0.17 | <0.001 | 0.20 | |
| 4319416 Bartonellaceae Bartonella unclassified | 0.49 ± 0.14 | 0.001 | 0.17 | |
| 100001 unclassified | 0.41 ± 0.11 | <0.001 | 0.18 | |
| 1007180 Methylobacteriaceae Methylobacterium | 0.37 ± 0.08 | <0.001 | 0.27 | |
| 1074945 Propionibacteriaceae Propionibacterium granulosum | 0.37 ± 0.08 | <0.001 | 0.27 | |
| 2170756 Xanthomonadaceae Stenotrophomonas geniculata | 0.37 ± 0.08 | <0.001 | 0.27 | |
| 579304 Lactobacillaceae | 0.37 ± 0.08 | <0.001 | 0.27 | |
| 356403 Clostridiaceae Clostridium hiranonis | −0.61 ± 0.18 | 0.001 | 0.15 | |
| 1000148 Comamonadaceae unclassified | −0.75 ± 0.18 | <0.001 | 0.21 | |
| 4384058 Enterobacteriaceae Salmonella | −0.77 ± 0.26 | 0.004 | 0.12 | |
| 266392 Lachnospiraceae Coprococcus | −0.91 ± 0.24 | <0.001 | 0.18 | |
| 1084643 Mogibacteriaceae Mogibacterium | −1.20 ± 0.28 | <0.001 | 0.22 | |
| 193279 Coriobacteriaceae Adlercreutzia | −1.24 ± 0.23 | <0.001 | 0.32 | |
| Dehydrolithocholate | ||||
| 193279 Coriobacteriaceae Adlercreutzia | 0.82 ± 0.13 | <0.001 | 0.39 | |
| 1084643 Mogibacteriaceae Mogibacterium | 0.67 ± 0.17 | <0.001 | 0.19 | |
| 4384058 Enterobacteriaceae Salmonella | 0.66 ± 0.14 | <0.001 | 0.26 | |
| 266392 Lachnospiraceae Coprococcus | 0.65 ± 0.14 | <0.001 | 0.27 | |
| 356403 Clostridiaceae Clostridium hiranonis | 0.62 ± 0.09 | <0.001 | 0.45 | |
| 839684 Lachnospiraceae unclassified | 0.61 ± 0.16 | <0.001 | 0.19 | |
| 1000148 Comamonadaceae unclassified | 0.57 ± 0.10 | <0.001 | 0.34 | |
| 100212 Veillonellaceae | 0.52 ± 0.15 | 0.001 | 0.15 | |
| 100027 Enterobacteriaceae | 0.46 ± 0.11 | <0.001 | 0.22 | |
| 1758401 Clostridiaceae SMB53 | 0.25 ± 0.09 | 0.009 | 0.10 | |
| 4473250 Paenibacillaceae Aneurinibacillus migulanus | −0.21 ± 0.05 | <0.001 | 0.18 | |
| 4319416 Bartonellaceae Bartonella unclassified | −0.24 ± 0.08 | 0.007 | 0.11 | |
| 100001 unclassified | −0.28 ± 0.06 | <0.001 | 0.25 | |
| 52166 Veillonellaceae Megasphaera | −0.39 ± 0.12 | 0.002 | 0.14 | |
| 100100 Bacillaceae unclassified | −0.39 ± 0.11 | 0.001 | 0.16 | |
| 128382 Veillonellaceae Dialister | −0.44 ± 0.11 | <0.001 | 0.20 | |
| Deoxycholate | ||||
| 193279 Coriobacteriaceae Adlercreutzia | 1.25 ± 0.27 | <0.001 | 0.25 | |
| 4384058 Enterobacteriaceae Salmonella | 1.22 ± 0.27 | <0.001 | 0.24 | |
| 839684 Lachnospiraceae unclassified | 1.00 ± 0.31 | 0.002 | 0.14 | |
| 1000148 Comamonadaceae unclassified | 0.97 ± 0.20 | <0.001 | 0.27 | |
| 100027 Enterobacteriaceae | 0.94 ± 0.21 | <0.001 | 0.25 | |
| 356403 Clostridiaceae Clostridium hiranonis | 0.88 ± 0.19 | <0.001 | 0.25 | |
| 266392 Lachnospiraceae Coprococcus | 0.86 ± 0.28 | 0.003 | 0.13 | |
| 1105591 Paraprevotellaceae Paraprevotella | 0.54 ± 0.18 | 0.005 | 0.12 | |
| 4473250 Paenibacillaceae Aneurinibacillus migulanus | −0.32 ± 0.11 | 0.005 | 0.12 | |
| 100001 unclassified | −0.42 ± 0.12 | 0.001 | 0.15 | |
| 4319416 Bartonellaceae Bartonella unclassified | −0.59 ± 0.15 | <0.001 | 0.18 | |
| 100100 Bacillaceae unclassified | −0.66 ± 0.22 | 0.004 | 0.12 | |
| 128382 Veillonellaceae Dialister | −0.86 ± 0.21 | <0.001 | 0.21 | |
| Isoursodeoxycholate | ||||
| 839684 Lachnospiraceae unclassified | 2.08 ± 0.44 | <0.001 | 0.26 | |
| 4384058 Enterobacteriaceae Salmonella | 1.76 ± 0.41 | <0.001 | 0.22 | |
| 100212 Veillonellaceae | 1.69 ± 0.43 | <0.001 | 0.19 | |
| 193279 Coriobacteriaceae Adlercreutzia | 1.64 ± 0.42 | <0.001 | 0.19 | |
| 100027 Enterobacteriaceae | 1.55 ± 0.30 | <0.001 | 0.30 | |
| 356403 Clostridiaceae Clostridium hiranonis | 1.45 ± 0.28 | <0.001 | 0.30 | |
| 266392 Lachnospiraceae Coprococcus | 1.23 ± 0.43 | 0.006 | 0.11 | |
| 1000148 Comamonadaceae unclassified | 1.06 ± 0.33 | 0.002 | 0.14 | |
| 1105591 Paraprevotellaceae Paraprevotella | 0.93 ± 0.27 | 0.001 | 0.16 | |
| 1758401 Clostridiaceae SMB53 | 0.80 ± 0.26 | 0.003 | 0.13 | |
| 4473250 Paenibacillaceae Aneurinibacillus migulanus | −0.49 ± 0.16 | 0.004 | 0.12 | |
| 100001 unclassified | −0.66 ± 0.19 | 0.001 | 0.17 | |
| 100100 Bacillaceae unclassified | −1.12 ± 0.33 | 0.001 | 0.16 | |
| 128382 Veillonellaceae Dialister | −1.13 ± 0.32 | 0.001 | 0.16 | |
| Lithocholate | ||||
| 193279 Coriobacteriaceae Adlercreutzia | 0.98 ± 0.16 | <0.001 | 0.36 | |
| 1084643 Mogibacteriaceae Mogibacterium | 0.83 ± 0.21 | <0.001 | 0.20 | |
| 4384058 Enterobacteriaceae Salmonella | 0.83 ± 0.17 | <0.001 | 0.26 | |
| 266392 Lachnospiraceae Coprococcus | 0.74 ± 0.17 | <0.001 | 0.22 | |
| 1000148 Comamonadaceae unclassified | 0.70 ± 0.12 | <0.001 | 0.33 | |
| 839684 Lachnospiraceae unclassified | 0.65 ± 0.20 | 0.002 | 0.14 | |
| 356403 Clostridiaceae Clostridium hiranonis | 0.60 ± 0.12 | <0.001 | 0.27 | |
| 100027 Enterobacteriaceae | 0.50 ± 0.14 | 0.001 | 0.16 | |
| 1105591 Paraprevotellaceae Paraprevotella | 0.35 ± 0.12 | 0.004 | 0.12 | |
| 1000062 Porphyromonadaceae unclassified | 0.32 ± 0.12 | 0.007 | 0.11 | |
| 1007180 Methylobacteriaceae Methylobacterium | −0.20 ± 0.06 | 0.002 | 0.14 | |
| 1074945 Propionibacteriaceae Propionibacterium granulosum | −0.20 ± 0.06 | 0.002 | 0.14 | |
| 2170756 Xanthomonadaceae Stenotrophomonas geniculata | −0.20 ± 0.06 | 0.002 | 0.14 | |
| 579304 Lactobacillaceae | −0.20 ± 0.06 | 0.002 | 0.14 | |
| 4473250 Paenibacillaceae Aneurinibacillus migulanus | −0.21 ± 0.07 | 0.003 | 0.13 | |
| 100001 unclassified | −0.32 ± 0.08 | <0.001 | 0.21 | |
| 4319416 Bartonellaceae Bartonella unclassified | −0.41 ± 0.10 | <0.001 | 0.21 | |
| 52166 Veillonellaceae Megasphaera | −0.44 ± 0.15 | 0.006 | 0.11 | |
| 4441081 Coriobacteriaceae unclassified | −0.44 ± 0.13 | 0.001 | 0.16 | |
| 128382 Veillonellaceae Dialister | −0.66 ± 0.13 | <0.001 | 0.29 | |
| Ursodeoxycholate | ||||
| 839684 Lachnospiraceae unclassified | 1.58 ± 0.43 | <0.001 | 0.17 | |
| 100212 Veillonellaceae | 1.45 ± 0.41 | 0.001 | 0.16 | |
| 4384058 Enterobacteriaceae Salmonella | 1.43 ± 0.40 | 0.001 | 0.17 | |
| 100027 Enterobacteriaceae | 1.32 ± 0.29 | <0.001 | 0.25 | |
| 356403 Clostridiaceae Clostridium hiranonis | 0.98 ± 0.28 | 0.001 | 0.16 | |
Operational taxonomic unit (OUT) number, family, and genus are shown; species are also shown when indicated. r2, square of Pearson’s correlation coefficient; SE, standard error.
Table 10.
Correlations between fecal short-chain fatty acids and OTUs.
| Estimate ± SE | p Value | r2 | |
|---|---|---|---|
| Short-chain fatty acid | |||
| Acetic acid | |||
| 100001 unclassified | 377.86 ± 169.92 | 0.029 | 0.06 |
| 193279 Coriobacteriaceae Adlercreutzia | −162.58 ± 69.07 | 0.021 | 0.07 |
| 266392 Lachnospiraceae Coprococcus | −180.36 ± 74.28 | 0.018 | 0.08 |
| 4384058 Enterobacteriaceae Salmonella | −186.24 ± 73.79 | 0.014 | 0.08 |
| 100027 Enterobacteriaceae | −257.88 ± 99.59 | 0.012 | 0.09 |
| Butyric acid | |||
| 100001 unclassified | 1481.79 ± 228.27 | <0.001 | 0.37 |
| 1007180 Methylobacteriaceae Methylobacterium | 1205.37 ± 327.19 | <0.001 | 0.16 |
| 1074945 Propionibacteriaceae Propionibacterium granulosum | 1205.37 ± 327.19 | <0.001 | 0.16 |
| 2170756 Xanthomonadaceae Stenotrophomonas geniculata | 1205.37 ± 327.19 | <0.001 | 0.16 |
| 579304 Lactobacillaceae | 1205.37 ± 327.19 | <0.001 | 0.16 |
| 4473250 Paenibacillaceae Aneurinibacillus migulanus | 1094.04 ± 311.20 | 0.001 | 0.15 |
| 52166 Veillonellaceae Megasphaera | 834.55 ± 120.91 | <0.001 | 0.40 |
| 4441081 Coriobacteriaceae unclassified | 741.05 ± 153.17 | <0.001 | 0.25 |
| 4319416 Bartonellaceae Bartonella unclassified | 711.14 ± 188.01 | <0.001 | 0.17 |
| 128382 Veillonellaceae Dialister | 681.55 ± 139.49 | <0.001 | 0.25 |
| 100100 Bacillaceae unclassified | 506.90 ± 156.59 | 0.002 | 0.13 |
| 652696 Bifidobacteriaceae Bifidobacterium adolescentis | 310.52 ± 115.20 | 0.009 | 0.09 |
| 1084643 Mogibacteriaceae Mogibacterium | −351.85 ± 94.69 | <0.001 | 0.16 |
| 100212 Veillonellaceae | −361.32 ± 119.61 | 0.003 | 0.11 |
| 839684 Lachnospiraceae unclassified | −427.17 ± 112.65 | <0.001 | 0.17 |
| 1000062 Porphyromonadaceae unclassified | −479.32 ± 185.41 | 0.012 | 0.08 |
| 1105591 Paraprevotellaceae Paraprevotella | −522.93 ± 173.04 | 0.003 | 0.11 |
| 266392 Lachnospiraceae Coprococcus | −529.60 ± 109.93 | <0.001 | 0.24 |
| 4384058 Enterobacteriaceae Salmonella | −540.56 ± 108.67 | <0.001 | 0.26 |
| 1758401 Clostridiaceae SMB53 | −651.43 ± 174.01 | <0.001 | 0.16 |
| 1000148 Comamonadaceae unclassified | −655.39 ± 137.87 | <0.001 | 0.24 |
| 193279 Coriobacteriaceae Adlercreutzia | −667.17 ± 87.02 | <0.001 | 0.45 |
| 100027 Enterobacteriaceae | −760.96 ± 144.85 | <0.001 | 0.28 |
| 356403 Clostridiaceae Clostridium hiranonis | −876.23 ± 132.62 | <0.001 | 0.38 |
| Propionic acid | |||
| 356403 Clostridiaceae Clostridium hiranonis | 281.28 ± 57.68 | <0.001 | 0.25 |
| 1758401 Clostridiaceae SMB53 | 225.48 ± 70.43 | 0.002 | 0.12 |
| 1000148 Comamonadaceae unclassified | 215.68 ± 57.15 | <0.001 | 0.17 |
| 1000062 Porphyromonadaceae unclassified | 206.39 ± 72.75 | 0.006 | 0.10 |
| 1105591 Paraprevotellaceae Paraprevotella | 186.05 ± 69.32 | 0.009 | 0.09 |
| 193279 Coriobacteriaceae Adlercreutzia | 169.61 ± 41.89 | <0.001 | 0.19 |
| 100027 Enterobacteriaceae | 154.64 ± 64.92 | 0.020 | 0.07 |
| 4384058 Enterobacteriaceae Salmonella | 140.78 ± 47.01 | 0.004 | 0.11 |
| 839684 Lachnospiraceae unclassified | 115.29 ± 46.91 | 0.016 | 0.08 |
| 266392 Lachnospiraceae Coprococcus | 108.81 ± 48.36 | 0.028 | 0.07 |
| 1084643 Mogibacteriaceae Mogibacterium | 81.80 ± 39.76 | 0.043 | 0.06 |
| 100100 Bacillaceae unclassified | −159.61 ± 63.61 | 0.014 | 0.08 |
| 652696 Bifidobacteriaceae Bifidobacterium adolescentis | −185.12 ± 42.57 | <0.001 | 0.21 |
| 52166 Veillonellaceae Megasphaera | −202.27 ± 56.90 | 0.001 | 0.15 |
| 128382 Veillonellaceae Dialister | −249.93 ± 56.49 | <0.001 | 0.21 |
| 4441081 Coriobacteriaceae unclassified | −269.82 ± 62.12 | <0.001 | 0.21 |
| 4319416 Bartonellaceae Bartonella unclassified | −315.69 ± 72.48 | <0.001 | 0.21 |
| 100001 unclassified | −322.04 ± 107.23 | 0.004 | 0.11 |
| 1007180 Methylobacteriaceae Methylobacterium | −338.04 ± 135.44 | 0.015 | 0.08 |
| 1074945 Propionibacteriaceae Propionibacterium granulosum | −338.04 ± 135.44 | 0.015 | 0.08 |
| 2170756 Xanthomonadaceae Stenotrophomonas geniculata | −338.04 ± 135.44 | 0.015 | 0.08 |
| 579304 Lactobacillaceae | −338.04 ± 135.44 | 0.015 | 0.08 |
| Branched-chain fatty acid | |||
| Isobutyric acid | |||
| 1105591 Paraprevotellaceae Paraprevotella | 24.15 ± 6.64 | 0.001 | 0.16 |
| 1000148 Comamonadaceae unclassified | 17.85 ± 5.84 | 0.003 | 0.12 |
| 1758401 Clostridiaceae SMB53 | 15.56 ± 7.32 | 0.037 | 0.06 |
| 839684 Lachnospiraceae unclassified | 14.18 ± 4.52 | 0.003 | 0.12 |
| 100027 Enterobacteriaceae | 14.14 ± 6.45 | 0.032 | 0.06 |
| 193279 Coriobacteriaceae Adlercreutzia | 13.88 ± 4.27 | 0.002 | 0.13 |
| 4384058 Enterobacteriaceae Salmonella | 10.98 ± 4.77 | 0.024 | 0.07 |
| 266392 Lachnospiraceae Coprococcus | 10.33 ± 4.90 | 0.039 | 0.06 |
| 100100 Bacillaceae unclassified | −17.88 ± 6.19 | 0.005 | 0.11 |
| 128382 Veillonellaceae Dialister | −21.80 ± 5.72 | <0.001 | 0.17 |
| 4319416 Bartonellaceae Bartonella unclassified | −27.37 ± 7.33 | <0.001 | 0.17 |
| 100001 unclassified | −27.75 ± 11.19 | 0.016 | 0.08 |
| 1007180 Methylobacteriaceae Methylobacterium | −28.03 ± 13.61 | 0.043 | 0.06 |
| 1074945 Propionibacteriaceae Propionibacterium granulosum | −28.03 ± 13.61 | 0.043 | 0.06 |
| 2170756 Xanthomonadaceae Stenotrophomonas geniculata | −28.03 ± 13.61 | 0.043 | 0.06 |
| 579304 Lactobacillaceae | −28.03 ± 13.61 | 0.043 | 0.06 |
| 4473250 Paenibacillaceae Aneurinibacillus migulanus | −31.56 ± 12.59 | 0.015 | 0.08 |
| Isovaleric acid | |||
| 1105591 Paraprevotellaceae Paraprevotella | 37.88 ± 10.38 | <0.001 | 0.16 |
| 1000148 Comamonadaceae unclassified | 19.47 ± 9.45 | 0.043 | 0.06 |
| 839684 Lachnospiraceae unclassified | 18.20 ± 7.28 | 0.015 | 0.08 |
| 100100 Bacillaceae unclassified | −20.32 ± 10.03 | 0.047 | 0.05 |
| 128382 Veillonellaceae Dialister | −28.92 ± 9.30 | 0.003 | 0.12 |
| 4319416 Bartonellaceae Bartonella unclassified | −34.65 ± 11.99 | 0.005 | 0.10 |
Operational taxonomic unit (OTU) number, family, and genus are shown; species are also shown when indicated. r2, square of Pearson’s correlation coefficient; SE, standard error.
Publisher’s Note: MDPI stays neutral with regard to jurisdictional claims in published maps and institutional affiliations. |
© 2021 by the authors. Licensee MDPI, Basel, Switzerland. This article is an open access article distributed under the terms and conditions of the Creative Commons Attribution (CC BY) license (https://creativecommons.org/licenses/by/4.0/).
Share and Cite
MDPI and ACS Style
Ephraim, E.; Jewell, D.E. Effect of Nutrition on Age-Related Metabolic Markers and the Gut Microbiota in Cats. Microorganisms 2021, 9, 2430. https://doi.org/10.3390/microorganisms9122430
AMA Style
Ephraim E, Jewell DE. Effect of Nutrition on Age-Related Metabolic Markers and the Gut Microbiota in Cats. Microorganisms. 2021; 9(12):2430. https://doi.org/10.3390/microorganisms9122430
Chicago/Turabian StyleEphraim, Eden, and Dennis E. Jewell. 2021. "Effect of Nutrition on Age-Related Metabolic Markers and the Gut Microbiota in Cats" Microorganisms 9, no. 12: 2430. https://doi.org/10.3390/microorganisms9122430
Note that from the first issue of 2016, this journal uses article numbers instead of page numbers. See further details here.