Article

Independence of a Marine Unicellular Diazotroph to the Presence of NO3

1
Laboratoire d’Océanographie Microbienne (LOMIC), CNRS, Sorbonne Université, F-66650 Banyuls-sur-Mer, France
2
Laboratoire d’Océanographie de Villefranche (LOV), CNRS, Sorbonne Université, F-06230 Villefranche-sur-Mer, France
3
Aix Marseille Université, CNRS/INSU, Université de Toulon, IRD, Mediterranean Institute of Oceanography (MIO) UM 110, 13288 Marseille, France
4
Laboratoire de Chimie Bactérienne (LCB), Aix Marseille Université, CNRS, 13284 Marseille, France
5
GEOMAR Helmholtz Centre for Ocean Research Kiel, 24105 Kiel, Germany
*
Author to whom correspondence should be addressed.
Microorganisms 2021, 9(10), 2073; https://doi.org/10.3390/microorganisms9102073
Submission received: 27 August 2021 / Revised: 23 September 2021 / Accepted: 28 September 2021 / Published: 1 October 2021
(This article belongs to the Special Issue Ecology, Diversity and Distribution of Pico-Sized Algae)

Abstract

:
Marine nitrogen (N2) fixation was historically considered to be absent or reduced in nitrate (NO3) rich environments. This is commonly attributed to the lower energetic cost of NO3 uptake compared to diazotrophy in oxic environments. This paradigm often contributes to making inferences about diazotroph distribution and activity in the ocean, and is also often used in biogeochemical ocean models. To assess the general validity of this paradigm beyond the traditionally used model organism Trichodesmium spp., we grew cultures of the unicellular cyanobacterium Crocosphaera watsonii WH8501 long term in medium containing replete concentrations of NO3. NO3 uptake was measured in comparison to N2 fixation to assess the cultures’ nitrogen source preferences. We further measured culture growth rate, cell stoichiometry, and carbon fixation rate to determine if the presence of NO3 had any effect on cell metabolism. We found that uptake of NO3 by this strain of Crocosphaera was minimal in comparison to other N sources (~2–4% of total uptake). Furthermore, availability of NO3 did not statistically alter N2 fixation rate nor any aspect of cell physiology or metabolism measured (cellular growth rate, cell stoichiometry, cell size, nitrogen fixation rate, nitrogenase activity) in comparison to a NO3 free control culture. These results demonstrate the capability of a marine diazotroph to fix nitrogen and grow independently of NO3. This lack of sensitivity of diazotrophy to NO3 suggests that assumptions often made about, and model formulations of, N2 fixation should be reconsidered.

1. Introduction

One of the key parameters classically considered to constrain the distribution of diazotrophs in the ocean is the availability, or lack thereof, of dissolved inorganic nitrogen (DIN). Two main arguments for this are brought forward in the literature. The primary reasoning is that the energetic demand of the uptake of DIN, such as ammonium (NH4+) and nitrate (NO3) has been shown in oxic waters to be less costly than that of nitrogenase activity to convert N2 to NH4+ [1,2,3], and the diel synthesis of the nitrogenase complex imposes additional costs upon diazotrophic cells [2]. Logically, one might therefore assume that a diazotroph would, in oxic environments, always choose DIN over N2 whenever available. However, marine diazotrophs tend to be slow-growing compared to other phytoplankton, and are not the most efficient in taking up inorganic nutrients [4]. Therefore, when in the presence of non-limiting concentrations of nitrate, diazotrophs are likely to be outcompeted for DIN sources, and, following classical bottom-up reasoning, assumed unlikely to be found in nutrient rich areas of the ocean. This first argument, though, also applies to photo-autotrophic diazotrophs, and has lost genericity as photo-heterotrophic and heterotrophic diazotrophs have since been described [5,6,7,8], whose distribution can expand to NO3-rich areas of the ocean [9].
The second line of thinking arose from seminal works on the easily observable, widely distributed diazotrophs such as Trichodesmium spp., which were the first to be maintained in culture and long constituted a reference for the N2 fixation process in situ [10]. Reduction of N2 fixation in the presence of DIN has been found in Trichodesmium spp. and is relatively well documented. A review [11] summarizing multiple culture and field experiments highlights that a substantial reduction in diazotrophy in Trichodesmium spp. occurred. The impact of DIN on nitrogenase activity was, however, infrequent and incomplete [12,13,14,15,16] in what we define here as being short term exposure, that is shorter than, or equivalent to, the time scale of the cell cycle. Although the term ‘inhibition’ has been used in the literature, it is unclear whether there is a real steric inhibition, sensu stricto, of the nitrogenase enzyme and how this inhibition would operate. We therefore refer to the more accurate term of ‘reduction’. This impact was also sensitive to the species of DIN. NH4+ was much more likely to induce a substantial reduction over short time scales, although NH4+ is far less prevalent than NO3 in the ocean. NO3 was less likely to cause high rates of reduction over these timescales. Over multiple generations of exposure to DIN, Trichodesmium tended to switch to DIN utilization over N2 fixation for the majority of its N acquisition needs (e.g.,[12,14,17]). An efficient switch to nitrate use is also reported in the unicellular strain Cyanothece sp. BG 043511, indicative of a reactive and plastic metabolism well adapted to the highly fluctuating conditions typical of coastal environments [3,4].
Both these lines of argument have often led to the conclusion that diazotrophs would eventually stop fixing N2 in the presence of DIN. It is then sensible to limit the process of N2 fixation to areas where NO3 is not present in significant concentrations, but the above mentioned studies do not necessarily justify exclusion of diazotrophic organisms ecologically (that is, the organisms themselves) from such regions. Despite this uncertainty, this literature has often been used to constrain placement of diazotrophs in ecological and biogeochemical models of the ocean [18,19]. As a result, it is sometimes difficult to predict unrestrained N2 fixation [20] in areas where there are significant concentrations of NO3, despite accumulated evidence from in situ observations [21]. As model placement of diazotrophy does not always align with marine observations, it is becoming clearer that this assumption of DIN controls on N2 fixation may not be entirely correct.
Paradigms of diazotrophy defined from observations of species such as Trichodesmium are currently coming under question due to recent expansion of the known phylogenetic pool of nitrogenase-producing, unicellular cyanobacteria [22,23,24]. Despite the need to test the consistency of conceptual and numerical model assumptions with diazotrophs newer to science, replication of this kind of study is currently impossible for the still uncultured diazotrophic cyanobacteria such as UCYN-A. A few culturable, marine unicellular cyanobacteria exist, however. One such is the UCYN-B Crocosphaera watsonii, naturally found in the open ocean. A small number of DIN limitation experiments have been performed on C. watsonii that show variability in results. Some experiments mirror, albeit to a seemingly lesser degree, the results obtained with Trichodesmium spp. experiments ([17] in long term exposure). Others suggest the ability to assimilate NO3 and NH4+ efficiently whilst continuing to fix nitrogen with only a small reduction in N2 fixation ([25]; short term exposure) or reduction only contingent on low light conditions ([26]; long term exposure at 25 μmol quanta m−2 s−1). This variability in results actually points to a general uncertainty in our understanding of the effect of NO3 exposure on C. watsonii and it is especially unclear how important NO3 is to supporting the growth of C. watsonii.
We therefore designed a number of experiments with the aim of expanding our knowledge of the relationship between NO3, N2 fixation, growth efficiency, and nitrogen metabolism. We grew C. watsonii in semi-continuous mode under different light regimes and with several concentrations of NO3 (90 µM to 1000 µM) to test for any threshold level, which we compared to cultures grown under obligate diazotrophy, taken as reference.

2. Materials and Methods

All culture experiments were conducted on monocultures of Crocosphaera watsonii WH8501 [27,28], in acid-cleaned boro-silicate culture vessels, maintained under tightly controlled conditions of light and temperature in a Sanyo MLR 351 incubator as described in [29] and using the same experimental setup. Irradiance was provided by fluorescent tubes (Sanyo FL40SS W/37, Osaka, Japan). Each culture replicate received light from opposite faces and the cultures were placed in such a way that no shading effect between flasks occurred during the experiments. The original YBCII culture medium proposed by Chen et al. [30] was slightly modified so as not to contain any source of nitrogen (Fe-NH4-citrate was replaced with Fe-citrate). In each experiment described below, control (obligate diazotrophy, thereafter noted as NO3-free) and treatment (NO3-rich culture) cultures were initiated using the same culture medium, made fresh at the beginning of each experiment and as described in [31], to prevent any bias that might result from differences in medium preparation. Salinity was about 35 PSU and pH was ~8.2. Nitrate was thereafter amended in the NO3-rich cultures. When dilutions were applied to refresh the cultures, the same medium devoid of NO3 was used for all treatments. An appropriate addition of NO3 was then made to each NO3-rich culture individually to bring the NO3 level back to that observed just before the dilution. Cultures were diluted at sufficient frequency (every 10 to 20 days in the present conditions) to maintain populations at exponential growth rate and at equivalent low densities, to limit any bias that would occur if cultures experienced differing irradiance, and also to prevent biases in the results that would actually be due to self-shading within flasks or to nutrient depletion. Cultures were grown long term in the presence of NO3 for more than 10 generations in order to analyze the response of cells, not only upon exposure but also once they are acclimated to high concentrations of NO3. This acclimation phase is particularly important to allow enough time for eventual genetic regulations to take place, and not to describe a metabolic response that would be a remnant of the dynamics of a previous conditions of growth. After acclimation, NO3 uptake, N2 fixation rate, and a number of other physiological and metabolic parameters (cellular growth rate, cell size, N content, N fixation rate) were measured to test the effect of NO3 on cell growth and activity. Cultures were inoculated at about 1 to 3·105 cells. mL−1.
Population dynamics and average cell size in each population were monitored using a Multisizer 3 Coulter Counter (Beckman Coulter, Brea, CA, USA). A few samples were taken in the course of the experiment to control that bacterial contamination remained low, as in [31]. Elemental stoichiometry of organic carbon (POC) and nitrogen (PON) in the cultures were determined using a CHN analyzer (Perkin Elmer, Waltham, MA, USA). Samples (5.8 mL) were filtered onto pre-combusted (6 h at 450 °C) GF/C filters (Whatman, Buckinghamshire, UK), then dried and stored at 60 °C before analysis. At time points when POC and PON data were not available, cellular nitrogen (fmol-N cell−1) and carbon (fmol-C cell−1) contents were derived using the cell abundance measured at the time of sampling and the average C and N contents estimated with available data. The concentrations of nitrate (NO3, μmol L−1) and nitrite (NO2, μmol L−1) in the cultures were monitored on a daily basis using a Technicon Auto-Analyzer calibrated on a range of [0–100] μmol NO3 L−1. An automated dilution loop operated whenever the nitrate levels in the culture were beyond the calibration range, using the long tried-and-tested, automated data-acquisition system developed by Malara and Sciandra [32]. Nitrogenase activity was monitored using an on-line assay using the same setup as described in [31]. Culture samples of about 45 mL were filtered through a GF/F filter and placed in the cell incubator at the onset of the dark phase. The incubation temperature was maintained at 27 °C using a water bath and the sample experienced the same light cycle as in the growth incubator. Growth rates were estimated from exponential regressions on the changes in abundance data with time, with R2 the coefficient of determination of the exponential fit. Predictions of NO3 consumption were derived from the observation of the population dynamics and the total, bulk N content in the population biomass. Under the hypothesis that N in the biomass comes from NO3 uptake, the NO3 uptake rate is predicted from the rate of biomass increase, by subtracting the amount of N incorporated in the biomass from the NO3 pool, at each time step. This predicted curve of NO3 disappearance from the medium simulates the consumption that would be necessary to support the nitrogen buildup in the biomass, should NO3 alone cover the nitrogen requirements. Three series of experiments were run and the conditions tested in each are recalled in Table 1.
In experiment #1, a first set of four cultures was run under 12 h Light: 12 h Dark (LD) cycles. Two were started with elevated NO3 concentrations (900 and 700 μmol NO3 L−1) and two others with no N source in the growth medium. All four cultures were started from the same seed culture and grown in the same incubator, at the same incident irradiance of 240 µE m−2 s−1 for 12 h per day. NO3 concentrations and cell counts were monitored in time. To verify if any decrease in nitrate concentration could be related to some other (possibly abiotic) process but uptake by cells, a test was also conducted in which two additional vessels, which only contained nitrate-rich medium (800 μmol NO3 L−1) and no cells, were exposed to the same LD regime. NO3 concentrations were monitored over time for several weeks. This control served as baseline for the NO3-containing culture experiments.
In Experiment #2, two more culture vessels were started as in experiment #1 with elevated NO3 concentrations (1038 μmol NO3 L−1), but exposed to continuous light (LL). The incident irradiance was set to 120 µE m−2 s−1 for 24 h per day, so as to provide the cultures with the same total daily light dose as in the other experiments. NO3 concentrations and cell counts were monitored over time.
Experiment #3 is an expansion of Experiment #1, in which we tested two nitrate levels (Experiment 3.1: 800 and Experiment 3.2: 90 μmol NO3 L−1) and compared them to NO3-free cultures run in parallel and taken as reference. Cultures were run in triplicate and exposed to a 12 h:12 h LD regime. Although the same setup was used, a careful measurement of the average incident irradiance field in the incubator gave 220 µE m−2 s−1 in Experiment 3.1 and 260 µE m−2 s−1 in Experiment 3.2. Rates of net N2 fixation and incorporation into the biomass were monitored using the stable isotope tracer method described by Montoya et al. [33], using 99% pure 15N2 gas (Eurisotop, Saint-Aubin, France). Incubations were performed in polycarbonate bottles. In Experiment 3.1, a volume of 0.5 mL 15N2 gas was injected in 170 mL bottles that contained a 0.7 mL residual air bubble, leading to an initial enrichment of 24%. In Experiment 3.2, due to volume restrictions, a volume of 0.1 mL 15N2 was injected in 20 mL bottles that did not show any residual air bubble, leading to an initial enrichment of 45%. Nitrogen incorporation per cell was then derived using the measured cells’ abundances. Incubations were started at the beginning of the dark phase and left for 24 h. Because cells divide (if they divided that day) at the mid light phase [31], i.e., after the period of N2 fixation, we logically referred to the cell abundance at the beginning of the incubation to estimate a nitrogen production per cell. Initial 15N abundances in the biomass were regularly verified at the light to dark transition and proved similar to the natural abundance, i.e., 0.366%. Following the incubation period, samples were filtered through pre-combusted (450 °C) Whatman GF/F filters (25 mm in diameter, nominal porosity ≈ 0.7 μm) using a low vacuum pressure (<100 mm Hg). Following filtration, filters were placed into 2 mL glass tubes, dried for 24 h in a 60 °C oven and stored dry until laboratory analysis. These filters were used to determine the final 15N enrichment ratio in the particulate organic matter on an Integra-CN mass spectrometer (SERCON) calibrated using glycine references according to Raimbault and Garcia [34]. Nitrogenase activity was recorded in Experiment 3.1.

3. Results

In this study, both nitrate and nitrite were monitored in the vessels. Nitrite concentrations always remained close to zero; therefore, we pooled NO3 + NO2, and considered this sum as being nitrate. The growth rates obtained in the different experiments are summarized in Table 1.

3.1. Control

In 9 days, the two control reactors devoid of biomass show a very similar trend with a steady 5.09% and 6.63% linear decrease in NO3 concentrations. The corresponding slopes estimated over the whole series are −5.68 and −8.13 μmol NO3 L−1 d−1, thus averaging −6.91 μmol NO3 L−1 d−1. Bacterial contamination in these vessels remained negligible; therefore, some small, yet non negligible and consistent NO3 disappearance occurred with time that was not due to Crocosphaera or bacteria uptake. In the following experiments, we operated a baseline correction by removing the average decreasing trend from measured NO3 concentrations. Note that this correction remains minor and doesn’t change the main results or the conclusions developed thereafter.

3.2. Culture Experiments

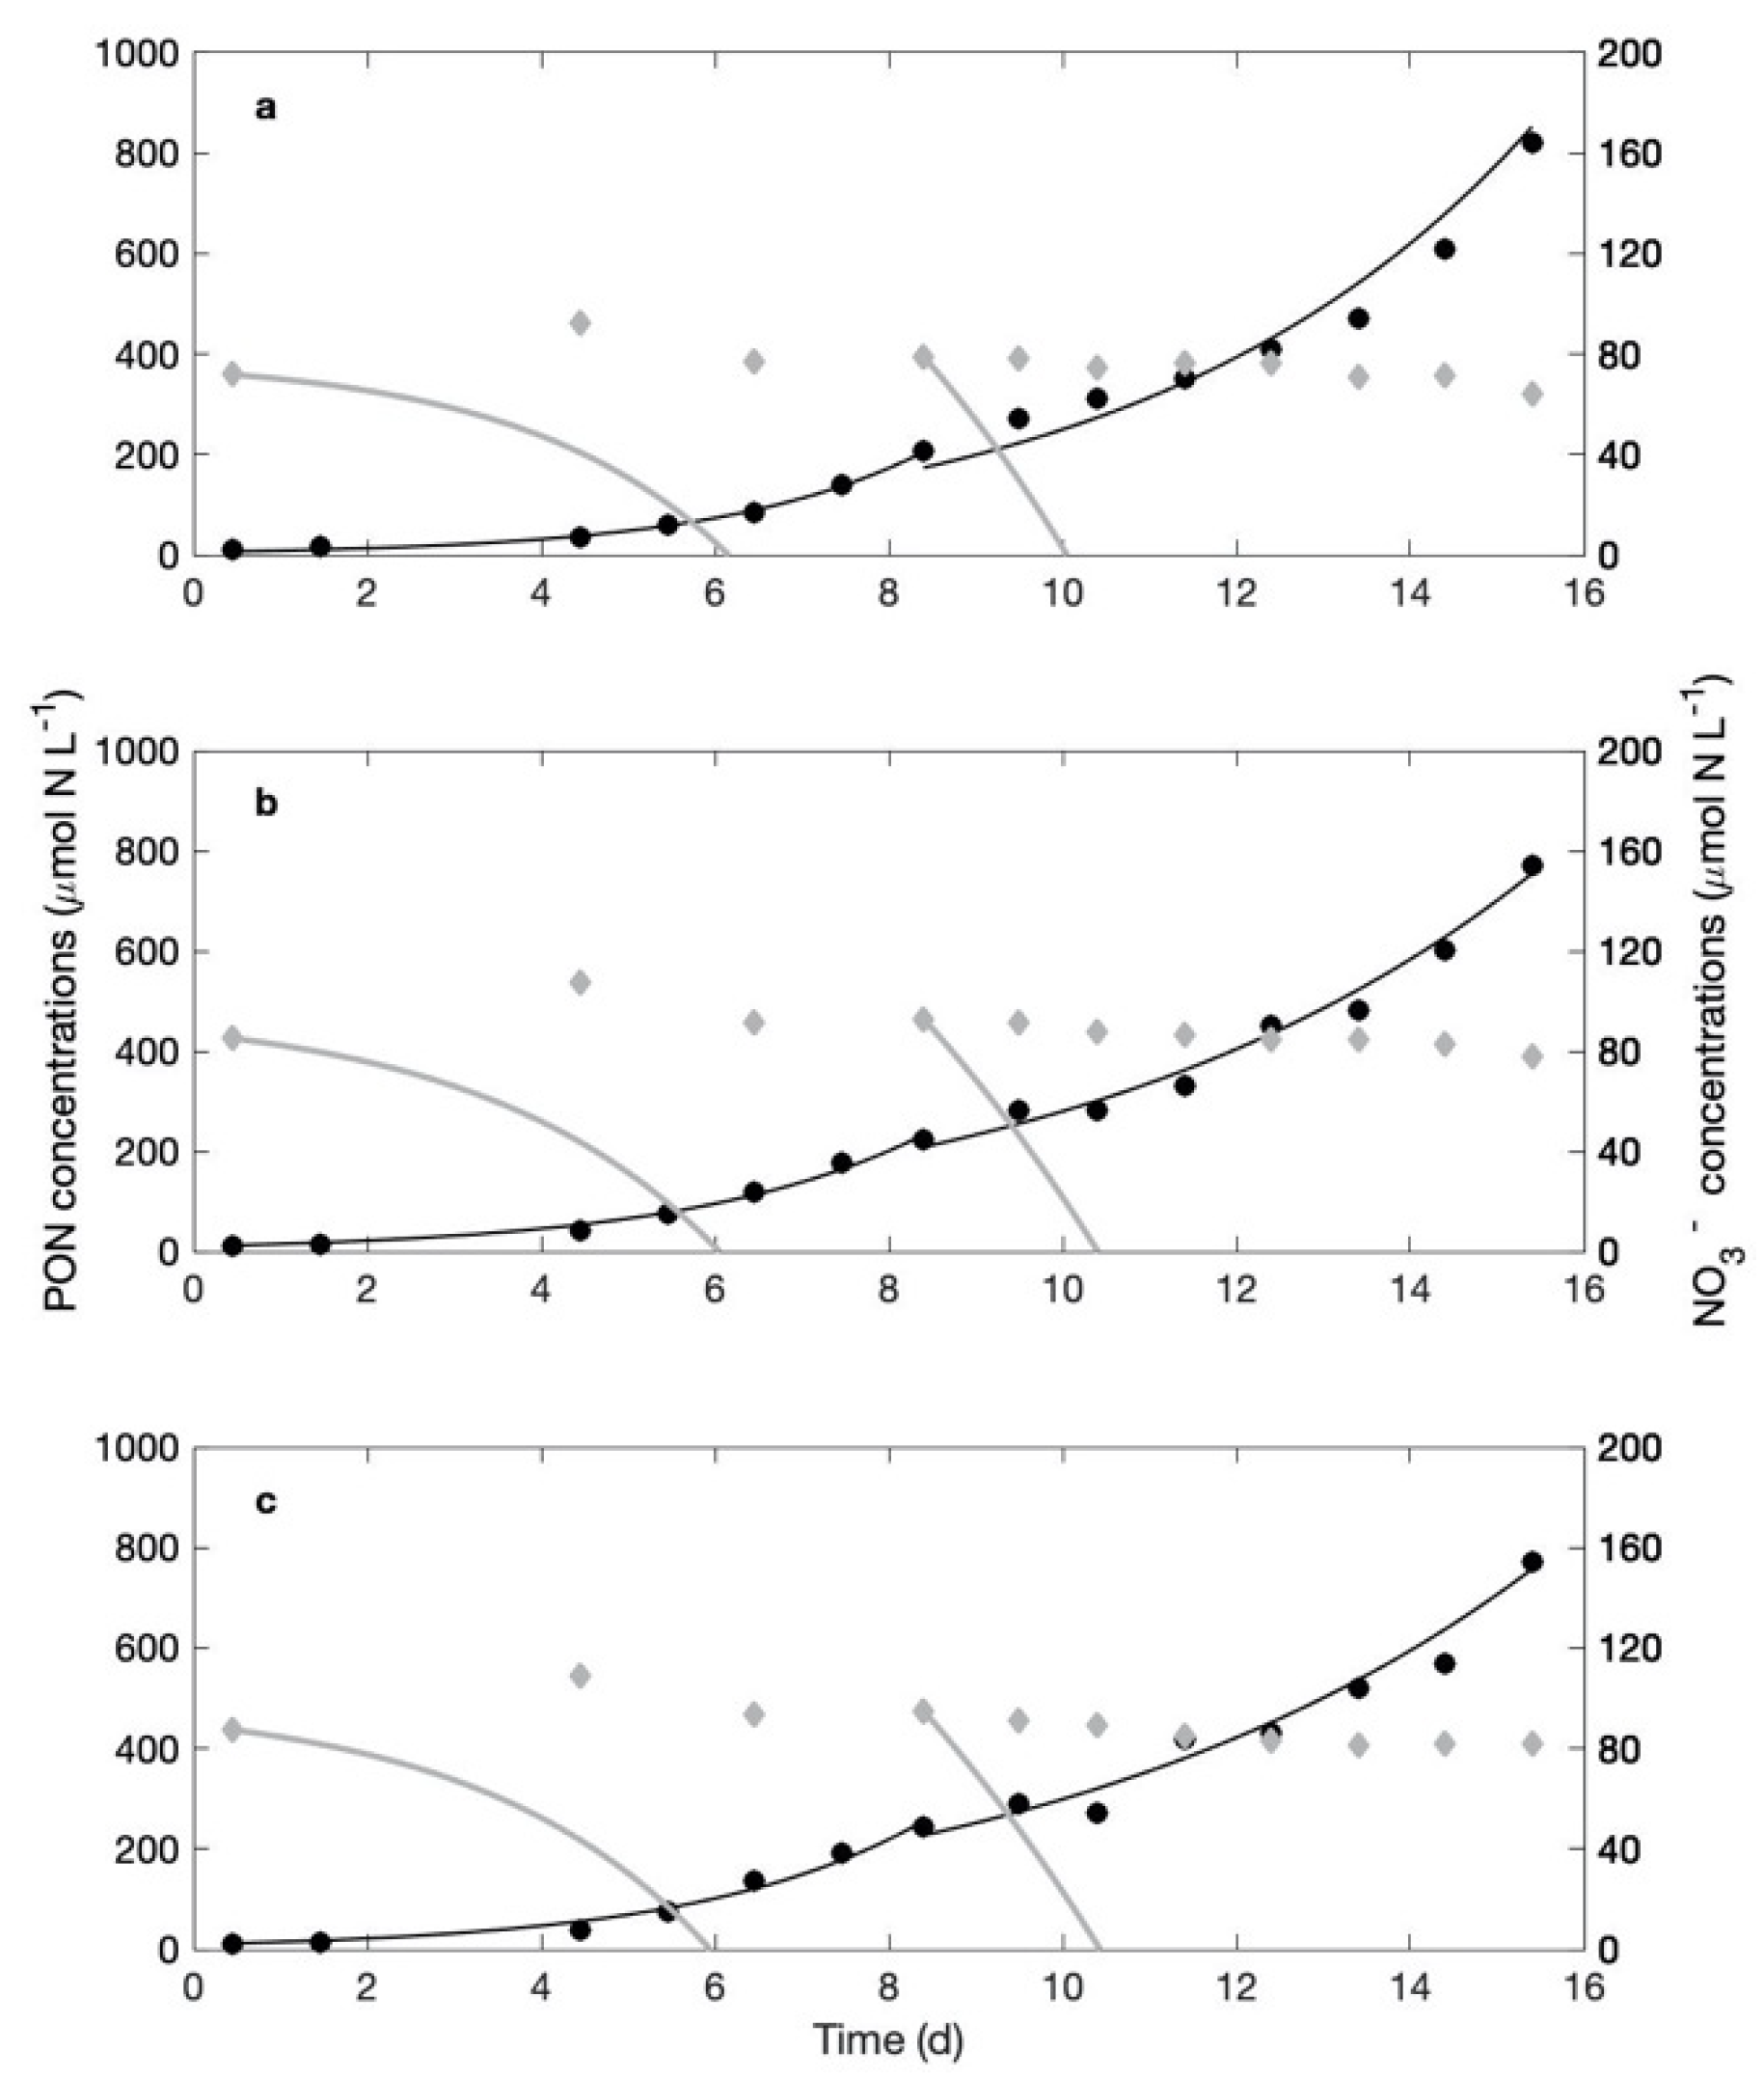
3.2.1. Experiment #1

Growth rates recorded under the LD regime in the NO3-free culture medium are 0.43 (R2 = 0.98) and 0.35 (R2 = 0.99) d−1. Those observed in the two NO3-rich cultures are 0.30 (R2 = 0.93) and 0.31 (R2 = 0.96) d−1. These growth rates do not statistically differ at the 5% level (Student t test). The total carbon and nitrogen contents per cell are needed to deduce the total nitrogen and carbon biomass formed in this experiment #1. We pooled data of carbon and nitrogen content in C. watsonii from the present study as well as our past studies [29,31,35] to derive an average content in our strain. The most robust reference appears to be the volumetric content as it allows comparison of N contents in cells with different sizes. We obtained an average of 25.62 ± 3.71 fmol C μm−3 and 2.69 ± 0.46 fmol N μm−3. The average cell volume in this Experiment #1 is 12.35 μm3. Therefore, the average N content is 33.22 fmol N cell−1. Given the number of cells formed over time in the two NO3-rich cultures, the according total PON buildup at the end of the experiment is 679.3 and 796.3 μmol N L−1 (Figure 1a, closed and open black circles and the black continuous and dashed lines showing the according fitted dynamics). Based on the observed population dynamics, we also simulated what the expected changes in NO3 concentrations should be, if DIN is to interrupt the activity of N2 fixation and Crocosphaera switches to NO3 uptake to support its growth. The thick grey lines on Figure 1a predict how NO3 concentrations should evolve in both culture replicates if NO3 is taken up to support all of the observed PON buildup in the biomass over time. That is, if NO3 is the primary source of N in the biomass, the PON buildup should be reflected in a symmetrical decrease in the NO3 concentration: PON and NO3 are plotted with the same scale for this purpose. Simulations thus predict that the initial NO3 concentration would be drawn to zero within 10 and 9 days in the two replicates. In clear contrast, the actual NO3 concentrations measured in the medium show a slightly decreasing trend with a slope of −7.35 and −1.89 μmol NO3 d−1 in the two replicates (Figure 1a, closed and open grey diamonds). After 10 days, NO3 concentration had only decreased by 7.72% and 2.52% in the two replicates. That is, in reality NO3 uptake supported at most 10.4% of the biomass formed in the first culture replicate and 2.3 in the second. The hypothesis of a NO3-supported growth (visualized by the grey lines on Figure 1a) does not match the observed evolution of NO3 in the culture, and must therefore be refuted.

3.2.2. Experiment #2

The growth rates obtained in the two (NO3-rich) cultures exposed to continuous illumination are 0.19 (R2 = 0.99) and 0.22 (R2 = 0.99) d−1, which is about 50% slower than the growth rates observed under light:dark cycles for the same 24 h-integrated light dose. The average cell volume in this experiment is 18.06 μm3. Therefore, the average N content is 48.52 fmol N cell−1. The total amount of PON formed over the 15-day growth period is 411 and 570 μmol N L−1 (Figure 1b, closed and open black circles). As in Experiment 1, we simulated how NO3 concentrations in the medium should evolve, if biomass formed in this experiment is supported by NO3 uptake (Figure 1b, solid and dashed grey lines). Given the observed biomass dynamics, we predict that NO3 concentrations after 15 days should have been drawn down by 60% and 43% of the initial concentration in the two culture replicates (Figure 1b, thick grey lines). However, the NO3 concentration actually decreased by 9.7% and 18.2% (Figure 1b, closed and open grey diamonds). In the end, NO3 uptake may have supported at most 24.55% and 27.54% of the observed biomass increase. Here again, the hypothesis of a NO3 supported growth does not agree with the data. Despite the very unfavorable conditions that the continuous irradiance imposes on the nitrogenase, most of the nitrogen in the biomass is acquired through N2 fixation in the two LL cultures.

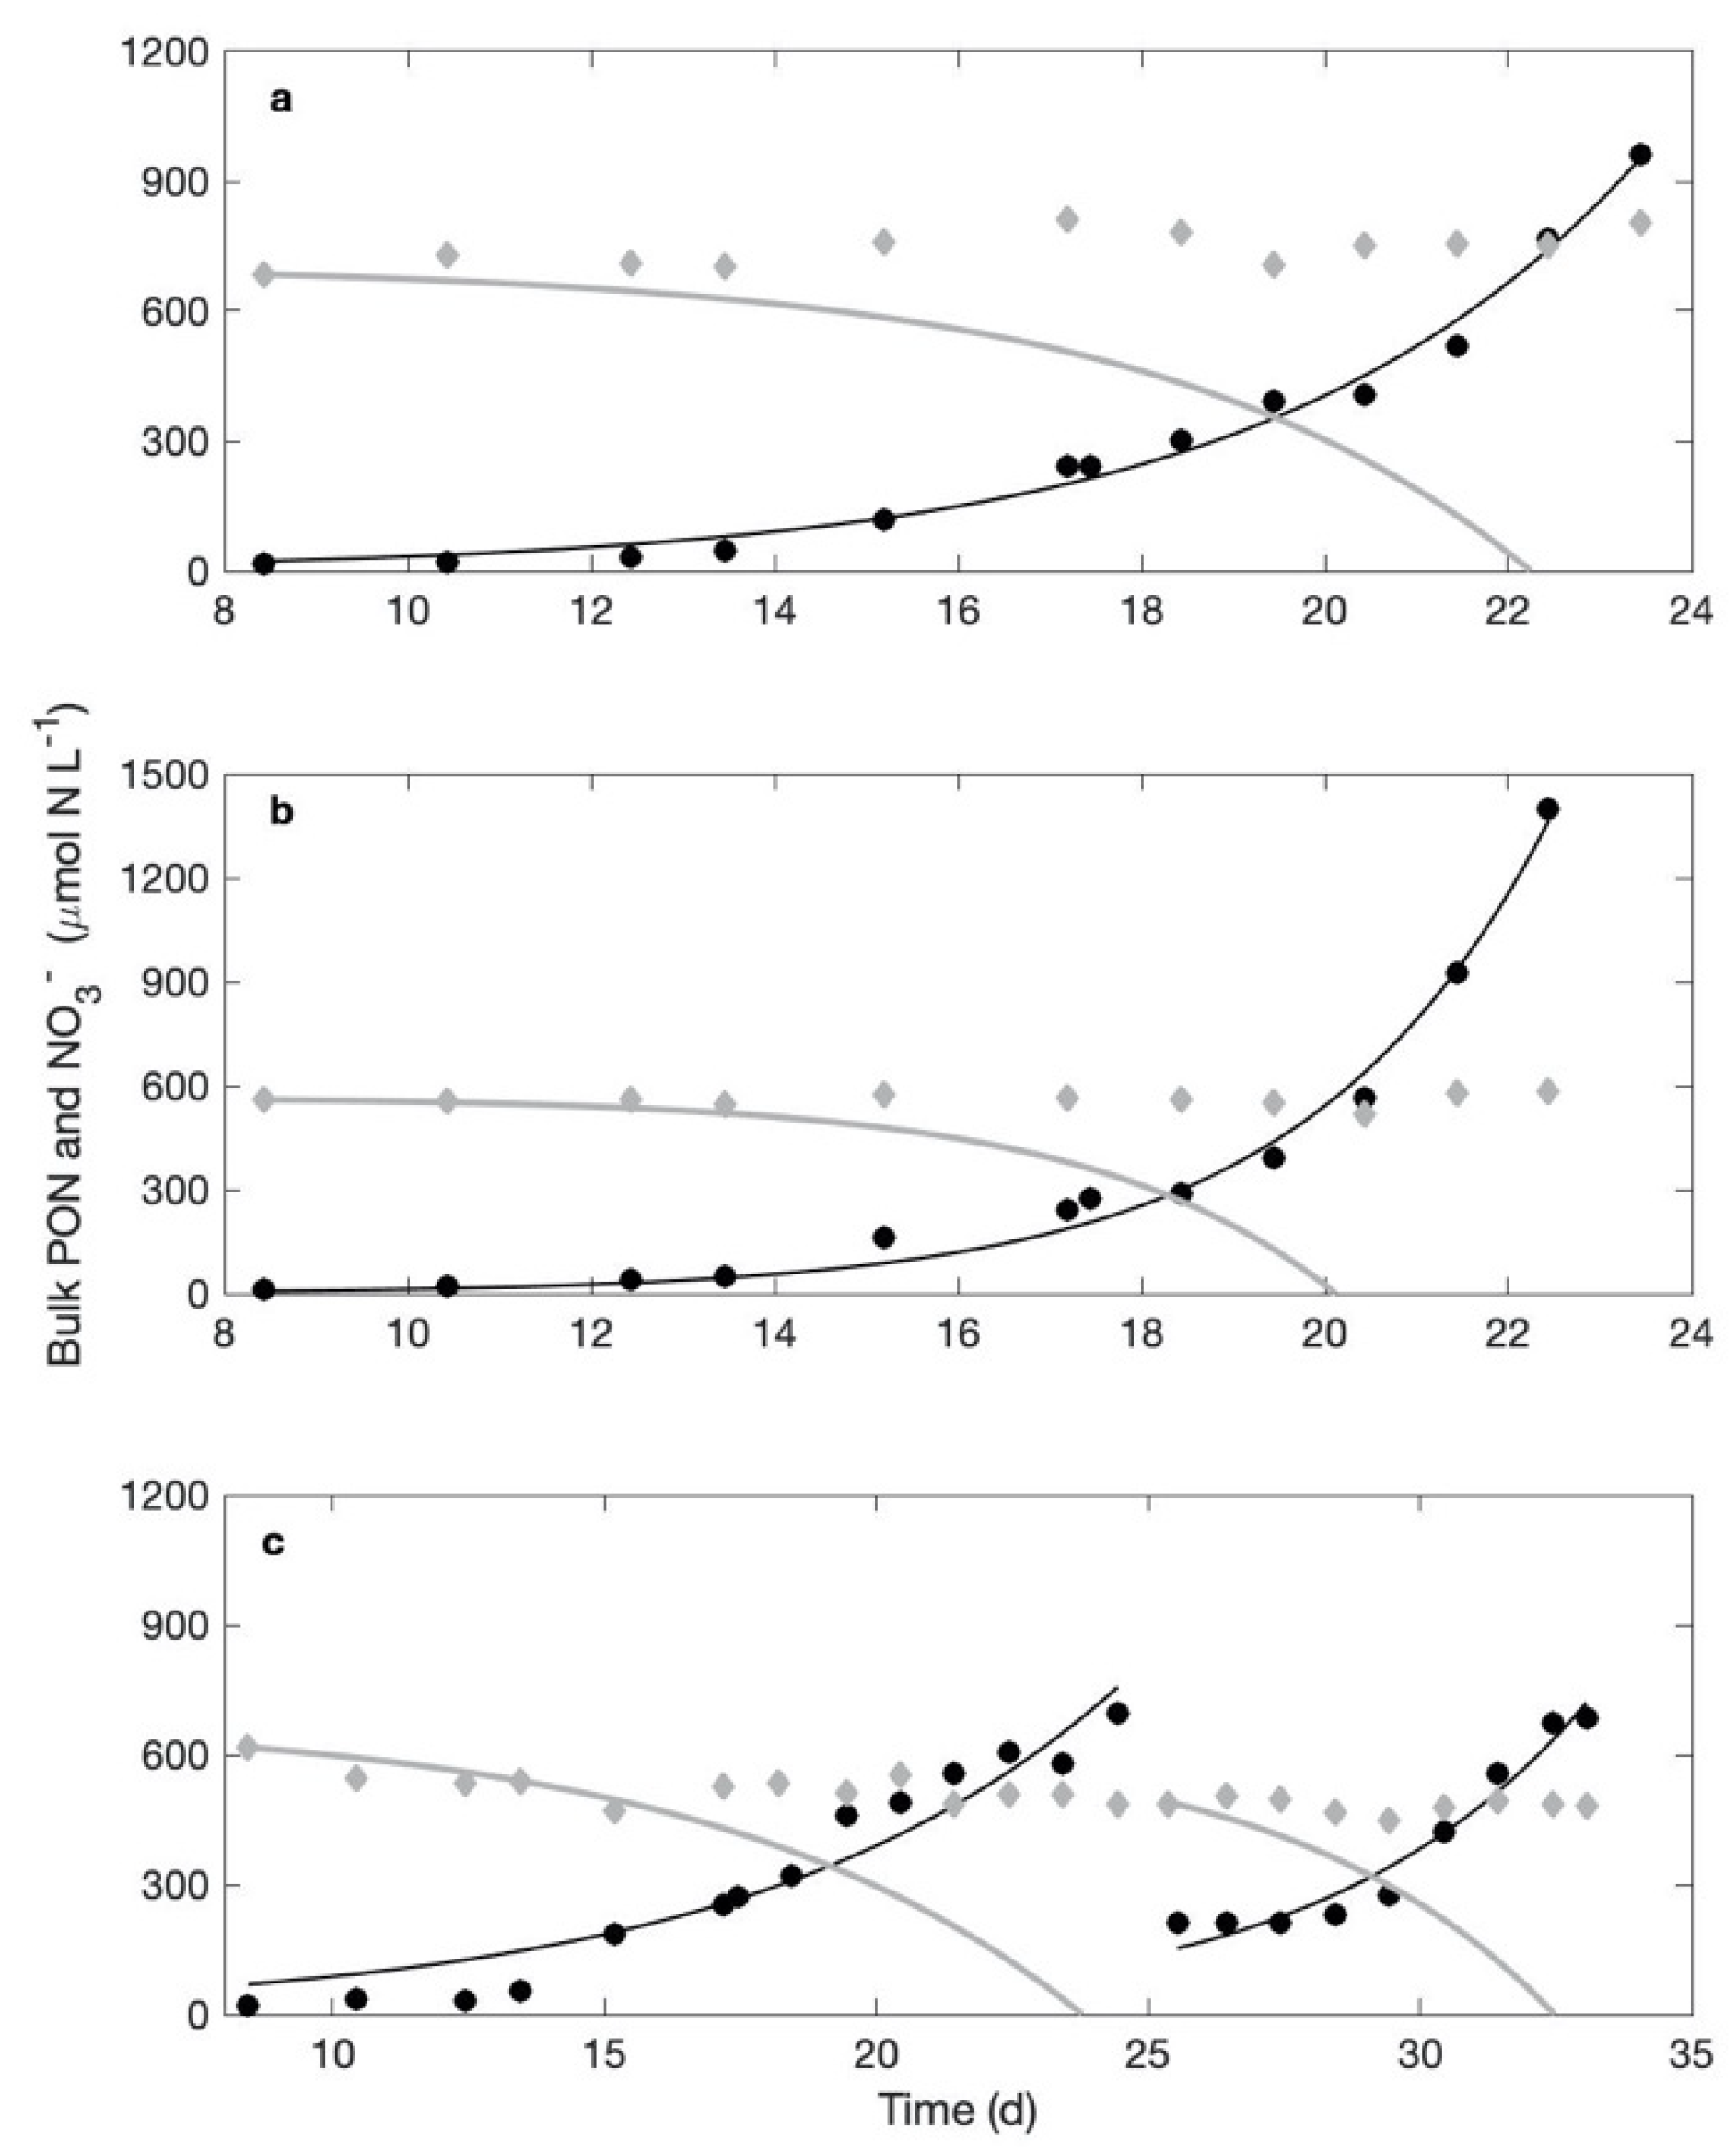
3.2.3. Experiment #3

In this experiment, we monitored the population dynamics in triplicate cultures over several growth phases, i.e., in between repeated dilutions of the culture medium.

Experiment #3-1

NO3-rich cultures were started with an initial concentration of 800 μmol NO3 L−1. During exponential growth, we obtained a total of six recorded maximum growth rates per treatment. Their average is 0.32 ± 0.02 d−1 in the NO3-rich cultures and 0.34 ± 0.02 d−1 in the NO3-free cultures (Figure 2). An independent-samples Student t-test run on the two sets of six growth rates (p = 0.57) indicates that they do not statistically differ between the treatments. Therefore, we conclude that cells grew equivalently well whether cultures were devoid of, or supplied with, NO3. Another t-test performed on the cell sizes (n = 91 for the NO3-rich cultures and n = 68 for the NO3-free cultures; p = 0.09) indicates that cell sizes do not statistically differ either between treatments.
The average N cellular content measured in the NO3-rich cultures is 62.47 ± 9.74 fmol N cell−1. The total PON formed during the experiment is 930.6 and 1357.8 μmol N L−1 in replicates A and B, respectively, and 686.7 and 567.1 μmol N L−1 in the two growth phases of replicate C (Figure 2). The total amount of nitrate that disappeared from the cultures over the exact same period is null in the first two replicates, and 71.8 and 9.29 μmol NO3 L−1 in the third replicate (Figure 2). In the end, NO3 uptake supported none of the biomass formation in the first two replicates, and at most 10.5 and 1.6% of the biomass increase in the third replicate.
We performed a total of 18 15N2 incubations on samples from the NO3- rich cultures and 18 on samples from the NO3- free cultures. The according N production estimated from the 15N2 incorporation is 1.37 ± 0.75 fmol N cell−1 d−1 in the NO3-rich cultures and 1.99 ± 0.72 fmol N cell-1 d-1 in the NO3-free cultures. The daily N production estimated by the isotopic method represents 2.59 ± 1.43% of the cellular N in the NO3-rich cultures and 5.15 ± 2.11% of the cellular N in the NO3-free cultures. Although the measured rates of 15N2 incorporations are very low in both treatments, they show the same order of magnitude, suggesting that similar N2 fixation activities occurred in the two treatments. An independent-samples Student t-test run on the two sets of N2 incorporation rates (p = 0.14), confirms that the biomass increase supported by N2 fixation is not significantly different between the two treatments. Therefore, we conclude by observing equivalent N2 incorporation rates between NO3-free and NO3-rich cultures.
Nitrogenase activity recorded using on-line GC incubations revealed very similar dynamics in the NO3-rich cultures and the NO3-free cultures. The average records taken on the NO3-rich and NO3-free cultures are shown on Figure 3. Nitrogenase activity becomes detectable after about 3 h into the dark phase, peaks around mid-dark, and decreases thereafter to arrive back at undetectable levels by the end of the dark. Some day-today variability can be observed but with very similar magnitude between the two treatments. Records were taken throughout the entire experiment period as cells were growing exponentially, indicating that no significant change in nitrogenase activity occurred in the course of the experiment. The average, gross amount of nitrogen fixed per day in this experiment is 496.7 ± 203.1 fmol N cell−1 d−1 (n = 6) in the NO3-rich cultures and 510.4 ± 186.2 fmol N cell−1 d−1 (n = 4) in the NO3-free cultures. As already reported previously [4,31,35,36,37], these gross rates derived from the enzyme activity largely exceed the net growth requirements. The ratio between the gross amount fixed to the total nitrogen content in cells spans from 4.8 to 13.8 in the NO3-rich cultures and from 5.2 to 14.0 in the NO3-free cultures. Given the respective growth rates of 0.32 and 0.34 d−1 in the NO3-rich and the NO3-free cultures, each cell needs a net gain of 17.9 and 17.7 fmol N per day on average, meaning that the estimated gross enzyme activity was on average 27.7 and 28.8 times larger than the net N requirements in the NO3-rich and the NO3-free cultures, respectively. Overall, the recorded enzymatic activity of the nitrogenase is thus extremely similar between the treatments, so totally unaffected by the presence of nitrate in the cultures.

Experiment #3-2

In this experiment, the NO3-rich cultures were started with an initial concentration of 90 μmol NO3 L−1. The population dynamics monitored in the triplicate cultures shows an average, exponential growth rate of 0.39 ± 0.03 d−1 in the NO3-rich cultures and 0.37 ± 0.06 d−1 in the NO3-free cultures. Again, these exponential growth rates are not statistically different (independent-samples Student t-test; p = 0.57) whether cultures are supplied with NO3 or not. Nitrogen content in the biomass averages 55.44 ± 1.44 fmol N cell−1 in the NO3-rich cultures. PON samples were acquired from day 9 to 16. We used this measured, average PON content per cell and the population dynamics measured in numbers over the first nine days to reconstruct the dynamics expressed in mass of nitrogen in the NO3-rich cultures (Figure 4, black lines). Over the first nine days, the PON in the biomass increased by 220.8 ± 22.5 μmol N L−1. The hypothetical, simulated NO3 consumption (grey line on Figure 4), should cell growth be supported by NO3 uptake, indicates that the NO3 stock should have been depleted in 6 days. Instead, NO3 concentrations remained essentially constant in the three replicates over the same period: the deviation around the mean concentration is 0.94, 1.27 and 2.09 μmol N L−1). Between days 8 and 16, the biomass increased by 584.8 ± 81.7 μmol N L−1 in the three NO3-rich cultures. The simulated NO3 consumption during the second phase of growth (from day 8) predicts a dramatic decrease in NO3 concentrations, due to the already higher level of biomass compared with that in the beginning of the experiment. There, NO3 should in theory be depleted in less than two days to cover for the PON buildup in the biomass (Figure 4). Instead, the measured NO3 concentrations decreased by 12.8 μmol L−1. In the end, over this 15-day experiment, the average biomass formed is 777.53 ± 58.84 μmol N L−1, while only 14.6 ± 2.66 μmol NO3 L−1 disappeared from the cultures. NO3 uptake supported at most 1.90 ± 0.45% of the nitrogen biomass formed in the three NO3-rich cultures.

4. Discussion

Biological nitrogen fixation in the open ocean represents a critical entry point for new nitrogen into the marine N cycle. Yet the accuracy of current estimations of global N2 fixation rates remains an open debate, with evidence pointing to their systematic underestimation. One long standing, questionable paradigm suggests that open ocean diazotrophs will not be found fixing nitrogen in areas where NO3 is available. In the present analysis, we prove that nitrogen fixation rates in the unicellular cyanobacterium C. watsonii WH8501 are not hindered in the presence of NO3 when light energy is sufficient to support nitrogen fixation.
The first main message that we derive from these experiments is that, in all the experiments we performed under a natural light regime (i.e., under light:dark cycles), NO3 provision did not stimulate the growth rates, nor did the high NO3 concentrations show any deleterious effect on growth efficiency. The fact that the exponential growth rates, derived from the counts over repeated experiments, are not significantly different between treatments is irrefutable proof that overall growth, in terms of population dynamics, was not enhanced in the presence of nitrate.
As cell sizes were also similar in NO3-rich and NO3-free cultures, the net incorporation of N (whatever its origin) and C is expected to be equivalent, whether in terms of rate or stock in the cells. It could be that cultures incorporated equivalent amounts of N in both treatments, but that cultures in the presence of NO3 switched from N2 fixation to NO3 uptake. From their analysis, Garcia and Hutchins [26] deduced that available light energy drives the growth rate, which results in an according nitrogen demand; cells take up DIN when available and, if need be, N2 fixation provides the complement to meet this N demand. If that is also the case in our experiments, we should observe a positive incorporation of NO3 in cells as well as an exponential decrease in NO3 concentration in the cultures, matching the exponential growth of the biomass, since these cultures are closed systems. The amount of nitrate disappearing from the culture following this uptake tells us to what extent NO3 use supports cell growth. The observation of the NO3 concentrations in all experiments indicate that the nitrate possibly taken up by Crocosphaera only supported a small percentage of the biomass produced (Figure 1, Figure 2 and Figure 4). Note that, had the baseline correction not been applied, results would have changed by a couple of percentage points only, which does not affect the main results discussed here, i.e., a striking absence of significant use of NO3 for growth. Besides, the changes in NO3 concentrations were so small that linear fits gave more robust results than exponential decreases. Yet, if NO3 uptake by the biomass is driven by the exponential growth of the population, the decreasing trends in NO3 concentration should be exponential: they never were in our experiments, no matter the NO3 availability. Note that Garcia and Hutchins [26] performed their experiments on Crocosphaera watsonii strain WH0003, not WH8501 as in the present study. A major difference thus appears between these two strains, in the fact that DIN is the primary N source for WH0003 while WH8501 does not seem to make use of NO3 to support their growth and almost completely relies on N2 fixation.
Logically, if cells are to switch to NO3 use, the N2 fixation rate is also expected to decrease accordingly. At the irradiance level applied in our study, we observed no statistically significant reduction in N2 fixation in the cultures grown in nitrate. Instead, as shown by 15N2 incubations, cells cultivated with a non-limiting supply of nitrate keep fixing N2 at equivalent rates as cells maintained under obligate diazotrophy. The specific, nitrogen production derived from nitrogen fixation, both per cell or per um3 (fmol N cell−1 d−1 or fmol N μm−3 d−1), is equivalent in all cultures, whether provided with NO3 or not. Very consistent with these results are the on-line records of nitrogenase activity (Figure 3), which reveal an unaffected daily dynamics of the enzymatic activity in the NO3-rich cultures compared to that in NO3-free cultures, as well as an efficient activity leading to equivalent daily gross estimates of fixed N2. Note that we express some reservations about the estimated rates of N2 incorporation derived from the isotopic analyses as their magnitude is far lower than the N incorporation deduced from PON quantifications. As argued by Grosskopf et al. [38], the 15N method tends to produce systematic underestimations of N2 fixation rates. If we do not rule out such possibility, we at least strongly believe that the actual enrichment remained consistent throughout the incubations, making our results valid in terms of proportion between treatments.
Another reason why Crocosphaera did not start to use NO3 might be that, due to the acclimation phase, cellular reserves were replenished, which would have made them less dependent upon external sources. Although we are not sure whether and how many times a cell may divide on its sole reserves, it is reasonable to think they cannot store enough N to sustain many divisions because N is the second major component of the biomass and cells are sterically limited. When cells grow at 0.3 to 0.4 d−1, they divide every ~1.7 to 2.3 days. So even if one or two divisions were supported by internal reserves, cells would need to replenish these again after a few days and this demand should then show on the NO3 concentration data. No such lag phase in NO3 consumption appears in any of the experiments, whose duration is very long compared to the division time. Whether cells are provided with nitrate or not, their reserves are replenished by N2 fixation. We thus can rule out any possible “internal reserve effect” on NO3 uptake.
Crocosphaera not using NO3 could be explained by the expression of nitrate assimilation genes being cryptic in this strain. However, in a global transcriptomic profiling of gene expression of this strain grown under N2, the transcripts for the narB gene encoding the nitrate reductase, the nirA gene involved in nitrate and nitrite reduction as well as the gene nrtP encoding high-affinity nitrate/nitrite bispecific transporter have been detected [39]. A specific analysis of the transcription of these genes under the experimental conditions used in our study will help in confirming these data. If these genes are actually expressed, it would be relevant to uncover the post-transcriptional regulation that could explain why the strain does not use nitrate. We sought to restrain N2 fixation by placing cells in conditions very unfavorable to nitrogenase activity. Nitrogenase being irreversibly inactivated by oxygen [40], unicellular, diazotrophic cyanobacteria has evolved a temporal separation of nitrogen fixation and of the oxygen-evolving photosynthesis, by confining nitrogenase synthesis and activity to the dark hours. The cultures exposed to continuous light did survive, but they showed here about a 33% reduction in their growth rate, compared to the cultures exposed to a L:D regime with the same daily light dose. This reduced growth rate could either be due to a lower, daily integrated photosynthetic efficiency related to the lower, instantaneous irradiance in the LL cultures, or to a negative impact of photosynthetically-evolved O2 on the nitrogenase enzyme, or both. In any case, this lower growth rate also implies a slower rate of nitrogen incorporation. The higher disappearance of nitrate from the culture medium compared to that under the LD regimes (Figure 1) suggests that the stress imposed by the continuous illumination did provoke a consumption of NO3 by C. watsonii. Therefore, the nitrate uptake pathway seems functional in this strain. Yet the predicted NO3 consumption required to fully support this growth still largely deviates from the actually observed NO3 concentrations (Figure 1B). Despite the stress imposed on the nitrogenase and the non-limiting availability of NO3, N2 fixation supported more than 75% of the biomass produced. We therefore conclude that in C. watsonii strain WH8501, N2 fixation is the primary pathway for N acquisition while NO3 is hardly used at all under natural (i.e., LD) light cycles. One may wonder whether, under very low irradiances, the additional costs imposed by N2 fixation [2,3] would not force cells to switch to NO3 uptake. Although this remains to be verified, we strongly suspect that cells will keep fixing N2 because they did not mainly switch to NO3 uptake under a continuous light despite the severe stress that this imposes on N2 fixation.
The present results demonstrate the existence of an NO3-insensitive cyanobacterial diazotrophy adding to a growing body of literature which modifies long-persisting paradigms of marine diazotrophy. In particular, we wish to encourage reconsideration of the N2 fixation process in biogeochemical models and the contribution of unicellular cyanobacteria to oceanic nitrogen fixation rates. N2 fixation is now explicitly included in biogeochemical models [41,42,43] but there are still significant issues with the placement of diazotrophs in areas rich in fixed nitrogen (relative to phosphorus), such as the North Atlantic [18,19]. This is related to the fact that the environmental controls on N2 fixation are still partially understood and insufficiently constrained in global models. Another difficulty is the still sparse availability of in situ data of abundance and activity of diazotrophs, which does not make model calibration any easier. Based on the hypothesis that N2 fixation should occur, or become competitive, when nitrate is limited, the process can be prescribed as a function of nutrients availability [44], assuming that the global N budget is balanced. The models HAMOCC [45,46] and MOPS [47] for instance, impose a constant biomass of diazotrophs and follow the above-mentioned concept by adjusting the rate of N2 fixation so that it balances the deviations of the NO3:PO43− ratio away from the Redfield [48,49] canonical value. Most parameterizations of N2 fixation are restricted to regions with observed low NO3:PO43− ratios, where it is prescribed to top up denitrification losses [46].
As emphasized by Kriest and Oschlies [47], predicting oceanic N fluxes is far from trivial, as they occupy a wide range of spatio-temporal scales that span from metabolic reactions within micrometer-large cells to the global circulation. Furthermore, the process of N2 fixation is all the more complex to describe, as it is operated by organisms with a variety of physiologies. Historically, the filamentous cyanobacterium Trichodesmium spp. was thought to be the major diazotroph in the open ocean [10], until the generalization of molecular tools revealed diverse diazotrophic capabilities in unicellular cyanobacteria (thereafter named UCYN) [9,22,23] as well as in heterotrophic bacteria [8,50]. We believe that while tackling the incongruence of nitrogen budgets at large scales, some answers will be found when looking at how N2 fixation operates at small scales, allowing for new parameterizations of the process to emerge in global models. Our results clearly suggest that, assuming that similarly behaving diazotrophs can also be found in nature, the occurrence of diazotrophs in the world ocean should not be delineated by availability of NO3. While diazotrophs may still be distributed by competition for nutrients, it may be that NO3 is less of a factor than was once considered. This may suggest that modelled, global rates of N2 fixation are underestimated due to the reduced overall biomass predicted in areas of significant NO3 concentration. Along with new results which have revealed a wider phylogeny of diazotrophs and their occurrence in areas where they were not suspected to occur, such as the polar regions (e.g., [51,52,53]), and the deep ocean (e.g., [54,55]), our results suggest that the study of marine diazotrophy is in need of expansion. This may help to alleviate the debate regarding global underestimation of marine N2 fixation which has been ongoing for the last two decades.

Author Contributions

Conceptualization, S.R., A.L. and A.O.; methodology, A.T., S.R., P.R. and T.B.; experiments implementation, B.R., S.R. and A.T.; data analysis, S.R. and B.R.; writing—original draft preparation and figures, S.R.; writing—review and editing, all authors; supervision, S.R. and A.O.; funding acquisition, S.R. and A.O. All authors have read and agreed to the published version of the manuscript.

Funding

This research was funded by the LEFE-CYBER program (Ntracking project). BR was equally supported by a fellowship from the Provence Côte d’Azur Region and from GEOMAR.

Institutional Review Board Statement

Not applicable.

Informed Consent Statement

Not applicable.

Data Availability Statement

All the data are shown in the manuscript and can be obtained from the authors upon request.

Acknowledgments

We wish to thank Nathalie Vigier for the enriching discussions on isotopic data and related methodologies.

Conflicts of Interest

The authors declare no conflict of interest. The funders had no role in the design of the study; in the collection, analyses, or interpretation of data; in the writing of the manuscript, or in the decision to publish the results.

References

  1. Falkowski, P.G. Enzymology of nitrogen assimilation. In Nitrogen in the Marine Environment; Carpenter, E.J., Capone, D.G., Eds.; Academic Press: San Diego, CA, USA, 1983; pp. 839–868. ISBN 978-0-12-160280-2. [Google Scholar]
  2. Großkopf, T.; LaRoche, J. Direct and Indirect Costs of Dinitrogen Fixation in Crocosphaera watsonii WH8501 and Possible Implications for the Nitrogen Cycle. Front. Microbiol. 2012, 3, 236. [Google Scholar] [CrossRef] [Green Version]
  3. Rabouille, S.; Campbell, D.A.; Masuda, T.; Zavřel, T.; Bernát, G.; Polerecky, L.; Halsey, K.; Eichner, M.; Kotabová, E.; Stephan, S.; et al. Electron and Biomass Dynamics of Cyanothece under Interacting Nitrogen and Carbon Limitations. Front. Microbiol. 2021, 12, 620. [Google Scholar] [CrossRef]
  4. Agawin, N.S.R.; Rabouille, S.; Veldhuis, M.J.W.; Servatius, L.; Hol, S.; van Overzee, H.M.J.; Huisman, J. Competition and Facilitation between Unicellular Nitrogen-Fixing Cyanobacteria and Non-Nitrogen-Fixing Phytoplankton Species. Limnol. Oceanogr. 2007, 52, 2233–2248. [Google Scholar] [CrossRef] [Green Version]
  5. Zehr, J.P.; Mellon, M.T.; Zani, S. New Nitrogen-Fixing Microorganisms Detected in Oligotrophic Oceans by Amplification of Nitrogenase (NifH) Genes. Appl. Environ. Microbiol. 1998, 64, 3444–3450. [Google Scholar] [CrossRef] [PubMed] [Green Version]
  6. Zehr, J.P.; Bench, S.R.; Carter, B.J.; Hewson, I.; Niazi, F.; Shi, T.; Tripp, H.J.; Affourtit, J.P. Globally Distributed Uncultivated Oceanic N2-Fixing Cyanobacteria Lack Oxygenic Photosystem II. Science 2008, 322, 1110–1112. [Google Scholar] [CrossRef] [PubMed] [Green Version]
  7. Tripp, H.J.; Bench, S.R.; Turk, K.A.; Foster, R.A.; Desany, B.A.; Niazi, F.; Affourtit, J.P.; Zehr, J.P. Metabolic Streamlining in an Open-Ocean Nitrogen-Fixing Cyanobacterium. Nature 2010, 464, 90–94. [Google Scholar] [CrossRef] [PubMed]
  8. Bombar, D.; Paerl, R.W.; Riemann, L. Marine Non-Cyanobacterial Diazotrophs: Moving beyond Molecular Detection. Trends Microbiol. 2016, 24, 916–927. [Google Scholar] [CrossRef] [PubMed]
  9. Moisander, P.H.; Beinart, R.A.; Hewson, I.; White, A.E.; Johnson, K.S.; Carlson, C.A.; Montoya, J.P.; Zehr, J.P. Unicellular Cyanobacterial Distributions Broaden the Oceanic N2 Fixation Domain. Science 2010, 327, 1512–1514. [Google Scholar] [CrossRef] [PubMed]
  10. Capone, D.G.; Zehr, J.P.; Paerl, H.W.; Bergman, B.; Carpenter, E.J. Trichodesmium, a Globally Significant Marine Cyanobacterium. Science 1997, 276, 1221–1229. [Google Scholar] [CrossRef] [Green Version]
  11. Knapp, A. The Sensitivity of Marine N2 Fixation to Dissolved Inorganic Nitrogen. Front. Microbiol. 2012, 3, 374. [Google Scholar] [CrossRef] [Green Version]
  12. Ohki, K.; Zehr, J.P.; Falkowski, P.G.; Fujita, Y. Regulation of Nitrogen Fixation by Different Nitrogen Sources in the Marine Non-Heterocystous Cyanobacterium Trichodesmium Sp. Nibb1067. Arch. Microbiol. 1991, 156, 335–337. [Google Scholar] [CrossRef]
  13. Mulholland, M.R.; Ohki, K.; Capone, D.G. Nutrient Controls on Nitrogen Uptake and Metabolism by Natural Populations and Cultures of Trichodesmium (Cyanobacteria). J. Phycol. 2001, 37, 1001–1009. [Google Scholar] [CrossRef]
  14. Fu, F.X.; Bell, P.R.F. Factors Affecting N2 Fixation by the Cyanobacterium Trichodesmium Sp. GBR-TRLI101. FEMS Microbiol. Ecol. 2003, 45, 203–209. [Google Scholar] [CrossRef] [Green Version]
  15. Holl, C.M.; Montoya, J.P. Interactions between Nitrate Uptake and Nitrogen Fixation in Continuous Cultures of the Marine Diazotroph Trichodesmium (Cyanobacteria). J. Phycol. 2005, 41, 1178–1183. [Google Scholar] [CrossRef]
  16. Sandh, G.; Ran, L.; Xu, L.; Sundqvist, G.; Bulone, V.; Bergman, B. Comparative Proteomic Profiles of the Marine Cyanobacterium Trichodesmium Erythraeum IMS101 under Different Nitrogen Regimes. Proteomics 2011, 11, 406–419. [Google Scholar] [CrossRef]
  17. Knapp, A.N.; Dekaezemacker, J.; Bonnet, S.; Sohm, J.A.; Capone, D.G. Sensitivity of Trichodesmium Erythraeum and Crocosphaera watsonii Abundance and N2 Fixation Rates to Varying NO3 and PO43− Concentrations in Batch Cultures. Aquat. Microb. Ecol. 2012, 66, 223–236. [Google Scholar] [CrossRef]
  18. Aumont, O.; Ethe, C.; Tagliabue, A.; Bopp, L.; Gehlen, M. PISCES-v2: An Ocean Biogeochemical Model for Carbon and Ecosystem Studies. Geosci. Model Dev. 2015, 8, 2465–2513. [Google Scholar] [CrossRef] [Green Version]
  19. Dunne, J.P.; John, J.G.; Shevliakova, E.; Stouffer, R.J.; Krasting, J.P.; Malyshev, S.L.; Milly, P.C.D.; Sentman, L.T.; Adcroft, A.J.; Cooke, W.; et al. GFDL’s ESM2 Global Coupled Climate–Carbon Earth System Models. Part II: Carbon System Formulation and Baseline Simulation Characteristics. J. Clim. 2013, 26, 2247–2267. [Google Scholar] [CrossRef] [Green Version]
  20. Schmittner, A.; Oschlies, A.; Matthews, H.D.; Galbraith, E.D. Future Changes in Climate, Ocean Circulation, Ecosystems, and Biogeochemical Cycling Simulated for a Business-as-Usual CO2 Emission Scenario until Year 4000 AD. Glob. Biogeochem. Cycles 2008, 22. [Google Scholar] [CrossRef] [Green Version]
  21. Luo, Y.W.; Doney, S.C.; Anderson, L.A.; Benavides, M.; Berman-Frank, I.; Bode, A.; Bonnet, S.; Bostrom, K.H.; Bottjer, D.; Capone, D.G.; et al. Database of Diazotrophs in Global Ocean: Abundance, Biomass and Nitrogen Fixation Rates. Earth Syst. Sci. Data 2012, 4, 47–73. [Google Scholar] [CrossRef] [Green Version]
  22. Zehr, J.P.; Waterbury, J.B.; Turner, P.J.; Montoya, J.P.; Omoregie, E.; Steward, G.F.; Hansen, A.; Karl, D.M. Unicellular Cyanobacteria Fix N2 in the Subtropical North Pacific Ocean. Nature 2001, 412, 635–638. [Google Scholar] [CrossRef] [PubMed]
  23. Zehr, J.P. Nitrogen Fixation by Marine Cyanobacteria. Trends Microbiol. 2011, 19, 162–173. [Google Scholar] [CrossRef]
  24. Zehr, J.P.; Capone, D.G. Changing Perspectives in Marine Nitrogen Fixation. Science 2020, 368, eaay9514. [Google Scholar] [CrossRef]
  25. Dekaezemacker, J.; Bonnet, S. Sensitivity of N2 Fixation to Combined Nitrogen Forms (NO3 and NH4+) in Two Strains of the Marine Diazotroph Crocosphaera watsonii (Cyanobacteria). Mar. Ecol.-Prog. Ser. 2011, 438, 33–46. [Google Scholar] [CrossRef] [Green Version]
  26. Garcia, N.S.; Hutchins, D.A. Light-Limited Growth Rate Modulates Nitrate Inhibition of Dinitrogen Fixation in the Marine Unicellular Cyanobacterium Crocosphaera watsonii. PLoS ONE 2014, 9, e114465. [Google Scholar] [CrossRef]
  27. Waterbury, J.B.; Watson, S.W.; Valois, F.W. Temporal Separation of Photosynthesis and Dinitrogen Fixation in the Marine Unicellular Cyanobacterium Erythrosphaera marina. EOS 1988, 69, 1089. [Google Scholar]
  28. Waterbury, J.B.; Rippka, R. The order Chroococcales. In Bergey’s Manual of Systematic Bacteriology; Krieg, N.R., Holt, J.B., Eds.; Williams & Wilkins: Baltimore, MD, USA, 1989; Volume 3, pp. 1728–1746. [Google Scholar]
  29. Rabouille, S.; Cabral, G.S.; Pedrotti, M.L. Towards a Carbon Budget of the Diazotrophic Cyanobacterium Crocosphaera: Effect of Irradiance. Mar. Ecol.-Prog. Ser. 2017, 570, 29–40. [Google Scholar] [CrossRef]
  30. Chen, Y.B.; Zehr, J.P.; Mellon, M. Growth and Nitrogen Fixation of the Diazotrophic Filamentous Non Heterocystous Cyanobacterium Trichodesmium Sp IMS 101 in Defined Media: Evidence for a Circadian Rhythm. J. Phycol. 1996, 32, 916–923. [Google Scholar] [CrossRef]
  31. Dron, A.; Rabouille, S.; Claquin, P.; Le Roy, B.; Talec, A.; Sciandra, A. Light-Dark (12:12) Cycle of Carbon and Nitrogen Metabolism in Crocosphaera watsonii WH8501: Relation to the Cell Cycle. Environ. Microbiol. 2012, 14, 967–981. [Google Scholar] [CrossRef]
  32. Malara, G.; Sciandra, A. A Multiparameter Phytoplankton Culture System Driven by Microcomputer. J. Appl. Phycol. 1991, 3, 235–241. [Google Scholar] [CrossRef]
  33. Montoya, J.P.; Voss, M.; Kahler, P.; Capone, D.G. A Simple, High-Precision, High-Sensitivity Tracer Assay for N2 Fixation. Appl. Environ. Microbiol. 1996, 62, 986–993. [Google Scholar] [CrossRef] [Green Version]
  34. Raimbault, P.; Garcia, N. Evidence for Efficient Regenerated Production and Dinitrogen Fixation in Nitrogen-Deficient Waters of the South Pacific Ocean: Impact on New and Export Production Estimates. Biogeosciences 2008, 5, 323–338. [Google Scholar] [CrossRef] [Green Version]
  35. Dron, A.; Rabouille, S.; Claquin, P.; Talec, A.; Raimbault, V.; Sciandra, A. Photoperiod Length Paces the Temporal Orchestration of Cell Cycle and Carbon-Nitrogen Metabolism in Crocosphaera watsonii. Environ. Microbiol. 2013, 15, 3292–3304. [Google Scholar] [CrossRef] [PubMed]
  36. Glibert, P.M.; Bronk, D.A. Release of Dissolved Organic Nitrogen by Marine Diazotrophic Cyanobacteria, Trichodesmium spp. Appl. Environ. Microbiol. 1994, 60, 3996–4000. [Google Scholar] [CrossRef] [Green Version]
  37. Mulholland, M.R.; Bernhardt, P.W. The Effect of Growth Rate, Phosphorus Concentration, and Temperature on N2 Fixation, Carbon Fixation, and Nitrogen Release in Continuous Cultures of Trichodesmium IMS101. Limnol. Oceanogr. 2005, 50, 839–849. [Google Scholar] [CrossRef]
  38. Großkopf, T.; Mohr, W.; Baustian, T.; Schunck, H.; Gill, D.; Kuypers, M.M.M.; Lavik, G.; Schmitz, R.A.; Wallace, D.W.R.; LaRoche, J. Doubling of Marine Dinitrogen-Fixation Rates Based on Direct Measurements. Nature 2012, 488, 361–364. [Google Scholar] [CrossRef] [PubMed] [Green Version]
  39. Shi, T.; Ilikchyan, I.; Rabouille, S.; Zehr, J.P. Genome-Wide Analysis of Diel Gene Expression in the Unicellular N-2-Fixing Cyanobacterium Crocosphaera watsonii WH 8501. ISME J. 2010, 4, 621–632. [Google Scholar] [CrossRef] [Green Version]
  40. Gallon, J.R. Reconciling the Incompatible—N2 Fixation and O2. New Phytol. 1992, 122, 571–609. [Google Scholar] [CrossRef]
  41. Hood, R.R.; Bates, N.R.; Capone, D.G.; Olson, D.B. Modeling the Effect of Nitrogen Fixation on Carbon and Nitrogen Fluxes at BATS. Deep-Sea Res. Part II 2001, 48, 1609–1648. [Google Scholar] [CrossRef]
  42. Fennel, K.; Spitz, Y.H.; Letelier, R.M.; Abbott, M.R.; Karl, D.M. A Deterministic Model for N2 Fixation at Stn. ALOHA in the Subtropical North Pacific Ocean. Deep-Sea Res. Part II 2002, 49, 149–174. [Google Scholar] [CrossRef] [Green Version]
  43. Moore, J.K.; Doney, S.C.; Kleypas, J.A.; Glover, D.M.; Fung, I.Y. An Intermediate Complexity Marine Ecosystem Model for the Global Domain. Deep-Sea Res. Part II-Top. Stud. Oceanogr. 2002, 49, 403–462. [Google Scholar] [CrossRef] [Green Version]
  44. Deutsch, C.; Sarmiento, J.L.; Sigman, D.M.; Gruber, N.; Dunne, J.P. Spatial Coupling of Nitrogen Inputs and Losses in the Ocean. Nature 2007, 445, 163–167. [Google Scholar] [CrossRef] [PubMed]
  45. Maier-Reimer, E.; Kriest, I.; Segschneider, J.; Wetzel, P. The HAMburg Ocean Carbon Cycle Model HAMOCC5.1—Technical Description Release 1.1. Berichte zur Erdsystemforschung 2004, 14. [Google Scholar]
  46. Ilyina, T.; Six, K.D.; Segschneider, J.; Maier-Reimer, E.; Li, H.; Núñez-Riboni, I. Global Ocean Biogeochemistry Model HAMOCC: Model Architecture and Performance as Component of the MPI-Earth System Model in Different CMIP5 Experimental Realizations. J. Adv. Model. Earth Syst. 2013, 5, 287–315. [Google Scholar] [CrossRef]
  47. Kriest, I.; Oschlies, A. MOPS-1.0: Towards a Model for the Regulation of the Global Oceanic Nitrogen Budget by Marine Biogeochemical Processes. Geosci. Model Dev. 2015, 8, 2929–2957. [Google Scholar] [CrossRef] [Green Version]
  48. Redfield, A.C. On the Proportions of Organic Derivations in Sea Water and Their Relation to the Composition of Plankton. In James Johnstone Memorial Volume; Daniel, R.J., Ed.; University Press of Liverpool: Merseyside, UK, 1934; pp. 177–192. [Google Scholar]
  49. Redfield, A.C.; Ketchum, B.H.; Richards, F.A. The Influence of Organisms on the Composition of Sea-Water. In The Composition of Seawater. Comparative and Descriptive Oceanography. The Sea: Ideas and Observations on Progress in the Study of the Seas; Hill, M.N., Ed.; Wiley-Interscience: New York, NY, USA, 1963; Volume 2, pp. 26–77. [Google Scholar]
  50. Moisander, P.H.; Serros, T.; Paerl, R.W.; Beinart, R.A.; Zehr, J.P. Gammaproteobacterial Diazotrophs and NifH Gene Expression in Surface Waters of the South Pacific Ocean. ISME J. 2014, 8, 1962–1973. [Google Scholar] [CrossRef] [PubMed]
  51. Blais, M.; Tremblay, J.-É.; Jungblut, A.D.; Gagnon, J.; Martin, J.; Thaler, M.; Lovejoy, C. Nitrogen Fixation and Identification of Potential Diazotrophs in the Canadian Arctic. Glob. Biogeochem. Cycles 2012, 26. [Google Scholar] [CrossRef]
  52. Shiozaki, T.; Fujiwara, A.; Ijichi, M.; Harada, N.; Nishino, S.; Nishi, S.; Nagata, T.; Hamasaki, K. Diazotroph Community Structure and the Role of Nitrogen Fixation in the Nitrogen Cycle in the Chukchi Sea (Western Arctic Ocean). Limnol. Oceanogr. 2018, 63, 2191–2205. [Google Scholar] [CrossRef] [Green Version]
  53. Shiozaki, T.; Fujiwara, A.; Inomura, K.; Hirose, Y.; Hashihama, F.; Harada, N. Biological Nitrogen Fixation Detected under Antarctic Sea Ice. Nat. Geosci. 2020, 13, 729–732. [Google Scholar] [CrossRef]
  54. Hewson, I.; Moisander, P.H.; Achilles, K.M.; Carlson, C.A.; Jenkins, B.D.; Mondragon, E.A.; Morrison, A.E.; Zehr, J.P. Characteristics of Diazotrophs in Surface to Abyssopelagic Waters of the Sargasso Sea. Aquat. Microb. Ecol. 2007, 46, 15–30. [Google Scholar] [CrossRef]
  55. Moisander, P.H.; Benavides, M.; Bonnet, S.; Berman-Frank, I.; White, A.E.; Riemann, L. Chasing after Non-Cyanobacterial Nitrogen Fixation in Marine Pelagic Environments. Front. Microbiol. 2017, 8, 1736. [Google Scholar] [CrossRef]
Figure 1. Measured and fitted population dynamics of Crocosphaera expressed as particulate organic nitrogen (PON, μmol N L−1) and NO3 concentrations (a) in the two LD, NO3-rich culture replicates from Experiment #1 and (b) in the two LL, NO3-rich culture replicates from Experiment #2. Measured biomass concentration (closed and open black circles) (μmol N L−1) and the corresponding, measured nitrate concentrations (closed and open grey diamonds) in the cultures. Black lines (continuous and dashed) represent the fitted cell biomass and thick grey lines (continuous and dashed) the predicted changes in NO3 concentration that would result from a growth entirely supported by NO3 uptake.
Microorganisms 09 02073 g001
Figure 2. Experiment 3-1. Measured (closed, black circles) and fitted (black line) biomass dynamics expressed as particulate organic nitrogen (PON, μmol N L−1) and measured NO3 concentration (grey, closed diamonds) in the three culture replicates (ac) of the NO3-rich cultures. The grey line is the predicted changes in NO3 concentration that would be observed should nitrate uptake support 100% of the biomass formed during the experiment.
Microorganisms 09 02073 g002
Figure 3. Experiment 3-1. Nitrogenase activity in (a) the NO3-rich cultures and (b) the NO3-free cultures. The average, real-time N2 fixation rate recorded on the cultures (black line), expressed in μmol N2 fixed per hour and per million cells, is shown with its standard deviation (grey shaded area). Vertical dashed lines indicate the onset of the dark (at D0) and onset of the light (after 12 h of dark, at D12 = L0).
Microorganisms 09 02073 g003
Figure 4. Experiment 3-2. Measured (closed, black circles) and fitted (black line) biomass dynamics expressed as particulate organic nitrogen (PON, μmol N L−1; left axis) and measured NO3 concentration (grey, closed diamonds; μmol NO3 L−1; right axis) for two successive growth sequences in the three culture replicates (ac) of the NO3-rich cultures. The grey lines are the predicted changes in NO3 concentration that would be observed should nitrate uptake support 100% of the biomass formed during the experiment. PON values are measured directly from day 9 to 16 and converted from cell counts during the first 8 days; a conservative approach was to split the analysis of this experiment into two phases (days (0–8) and (9–16)). Note the difference in scale between the two Y axes.
Microorganisms 09 02073 g004
Table 1. Summary of the experimental conditions tested, and data acquired, in the three series of experiments. LD, Light:Dark. LL, Light:Light (i.e., continuous light). (+) and (−) indicate that cultures were grown with or without NO3. Max NO3 support, maximum percentage of the N incorporated in the biomass possibly supported by NO3 uptake. The symbol indicates that averages measured in the NO3-rich and NO3-free cultures (in a given experiment) are not statistically significant at the 5% level.
ConditionExperiment #1Experiment #2Experiment #3
3.13.2
Light regimeLDLLLDLD
irradiance (µE m−2 s−1)240120220260
NO3 (μmol N·L−1)(+)(−)(+)(+)(−)(+)(−)
Growth rate (d−1)0.30, 0.310.43, 0.35 0.19, 0.220.32 ± 0.020.34 ± 0.02 0.39 ± 0.030.37 ± 0.06
N content (fmolN cell−1)33.2248.5262.47 ± 9.7455.4 ± 1.44
Max NO3 support (%)10.4, 2.3NA24.55, 27.540, 10.5, 1.61.90 ± 0.45
Publisher’s Note: MDPI stays neutral with regard to jurisdictional claims in published maps and institutional affiliations.

