Polymorphisms in Pepsinogen C and miRNA Genes Associate with High Serum Pepsinogen II in Gastric Cancer Patients

 , , , , , , and
Abstract
:1. Introduction
2. Materials and Methods
2.1. Biological Materials and Research Ethics
2.2. Clinical Data and Analytical Procedures
2.3. Genotyping Assays
2.4. Two-Dimensional Difference in Gel Electrophoresis, 2D-DIGE, Analysis
2.5. NanoString Analysis
2.6. Statistical Analyses
3. Results
3.1. Clinical Characteristics of Patients
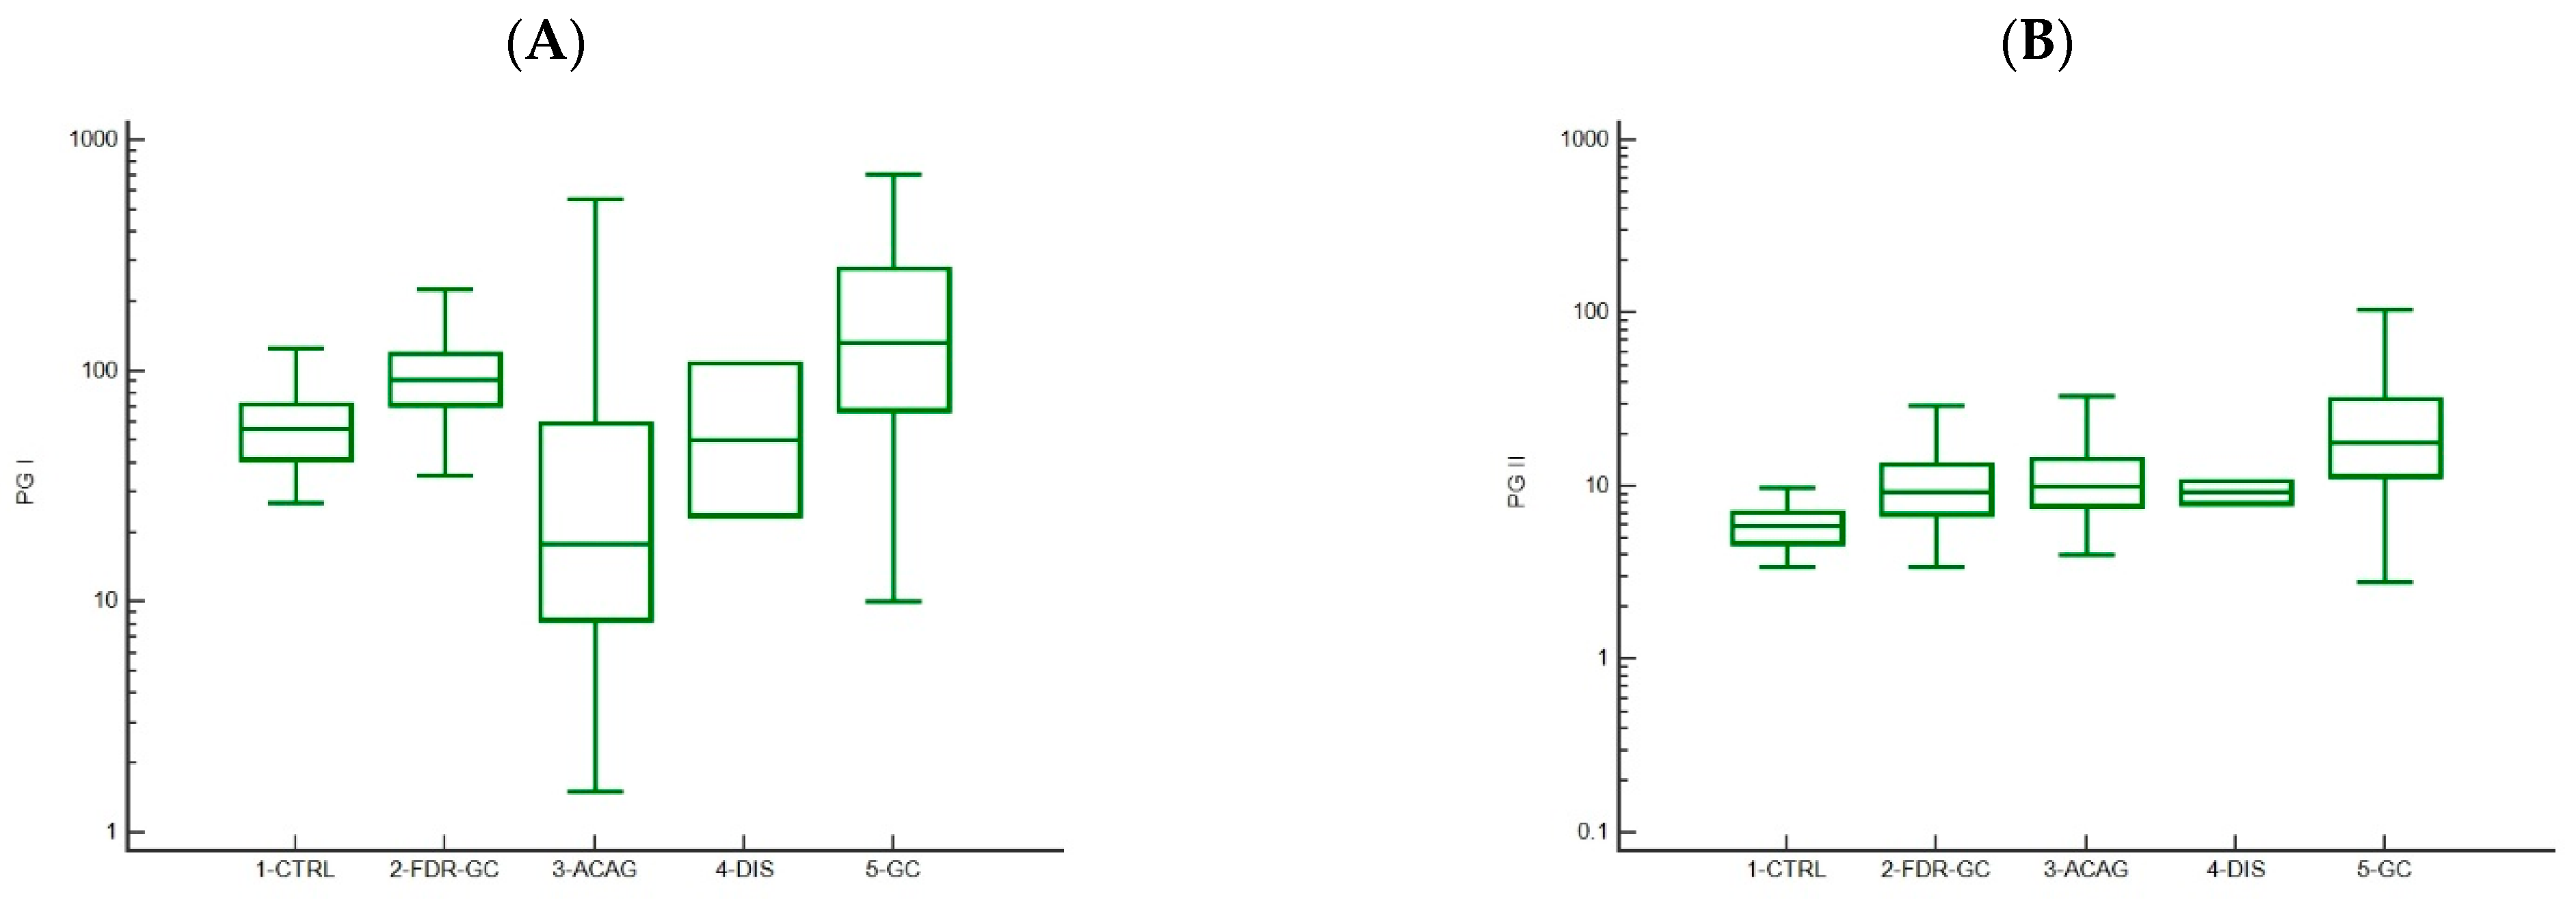
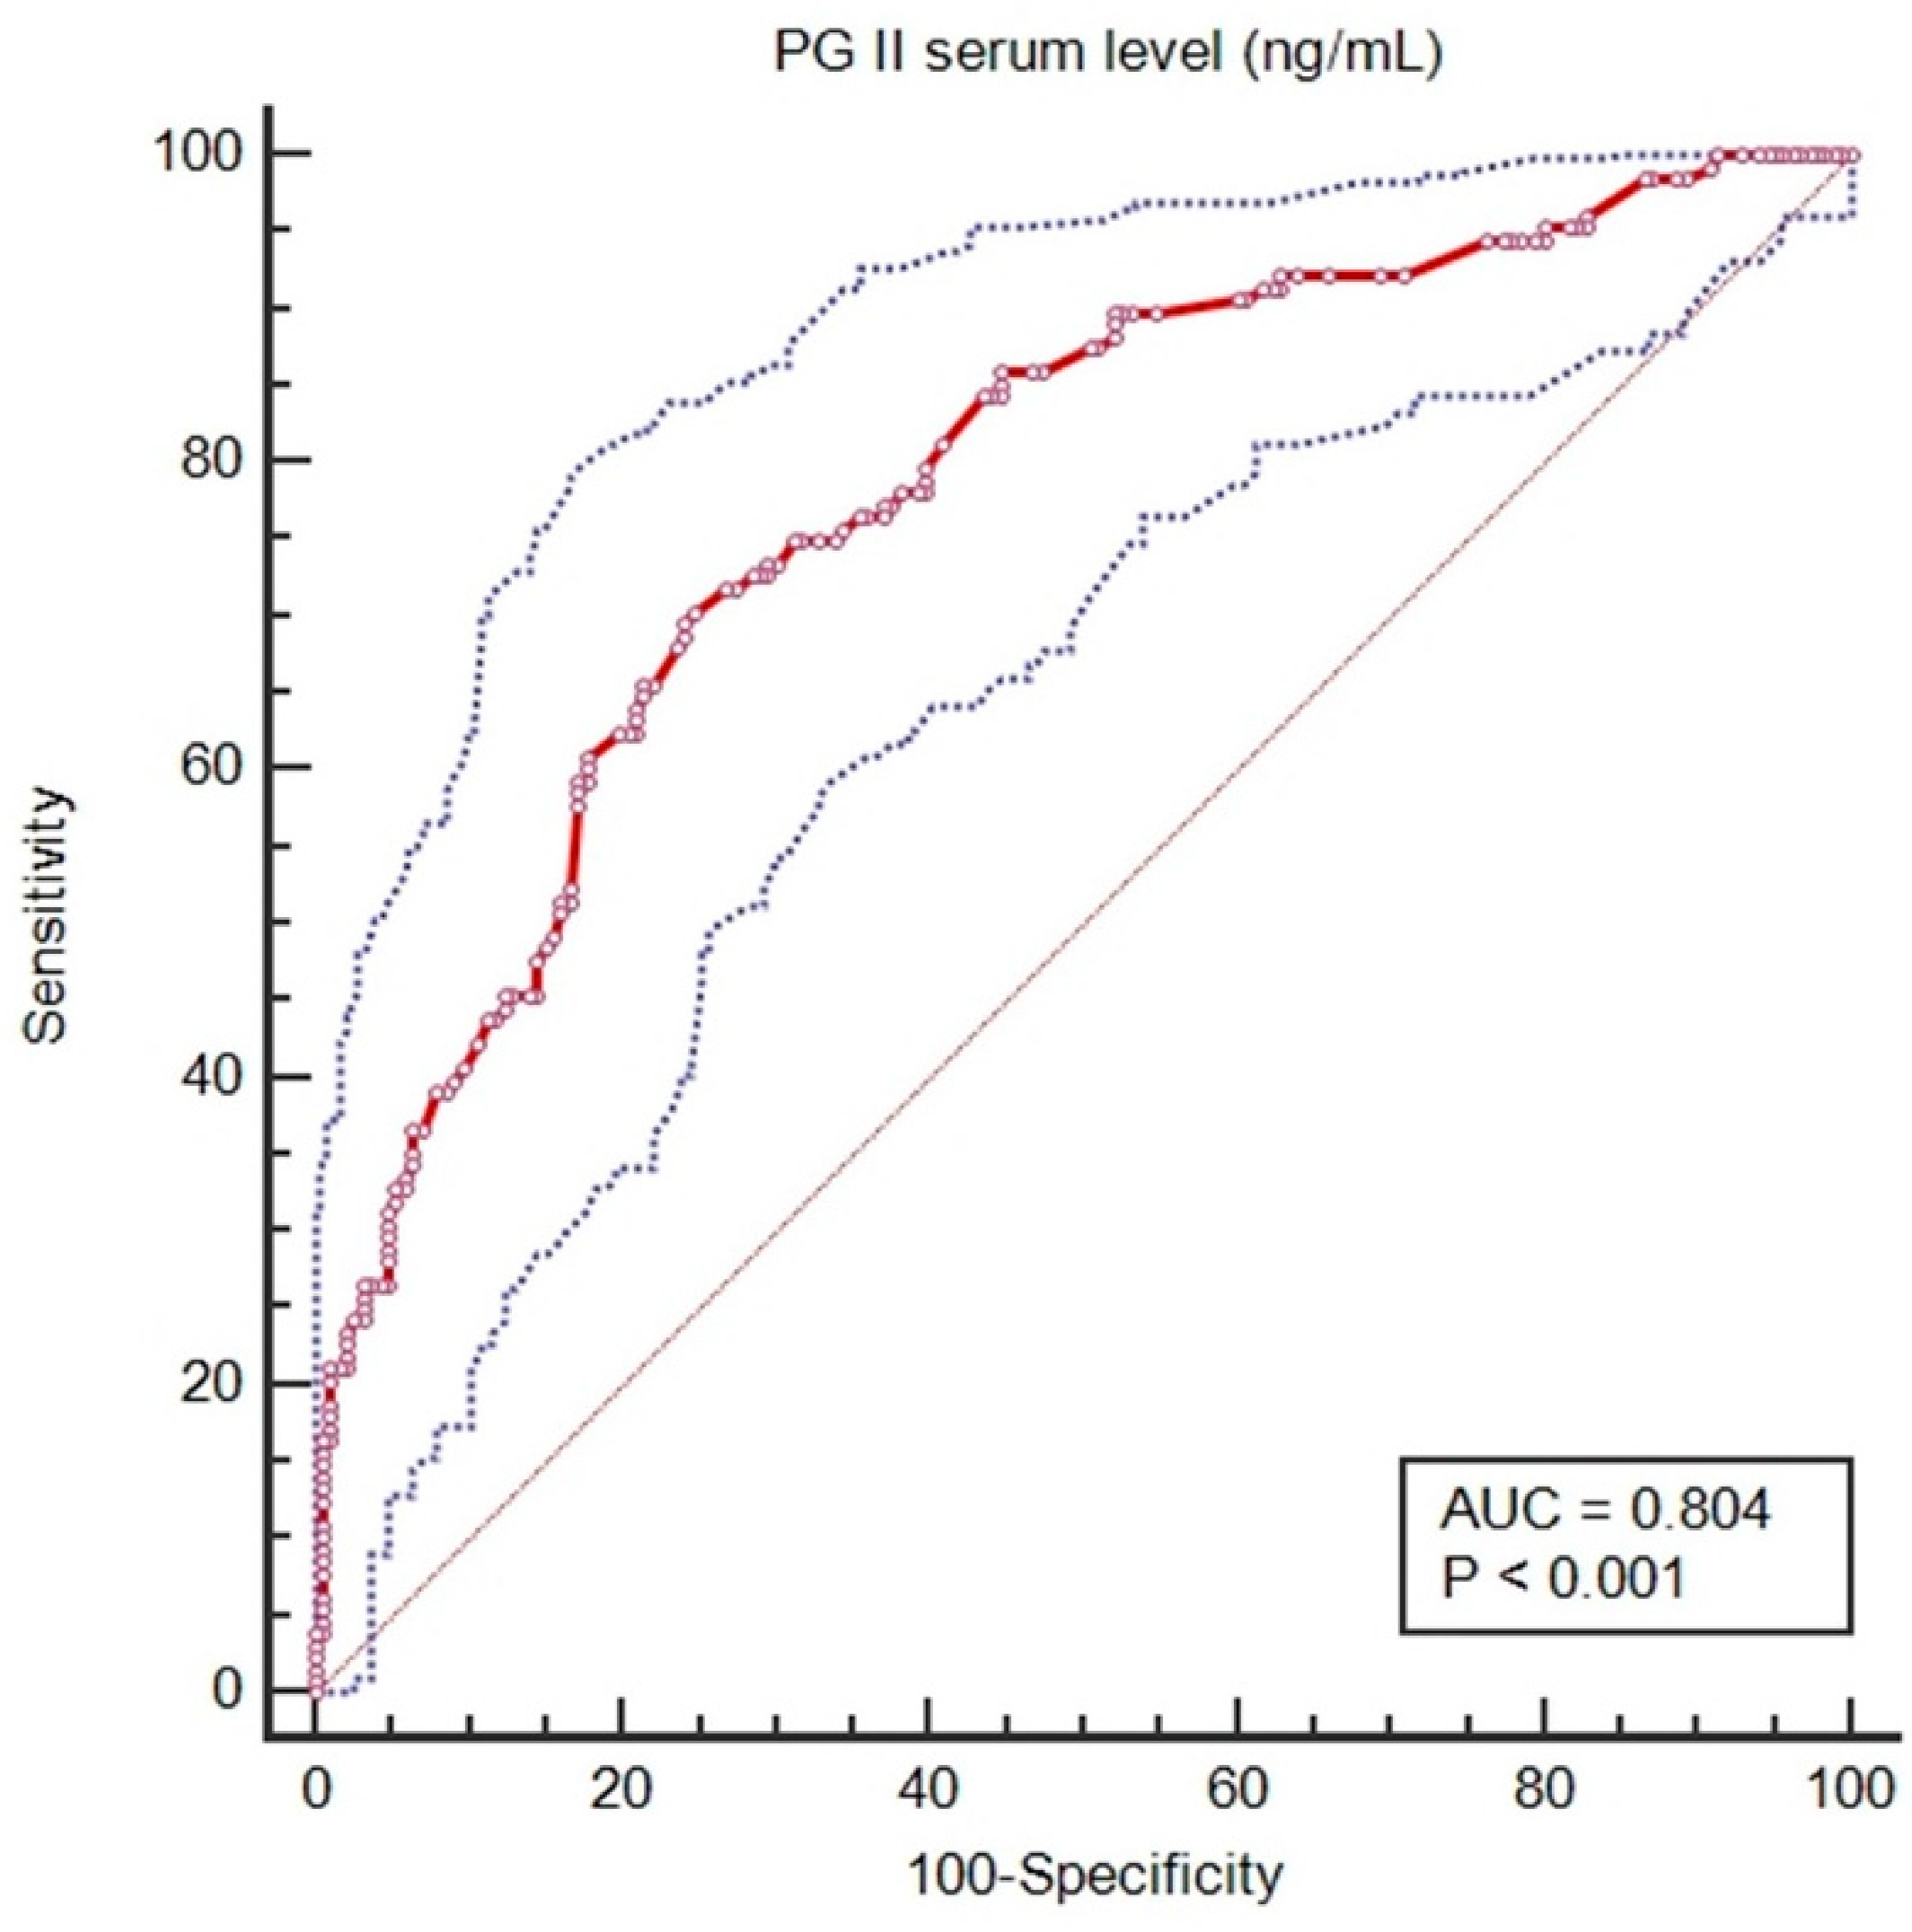
3.2. Trends in Pepsinogen I and II Levels
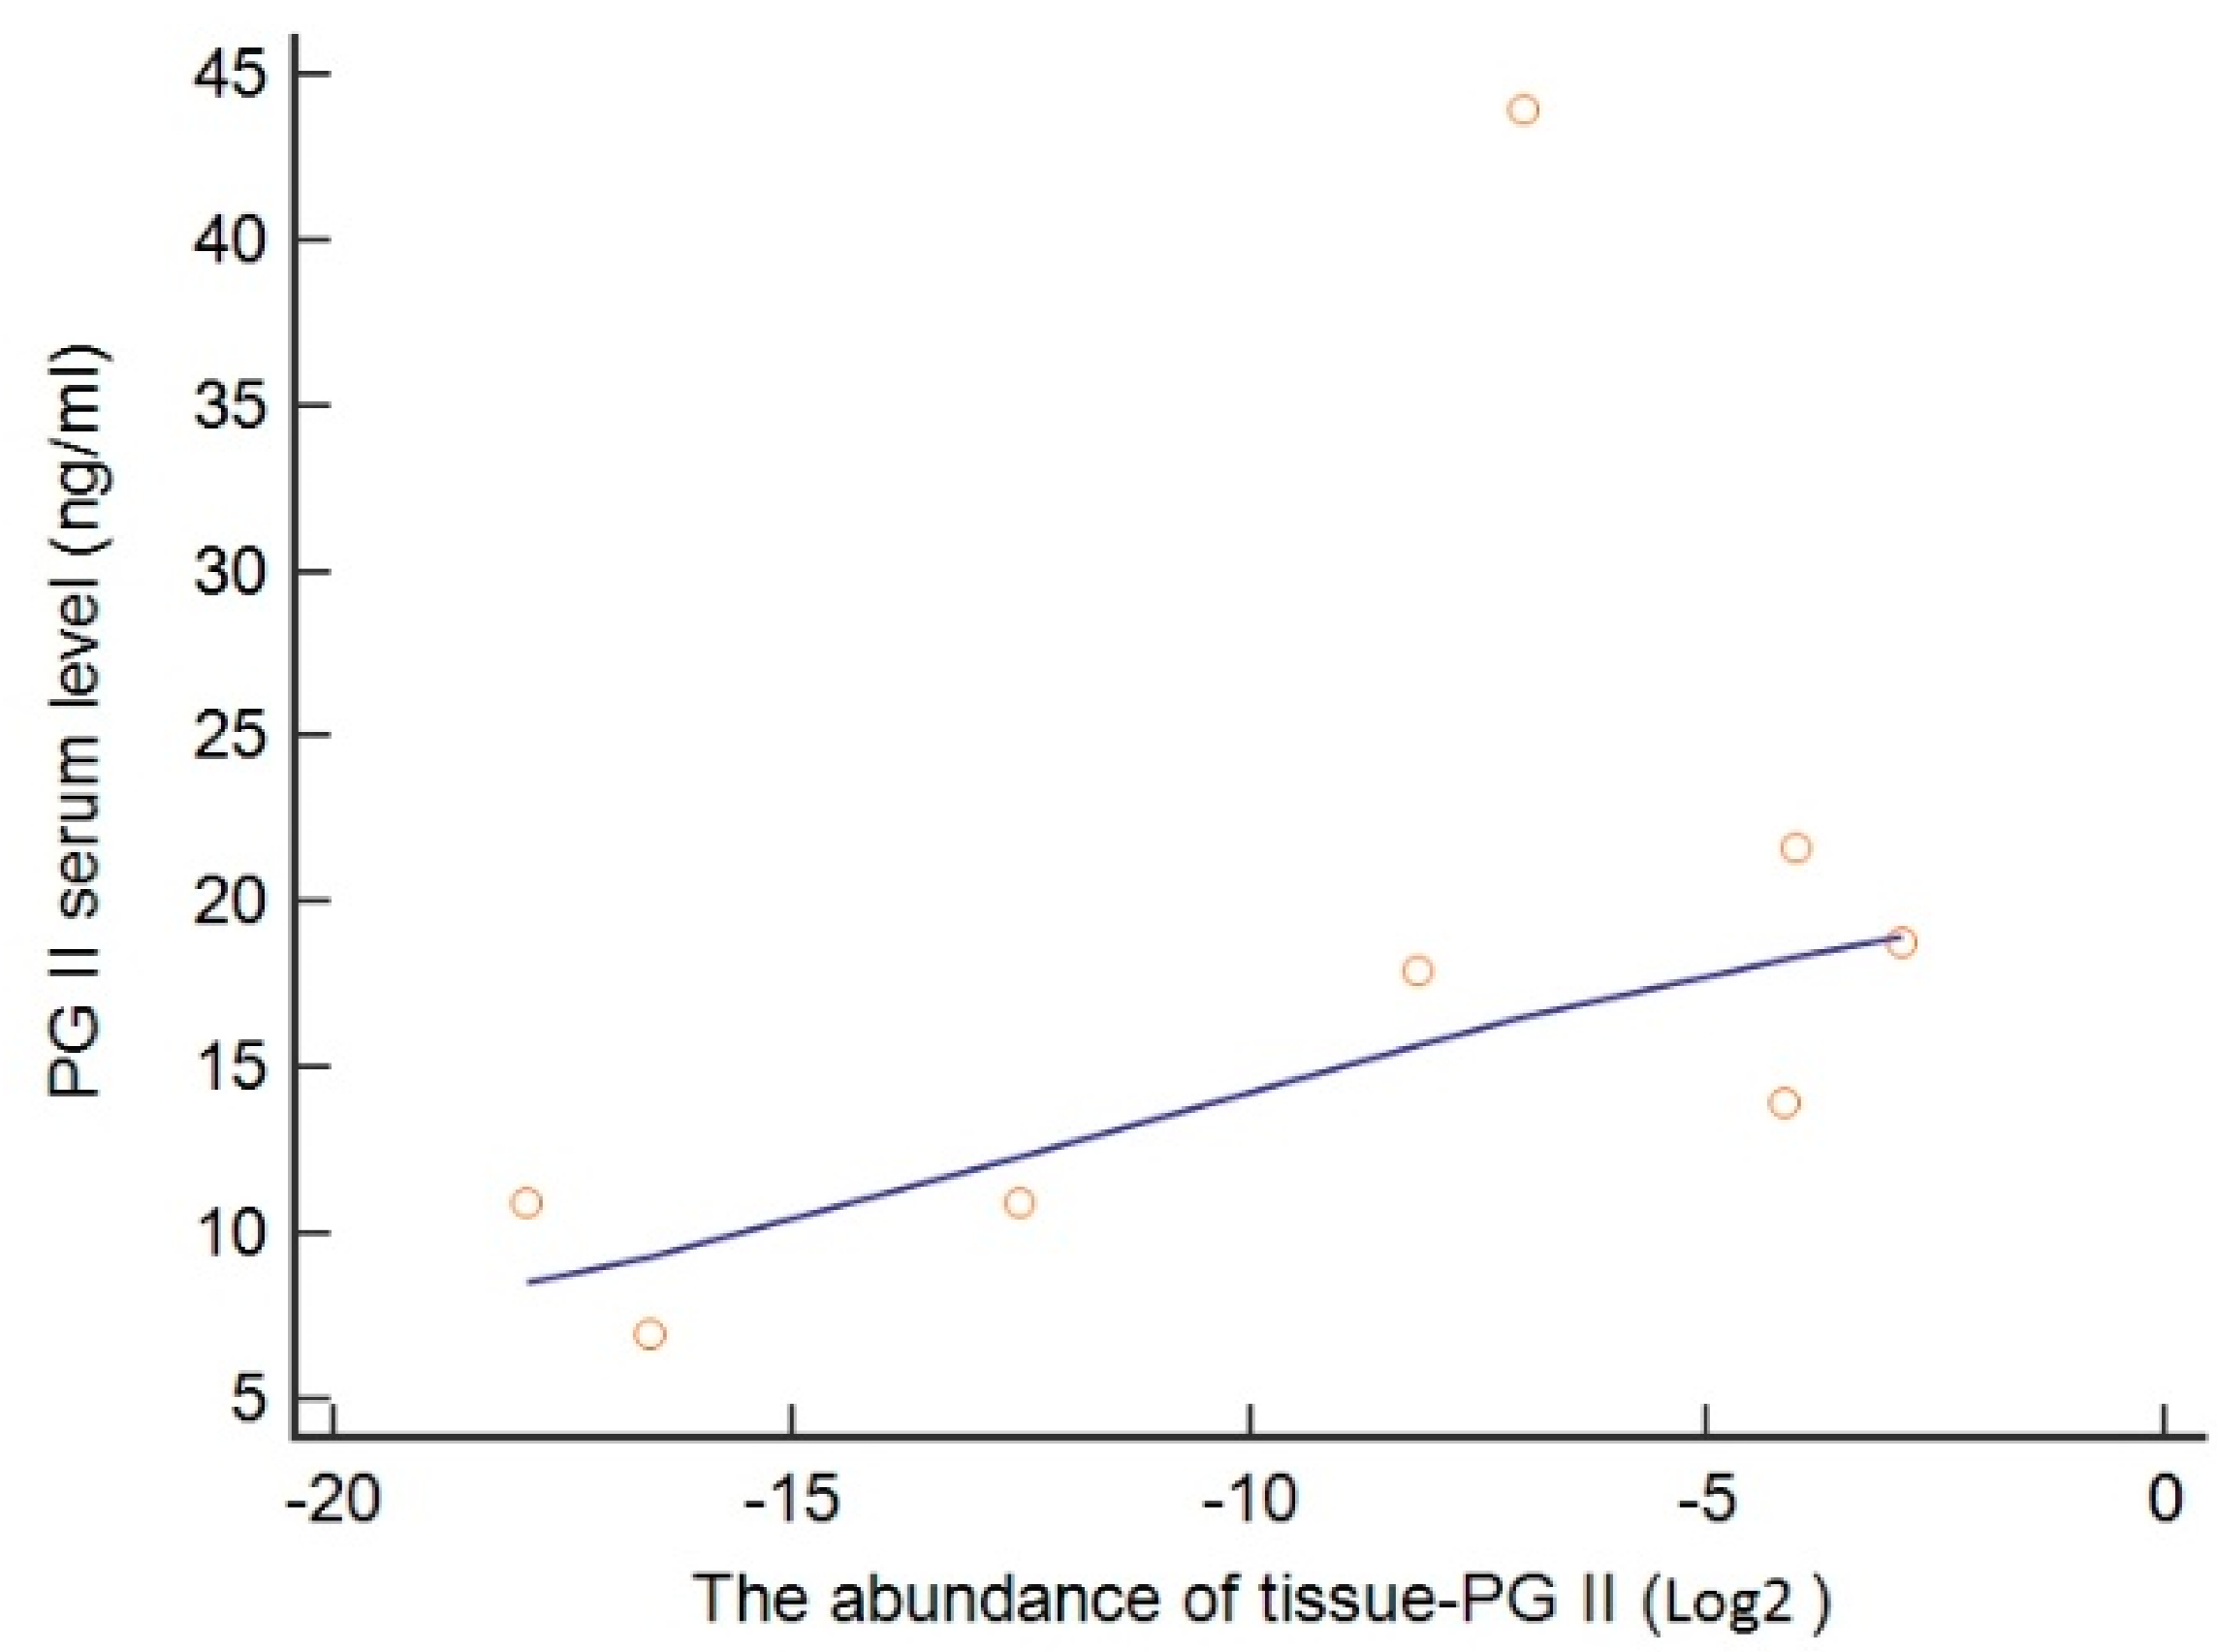
3.3. Genetic Regulation of PGII Levels
4. Discussion
5. Conclusions
Supplementary Materials
Author Contributions
Funding
Institutional Review Board
Informed Consent Statement
Data Availability Statement
Acknowledgments
Conflicts of Interest
References
- Torre, L.A.; Siegel, R.L.; Ward, E.M.; Jemal, A. Global Cancer Incidence and Mortality Rates and Trends--An Update. Cancer Epidemiol. Biomarkers Prev. 2016, 25, 16–27. [Google Scholar] [CrossRef] [Green Version]
- Choi, I.J.; Kim, C.G.; Lee, J.Y.; Kim, Y.-I.; Kook, M.-C.; Park, B.; Joo, J. Family History of Gastric Cancer and Helicobacter pylori Treatment. N. Engl. J. Med. 2020, 382, 427–436. [Google Scholar] [CrossRef] [PubMed]
- Bonelli, P.; Borrelli, A.; Tuccillo, F.M.; Silvestro, L.; Palaia, R.; Buonaguro, F.M. Precision medicine in gastric cancer. World J. Gastrointest. Oncol. 2019, 11, 804–829. [Google Scholar] [CrossRef] [PubMed]
- Correa, P.; Piazuelo, M.B.; Camargo, M.C. The future of gastric cancer prevention. Gastric Cancer 2004, 7, 9–16. [Google Scholar] [CrossRef] [PubMed]
- Soykan, I.; Yakut, M.; Keskin, O.; Bektaş, M. Clinical profiles, endoscopic and laboratory features and associated factors in patients with autoimmune gastritis. Digestion 2012, 86, 20–26. [Google Scholar] [CrossRef]
- Hu, B.; El Hajj, N.; Sittler, S.; Lammert, N.; Barnes, R.; Meloni-Ehrig, A. Gastric cancer: Classification, histology and application of molecular pathology. J. Gastrointest Oncol. 2012, 3, 251–261. [Google Scholar]
- Den Hollander, W.J.; Holster, I.L.; den Hoed, C.M.; Capelle, L.G.; Tang, T.J.; Anten, M.-P.; Prytz-Berset, I.; Witteman, E.M.; ter Borg, F.; den Hartog, G.; et al. Surveillance of premalignant gastric lesions: A multicentre prospective cohort study from low incidence regions. Gut 2019, 68, 585–593. [Google Scholar] [CrossRef]
- Rugge, M.; Sugano, K.; Scarpignato, C.; Sacchi, D.; Oblitas, W.J.; Naccarato, A.G. Gastric cancer prevention targeted on risk assessment: Gastritis OLGA staging. Helicobacter 2019, 24, e12571. [Google Scholar] [CrossRef]
- Loor, A.; Dumitraşcu, D.L. Helicobacter pylori Infection, Gastric Cancer and Gastropanel. Rom. J. Intern. Med. 2016, 54, 151–156. [Google Scholar] [CrossRef] [Green Version]
- Banks, M.; Graham, D.; Jansen, M.; Gotoda, T.; Coda, S.; di Pietro, M.; Uedo, N.; Bhandari, P.; Pritchard, D.M.; Kuipers, E.J.; et al. British Society of Gastroenterology guidelines on the diagnosis and management of patients at risk of gastric adenocarcinoma. Gut 2019, 68, 1545–1575. [Google Scholar] [CrossRef] [Green Version]
- Asaka, M.; Mabe, K. Strategies for eliminating death from gastric cancer in Japan. Proc. Jpn. Acad. Ser. B Phys. Biol. Sci. 2014, 90, 251–258. [Google Scholar] [CrossRef] [PubMed] [Green Version]
- Leja, M.; Kupcinskas, L.; Funka, K.; Sudraba, A.; Jonaitis, L.; Ivanauskas, A.; Janciauskas, D.; Kiudelis, G.; Chiu, H.-M.; Lin, J.-T. The validity of a biomarker method for indirect detection of gastric mucosal atrophy versus standard histopathology. Dig. Dis. Sci. 2009, 54, 2377–2384. [Google Scholar] [CrossRef] [PubMed]
- Bornschein, J.; Selgrad, M.; Wex, T.; Kuester, D.; Malfertheiner, P. Serological assessment of gastric mucosal atrophy in gastric cancer. BMC Gastroenterol. 2012, 12, 10. [Google Scholar] [CrossRef] [PubMed] [Green Version]
- Bang, C.S.; Lee, J.J.; Baik, G.H. Prediction of Chronic Atrophic Gastritis and Gastric Neoplasms by Serum Pepsinogen Assay: A Systematic Review and Meta-Analysis of Diagnostic Test Accuracy. J. Clin. Med. 2019, 8, 657. [Google Scholar] [CrossRef] [PubMed] [Green Version]
- Agkoc, M.; Dursun, H.; Albayrak, F.; Yilmaz, O.; Kiziltunc, A.; Yilmaz, A.; Gundogdu, C. Usefulness of serum pepsinogen levels as a screening test for atrophic gastritis and gastric cancer. Eurasian J. Med. 2010, 42, 15–18. [Google Scholar] [CrossRef]
- De Re, V.; Orzes, E.; Canzonieri, V.; Maiero, S.; Fornasarig, M.; Alessandrini, L.; Cervo, S.; Steffan, A.; Zanette, G.; Mazzon, C.; et al. Pepsinogens to Distinguish Patients with Gastric Intestinal Metaplasia and Helicobacter pylori Infection Among Populations at Risk for Gastric Cancer. Clin. Transl. Gastroenterol. 2016, 7, e183. [Google Scholar] [CrossRef]
- Väänänen, H.; Vauhkonen, M.; Helske, T.; Kääriäinen, I.; Rasmussen, M.; Tunturi-Hihnala, H.; Koskenpato, J.; Sotka, M.; Turunen, M.; Sandström, R.; et al. Non-endoscopic diagnosis of atrophic gastritis with a blood test. Correlation between gastric histology and serum levels of gastrin-17 and pepsinogen I: A multicentre study. Eur. J. Gastroenterol. Hepatol 2003, 15, 885–891. [Google Scholar] [CrossRef]
- Shen, S.; Jiang, J.; Yuan, Y. Pepsinogen C expression, regulation and its relationship with cancer. Cancer Cell Int. 2017, 17, 57. [Google Scholar] [CrossRef] [Green Version]
- Hassan, M.I.; Toor, A.; Ahmad, F. Progastriscin: Structure, function, and its role in tumor progression. J. Mol. Cell Bio.l 2010, 2, 118–127. [Google Scholar] [CrossRef] [Green Version]
- Watanabe, T.; Matsushima, Y.; Nakase, H.; Iwano, M.; Hosotani, R.; Imamura, M.; Kinoshita, Y.; Chiba, T. Effects of Helicobacter pylori infection on Zollinger-Ellison syndrome. J. Gastroenterol. 2000, 35, 735–741. [Google Scholar] [CrossRef]
- Samloff, I.M.; Stemmermann, G.N.; Heilbrun, L.K.; Nomura, A. Elevated serum pepsinogen I and II levels differ as risk factors for duodenal ulcer and gastric ulcer. Gastroenterology 1986, 90, 570–576. [Google Scholar] [CrossRef]
- Kikuchi, S.; Kato, M.; Mabe, K.; Kawai, T.; Furuta, T.; Inoue, K.; Ito, M.; Yoshihara, M.; Kodama, M.; Murakami, K. Optimal Criteria and Diagnostic Ability of Serum Pepsinogen Values for Helicobacter pylori Infection. J. Epidemiol 2019, 29, 147–154. [Google Scholar] [CrossRef] [Green Version]
- Xu, Q.; Wu, Y.-F.; Li, Y.; He, C.-Y.; Sun, L.-P.; Liu, J.-W.; Yuan, Y. SNP-SNP interactions of three new pri-miRNAs with the target gene PGC and multidimensional analysis of H. pylori in the gastric cancer/atrophic gastritis risk in a Chinese population. Oncotarget 2016, 7, 23700–23714. [Google Scholar] [CrossRef] [Green Version]
- Wu, Y.-F.; Xu, Q.; He, C.-Y.; Li, Y.; Liu, J.-W.; Deng, N.; Sun, L.-P.; Yuan, Y. Association of Polymorphisms in three pri-miRNAs that Target Pepsinogen C with the Risk and Prognosis of Gastric Cancer. Sci. Rep. 2017, 7, 39528. [Google Scholar] [CrossRef] [PubMed] [Green Version]
- Dixon, M.F.; Genta, R.M.; Yardley, J.H.; Correa, P. Classification and grading of gastritis. The updated Sydney System. International Workshop on the Histopathology of Gastritis, Houston 1994. Am. J. Surg. Pathol. 1996, 20, 1161–1181. [Google Scholar] [CrossRef] [PubMed]
- Cannizzaro, R.; Magris, R.; Maiero, S.; Spessotto, P.; De Re, V.; Fornasarig, M. Gastric Cancer in the Precision Medicine Era: Diagnosis and Therapy; Current Clinical Pathology; Canzonieri, V., Giordano, A., Eds.; Humana Press: Tortowa, NJ, USA, 2019; ISBN 978-3-030-04860-0. [Google Scholar]
- He, C.; Xu, Q.; Tu, H.; Sun, L.; Gong, Y.; Liu, J.; Yuan, Y. Polymorphic rs9471643 and rs6458238 upregulate PGC transcription and protein expression in overdominant or dominant models. Mol. Carcinog. 2016, 55, 586–599. [Google Scholar] [CrossRef]
- Kumar, S.; Kumari, N.; Mittal, R.D.; Ghoshal, U.C. Pepsinogen-II 100 bp ins/del gene polymorphism and its elevated circulating levels are associated with gastric cancer, particularly with Helicobacter pylori infection and intestinal metaplasia. Gastric Cancer 2016, 19, 808–816. [Google Scholar] [CrossRef] [Green Version]
- Ichinose, M.; Miki, K.; Wong, R.N.; Tatematsu, M.; Furihata, C.; Konishi, T.; Matsushima, M.; Tanji, M.; Sano, J.; Kurokawa, K. Methylation and expression of human pepsinogen genes in normal tissues and their alteration in stomach cancer. Jpn. J. Cancer Res. 1991, 82, 686–692. [Google Scholar] [CrossRef]
- Yamagata, Z.; Zhang, Y.; Shinozaki, S.; Miyamura, T.; Iijima, S.; Asaka, A.; Kobayashi, K. Influence of pepsinogen gene polymorphisms on serum pepsinogen. Ann. Hum. Genet. 1997, 61, 93–97. [Google Scholar] [CrossRef]
- Repetto, O.; Zanussi, S.; Casarotto, M.; Canzonieri, V.; De Paoli, P.; Cannizzaro, R.; De Re, V. Differential Proteomics of Helicobacter pylori Associated with Autoimmune Atrophic Gastritis. Mol. Med. 2014, 20, 57–71. [Google Scholar] [CrossRef]
- Young, G.O.; Brown, S.; Stemmet, N.; Lastovica, A.J.; Marks, I.N.; Modlin, I.M.; Kidd, M. The pepsinogen releasing effect of Helicobacter pylori lipopolysaccharide. Helicobacter 2002, 7, 30–38. [Google Scholar] [CrossRef] [PubMed]
- Tu, H.; Sun, L.; Dong, X.; Gong, Y.; Xu, Q.; Jing, J.; Long, Q.; Flanders, W.D.; Bostick, R.M.; Yuan, Y. Temporal changes in serum biomarkers and risk for progression of gastric precancerous lesions: A longitudinal study. Int. J. Cancer 2015, 136, 425–434. [Google Scholar] [CrossRef] [PubMed] [Green Version]
- Terasawa, T.; Nishida, H.; Kato, K.; Miyashiro, I.; Yoshikawa, T.; Takaku, R.; Hamashima, C. Prediction of gastric cancer development by serum pepsinogen test and Helicobacter pylori seropositivity in Eastern Asians: A systematic review and meta-analysis. PLoS ONE 2014, 9, e109783. [Google Scholar] [CrossRef] [PubMed]
- Yanaoka, K.; Oka, M.; Mukoubayashi, C.; Yoshimura, N.; Enomoto, S.; Iguchi, M.; Magari, H.; Utsunomiya, H.; Tamai, H.; Arii, K.; et al. Cancer high-risk subjects identified by serum pepsinogen tests: Outcomes after 10-year follow-up in asymptomatic middle-aged males. Cancer Epidemiol. Biomark. Prev. 2008, 17, 838–845. [Google Scholar] [CrossRef] [Green Version]
- Yuan, L.; Zhao, J.-B.; Zhou, Y.-L.; Qi, Y.-B.; Guo, Q.-Y.; Zhang, H.-H.; Khan, M.N.; Lan, L.; Jia, C.-H.; Zhang, Y.-R.; et al. Type I and type II Helicobacter pylori infection status and their impact on gastrin and pepsinogen level in a gastric cancer prevalent area. World J. Gastroenterol. 2020, 26, 3673–3685. [Google Scholar] [CrossRef]
- Ikeda, F.; Shikata, K.; Hata, J.; Fukuhara, M.; Hirakawa, Y.; Ohara, T.; Mukai, N.; Nagata, M.; Yoshida, D.; Yonemoto, K.; et al. Combination of Helicobacter pylori Antibody and Serum Pepsinogen as a Good Predictive Tool of Gastric Cancer Incidence: 20-Year Prospective Data From the Hisayama Study. J. Epidemiol. 2016, 26, 629–636. [Google Scholar] [CrossRef] [Green Version]
- Kishikawa, H.; Kimura, K.; Takarabe, S.; Kaida, S.; Nishida, J. Helicobacter pylori Antibody Titer and Gastric Cancer Screening. Dis. Markers 2015, 2015, 156719. [Google Scholar] [CrossRef] [Green Version]
- Yoshida, T.; Kato, J.; Inoue, I.; Yoshimura, N.; Deguchi, H.; Mukoubayashi, C.; Oka, M.; Watanabe, M.; Enomoto, S.; Niwa, T.; et al. Cancer development based on chronic active gastritis and resulting gastric atrophy as assessed by serum levels of pepsinogen and Helicobacter pylori antibody titer. Int. J. Cancer 2014, 134, 1445–1457. [Google Scholar] [CrossRef]
- Minn, I.; Kim, H.S.; Kim, S.C. Antimicrobial peptides derived from pepsinogens in the stomach of the bullfrog, Rana catesbeiana. Biochim. Biophys. Acta-Mol. Basis Dis. 1998, 1407, 31–39. [Google Scholar] [CrossRef] [Green Version]
- Yanaoka, K.; Oka, M.; Yoshimura, N.; Mukoubayashi, C.; Enomoto, S.; Iguchi, M.; Magari, H.; Utsunomiya, H.; Tamai, H.; Arii, K.; et al. Risk of gastric cancer in asymptomatic, middle-aged Japanese subjects based on serum pepsinogen and Helicobacter pylori antibody levels. Int. J. Cancer 2008, 123, 917–926. [Google Scholar] [CrossRef]
- Su, J.-L.; Chen, P.-S.; Johansson, G.; Kuo, M.-L. Function and regulation of let-7 family microRNAs. Microrna 2012, 1, 34–39. [Google Scholar] [CrossRef] [PubMed]
- Büssing, I.; Slack, F.J.; Grosshans, H. let-7 microRNAs in development, stem cells and cancer. Trends Mol. Med. 2008, 14, 400–409. [Google Scholar] [CrossRef] [PubMed]
- Liu, W.-J.; Xu, Q.; Sun, L.-P.; Dong, Q.-G.; He, C.-Y.; Yuan, Y. Expression of serum let-7c, let-7i, and let-7f microRNA with its target gene, pepsinogen C, in gastric cancer and precancerous disease. Tumour Biol. 2015, 36, 3337–3343. [Google Scholar] [CrossRef] [PubMed]
- Xu, Q.; Dong, Q.; He, C.; Liu, W.; Sun, L.; Liu, J.; Xing, C.; Li, X.; Wang, B.; Yuan, Y. A new polymorphism biomarker rs629367 associated with increased risk and poor survival of gastric cancer in chinese by up-regulated miRNA-let-7a expression. PLoS ONE 2014, 9, e95249. [Google Scholar] [CrossRef]
- Shan, Y.; Liu, Y.; Zhao, L.; Liu, B.; Li, Y.; Jia, L. MicroRNA-33a and let-7e inhibit human colorectal cancer progression by targeting ST8SIA1. Int. J. Biochem. Cell Biol. 2017, 90, 48–58. [Google Scholar] [CrossRef]
- Yu, C.; Wang, L.; Rowe, R.G.; Han, A.; Ji, W.; McMahon, C.; Baier, A.S.; Huang, Y.-C.; Marion, W.; Pearson, D.S.; et al. A nanobody targeting the LIN28:let-7 interaction fragment of TUT4 blocks uridylation of let-7. Proc. Natl. Acad. Sci. USA 2020, 117, 4653–4663. [Google Scholar] [CrossRef] [Green Version]
- Tsai, M.-M.; Wang, C.-S.; Tsai, C.-Y.; Huang, H.-W.; Chi, H.-C.; Lin, Y.-H.; Lu, P.-H.; Lin, K.-H. Potential Diagnostic, Prognostic and Therapeutic Targets of MicroRNAs in Human Gastric Cancer. Int. J. Mol. Sci. 2016, 17, 945. [Google Scholar] [CrossRef]
- Wang, X.; Cao, L.; Wang, Y.; Wang, X.; Liu, N.; You, Y. Regulation of let-7 and its target oncogenes (Review). Oncol. Lett. 2012, 3, 955–960. [Google Scholar] [CrossRef]
- Ranjbar, R.; Hesari, A.; Ghasemi, F.; Sahebkar, A. Expression of microRNAs and IRAK1 pathway genes are altered in gastric cancer patients with Helicobacter pylori infection. J. Cell. Biochem. 2018, 119, 7570–7576. [Google Scholar] [CrossRef]
- Chen, Z.; Huang, Z.; Ye, Q.; Ming, Y.; Zhang, S.; Zhao, Y.; Liu, L.; Wang, Q.; Cheng, K. Prognostic significance and anti-proliferation effect of microRNA-365 in hepatocellular carcinoma. Int. J. Clin. Exp. Pathol 2015, 8, 1705–1711. [Google Scholar]
- Guo, S.-L.; Ye, H.; Teng, Y.; Wang, Y.-L.; Yang, G.; Li, X.-B.; Zhang, C.; Yang, X.; Yang, Z.-Z.; Yang, X. Akt-p53-miR-365-cyclin D1/cdc25A axis contributes to gastric tumorigenesis induced by PTEN deficiency. Nat. Commun. 2013, 4, 2544. [Google Scholar] [CrossRef] [PubMed]
- Jiang, Z.-B.; Ma, B.-Q.; Liu, S.-G.; Li, J.; Yang, G.-M.; Hou, Y.-B.; Si, R.-H.; Gao, P.; Yan, H.-T. miR-365 regulates liver cancer stem cells via RAC1 pathway. Mol. Carcinog. 2019, 58, 55–65. [Google Scholar] [CrossRef] [PubMed] [Green Version]
- Liu, Y.; Zhang, G.; Li, H.; Han, L.; Fu, A.; Zhang, N.; Zheng, Y. Serum microRNA-365 in combination with its target gene TTF-1 as a non-invasive prognostic marker for non-small cell lung cancer. Biomed. Pharmacother. 2015, 75, 185–190. [Google Scholar] [CrossRef] [PubMed]
- Madhavan, D.; Peng, C.; Wallwiener, M.; Zucknick, M.; Nees, J.; Schott, S.; Rudolph, A.; Riethdorf, S.; Trumpp, A.; Pantel, K.; et al. Circulating miRNAs with prognostic value in metastatic breast cancer and for early detection of metastasis. Carcinogenesis 2016, 37, 461–470. [Google Scholar] [CrossRef] [Green Version]
- Han, J.-G.; Jiang, Y.-D.; Zhang, C.-H.; Yang, Y.-M.; Pang, D.; Song, Y.-N.; Zhang, G.-Q. A novel panel of serum miR-21/miR-155/miR-365 as a potential diagnostic biomarker for breast cancer. Ann. Surg. Treat Res. 2017, 92, 55–66. [Google Scholar] [CrossRef] [Green Version]
- Kodahl, A.R.; Lyng, M.B.; Binder, H.; Cold, S.; Gravgaard, K.; Knoop, A.S.; Ditzel, H.J. Novel circulating microRNA signature as a potential non-invasive multi-marker test in ER-positive early-stage breast cancer: A case control study. Mol. Oncol. 2014, 8, 874–883. [Google Scholar] [CrossRef]
- Tran, P.; Nguyen, C.; Klempner, S.J. Targeting the Phosphatidylinositol-3-kinase Pathway in Gastric Cancer: Can Omics Improve Outcomes? Int. Neurourol. J. 2016, 20, S131–S140. [Google Scholar] [CrossRef] [Green Version]
- Gnoni, A.; Santini, D.; Scartozzi, M.; Russo, A.; Licchetta, A.; Palmieri, V.; Lupo, L.; Faloppi, L.; Palasciano, G.; Memeo, V.; et al. Hepatocellular carcinoma treatment over sorafenib: Epigenetics, microRNAs and microenvironment. Is there a light at the end of the tunnel? Expert Opin. Ther. Targets 2015, 19, 1623–1635. [Google Scholar] [CrossRef]
- Danza, K.; Silvestris, N.; Simone, G.; Signorile, M.; Saragoni, L.; Brunetti, O.; Monti, M.; Mazzotta, A.; De Summa, S.; Mangia, A.; et al. Role of miR-27a, miR-181a and miR-20b in gastric cancer hypoxia-induced chemoresistance. Cancer Biol. Ther. 2016, 17, 400–406. [Google Scholar] [CrossRef] [Green Version]


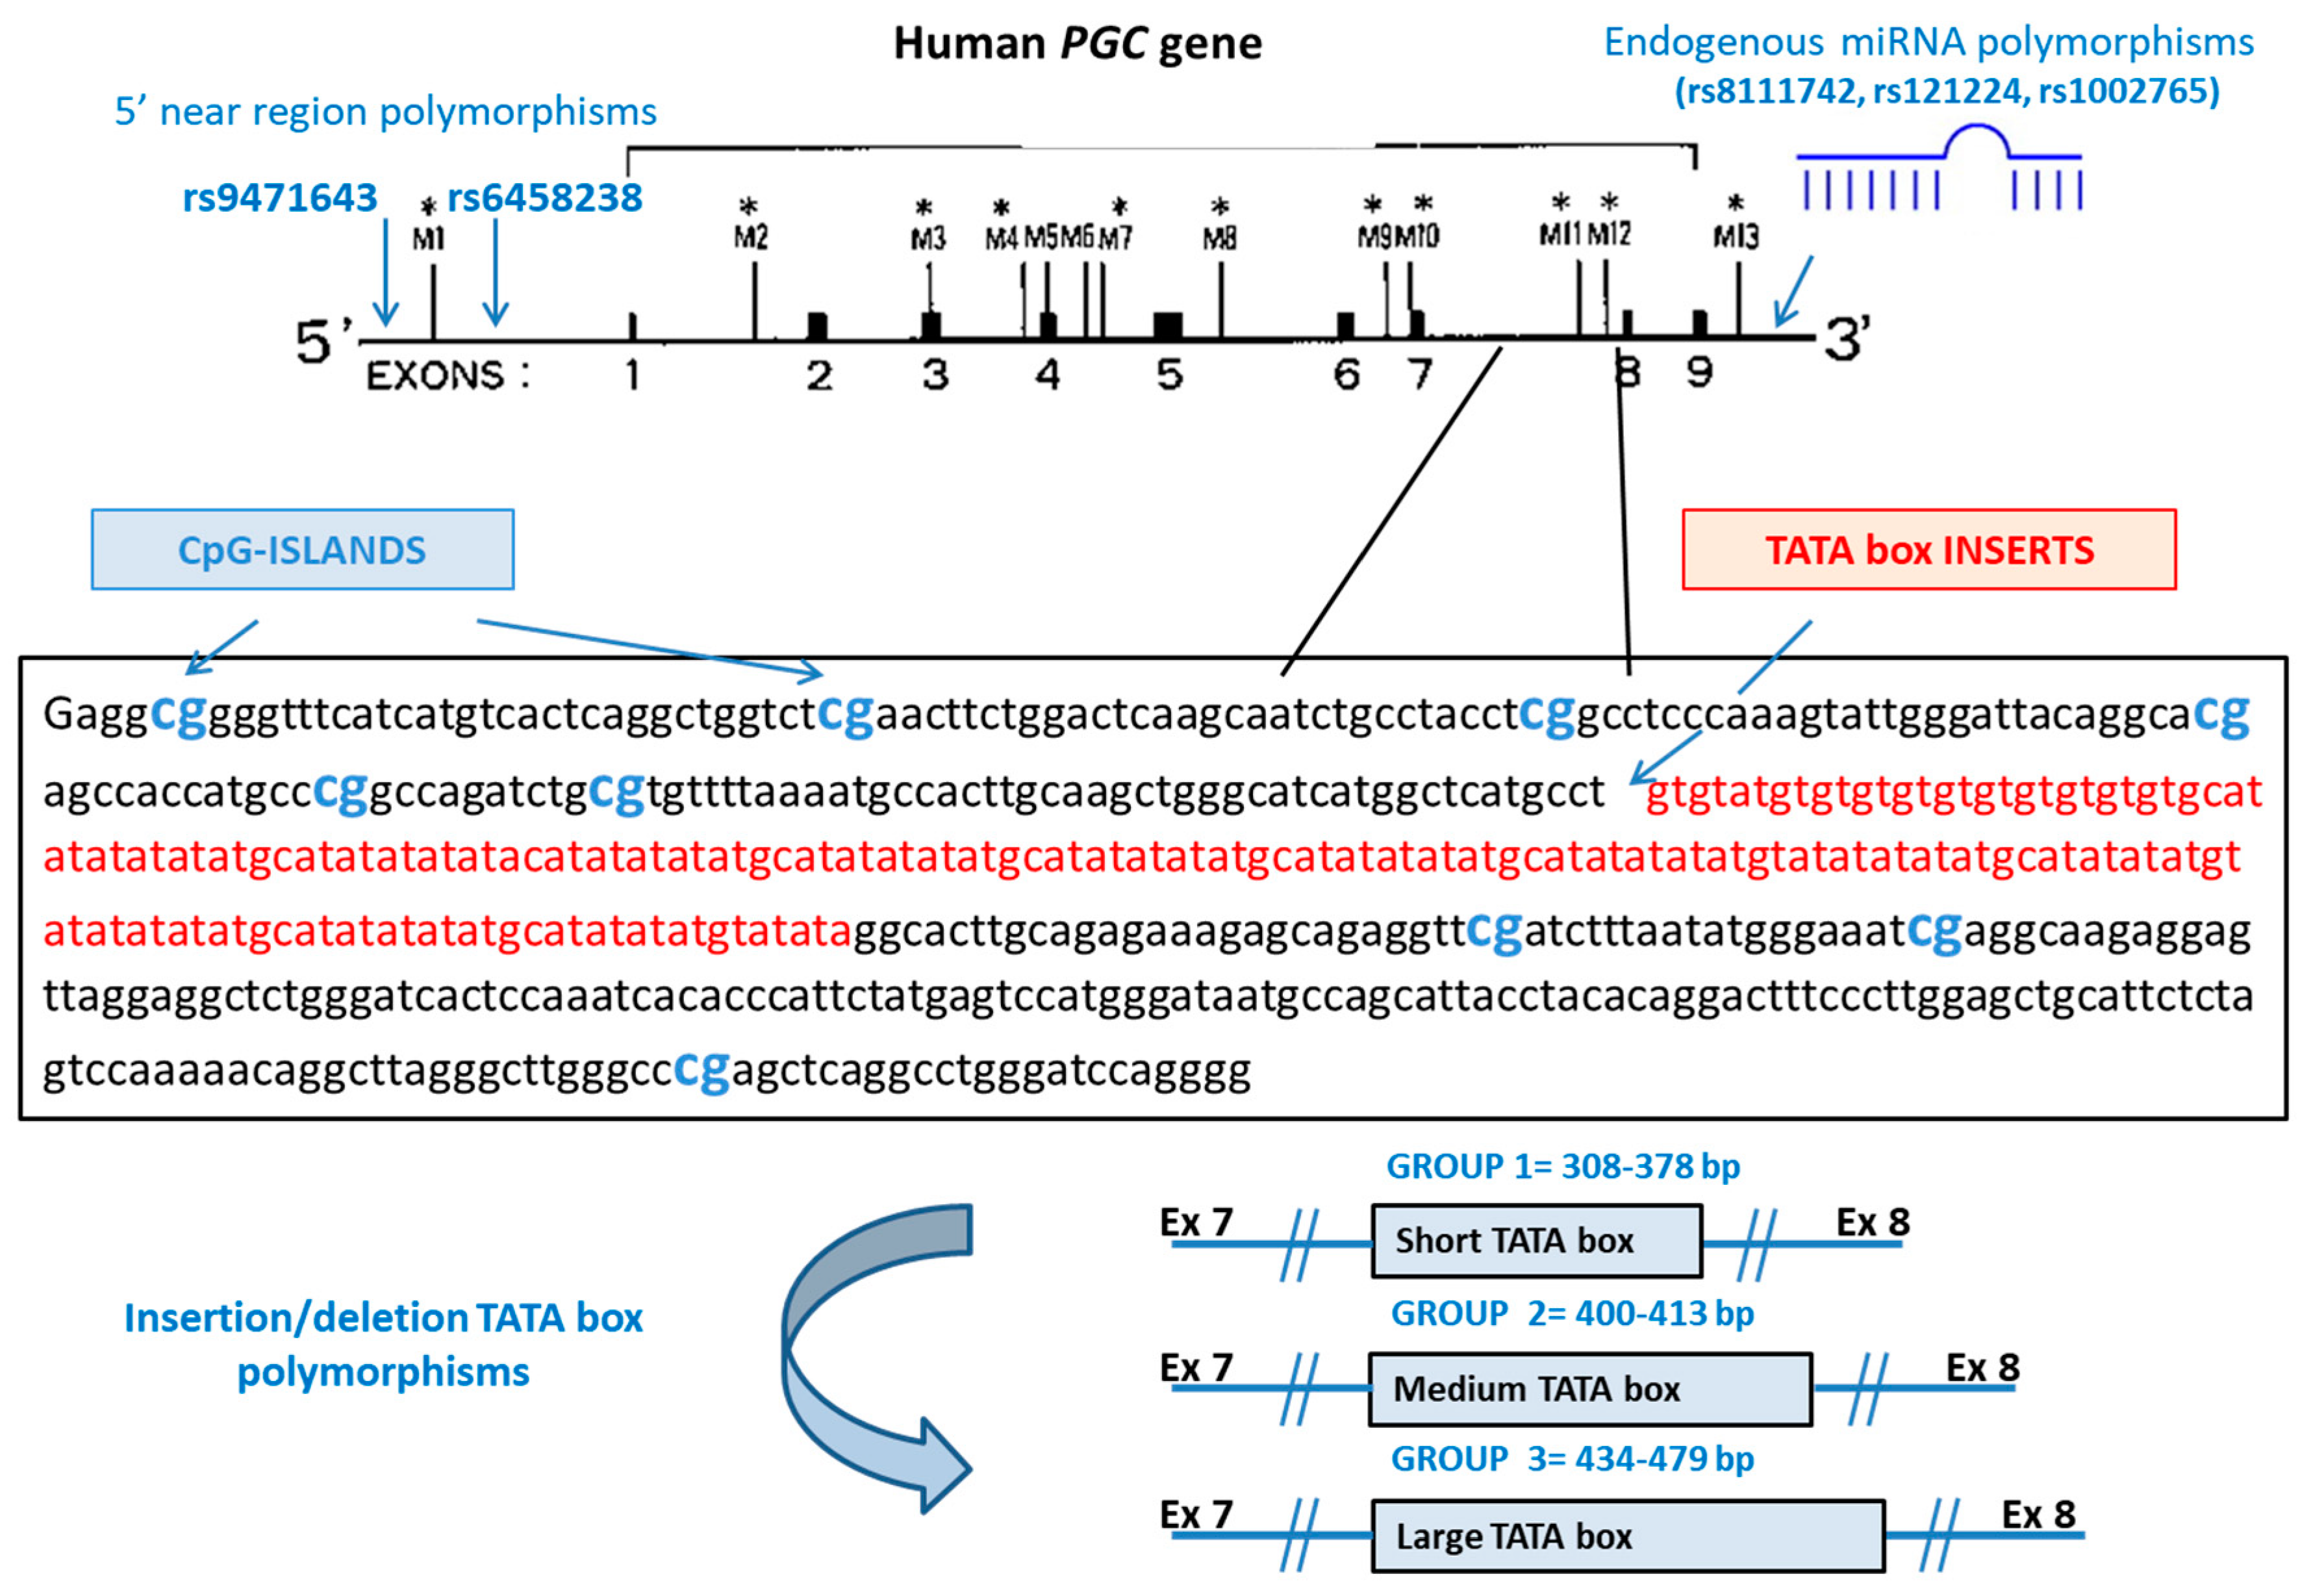
| Variant | Gene Region | Change | Probes and Primers |
|---|---|---|---|
| rs9471643 | 5′UTR of PGC | C > G | AGATTTGAACATAGCTGTGATCGTT[C/G]TGTAAAGGCAACTTCTGTTTTGCCC |
| rs6458238 | 5′UTR of PGC | A > G | GGTGGTGCCCAGGCTTTTTCTTATC[A/G]CCTTCTAGTCTCATTTCCTTTAAGC |
| rs8111742 | 5′UTR of miR-Let-7e | A > G | AGGTGTGCCCAAAGGGCCAAATTAC[A/G]AGACAAATGAGGTTCCCTCCCAGCC |
| rs121224 | 5′UTR of miR-365b | C > G | AAGAAGGTTGGAGGCTGGCTGTCTT[C/G]TGTTCATGTGTCACGCCAGGCCTGA |
| rs1002765 | 5′UTR of miR-4795 | A > G | CCTCTGCTTCGATTGTTGCTCTTCA[A/G]TTGGGCGATATACTACTTGTAGGCA |
| Ins/del of TATA boxes | PGC intron between exons 7 and 8 | 308–378 bp 400–413 bp 434–479 bp | Forward 5′-6-FAM-GGCCAGATCTGCGTGTTTTA-3′ Reverse 5’-AGCCCTAAGCCTGTTTTTGG-3′ |
| Characteristic | Controls (n = 52) | FDR-GC (n = 74) | ACAG (n = 62) | Dysplasia (n = 2) | GC (n = 80) |
|---|---|---|---|---|---|
| Age, years, mean (±SD) | 56 (12) | 47 (14) | 52 (11) | 58.2 (12.9) | 61 (12) |
| Male, n (%) | 37 (71.2) | 30 (40.5) | 15 (24.2) | 0 (0) | 48 (60.0) |
| H. pylori infection | |||||
| Positive cases, n (%) | 7 (13.5) | 22 (29.7) | 20 (32.3) | 1 (50.0) | 44 (55.0) |
| IgG, IU/mL, mean (±SD) § | 76 (28) | 89 (26) | 85 (33) | 57.4 (--) | 90 (28) |
| Characteristic | n (%) | PGII (ng/mL) § | PGI/PGII Ratio § |
|---|---|---|---|
| Histotype | |||
| Intestinal | 29 (36.2) | 14.2 (8.4–23.3) | 7.3 (5.1–10.7) |
| Diffuse | 43 (53.7) | 16.0 (9.9–28.2) | 7.1 (3.9–10.0) |
| Mixed | 8 (10.0) | 18.8 (16.2–23.9) | 7.3 (5.9–9.2) |
| Location | |||
| Proximal | 23 (28.7) | 19.5 (9.5–33.4) | 8.5 (5.4–11.6) |
| Distal | 57 (71.2) | 16.0 (11.0–22.3) | 7.1 (4.3–10.0) |
| Clinical stage | |||
| I-II | 31 (38.8) | 17.0 (10.0–22.8) | 7.3 (5.9–11.3) |
| III-IV | 49 (61.2) | 16.0 (12.1–32.6) | 7.1 (4.2–9.8) |
| H. pyloriinfection | |||
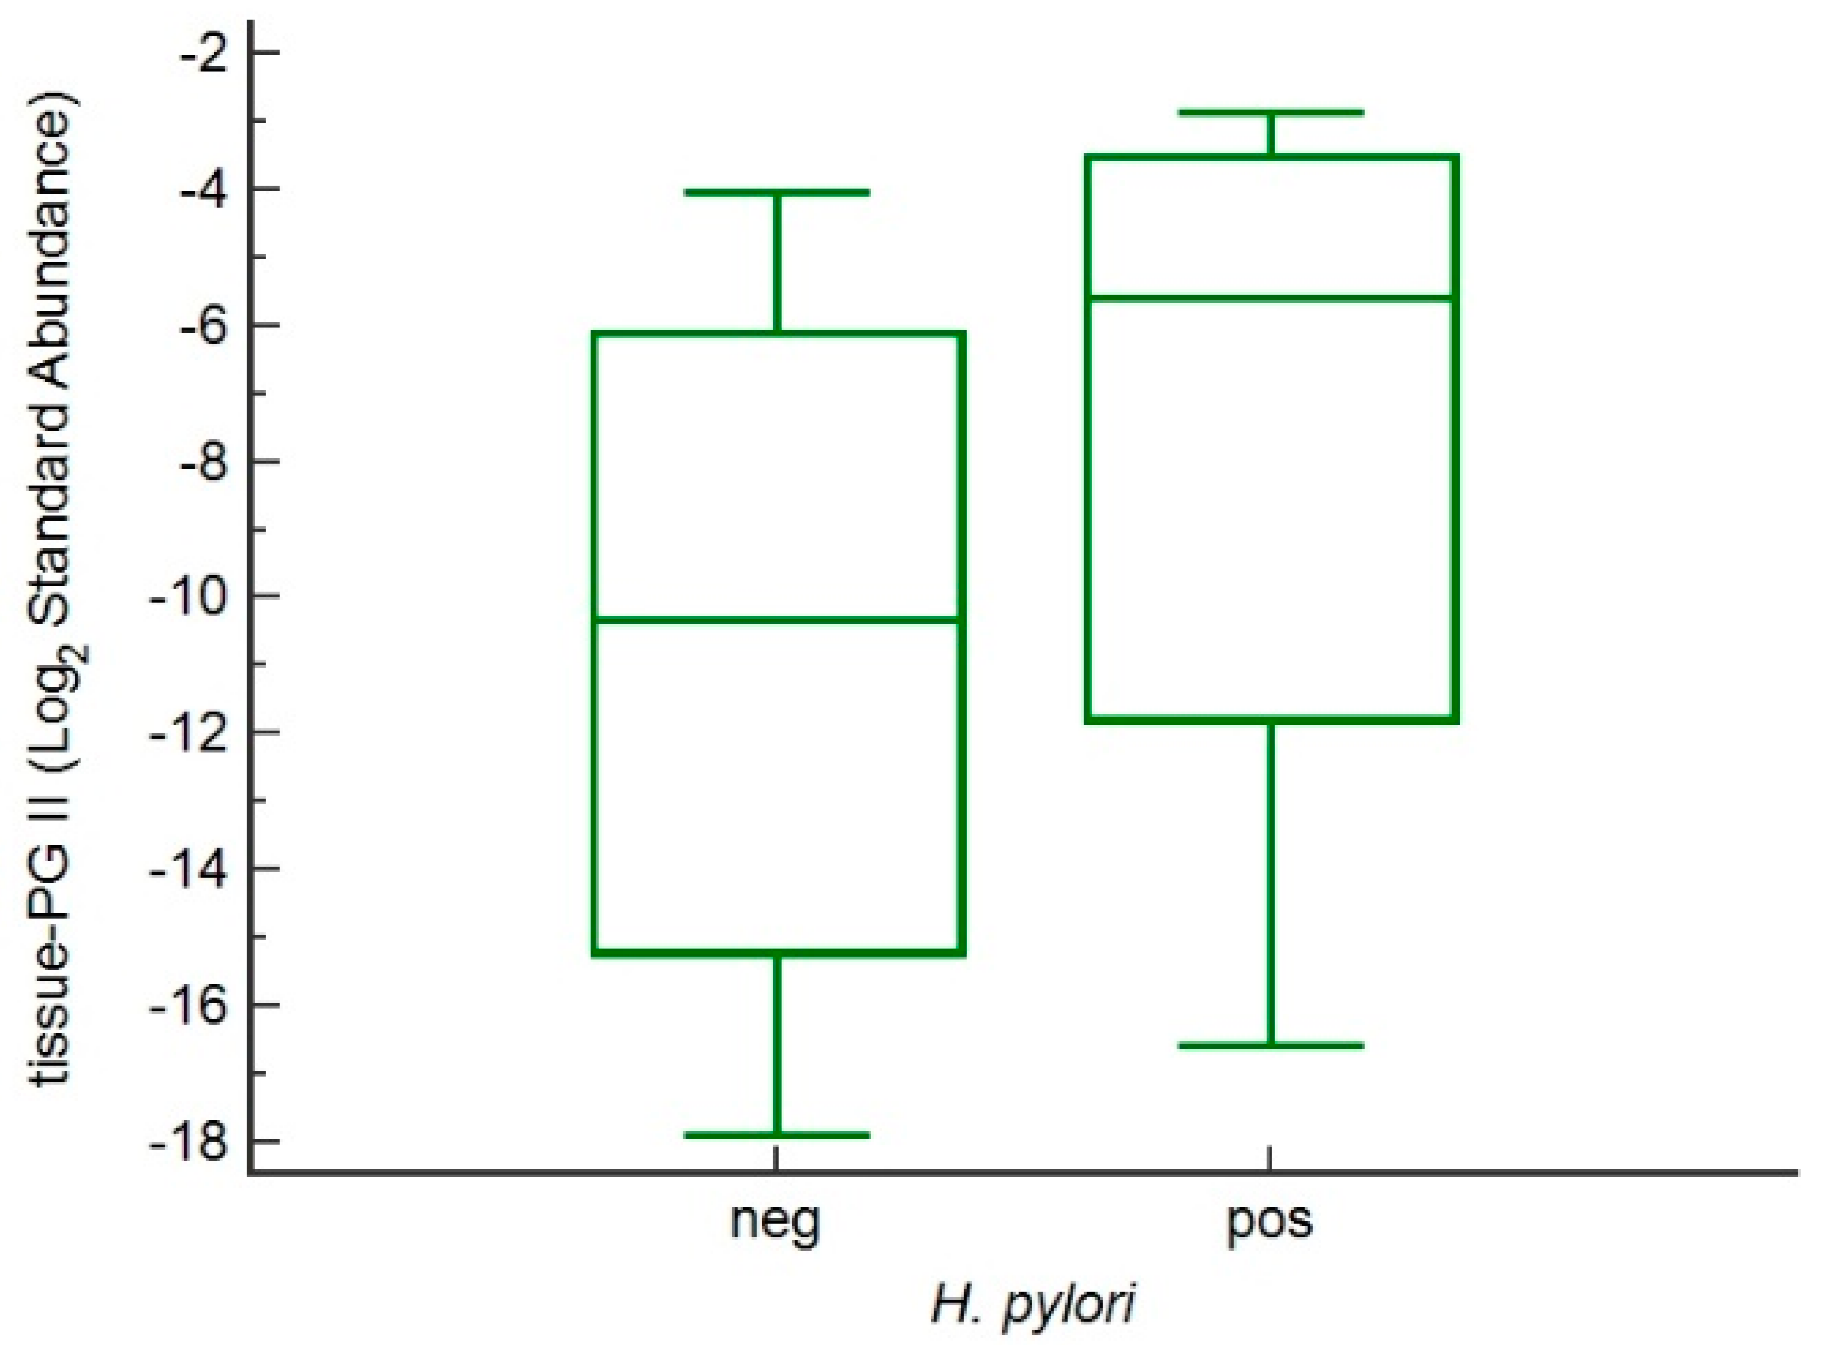
| Yes | 44 (55.0) | 19.9 (15.0–39.4) | 7.0 (4.8–9.0) |
| No | 36 (45.0) | 12.6 (7.2–19.1) | 8.5 (5.4–12.9) |
| p * | <0.001 | 0.044 |
| Serum Marker | Controls (n = 52) | FDR-GC (n = 74) | ACAG (n = 62) | Dysplasia (n = 2) | GC (n = 80) |
|---|---|---|---|---|---|
| PGI, ng/mL a | 56.25 (41.5–71.4) | 91.4 (77.0–123.7) | 17.8 (8.5–67.6) | 65.9 (23.7–108.0) | 132.8 (68.1–225.5) |
| PGI <70 ng/mL, n (%) | 38 (73.1) | 14 (18.9) | 48 (77.4) | 2 (100) | 23 (28.7) |
| PGI <25 ng/mL, n (%) | 0 (0) | 1 (1.4) | 37 (59.7) | 1 (50.0) | 7 (8.8) |
| PGII, ng/mL a | 5.9 (5.2–11.0) | 9.3 (11.0–28.7) | 10.0 (7.0–15.1) | 9.4 (8.0–10.7) | 17.8 (11.0–28.7) |
| PGI/PGII ratio a | 9.5 (8.2–13.1) | 10.5 (7.86–13.04) | 2.1 (1.01–5.7) | 2.8 (2.7–3.0) | 7.1 (4.9–10.1) |
| PGI/PGII ratio ≤3, n (%) | 0 (0) | 1 (1.4) | 41 (66.1) | 2 (100) | 12 (15.0) |
| Gastrin-17, pmol/L a | 2.0 (0.7–8.1) | 4.3 (1.7–13.4) | 105.9 (27.3–248.5) | 88.9 (1.94–175.9) | 14.6 (3.8–26.9) |
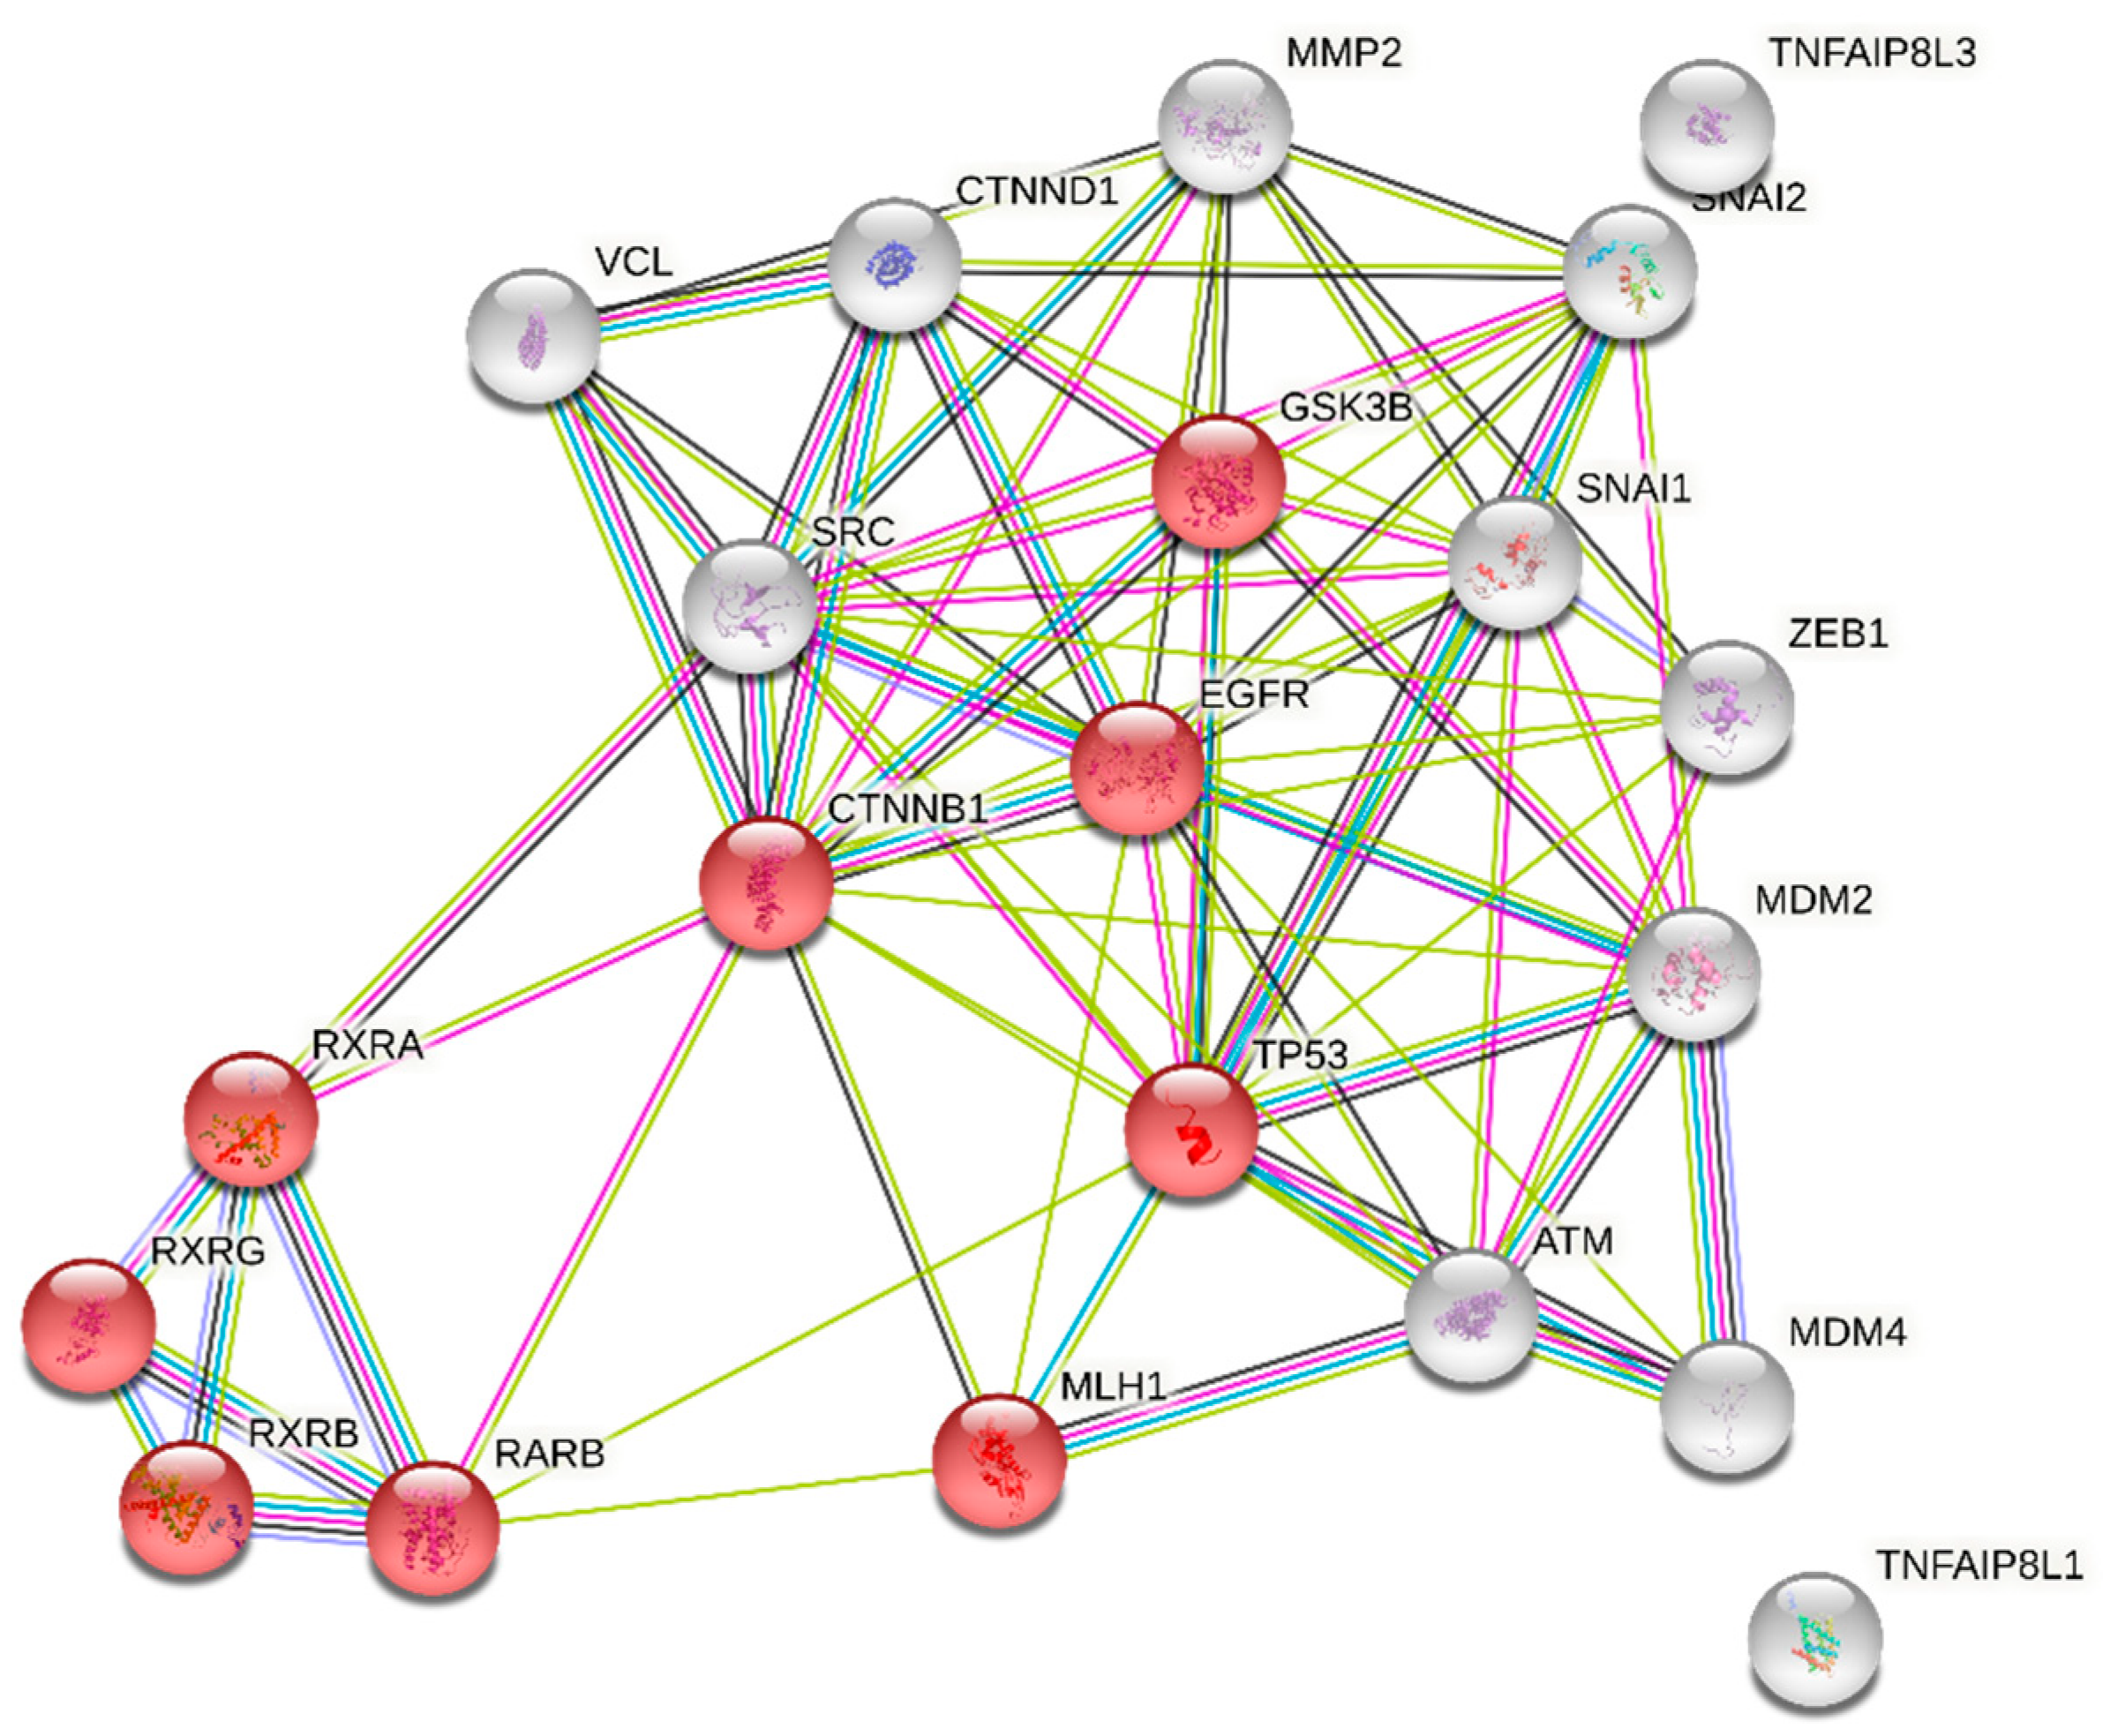
| Gene Name | Log2 Fold Change | Std Error (log2) | p-Value | p-Corrected * |
|---|---|---|---|---|
| MDM2 | 0.118 | 0.0204 | 0.000000567 | 0.000736 |
| SNAI2 | 0.089 | 0.0163 | 0.0000133 | 0.000863 |
| EGFR | 0.0858 | 0.0165 | 0.0000024 | 0.00107 |
| MMP2 | 0.106 | 0.0228 | 0.000010 | 0.00326 |
| RARb | 0.0704 | 0.016 | 0.000186 | 0.00482 |
| TIPE1 or TNFAIP8L1 | 0.0903 | 0.021 | 0.000241 | 0.00521 |
| CTNNB1 | 0.062 | 0.0147 | 0.000305 | 0.00567 |
| RXRg | 0.126 | 0.0308 | 0.000404 | 0.00656 |
| TIPE3 or TNFAIP8L3 | 0.111 | 0.0286 | 0.000696 | 0.00972 |
| ATM | 0.055 | 0.0143 | 0.000776 | 0.00972 |
| VCL | 0.0867 | 0.0227 | 0.000823 | 0.00972 |
| MDM4 | 0.0626 | 0.0167 | 0.000986 | 0.0104 |
| RXRb | 0.0622 | 0.0167 | 0.00104 | 0.0104 |
| CTNND1 | 0.0606 | 0.0166 | 0.00129 | 0.012 |
| SNAI1 | 0.079 | 0.0226 | 0.00191 | 0.0165 |
| ZEB1 | 0.0921 | 0.0274 | 0.00262 | 0.0213 |
| SRC | 0.0566 | 0.0175 | 0.00346 | 0.0265 |
| GSK3B | 0.0538 | 0.0167 | 0.00373 | 0.0269 |
| MLH1 | 0.0574 | 0.0187 | 0.00525 | 0.0359 |
| RXRa | 0.0557 | 0.0192 | 0.00787 | 0.0499 |
| TP53 | 0.05 | 0.0173 | 0.00806 | 0.0499 |
| RARg | 0.0548 | 0.0201 | 0.0119 | 0.0704 |
| MSH6 | 0.0459 | 0.0177 | 0.0161 | 0.0911 |
| RARa | 0.0425 | 0.0167 | 0.0174 | 0.0943 |
| PMS2 | 0.0409 | 0.0167 | 0.0217 | 0.113 |
| CDH1 | 0.0341 | 0.0146 | 0.0281 | 0.14 |
| HER2 | −0.0578 | 0.0264 | 0.0387 | 0.186 |
| Variant | Genotype | Cases, n | PGII, ng/mL § | p * |
|---|---|---|---|---|
| rs9471643 | C/C | 18 | 16.6 (9.1–22.4) | 0.03 |
| C/G | 90 | 9.0 (6.4–15.6) | ||
| G/G | 162 | 10.1 (6.3–17.1) | ||
| rs6458238 | A/A | 3 | 4.5 (4.0–7.2) | 0.61 |
| A/G | 36 | 9.4 (7.6–15.1) | ||
| G/G | 231 | 10.1 (7.7–18.7) | ||
| rs8111742 | A/A | 19 | 10.1 (8.3–18.9) | 0.06 |
| A/G | 113 | 12.0 (6.7–18.5) | ||
| G/G | 138 | 9.0 (6.3–14.0) | ||
| rs121224 | C/C | 91 | 10.5 (6.9–16.5) | 0.08 |
| C/G | 124 | 10.3 (6.5–18.7) | ||
| G/G | 55 | 11.65 (8.6–36.0) | ||
| rs1002765 | A/G | 58 | 11.3 (6.4–17.6) | 0.31 |
| G/G | 212 | 9.6 (6.7–16.2) | ||
| Indel (TATA boxes) | Group 1 (308–378 bp) | 78 | 11.3 (7.4–19.0) | 0.07 |
| Group 2 (400–413 bp) | 25 | 9.5 (6.5–13.1) | ||
| Group 3 (434–479 bp) | 169 | 12.1 (7.9–18.8) |
| rs9471643 | GC H. pylori-positive | GC H. pylori-negative | |||||
|---|---|---|---|---|---|---|---|
| n | PGII § | n | PGII § | RR (95%CI) p | Fold Change | p & | |
| C/C | 7 | 22.4 (17.5–41.5) | 1 | 22.1 (22.1–22.1) | 1.57 (1.13–2.20) <0.01 | 1.01 | 0.82 |
| C/G | 17 | 18.8 (15.7–28.4) | 6 | 7.1 (5.0–20.0) | 1.40 (0.99–1.98) 0.05 | 2.59 | 0.05 |
| G/G | 23 | 27.1 (16.2–39.8) | 26 | 12.8 (9.5–19.4) | 0.6 (0.43–0.86) <0.01 | 2.11 | <0.0001 |
| p * | 0.46 | 0.31 | |||||
| rs9471643 | CTRL H. pylori-positive | CTRL H. pylori-negative | |||||
| n | PGII § | n | PGII § | RR (95%CI) p | Fold Change | p & | |
| C/C | 2 | 6.6 (6.6–6.6) | 4 | 6.5 (6.1–6.9) | 2.72 (0.78–9.50) 0.12 | 1.02 | 1.00 |
| C/G | 0 | --- | 36 | 5.8 (4.7–6.8) | 0.06 (0.01–1.05) 0.05 | --- | --- |
| G/G | 12 | 9.0 (8.3–14.0) | 50 | 5.6 (4.7–6.1) | 4.06 (0.96–17.24 0.06 | 1.60 | 0.001 |
| p * | 0.14 | 0.31 | |||||
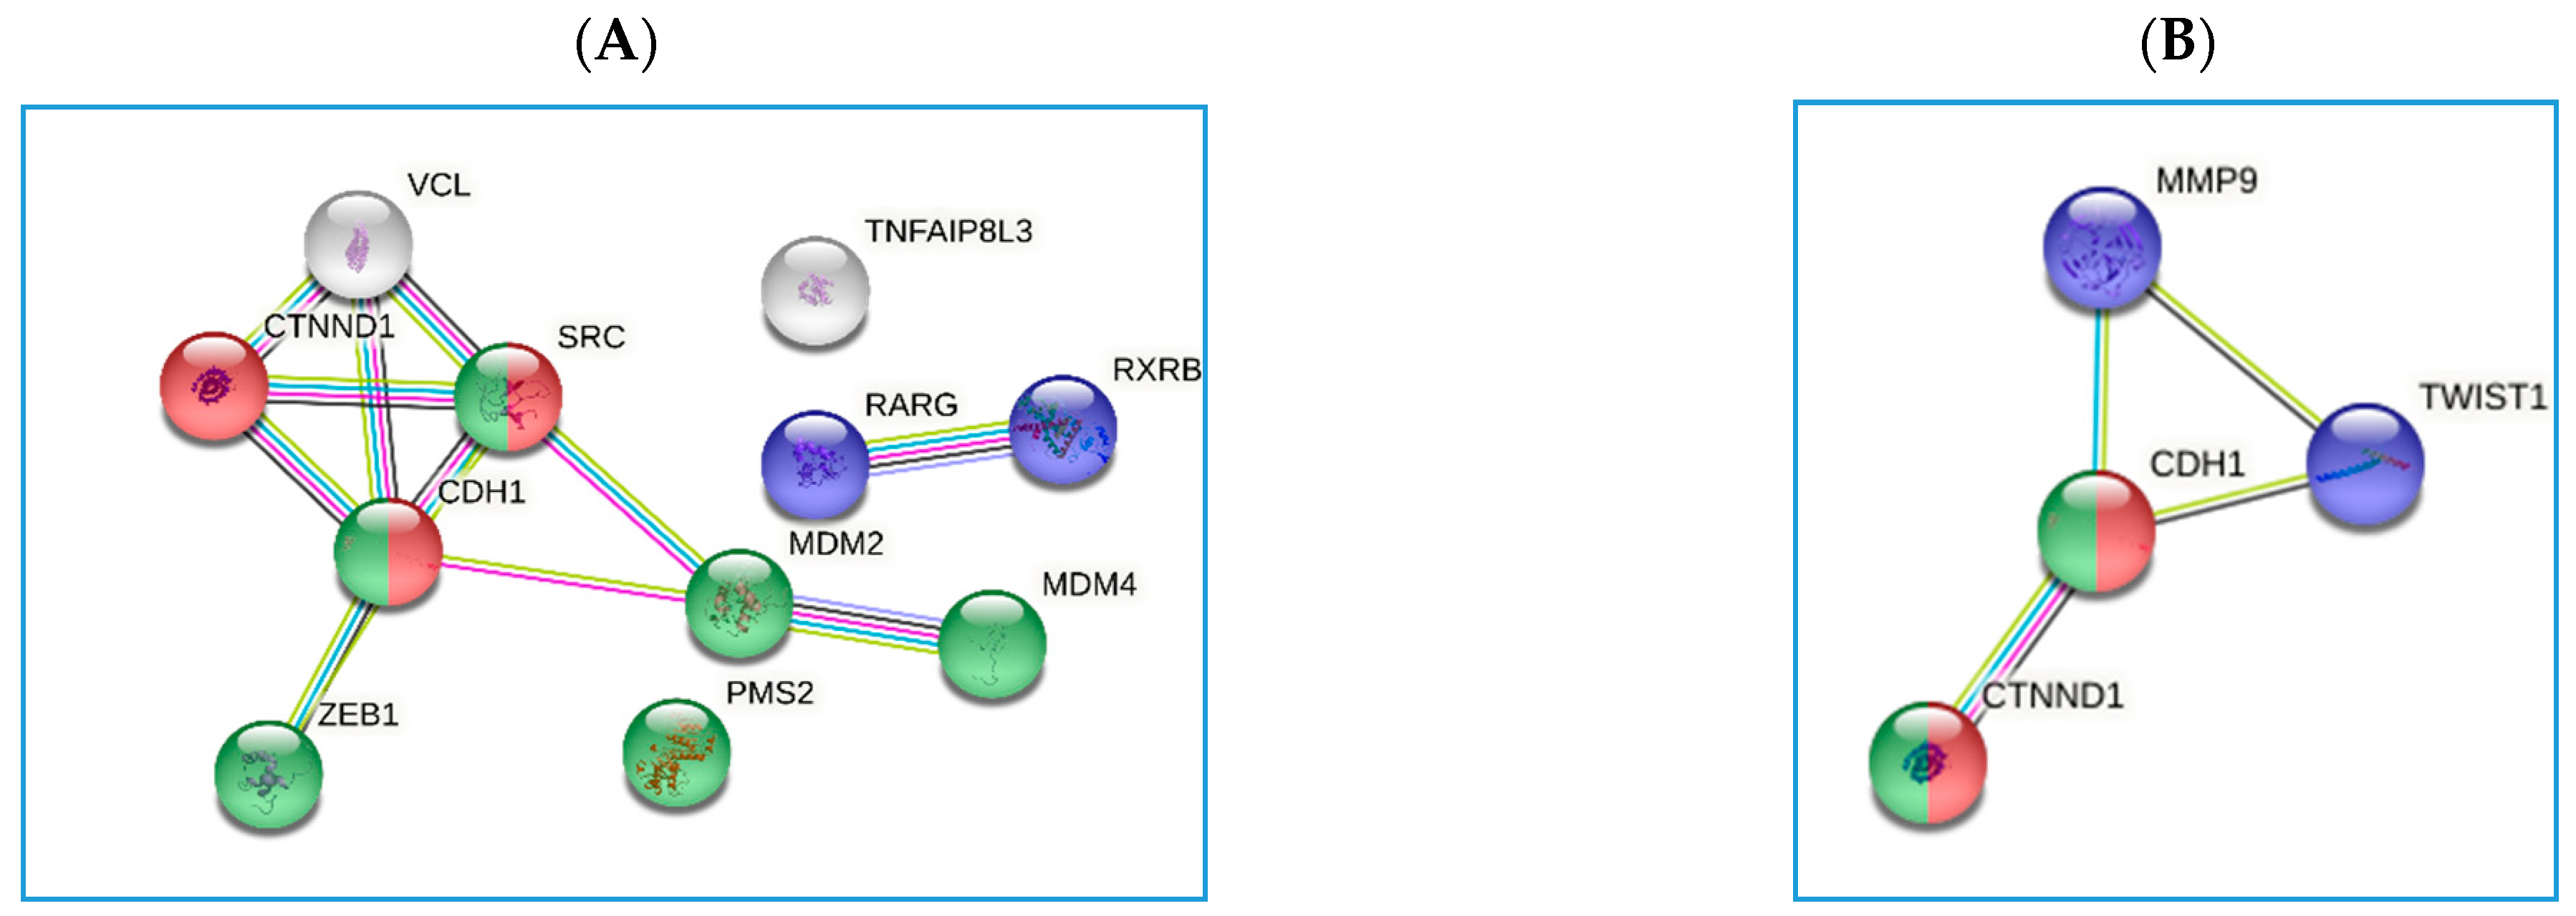
| Polymorphisms | Gene Name | Log2 Fold Change | Std Error (log2) | p-Value |
|---|---|---|---|---|
| rs9471643 CvsG allele | MDM2 | −2.40 | 0.905 | 0.0143 |
| SRC | −1.76 | 0.693 | 0.0181 | |
| RXRb | −1.57 | 0.632 | 0.0207 | |
| CDH1 | −1.29 | 0.523 | 0.0217 | |
| CTNND1 | −1.59 | 0.689 | 0.0304 | |
| VCL | −2.19 | 0.955 | 0.0312 | |
| PMS2 | −1.37 | 0.616 | 0.0366 | |
| TIPE3 or TNFAIP8L3 | −2.68 | 1.21 | 0.0367 | |
| ZEB1 | −2.50 | 1.13 | 0.0377 | |
| MDM4 | −1.51 | 0.7 | 0.0418 | |
| RARg | −1.71 | 0.809 | 0.0457 | |
| rs8111742 GvsA allele | TWIST1 | 1.10 | 0.771 | 0.167 |
| CTNND1 | −0.69 | 0.551 | 0.224 | |
| rs121224 GvsC allele | MMP9 | −1.33 | 0.506 | 0.015 |
| CDH1 | −0.72 | 0.316 | 0.0319 |
| Variant | GC | Non-GC | |||
|---|---|---|---|---|---|
| Cases, n | PGII, § | Cases, n | PGII, § | p * | |
| rs8111742 | |||||
| A/A | 5 | 19.4 (11.6–67.6) | 14 | 9.8 (7.6–16.8) | 0.06 |
| A/G | 38 | 20.1 (15.0–39.4) | 76 | 10.9 (7.1–15.0) | <0.0001 |
| G/G | 37 | 15.4 (8.6–22.2) | 100 | 9.0 (7.1–12.6) | <0.001 |
| p * | 0.02 | 0.48 | |||
| A | 48 | 19.8 (15.0–40.5) | 104 | 9.0 (5.7–14.3) | <0.0001 |
| G | 112 | 17.0 (10.0–24.9) | 276 | 8.0 (6.5–11.5) | <0.0001 |
| p * | 0.02 | 0.47 | |||
| rs121224 | |||||
| C/C | 31 | 16.0 (11.0–22.2) | 61 | 10.6 (7.2–15.0) | <0.0001 |
| C/G | 36 | 20.3 (15.5–39.8) | 88 | 9.8 (6.9–14.3) | <0.0001 |
| G/G | 15 | 11.0 (6.4–21.8) | 41 | 9.2 (7.5–11.7) | 0.24 |
| p * | 0.01 | 0.47 | |||
| C | 98 | 17.3 (12.6–33.7) | 210 | 8.0 (5.6–12.8) | <0.0001 |
| G | 62 | 18.3 (9.5–29.0) | 170 | 8.1 (6.1–11.3) | <0.0001 |
| p * | 0.55 | 0.67 | |||
| Variant | H. pylori-positive | H. pylori-negative | |||
|---|---|---|---|---|---|
| Cases, n | PGII, § | Cases, n | PGII, § | p * | |
| rs8111742 | |||||
| A/A | 1 | 104 (104–104) | 4 | 16.0 (10.8–37.4) | 0.16 |
| A/G | 23 | 27.1 (17.7–42.2) | 15 | 17.0 (12.7–20.2) | 0.006 |
| G/G | 23 | 18.3 (14.4–34.0) | 14 | 6.0 (3.9–11.0) | 0.0002 |
| p * | 0.03 | 0.03 | |||
| A | 25 | 33.7 (18.2–43.0) | 23 | 17.0 (12.5–20.5) | <0.0001 |
| G | 69 | 20.3 (15.9–37.1) | 43 | 10.8 (4.6–17.1) | <0.0001 |
| p * | 0.04 | 0.006 | |||
| rs121224 | |||||
| C/C | 18 | 19.5 (15.4–40.0) | 13 | 12.5 (4.7–17.6) | 0.005 |
| C/G | 25 | 20.6 (18.1–41.8) | 11 | 17.1 (12.7–20.15) | 0.006 |
| G/G | 4 | 20.5 (12.9–30.1) | 9 | 7.2 (4.6–14.4) | 0.002 |
| p * | 0.58 | 0.053 | |||
| C | 61 | 20.6 (16.8–37.6) | 37 | 13.0 (9.4–19.4) | <0.0001 |
| G | 33 | 20.6 (16.0–40.3) | 29 | 12.0 (7.0–21.7) | <0.0001 |
| p * | 0.99 | 0.76 | |||
Publisher’s Note: MDPI stays neutral with regard to jurisdictional claims in published maps and institutional affiliations. |
© 2021 by the authors. Licensee MDPI, Basel, Switzerland. This article is an open access article distributed under the terms and conditions of the Creative Commons Attribution (CC BY) license (http://creativecommons.org/licenses/by/4.0/).
Share and Cite
De Re, V.; Zorzi, M.D.; Caggiari, L.; Repetto, O.; Brisotto, G.; Magris, R.; Zanussi, S.; Steffan, A.; Cannizzaro, R. Polymorphisms in Pepsinogen C and miRNA Genes Associate with High Serum Pepsinogen II in Gastric Cancer Patients. Microorganisms 2021, 9, 126. https://doi.org/10.3390/microorganisms9010126
De Re V, Zorzi MD, Caggiari L, Repetto O, Brisotto G, Magris R, Zanussi S, Steffan A, Cannizzaro R. Polymorphisms in Pepsinogen C and miRNA Genes Associate with High Serum Pepsinogen II in Gastric Cancer Patients. Microorganisms. 2021; 9(1):126. https://doi.org/10.3390/microorganisms9010126
Chicago/Turabian StyleDe Re, Valli, Mariangela De Zorzi, Laura Caggiari, Ombretta Repetto, Giulia Brisotto, Raffaela Magris, Stefania Zanussi, Agostino Steffan, and Renato Cannizzaro. 2021. "Polymorphisms in Pepsinogen C and miRNA Genes Associate with High Serum Pepsinogen II in Gastric Cancer Patients" Microorganisms 9, no. 1: 126. https://doi.org/10.3390/microorganisms9010126