Article

Supplementation with Combined Lactobacillus helveticus R0052 and Bifidobacterium longum R0175 Across Development Reveals Sex Differences in Physiological and Behavioural Effects of Western Diet in Long–Evans Rats

1
Department of Psychology and Neuroscience, Dalhousie University, 1355 Oxford St., Halifax, NS B3H 4R2, Canada
2
Rosell® Institute for Microbiome and Probiotics, 6100 Ave. Royalmount, Montreal, QC H4P 2R2, Canada
3
Brain Repair Centre, Dalhousie University, Halifax, NS B3H 4R2, Canada
*
Authors to whom correspondence should be addressed.
Microorganisms 2020, 8(10), 1527; https://doi.org/10.3390/microorganisms8101527
Submission received: 10 September 2020 / Revised: 2 October 2020 / Accepted: 2 October 2020 / Published: 5 October 2020
(This article belongs to the Special Issue Gut Microbiota-Brain Axis in Regulation of Feeding Behavior)

Abstract

:
The gut microbiome affects various physiological and psychological processes in animals and humans, and environmental influences profoundly impact its composition. Disorders such as anxiety, obesity, and inflammation have been associated with certain microbiome compositions, which may be modulated in early life. In 62 Long–Evans rats, we characterised the effects of lifelong Bifidobacterium longum R0175 and Lactobacillus helveticus R0052 administration—along with Western diet exposure—on later anxiety, metabolic consequences, and inflammation. We found that the probiotic formulation altered specific anxiety-like behaviours in adulthood. We further show distinct sex differences in metabolic measures. In females, probiotic treatment increased calorie intake and leptin levels without affecting body weight. In males, the probiotic seemed to mitigate the effects of Western diet on adult weight gain and calorie intake, without altering leptin levels. The greatest inflammatory response was seen in male, Western-diet-exposed, and probiotic-treated rats, which may be related to levels of specific steroid hormones in these groups. These results suggest that early-life probiotic supplementation and diet exposure can have particular implications on adult health in a sex-dependent manner, and highlight the need for further studies to examine the health outcomes of probiotic treatment in both sexes.

1. Introduction

The microbes that inhabit the animal gut (i.e., gut microbiota) have been consistently reported to affect physiological and psychological functioning [1]. These microbes—especially bacteria—have important physiological functions in the host, including helping to regulate digestion, the immune system, central nervous system, and hormone levels (see [2] for a review). Indeed, the composition of the microbiota has been linked to various diseases (see [3] for a review) and is highly vulnerable to environmental exposures of the host (e.g., antibiotic use, infection) [4]. These environmental experiences can alter the microbiome in a way that promotes disease development (i.e., dysbiosis) [4]. Importantly, dysbiosis can be compounded by unhealthy Western diet (i.e., a diet containing processed foods, refined grains, fats, and added sugar) [5], which has been shown to alter the microbiota composition and change how the host stores and uses energy [6,7].
Probiotics (e.g., bacteria, yeasts) are defined as “live microorganisms that, when administered in adequate amounts, confer a health benefit on the host” [8] (p. 507). Expanding on this definition, Dinan and colleagues [9] describe that certain probiotics can function as psychobiotics if the health benefit from administration is that there is an improvement of symptoms of psychiatric illness. Although the microbiota is a potential target for the treatment and prevention of specific diseases that may be related to dysbiosis (e.g., stress-related disorders, gastrointestinal disorders) [2,10], multiple groups have stressed that research has not sufficiently differentiated a “normal” or “healthy” microbiota from that which is “abnormal” or “unhealthy” [2,3,11]. Many of the existing studies that administer or report on specific probiotics emphasise that the effects of probiotic treatment are dependent on which microorganisms were used [12,13,14], making studies that aim to characterise specific strain or formulation effects critical for the field [8]. Indeed, specific probiotic formulations have been shown to decrease the response to stress in rodent models (e.g., Companilactobacillus farciminis [15]; CEREBIOME® [16]; Lacidofil® [17]), improve anxiety symptomatology in humans and anxiety-like behaviours in rats (e.g., CEREBIOME® [18]), improve obesogenic outcomes (e.g., Lactiplantibacillus plantarum [19]; Bifidobacterium spp. [20,21]; L. helveticus R0052 [22]), and reduce the inflammatory response (e.g., B. infantis 35624 [23]; 8-strain combination probiotic [24]; 3-strain combination probiotic [25]).
Above and beyond the findings that probiotic treatment seems to ameliorate the previously mentioned health outcomes is the apparent interaction between the development of psychiatric disorders, obesity-related disorders, and inflammatory conditions. In their review, Dallman et al. [26] concluded that increased glucocorticoids and insulin work in conjunction to increase the consumption of palatable foods and energy storage as abdominal fat. Specifically, Pecoraro et al. [27] report reduced hypothalamic–pituitary–adrenal (HPA) activity (i.e., lower corticotropin-releasing factor (CRF) mRNA) when rats consume palatable food. Importantly, diet quality can also impair the development of the stress response in offspring mice, even without direct administration of the poor diet [28]. Psychological stress and dysfunction are also associated with increased inflammatory responses in both animal models [29,30] and human subjects [31] (see [32] for review on inflammation and anxiety disorders). In animal models, pro-inflammatory markers are increased in rats exposed to a high-fat diet (e.g., IL-6, TNF-α, IL-1β) [33]. In their review, Dandona et al. [34] report that obesity from overeating in humans may promote oxidative stress and inflammation. Of note is the association between obesity and type 2 diabetes and increased IL-6, TNF-α, and C-reactive protein (CRP) levels. Overall, probiotics that induce the production of IL-10 are described as immunoregulatory, which can improve health (e.g., reducing allergies, symptoms of irritable bowel disease) by inhibiting pro-inflammatory cytokines that induce inflammation [35]. Probiotics can also be categorised as immunostimulatory, where they have the potential to act against cancer and infection (e.g., inducing IL-12 production can induce natural killer cells) [35].
This study was designed to examine the effects of lifelong supplementation with CEREBIOME® (i.e., Lactobacillus helveticus R0052 and Bifidobacterium longum R0175; Lallemand Health Solutions Inc., Montreal, QC, Canada) in Long–Evans rats of both sexes exposed to a control or Western diet on adulthood anxiety-like behaviours, obesogenic outcomes, and inflammatory responses to acute stress. Based on previous literature characterising the effects of the strains composing CEREBIOME® or similar strains, we hypothesised that the probiotic formulation would be protective with respect to our measured adult health outcomes in comparison to a placebo. We additionally hypothesised that the Western diet would worsen these measured health outcomes compared to a control diet, and that probiotic administration may counteract some of the detrimental health consequences of lifelong Western diet intake.

2. Materials and Methods

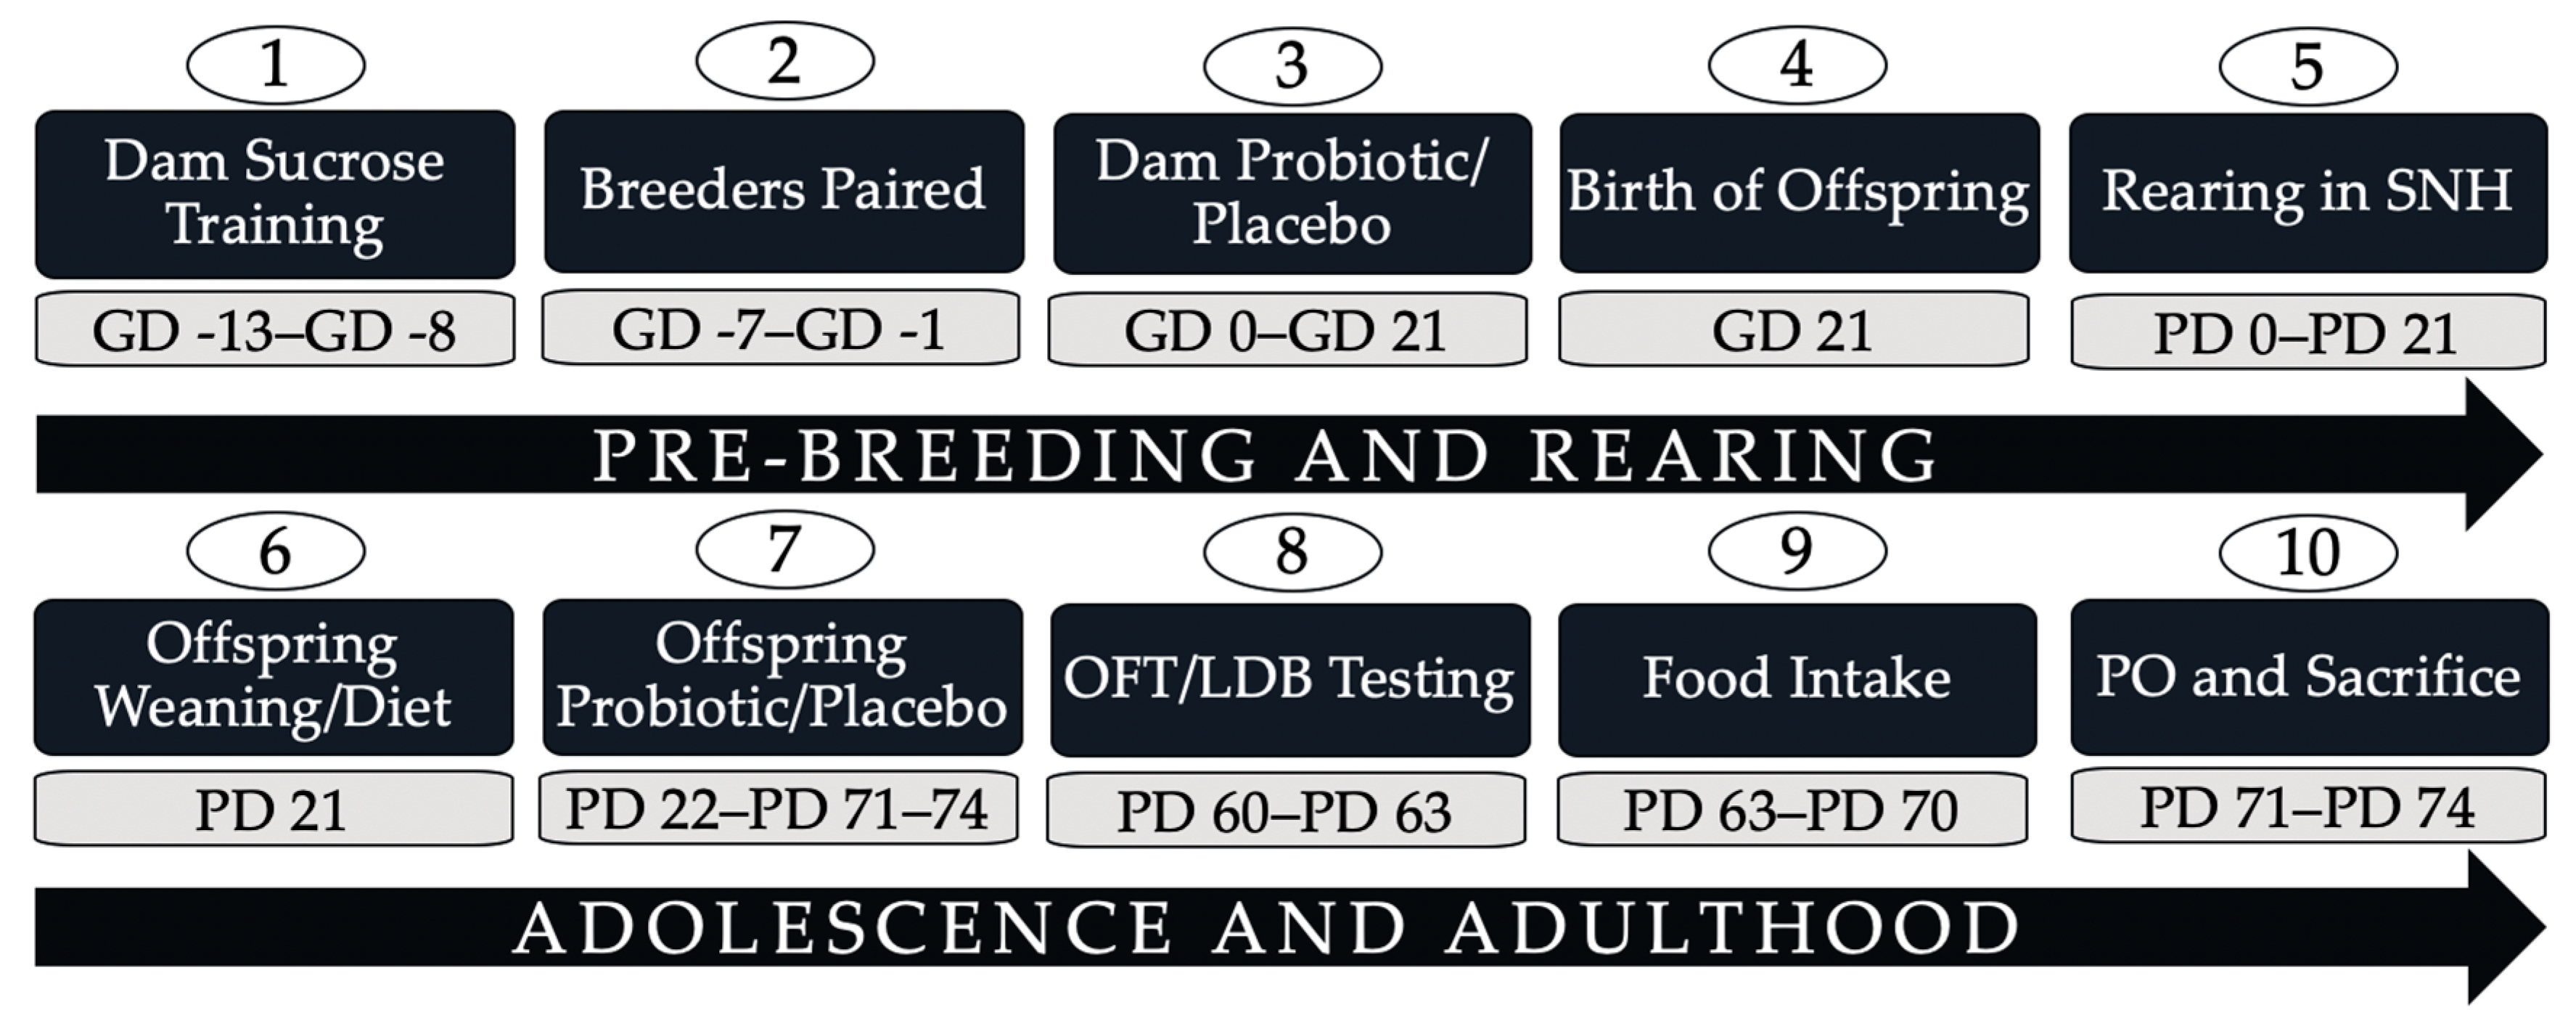
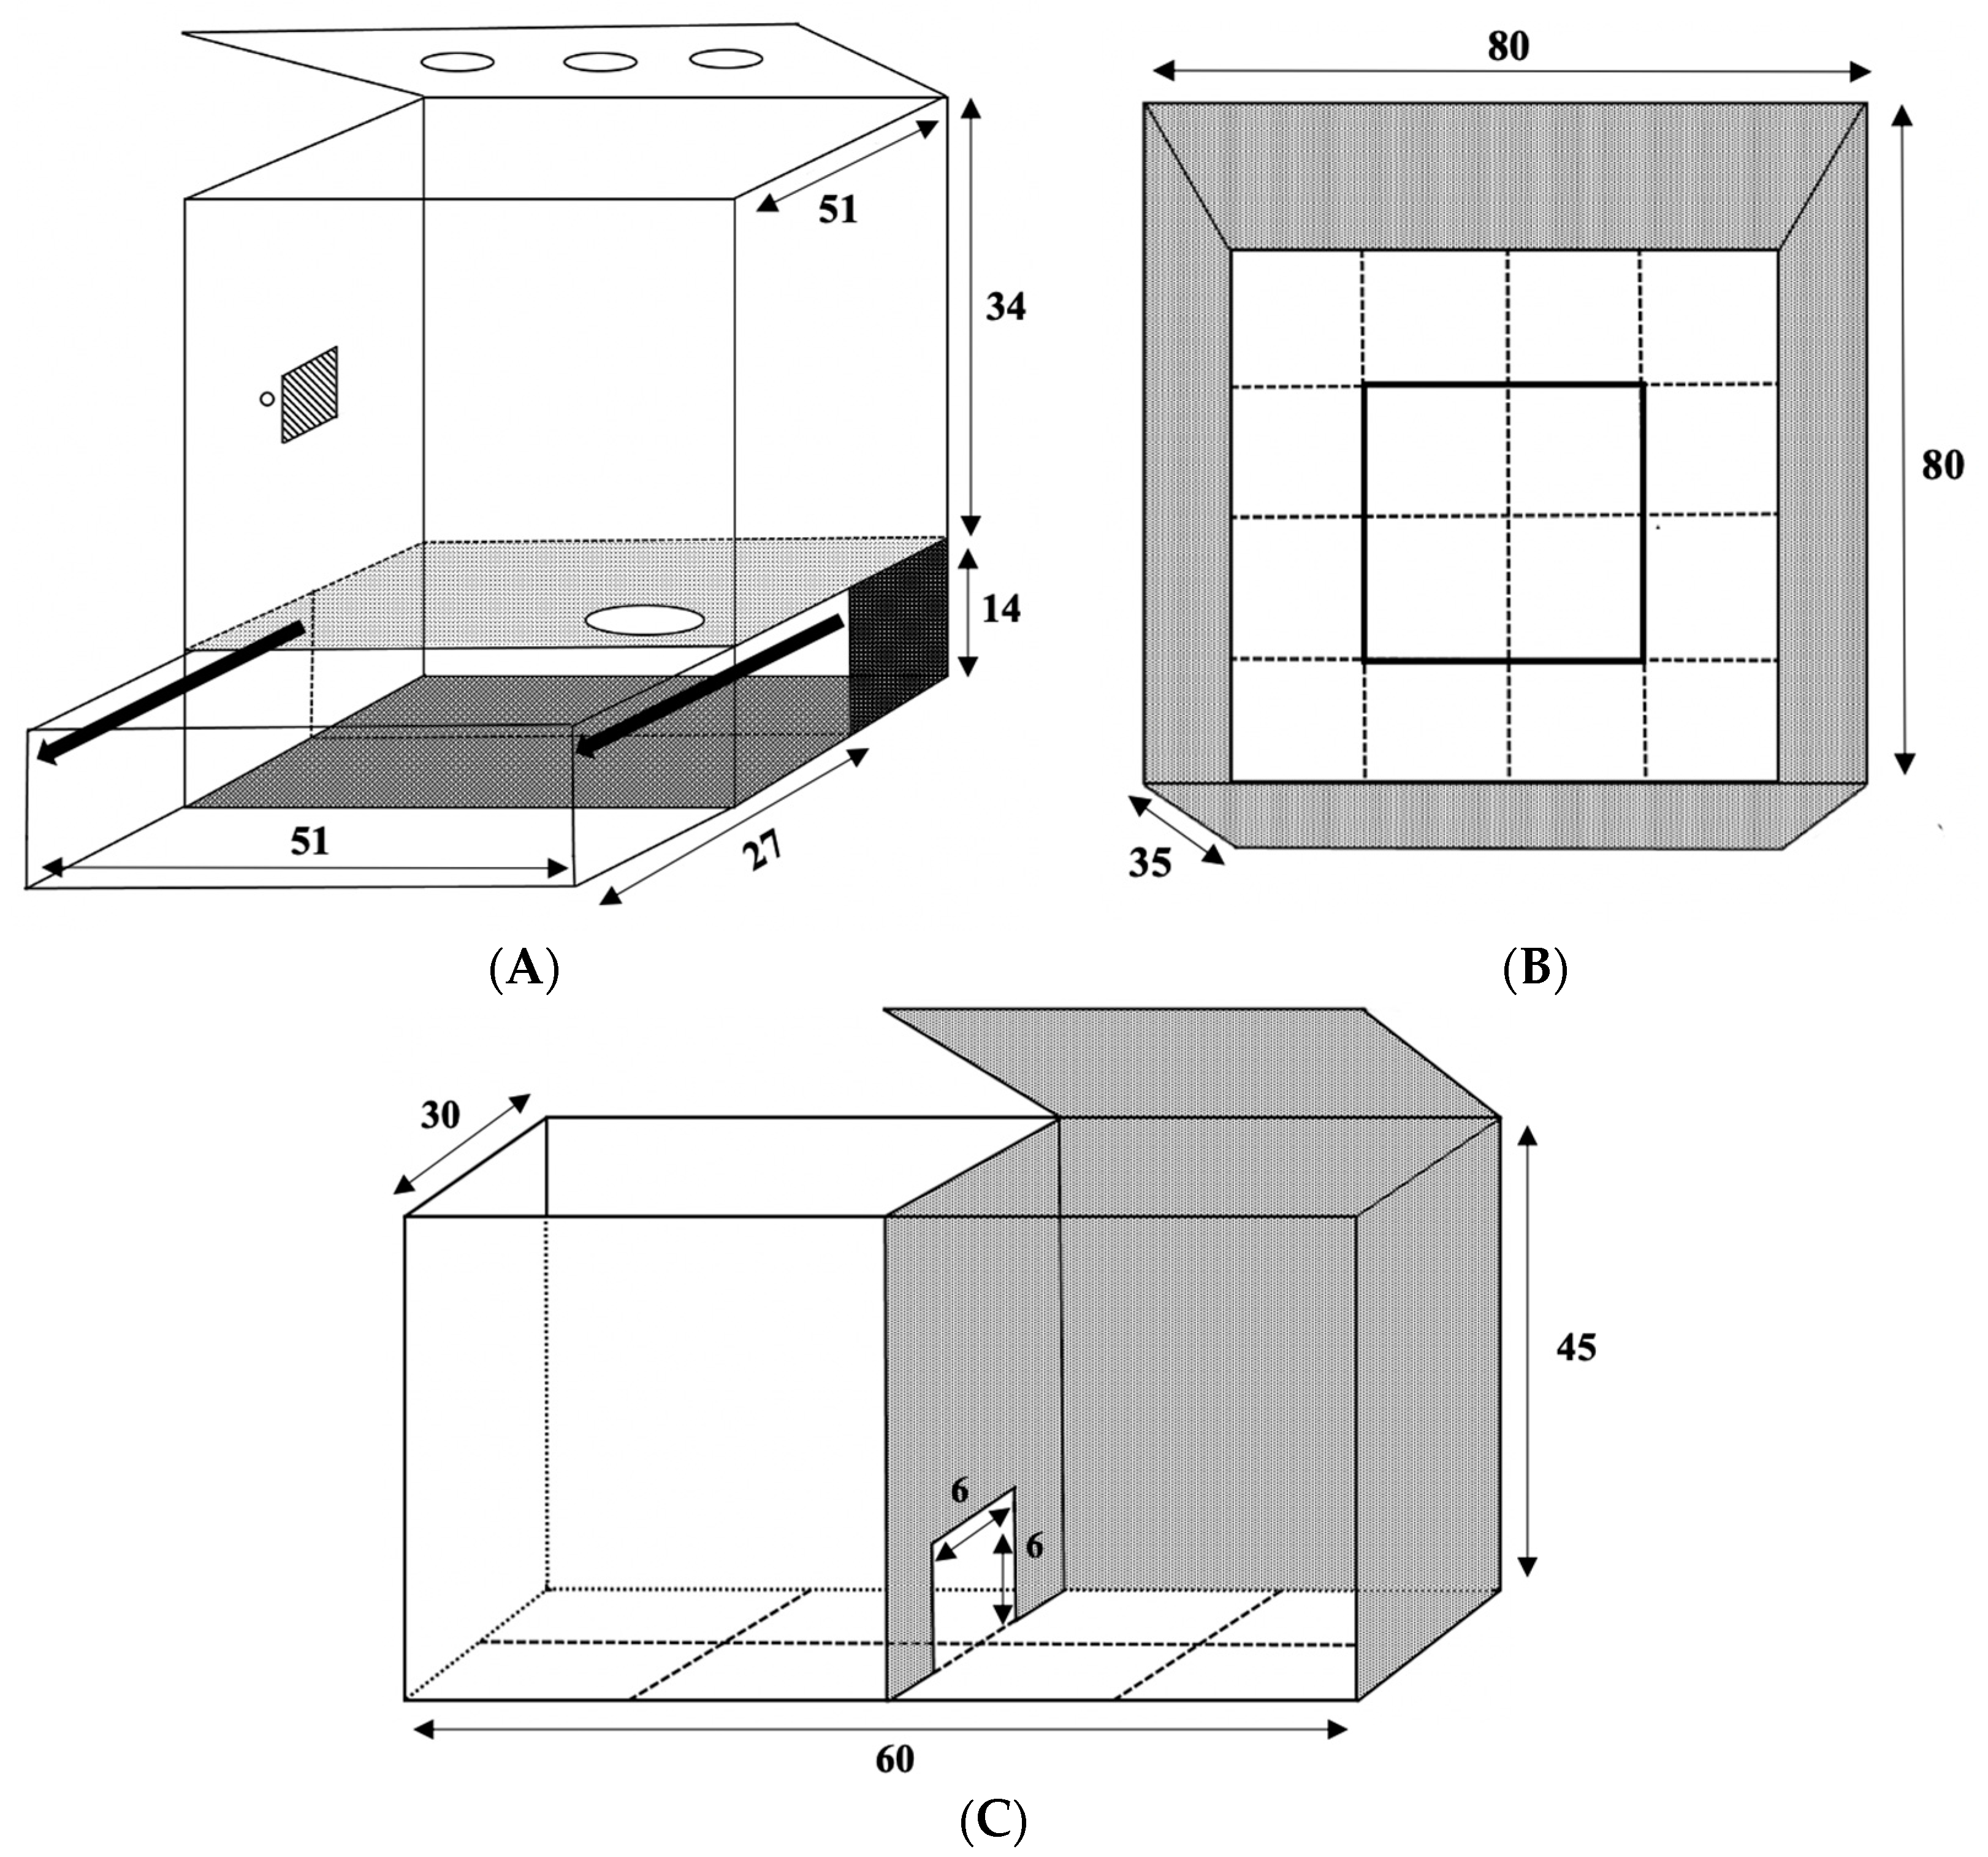
2.1. Animal and Breeding

The timeline for all experimental procedures is summarized in Figure 1. All procedures were approved by the Dalhousie University Committee on Laboratory Animals (Dalhousie University, Halifax, NS, Canada, protocol #18-023, 1 April 2018) and performed in accordance with the guidelines of the Canadian Council on Animal Care (CCAC). For this experiment, 16 Long–Evans hooded rats (eight males between 275 and 300 g and eight females between 220 and 225 g; Charles River Laboratories, Raleigh, NC, USA) were ordered—specific-pathogen-free and viral-antibody-free—for breeding and given two weeks to acclimate to our facility upon arrival. Rats were housed in same-sex pairs from arrival until breeding in polypropylene cages (47 cm × 24 cm × 20.5 cm) in a colony room maintained at 21 °C ± 2 °C under a reversed 12:12 h light–dark cycle with lights off at 10:00 in the multi-species and restricted card access animal facility in the Department of Psychology and Neuroscience (Dalhousie University, Halifax, NS, Canada). These standard static conventional housing cages were covered with stainless-steel wire hoppers and micro-isolator lids and contained softwood bedding (Shaw Resources, Shubenacadie, NS, Canada) with a black PVC tube (12 cm long, 9 cm in diameter). Standard rodent chow (Laboratory Rodent Diet 5001, Purina LabDiet®, St. Louis, MO, USA) and double-filtered municipal tap water were supplied ad libitum in a glass bottle with a stainless-steel sipper tip.
For breeding, two groups, each containing four naïve breeding pairs, were placed in separate colony rooms that would eventually become the probiotic or placebo administration rooms. The colony rooms were virtually identical in appearance and setup. Breeding in both rooms was conducted at the same time, and involved placing each of the eight pairs of rats together in a standard housing cage for seven days. After this time, the female was assumed to be pregnant, and the male was removed from the cage and housed alone until sacrifice. Females were pair-housed after breeding to minimise isolation stress until estimated gestational day 17 when they were given a fresh cage to await parturition. Females were weighed bi-weekly during pregnancy, and seven of eight bred females gave birth after 21 gestational days, with one female in the placebo-designated room not producing a litter. Within 24 h of parturition, females and their litters were transferred into large cages with a burrow section (semi-naturalistic housing, SNH, Figure 2A) [36]. Female breeders were kept with their pups until weaning at postnatal day (PD) 21.
A total of 46 pups were live-born (1 still-born) to four probiotic-treated dams with an additional 4 pups not surviving to weaning. In the placebo group, 33 pups were live-born (2 still-born) to three dams with an additional 3 pups not surviving to weaning. Due to the discrepancy in sample sizes (i.e., 42 probiotic offspring, 30 placebo offspring), pups in the probiotic group were culled to 32 offspring (i.e., 10 culled and used for molecular assay optimisation), which left 8 pups in each diet condition with an equal sex ratio. Overall, for this experiment, breeding produced 62 offspring for eight experimental offspring groups separated by treatment (32 probiotic, 30 placebo), by diet condition (31 Western diet, 31 control diet), and by sex (30 males, 32 females). Offspring were housed in same-sex pairs in groups of two or three in standard housing cages as described. Ethically, to reduce the number of offspring produced for this experiment, eight dams were bred, and offspring were sorted into the eight experimental groups randomly but in a way that maximised diversity. Due to litter sex ratios and ethical responsibility to pair house or house in threes, all litters could not always be represented in each group, but complete litter statistics are summarised in Table 1. Sample size was chosen from previous similar experiments by our laboratory group [36] and kept as small as possible to reduce the number of animals bred for experimental purposes.

2.2. Probiotic Administration

In this experiment, each dam and her offspring were placed into the same treatment group and received probiotic (CEREBIOME®) or its placebo. For all animals, the daily probiotic dosage was 1 billion colony forming units (CFUs) per mL, per day (i.e., 0.05 g of probiotic powder per 0.5 mL of reverse osmosis water, based on the CFU/g value for this specific batch of probiotic). An equivalent amount of placebo (i.e., the probiotic vehicle that contains malic acid, xylitol, and maltodextrin as excipients) solution was prepared (i.e., 0.05 g of placebo powder per 0.5 mL of reverse osmosis water). Solutions were made fresh each morning and maintained at 4 °C ± 4 °C until administration, according to the protocol developed in [37]. For both dams and offspring, probiotic or placebo were delivered via syringe feeding during the dark phase of the light–dark cycle (i.e., 11:00 ± 1 h) as per the protocol developed by Tillmann and Wegener [38] for adult male rats. Briefly, the syringe feeding protocol involves a training period that varies by age and sex of the rat, whereby the rat is lap-fed by an experimenter. After successful training (three to four days for adult male rats), rats will voluntarily approach the syringe and feed from the cage.
There is evidence suggesting that probiotics are transferred through the act of breastfeeding [39,40], and there are further reports that infant microbial gut colonisation may begin in utero [41]. Thus, although this experiment focused on offspring outcomes, solutions were delivered daily to the dam during pregnancy and lactation to maximise any potential benefits for the offspring. To expedite syringe training with the female breeders and to not interfere with breeding, females were trained by adding a 0.25 M sucrose solution (i.e., 0.04 g of sucrose in 0.5 mL of reverse osmosis water) to the solution for four days prior to breeding. Four of the eight females voluntarily took the syringe with sucrose-sweetened probiotic or placebo solution after the four days. After breeding, probiotic and placebo solution were delivered without added sucrose, and all females voluntarily fed from the cage at that time. Solutions were delivered to the offspring daily from PD 22 until day of sacrifice (PD 71 to 74; i.e., for equal to or greater than seven weeks). As the probiotic vehicle contained a polysaccharide food additive that was slightly sweet, sucrose was not added to the offspring probiotic and placebo solutions during training. All offspring learned to take the solution voluntarily from the cage after 27 days.

2.3. Diet Manipulation

From weaning, all rats were fed a specific chow and provided water ad libitum until sacrifice. Diets were purchased from Research Diets (New Brunswick, NJ, USA) and comprised equivalent protein matched by the supplier and a similar number of kilocalories. Offspring rats in both the probiotic and placebo groups received either control diet (product #D14042701; carbohydrate 73% kcal, fat 10% kcal, protein 17% kcal, kcal/g = 3.9) or Western diet (product #D12079B; carbohydrate 43% kcal, fat 40% kcal, protein 17% kcal, kcal/g = 4.7). In the control diet, the main sources of carbohydrates were corn starch followed by maltodextrin, whereas they were sucrose, maltodextrin, and corn starch in the Western diet. The main source of fat for both diets was anhydrous milk fat, but the Western diet contained more anhydrous milk fat relative to the control diet; they contained equal amounts of corn oil. Protein content, vitamins, minerals, and added fibre were identical between the two diets, but the Western diet contained cholesterol, whereas the control diet did not.

2.4. Weight and Food Intake

Offspring rats were weighed bi-weekly from weaning until sacrifice to monitor for any changes in health status and also at an average age of PD 67 to obtain a final adult weight. All birth, wean, and adult weights are provided in grams (g). Additionally, when offspring reached adulthood, food intake was measured for five consecutive days between PD 63 and PD 70. Briefly, a 24 h ± 1 h change in food weight for each cage was determined and divided by the number of rats in the cage. A 4-day average amount of food consumed (in kcal, by multiplying each average food weight in grams by the kcal/g values above) was calculated from the change in food across each of the five measurement days, and differences by treatment, diet, or sex were determined.

2.5. Anxiety-Like Behaviours

To assess anxiety-like behaviour, all offspring were tested for 5 min in each of the open field test (OFT; between PD 60 and PD 61) and light–dark box (LDB; between PD 62 and PD 63). For both tests, rearing and line crosses were scored in real-time, while remaining behaviours were scored later from video. Behavioural apparatuses were cleaned with 70% ethanol between rats and before the first rat was tested each day. The testing room was lit by a 60 W red light during both tests.
Behaviours measured included line crosses (between equal squares marked by white FisherbrandTM labelling tape (Thermo Fisher Scientific, Whitby, ON, Canada), total rearing, supported rearing, unsupported rearing, transitions between light and dark areas (in the LDB), time in centre (in the OFT; not including initial time taken to exit centre), time in light (in the LDB), latency to move from centre (in the OFT), and latency to move from the dark area (in the LDB). As described by Kalueff and Tuohimaa [42], increased time spent by a subject in (or transitions into) more anxiety-inducing areas (i.e., the centre area in the OFT; the light section in the LDB) was interpreted as showing less anxiety. Additionally, more time taken to leave a more-anxiety-inducing area when initially placed there (e.g., centre of OFT) is indicative of higher anxiety, whereas less time taken to voluntarily enter a more-anxiety-inducing area (e.g., light section of LDB when initially placed in the dark section) is indicative of lower anxiety [42]. Increased locomotion (e.g., line crosses) is usually regarded as a measure of lower anxiety in behavioural tests such as the OFT and LDB [42], but should be interpreted with caution when weight varies between tested groups [43]. Rearing frequency is another commonly examined behaviour, which may indicate more exploration (i.e., low anxiety) but can also vary due to overall locomotor ability, which is influenced by more than just anxiety (e.g., by weight) [44]. It has recently been suggested that rearing always be separated out by supported (locomotion measure to be interpreted cautiously) and unsupported (exploratory and low-anxiety behaviour), as these are distinct behavioural variables [45].

2.5.1. Open Field Test

The OFT was constructed of black plexiglass (80 cm long × 80 cm wide × 35 cm high) with no lid (Figure 2B). Animals were initially placed in the centre of the arena [46,47], facing a consistent side of the testing apparatus.

2.5.2. Light–Dark Box

The LDB (Figure 2C; overall 60 cm long × 30 cm wide × 45 cm high, 6 cm × 6 cm middle passage door; adapted from designs in [48,49]) had a 50/50 light/dark split where the dark box was constructed to fit into half of an overall apparatus constructed of clear plexiglass. The dark box was constructed of clear plexiglass on one side (to allow for video and live scoring) and opaque black plexiglass on the remaining three sides and hinged lid. At the start of testing, all rats were placed in the centre of the dark side, facing the opening to the light side. A 60 W white light was mounted 45 cm above the light section of the LDB, which was illuminated during testing.

2.6. Predator Odour Exposure, Sacrifice, and Tissue Collection

Between PD 71 and PD 74, animals were sacrificed 90 min following a 5-min acute predator odour stressor comprised of exposure to a cotton swab containing 0.5 mL of pure cat urine in a metal tea strainer hung from the side of the apparatus in the light section of the LDB (Figure 2C). This modified LDB was cleaned with 70% ethanol between each exposure and before the first exposure of the day. All surgical equipment was cleaned with 70% ethanol before the first sacrifice of the day and between animals. Testing, sacrifices, and dissections from the placebo group were always performed prior to the probiotic group.
All 62 rats were anaesthetised with Euthanyl (sodium pentobarbital) via intraperitoneal injection and, once fully unconscious, were quickly decapitated. Brains were removed and immediately placed on a plexiglass plate over dry ice, and the hippocampus and hypothalamus were gross dissected from a coronal section. Adrenal glands, colon, caecum, small intestine, stomach, fat, liver, and spleen were collected and immediately placed on dry ice until they were stored at −80 °C. The presence or absence of both L. helveticus R0052 and B. longum R0175 in all animals was confirmed in caecum contents collected at sacrifice, as previously described [37]. Briefly, we confirmed by qPCR that, on the day caecum was collected, CEREBIOME® (previously known as Probio’Stick®) was detected in all probiotic-treated animals and not detected in any placebo-treated animals [37].

2.7. Plasma Inflammatory Marker Multiplex Analysis

For the detection of immunological analyte concentration in plasma (pg/mL), the Luminex Bio-Plex® 200 system—along with the Bio-Plex Pro™ Rat Cytokine 23-Plex Assay Kit—was used (Bio-Rad Laboratories, Hercules, CA, USA, cat. #12005641, lot #64178837). Plasma was prepared from trunk blood collection after decapitation. At 4 °C, whole blood was spun at 1,000 g for 15 min, transferred into a clean microtube, re-spun at 10,000 g for 10 min, followed by transfer to a clean microtube. Plasma dilutions were done using the Bio-Plex® sample diluent (part of the Bio-Plex Pro™ Rat Cytokine 23-Plex Assay Kit) at a 1:10 dilution, based on previous dilution optimisation. Following the manufacturer’s protocol, plasma samples were analysed using the Luminex Bio-Plex® 200. Briefly, this kit is designed to measure the following pro-inflammatory, anti-inflammatory, and regulatory inflammatory analytes: IL (interleukin)-1α, IL-1β, IL-2, IL-4, IL-5, IL-6, IL-7, IL-10, IL-12p70, IL-13, IL-17A, IL-18, IFN-γ (interferon-gamma), M-CSF (macrophage-colony stimulating factor, CSF-1), GM-CSF (granulocyte macrophage-colony stimulating factor, CSF-2), G-CSF (granulocyte-colony stimulating factor, CSF-3), TNF-α (tumor necrosis factor-alpha), GRO/KC (growth related oncogene/keratinocyte chemoattractant, CXCL1, GRO-α), VEGF (vascular endothelial growth factor), MCP-1 (monocyte chemoattractant protein-1, CCL2), MIP-1α (macrophage inflammatory protein 1-alpha; CCL3), MIP-3α (CCL20), and RANTES (regulated upon activation normal T-cell expressed and secreted; CCL5).

2.8. Plasma Leptin Enzyme-Linked Immunosorbent Assay (ELISA)

For the detection of leptin concentration (pg/mL) in plasma, samples were previously prepared, as described in Section 2.7. Two leptin rat ELISA kits (ThermoFisher Scientific, Waltham, MA, USA, cat. #KRC2281, lot #218111-003) were counterbalanced by group type and for location on the plate. Samples were assayed in duplicate and diluted to 1:11 based on previous dilution optimisation. It was decided that samples with greater than 20% coefficient of variation (CV) would be redone, but no samples were assayed with greater than 20% CV. Interassay and intraassay variability are reported by the manufacturer as 4.6% and 3.6%, respectively.

2.9. Statistical Analyses

All statistical analyses were conducted using IBM SPSS Statistics (Version 25; IBM Corporation, Armonk, NY, USA) software. For behavioural analyses, outliers were removed from analyses if they were greater or below three standard deviations (SD) from the mean (M). There were no outliers found for adult weight or food intake variables. For plasma leptin levels, one extreme value just greater than 3 SDs from the mean (a placebo male exposed to Western diet) was noted, but the value remained in analyses because it represented a possible biological value on the standard curve with a CV of 0.87% between duplicates. For inflammation, outliers were removed from analyses if values were greater or less than 3 SDs from the mean for each analyte individually. Values below the standard curve were reported as the minimum for the standard curve for each analyte. Of the 23 analytes tested, only those deemed measurable were reported, with measurable being defined as 80% or greater of the subjects tested falling within the standard curve for that analyte.
All behavioural, adult weight, food intake, leptin, and inflammation dependent variables were analysed using 2 × 2 × 2 (treatment by diet by sex) factorial analyses of variance (ANOVAs). Results from all ANOVA analyses are presented with descriptive statistics (i.e., M and SD) provided for all measures, with the goal of conveying the amount of variability of data from the mean. Wean weight was analysed using a 2 × 2 (treatment by sex) factorial ANOVA, as offspring were not exposed to diet until after weaning. Further 2 × 2 × 2 ANOVAs requiring a co-variate (ANCOVAs) were conducted on all behavioural measures (controlling for adult weight). All 2-way and 3-way interactions were analysed post hoc by simple effects analyses. While the alpha level was chosen to be 0.05 and main effects and interactions are presented when results are below this threshold, due to the large number of ANOVAs being conducted in this study, it should be noted that p-values between 0.01 and 0.05 should be interpreted with caution as the possibility of type I error is increased with multiple comparisons. Correlations were analysed by Spearman’s rho (rs) also at an alpha level of 0.05 with p-values between 0.01 and 0.05 also interpreted with caution. Effect sizes were reported as partial eta squared (ηp2), see [50,51] for considerations when using ηp2 for power analyses and meta-analyses.

3. Results

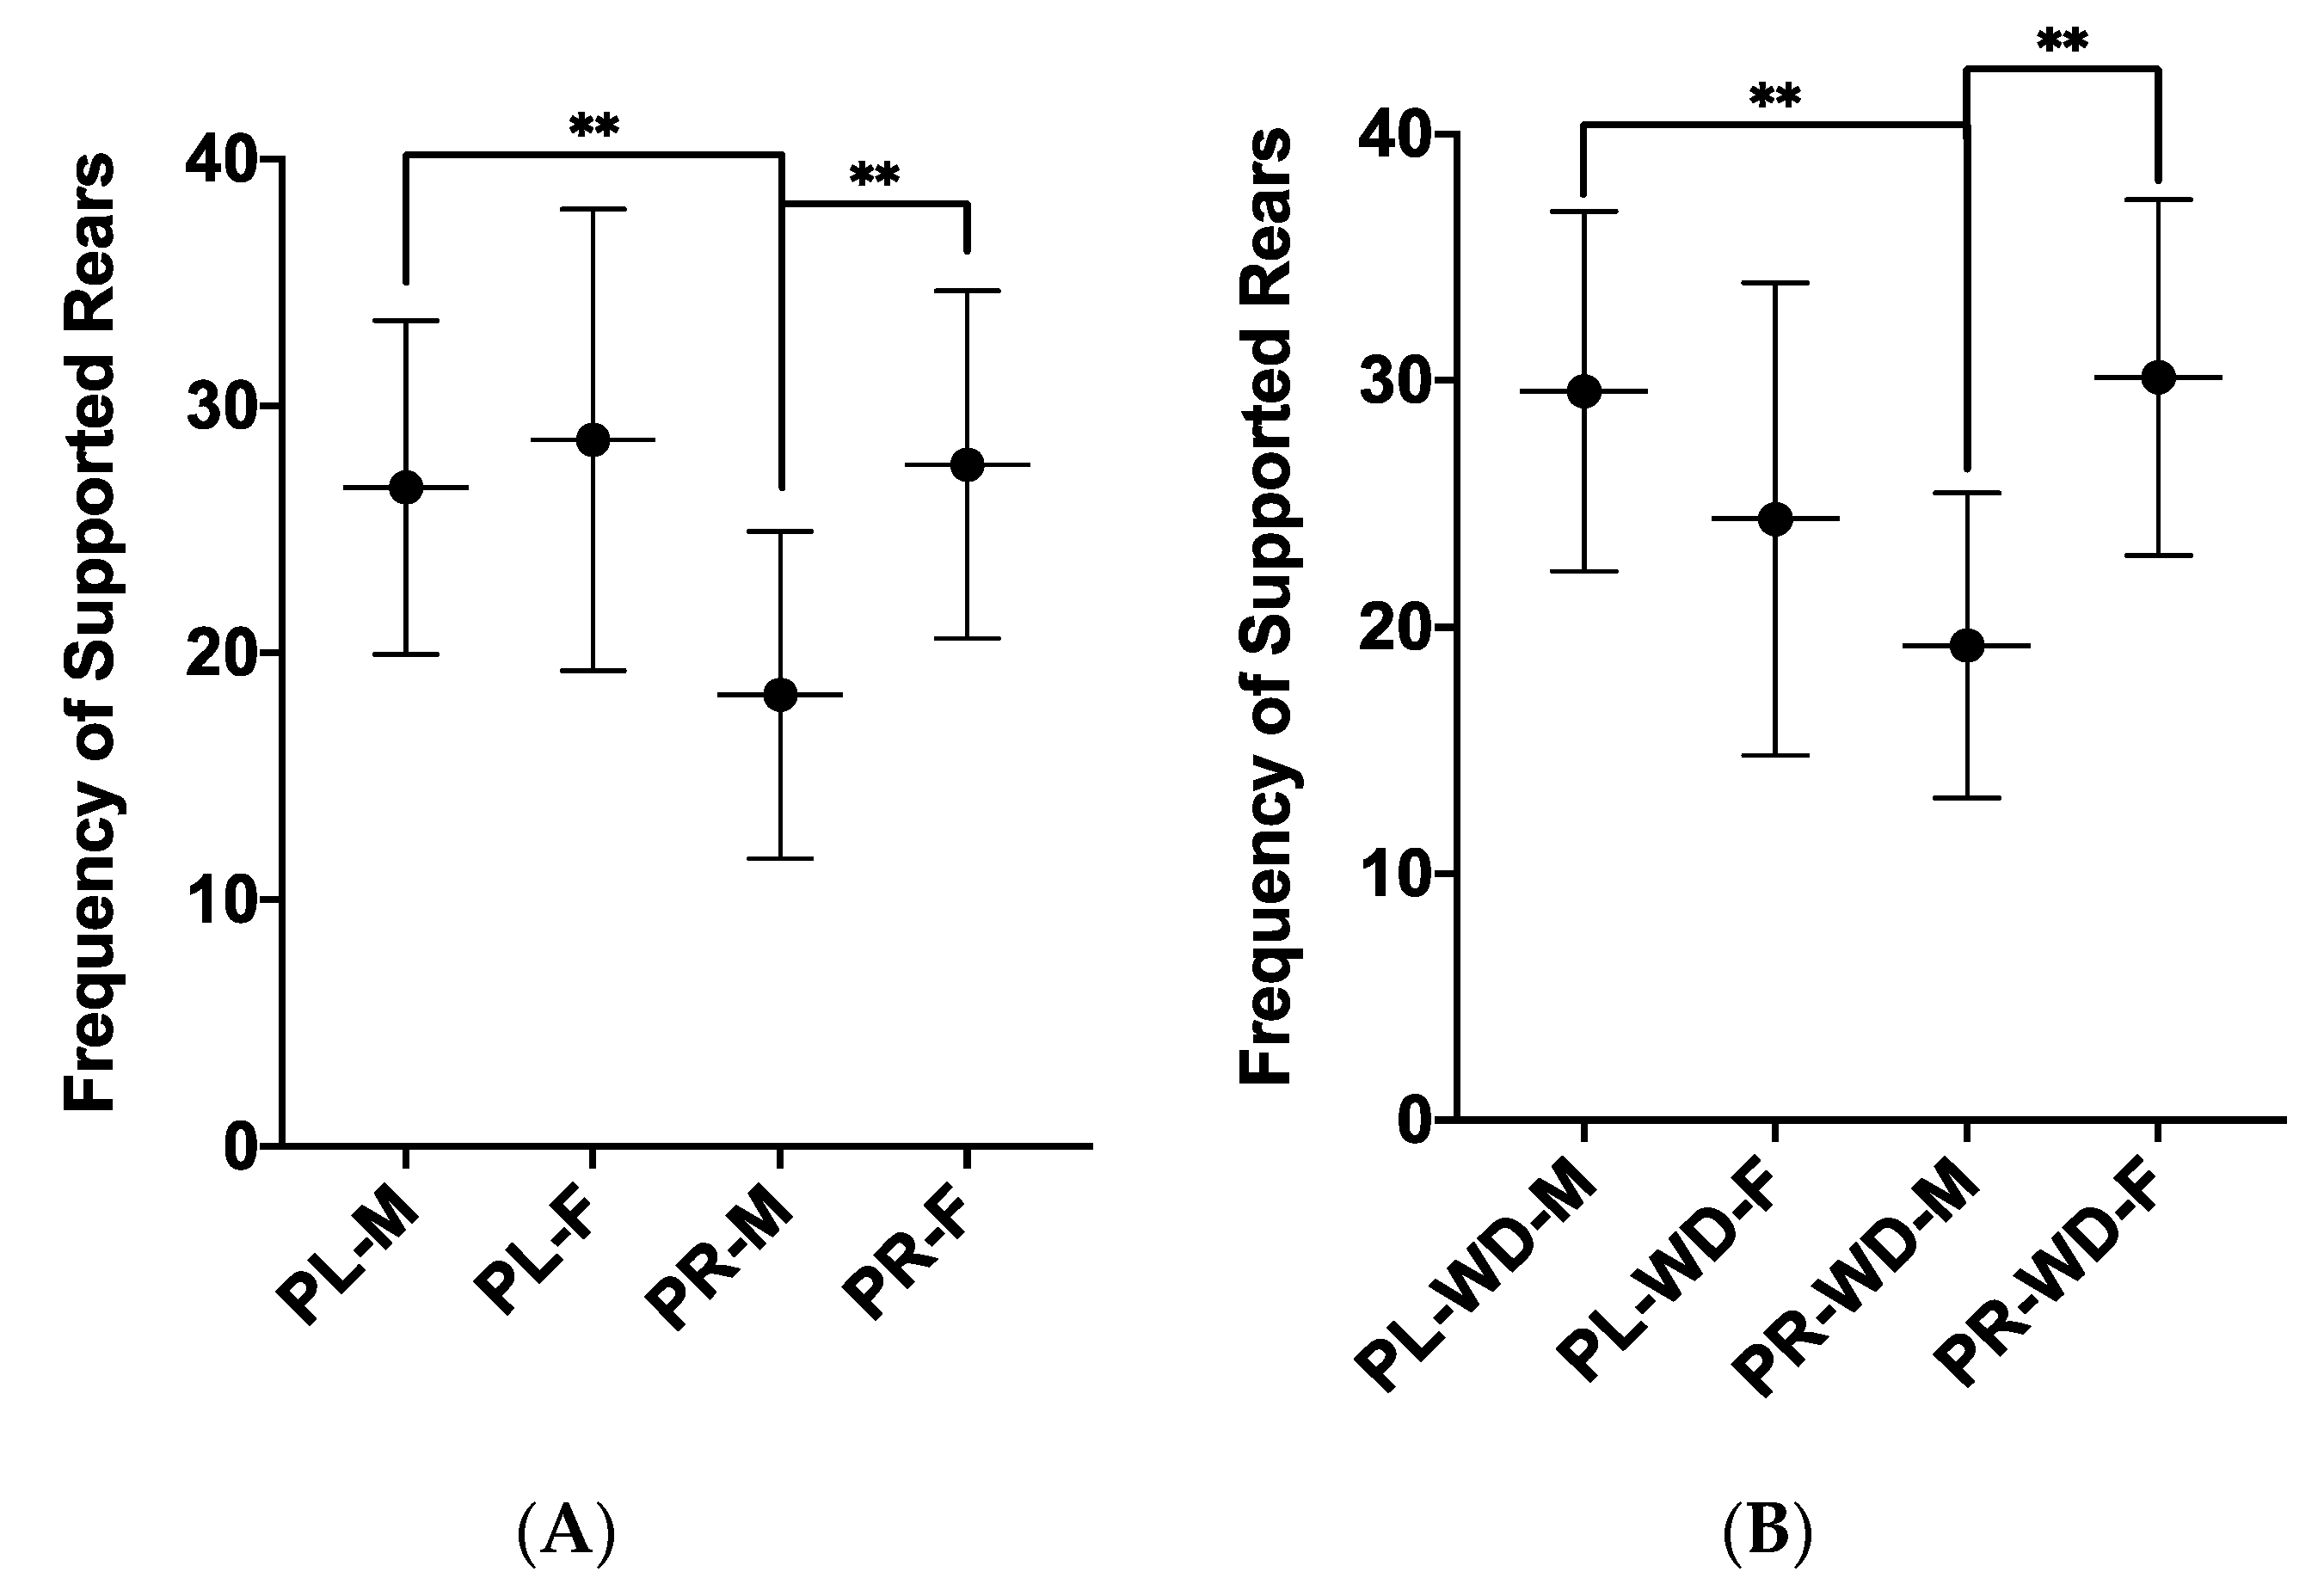
3.1. Anxiety-Like Behaviours

A series of treatment by diet by sex factorial ANOVAs were conducted to analyse the six behavioural variables recorded from the OFT. Overall, there were no main effects of diet on any of these behavioural measures, but there were specific main effects of treatment and sex. First, for total rearing, a main effect of treatment was found (p = 0.002), in that placebo rats reared more overall compared to probiotic rats (Table 2). Specifically, there was a main effect of treatment for supported rearing (p < 0.001), whereby placebo rats performed more supported rears than probiotic rats (Table 2). No main effects of treatment were found for line crosses, unsupported rearing, time in centre, or latency from centre. Next, a main effect of sex was found for line crosses (p < 0.001), in that females crossed more lines than males (Table 2). Two main effects of sex were found for total rearing, in that females showed more overall rearing (p = 0.046) and supported rearing (p = 0.041) than males (Table 2). No sex differences were found for unsupported rearing, time in centre, or latency from centre.
Another series of treatment by diet by sex factorial ANOVAs were conducted to analyse the seven behavioural variables recorded from the LDB. Unsupported rearing in the LDB was not reported because the behaviour was too infrequently performed, but it is included in total rearing. Similar to OFT results, there were no main effects of diet on any of these behavioural measures, but there were main effects for treatment and sex, along with an interaction effect for the supported rearing behaviour. First, a main effect of treatment was found for supported rearing (p = 0.013), in that placebo rats engaged in more supported rears than probiotic rats and a main effect of treatment for transitions (p = 0.002) was found in that probiotic rats transitioned more between the light and dark compartments compared to placebo rats (Table 3). There were no main effects of treatment for line crosses, total rearing, time in light, or latency to light. Next, main effects of sex were found for line crosses (p < 0.001), supported rearing (p = 0.003), transitions (p < 0.001), and latency to light (p < 0.001), whereby females demonstrated more line crosses, more supported rearing, more transitions, and took less time to enter the light compartment of the LDB (Table 3). There were no main effects of sex for total rearing or time in light.
ANOVA analyses from LDB data revealed a treatment by sex interaction for supported rearing (F1, 54 = 4.10, p = 0.048, ηp2 = 0.070). Simple effects analyses showed that placebo males performed more supported rears compared to probiotic males (p = 0.002; Figure 3A). Furthermore, the probiotic females performed more supported rears than the probiotic males (p = 0.001; Figure 3A). A further treatment by diet by sex interaction was found for supported rearing (F1, 54 = 5.62, p = 0.021, ηp2 = 0.094), and simple effects analyses showed that placebo Western males performed more supported rears compared to probiotic Western males (p = 0.008; Figure 3B). As well, probiotic Western females performed more supported rears compared to probiotic Western males (p = 0.004; Figure 3B). With control diet females, those given the placebo reared more with support than those given the probiotic (p = 0.036), and with placebo females, those given the control diet reared more with support compared to those given the Western diet (p = 0.022). Additionally, females reared more than males in both placebo control animals (p = 0.019) and probiotic control animals (p = 0.036).

3.2. Metabolic Measures

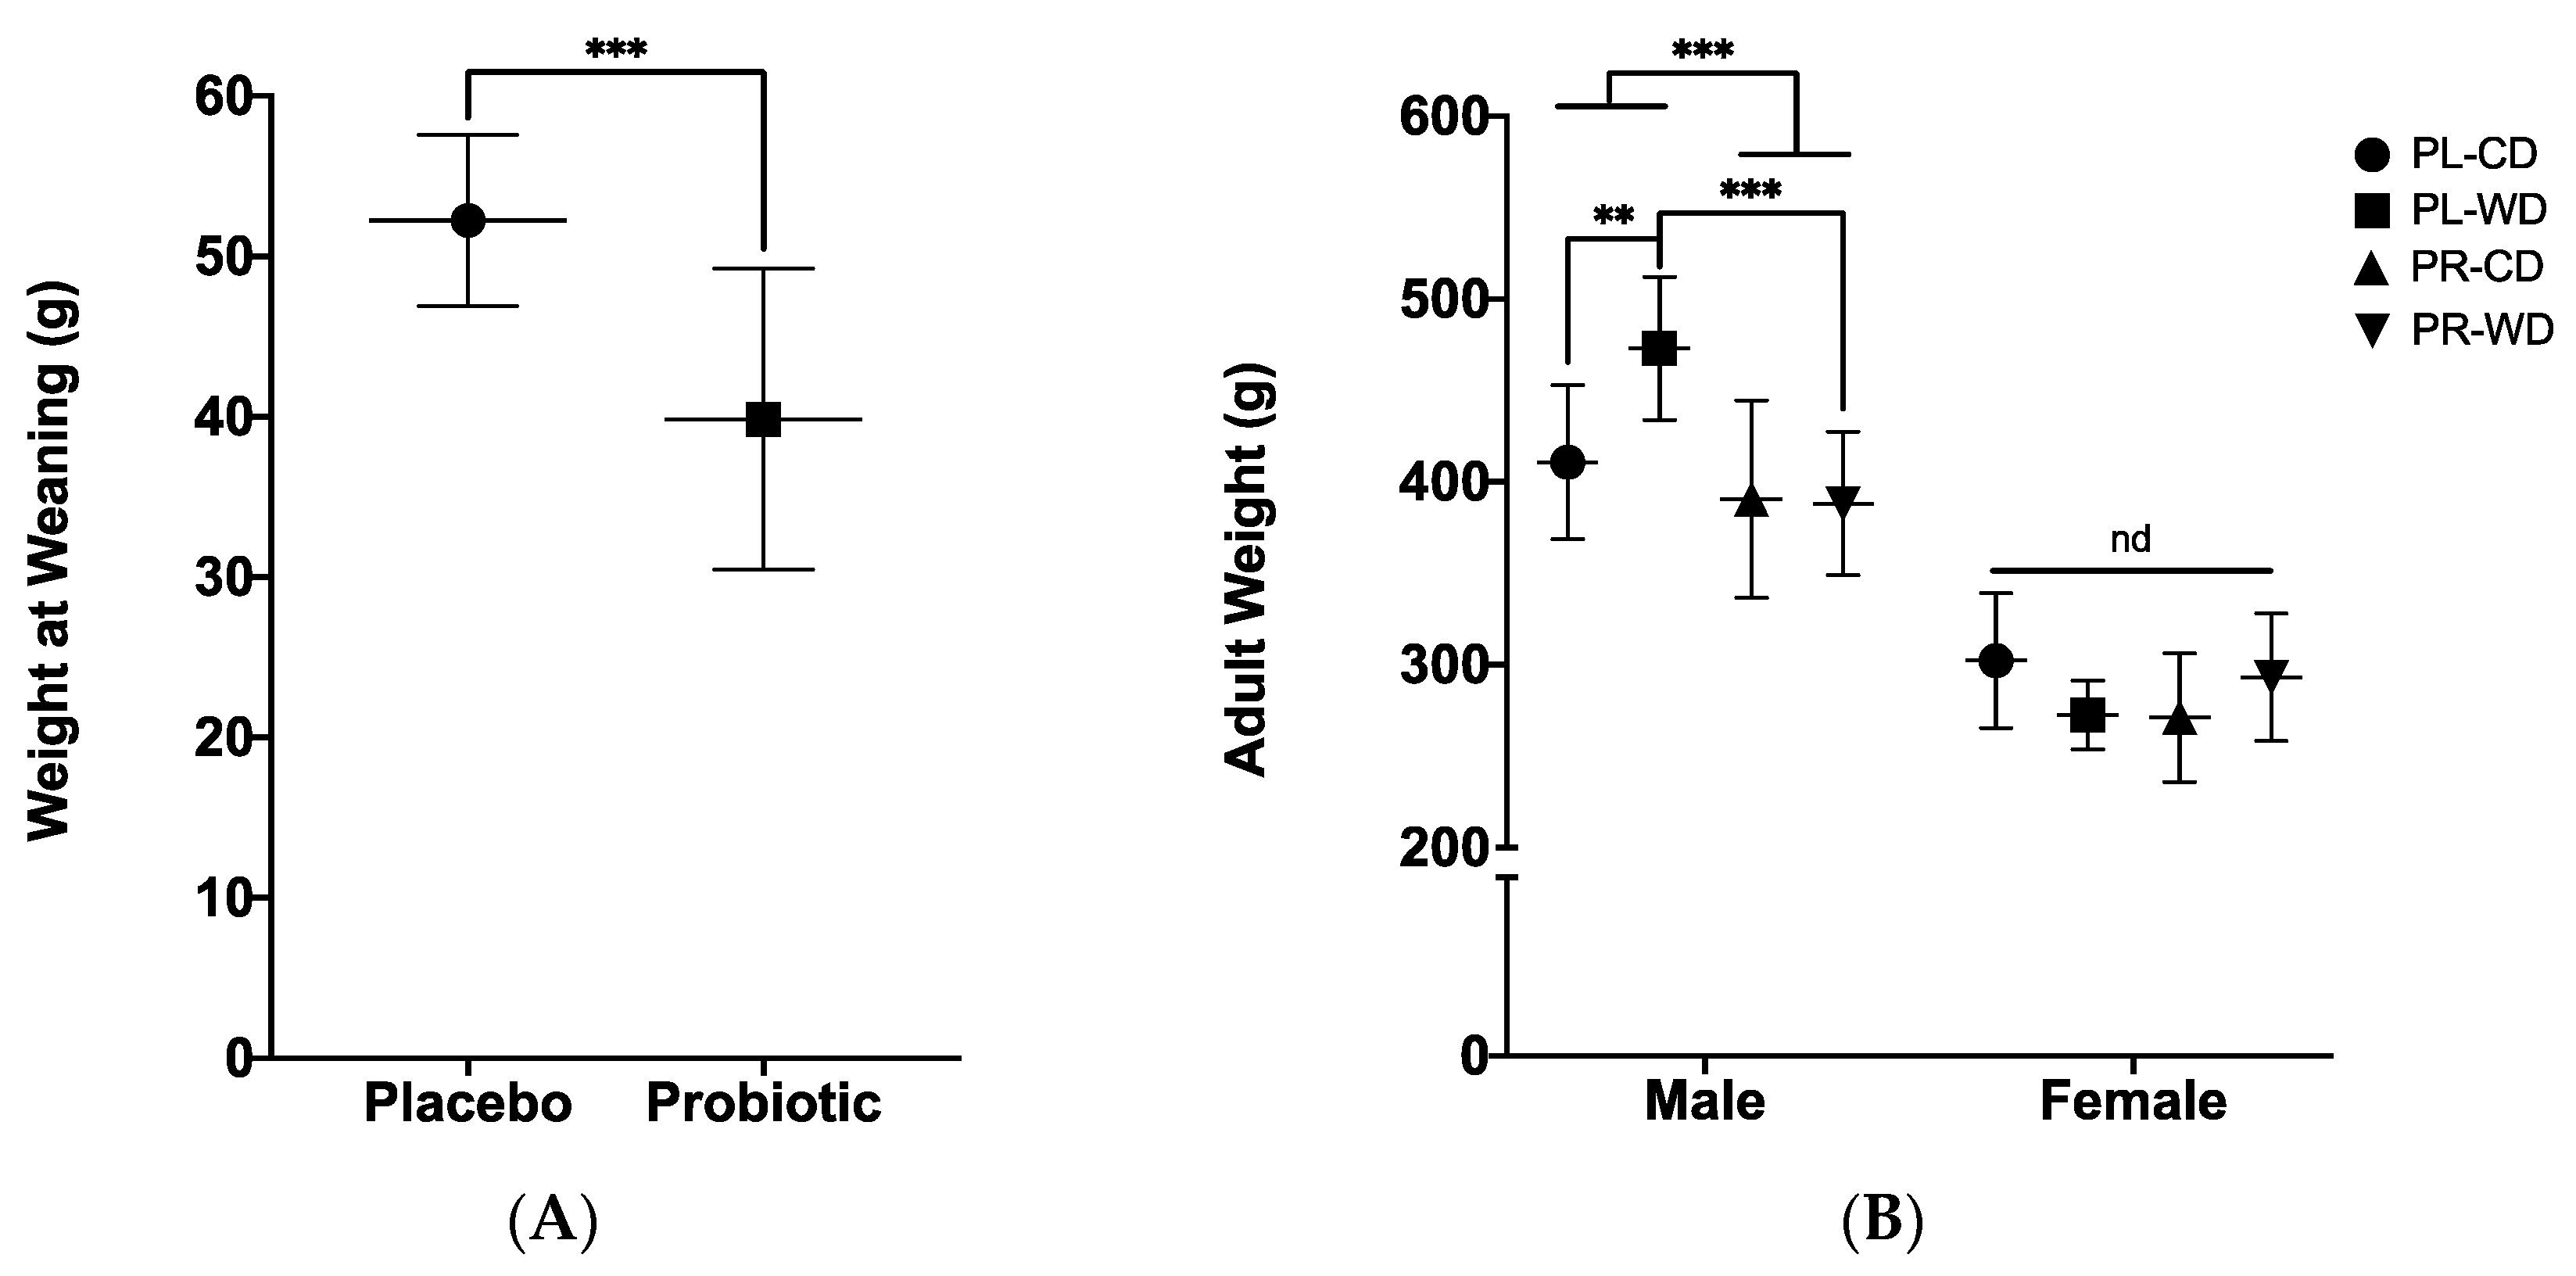
3.2.1. Wean and Adult Weights

A treatment by sex factorial ANOVA showed that wean weight was lower in offspring from mothers consuming probiotic during lactation (treatment main effect; F1, 58 = 40.36, p < 0.001, ηp 2 = 0.410; Figure 4A), with no difference in weight by sex found at weaning (p = 0.196). At birth, this difference was not apparent, with pups live-born to placebo-treated dams (M = 6.25, SD = 0.48, n = 33) having similar average weight to pups live-born to probiotic-treated dams (M = 6.26, SD = 0.51, n = 46). A treatment by diet by sex factorial ANOVA on adult weight found a main effect of sex (F1, 54 = 178.10, p < 0.001, ηp2 = 0.767), in that males (M = 413.95, SD = 54.24) weighed more than females (M = 284.82, SD = 33.54). Furthermore, similar to wean weight, there was a main effect of treatment (F1, 54 = 8.66, p = 0.005, ηp2 = 0.138), in that placebo rats (M = 359.54, SD = 88.55) had increased adult weight compared to probiotic rats (M = 335.83, SD = 67.75).
From the treatment by diet by sex factorial ANOVA on adult weight, a sex by treatment interaction was found (F1, 54 = 5.83, p = 0.019, ηp2 = 0.097). Simple effects analyses showed that males in the placebo group weighed more in adulthood compared to males in the probiotic group (p < 0.001; Figure 4B), whereas no difference by treatment or diet was seen with female rats. A sex by diet by treatment interaction was also found (F1, 54 = 8.85, p = 0.004, ηp2 = 0.141), where male rats in the Western diet condition weighed more in the placebo group than in the probiotic group (p < 0.001; Figure 4B). Furthermore, analyses of this three-way interaction showed that of males in the placebo group, those in the Western diet condition weighed more than males in the control diet condition (p = 0.004; Figure 4B).

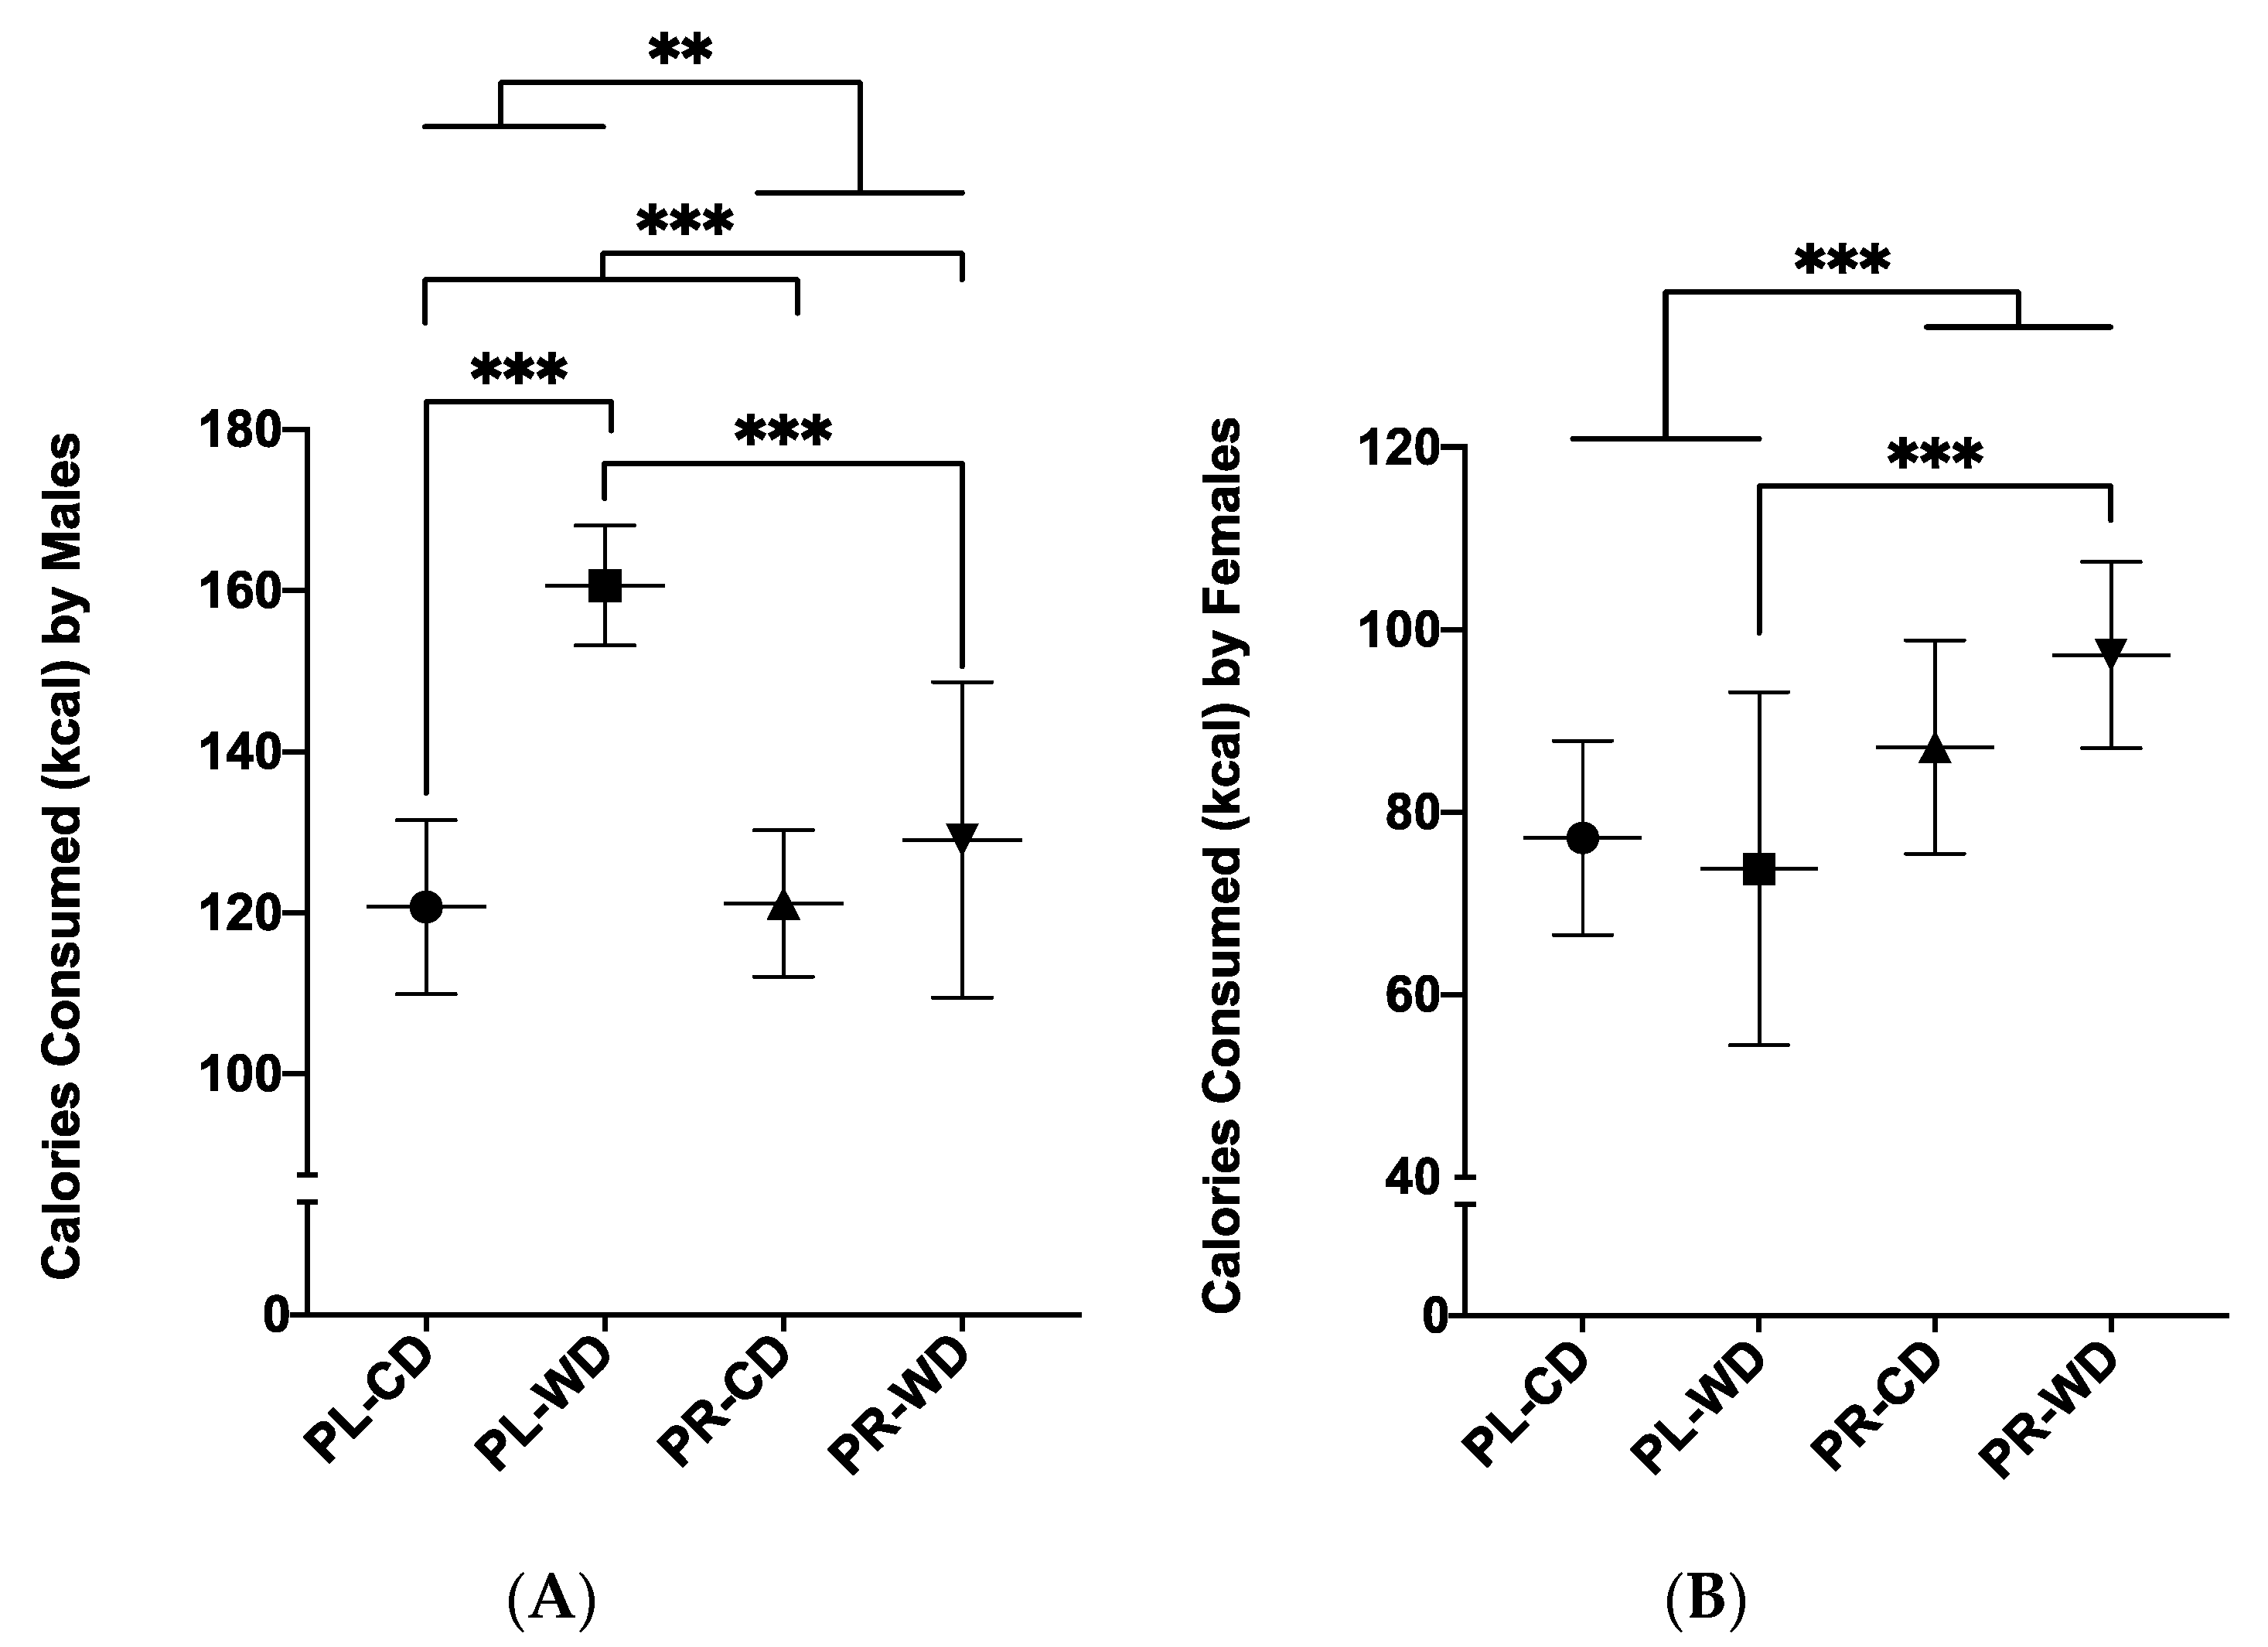
3.2.2. Average Daily Calorie Intake

Food intake was measured as average amount of calories consumed, calculated from grams of food eaten (see Section 2.4 above). It is noteworthy that adult weight was positively correlated with daily calorie intake (rs = 0.87, p < 0.001, N = 62). A treatment by diet by sex factorial ANOVA revealed a main effect of diet (F1, 54 = 16.47, p < 0.001, ηp2 = 0.234), with Western diet animals (M = 113.72, SD = 35.87) consuming more calories compared to control diet animals (M = 100.94, SD = 22.42). There was also a main effect of sex (F1, 54 = 213.53, p < 0.001, ηp2 = 0.798), in that males (M = 132.38, SD = 20.29) had increased calorie intake compared to females (M = 83.84, SD = 15.85).
ANOVA further revealed treatment by sex (F1, 54 = 23.08, p < 0.001, ηp2 = 0.299) and diet by sex (F1, 54 = 9.37, p = 0.003, ηp2 = 0.148) interactions for average daily calories consumed. Upon analysis of the treatment by sex interaction, it was first found that males in the placebo group consumed more daily calories compared to males in the probiotic group (p = 0.002; Figure 5A). On the contrary, probiotic females consumed more calories compared to placebo females (p < 0.001; Figure 5B). Analysis of the two-way diet by sex interaction also showed that in males only, animals given the Western diet consumed more calories compared to control diet animals (p < 0.001; Figure 5A).
A treatment by diet by sex interaction was found for daily calories consumed (F1, 54 = 11.44, p = 0.001, ηp2 = 0.175) and simple effects analyses showed that in Western-diet-exposed males, placebo-treated animals consumed more calories compared to probiotic-treated animals (p < 0.001, Figure 5A). Additionally, within placebo-exposed males, Western diet rats consumed more calories than control diet rats (p < 0.001, Figure 5A). In females given the Western diet, probiotic animals consumed more calories compared to placebo animals (p < 0.001; Figure 5B).

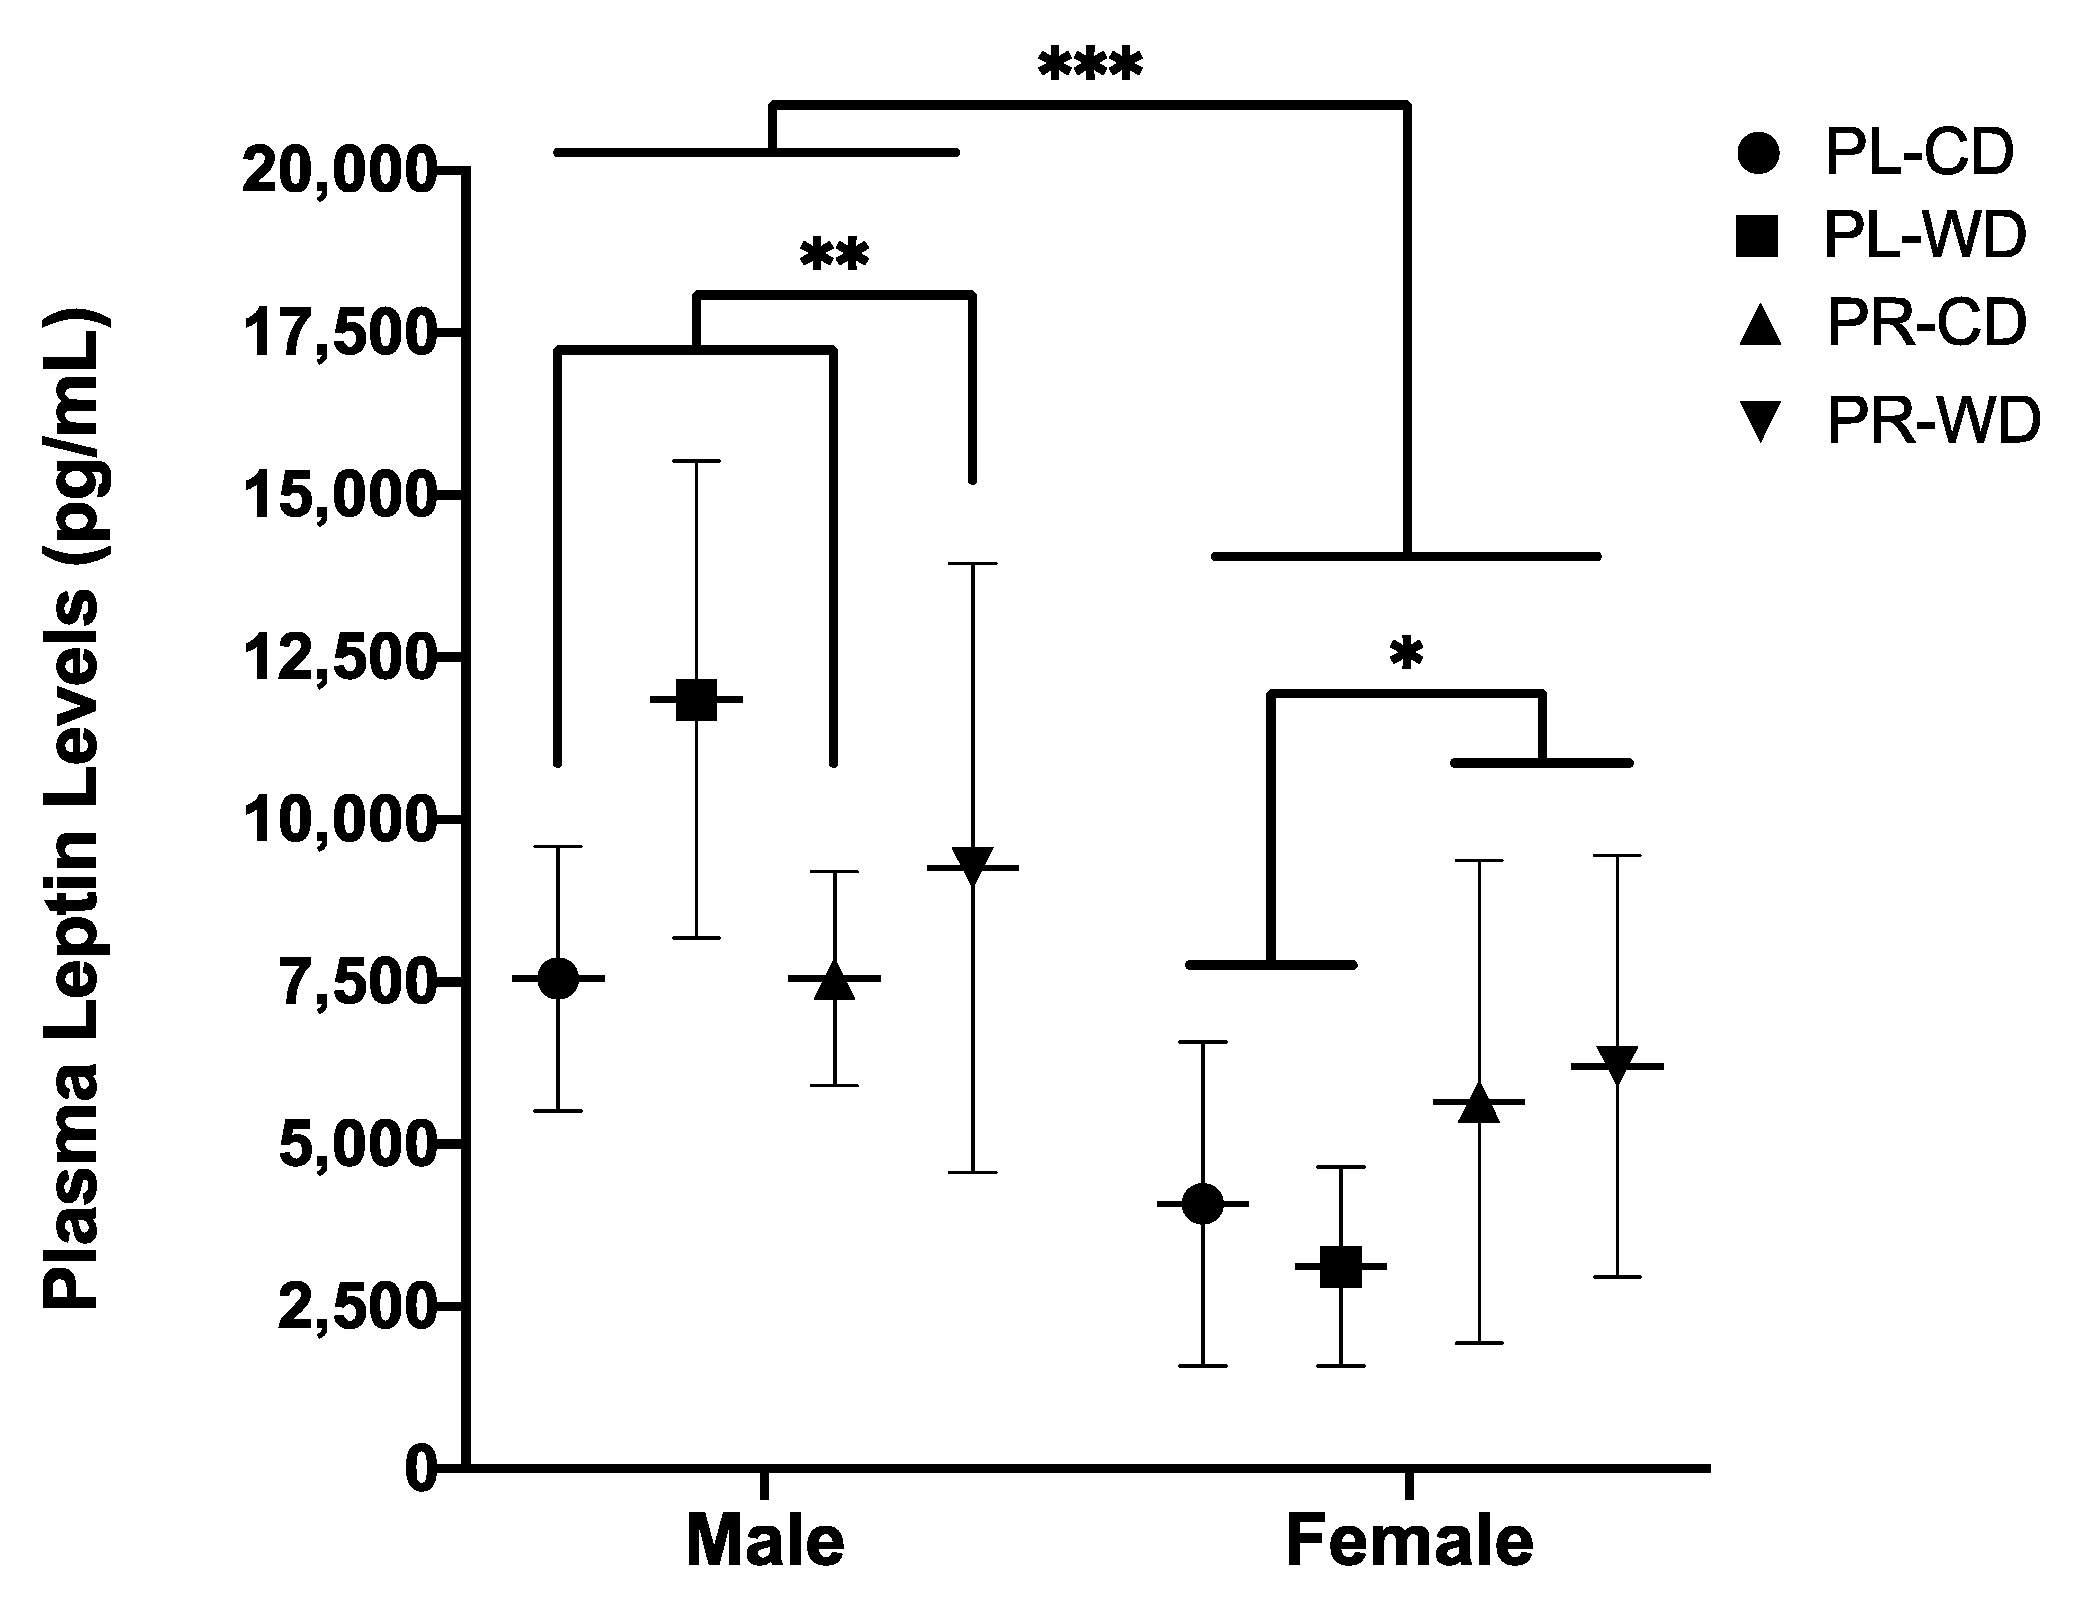
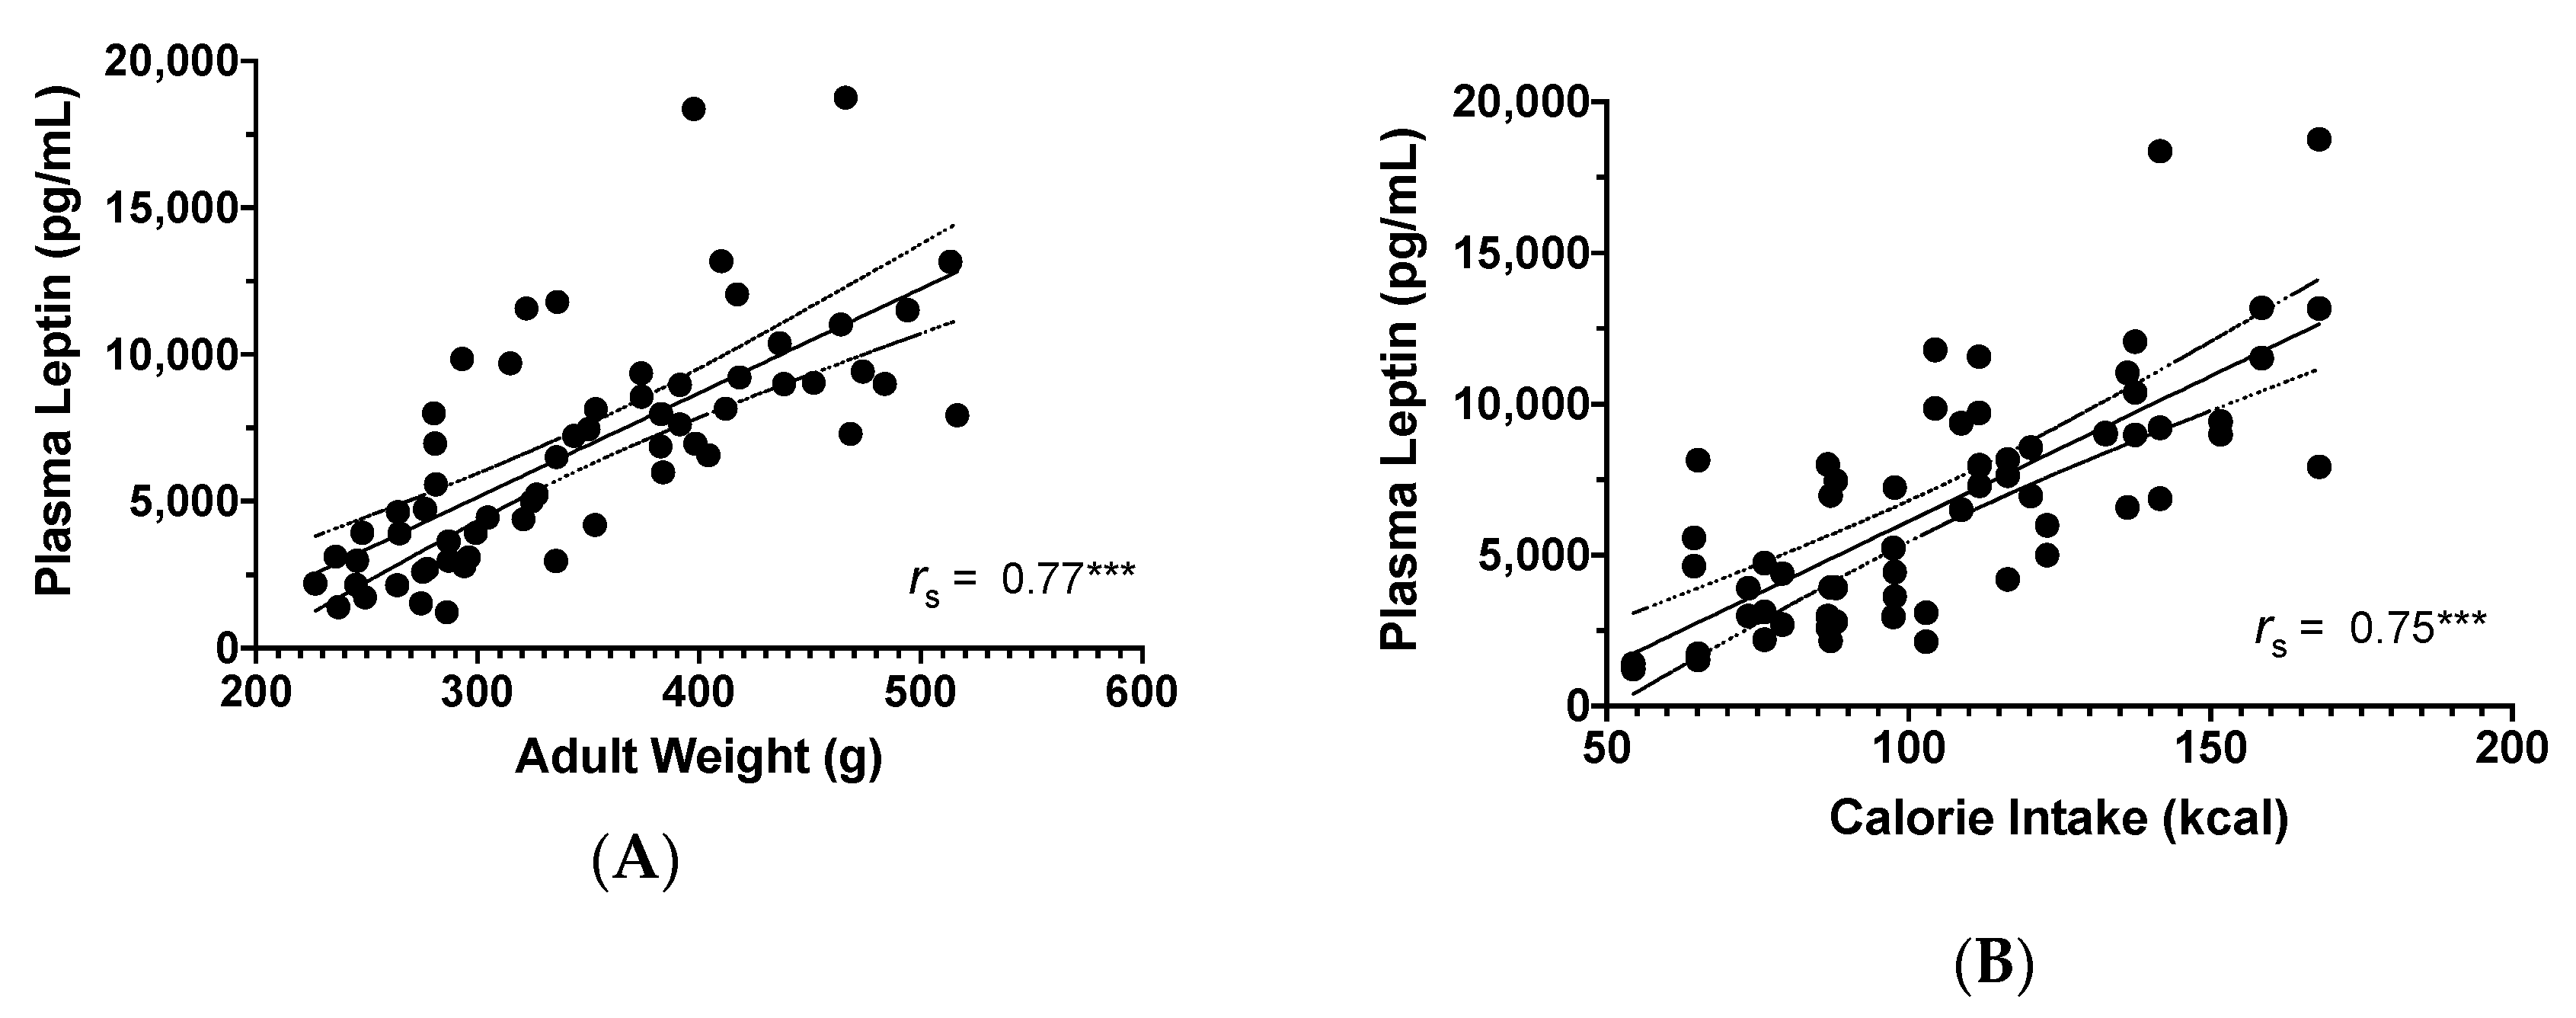
3.2.3. Plasma Leptin

For leptin concentration in plasma, while the treatment by diet by sex factorial ANOVA did not reveal main effects of treatment or diet, there was a main effect of sex (F1, 54 = 30.11, p < 0.001, ηp2 = 0.358), in that males (M = 9009.57, SD = 3560.35) had higher leptin levels at sacrifice compared to females (M = 4764.66, SD = 3000.57). Furthermore, there were treatment by sex (F1, 54 = 5.39, p = 0.024, ηp2 = 0.091) and diet by sex (F1, 54 = 4.23, p = 0.045, ηp2 = 0.073) interactions found. Simple effects analyses revealed that probiotic females had higher leptin levels than placebo females (p = 0.036; Figure 6). Simple effects analyses further revealed that males in the Western diet group had higher leptin levels than males in the control diet group (p = 0.010; Figure 6).
Plasma leptin levels were positively correlated with adult weight (rs = 0.77, p < 0.001, N = 62; Figure 7A) and daily calorie intake (rs = 0.75, p < 0.001, N = 62; Figure 7B).

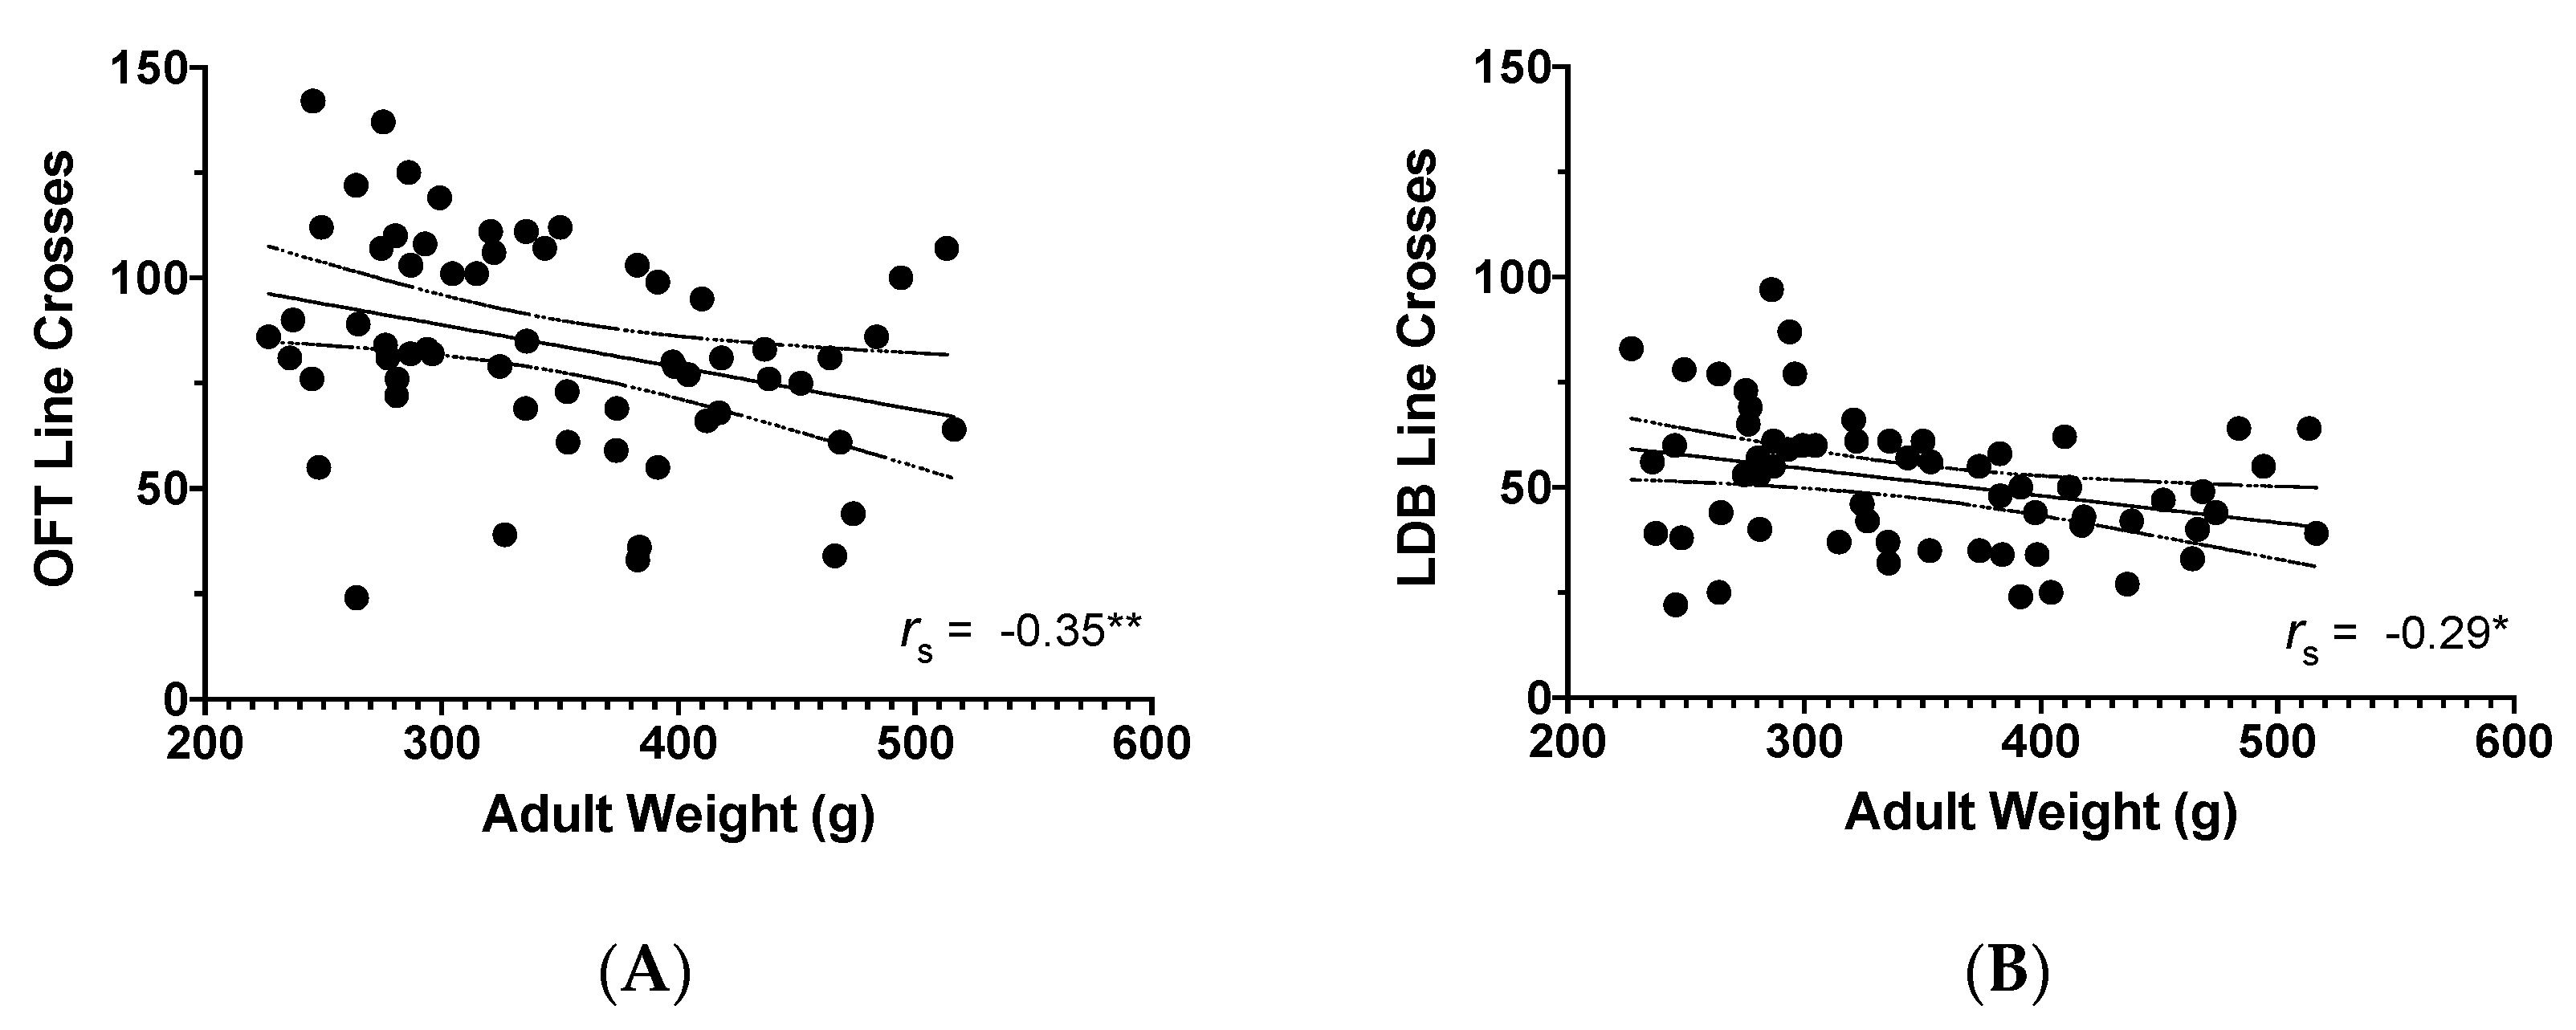
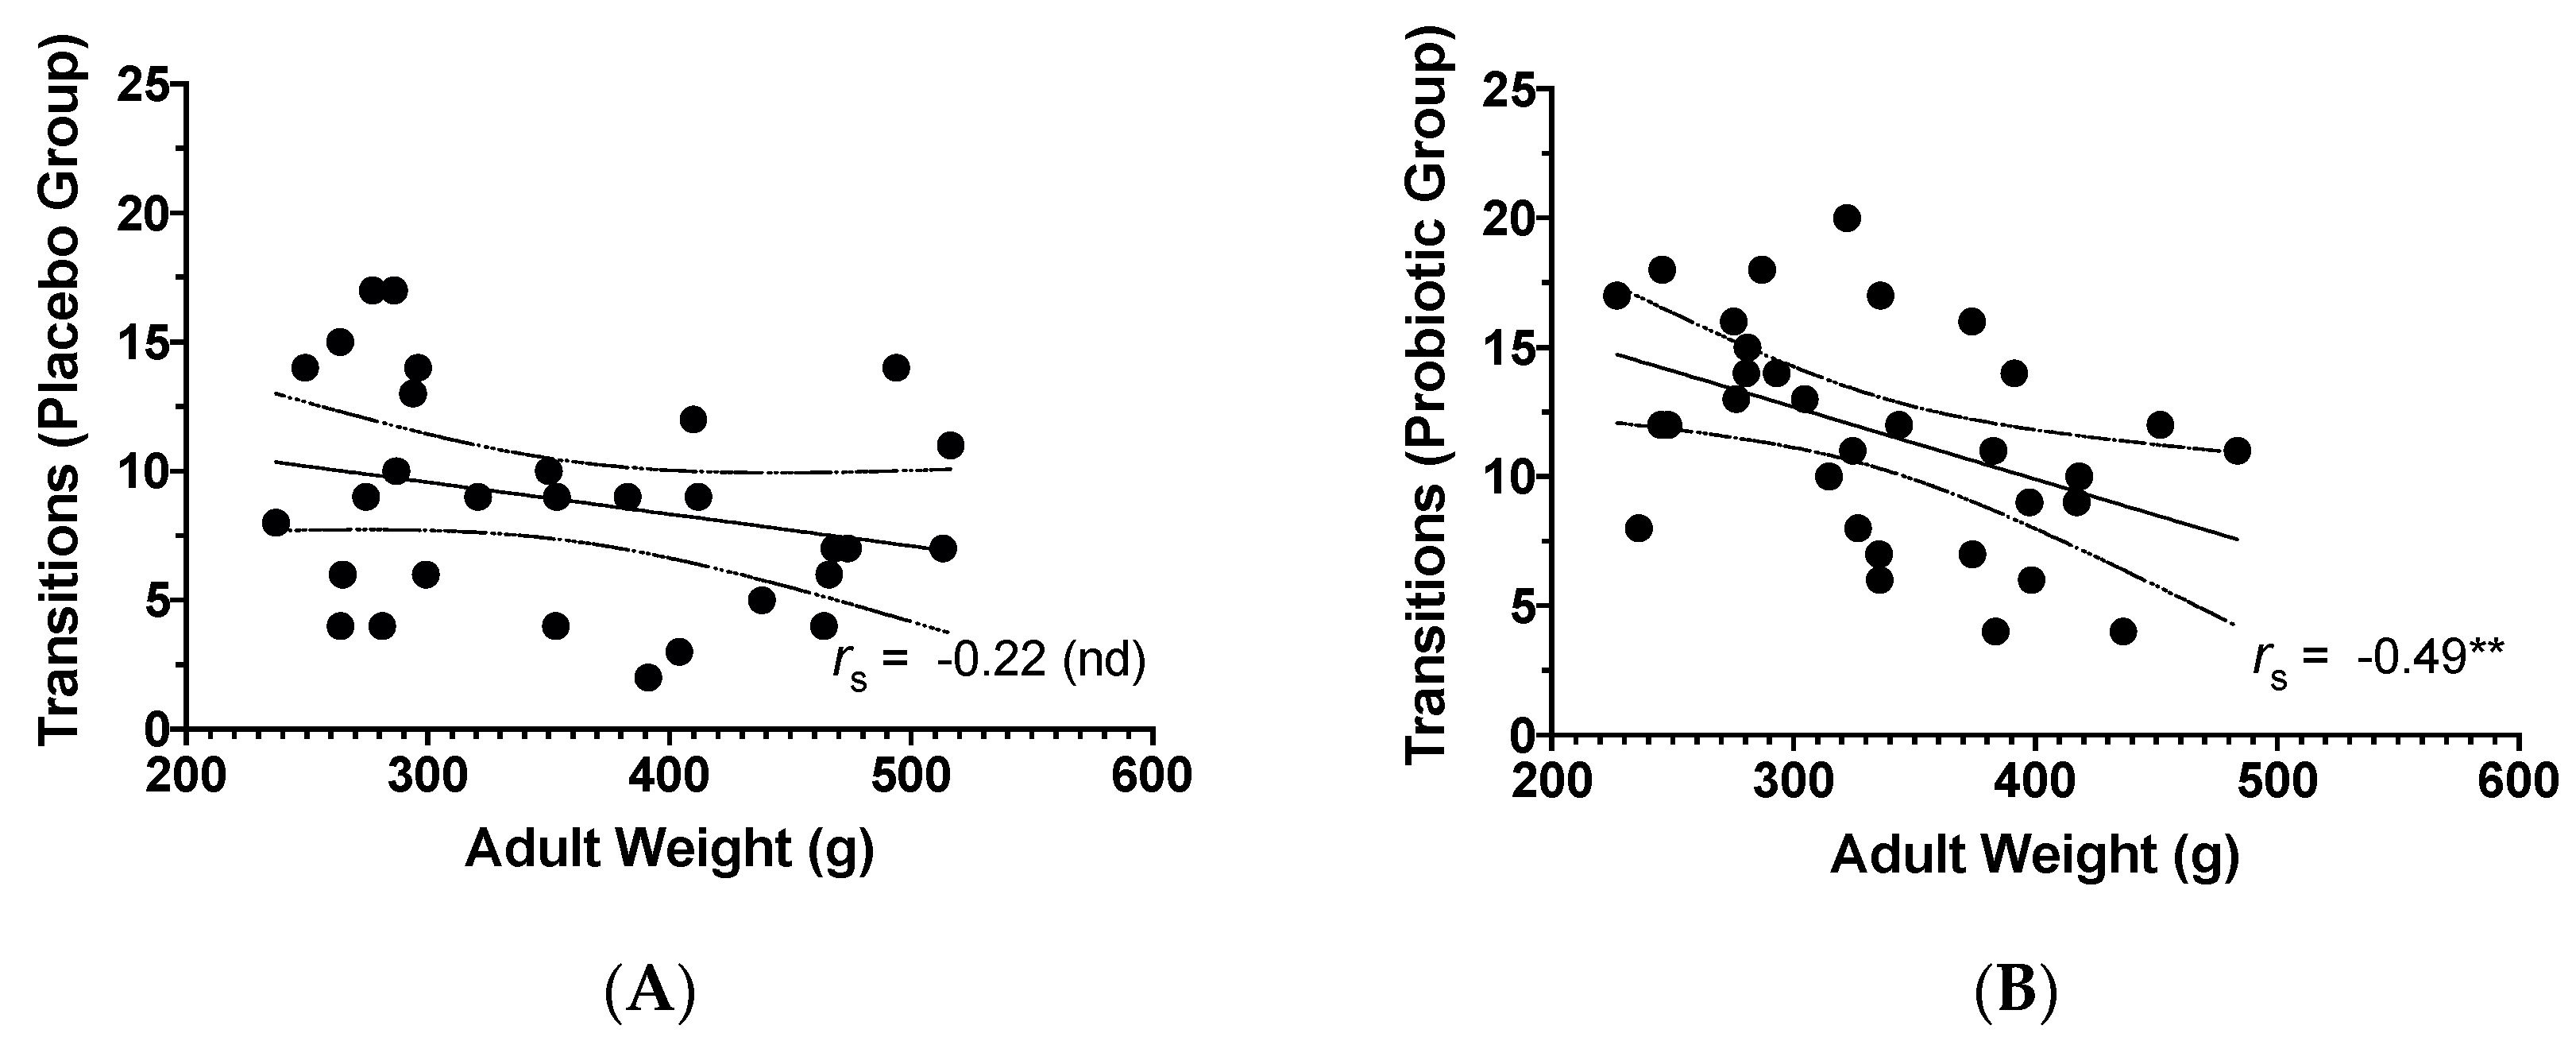
3.3. Adult Weight and Behavioural Findings

Overall, lower adult weight was related to more locomotion (line crosses) in the OFT (rs = −0.35, p = 0.006, N = 62; Figure 8A). Adult weight was not correlated with any other measured variables in the OFT. Examining the correlations by treatment revealed a negative correlation between OFT line crosses and adult weight in placebo animals (rs = −0.39, p = 0.031, n = 30), but not in probiotic animals (rs = −0.25, p = 0.177, n = 32). Weight and line crosses were not correlated in males only (rs = 0.12, p = 0.525, n = 30) or in females only (rs = 0.11, p = 0.541, n = 32).
Due to main effects and interaction effects of treatment, diet, and sex on adult weight, along with correlations between weight and certain behaviours, a series of ANCOVAs on all dependent behavioural variables in the OFT were conducted. The main effects of treatment for total rearing (F1, 53 = 8.53, p = 0.005, ηp2 = 0.139) and supported rearing (F1, 53 = 12.73, p < 0.001, ηp2 = 0.197) remained, with placebo-treated rats rearing more overall and performing more supported rears than probiotic-treated rats. Females still performed more line crosses than males (sex main effect; F1, 53 = 7.32, p = 0.009, ηp2 = 0.121), but females no longer performed more total rears (F1, 53 = 1.84, p = 0.180, ηp2 = 0.034) or supported rears compared to males (F1, 53 = 2.85, p = 0.098, ηp2 = 0.052). When controlling for adult weight, two main effects of sex appeared for time in centre (F1, 51 = 4.74, p = 0.034, ηp2 = 0.085) and latency from centre (F1, 51 = 4.63, p = 0.036, ηp2 = 0.083). Specifically, males (M = 12.64, SD = 13.62) took longer to leave the centre compared to females (M = 10.91, SD = 14.58) and males (M = 27.73, SD = 19.50) spent more time in the centre compared to females (M = 24.67, SD = 13.61).
In the LDB, similar to the OFT, there was a negative correlation between line crosses and adult weight (rs = −0.29, p = 0.020, N = 62; Figure 8B) that was no longer present when examining the correlations by treatment group or by sex. Transitions in the LDB were higher in animals that weighed less (rs = −0.38, p = 0.002, N = 62). The negative correlation between transitions and adult weight was not present when only examining placebo animals (rs = −0.22, p = 0.243, n = 30; Figure 9A) or by examining results by sex, but was present with probiotic animals (rs = −0.49, p = 0.005, n = 32; Figure 9B). As well, overall, heavier animals in adulthood took longer to enter the light area (rs = 0.43, p < 0.001, n = 61). There was no correlation between latency to light and weight in placebo rats only (rs = 0.37, p = 0.052, n = 29) or by examining results by sex, but there was a positive relationship in probiotic rats (rs = 0.48, p = 0.006, n = 32). There were no other correlations for the remaining LDB behaviours and weight found, but upon examining all variables broken down by sex, a positive association was found in males between supported rearing and adult weight (rs = 0.52, p = 0.003, n = 30), showing that more supported rears were related to higher weight in males only.
ANCOVAs were also conducted for all LDB behavioural measures to examine differences in these behaviours after controlling for adult weight. Results showed that there was no longer a main effect of treatment on supported rearing (F1, 53 = 3.72, p = 0.059, ηp2 = 0.066), but the main effect of treatment on transitions remained (F1, 53 = 9.90, p = 0.003, ηp2 = 0.157), with probiotic rats transitioning more than placebo rats. Females still performed more line crosses (F1, 53 = 8.19, p = 0.006, ηp2 = 0.134), along with more supported rears (F1, 53 = 6.73, p = 0.012, ηp2 = 0.113) and transitions (F1, 53 = 7.01, p = 0.011, ηp2 = 0.117). There was no longer a difference between males and females for latency to light (F1, 52 = 3.51, p = 0.066, ηp2 = 0.063), no longer a two-way treatment by sex interaction for supported rearing (F1, 53 = 2.37, p = 0.130, ηp2 = 0.043), or a three-way interaction for supported rearing (F1, 53 = 3.01, p = 0.089, ηp2 = 0.054) after controlling for adult weight.

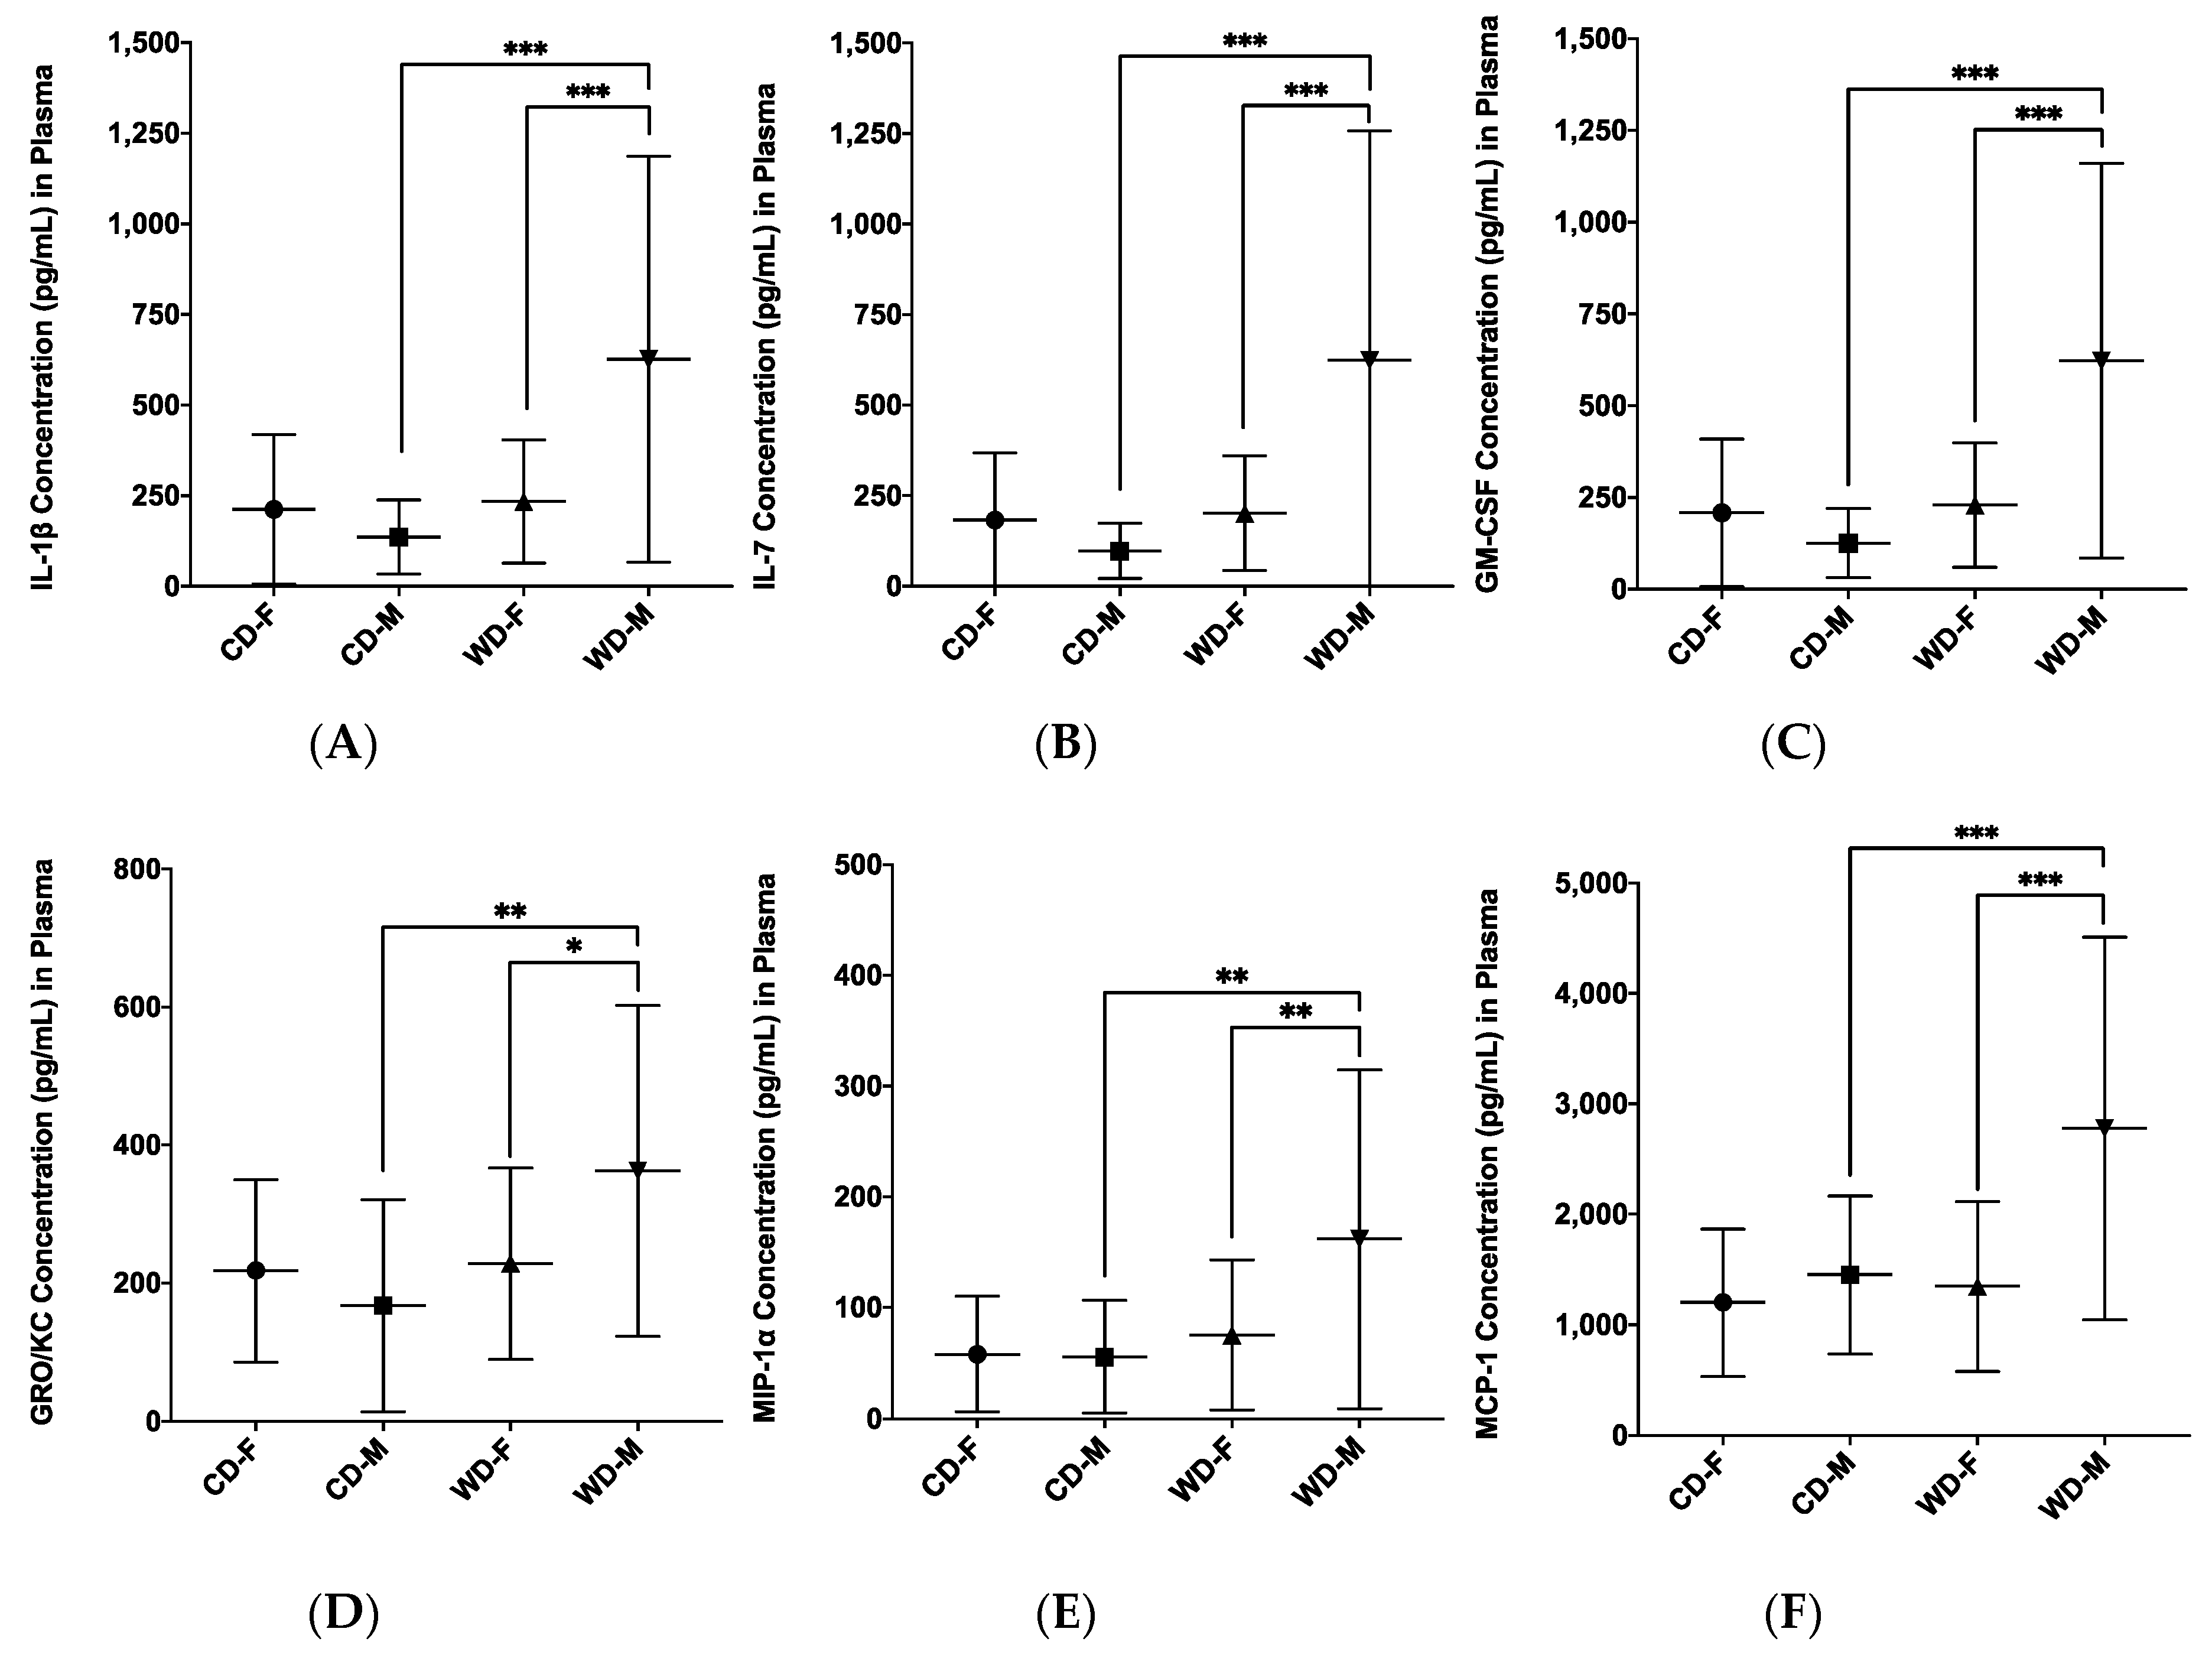
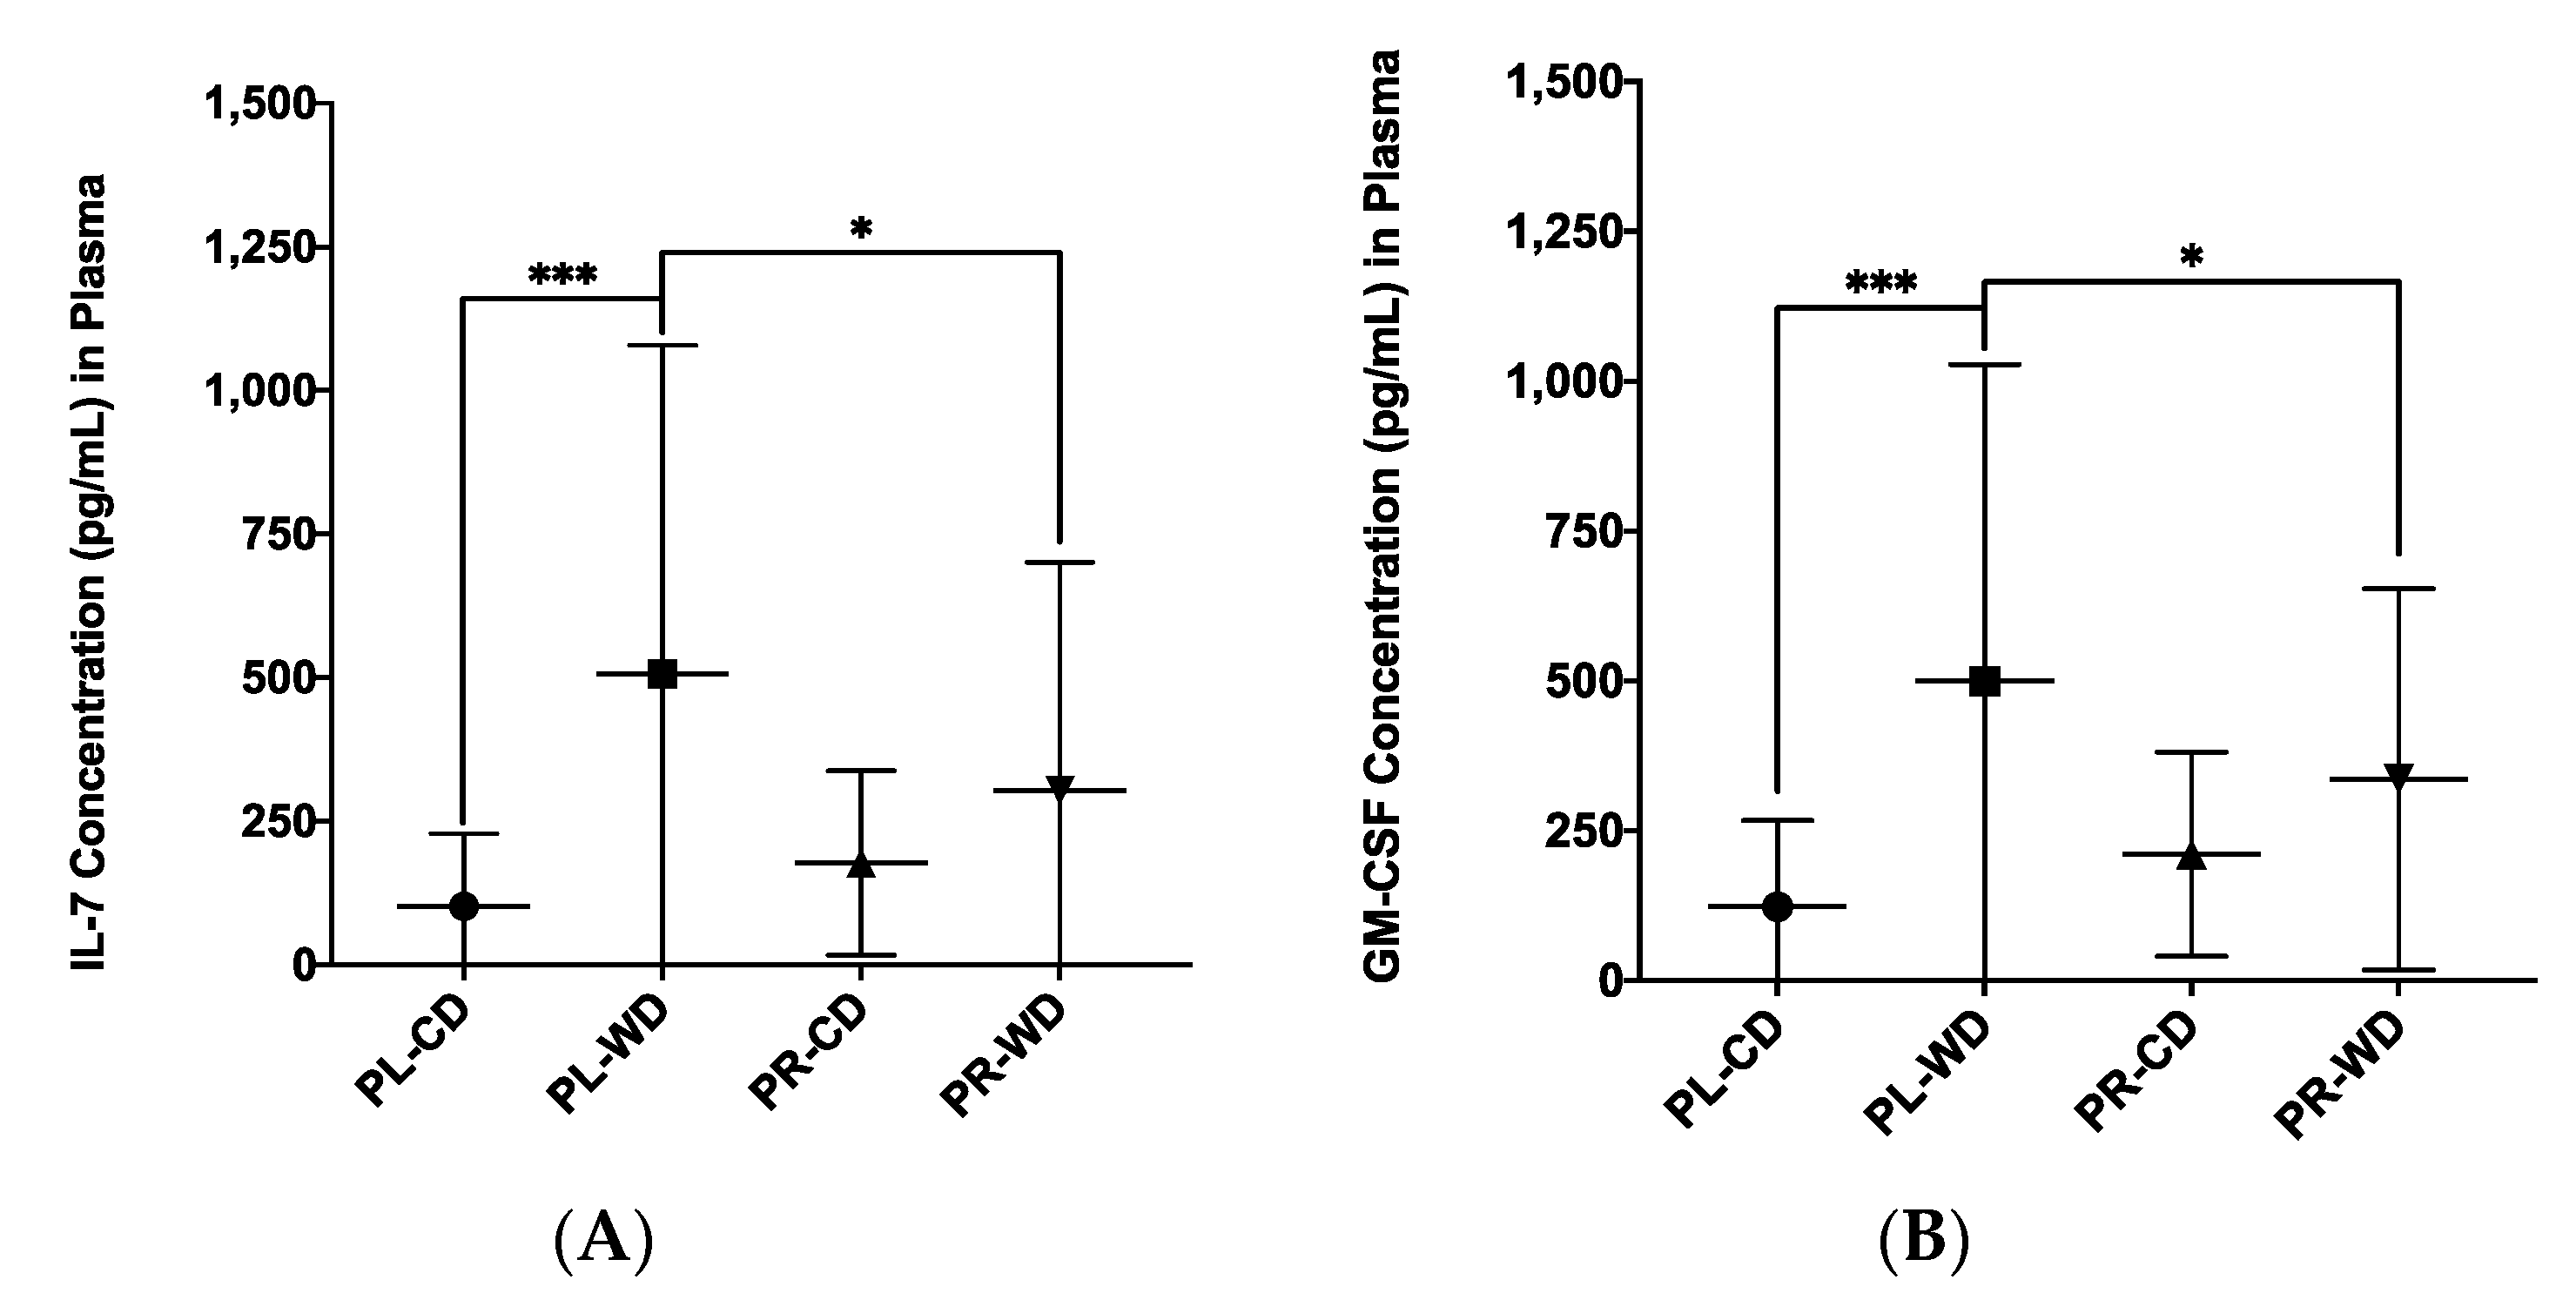
3.4. Plasma Inflammatory Analytes

Using multiplex technology, we analysed plasma samples from rats exposed to predator odour stress for the inflammatory analytes previously outlined in Section 2.7. The following 10 analytes were not consistently measured by the Bio-Plex Pro™ Rat Cytokine 23-Plex in rat plasma, and were thus excluded from analyses: IL-2, IL-4, IL-5, IL-6, IL-12p70, IL-13, IL-17A, IFN-γ, G-CSF, and TNF-α. The remaining 13 analytes that were deemed measurable included IL-1α (pro-inflammatory) [52,53,54], IL-1β (pro-inflammatory) [52,53,54,55], IL-7 (anti-inflammatory) [56], IL-10 (anti-inflammatory) [53,54,56,57,58], IL-18 (pro-inflammatory) [52,53,56], GM-CSF (pro-inflammatory) [53,59], GRO/KC (pro-inflammatory) [52], M-CSF (regulatory) [59], MIP-1α (anti-inflammatory) [56], MIP-3α (regulatory) [60], RANTES (pro-inflammatory) [52,53], VEGF (pro-inflammatory) [52], and MCP-1 (pro-inflammatory) [53,57].
ANOVA revealed that animals given the probiotic were higher in IL-1α (p = 0.022), IL-10 (p = 0.004), M-CSF (p < 0.001), and MIP-3α (p < 0.001; Table 4). ANOVA further revealed that the Western diet group was higher in IL-1β (p = 0.001), IL-7 (p < 0.001), GM-CSF (p < 0.001), GRO/KC (p = 0.018), MIP-1α (p = 0.006), VEGF (p = 0.019), and MCP-1 (p = 0.006; Table 5). By sex, males were higher in IL-1β (p = 0.037), IL-7 (p = 0.027), GM-CSF (p = 0.022), and MCP-1 (p = 0.003; Table 6). Overall, there were no main effects or interactions by treatment, diet, or sex for plasma levels of IL-18 and RANTES.
Diet by sex interactions were found (Figure 10) for IL-1β (F1, 53 = 10.13, p = 0.002, ηp2 = 0.161), IL-7 (F1, 53 = 11.29, p = 0.001, ηp2 = 0.176), GM-CSF (F1, 53 = 12.83, p < 0.001, ηp2 = 0.195), GRO/KC (F1, 53 = 4.88, p = 0.031, ηp2 = 0.084), MIP-1α (F1, 53 = 4.32, p = 0.042, ηp2 = 0.075), and MCP-1 (F1, 53 = 5.28, p = 0.026, ηp2 = 0.091). All diet by sex interactions were analysed post hoc by simple effects analyses, and two patterns again emerged. First, compared to male control rats, male Western diet rats were higher in IL-1β (p < 0.001), IL-7 (p < 0.001), GM-CSF (p < 0.001), GRO/KC (p = 0.002), MIP-1α (p = 0.001), and MCP-1 (p < 0.001). Second, compared to Western diet females, Western diet males were higher in IL-1β (p < 0.001), IL-7 (p < 0.001), GM-CSF (p < 0.001), GRO/KC (p = 0.032), MIP-1α (p = 0.007), and MCP-1 (p < 0.001).
Two treatment by diet interactions were found (Figure 11) for IL-7 (F1, 53 = 4.17, p = 0.046, ηp2 = 0.073) and GM-CSF (F1, 53 = 4.48, p = 0.039, ηp2 = 0.078). These treatment by diet interactions were analysed post hoc by simple effects analyses, and two patterns emerged. First, analyses revealed that compared to Western diet probiotic rats, Western diet placebo rats were higher in IL-7 (p = 0.034) and GM-CSF (p = 0.044). Second, compared to placebo control rats, placebo Western diet rats were higher in IL-7 (p < 0.001) and GM-CSF (p < 0.001).

4. Discussion

The goal of this work was to increase knowledge on the health effects of L. helveticus R0052 and B. longum R0175 (i.e., CEREBIOME®) using a developmental model. To summarise, two tests of anxiety, the OFT and LDB, were used in the present study with consistent results. After controlling for adult weight, placebo-treated rats showed evidence of higher anxiety [42,45,49,61]. Again, after factoring in weight, females showed evidence of lower anxiety [42]. This is the first animal study to our knowledge that has examined the metabolic consequences of CEREBIOME®, and our metabolic results suggest drastically different weight and food intake patterns in male and female rats with respect to probiotic treatment and diet. In females, treatment with the probiotic resulted in higher leptin levels compared to placebo and increased calorie intake, especially with Western diet exposure, without the expected change in weight. In males, the probiotic counteracted the increase in daily calories consumed and adult weight that was seen in the placebo-treated animals given the Western diet, with no corresponding change in leptin levels by treatment (i.e., leptin levels were higher only with Western diet exposure). It is also important to note that wean weight was lower in the offspring of dams given probiotic compared to placebo, even with no difference in birth weight, suggesting that the probiotic could be modulating weight during lactation either directly (i.e., the probiotic is being transferred to the pups through the breast milk) or indirectly (i.e., the pups are receiving probiotic from being in the same environment as their mother). Finally, approximately 90 min after rats were exposed to acute predator odour stress, specific inflammatory analytes, seemingly independent of analyte category, were higher in those given CEREBIOME®, in those treated with a Western diet, and in males.
The fact that placebo-treated rats reared more with support than probiotic-treated rats is noteworthy, as probiotic treatment is reported to improve anxiety in animal studies [18,24] and decrease the stress response [15,16,62,63]. Rearing is a complex behaviour (especially supported rearing) [45], and should be interpreted with caution as the act of performing a supported rear can vary based on the state of the animal performing the behaviour (i.e., escape behaviour or exploratory behaviour) [61]. From our results, it can only be theorised that the placebo animals may be performing more supported rears due to a desire to escape the testing area. This idea is strengthened by the fact that probiotic-treated animals transitioned more in the LDB (a behaviour consistent with lower anxiety) and reveals that multiple means for estimating anxiety levels is ideal. Future studies would benefit from additional measured variables such as number of defecations to help distinguish between exploratory- versus escape-related rearing [64].
From previous literature describing the effects of diet on the stress response system [27,65], it is of interest that we did not see any effect of diet on our anxiety measures. This is consistent with Abildgaard and colleagues [62], who also found no differences in the OFT by probiotic treatment or by diet, but they solely measured locomotion. It may be that results are affected by the type of diet, length of stress exposure, and choice of behavioural tests. One important note is that a high-carbohydrate control diet such as that used here leads to insulin resistance, excess fat storage, and weight gain [66], and low-carbohydrate diets are used when treating insulin resistance and type 2 diabetes [67]. High-carbohydrate diets are defined as containing greater than 45% of their energy from carbohydrates [67]—markedly lower than commonly used control diets, which are frequently comprised of 70% carbohydrates. In fact, Prasad and Prasad [68] report that rats given a 90% high-fat diet for one week had decreased observed anxiety on the elevated plus maze (EPM) test compared to baseline when compared to a 90% carbohydrate and 90% protein diet. Additionally, while Bridgewater et al. [46] found that male mice (but not females) given a 60% high-fat diet showed more anxiety-like behaviours in the OFT and EPM when also exposed to a chronic unpredictable stress paradigm. Importantly, the study by Bridgewater and colleagues [46] obtained similar results to the present study, in that male and female mice responded uniquely with respect to their observed anxiety.
Lactobacillus and Bifidobacterium strains have been documented as agents that can aid in the prevention and reversal of obesity via their impact on modulating the gut microbiome (i.e., affecting energy balance/storage, food intake hormones, and the lining of the gut) [69]. Previous research has shown that weight gain and other markers of obesity are improved with probiotic treatment (e.g., Bifidobacterium strains [20]; L. helveticus R0052 [22]). At least for males, our results suggest that probiotic treatment may lessen the negative health impacts of the Western diet. Our results are consistent with literature characterising the effects of probiotics on weight gain in response to unhealthy diet (e.g., in mice [22]; in zebrafish [70]). Although sex-specific effects of high-fat diet have been documented [46], there is a stark lack of studies examining how the combination of diet and probiotic treatment might affect males compared to females. For instance, Karlsson et al. [19] reported lower weight gain, fat around organs, and plasma leptin with Lactiplantibacillus plantarum treatment, but results were not reported by sex. In a recent study, individuals with major depressive disorder were supplemented with the CEREBIOME® formulation, a galactooligosaccharide prebiotic, or placebo, and it was found that only the probiotic was associated with decreased reported depressive symptoms on the Beck Depression Inventory [71]. Of interest was that this probiotic was related to an increase in the ratio of tryptophan to isoleucine (a branched-chain amino acid, BCAA), with no change in overall tryptophan levels, suggesting that the probiotic may be related to decreased levels of isoleucine [71]. Lee et al. [72] recently found that overall BCAA levels in plasma (i.e., sum of valine, leucine, and isoleucine) was associated with metabolic dysfunction and diabetes, so further studies that aim to characterise the metabolic effects of CEREBIOME® would benefit from including a measure of overall or specific BCAAs.
Because leptin is reported to inhibit food intake [73], it is of interest that the female rats given probiotic had both increased leptin and increased calorie intake compared to those given placebo. There is evidence of sex differences in gut microbiota compositions. For instance, Tennoune et al. [74] report Escherichia coli K12 DNA presence at baseline in female rat feces only. Interestingly, the group further reports increased weight in females after administration of this same strain but both decreased weight and decreased food intake in males [74]. As Taraschenko and colleagues [75] suggested, evidence shows that diet-induced obesity occurs differently in each sex, highlighting the need for studies to report on results in both sexes when examining the anti-obesity effects of probiotic treatment. One study that aimed to correct high-fat diet-induced obesity was only successful with male rats [75]. Furthermore, Alonso-Caraballo and colleagues [76] found that increased anxiety-like behaviours in the EPM were associated with increased weight gain and plasma leptin in male rats only. Interestingly, when Harris et al. [77] induced leptin resistance (by administering high-fat diet and leptin injections) females still lost weight in response to the leptin administration with no change in food intake (i.e., they did not become leptin resistant like males) [77]. The results from Harris et al. [77] combined with the present results may indicate a time-delay in the development of leptin resistance in female rats compared to male rats. As Gruzdeva et al. [78] describe in their review, increased leptin can reduce appetite and body weight to a certain extent, but if the body becomes resistant to leptin as seen with obesity, increased leptin signals are no longer effective in decreasing food intake. Although leptin resistance is difficult to characterise and the mechanisms underlying leptin resistance have not been fully elucidated [78], the male rats in the present study had greater plasma leptin levels compared to females, which may be indicative of leptin resistance. Thus, if females were not in a leptin resistance state, higher leptin levels in the probiotic-treated compared to the placebo-treated females may indicate a more metabolically healthy outcome at the time leptin was measured.
Our results from inflammatory marker analysis are intriguing as we expected that probiotic treatment would both decrease pro-inflammatory markers and increase anti-inflammatory markers. In fact, probiotic animals displayed higher levels of pro-inflammatory analyte, IL-1α, but also of the anti-inflammatory analyte, IL-10, and the regulatory analytes, M-CSF and MIP-3α. Prior studies have shown that probiotic treatment decreases pro-inflammatory analytes and factors in response to chronic stress (e.g., IL-6 in rats [23]; IL-1β and NF-κB in Syrian golden hamsters [24]). Furthermore, Dai and colleagues [79] administered a probiotic including Bifidobacteria, Lactobacilli, and one Streptococcus species in a rat model of colitis and found that treatment similarly induced production of IL-10 (anti-inflammatory), but concurrently, reduced production of pro-inflammatory analytes (e.g., TNF-α and IL-6 in colon and serum). In addition, Bisson et al. [80] showed that a probiotic given to rats—containing L. helveticus R0052, B. longum R0175, Lacticaseibacillus rhamnosus R0011 and Saccharomyces boulardii yeasts—reduced pro-inflammatory analytes in serum (e.g., IL-1α, IL-6) and induced production of IL-4 and IL-10 after Escherichia coli infection. However, research is conflicted with respect to the effects of probiotic treatment on the inflammatory response, especially after stress exposure. In rats, Ait-Belgnaoui et al. [15] found no changes in plasma pro-inflammatory cytokines (i.e., IL-1β, IL-6) after probiotic (Companilactobacillus farciminis) treatment or acute stress exposure (partial restraint stress), but did find lower levels of hippocampal inflammatory analytes (IL-1β, IL-6, TNF-α mRNA) and stress hormones after stress exposure (i.e., CRF mRNA, plasma corticosterone and adrenocorticotropic hormone, ACTH) with the probiotic treatment. Conversely, in response to a multi-species probiotic treatment with prior stress exposure, Abilgaard et al. [62] found that mononuclear cells isolated from rat blood produced a greater amount of the cytokines IFN-γ, IL-2 and IL-4 when stimulated. As well, mice that were immune challenged and then exposed to an acute footshock stressor had increased glucocorticoid release and reduced IL-1α and IL-1β in the brain [81].
A complex relationship exists between the interleukin-1 family and the HPA axis where low levels of IL-1 (e.g., IL-1α and IL-1β) might be beneficial for efficient coping with stressors, but under severe or chronic stress conditions, increased IL-1 might be an adaptive method in reducing the stress response and preventing widespread damage [82]. In fact, one study that used the same combination of L. helveticus R0052 and B. longum R0175 as the present study found that, in rats, the probiotic prevented increased stress hormone release (i.e., corticosterone, noradrenaline, adrenaline) in plasma and prevented downregulation of glucocorticoid receptors, seen in response to chronic stress [16]. Wagner and Johnson [83] reported that cells from a vaginal epithelial cell line infected with Candida albicans and exposed to Lacticaseibacillus rhamnosus GR-1® and Limosilactobacillus reuteri RC-14® responded by increasing expression of IL-1α and IL-1β mRNA. Taken together, if the placebo animals had a greater physiological stress response to the potent predator odour stress (i.e., severe acute stress), this may explain the relatively lower amounts of plasma IL-1α measured in placebo compared to probiotic animals. Although research is severely lacking on the effects of stress and probiotic treatment on less-studied immunological analytes such as M-CSF and MIP-3α, it would not be surprising if these analytes are also affected by the stress response.
Our findings that the Western diet-exposed animals had increased inflammatory marker release is interesting when considering the relationship between glucocorticoids (steroid hormones) and the immune response. Glucocorticoids, when administered therapeutically, can modulate the immune system in response to autoimmune diseases and organ transplantation but can also promote insulin resistance and diabetes development (see [84] for a commentary). Furthermore, Wang et al. [85] showed that animals on a high-sugar diet had increased plasma corticosterone levels. Taking into consideration the research reported above, increased carbohydrate intake from the control diet may have led to increased presence of stress hormones, which in turn, could help to explain a lower inflammatory response in our control diet group.
We noted a number of sex differences in plasma analyte levels that may be explained, at least in part, by levels of circulating sex steroid hormones, and, is of importance to further studies characterising the effects of probiotic treatment in both sexes. Pyter et al. [86] reported that chronic stress exposure led to increased hippocampal inflammatory marker expression in male, but not female rats, after an immune challenge with lipopolysaccharide. Although there were no sex differences in corticosterone levels after the immune challenge, female rats had increased plasma estradiol, which may have prevented hippocampal expression of genes for the inflammatory analytes measured (e.g., IL-1β, TNF-α) [86]. Both testosterone (indirectly) and estradiol (directly) affect the HPA axis related to their actions on androgen and estrogen receptors, respectively [87] and males naturally have lower circulating levels of estradiol compared to females [88]. Furthermore, in response to stress, a recent review reports that female rats have increased corticosterone and ACTH compared to males [87], which may also suppress the inflammatory response as described above and may be further affected by circulating levels of estradiol. Theoretically, increased estrogens and/or increased corticosterone release may affect the inflammatory response in females and warrants investigation in studies aiming to elucidate sex differences in the mechanistic link between stress and inflammation.

5. Conclusions

We present evidence that the probiotic-treated animals showed less anxiety in the behavioural testing arenas used in this study (i.e., the OFT and LDB). Future studies would benefit from combining further anxiety behavioural tests (e.g., the EPM) with the aim of increasing the duration and complexity of testing in order to characterise the more subtle effects of probiotic treatment (e.g., to increase the incidence of lower-frequency behaviours). Importantly, by examining behavioural results by sex while factoring in weight, we show that weight is not the only factor affecting the differences in the observed anxiety-like behaviours seen between males and females. With the drastically different pattern of results between males and females seen for our metabolic measures (i.e., adult weight, food intake, and plasma leptin), it becomes important for future studies to include sex as a factor in the study design. This is the first study to our knowledge that examined inflammatory levels after acute exposure to predator odour stress with CEREBIOME® treatment. These results provide evidence that male, probiotic-treated, and Western-diet-administered rats have a greater inflammatory response after acute stress, which may be related to increased levels of specific steroid hormones and warrants further study (e.g., estradiol in males, corticosterone in placebo-treated and control diet-fed animals).
Overall, this study adds to what we know about a combination L. helveticus R0052 and B. longum R0175 probiotic with respect to adult anxiety behaviours, weight, food intake, and plasma levels of leptin and inflammatory analytes in a developmental Long–Evans rat model also exposed to a control or Western diet. The examination of these factors in the same group of animals is important, as all of the abovementioned health outcomes have been shown to be affected by probiotic treatment and each other. Importantly, our results demonstrate specific benefits of this probiotic that vary by sex, which is a critical consideration for developmental animal studies, which often examine effects in males exclusively. Over and above the specific findings in this study, it is our hope that results demonstrate the importance of including both sexes in animal studies that examine health outcomes and call attention to the idea of appropriate caution when choosing a control diet for a high-fat or Western diet. In future studies examining the effects of Western diet exposure, it would be enlightening to compare to the rat chow traditionally provided by animal care facilities rather than a high-carbohydrate control diet.

Author Contributions

Conceptualization, E.M.M., T.A.T. and T.S.P.; methodology, E.M.M., M.E.O., T.A.T. and T.S.P.; validation, E.M.M., M.E.O., C.W.M. and E.H.M.; formal analysis, E.M.M., M.E.O., R.S., C.W.M. and A.O.; investigation, E.M.M., M.E.O., R.S., C.W.M., A.O. and E.H.M.; resources, T.A.T. and T.S.P.; data curation, E.M.M. and R.S.; writing—original draft preparation, E.M.M.; writing—review and editing, E.M.M., M.E.O., R.S., C.W.M., A.O., E.H.M., T.A.T. and T.S.P.; visualization, E.M.M., E.H.M. and T.S.P.; supervision, T.A.T. and T.S.P.; project administration, E.M.M. and T.S.P.; funding acquisition, E.M.M, R.S., T.A.T. and T.S.P. All authors have read and agreed to the published version of the manuscript.

Funding

This work was supported by Engage and Engage Plus grants from the Natural Sciences and Engineering Research Council (NSERC) of Canada to T.S.P. (Grants 523896-18 and EGP2537192-18), with financial support from the Rosell® Institute for Microbiome and Probiotics. As well, an NSERC Canada Graduate Scholarships-Master’s (CGS-M) Program awarded to E.M.M. and an Undergraduate Student Research Award (USRA) by NSERC awarded to R.S. Support for this project was also obtained through a Master’s level Mitacs Accelerate Fellowship (IT11380) to E.M.M. and T.S.P. made possible with financial support and in-kind contributions from the Rosell® Institute for Microbiome and Probiotics. Financial support in the form of stipends was also provided to E.M.M. and M.E.O. from the Department of Psychology & Neuroscience and the Faculty of Graduate Studies at Dalhousie University and E.M.M. and M.E.O. were further supported with Master’s level Nova Scotia Graduate Scholarships.

Acknowledgments

A thank you to the past and continuing members of the Early Life & Adult Resiliency Lab at Dalhousie University, Canada. We would also like to express our appreciation to the employees at the Rosell® Institute for Microbiome and Probiotics, the research group of Lallemand Health Solutions Inc., for their help on this project and for supplying the CEREBIOME® formulation and other molecular expertise and reagents. Additionally, we give particular thanks to Annie Tremblay for providing helpful edits on the final manuscript, Andrea West for consistently providing excellent care to the animals, and to Sean MacKinnon for statistical advice.

Conflicts of Interest

The CEREBIOME® probiotic and placebo formulations were kindly provided by Lallemand Health Solutions Inc. (Montreal, QC, Canada). The Rosell® Institute for Microbiome and Probiotics, the research group of Lallemand Health Solutions Inc., of which T.A.T. and C.W.M. are employees, further provided access to the rat Luminex 23-Plex assay kits, Bio-PlexTM equipment, qPCR protocols and reagents for strain detection, along with associated technical expertise and in-kind contributions. E.M.M (IT11380, IT15513) and M.E.O (IT11379, IT15514) have each been awarded two Mitacs Accelerate Fellowships (“Master’s” and “PhD”, respectively) under the supervision of T.S.P made possible through financial and in-kind support from the Rosell® Institute for Microbiome and Probiotics. The Engage and Engage Plus grants from the Natural Sciences and Engineering Research Council (NSERC) of Canada awarded to T.S.P. (Grants 523896-18 and EGP2537192-18) were made possible with collaboration and financial support from the Rosell® Institute for Microbiome and Probiotics. Lallemand Health Solutions Inc., or its noted research group, was not involved in any data analyses or publishing decisions, and no other conflicts of interest are reported.

References

  1. Rieder, R.; Wisniewski, P.J.; Alderman, B.L.; Campbell, S.C. Microbes and mental health: A review. Brain. Behav. Immun. 2017, 66, 9–17. [Google Scholar] [CrossRef] [PubMed]
  2. Moloney, R.D.; Desbonnet, L.; Clarke, G.; Dinan, T.G.; Cryan, J.F. The microbiome: Stress, health and disease. Mamm. Genome 2014, 25, 49–74. [Google Scholar] [CrossRef] [PubMed]
  3. Bäckhed, F.; Fraser, C.M.; Ringel, Y.; Sanders, M.E.; Sartor, R.B.; Sherman, P.M.; Versalovic, J.; Young, V.; Finlay, B.B. Defining a healthy human gut microbiome: Current concepts, future directions, and clinical applications. Cell Host Microbe 2012, 12, 611–622. [Google Scholar] [CrossRef] [PubMed] [Green Version]
  4. Stecher, B.; Maier, L.; Hardt, W.D. “Blooming” in the gut: How dysbiosis might contribute to pathogen evolution. Nat. Rev. Microbiol. 2013, 11, 277–284. [Google Scholar] [CrossRef] [Green Version]
  5. Vega Mejía, N.; Ponce Reyes, R.; Martinez, Y.; Carrasco, O.; Cerritos, R. Implications of the Western diet for agricultural production, health and climate change. Front. Sustain. Food Syst. 2018, 2, 88. [Google Scholar] [CrossRef] [Green Version]
  6. Jia, W.; Li, H.; Zhao, L.; Nicholson, J.K. Gut microbiota: A potential new territory for drug targeting. Nat. Rev. Drug Discov. 2008, 7, 123–129. [Google Scholar] [CrossRef] [Green Version]
  7. Turnbaugh, P.J.; Ley, R.E.; Mahowald, M.A.; Magrini, V.; Mardis, E.R.; Gordon, J.I. An obesity-associated gut microbiome with increased capacity for energy harvest. Nature 2006, 444, 1027–1031. [Google Scholar] [CrossRef]
  8. Hill, C.; Guarner, F.; Reid, G.; Gibson, G.R.; Merenstein, D.J.; Pot, B.; Morelli, L.; Canani, R.B.; Flint, H.J.; Salminen, S.; et al. Expert consensus document: The International Scientific Association for Probiotics and Prebiotics consensus statement on the scope and appropriate use of the term probiotic. Nat. Rev. Gastroenterol. Hepatol. 2014, 11, 506–514. [Google Scholar] [CrossRef] [Green Version]
  9. Dinan, T.G.; Stanton, C.; Cryan, J.F. Psychobiotics: A novel class of psychotropic. Biol. Psychiatry 2013, 74, 720–726. [Google Scholar] [CrossRef]
  10. Traina, G.; Menchetti, L.; Rappa, F.; Casagrande-Proietti, P.; Barbato, O.; Leonardi, L.; Carini, F.; Piro, F.; Brecchia, G. Probiotic mixture supplementation in the preventive management of trinitrobenzenesulfonic acid-induced inflammation in a murine model. J. Biol. Regul. Homeost. Agents 2016, 30, 895–901. [Google Scholar] [PubMed]
  11. Grenham, S.; Clarke, G.; Cryan, J.F.; Dinan, T.G. Brain-gut-microbe communication in health and disease. Front. Physiol. 2011, 2, 94. [Google Scholar] [CrossRef] [PubMed] [Green Version]
  12. Bruce-Keller, A.J.; Salbaum, J.M.; Berthoud, H.R. Harnessing gut microbes for mental health: Getting from here to there. Biol. Psychiatry 2018, 83, 214–223. [Google Scholar] [CrossRef] [PubMed]
  13. Cryan, J.F.; O’Mahony, S.M. The microbiome-gut-brain axis: From bowel to behavior. Neurogastroenterol. Motil. 2011, 23, 187–192. [Google Scholar] [CrossRef] [PubMed]
  14. Luna, R.A.; Foster, J.A. Gut brain axis: Diet microbiota interactions and implications for modulation of anxiety and depression. Curr. Opin. Biotechnol. 2015, 32, 35–41. [Google Scholar] [CrossRef]
  15. Ait-Belgnaoui, A.; Durand, H.; Cartier, C.; Chaumaz, G.; Eutamene, H.; Ferrier, L.; Houdeau, E.; Fioramonti, J.; Bueno, L.; Theodorou, V. Prevention of gut leakiness by a probiotic treatment leads to attenuated HPA response to an acute psychological stress in rats. Psychoneuroendocrinology 2012, 37, 1885–1895. [Google Scholar] [CrossRef]
  16. Ait-Belgnaoui, A.; Payard, I.; Rolland, C.; Harkat, C.; Braniste, V.; Théodorou, V.; Tompkins, T.A. Bifidobacterium longum and Lactobacillus helveticus synergistically suppress stress-related visceral hypersensitivity through hypothalamic-pituitary-adrenal axis modulation. J. Neurogastroenterol. Motil. 2018, 24, 138–146. [Google Scholar] [CrossRef] [Green Version]
  17. Gareau, M.G.; Jury, J.; MacQueen, G.; Sherman, P.M.; Perdue, M.H. Probiotic treatment of rat pups normalises corticosterone release and ameliorates colonic dysfunction induced by maternal separation. Gut 2007, 56, 1522–1528. [Google Scholar] [CrossRef] [Green Version]
  18. Messaoudi, M.; Lalonde, R.; Violle, N.; Javelot, H.; Desor, D.; Nejdi, A.; Bisson, J.F.; Rougeot, C.; Pichelin, M.; Cazaubiel, M.; et al. Assessment of psychotropic-like properties of a probiotic formulation (Lactobacillus helveticus R0052 and Bifidobacterium longum R0175) in rats and human subjects. Br. J. Nutr. 2011, 105, 755–764. [Google Scholar] [CrossRef] [Green Version]
  19. Karlsson, C.L.J.; Molin, G.; Fåk, F.; Johansson Hagslätt, M.L.; Jakesevic, M.; Håkansson, Å.; Jeppsson, B.; Weström, B.; Ahrné, S. Effects on weight gain and gut microbiota in rats given bacterial supplements and a high-energy-dense diet from fetal life through to 6 months of age. Br. J. Nutr. 2011, 106, 887–895. [Google Scholar] [CrossRef] [Green Version]
  20. An, H.M.; Park, S.Y.; Lee, D.K.; Kim, J.R.; Cha, M.K.; Lee, S.W.; Lim, H.T.; Kim, K.J.; Ha, N.J. Antiobesity and lipid-lowering effects of Bifidobacterium spp. in high fat diet-induced obese rats. Lipids Health Dis. 2011, 10, 116. [Google Scholar] [CrossRef] [Green Version]
  21. Yin, Y.N.; Yu, Q.F.; Fu, N.; Liu, X.W.; Lu, F.G. Effects of four Bifidobacteria on obesity in high-fat diet induced rats. World J. Gastroenterol. 2010, 16, 3394–3401. [Google Scholar] [CrossRef] [PubMed]
  22. Ohland, C.L.; Kish, L.; Bell, H.; Thiesen, A.; Hotte, N.; Pankiv, E.; Madsen, K.L. Effects of Lactobacillus helveticus on murine behavior are dependent on diet and genotype and correlate with alterations in the gut microbiome. Psychoneuroendocrinology 2013, 38, 1738–1747. [Google Scholar] [CrossRef] [PubMed]
  23. Desbonnet, L.; Garrett, L.; Clarke, G.; Kiely, B.; Cryan, J.F.; Dinan, T.G. Effects of the probiotic Bifidobacterium infantis in the maternal separation model of depression. Neuroscience 2010, 170, 1179–1188. [Google Scholar] [CrossRef] [PubMed]
  24. Avolio, E.; Fazzari, G.; Zizza, M.; de Lorenzo, A.; di Renzo, L.; Alò, R.; Facciolo, R.M.; Canonaco, M. Probiotics modify body weight together with anxiety states via pro-inflammatory factors in HFD-treated Syrian golden hamster. Behav. Brain Res. 2019, 356, 390–399. [Google Scholar] [CrossRef]
  25. Li, N.; Wang, Q.; Wang, Y.; Sun, A.; Lin, Y.; Jin, Y.; Li, X. Oral probiotics ameliorate the behavioral deficits induced by chronic mild stress in mice via the gut microbiota-inflammation axis. Front. Behav. Neurosci. 2018, 12, 266. [Google Scholar] [CrossRef] [Green Version]
  26. Dallman, M.F.; Pecoraro, N.C.; la Fleur, S.E. Chronic stress and comfort foods: Self-medication and abdominal obesity. Brain. Behav. Immun. 2005, 19, 275–280. [Google Scholar] [CrossRef]
  27. Pecoraro, N.; Reyes, F.; Gomez, F.; Bhargava, A.; Dallman, M.F. Chronic stress promotes palatable feeding, which reduces signs of stress: Feedforward and feedback effects of chronic stress. Endocrinology 2004, 145, 3754–3762. [Google Scholar] [CrossRef]
  28. Grissom, N.M.; George, R.; Reyes, T.M. The hypothalamic transcriptional response to stress is severely impaired in offspring exposed to adverse nutrition during gestation. Neuroscience 2017, 342, 200–211. [Google Scholar] [CrossRef]
  29. O’Mahony, S.M.; Marchesi, J.R.; Scully, P.; Codling, C.; Ceolho, A.M.; Quigley, E.M.M.; Cryan, J.F.; Dinan, T.G. Early life stress alters behavior, immunity, and microbiota in rats: Implications for irritable bowel syndrome and psychiatric illnesses. Biol. Psychiatry 2009, 65, 263–267. [Google Scholar] [CrossRef]
  30. Qian, L.; Lu, L.; Huang, L.; Wen, Q.; Xie, J.; Jin, W.; Li, H.; Jiang, L. The effect of neonatal maternal separation on short-chain fatty acids and airway inflammation in adult asthma mice. Allergol. Immunopathol. 2019, 47, 2–11. [Google Scholar] [CrossRef]
  31. Carpenter, L.L.; Gawuga, C.E.; Tyrka, A.R.; Lee, J.K.; Anderson, G.M.; Price, L.H. Association between plasma IL-6 response to acute stress and early-life adversity in healthy adults. Neuropsychopharmacology 2010, 35, 2617–2623. [Google Scholar] [CrossRef] [PubMed] [Green Version]
  32. Michopoulos, V.; Powers, A.; Gillespie, C.F.; Ressler, K.J.; Jovanovic, T. Inflammation in fear-and anxiety-based disorders: PTSD, GAD, and beyond. Neuropsychopharmacology 2017, 42, 254–270. [Google Scholar] [CrossRef] [PubMed] [Green Version]
  33. De Souza, C.T.; Araujo, E.P.; Bordin, S.; Ashimine, R.; Zollner, R.L.; Boschero, A.C.; Saad, M.J.A.; Velloso, L.A. Consumption of a fat-rich diet activates a proinflammatory response and induces insulin resistance in the hypothalamus. Endocrinology 2005, 146, 4192–4199. [Google Scholar] [CrossRef] [PubMed] [Green Version]
  34. Dandona, P.; Aljada, A.; Bandyopadhyay, A. Inflammation: The link between insulin resistance, obesity and diabetes. Trends Immunol. 2004, 25, 4–7. [Google Scholar] [CrossRef]
  35. Azad, M.A.K.; Sarker, M.; Wan, D. Immunomodulatory effects of probiotics on cytokine profiles. BioMed Res. Int. 2018, 2018, 8063647. [Google Scholar] [CrossRef] [Green Version]
  36. Korgan, A.C.; O’Leary, E.; King, J.L.; Weaver, I.C.G.; Perrot, T.S. Effects of paternal high-fat diet and rearing environment on maternal investment and development of defensive responses in the offspring. Psychoneuroendocrinology 2018, 91, 20–30. [Google Scholar] [CrossRef]
  37. Myles, E.M.; O’Leary, M.E.; Romkey, I.D.; Piano, A.; de Carvalho, V.; Tompkins, T.A.; Perrot, T.S. Guidelines for best practice in placebo-controlled experimental studies on probiotics in rodent animal models. Benef. Microbes 2020, 11, 245–254. [Google Scholar] [CrossRef]
  38. Tillmann, S.; Wegener, G. Syringe-feeding as a novel delivery method for accurate individual dosing of probiotics in rats. Benef. Microbes 2018, 9, 311–315. [Google Scholar] [CrossRef] [Green Version]
  39. Mueller, N.T.; Bakacs, E.; Combellick, J.; Grigoryan, Z.; Dominguez-Bello, M.G. The infant microbiome development: Mom matters. Trends Mol. Med. 2015, 21, 109–117. [Google Scholar] [CrossRef] [Green Version]
  40. Rautava, S. Probiotic intervention through the pregnant and breastfeeding mother to reduce disease risk in the child. Breastfeed. Med. 2018, 13, S14–S15. [Google Scholar] [CrossRef] [Green Version]
  41. Collado, M.C.; Rautava, S.; Aakko, J.; Isolauri, E.; Salminen, S. Human gut colonisation may be initiated in utero by distinct microbial communities in the placenta and amniotic fluid. Sci. Rep. 2016, 6, 23129. [Google Scholar] [CrossRef] [PubMed] [Green Version]
  42. Kalueff, A.V.; Tuohimaa, P. Experimental modeling of anxiety and depression. Acta Neurobiol. Exp. 2004, 64, 439–448. [Google Scholar] [PubMed]
  43. Barrow, P.; Leconte, I. The influence of body weight on open field and swimming maze performance during the post-weaning period in the rat. Lab. Anim. 1996, 30, 22–27. [Google Scholar] [CrossRef] [Green Version]
  44. Tanaka, S.; Young, J.W.; Halberstadt, A.L.; Masten, V.L.; Geyer, M.A. Four factors underlying mouse behavior in an open field. Behav. Brain Res. 2012, 233, 55–61. [Google Scholar] [CrossRef] [Green Version]
  45. Sturman, O.; Germain, P.L.; Bohacek, J. Exploratory rearing: A context- and stress-sensitive behavior recorded in the open-field test. Stress 2018, 21, 443–452. [Google Scholar] [CrossRef]
  46. Bridgewater, L.C.; Zhang, C.; Wu, Y.; Hu, W.; Zhang, Q.; Wang, J.; Li, S.; Zhao, L. Gender-based differences in host behavior and gut microbiota composition in response to high fat diet and stress in a mouse model. Sci. Rep. 2017, 7, 10776. [Google Scholar] [CrossRef] [PubMed] [Green Version]
  47. Soulis, G.; Papalexi, E.; Kittas, C.; Kitraki, E. Early impact of a fat-enriched diet on behavioral responses of male and female rats. Behav. Neurosci. 2007, 121, 483–490. [Google Scholar] [CrossRef]
  48. Arrant, A.E.; Schramm-Sapyta, N.L.; Kuhn, C.M. Use of the light/dark test for anxiety in adult and adolescent male rats. Behav. Brain Res. 2013, 256, 119–127. [Google Scholar] [CrossRef] [Green Version]
  49. Miller, S.M.; Piasecki, C.C.; Lonstein, J.S. Use of the light-dark box to compare the anxiety-related behavior of virgin and postpartum female rats. Pharmacol. Biochem. Behav. 2011, 100, 130–137. [Google Scholar] [CrossRef] [Green Version]
  50. Lakens, D. Calculating and reporting effect sizes to facilitate cumulative science: A practical primer for t-tests and ANOVAs. Front. Psychol. 2013, 4, 863. [Google Scholar] [CrossRef] [Green Version]
  51. Olejnik, S.; Algina, J. Generalized eta and omega squared statistics: Measures of effect size for some common research designs. Psychol. Methods 2003, 8, 434–447. [Google Scholar] [CrossRef] [PubMed] [Green Version]
  52. Brown, G.R.; Hem, V.; Katz, K.S.; Ovetsky, M.; Wallin, C.; Ermolaeva, O.; Tolstoy, I.; Tatusova, T.; Pruitt, K.D.; Maglott, D.R.; et al. Gene: A gene-centered information resource at NCBI. Nucleic Acids Res. 2015, 43, D36–D42. [Google Scholar] [CrossRef] [PubMed]
  53. Hong, J.; Chang, A.; Zavvarian, M.M.; Wang, J.; Liu, Y.; Fehlings, M.G. Level-specific differences in systemic expression of pro-and anti-inflammatory cytokines and chemokines after spinal cord injury. Int. J. Mol. Sci. 2018, 19, 2167. [Google Scholar] [CrossRef] [PubMed] [Green Version]
  54. Zhou, X.; Fragala, M.S.; McElhaney, J.E.; Kuchel, G.A. Conceptual and methodological issues relevant to cytokine and inflammatory marker measurements in clinical research. Curr. Opin. Clin. Nutr. Metab. Care 2010, 13, 541–547. [Google Scholar] [CrossRef] [Green Version]
  55. Bode, H.; Schmitz, H.; Fromm, M.; Scholz, P.; Riecken, E.O.; Schulzke, J.D. IL-1β and TNF-α, but not IFN-α, IFN-γ, IL-6 or IL-8, are secretory mediators in human distal colon. Cytokine 1998, 10, 457–465. [Google Scholar] [CrossRef]
  56. Chio, C.C.; Lin, H.J.; Tian, Y.F.; Chen, Y.C.; Lin, M.T.; Lin, C.H.; Chang, C.P.; Hsu, C.C. Exercise attenuates neurological deficits by stimulating a critical HSP70/NF-ΚB/IL-6/synapsin I axis in traumatic brain injury rats. J. Neuroinflamm. 2017, 14, 90. [Google Scholar] [CrossRef] [Green Version]
  57. Cuneo, A.; Autieri, M. Expression and function of anti-inflammatory interleukins: The other side of the vascular response to injury. Curr. Vasc. Pharmacol. 2009, 7, 267–276. [Google Scholar] [CrossRef] [Green Version]
  58. Wood, S.K.; Wood, C.S.; Lombard, C.M.; Lee, C.S.; Zhang, X.Y.; Finnell, J.E.; Valentino, R.J. Inflammatory factors mediate vulnerability to a social stress-induced depressive-like phenotype in passive coping rats. Biol. Psychiatry 2015, 78, 38–48. [Google Scholar] [CrossRef] [Green Version]
  59. Ushach, I.; Zlotnik, A. Biological role of granulocyte macrophage colony-stimulating factor (GM-CSF) and macrophage colony-stimulating factor (M-CSF) on cells of the myeloid lineage. J. Leukoc. Biol. 2016, 100, 481–489. [Google Scholar] [CrossRef]
  60. Trivedi, P.J.; Adams, D.H. Chemokines and chemokine receptors as therapeutic targets in inflammatory bowel disease; Pitfalls and promise. J. Crohn’s Colitis 2018, 12, S641–S652. [Google Scholar] [CrossRef] [Green Version]
  61. Lever, C.; Burton, S.; O’Keefe, J. Rearing on hind legs, environmental novelty, and the hippocampal formation. Rev. Neurosci. 2006, 17, 111–133. [Google Scholar] [CrossRef] [PubMed]
  62. Abildgaard, A.; Elfving, B.; Hokland, M.; Wegener, G.; Lund, S. Probiotic treatment reduces depressive-like behaviour in rats independently of diet. Psychoneuroendocrinology 2017, 79, 40–48. [Google Scholar] [CrossRef] [PubMed]
  63. Ait-Belgnaoui, A.; Colom, A.; Braniste, V.; Ramalho, L.; Marrot, A.; Cartier, C.; Houdeau, E.; Theodorou, V.; Tompkins, T. Probiotic gut effect prevents the chronic psychological stress-induced brain activity abnormality in mice. Neurogastroenterol. Motil. 2014, 26, 510–520. [Google Scholar] [CrossRef] [PubMed]
  64. Genaro, G.; Schmidek, W.R. Exploratory activity of rats in three different environments. Ethology 2000, 106, 849–859. [Google Scholar] [CrossRef]
  65. Cagampang, F.R.; Poore, K.R.; Hanson, M.A. Developmental origins of the metabolic syndrome: Body clocks and stress responses. Brain. Behav. Immun. 2011, 25, 214–220. [Google Scholar] [CrossRef]
  66. Ludwig, D.S.; Ebbeling, C.B. The carbohydrate-insulin model of obesity: Beyond “calories in, calories out”. JAMA Intern. Med. 2018, 178, 1098–1103. [Google Scholar] [CrossRef]
  67. Feinman, R.D.; Pogozelski, W.K.; Astrup, A.; Bernstein, R.K.; Fine, E.J.; Westman, E.C.; Accurso, A.; Frassetto, L.; Gower, B.A.; McFarlane, S.I.; et al. Dietary carbohydrate restriction as the first approach in diabetes management: Critical review and evidence base. Nutrition 2015, 31, 1–13. [Google Scholar] [CrossRef] [Green Version]
  68. Prasad, A.; Prasad, C. Short-term consumption of a diet rich in fat decreases anxiety response in adult male rats. Physiol. Behav. 1996, 60, 1039–1042. [Google Scholar] [CrossRef]
  69. Kobyliak, N.; Conte, C.; Cammarota, G.; Haley, A.P.; Styriak, I.; Gaspar, L.; Fusek, J.; Rodrigo, L.; Kruzliak, P. Probiotics in prevention and treatment of obesity: A critical view. Nutr. Metab. 2016, 13, 14. [Google Scholar] [CrossRef] [Green Version]
  70. Falcinelli, S.; Rodiles, A.; Hatef, A.; Picchietti, S.; Cossignani, L.; Merrifield, D.L.; Unniappan, S.; Carnevali, O. Dietary lipid content reorganizes gut microbiota and probiotic L. rhamnosus attenuates obesity and enhances catabolic hormonal milieu in zebrafish. Sci. Rep. 2017, 7, 5512. [Google Scholar] [CrossRef]
  71. Kazemi, A.; Noorbala, A.A.; Azam, K.; Eskandari, M.H.; Djafarian, K. Effect of probiotic and prebiotic vs. placebo on psychological outcomes in patients with major depressive disorder: A randomized clinical trial. Clin. Nutr. 2019, 38, 522–528. [Google Scholar] [CrossRef] [PubMed]
  72. Lee, C.C.; Watkins, S.M.; Lorenzo, C.; Wagenknecht, L.E.; Il’Yasova, D.; Chen, Y.D.I.; Haffner, S.M.; Hanley, A.J. Branched-chain amino acids and insulin metabolism: The Insulin Resistance Atherosclerosis Study (IRAS). Diabetes Care 2016, 39, 582–588. [Google Scholar] [CrossRef] [PubMed] [Green Version]
  73. Shi, H.; Clegg, D.J. Sex differences in the regulation of body weight. Physiol. Behav. 2009, 97, 199–204. [Google Scholar] [CrossRef] [PubMed] [Green Version]
  74. Tennoune, N.; Legrand, R.; Ouelaa, W.; Breton, J.; Lucas, N.; Bole-Feysot, C.; do Rego, J.C.; Déchelotte, P.; Fetissov, S.O. Sex-related effects of nutritional supplementation of Escherichia coli: Relevance to eating disorders. Nutrition 2015, 31, 498–507. [Google Scholar] [CrossRef] [PubMed]
  75. Taraschenko, O.D.; Maisonneuve, I.M.; Glick, S.D. Sex differences in high fat-induced obesity in rats: Effects of 18-methoxycoronaridine. Physiol. Behav. 2011, 103, 308–314. [Google Scholar] [CrossRef] [PubMed]
  76. Alonso-Caraballo, Y.; Hodgson, K.J.; Morgan, S.A.; Ferrario, C.R.; Vollbrecht, P.J. Enhanced anxiety-like behavior emerges with weight gain in male and female obesity-susceptible rats. Behav. Brain Res. 2019, 360, 81–93. [Google Scholar] [CrossRef]
  77. Harris, R.B.S.; Bowen, H.M.; Mitchell, T.D. Leptin resistance in mice is determined by gender and duration of exposure to high-fat diet. Physiol. Behav. 2003, 78, 543–555. [Google Scholar] [CrossRef]
  78. Gruzdeva, O.; Borodkina, D.; Uchasova, E.; Dyleva, Y.; Barbarash, O. Leptin resistance: Underlying mechanisms and diagnosis. Diabetes Metab. Syndr. Obes. Targets Ther. 2019, 12, 191–198. [Google Scholar] [CrossRef] [Green Version]
  79. Dai, C.; Zheng, C.Q.; Jiang, M.; Ma, X.Y.; Jiang, L.J. Probiotics and irritable bowel syndrome. World J. Gastroenterol. 2013, 19, 5973–5980. [Google Scholar] [CrossRef]
  80. Bisson, J.F.; Hidalgo, S.; Rozan, P.; Messaoudi, M. Preventive effects of different probiotic formulations on travelers’ diarrhea model in wistar rats: Preventive effects of probiotics on TD. Dig. Dis. Sci. 2010, 55, 911–919. [Google Scholar] [CrossRef]
  81. Goujon, E.; Parnet, P.; Laye, S.; Combe, C.; Kelley, K.W.; Dantzer, R. Stress downregulates lipopolysaccharide-induced expression of proinflammatory cytokines in the spleen, pituitary, and brain of mice. Brain Behav. Immun. 1995, 9, 292–303. [Google Scholar] [CrossRef] [PubMed] [Green Version]
  82. Goshen, I.; Yirmiya, R. Interleukin-1 (IL-1): A central regulator of stress responses. Front. Neuroendocrinol. 2009, 30, 30–45. [Google Scholar] [CrossRef]
  83. Wagner, R.D.; Johnson, S.J. Probiotic lactobacillus and estrogen effects on vaginal epithelial gene expression responses to Candida albicans. J. Biomed. Sci. 2012, 19, 58. [Google Scholar] [CrossRef] [PubMed] [Green Version]
  84. Ferris, H.A.; Kahn, C.R. New mechanisms of glucocorticoid-induced insulin resistance: Make no bones about it. J. Clin. Invest. 2012, 122, 3854–3857. [Google Scholar] [CrossRef] [PubMed]
  85. Wang, J.; Akabayashi, A.; Dourmashkin, J.; Yu, H.J.; Alexander, J.T.; Chae, H.J.; Leibowitz, S.F. Neuropeptide Y in relation to carbohydrate intake, corticosterone and dietary obesity. Brain Res. 1998, 802, 75–88. [Google Scholar] [CrossRef]
  86. Pyter, L.M.; Kelly, S.D.; Harrell, C.S.; Neigh, G.N. Sex differences in the effects of adolescent stress on adult brain inflammatory markers in rats. Brain. Behav. Immun. 2013, 30, 88–94. [Google Scholar] [CrossRef] [Green Version]
  87. Heck, A.L.; Handa, R.J. Sex differences in the hypothalamic–pituitary–adrenal axis’ response to stress: An important role for gonadal hormones. Neuropsychopharmacology 2019, 44, 45–58. [Google Scholar] [CrossRef] [Green Version]
  88. Schulster, M.; Bernie, A.M.; Ramasamy, R. The role of estradiol in male reproductive function. Asian J. Androl. 2016, 18, 435–440. [Google Scholar] [CrossRef]
Figure 1. Experimental timeline (numbered in chronological order from 1 to10) from arrival of breeder rats until offspring sacrifices with gestational day (GD) 0 serving as the reference point for the timeline. PD: postnatal day (0 to 74); GD: gestational day (−13 to 21); SNH: semi-naturalistic housing; OFT: open field test; LDB: light–dark box; PO: predator odour.
Microorganisms 08 01527 g001
Figure 2. Visual representation (in centimetres) of (A) the semi-naturalistic housing cages with a burrow section that pulls open used in this experiment for offspring and their dam during lactation (PD 0 to PD 21), (B) The open field test, and (C) The light–dark box and predator odour exposure arena.
Microorganisms 08 01527 g002
Figure 3. Supported rearing in the light–dark box for (A) the 2-way interaction between treatment and sex, and (B) the 3-way interaction between treatment, diet, and sex. Data expressed as M(SD). ** p < 0.01. PL: placebo; PR: probiotic; WD: Western diet; M: male; F: female.
Microorganisms 08 01527 g003
Figure 4. (A) Wean weight in placebo and probiotic animals; (B) Adult weight in all animals at an average of 67 days old. Data expressed as M(SD). ** p < 0.01, *** p < 0.001, nd: no difference. PL: placebo; PR: probiotic; WD: Western diet; CD: control diet.
Microorganisms 08 01527 g004
Figure 5. Food intake as measured by average calories consumed (kcal) over 4 days in placebo and probiotic rats given control diet or Western diet separated by (A) males and (B) females. Data expressed as M(SD). ** p < 0.01, *** p < 0.001. PL: placebo; PR: probiotic; WD: Western diet; CD: control diet.
Microorganisms 08 01527 g005
Figure 6. Plasma leptin levels (pg/mL) in males and females by treatment and diet condition. Data expressed as M(SD). * p < 0.05, ** p < 0.01, *** p < 0.001. PL: placebo; PR: probiotic; WD: Western diet; CD: control diet.
Microorganisms 08 01527 g006
Figure 7. Scatterplot of the relationship between plasma leptin levels (pg/mL) and: (A) Adult weight (g); (B) Average daily calorie intake (kcal). *** p < 0.001, including 95% confidence bands of the best fit lines.
Microorganisms 08 01527 g007
Figure 8. Scatterplot of the relationship between adult weight (g) and: (A) Line crosses in the open field test; (B) Line crosses in the light–dark box. *p < 0.05, **p < 0.01, including 95% confidence bands of the best fit lines.
Microorganisms 08 01527 g008
Figure 9. Scatterplot of the relationship between adult weight (g) and: (A) Transitions during light–dark box testing in placebo animals; (B) Transitions during light–dark box testing in probiotic animals. ** p < 0.01; nd: no difference; including 95% confidence bands of the best fit lines.
Microorganisms 08 01527 g009
Figure 10. Diet by sex interactions in plasma inflammatory analytes from factorial ANOVA analyses for (A) IL-1β, (B) IL-7, (C) GM-CSF, (D) GRO/KC, (E) MIP-1α, and (F) MCP-1. Data expressed as M(SD). * p < 0.05, ** p < 0.01, *** p < 0.001. WD: Western diet; CD: control diet; M: male; F: female.
Microorganisms 08 01527 g010
Figure 11. Treatment by diet interactions in plasma inflammatory analytes from factorial ANOVA analyses for (A) IL-7 and (B) GM-CSF. Data expressed as M(SD). * p < 0.05, *** p < 0.001. PL: placebo; PR: probiotic; WD: Western diet; CD: control diet.
Microorganisms 08 01527 g011
Table 1. Litter diversity details for each of the eight experimental groups including total sample size, maximum subjects per litter in each group, and represented litters of total by treatment (four probiotic, three placebo). PL: placebo; PR: probiotic; WD: Western diet; CD: control diet; M: male; F: female.
Experimental Group
PR-WD-MPR-WD-FPR-CD-MPR-CD-FPL-WD-MPL-WD-FPL-CD-MPL-CD-F
Sample size88887878
Max. n per litter33235433
Represented litters 4 of 43 of 44 of 43 of 42 of 32 of 33 of 33 of 3
Table 2. Overview of treatment and sex main effects in the open field test from factorial ANOVA analyses for line crosses, total rearing, and supported rearing, including means (M) and standard deviations (SD).
Behaviour, dfProbiotic
M(SD)
Placebo
M (SD)
F-Valuep-ValueEffect Size (ηp2)
Total Rearing, F1, 5420.22 (8.69)29.03 (11.85)11.19p = 0.002ηp2 = 0.172
Supported Rearing, F1, 5315.81 (6.11)24.07 (9.59)17.21p < 0.001ηp2 = 0.245
Behaviour, dfMale
M (SD)
Female
M(SD)
F-Valuep-ValueEffect Size (ηp2)
Line Crosses, F1, 5472.73 (21.39)94.69 (24.25)14.06p < 0.001ηp2 = 0.207
Total Rearing, F1, 5421.73 (10.21)27.31 (11.62)4.17p = 0.046ηp2 = 0.072
Supported Rearing, F1, 5317.63 (8.19)21.77 (9.24)4.39p = 0.041ηp2 = 0.076
Table 3. Overview of treatment and sex main effects in the light–dark box from factorial ANOVA analyses for line crosses, supported rearing, transitions, and latency to enter light, including means (M) and standard deviations (SD).
Behaviour, dfProbiotic
M(SD)
Placebo
M (SD)
F-Valuep-ValueEffect Size (ηp2)
Supported Rearing, F1, 5422.97 (8.22)27.73 (8.16)6.61p = 0.013ηp2 = 0.109
Transitions, F1, 5411.69 (4.21)8.83 (4.19)10.21p = 0.002ηp2 = 0.159
Behaviour, dfMale
M (SD)
Female
M (SD)
F-Valuep-ValueEffect Size (ηp2)
Line Crosses, F1, 5443.30 (10.92)58.97 (16.81)18.63p < 0.001ηp2 = 0.256
Supported Rearing, F1, 5422.23 (7.84)28.13 (8.15)9.41p = 0.003ηp2 = 0.148
Transitions, F1, 548.17 (3.53)12.31 (4.24)20.66p < 0.001ηp2 = 0.277
Latency to Light, F1, 5350.39 (44.06)17.90 (26.37)13.55p < 0.001ηp2 = 0.204
Table 4. Overview of treatment main effects for plasma inflammatory analytes from factorial ANOVA analyses for IL-1α, IL-10, M-CSF, and MIP-3α, including means (M) and standard deviations (SD).
Analyte, dfProbiotic
M (SD)
Placebo
M (SD)
F-Valuep-ValueEffect Size
p2)
IL-1α, F1, 53163.79 (126.86)94.81 (95.64)5.54p = 0.022ηp2 = 0.095
IL-10, F1, 53100.15 (94.01)37.04 (63.77)8.95p = 0.004ηp2 = 0.145
M-CSF, F1, 5324.97 (11.51)13.54 (11.22)14.40p < 0.001ηp2 = 0.214
MIP-3α, F1, 5131.40 (11.49)19.93 (6.53)20.85p < 0.001ηp2 = 0.290
Table 5. Overview of diet main effects for plasma inflammatory analytes from factorial ANOVA analyses for IL-1β, IL-7, GM-CSF, GRO/KC, MIP-1α, VEGF, and MCP-1, including means (M) and standard deviations (SD).
Analyte, dfWestern
M (SD)
Control
M (SD)
F-Valuep-ValueEffect Size
p2)
IL-1β, F1, 53416.93 (441.58)175.24 (166.16)12.00p = 0.001ηp2 = 0.185
IL-7, F1, 53398.52 (488.85)141.26 (147.92)12.91p < 0.001ηp2 = 0.196
GM-CSF, F1, 53412.78 (429.38)168.43 (161.61)14.99p < 0.001ηp2 = 0.220
GRO/KC, F1, 53291.18 (200.57)193.62 (142.54)6.00p = 0.018ηp2 = 0.102
MIP-1α, F1, 53115.89 (121.43)57.20 (50.43)8.03p = 0.006ηp2 = 0.132
VEGF, F1, 52456.43 (383.96)250.07 (265.76)5.83p = 0.019ηp2 = 0.101
MCP-1, F1, 532014.98 (1476.12)1321.93 (689.83)8.10p = 0.006ηp2 = 0.133
Table 6. Overview of sex main effects for plasma inflammatory analytes from factorial ANOVA analyses for IL-1β, IL-7, GM-CSF, and MCP-1, including means (M) and standard deviations (SD).
Analyte, dfMale
M (SD)
Female
M (SD)
F-Valuep-ValueEffect Size
p2)
IL-1β, F1, 53372.48 (461.38)223.07 (186.10)4.60p = 0.037ηp2 = 0.080
IL-7, F1, 53351.46 (511.02)191.94 (170.06)5.16p = 0.027ηp2 = 0.089
GM-CSF, F1, 53365.50 (450.16)218.91 (183.12)5.59p = 0.022ηp2 = 0.095
MCP-1, F1, 532091.35 (1451.34)1274.37 (710.64)9.83p = 0.003ηp2 = 0.157

