Article

Simulation and Experimental Characterization of Microscopically Accessible Hydrodynamic Microvortices

1
Center for Biosignatures Discovery Automation, Biodesign Institute, Arizona State University, Tempe, AZ 85287, USA
2
School of Biological and Health Systems Engineering, Arizona State University, Tempe, AZ 85287, USA
3
School of Electrical, Computer and Energy Engineering, Arizona State University, Tempe, AZ 85287, USA
*
Author to whom correspondence should be addressed.
Micromachines 2012, 3(2), 529-541; https://doi.org/10.3390/mi3020529
Submission received: 26 April 2012 / Revised: 22 May 2012 / Accepted: 8 June 2012 / Published: 15 June 2012
(This article belongs to the Special Issue Micro Flow Controllers)

Abstract

:
Single-cell studies of phenotypic heterogeneity reveal more information about pathogenic processes than conventional bulk-cell analysis methods. By enabling high-resolution structural and functional imaging, a single-cell three-dimensional (3D) imaging system can be used to study basic biological processes and to diagnose diseases such as cancer at an early stage. One mechanism that such systems apply to accomplish 3D imaging is rotation of a single cell about a fixed axis. However, many cell rotation mechanisms require intricate and tedious microfabrication, or fail to provide a suitable environment for living cells. To address these and related challenges, we applied numerical simulation methods to design new microfluidic chambers capable of generating fluidic microvortices to rotate suspended cells. We then compared several microfluidic chip designs experimentally in terms of: (1) their ability to rotate biological cells in a stable and precise manner; and (2) their suitability, from a geometric standpoint, for microscopic cell imaging. We selected a design that incorporates a trapezoidal side chamber connected to a main flow channel because it provided well-controlled circulation and met imaging requirements. Micro particle-image velocimetry (micro-PIV) was used to provide a detailed characterization of flows in the new design. Simulated and experimental results demonstrate that a trapezoidal side chamber represents a viable option for accomplishing controlled single cell rotation. Further, agreement between experimental and simulated results confirms that numerical simulation is an effective method for chamber design.

1. Introduction

1.1. Single Cell Analysis with Multiple Perspective Imaging

Cell biology and microbiology applications that require the ability to quantify genotype, gene expression, and phenotype at the single cell level are becoming increasingly important. Single-cell studies can quantify the heterogeneity among cells within populations, including isogenic cell populations. Historically, biological research relied primarily on bulk cell studies, which quantify averaged cellular parameters and responses. However, ensemble averaged measurements fail to explain how a subgroup of cells respond or survive in the face of a sudden perturbation such as a rapid environmental change or the administration of a drug. Quantification of intercellular differences through single cell analyses can offer insight into the benefits or consequences of cell population heterogeneity [1]. Some fatal diseases develop from the single cell level, and phenotypic heterogeneity studies may be able to shed light on the mechanisms underlying pathogenesis and pathophysiology [2]. For example, in the early stages of neoplastic transformation, the population of malignant tumor cells is very limited. However, rapid cell growth and accumulation will eventually damage normal tissue and the immune system [3]. Therefore, the detection of rare, mutated, or otherwise aberrant cells is important for the early diagnosis and treatment of cancer.
Cell morphology provides useful information for diagnosing diseases. For example, irregular nuclear size, shape, and internal chromatin distribution can suggest cancer initiation and portend progression [4]. Conventional optical microscopy is two-dimensional (2D) and does not capture the true 3D structures of cells and their internal organelles [5]. This limitation impedes quantitative investigations of cellular morphology. A cell’s internal structures may overlap in 2D images, compromising accurate measurement. As a result, the precise three-dimensional (3D) volume of each component can only be estimated. Further, intracellular features oriented parallel to the optical axis may be poorly resolved or overlooked entirely. Confocal microscopy represents an imaging alternative that does allow for the reconstruction of 3D structures, but has other drawbacks in the context of cell studies. Specifically, confocal microscopy suffers due to chromatic and spherical aberrations as well as problems with fluorescent probes (e.g., photobleaching and phototoxicity) [6].
Multiple-perspective microscopy accesses 3D cellular structure with fewer drawbacks and also enables volumetric image reconstruction. For example, 3D single cell computed tomography (Cell-CT, VisionGate, Phoenix, Arizona) acquires a series of pseudoprojections taken by optical microscopy from various angles, and applies the filtered backprojection method to reconstruct a 3D image of the cell. The method is similar to x-ray computed tomography (CT) [7]. To enable multiple-perspective projection acquisition, a cell must rotate relative to a fixed axis perpendicular to the optical axis (viewing direction). Current commercial Cell-CT systems mechanically rotate a capillary tube that contains fixed cells, immobilized in an optical carrier gel [8]. The cylindrical capillary tube wall necessitates a non-biocompatible refractive index-matching optical gel to avoid spatial distortions in the projection images. As a result, only fixed cells can be examined. Many important investigations, such as functional imaging and evaluation of dynamic drug responses, are prohibited. To solve the problems inherent to current approaches, we propose a new live-cell rotation method based on a microfluidic device with a flat imaging surface and biocompatible environment as shown in Figure 1.
Figure 1. Schematic illustrating cell rotation in a trapezoidal side chamber. Illumination is provided by a broadband light source and condenser. A cell is stabilized at the desired position by optical trapping in a trapezoidal side chamber. Projection images may be acquired at different angles as the cell is rotated by hydrodynamic forces.
Micromachines 03 00529 g001

1.2. Existing Techniques for Single Cell Rotation

On the micro-scale level, mechanical micromanipulation provides precise user control with multiple degrees of freedom for orienting single cells [9]. However, mechanical micromanipulation methods apply direct physical contact that may contaminate and damage cells or introduce undesirable physical and biological responses from cells [10]. A more viable approach is microfluidic manipulation whereby single cells can be analyzed in real time within a controlled environment free of direct cellular contact with physical manipulators [11]. Microfluidic devices are established tools for chemical, biochemical and biological studies. They offer favorable surface area-to-volume ratios and may achieve well-understood laminar flows [12]. More specifically, microfluidic rotation mechanisms that use ultrasound, dielectrophoretic forces, electric fields, and Lorentz forces are well studied [10,13]. However, these methods usually require intricate equipment configurations and call for extensive microfabrication to produce micro-actuators, micro-electrodes and other features. Shelby et al. introduced the use of microvortex rotation using hydrodynamic forces achieved with relatively simple instrumentation and microfabrication processes [14,15]. Microvortex rotation refers to spinning microscopic objects in recirculating flows or vortices that are formed when flow detachment occurs in a fluid. Such vortices are an inherently unstable particle traps which may eject the entrained object. To counter this instability, a stabilizing force may be applied to hold the object within the rotating vortex. Such a force can be exerted with a simple optical tweezer system [16,17]. For example, Shelby et al. relied on a combination of microvortex and stabilizing optical trap within a diamond-shaped side chamber attached to a long, straight primary flow channel. Using high flow rates in the primary channel, the microvortex generated by flow detachment in the side chamber enabled the investigation of high radial acceleration and shear stress applied to single cells. These relatively high shear stress levels are of interest because they may induce cellular stress responses [18]. For multiple perspective microscopy, low flow rates and low shear stress in the microvortex provide a more favorable environment including low shear stress on the rotated cell [10]. However, the diamond-shaped microvortex chamber is not compatible with multiple perspective imaging because it has a sharp corner facing the image acquisition surface. We designed and tested an alternative trapezoidal side chamber with a flat surface facing the objective lens in order to address the requirements for high-magnification imaging.

1.3. Investigations of Flow Profiles in Microvortex Systems

We use Computational Fluid Dynamics (CFD) to facilitate microvortex chamber geometry design and flow field simulation. CFD was previously used to evaluate and compare diamond- and double diamond-shaped side chamber designs [19]. Further, Bahk et al. applied CFD to develop a micro-centrifuge device with a rectangular side chamber [20].
Researchers have also performed experimental characterization on microvortex flow fields. Shelby et al. established angular velocity profiles by tracking the change in backscattered laser light from an ablated polystyrene particle and the change in fluorescent signal from a single cell [19]. Flow tagging velocimetry (FTV) presents another alternative to characterize the flow profile [21]. However, FTV requires a more complicated setup that includes an additional pulse laser to excite photoactivated fluorophore in the flow. Further, FTV is incapable of sub-micron resolution. Mapping 2D flow profiles using FTV also requires additional automation and computational reconstruction techniques, since FTV only measures one-dimensional velocity at any instant [21].
We applied micro particle-image velocimetry (µ-PIV) to investigate recirculating flows in microscale side chambers. Adrian introduced the first µ-PIV systems to demonstrate slow flow measurement with micrometer resolution [22]. Later, the introduction of Nd:YAG lasers enabled the characterization of rapid flows on the order of m/s [23]. Micro particle-image velocimetry then became a popular method for understanding detailed fluid motion inside of microfluidic channels [23]. One relevant study applied µ-PIV to investigate the microvortex produced by active microcentrifugation with electrodes [24]. Later studies showed further progress toward effective µ-PIV investigation of microvortices [20]. On the millimeter scales, Ota et al. applied two parallel counter flows to generate circulation, and the associated µ-PIV work demonstrated rotational velocity profiles inside the chamber [25]. We present the first experimental data describing fluid velocity profiles of microvortices in a side chamber.

2. Methods

2.1. Computational Modeling

To understand the effect of side chamber geometry, a first set of simulations was performed to characterize rectangle-shaped, isosceles trapezoid-shaped, and diamond-shaped side chambers, each attached to a long, straight channel. All CFD simulations were performed in 2D. The simulated main channels were 700 µm long and 50 µm high. The opening between each channel and chamber was 40 µm. The trapezoid- and rectangle-shaped side chambers were 60 µm high, and the diamond-shaped side chamber was 130 µm high. The longer parallel side of the trapezoid-shaped side chamber was 140 µm. The lower half of the diamond-shaped side chamber was identical to the trapezoid-shaped chamber.
Channel and side chamber geometries were meshed with Gambit (ANSYS, Canonsburg, PA). 5,125 structured quadrilateral elements were applied to mesh the main flow channel. Since the microvortex forms within the side chamber, node density was set to 1 µm/node in each side chamber to ensure detailed grid resolution there. Structured quadrilateral meshes were applied for the rectangle-shaped side chamber, which resulted in 2,400 quadrilateral elements. A combination of unstructured quadrilateral and triangular meshing was applied for the diamond-shaped and trapezoid-shaped side chambers. The diamond-shaped chamber comprised 10,151 elements, while the trapezoid-shaped chamber comprised 5,360 elements
Fluent 6.2 (ANSYS, Canonsburg, PA), was used to simulate 2D velocity profiles in the chambers. The SIMPLE algorithm was applied to couple pressure and velocity, a no-slip boundary condition was applied at the walls, and water was used as the working fluid. A uniform 20 µm/s inflow velocity was applied at the inlet and an outflow boundary condition was applied at the outlet for all three cases in the first set of simulations. It is noteworthy that uniform inflow velocities ranging from 0.01 µm/s to 1 m/s, all of which correspond to flows within the laminar regime, were also examined for a subset of the side chamber designs. Over that range, there were no apparent changes to the shapes of the side chamber flow structures.
We compared simulation results for the different chamber geometries and, based on performance and optical accessibility, we selected the trapezoid-shaped side chamber as the most advantageous design. For the second set of simulations, the trapezoid-shaped design was further optimized based on our design requirements, including ease of prototyping. More specifically, the chamber opening was made as large as possible (so as to facilitate cell entry and nourishment, and also to avoid sharp corners that are problematic for microfabrication), without elevating the chamber opening to main channel height ratio above 0.8. That value was identified as a maximum conservative threshold, based on previous simulations, which must not be exceeded in order for the microvortex to form. Further, the chamber height was made as large as possible (again to avoid sharp corners), without surpassing the main channel height, beyond which point the microvortex position within the chamber becomes problematic for imaging (again based on previous simulations). In the final design, the main channel was made 800 µm long and 70 µm high, and the trapezoidal side chamber was made 70 µm high, with a 140 µm longer side and a 56 µm shorter side. The main flow channel was meshed with 8,890 structured quadrilateral elements, and the chamber was meshed with 7,436 unstructured quadrilateral and triangular elements. A uniform 23.8 cm/s inflow velocity was applied at the inlet for this second set of simulations and results were then compared with experimental data. It is noteworthy that geometric optimization of the chamber in this application was driven by fairly simple design constraints, so advanced geometric optimization methods were not required; however, in cases characterized by more complex and demanding constraints, successful design may benefit from if not require a highly capable geometric optimization strategy [26].

2.2. Microfabrication

Based on the optimized geometry, a microfluidic device was fabricated in polydimethylsiloxane (PDMS) with standard soft lithography methods using a 60-µm-thick KMPR mold. The fabrication process is summarized as follows: First, PDMS monomer and cross-linker were mixed at a ratio of 10:1. Second, the mixture was degassed in a vacuum chamber for at least 30 min until all air bubbles disappeared. PDMS was poured into the KMPR mold and cured overnight. After curing, inlet and outlet holes were created by punching with an 18-gage stainless steel tube. PDMS chips and cover glasses were treated by a plasma cleaner (PDC-32G, Harrick Plasma, Ithaca, NY) for 40 s. After attaching the treated surfaces together, the PDMS layer was permanently bonded to the microscope cover glass.

2.3. µ-PIV Validation Experiments

A volumetric flow rate of 1 µL/s was supplied by a gear pump (milliGAT, GlobalFIA, Fox Island, WA), which provided an approximately uniform flow profile at the inlet of the microfluidic device with a mean flow rate of 23.8 cm/s. Fluorescent particles of 1-µm diameter (PSL, TSI Inc., St. Paul, MN) were diluted 10x before seeding. A 2D µ-PIV system (Micro-PIV, TSI Inc., St. Paul, MN) was used to obtain a series of consecutive image pairs within the flow field. A schematic of the experimental setup is shown in Figure 2. The µ-PIV system is based on an inverted microscope (Eclipse Lv100, Nikon, Melville, NY). The microfluidic device was placed over the objective lens of the inverted microscope. A CCD camera (PowerView Plus 2M, TSI Inc., St. Paul, MN) was used to capture images with a 1,600 × 1,200 pixel resolution. The illumination and excitation source was a 532 nm Nd:YAG laser (Solo PIV, New Wave, Fremont, CA). A TSI synchronizer (model 610035, TSI Inc., St. Paul, MN) was used to synchronize the camera and laser with a time resolution of 1 ns.
A filter cube containing a dichroic mirror filter and a barrier filter was integrated with the inverted microscope. The light path in the system is shown in Figure 2. The 532 nm excitation laser light was reflected by the dichroic mirror to the microfluidic device. Fluorescence at wavelengths of 560 nm and above (with at least 80 percent efficiency) was passed through the dichroic mirror onto the detector. A barrier filter was used to block light at the laser wavelength, so as to prevent it from reaching the camera or eyepiece.
Using a 20×, 0.45 NA objective lens, the entire trapezoidal side chamber could be seen within the field of view. The focal plane was adjusted to the central plane of the microfluidic device because the particle density was highest in this plane. In addition, PIV particles can slowly recirculate near the flow channel and microchamber walls, causing the particles to lag behind the flow [27]. This effect is minimal at the central plane though.
Figure 2. Micro particle-image velocimetry experimental setup. Inset shows trapezoidal side chamber.
Micromachines 03 00529 g002
A set of 400 image pairs was captured for each experimental run. The time separation between images in a pair was set to 70 µs to ensure that particle displacements within the trapezoidal chamber were less than 10 pixels. Raw images were processed after capture using DaVis software (LaVision, Ypsilanti, MI). Background noise was first removed by subtracting the mean intensity of 400 image pairs from each image. A mask with the shape of the trapezoidal side chamber was applied to exclude everything outside of the flow region. Velocity vectors were calculated using a multi-pass, recursive cross-correlation algorithm with 50 percent grid overlap. In this study, the initial interrogation window was set to 64 × 64 pixels, and the final window was set to 32 × 32 pixels. The size of the initial interrogation window was chosen as 64 × 64 pixels to accurately capture the range of velocities within the chamber. However, this choice of interrogation window size resulted in an experimental design tradeoff favoring measurement accuracy within the chamber at the expense of measurement accuracy in the main flow channel, where higher velocities were present. A Gaussian weighting function was also applied to the correlation surfaces calculated for each interrogation window in order to deemphasize outliers.

3. Results

3.1. CFD Simulation

Three different side chamber geometries were simulated and performance was compared in terms of vorticity and vortex position. Vorticity is the curl of the velocity field V ( Micromachines 03 00529 i001
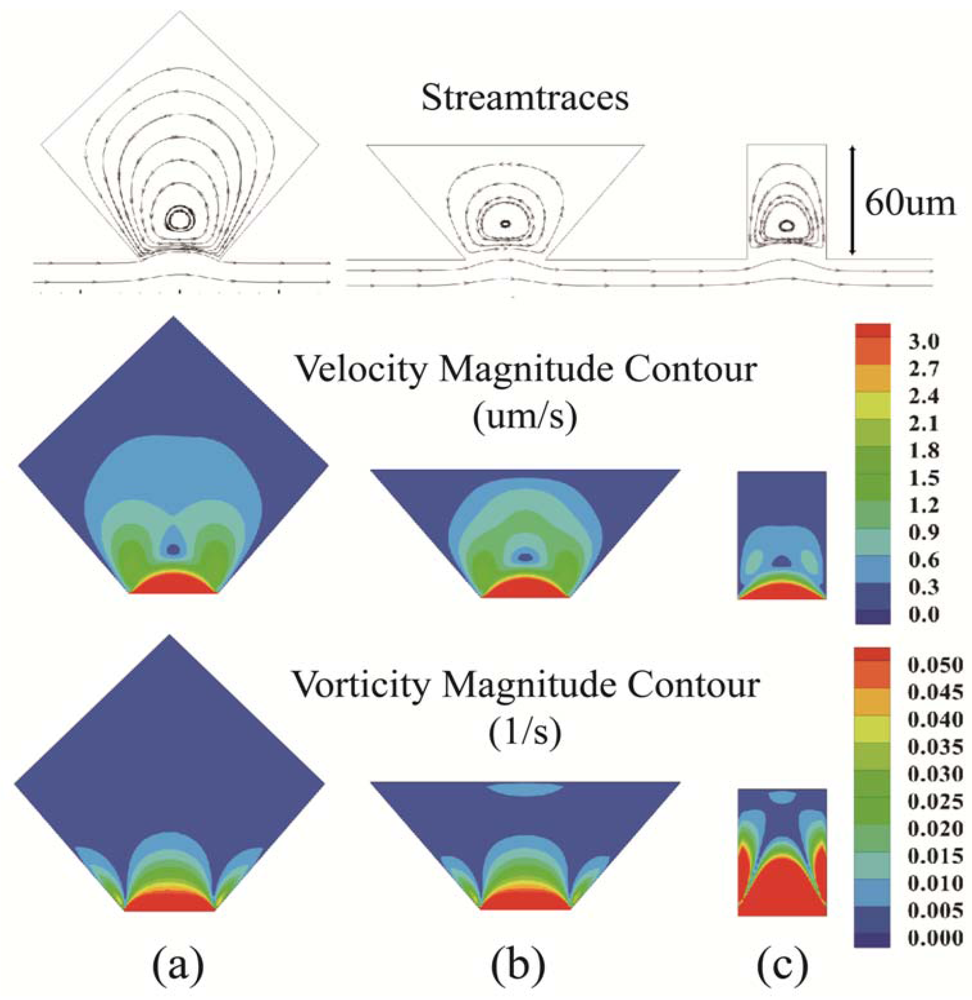
), which represents the rotation of a fluid element in the flow field [28]. Contour plots of vorticity for the three chamber designs are shown in Figure 3 along with contour plots of velocity magnitude and streamlines. The ratio of chamber opening to channel height was 0.8 for all three cases. The geometries of cases (a) and (b) shared lower sides with the same slope, and case (b) had the same chamber height as case (c). The flow direction in the main channel for all three geometries was from left to right, and flow circulation in the side chambers was in a counterclockwise direction. Flow detachment from the channel into the side chamber, forming the microvortices, was apparent in the closed streamline paths.
Figure 3. Columns show CFD simulations of the diamond-shaped (a), trapezoid-shaped (b), and rectangle-shaped (c) chamber designs. The first row shows flow streamlines, the second row shows velocity magnitude contours, and the third row shows vorticity magnitude contours. All results correspond to an inlet flow velocity of 20 µm/s.
Micromachines 03 00529 g003
In order to create a microscopically accessible hydrodynamic microvortex for multiple-perspective imaging, a flat side plane parallel to the main channel is desirable. The diamond-shaped side chamber with a corner at the imaging surface does not provide imaging accessibility. Rectangular and trapezoidal side chambers on the other hand both provide excellent optical access. However, for the same chamber opening size, the trapezoid-shaped chamber offers superior accessibility for imaging. The vortex center of the trapezoidal side chamber is further away from the main channel than the rectangular one. The position of the vortex center is an important parameter since further displacement from the main flow channel, toward the imaging surface, can improve rotational stability and decrease the likelihood of a cell being dragged out of the microchamber and into the high-velocity main channel. The trapezoidal chamber displaced the vortex center 6.3% closer to the imaging surface than the rectangular chamber. Total circulation Micromachines 03 00529 i002, the line integral of the tangential velocity component about the boundary of the microvortex, determines the strength of the vortex, and is directly related to the size and shape of the chamber [28]. The value of Micromachines 03 00529 i002 is calculated as:
Micromachines 03 00529 i003
The trapezoidal chamber achieves 61 percent more circulation than the rectangular chamber. One explanation may be that the obtuse angles (sharper corners) at the channel neck of the trapezoidal chamber separate more flow from the main flow channel than the right angles of the rectangle-shaped side chamber. Furthermore, the vorticity contours in Figure 3 indicate that the vortex center for a rectangular chamber is located at a point surrounded by maximum vorticity, which requires stronger trapping force to prevent the cell being dragged into the main flow channel. Accordingly, we selected the trapezoidal chamber as the best design.

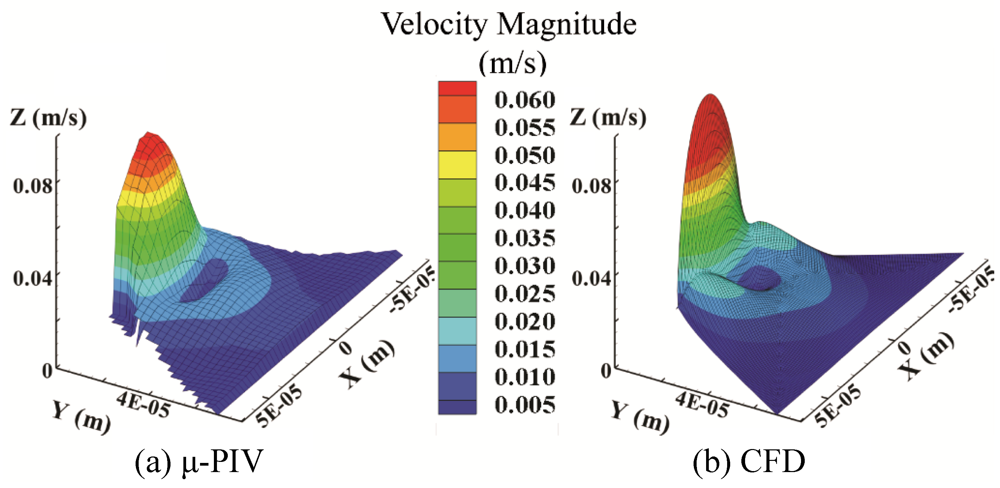
3.2. Quantification and Comparison of Flow Profiles in a Trapezoidal Side Chamber

A comparison of the velocity and vorticity magnitude contours from µ-PIV experiments and simulations using the trapezoidal chamber is shown in Figure 4. For an inlet flow velocity of 23.8 cm/s in the positive x direction, microvortices can be observed in both experimental (a) and CFD (b) data. The velocity fields describe a counter-clockwise rotation inside of the chambers for both cases. The simulated and measured velocity magnitude contour plots both demonstrate a series of concentric rings. The vortex center is the point in the circulation where velocity is zero, within the deep blue low velocity region at the center of the ring patterns. The vorticity distribution, the position of the vortex center, and the velocity distribution are all very similar between the simulated and experimental results. There is a second, low-velocity region at the lower right corner of the trapezoid-shaped chamber in (a) because some particle aggregation occurred near that corner during the experiment.
Figure 4. Velocity and vorticity magnitude contours from µ-PIV (a) and CFD (b) for the trapezoid-shaped side chamber.
Micromachines 03 00529 g004
The velocity magnitude surface plots for both µ-PIV experimental data (a) and simulated data (b) are shown in Figure 5. The overall shapes of the experimental and simulated plots are similar. CFD yielded higher velocity magnitudes at the channel-chamber interface than µ-PIV. This may be explained by the velocity magnitude at the channel-chamber interface (the microchamber neck) being very high, possibly exceeding the maximum detectable µ-PIV pixel displacement for our experiments (32 pixels for the chosen window size). As described earlier in Subsection 2.3, this measurement shortcoming was allowed so that smaller displacements (sometimes sub-pixel) could be characterized well in side chamber microvortices, which were the focal point of this study.
Figure 5. Comparison between µ-PIV (a) and CFD (b) surface plots of velocity magnitude versus position.
Micromachines 03 00529 g005
In order to quantitatively compare the PIV results with CFD, a statistical analysis was performed. It is noteworthy that velocity magnitude in the trapezoid chamber was not normally distributed, so we applied a nonparametric data analysis that does not require data normality and provides the additional advantage of being robust to outliers. Specifically, the Kolmogorov-Smirnov two-sample test was used to test the null hypothesis that PIV and CFD velocity magnitudes were identical with respect to location and dispersion. First, we smoothed the CFD resolution to the µ-PIV level (2.88 µm/node) with Kriging interpolation [29]. Then we extracted and compared the velocity magnitudes from the region of interest for CFD and µ-PIV. We used SAS 9.2 (SAS Institute Inc., Cary, NC) to execute the statistical analysis, which yielded a Kolmogorov-Smirnov P-value of 0.18. Since 0.18 is larger than 0.05, the null hypothesis is not rejected. In other words, at a 5% significance level, there is insufficient evidence to reject the hypothesis that the PIV and CFD results were identical.

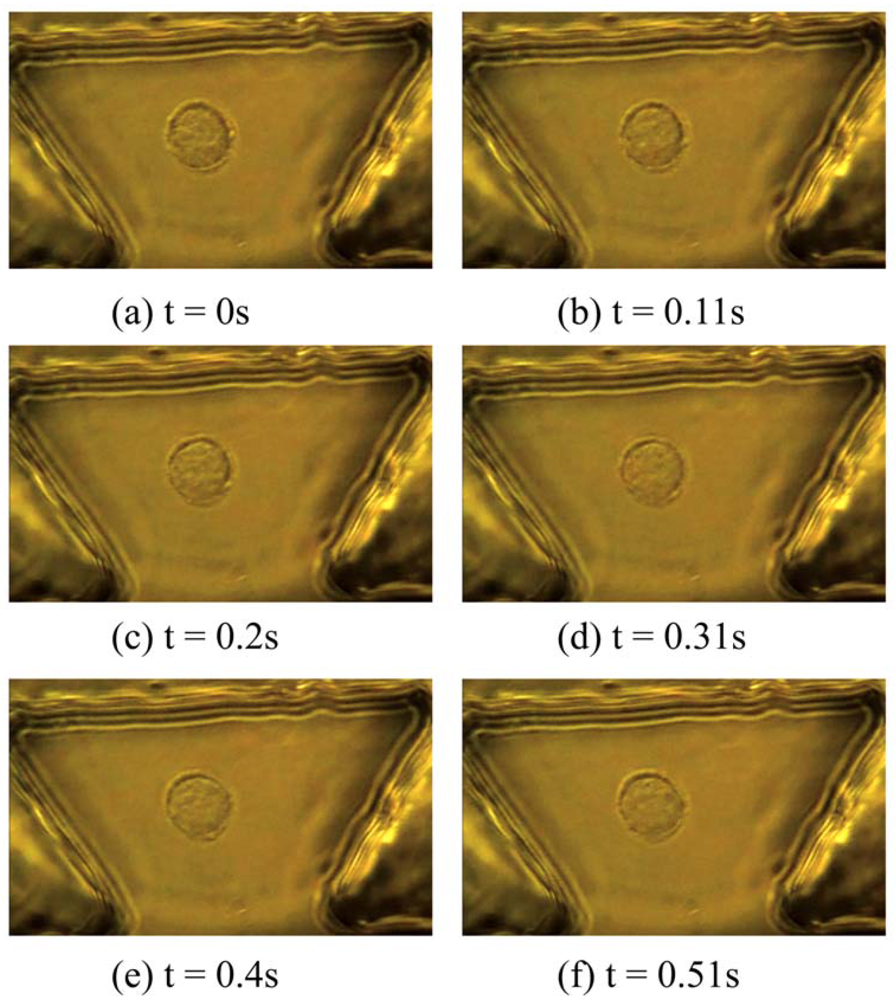
3.3. Rotation of Biological Cells in the Trapezoidal Side Chamber

To demonstrate the successful design and fabrication of the trapezoidal side chamber, pre-cancerous human esophageal epithelial cells cells were introduced into the chamber and rotated at controlled rates. A time series of images showing controlled rotation of a dysplastic esophageal epithelial cell (CP-C cell line) is provided in Figure 6. Rotation rates were monitored through simple manual image processing based on images acquired at 30 fps with a CCD camera (WAT-221S, Watec, New York, USA). Rotation rates ranging from 60 rpm to 120 rpm were achieved, and for a target rotation rate of 100 rpm a cell was rotated at 97 ± 3 rpm for a duration of 40 s.
Figure 6. Time series images demonstrating the controlled rotation of a CP-C cell through 180° over 0.51 s.
Micromachines 03 00529 g006

4. Discussion and Conclusions

The trapezoidal side chamber provides excellent optical access. Using an appropriate cell culture medium as the working fluid, the device can also provide a suitable environment for living cells. The chamber design is compatible with rotating single cells at a controllable rate, providing a viable image acquisition process for multiple-perspective imaging systems. Specifically, cells have been rotated within the chamber at rates ranging from 70 to 120 rpm in continued work, with a validated rotation rate accuracy of approximately +/− three percent. Future work will include advanced CFD model development, including modeling of both the trapped object and the optical trapping beam. The µ-PIV experiment can also be improved by using smaller tracing particles and a more advanced, perhaps elastic, particle tracking algorithm. Lastly, the realism and/or relevance of the experimental flow profile could be further enhanced by introducing a trapped microparticle or cell into the µ-PIV-monitored device.
This article presented a process, guided by numerical simulation, for designing microvortex side chambers. We selected the trapezoidal side chamber design for our application, after comparing performance among alternatives, because it provided the best optical access and microvortex center position. Our µ-PIV experimental approach was used to achieve a specifically purposed flow profile within a trapezoidal side chamber, which has not been proposed in other studies. The design process was further supported by simulation results, which agreed with µ-PIV results at the 95 percent confidence level, and the proposed design has now been used successfully to accomplish controlled rotation of real cells. Future work will include broader experimental cell studies and cell imaging, as well as more advanced computational studies that focus on other important fluid dynamic characteristics of the proposed chamber design, such as the shear stress profiles experienced by rotating cells under variable main channel flow conditions.

Acknowledgments

This research was supported in part by a grant from the W.M. Keck Foundation (D.R. Meldrum, PI).

References

  1. Avery, S.V. Microbial cell individuality and the underlying sources of heterogeneity. Nat. Rev. Microbiol. 2006, 4, 577–587. [Google Scholar] [CrossRef]
  2. Suresh, S.; Spatz, J.; Mills, J.P.; Micoulet, A.; Dao, M.; Lim, C.T.; Beil, M.; Seufferlein, T. Connections between single-cell biomechanics and human disease states: Gastrointestinal cancer and malaria. ActaBiomater. 2005, 1, 15–30. [Google Scholar]
  3. Loeb, L.A. Multiple mutations and cancer. Proc. Natl. Acad. Sci. USA 2003, 100, 776–781. [Google Scholar] [CrossRef]
  4. Nandakumar, V.; Kelbauskas, L.; Johnson, R.; Meldrum, D. Quantitative characterization of preneoplastic progression using single-cell computed tomography and three-dimensional karyometry. Cytometry 2011, 79A, 25–34. [Google Scholar] [CrossRef]
  5. Meyer, M.G.; Fauver, M.; Rahn, J.R.; Neumann, T.; Patten, F.W.; Seibel, E.J.; Nelson, A.C. Automated cell analysis in 2D and 3D: A comparative study. Pattern Recogn. 2009, 42, 141–146. [Google Scholar]
  6. Semwogerere, D.; Weeks, E.R. Confocal microscopy. Biomed. Eng. 2005, 23, 1–10. [Google Scholar]
  7. Fauver, M.; Seibel, E.; Rahn, J.R.; Meyer, M.; Patten, F.; Neumann, T.; Nelson, A. Three-dimensional imaging of single isolated cell nuclei using optical projection tomography. Opt. Express 2005, 13, 4210–4223. [Google Scholar]
  8. Miao, Q.; Rahn, J.R.; Tourovskaia, A.; Meyer, M.G.; Neumann, T.; Nelson, A.C.; Seibel, E.J. Dual-modal three-dimensional imaging of single cells with isometric high resolution using an optical projection tomography microscope. J. Biomed. Opt. 2009. [Google Scholar]
  9. Arai, F.; Kawaji, A.; Luangjarmekom, P.; Fukuda, T.; Itoigawa, K. Three-dimensional Bio-micromanipulation under the microscope. In Proceedings of the 2001 IEEE International Conference on Robotics and Automation, Seoul, Korea, 21–26 May 2001; 1, pp. 604–609.
  10. Lin, C.M.; Lai, Y.S.; Liu, H.P.; Chen, C.Y.; Wo, A.M. Trapping of bioparticles via microvortices in a microfluidic device for bioassay applications. Anal. Chem. 2008, 80, 8937–8945. [Google Scholar] [CrossRef]
  11. Lidstrom, M.E.; Meldrum, D.R. Life-on-a-chip. Nat. Rev. Microbiol. 2003, 1, 158–164. [Google Scholar] [CrossRef]
  12. Eriksson, E.; Enger, J.; Nordlander, B.; Erjavec, N.; Ramser, K.; Goksor, M.; Hohmann, S.; Nystrom, T.; Hanstorp, D. A microfluidic system in combination with optical tweezers for analyzing rapid and reversible cytological alterations in single cells upon environmental changes. Lab Chip 2007, 7, 71–76. [Google Scholar] [CrossRef]
  13. Brehm-Stecher, B.F.; Johnson, E.A. Single-cell microbiology: Tools, technologies, and applications. Microbiol. Mol. Biol. Rev. 2004, 68, 538–559. [Google Scholar] [CrossRef]
  14. Shelby, J.P.; Lim, D.S.W.; Kuo, J.S.; Chiu, D.T. High radial acceleration in microvortices. Nature 2003. [Google Scholar]
  15. Shelby, J.P.; Chiu, D.T. Controlled rotation of biological micro- and nano-particles in microvortices. Lab Chip 2004, 4, 168–170. [Google Scholar] [CrossRef]
  16. Ashkin, A.; Dziedzic, J.M.; Yamane, T. Optical trapping and manipulation of single cells using infrared-laser beams. Nature 1987, 330, 769–771. [Google Scholar]
  17. Neuman, K.C.; Block, S.M. Optical trapping. Rev. Sci. Instrum. 2004, 75, 2787–2809. [Google Scholar] [CrossRef]
  18. Liu, K.; Pitchimani, R.; Dang, D.; Bayer, K.; Harrington, T.; Pappas, D. Cell culture chip using low-shear mass transport. Langmuir 2008, 24, 5955–5960. [Google Scholar] [CrossRef]
  19. Shelby, J.P.; Mutch, S.A.; Chiu, D.T. Direct manipulation and observation of the rotational motion of single optically trapped microparticles and biological cells in microvortices. Anal. Chem. 2004, 76, 2492–2497. [Google Scholar] [CrossRef]
  20. Ha, J.B.; Bahk, Y.K.; Yoon, S.H.; Lee, J.H.; Jeong, E.H.; Yoon, S.Y.; Arakawa, T.; Ko, J.S.; Shin, B.S.; Kim, K.C.; Boo, J.S.; Shoji, S.; Go, J.S. Microfludic centrifuge of nano particles using rotating flow in a microchamber. In Proceedings of the Solid-State SensorsActuators and Microsystems ConferenceTRANSDUCERS 2007, Lyon, France, 10–14 June 2007; pp. 927–930.
  21. Shelby, J.P.; Chiu, D.T. Mapping fast flows over micrometer-length scales using flow-tagging velocimetry and single-molecule detection. Anal. Chem. 2003, 75, 1387–1392. [Google Scholar] [CrossRef]
  22. Santiago, J.G.; Wereley, S.T.; Meinhart, C.D.; Beebe, D.J.; Adrian, R.J. A particle image velocimetry system for microfluidics. Exp. Fluids 1998, 25, 316–319. [Google Scholar] [CrossRef]
  23. Raffel, M.; Willert, C.E.; Wereley, S.T.; Kompenhaus, J. Particle Image Velocimetry a Practical Guide, 2nd ed; Springer: Heidelberg, Germany, 2007. [Google Scholar]
  24. Qin, J.J.; Yeo, L.Y.; Friend, J.R. MicroPIV and micromixing study of corona wind induced microcentrifugation flows in a cylindrical cavity. Microfluid. Nanofluid. 2009, 8, 231–241. [Google Scholar]
  25. Ota, H.; Yamamoto, R.; Deguchi, K.; Tanaka, Y.; Kazoe, Y.; Sato, Y.; Miki, N. Three-dimensional spheroid-forming lab-on-a-chip using micro-rotational flow. Sens. Actuat. B Chem. 2010, 147, 359–365. [Google Scholar] [CrossRef]
  26. Yang, J.-T.; Huang, K.-J.; Lin, Y.-C. Geometric effects on fluid mixing in passive grooved micromixers. Lab Chip 2005, 5, 1140–1147. [Google Scholar] [CrossRef]
  27. Park, J.-S.; Song, S.-H.; Jung, H.-I. Continuous focusing of microparticles using inertial lift force and vorticity via multi-orifice microfluidic channels. Lab Chip 2009, 9, 939–948. [Google Scholar] [CrossRef]
  28. Fox, R.W.; Pritchard, P.J.; McDonald, A.T. Introduction to Fluid Mechanics, 7th ed; Wiley: Hoboken, NJ, USA, 2008; p. 181. [Google Scholar]
  29. Matheron, G. Principles of geostatistics. Econ. Geol. 1963, 58, 1246–1266. [Google Scholar] [CrossRef]

