Article

Dual-Wavelength Photoacoustic Computed Tomography with Piezoelectric Ring-Array Transducer for Imaging of Indocyanine Green Liposomes Aggregation in Tumors

1
State Key Laboratory of High Performance Complex Manufacturing, College of Mechanical and Electrical Engineering, Central South University, Changsha 410083, China
2
ULSO (Shanghai) Tech Co., Ltd., Shanghai 201821, China
3
Department of Biomedical Engineering, School of Basic Medical Science, Central South University, Changsha 410083, China
*
Authors to whom correspondence should be addressed.
These authors contributed equally to this work.
Micromachines 2022, 13(6), 946; https://doi.org/10.3390/mi13060946
Submission received: 25 May 2022 / Revised: 8 June 2022 / Accepted: 9 June 2022 / Published: 15 June 2022
(This article belongs to the Special Issue Piezoelectric Ultrasound Transducer for Biomedical Applications)

Abstract

:
Recently, indocyanine green (ICG), as an FDA-approved dye, has been widely used for phototherapy. It is essential to obtain information on the migration and aggregation of ICG in deep tissues. However, existing fluorescence imaging platforms are not able to obtain the structural information of the tissues. Here, we prepared ICG liposomes (ICG-Lips) and built a dual-wavelength photoacoustic computed tomography (PACT) system with piezoelectric ring-array transducer to image the aggregation of ICG-Lips in tumors to guide phototherapy. Visible 780 nm light excited the photoacoustic (PA) effects of the ICG-Lips and near-infrared 1064 nm light provided the imaging of the surrounding tissues. The aggregation of ICG-Lips within the tumor and the surrounding tissues was visualized by PACT in real time. This work indicates that PACT with piezoelectric ring-array transducer has great potential in the real-time monitoring of in vivo drug distribution.

1. Introduction

Cancer is a common public disease and has a high lethality rate [1]. It is critical to develop a non-invasive imaging method for imaging the structural information of tumors and the in vivo distribution of drugs. Photoacoustic (PA) imaging is a new biomedical non-invasive imaging modality due to its especially hybrid imaging characteristics [2]. It is based on the ultrasound wave that is excited by short pulse lasers and detected by the transducer. PA imaging combines the advantages of higher spatial ultrasonic resolution and richer optical contrast to provide tissue information with endogenous or exogenous agents, such as oxyhemoglobin (HbO2), deoxyhemoglobin (Hb), gold nanoparticles, and indocyanine green (ICG) [3,4,5,6]. Compared to ultrasound imaging, magnetic resonance imaging (MRI), X-ray computed tomography (X-ray CT), positron emission tomography (PET), and pure optical imaging (fluorescence imaging) [7,8], PA imaging has shown its unique advantages including higher spatial resolution, lower cost, richer optical contrast, and no radiation [9].
In the PA imaging system, there are several common types of ultrasound transducers [10], such as single-element transducers [11], handheld linear transducers [12], and curve-array or ring-array transducers [7,13,14,15]. Photoacoustic computed tomography (PACT), as a common form of PA imaging, has shown the excellent potential in clinical applications, including monitoring the circulating tumor cells [16], whole-body imaging for small animals [14], imaging for cancer and inflammation [13,14], therapy monitoring and molecular imaging [17]. To date, a variety of piezoelectric transducers with different geometries have been used in PACT systems, especially ring-array transducers [7,14,15,18,19]. Ring-array transducers can achieve high spatial resolution and rich optical contrast in deep tissues, due to their wide field of view (FOV) [14,20]. Thus, it is essential to develop a ring-array-based PACT system for biomedical imaging (e.g., molecular imaging) [6,21].
Nowadays, a wide range of PA contrast agents with excellent photothermal characteristics [6], such as indocyanine green (ICG) and gold nanoparticles [22,23,24], have been used for cancer treatment [25]. ICG, as a near-infrared (NIR) dye approved by the U.S. Food and Drug Administration (FDA) [26], has attracted tremendous attention in photothermal therapy, due to its phototherapeutic capability. However, the clinical use of ICG is limited because it is unstable in water and can be rapidly cleared in the liver. ICG liposomes (ICG-Lips) overcome these limitations with the advantages of improved solubility of ICG and prevention of degradation during administration [27,28]. To improve the photothermal effects of ICG-Lips, laser irradiation should be conducted according to the accumulation of ICG-Lips in the tumor. Therefore, a high-sensitivity PA imaging system for monitoring the dynamic distribution of ICG-Lips is desirable.
In this paper, we developed a dual-wavelength PACT system with the piezoelectric ring-array transducer to detect the ICG-Lips and assessed their distribution in the tumor. The engineered PACT system consisted of a 512-element ring-array transducer, an OPO laser, and a Verasonics data acquisition system. A 780-nm laser beam and a 1064-nm laser beam were used to obtain the in vivo distribution of ICG-Lips and the structural information of tumor tissues simultaneously. The results indicated that the PACT system enabled the real-time monitoring of ICG-Lips accumulation in tumors. Due to the non-invasiveness and high spatial resolution, our PACT system provides a convenient way to image ICG-Lips in tumors in real time and can be used as a promising imaging platform for phototherapeutic guidance.

2. Materials and Methods

2.1. Materials

Dipalmitoyl phosphatidylcholine (DPPC), cholesterol, and 1,2-distearoyl-sn-glycero-3-phosphoethanolamine-N-[amino(polyethylene glycol)2000] (DSPE-PEG-2000) were purchased from Xi’an Ruixi Biological Technology Co., Ltd., Xi’an, China.

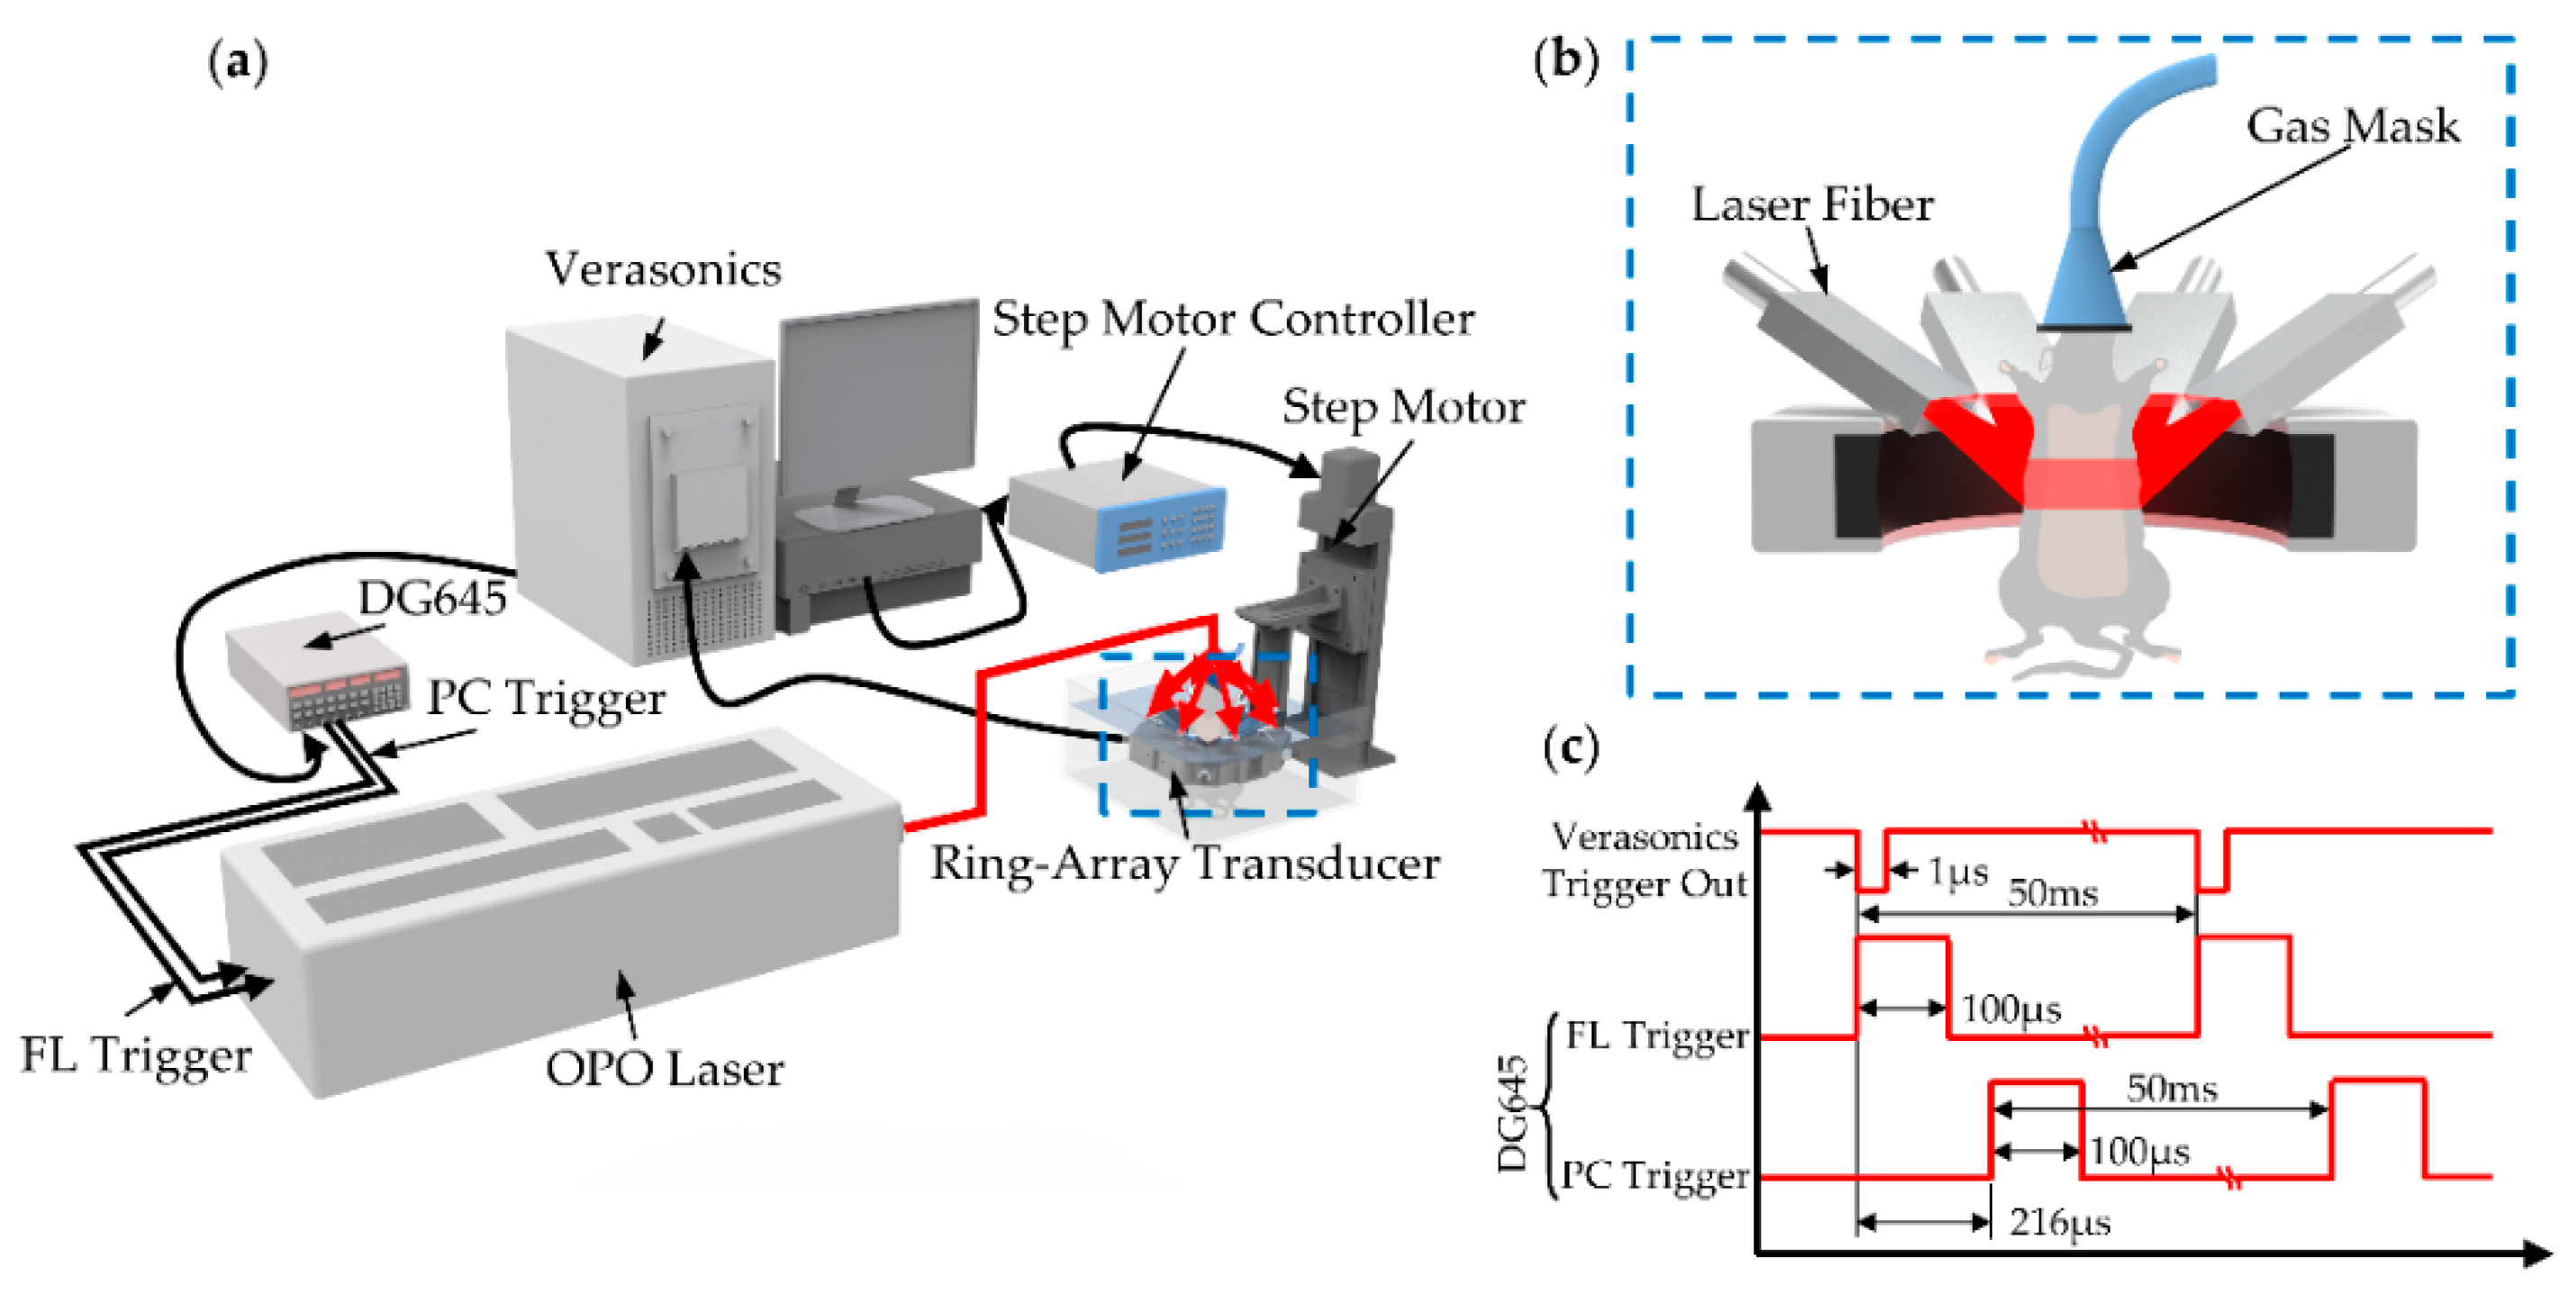
2.2. System Configuration

The PACT system is shown in Figure 1a. The system was controlled by the data acquisition system (Verasonics, Inc., Washington, USA, 256-channel). A trigger (1 µs pulse duration, 20 Hz), outputted from the data acquisition system, was received by DG645 digital delay/pulse generator (ThinkSRS, Inc., CA, USA). DG645 was triggered by falling edge and generated two triggers with a difference of 216 µs (Flash lamp (FL) trigger and Pockels cell (PC) trigger, 100 µs pulse duration, 20 Hz, Figure 1c). The SpitLight 600 OPO laser (Innolas Laser GmbH, 10 ns pulse duration, 20 Hz), triggered by FL trigger and PC trigger, was used as the irradiation source. For the tissues and ICG-Lips imaging, a 1064 nm laser beam and a 780 nm laser beam were transmitted separately through the optic-fiber light delivery. The light intensity at the wavelength of 1064 nm and 780 nm were ~ 7.38 mJ/cm2 and ~17.2 mJ/cm2, respectively, which was below the American National Standards Institute (ANSI) safety. To homogenize light spots, the eight-branch fiber was then placed evenly around the center of the ring-array transducer (ULSO, Inc., Shanghai, China) (Figure 1b).
We used a customed 512-element ring-array transducer for the PA signal detection. The transducer consisted of such four arc-shaped parts that they could form a complete ring-array with a diameter of 100 mm.
Due to the limited channels of the Verasonics system, we divided the ring-array into two parts with 2:1 multiplexing. Two laser firings were employed to form a complete 512-channel acquisition. The data acquisition system obtained the PA signal at a sampling rate of 62.5 MHz and processed the data with MATLAB (R2020a). At the same time, data transfer for imaging was operated at a rate of 4 frames/sec in real time.

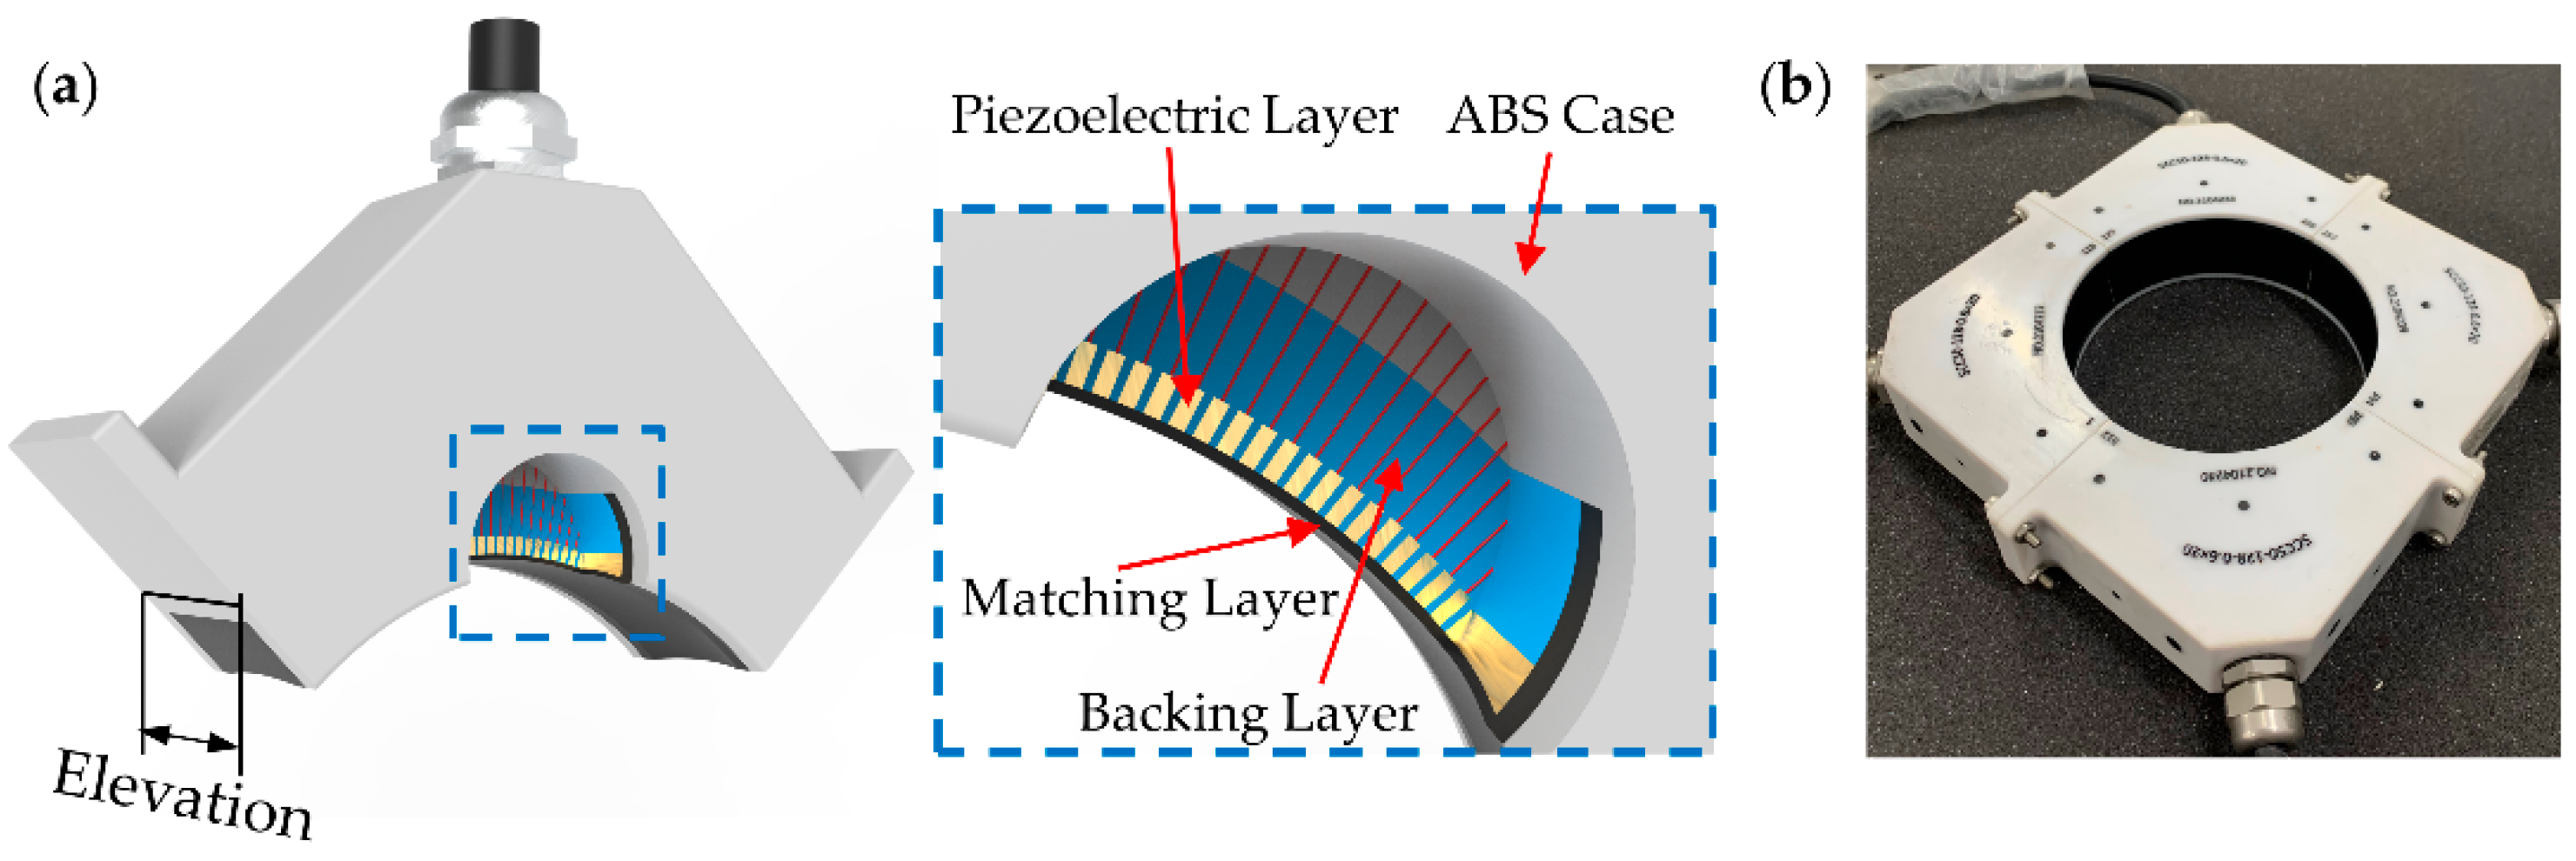
2.3. Design and Fabrication of Piezoelectric Ring-Array Transducer

A piezoelectric ring-array transducer (diameter, 100 mm) was proposed to achieve a self-focusing FOV. First, piezoelectric composites were split into multiple periodic arrays by the cutter with a kerf of 0.055 mm. The pitch between the elements was 0.618 mm. To achieve a self-focusing anxiety of 50 mm, the piezoelectric composite was machined into an arc (with a radius of 50 mm) in the elevation direction. The thickness of the piezoelectric composite was 0.3 mm, which was determined using the designed central frequency and sound velocity of the material. Next, the backing material was filled in the kerf between the array elements and behind the piezoelectric layer. The thickness of the acoustic matching layer was 0.13 mm. The configuration of the ring-array transducer is shown in Figure 2a. The ring-array transducer was composed of a matching layer, a backing layer, a piezoelectric composite, and an ABS case. Figure 2b shows the photograph of the piezoelectric ring-array transducer. The design parameters of the ring-array transducer are shown in Table 1. The properties of the piezoelectric layer are shown in Table 2.

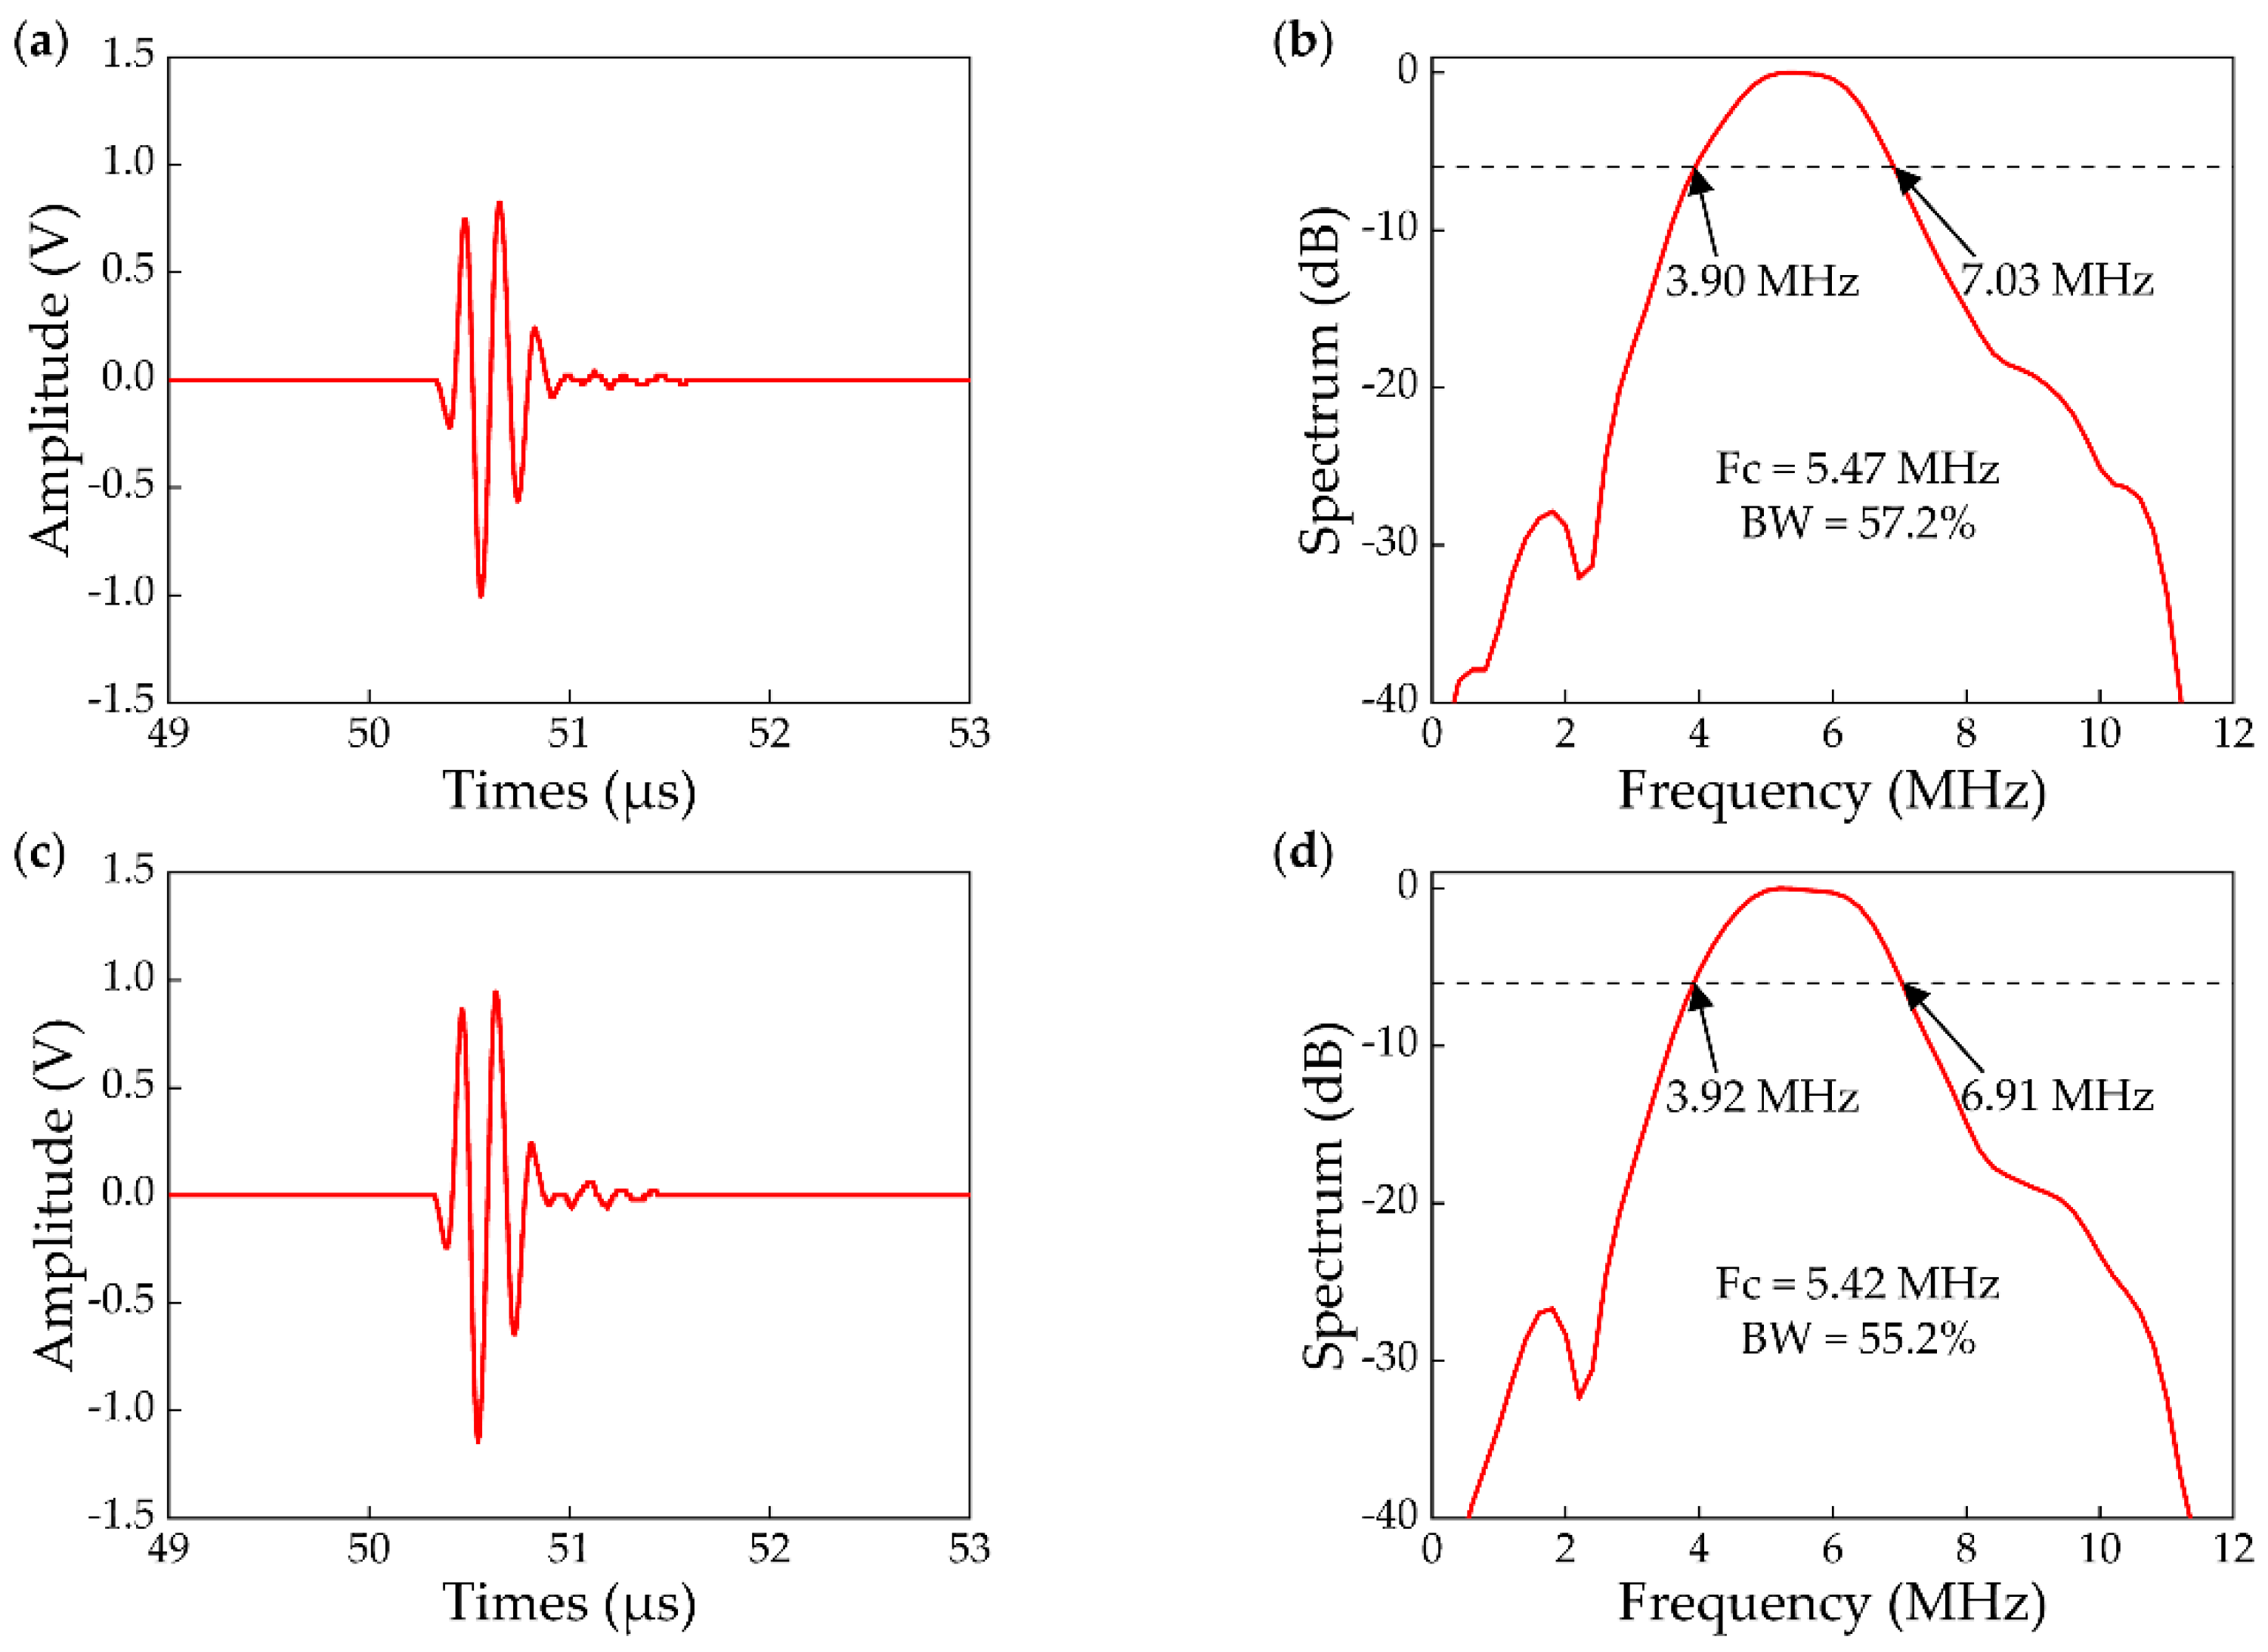
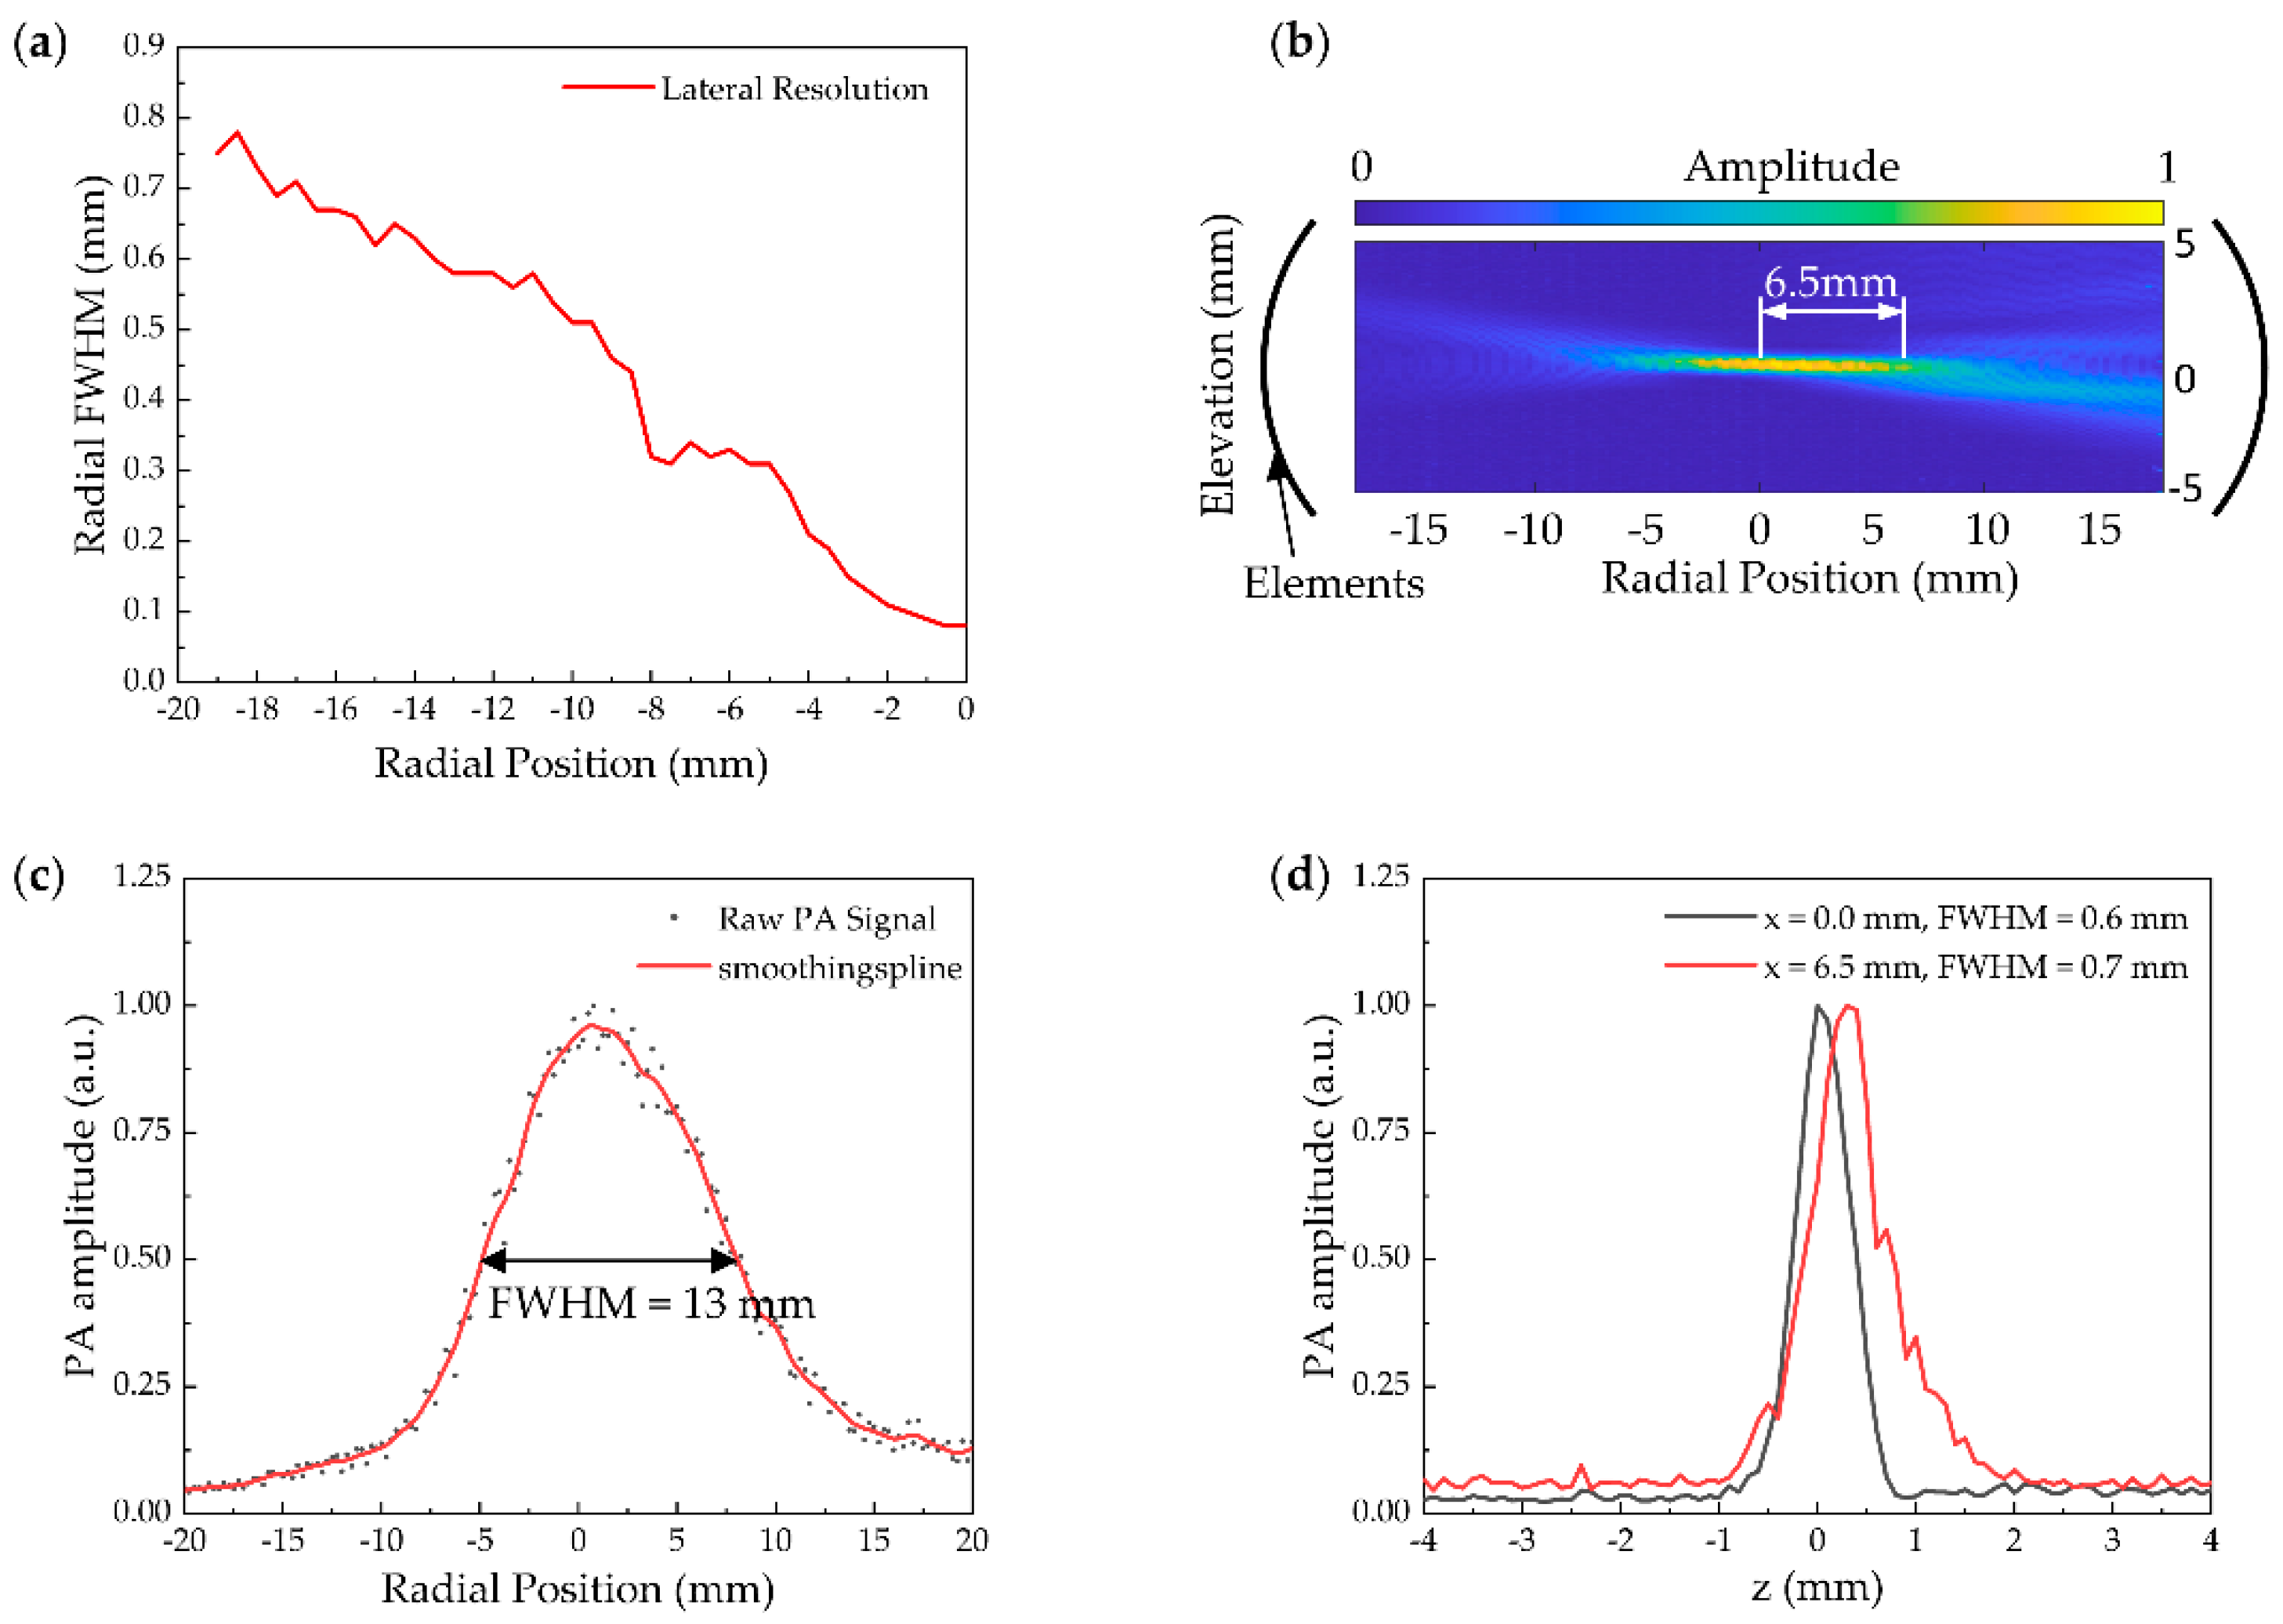
2.4. Transducer Characterization

For the basic parameter determination of the transducer, a test block (a ball with a diameter of 25 mm) was placed in the FOV and the impulse response waveforms of the ring-array transducer elements were recorded by the oscilloscope (Keysight, DSO2012A). In the measurements, electrical pulse was generated from a pulser/receiver (JSR, DPR300). The time-domain waveforms and their corresponding frequency spectra were detected. The transmission responses of the 25-th and 96-th elements are shown in Figure 3. The center frequency of the ring-array transducer was 5 ± 0.5 MHz, and the −6 dB bandwidth was greater than 55%.
Resolution and the FOV play a crucial role in the imaging quality [29]. For the characterization of the transducer, we measured the resolution and the FOV with ultrasound mode. To measure the lateral resolution, a short section tungsten filament of 100 µm diameter was placed vertically in the FOV. Radial scan movements had an increment of 0.5 mm. Figure 4a shows the trend of linear decrease in lateral resolution. The resolution decreases as the tungsten filament moves away from the center of the transducer.
The focused zone of the FOV was shaped like a disk. For FOV measurements, the tungsten filament was placed across in radial section of the ring-array. The step of radial movement was 0.25 mm and the elevation direction movement step was 0.1 mm. Figure 4b shows the cross-section passing through the center of the ring-array and cutting the ring-array into two semicircles. The full width at half maximum (FWHM) of the cross-section FOV focus area was 13 mm (Figure 4c). The FWHM was 0.6 mm in the center area (x = 0.0 mm) of the elevation direction, and 0.7 mm at the edge (x = 6.5 mm) of the focus area (Figure 4d).

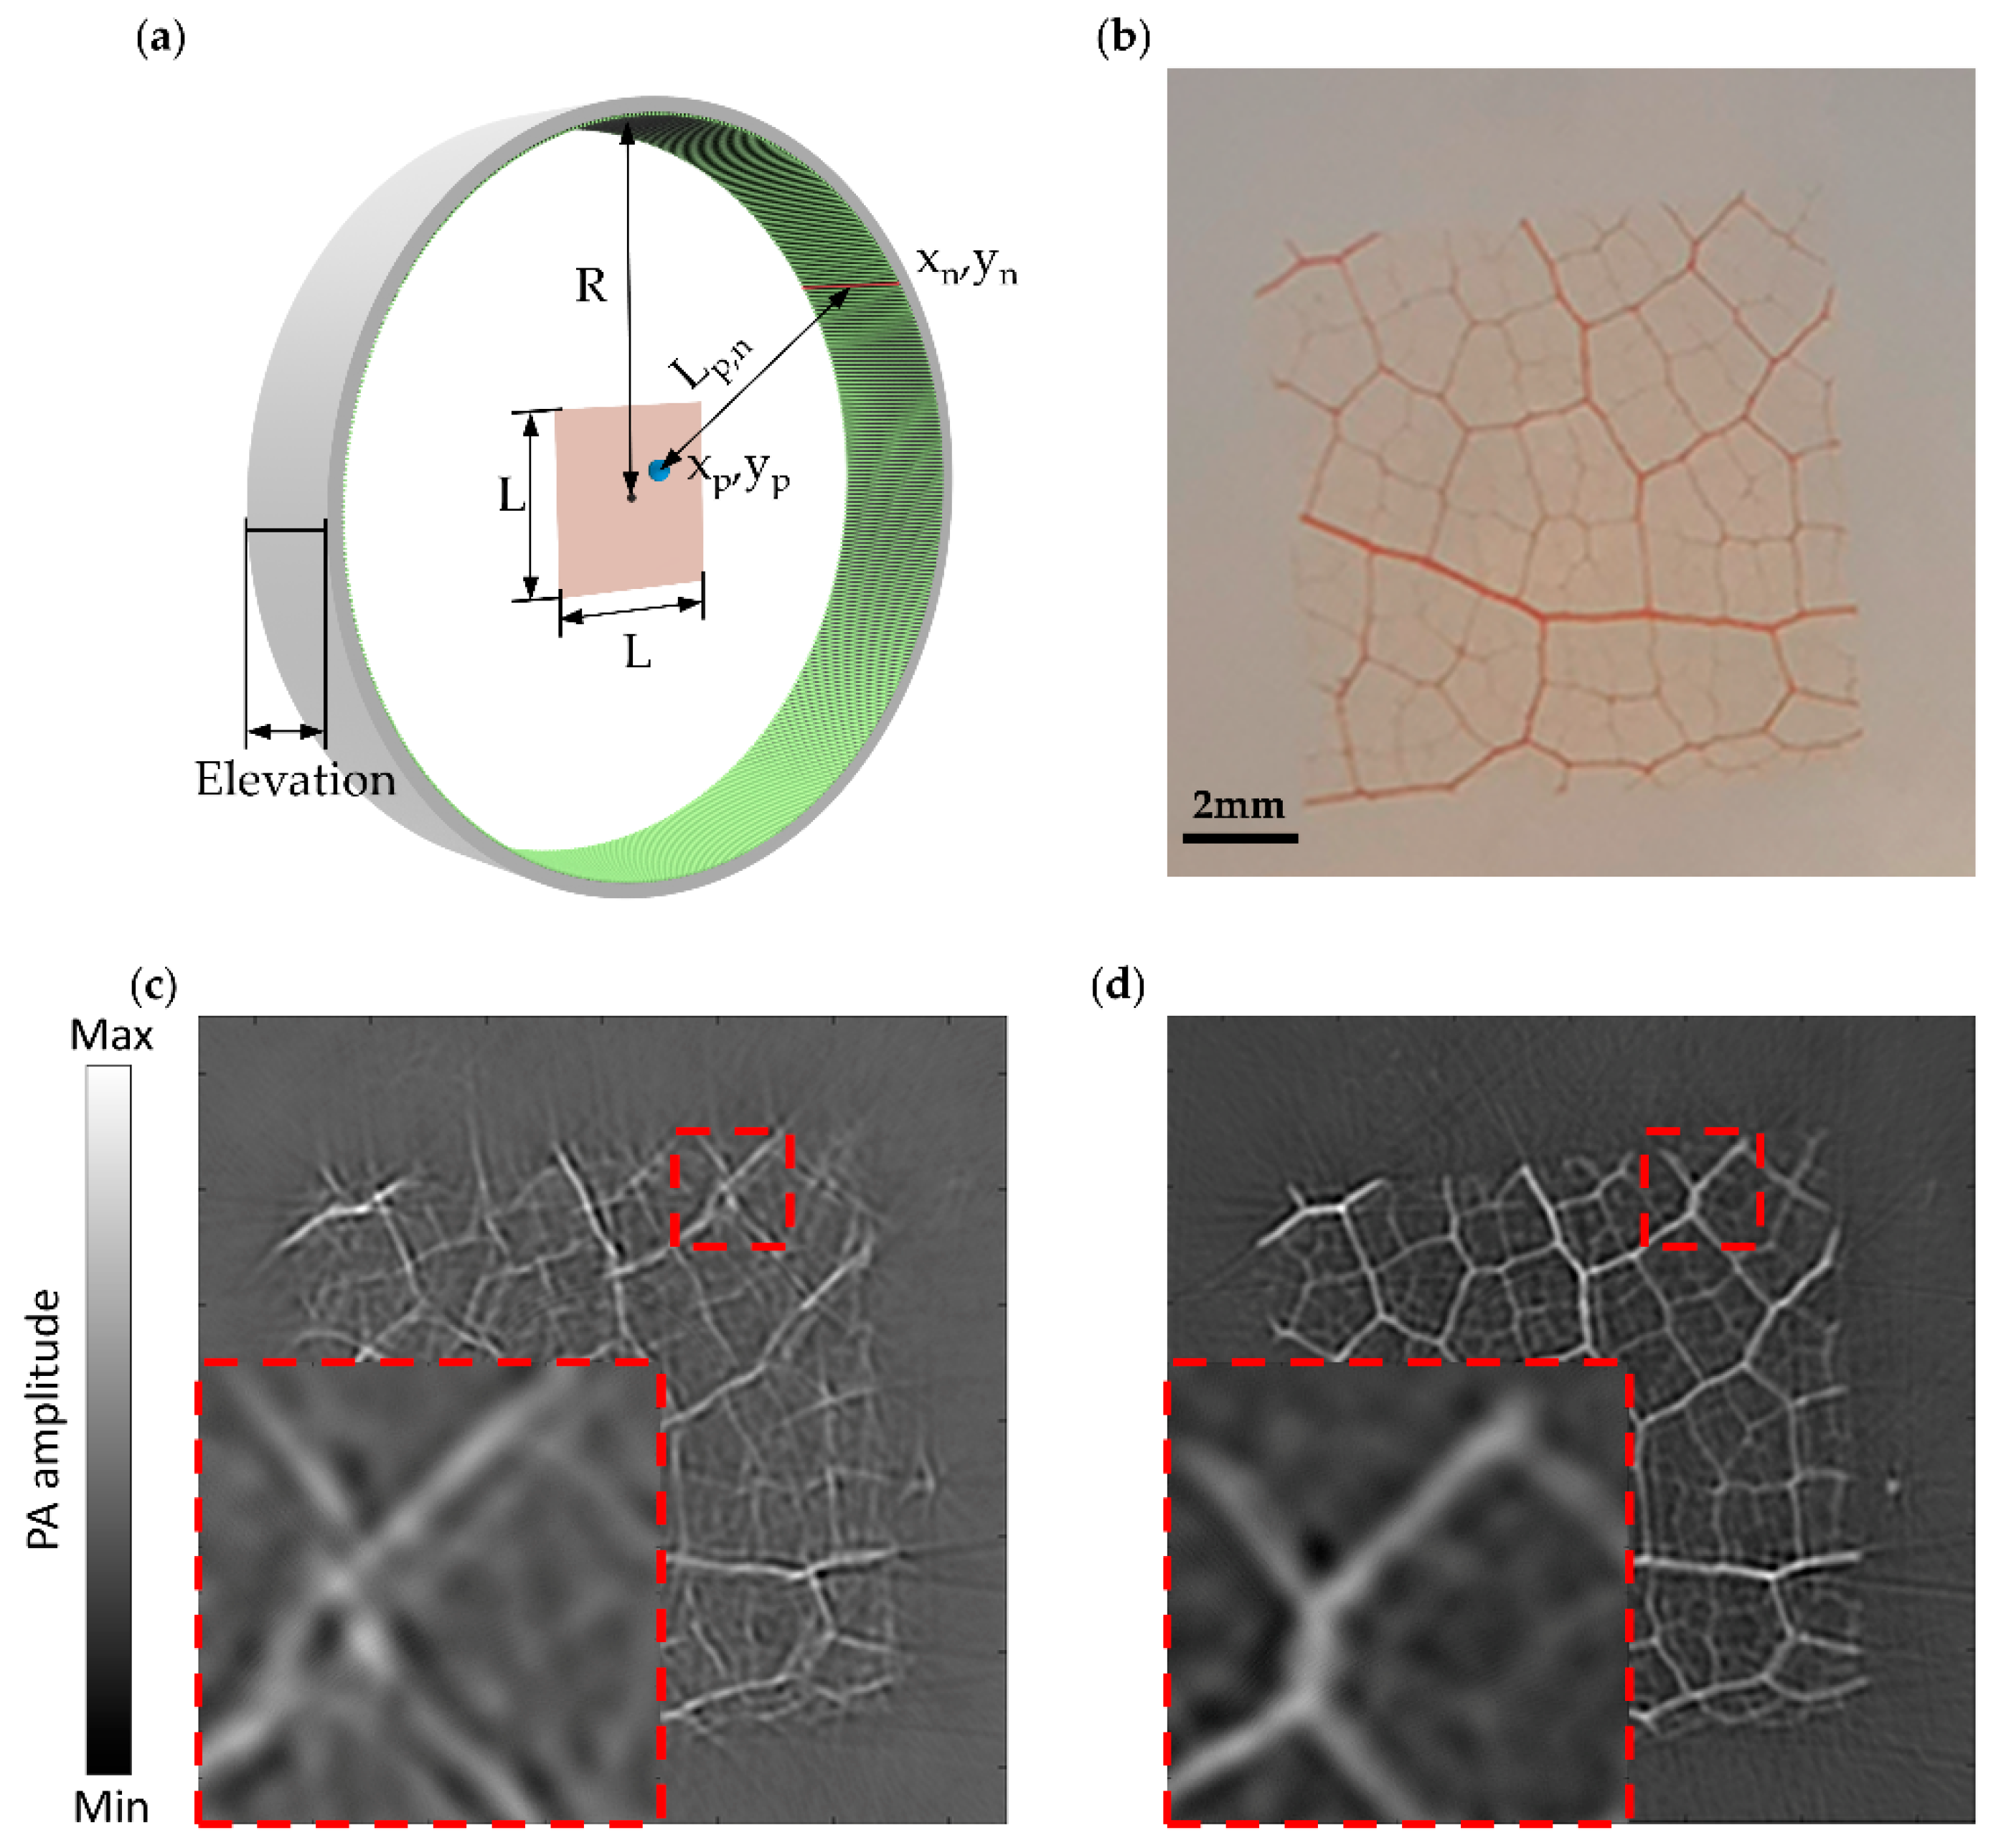
2.5. Geometry Correction of the Transducer

Since the ring-array was composed of four circular arc-shaped parts, there would be geometric errors in the assembly process. We should correct this error in the image reconstruction process. We drew inspiration from the work of Lin et al. [7]. We placed a tungsten filament (~100 µm) vertically in the FOV to excite the PA effect as a point source (xp’, yp’) signal. In the image reconstruction, we assumed that the coordinates of the array elements were arranged uniformly in a circle. Figure 5a shows the definition of both the array element coordinates and the FOV of the image reconstruction area. (xn, yn) represents the position of the n-th array element and (xp, yp) represents the pixel location of the point source. L is the size of the image reconstruction area. Lp,n is the distance between the array element (xn, yn) and the pixel point (xp, yp). In fact, it is very difficult to obtain the coordinates of the point source (xp’, yp’), but we can find the pixel point (xp, yp) corresponding to the point source (xp’, yp’) in the image reconstructed region. We divided the reconstructed area into a number of pixel points with a size of 100 µm. The distance of each pixel point to the array of elements can be easily achieved from the equation:
(xn − xp)2 + (yn − yp)2 = Lp,n
n = 1, 2, 3, …, 512
Furthermore, we fitted the point source signals collected by each element into a distance curve in MATLAB. By comparing the Lp,n with the distance curve, the exact location of the pixel point (xp, yp) can be found.
Due to the acquired signal of elements detection being a time domain signal, we can measure the propagation time of PA signal from a point source (xp’, yp’) to n-th element tp’,n precisely. The propagation time of PA signal from pixel point (xp, yp) to n-th element tp,n can be measured from the fellow equation:
Lp,n = tp,n × v
n = 1, 2, 3, …, 512
v, representing the speed of sound in water, is 1.50 mm/µs. Thus, we can obtain the correction delay Tn for each array element from the difference between tp’,n and tp,n. A 10 × 10 mm sample of leaf vein was used to verify the correction effect (Figure 5b). Figure 5c shows the leaf vein images without delay correction. The corrected image is shown in Figure 5d. The enlarged details in the bottom left of the figure show the splitting artifacts caused by the uncorrected geometry errors of the transducer.

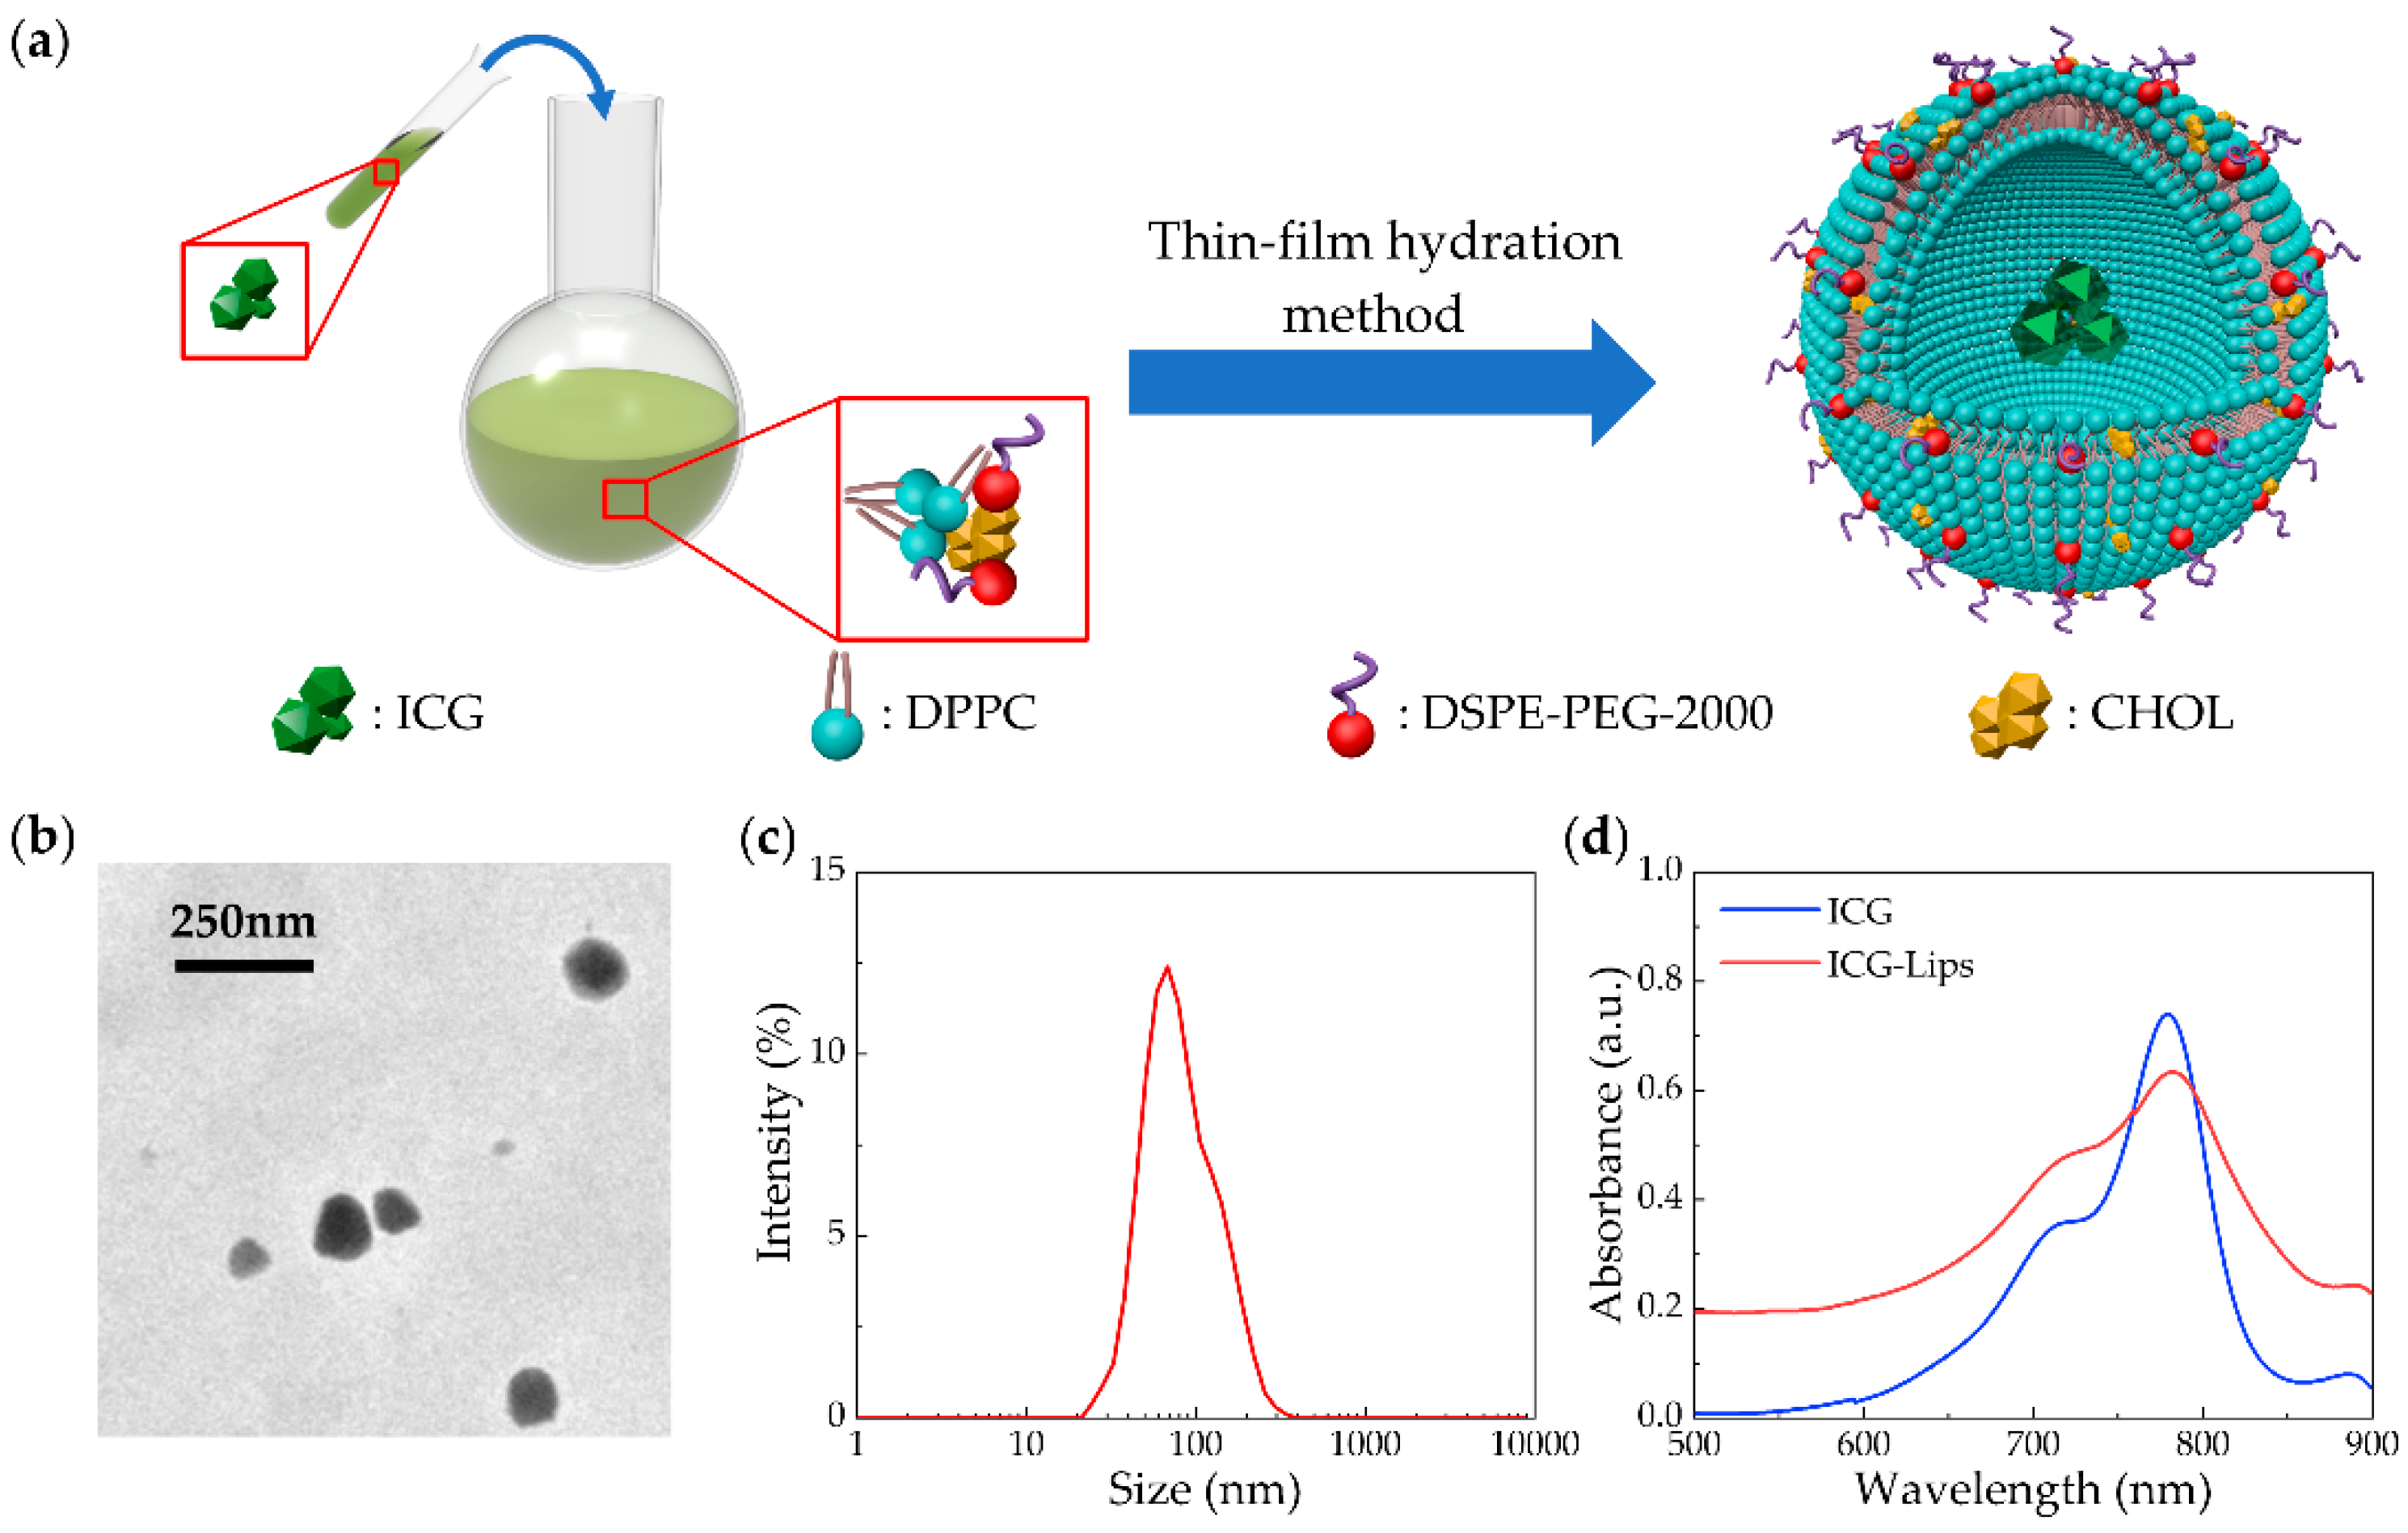
2.6. ICG-Lips Preparation

Figure 6a shows the process of the ICG-Lips. The ICG-containing liposomes were prepared using a thin-film hydration method. Briefly, DPPC, DSPE-PEG-2000, and cholesterol at a molar ratio of 10:1:3 were dissolved in 5 mL chloroform. The solution was evaporated under reduced pressure for at least 4 h to completely remove the solvent and obtain the lipid thin film. Then, 4 mL ultrapure water containing ICG at a concentration of 1 mg/mL was added to the flask. The lipid film was hydrated with ICG solution at 50 °C for 30 min. After hydration, the suspension was sonicated for 20 min and then extruded 15 times using an extruder with a 100 nm membrane. Finally, the prepared ICG-Lips were purified by dialysis.

2.7. Characterization of the ICG-Lips

The transmission electron microscope (TEM) image of ICG-Lips is shown in Figure 6b. The ICG-Lips showed a spherical morphology with a small size. The Z-average value of ICG-Lips measured by dynamic light scattering (DLS) was 129±49 nm (Figure 6c). The particle size determined by DLS was consistent with the size determined by TEM. To guide PACT imaging, the UV-Vis spectra of ICG and ICG-Lips were measured. The absorption peak of ICG and ICG-Lips in phosphate-buffered saline was determined at 780 nm (Figure 6d).

2.8. Animal Preparation

All procedures involving animal experiments were approved by the animal ethics committee of Central South University, China.
4−5 weeks old BALB/cA mice (15−20 g body weight, male) were purchased from Hunan SJA Laboratory Animal Co., Ltd. (Hunan, China) and used for experiments. To reduce the effect of respiration, the mice were anesthetized with 1% isoflurane using a compact small animal anesthesia machine (RWD, R500) and placed on a custom-made hollow acrylic plate. The function of the hollow acrylic plate was to support the mouse while reducing the reflection of PA signals. For tumor inoculation, 2 × 10⁷ Lewis lung carcinoma (LLC) cells were subcutaneously implanted in the back of the mouse. Tumor-bearing mice were incubated for two weeks.

2.9. Data Process

The data acquisitions with 780 nm and 1064 nm laser wavelengths were performed to image the ICG-Lips and the mouse tissues respectively. All data processing was performed in MATLAB. Then, the data were reconstructed with the conventional back-projection method [30]. In this work, we selected the tumor part in the 780 nm laser wavelength image and the surrounding tissues in the 1064 nm image as the region of interest (ROI). Firstly, we started with the hue, saturation, value (HSV) color mode for imaging with the colormap of hot and gray separately. Then, we converted the processed HSV image to the RGB color space and displayed the new RGB images for the fusion of the 780 nm image and 1064 nm image. For fused images, the pixel values in the RGB color space were calculated using the following equation [31]:
R, G, B = (1− M) · × A1064 + M · × A780
Here, R, G, and B represent the red, green, and blue three-color spaces of the pixel. A780 and A1064 are the new RGB images at the wavelength of 780 nm and 1064 nm, respectively, and M is a mask matrix that represents the threshold when overlaying the 780 nm image onto the 1064 nm image (A780 > 0, M = 1, else M = 0). · × represents the pixel-wise multiple.

3. Results

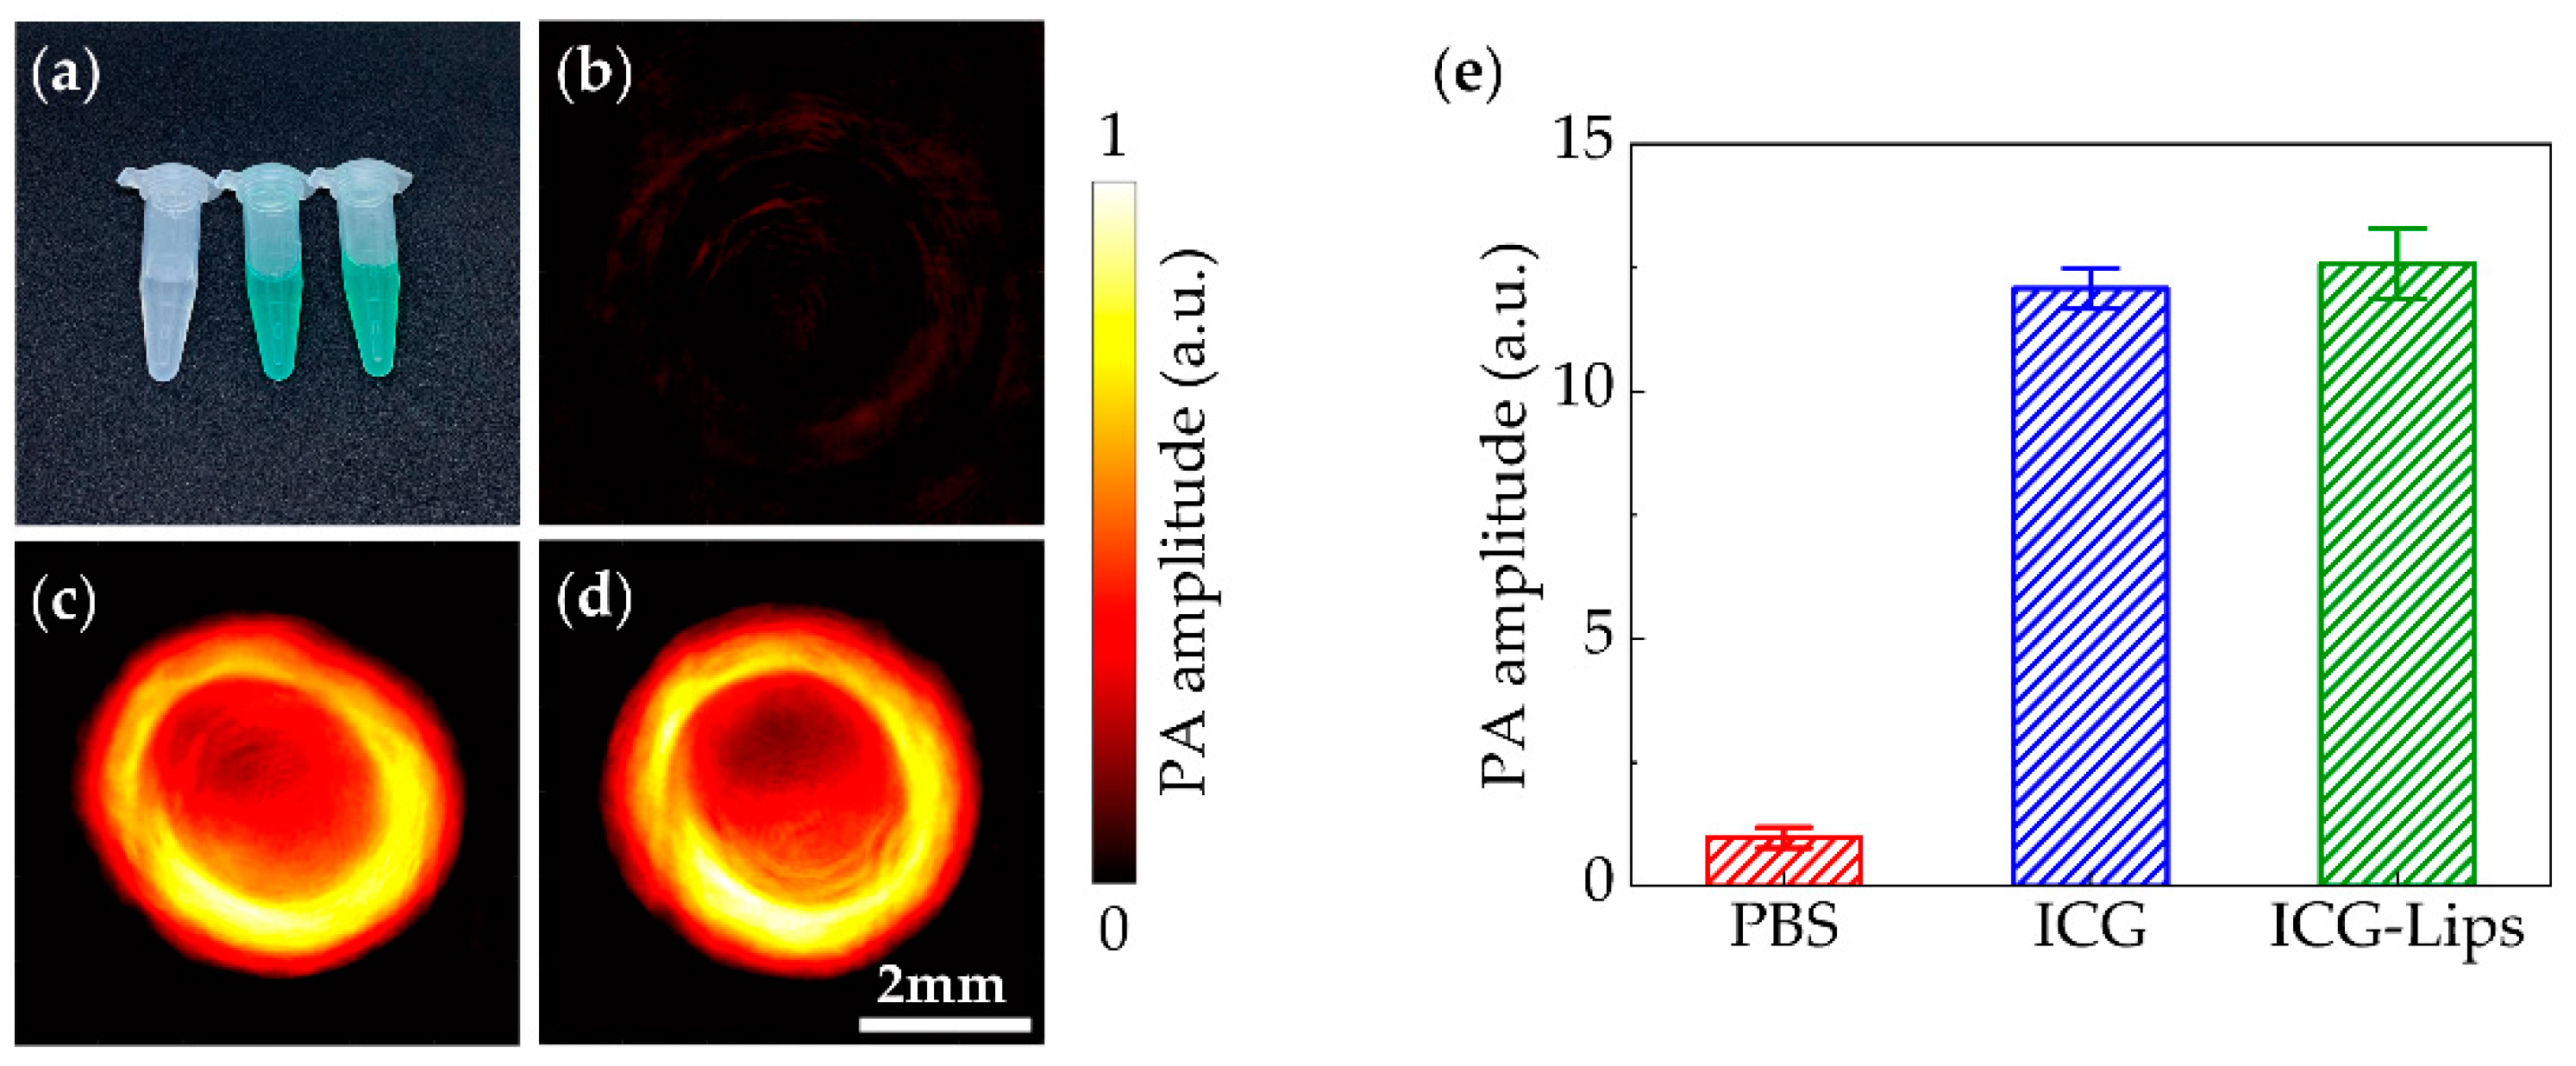
3.1. Characterization of PA Performances of ICG-Lips

The PA performances of the ICG-Lips were evaluated by our PACT system. ICG and ICG-Lips were diluted to the same concentration (50 µg/mL) in phosphate-buffered saline (PBS). Then, the PBS, ICG, and ICG-Lips were separately injected into three transparent plastic tubes and captured by PACT with the laser wavelength 780 nm. As shown in Figure 7, the PA performance between ICG and ICG-Lips was not significantly different. The prepared ICG-Lips retains the PA properties of ICG.

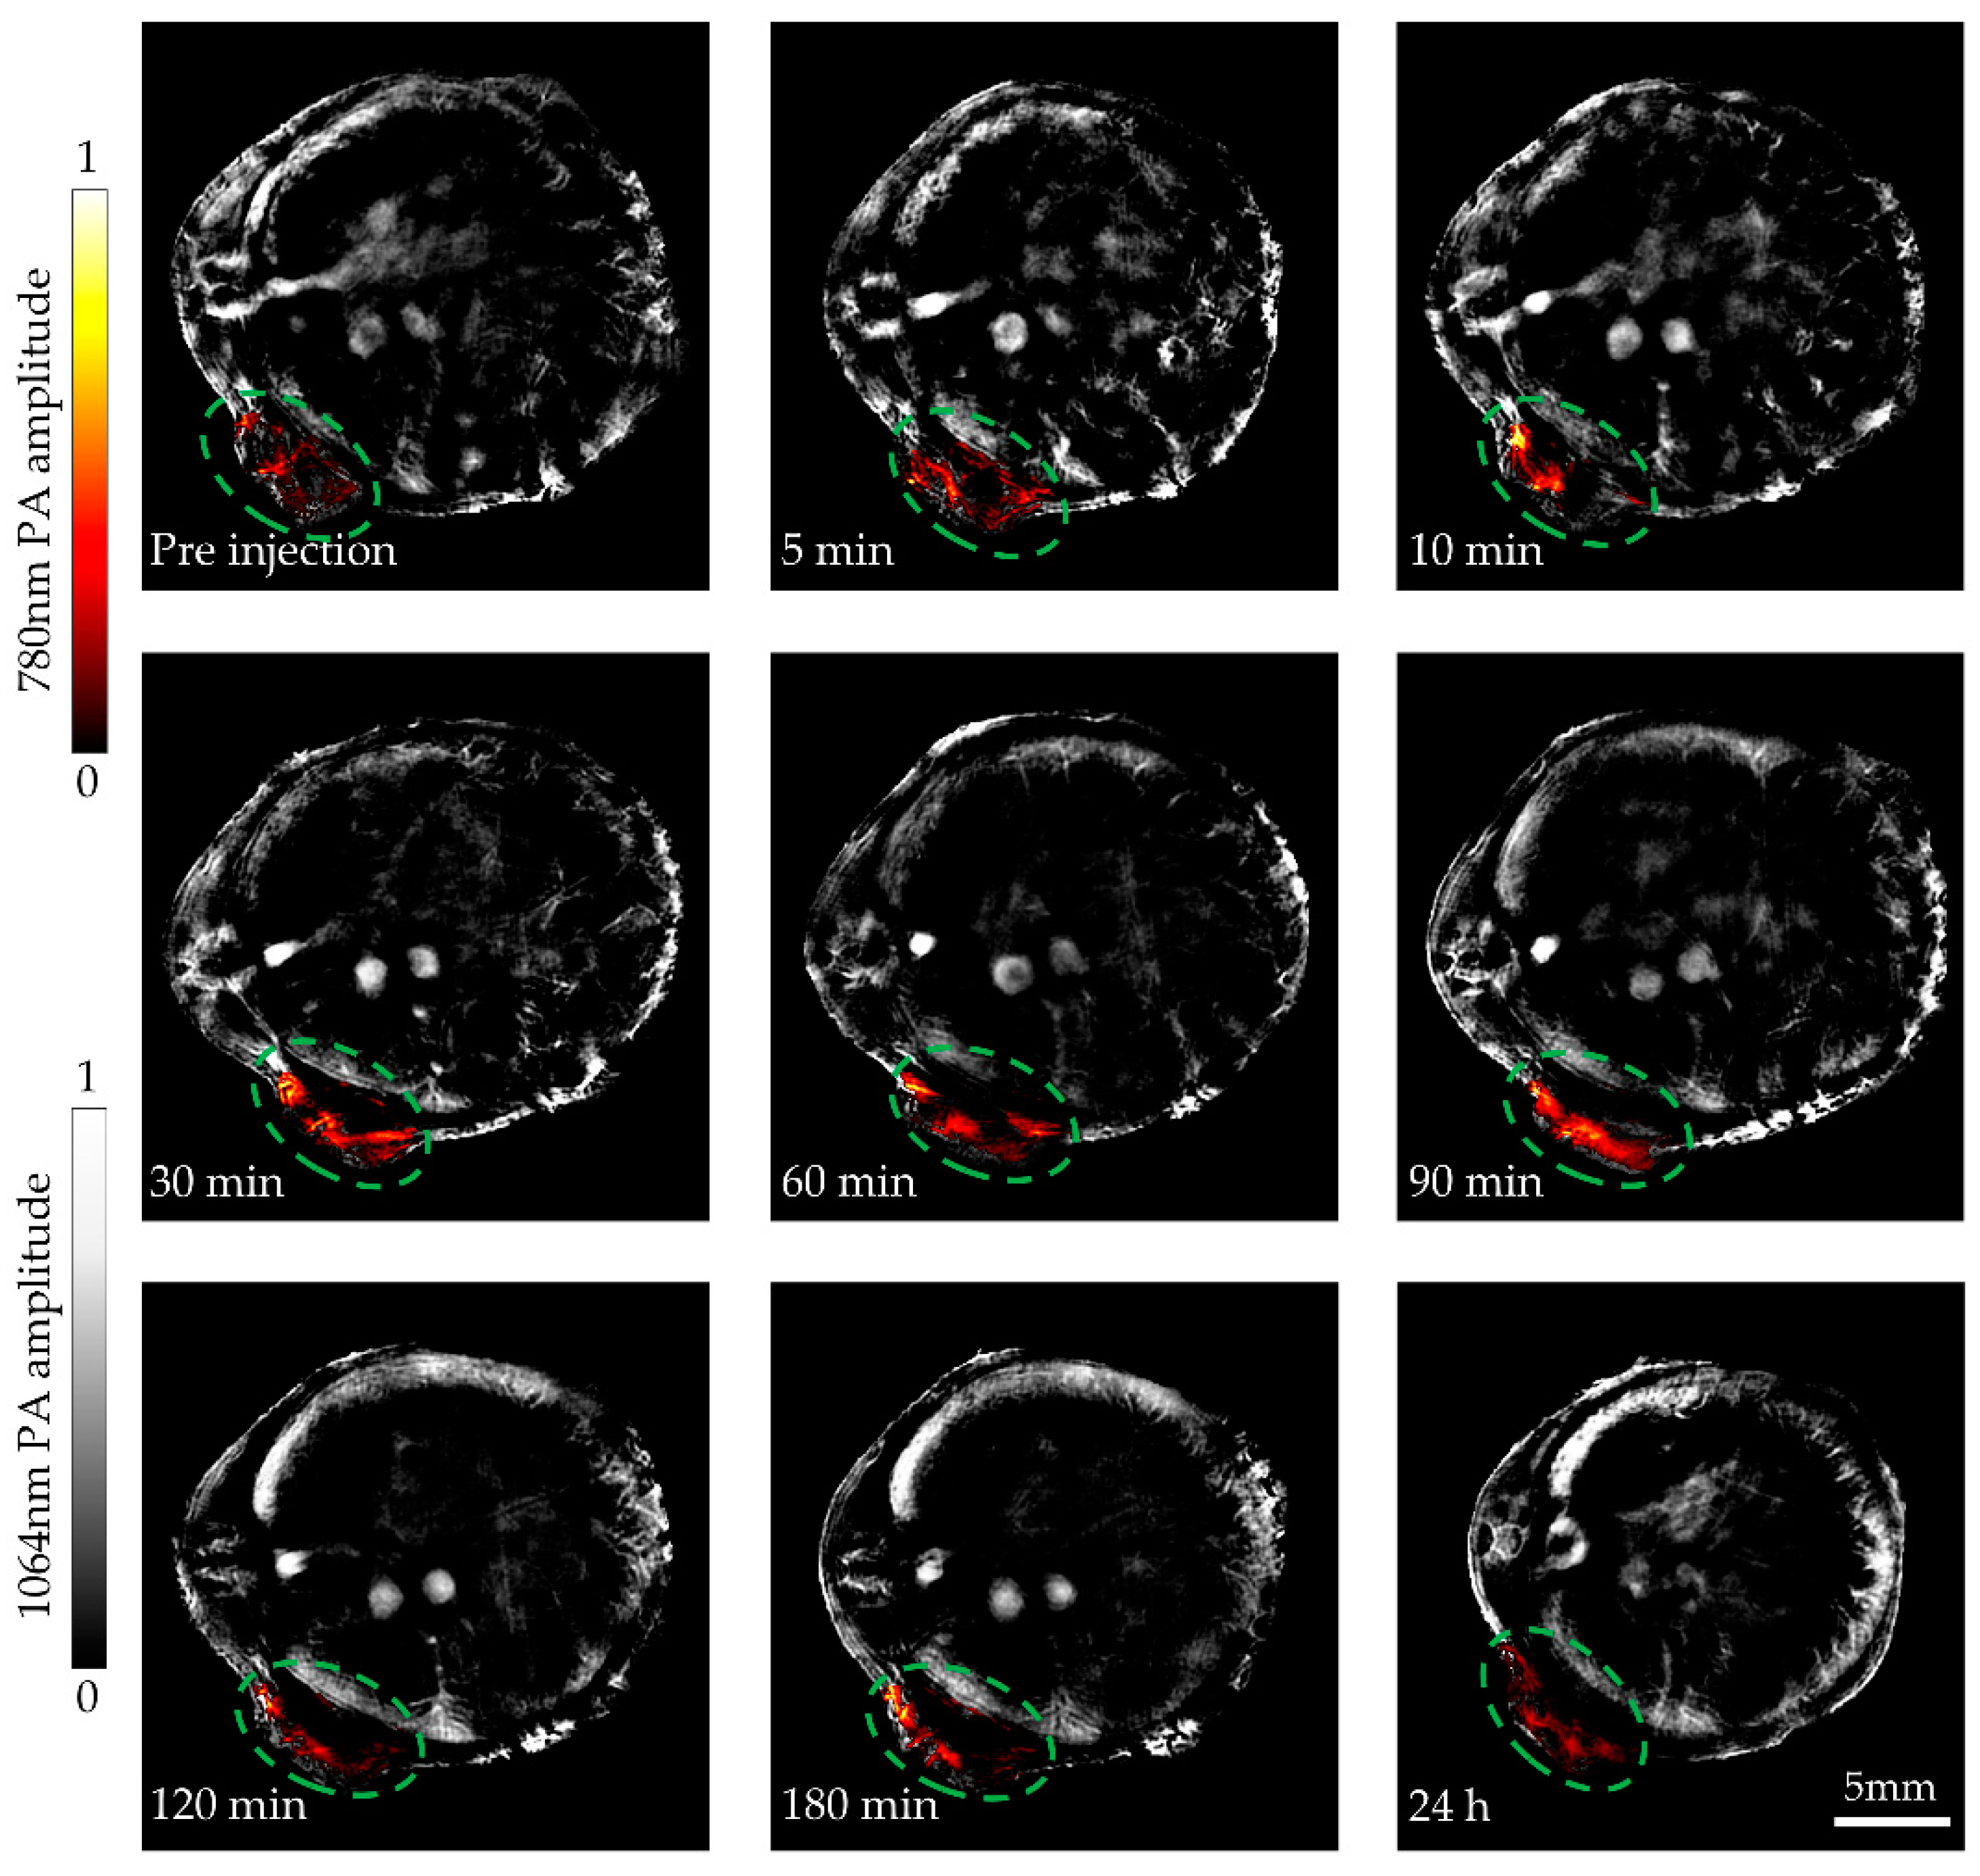
3.2. Imaging of the ICG-Lips in Tumors

The accumulation of ICG-Lips in tumor was monitored by our PACT system. Firstly, the mouse was anesthetized and placed vertically in the center of the transducer for cross-sectional imaging before injecting the ICG-Lips (Figure 1b and Figure 8a). Then, the ICG-Lips was injected into mice via tail vein at a volume of 100 µL [23]. The PA signal was captured for ~24 h. As shown in Figure 8, where the surrounding tissues are shown in gray captured with 1064 nm laser wavelength, and the PA effects of 780 nm in tumor are highlighted in color. After 5 min of injection, there was a significant enhancement of the PA signal in the ROI. The accumulation ICG-Lips via enhanced permeability and retention (EPR) effects lasted about 90 min.
For long-term monitoring, respiration in the mouse caused a slight drifting during the imaging process. To overcome this problem, we acquired 30 frames of data at each time point and drawn a line graph for the trend of the 780 nm PA signal of the ROI at different time points. As Figure 9 shows, the PA signal had a significant change from pre-injection to 24 h. After 5 min of ICG-Lips injection, the PA amplitude at the tumor site began to show an increasing trend. After 90 min of ICG-Lips injection, the PA amplitude of the ROI had dropped. From the results and the images, ICG-Lips in the tumor is abundantly aggregated within 30 min to 90 min after injection. After that, the PA amplitude decreased, indicating that ICG was gradually cleared by the liver. This result guided the best time for phototherapy to be 30 min to 90 min after the injection.
The results indicated that our PACT system could monitor the dynamic biodistribution of ICG-Lips in tumors in real time and provide treatment guidance for phototherapeutic applications.

4. Discussion

With the high spatial resolution and rich optical contrast, our PACT system has the ability to estimate in vivo PA performance of different photoacoustic contract agents. Here, ICG-encapsulated liposomes are prepared as PA imaging agents. In vitro PA studies indicated that ICG-Lips and free ICG had compatible PA effects. (Figure 7e). Moreover, due to the high sensitivity of our PACT system, the in vivo PA effects of ICG-Lips can be captured by our platform in real-time. Our dual-wavelength PACT system, integrating the real-time imaging of drug distribution and surrounding tissues, provides vital guidance for phototherapeutic applications.
Although the dual-wavelength PACT system has shown its great potential in disease treatment, its clinical applications for humans still need further development. For example, tissue penetration issues still hinter the imaging quality of PACT. We will also continue to explore new ways to improve system performance.
In summary, we report a dual-wavelength PACT system to monitor the dynamic bio-distribution of ICG-Lips in tumors. Owing to the non-invasiveness and high sensitivity, our PACT system offers a promising imaging platform for phototherapeutic guidance.

Author Contributions

Conceptualization, X.S. and H.S.; methodology, X.S. and H.S.; software, X.S.; validation, X.S. and H.S.; formal analysis, X.S.; investigation, X.S., Z.C. (Ziyan Chen) and Q.L.; resources, X.S., H.S., D.L. and Z.L.; data curation, X.S., H.S., D.L. and Z.L.; writing—review and editing, X.S. and H.S.; visualization, X.S.; supervision, K.P. and Z.C. (Zeyu Chen); project administration, Z.C. (Zeyu Chen); funding acquisition, Z.C. (Zeyu Chen). All authors have read and agreed to the published version of the manuscript.

Funding

Funding was provided by the Department of Science and Technology of Hunan Province, High-tech Industry Science and Technology Innovation Leading Program (2020SK2003), Management Science and Technology Project of Hunan Province (2020YJ004), Central South University, Innovation Driven Program Team Project (2020CX004), Science Fund for Distinguished Young Scholars of Hunan Province (2021JJ10069).

Institutional Review Board Statement

The study was conducted in accordance with the Declaration of Helsinki, and approved by the animal ethics committee of Central South University, China. (protocol code 2022020641, 10 March 2022).

Data Availability Statement

The data presented in this study are available on request from the corresponding author. The data are not publicly available due to the confidentiality of the relevant codes.

Acknowledgments

We thank Bo Wang at the department of Biomedical Engineering, School of Basic Medical Science, Central South University for valuable discussion.

Conflicts of Interest

The authors declare no conflict of interest. The funders had no role in the design of the study; in the collection, analyses, or interpretation of data; in the writing of the manuscript, or in the decision to publish the results.

References

  1. Siegel, R.L.; Miller, K.D.; Fuchs, H.E.; Jemal, A. Cancer statistics, 2022. CA-Cancer J. Clin. 2022, 72, 7–33. [Google Scholar] [CrossRef] [PubMed]
  2. Wang, L.V. Multiscale photoacoustic microscopy and computed tomography. Nat. Photonics 2009, 3, 503–509. [Google Scholar] [CrossRef] [PubMed] [Green Version]
  3. Beard, P. Biomedical photoacoustic imaging. Interface Focus 2011, 1, 602–631. [Google Scholar] [CrossRef] [PubMed]
  4. Steinberg, I.; Huland, D.M.; Vermesh, O.; Frostig, H.E.; Tummers, W.S.; Gambhir, S.S. Photoacoustic clinical imaging. Photoacoustics 2019, 14, 77–98. [Google Scholar] [CrossRef] [PubMed]
  5. Wang, L.V. Prospects of photoacoustic tomography. Med. Phys. 2008, 35, 5758–5767. [Google Scholar] [CrossRef]
  6. Fu, Q.; Zhu, R.; Song, J.; Yang, H.; Chen, X. Photoacoustic Imaging: Contrast Agents and Their Biomedical Applications. Adv. Mater. 2019, 31, e1805875. [Google Scholar] [CrossRef]
  7. Lin, L.; Hu, P.; Tong, X.; Na, S.; Cao, R.; Yuan, X.; Garrett, D.C.; Shi, J.; Maslov, K.; Wang, L.V. High-speed three-dimensional photoacoustic computed tomography for preclinical research and clinical translation. Nat. Commun. 2021, 12, 882. [Google Scholar] [CrossRef]
  8. Mallidi, S.; Luke, G.P.; Emelianov, S. Photoacoustic imaging in cancer detection, diagnosis, and treatment guidance. Trends Biotechnol. 2011, 29, 213–221. [Google Scholar] [CrossRef] [Green Version]
  9. Zackrisson, S.; Van De Ven, S.M.W.Y.; Gambhir, S.S. Light In and Sound Out: Emerging Translational Strategies for Photoacoustic Imaging. Cancer Res. 2014, 74, 979–1004. [Google Scholar] [CrossRef] [Green Version]
  10. Wang, L.V.; Yao, J. A practical guide to photoacoustic tomography in the life sciences. Nat. Methods 2016, 13, 627–638. [Google Scholar] [CrossRef]
  11. Luo, X.F.; Cai, Y.Q.; Chen, Z.Y.; Shan, H.; Sun, X.; Lin, Q.B.; Ma, J.G.; Wang, B. Stack-Layer Dual-Element Ultrasonic Transducer for Broadband Functional Photoacoustic Tomography. Front. Bioeng. Biotechnol. 2021, 9, 8. [Google Scholar] [CrossRef] [PubMed]
  12. Zhao, C.; Wang, Q.; Tao, X.; Wang, M.; Yu, C.; Liu, S.; Li, M.; Tian, X.; Qi, Z.; Li, J.; et al. Multimodal photoacoustic/ultrasonic imaging system: A promising imaging method for the evaluation of disease activity in rheumatoid arthritis. Eur. Radiol. 2021, 31, 3542–3552. [Google Scholar] [CrossRef] [PubMed]
  13. Huang, N.; He, M.; Shi, H.; Zhao, Y.; Lu, M.; Zou, X.; Yao, L.; Jiang, H.; Xi, L. Curved-Array-Based Multispectral Photoacoustic Imaging of Human Finger Joints. IEEE Trans. Biomed. Eng. 2018, 65, 1452–1459. [Google Scholar] [CrossRef] [PubMed]
  14. Li, L.; Zhu, L.; Ma, C.; Lin, L.; Yao, J.; Wang, L.; Maslov, K.; Zhang, R.; Chen, W.; Shi, J.; et al. Single-impulse Panoramic Photoacoustic Computed Tomography of Small-animal Whole-body Dynamics at High Spatiotemporal Resolution. Nat. Biomed. Eng. 2017, 1, 0071. [Google Scholar] [CrossRef]
  15. Zhang, Y.; Wang, L. Video-Rate Ring-Array Ultrasound and Photoacoustic Tomography. IEEE Trans. Med. Imaging 2020, 39, 4369–4375. [Google Scholar] [CrossRef]
  16. Hai, P.; Qu, Y.; Li, Y.; Zhu, L.; Shmuylovich, L.; Cornelius, L.A.; Wang, L.V. Label-free high-throughput photoacoustic tomography of suspected circulating melanoma tumor cells in patients in vivo. J. Biomed. Opt. 2020, 25, 1. [Google Scholar] [CrossRef]
  17. Chen, J.; Qi, J.; Chen, C.; Chen, J.; Liu, L.; Gao, R.; Zhang, T.; Song, L.; Ding, D.; Zhang, P.; et al. Tocilizumab-Conjugated Polymer Nanoparticles for NIR-II Photoacoustic-Imaging-Guided Therapy of Rheumatoid Arthritis. Adv. Mater. 2020, 32, e2003399. [Google Scholar] [CrossRef]
  18. Brecht, H.-P.; Su, R.; Fronheiser, M.; Ermilov, S.A.; Conjusteau, A.; Oraevsky, A.A. Whole-body three-dimensional optoacoustic tomography system for small animals. J. Biomed. Opt. 2009, 14, 064007. [Google Scholar] [CrossRef]
  19. Zafar, M.; Kratkiewicz, K.; Manwar, R.; Avanaki, M. Development of Low-Cost Fast Photoacoustic Computed Tomography: System Characterization and Phantom Study. Appl. Sci.-Basel 2019, 9, 374. [Google Scholar] [CrossRef] [Green Version]
  20. Alijabbari, N.; Alshahrani, S.S.; Pattyn, A.; Mehrmohammadi, M. Photoacoustic Tomography with a Ring Ultrasound Transducer: A Comparison of Different Illumination Strategies. Appl. Sci. 2019, 9, 3094. [Google Scholar] [CrossRef] [Green Version]
  21. Upputuri, P.K.; Pramanik, M. Recent advances in photoacoustic contrast agents for in vivo imaging. Wiley Interdiscip. Rev.-Nanomed. Nanobiotechnol. 2020, 12, e1618. [Google Scholar] [CrossRef] [PubMed]
  22. Hannah, A.; Luke, G.; Wilson, K.; Homan, K.; Emelianov, S. Indocyanine green-loaded photoacoustic nanodroplets: Dual contrast nanoconstructs for enhanced photoacoustic and ultrasound imaging. ACS Nano 2014, 8, 250–259. [Google Scholar] [CrossRef] [PubMed]
  23. Zheng, C.F.; Zheng, M.B.; Gong, P.; Jia, D.X.; Zhang, P.F.; Shi, B.H.; Sheng, Z.H.; Ma, Y.F.; Cai, L.T. Indocyanine green-loaded biodegradable tumor targeting nanoprobes for in vitro and in vivo imaging. Biomaterials 2012, 33, 5603–5609. [Google Scholar] [CrossRef]
  24. Zheng, M.; Zhao, P.; Luo, Z.; Gong, P.; Zheng, C.; Zhang, P.; Yue, C.; Gao, D.; Ma, Y.; Cai, L. Robust ICG theranostic nanoparticles for folate targeted cancer imaging and highly effective photothermal therapy. ACS Appl. Mater. Interfaces 2014, 6, 6709–6716. [Google Scholar] [CrossRef] [PubMed]
  25. Chen, J.; Ning, C.; Zhou, Z.; Yu, P.; Zhu, Y.; Tan, G.; Mao, C. Nanomaterials as photothermal therapeutic agents. Prog. Mater. Sci. 2019, 99, 1–26. [Google Scholar] [CrossRef]
  26. Chaudhary, Z.; Khan, G.M.; Abeer, M.M.; Pujara, N.; Wan-Chi Tse, B.; McGuckin, M.A.; Popat, A.; Kumeria, T. Efficient photoacoustic imaging using indocyanine green (ICG) loaded functionalized mesoporous silica nanoparticles. Biomater. Sci. 2019, 7, 5002–5015. [Google Scholar] [CrossRef]
  27. Kraft, J.C.; Ho, R.J. Interactions of indocyanine green and lipid in enhancing near-infrared fluorescence properties: The basis for near-infrared imaging in vivo. Biochemistry 2014, 53, 1275–1283. [Google Scholar] [CrossRef] [Green Version]
  28. Yoon, H.J.; Lee, H.S.; Lim, J.Y.; Park, J.H. Liposomal Indocyanine Green for Enhanced Photothermal Therapy. ACS Appl. Mater. Interfaces 2017, 9, 5683–5691. [Google Scholar] [CrossRef]
  29. Gamelin, J.; Maurudis, A.; Aguirre, A.; Huang, F.; Guo, P.Y.; Wang, L.V.; Zhu, Q. A real-time photoacoustic tomography system for small animals. Opt. Express 2009, 17, 10489–10498. [Google Scholar] [CrossRef] [Green Version]
  30. Xu, M.; Wang, L.V. Universal back-projection algorithm for photoacoustic computed tomography. Phys. Rev. E 2005, 71, 016706. [Google Scholar] [CrossRef] [Green Version]
  31. Wang, C.C.; Guo, L.L.; Wang, G.; Ye, T.; Wang, B.; Xiao, J.Y.; Liu, X.L. In-Vivo imaging of melanoma with simultaneous dual-wavelength acoustic-resolution-based photoacoustic/ultrasound microscopy. Appl. Optics 2021, 60, 3772–3778. [Google Scholar] [CrossRef] [PubMed]
Figure 1. System structure schematic and trigger timing diagram. (a) Schematic of the dual-wavelength PACT system for tumor imaging; (b) Close up of the blue dashed box region in (a), which shows the distribution of the laser fibers and the placement of mouse; (c) System trigger timing diagram.
Micromachines 13 00946 g001
Figure 2. (a) The configuration of the transducer. The blue dotted box is a close-up of the transducer; (b) The photograph of the ring-array transducer.
Micromachines 13 00946 g002
Figure 3. Transmit characteristic of the ring-array transducer. (a,b) Measured waveform and spectrum diagram of the 25-th element of the ring-array transducer; (c,d) Measured waveform and spectrum diagram of the 96-th element of the ring-array transducer.
Micromachines 13 00946 g003
Figure 4. (a) Experimental cross-sectional view of the field of view (FOV) with location for a radical cut dividing the transducer into two halves; (b) Measured lateral resolution versus distance from the center of the transducer; (c) The full width at half maximum (FWHM) of (a) the radial FOV focus area; (d) The FWHM of (a) at the center of the ring-array (x = 0 mm) and at 6.5 mm in the elevation direction.
Micromachines 13 00946 g004
Figure 5. Theoretical analysis model and the comparison of results before and after transducer geometry correction. (a) The definition of both the array element coordinates and the FOV of the image reconstruction area. (xn, yn) represents the position of the n-th array element and (xp, yp) represents the pixel location of the point source. L is the size of the image reconstruction area. Lp,n is the distance between the array element (xn, yn) and the pixel point (xp, yp); (b) The sample of leaf vein for imaging; (c,d) The PA image of the leaf vein before and after transducer geometry correction. The red dotted box is a close-up of the same area of the leaf veins.
Micromachines 13 00946 g005
Figure 6. Schematic of the preparation process and the characterization of ICG-Lips. (a) ICG-Lips are generated by the thin-film hydration method. ICG, indocyanine green. DPPC, dipalmitoyl phosphatidylcholine. DSPE-PEG, 1,2-distearoyl-sn-glycero-3-phosphoethanolamine-N-[amino (polyethylene glycol) 2000]. CHOL, cholesterol; (b) Transmission electron microscope (TEM) image of ICG-Lips; (c) Size distribution of ICG-Lips (z-average 129 ± 49 nm); (d) UV-Vis spectra of ICG and ICG-Lips in phosphate-buffered saline.
Micromachines 13 00946 g006
Figure 7. The comparison of PA performances. (a) The photograph of PBS, free ICG, and ICG-Lips (containing 50 µg/mL ICG) in centrifuge tubes; (bd) PA images of PBS, free ICG, and ICG-Lips; (e) The PA amplitude of PBS, free ICG, and ICG-Lips in transparent plastic tubes with laser wave-length at 780 nm. PBS, phosphate-buffered saline. Error bars represent the standard deviations from 30 independent measurements.
Micromachines 13 00946 g007
Figure 8. ICG-Lips accumulation in tumors for 24 h was monitored by our PACT system. The PA images of mouse tissues imaged by a 1064 nm wavelength laser are shown in gray. The PA images of ICG-Lips in tumors imaged by a 780 nm wavelength laser are shown in color.
Micromachines 13 00946 g008
Figure 9. 780 nm PA amplitude of the ROI at different time points. Error bars represent the standard deviations from 30 independent measurements.
Micromachines 13 00946 g009
Table 1. The design parameters of the ring-array transducer.
LayerSound
Velocity(m/s)
Density
(kg/m3)
Acoustic Impedance
(×106 kg/(m2·s))
Thickness (mm)
Matching layer263511803.110.13
Backing layer173020503.557
Piezoelectric layer3737348013.000.3
Table 2. The properties of the piezoelectric layer.
Materialετ33 1
(1 kHz)
d33 2
(Pc/n)
kt 3Qm 4Dielectric Loss
(1 kHz (tan δ))
ƒt 5
(MHz)
ƒα 6
(MHz)
PZT/epoxy 1–3 composite1361.84930.612180.0285.0066.107
1 Dielectric constant; 2 Piezoelectric strain constant; 3 Electromechanical coupling coefficient; 4 Mechanic quality factor; 5 Resonant frequency; 6 Anti-resonant frequency.
Publisher’s Note: MDPI stays neutral with regard to jurisdictional claims in published maps and institutional affiliations.

