Article

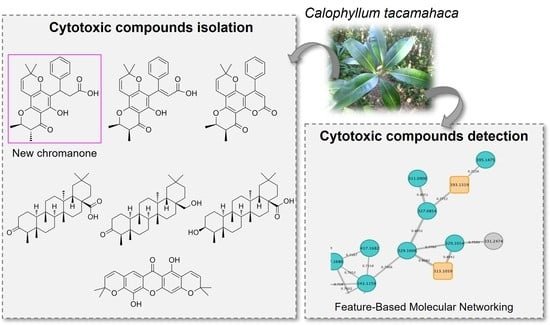
Cytotoxic Metabolites from Calophyllum tacamahaca Willd.: Isolation and Detection through Feature-Based Molecular Networking

1
Laboratoire de Chimie et de Biotechnologie des Produits Naturels, Faculté des Sciences et Technologies, Université de La Réunion, Campus du Moufia, 97744 St Denis, France
2
Spectropole, FSCM, Centrale Marseille, CNRS, Aix-Marseille Université, Campus de St Jérôme–Service 511, 13397 Marseille, France
3
IMBE, CNRS, IRD, Aix Marseille Université, Faculté de Pharmacie, Service de Pharmacognosie, 13331 Marseille, France
4
IMBE, CNRS, IRD, Aix-Marseille Université, Faculté de Pharmacie, Service de Mutagénèse Environnementale, 13385 Marseille, France
5
Institut de Chimie Organique et Analytique, UMR 6759, Université d’Orléans–CNRS, Pôle de Chimie, Rue de Chartres, BP6759, CEDEX 2, 45067 Orléans, France
6
Laboratoire de Pharmacognosie, Centre Interfacultaire de Recherche sur le Médicament (CIRM), Université de Liège, Département de Pharmacie, Campus du Sart-Tilman, Quartier Hôpital, B-4000 Liège, Belgium
*
Author to whom correspondence should be addressed.
Metabolites 2023, 13(5), 582; https://doi.org/10.3390/metabo13050582
Submission received: 29 March 2023 / Revised: 14 April 2023 / Accepted: 18 April 2023 / Published: 23 April 2023

Abstract

:
Isocaloteysmannic acid (1), a new chromanone, was isolated from the leaf extract of the medicinal species Calophyllum tacamahaca Willd. along with 13 known metabolites belonging to the families of biflavonoids (2), xanthones (35, 10), coumarins (68) and triterpenes (9, 1114). The structure of the new compound was characterized based on nuclear magnetic resonance (NMR), high-resolution electrospray mass spectrometry (HRESIMS), ultraviolet (UV) and infrared (IR) data. Its absolute configuration was assigned through electronic circular dichroism (ECD) measurements. Compound (1) showed a moderate cytotoxicity against HepG2 and HT29 cell lines, with IC50 values of 19.65 and 25.68 µg/mL, respectively, according to the Red Dye method. Compounds 7, 8 and 1013 exhibited a potent cytotoxic activity, with IC50 values ranging from 2.44 to 15.38 µg/mL, against one or both cell lines. A feature-based molecular networking (FBMN) approach led to the detection of a large amount of xanthones in the leaves extract, and particularly analogues of the cytotoxic isolated xanthone pyranojacareubin (10).

Graphical Abstract

1. Introduction

The genus Calophyllum (Calophyllaceae) includes approximately 200 species, distributed across all tropical regions. They are traditionally used against many ailments, including ulcers, malaria, tumor, infections, eye diseases, pain, inflammation and rheumatism [1,2]. This genus is an important source of bioactive natural products, including coumarins, xanthones, chromanones and triterpenes [3,4]. Xanthones and coumarins from Calophyllum species are known to possess cytotoxic, antiviral, antimicrobial, antiparasite, analgesic, anti-inflammatory and chemopreventive properties [5,6]. (+)-Calanolide A, a pyranocoumarin isolated from C. lanigerum, reached phase II of a clinical trial for its potent inhibitory activity of HIV-1 reverse transcriptase [4].
The species Calophyllum tacamahaca Willd., commonly known as “Takamaka des Hauts”, is an endemic tree to Mauritius and Reunion Island. The leaf species is registered in the List of plants used in traditional medicine of French pharmacopoeia since April 2022, for eye diseases, fever, headaches and as veinotonic. This species is also traditionally employed to treat skin diseases, memory disorders, rheumatism and blood circulation troubles [7]. Previous investigations showed that leaf extract possesses hypotensive [8], antiplasmodial [9], antimicrobial [7], antiviral [10] and anti-inflammatory [11] activities. Nevertheless, the chemical composition of the species has never been studied and so bioactive compounds of the species have never been isolated nor identified so far.
Thus, the ethyl acetate (EtOAc) leaf extract of C. tacamahaca was subjected to a bio-guided chemical investigation in order to identify bioactive metabolites. Herein, we report the isolation, structure characterization and in vitro cytotoxic activity of one new chromanone (1), along with 13 known compounds (214). A feature-based molecular networking (FBMN) approach was performed in order to detect analogues of the bioactive compounds, and the obtained results are discussed below.

2. Materials and Methods

2.1. General Experimental Procedures

Optical rotations were determined using an Anton Paar MCP200 polarimeter (589 nm, 25 °C), and UV spectra were acquired on a Thermo Scientific DAD spectrophotometer. IR spectra were recorded on a Vertex 70 (Bruker) ATR-FTIR spectrometer. For compound (1), UV–vis and experimental ECD spectra were recorded on a JASCO J-815 spectrometer equipped with a JASCO Peltier cell holder PTC-423 to maintain the temperature at 20.0 °C. The handedness of the circular polarized light was modulated at 50 kHz with a quartz photoelastic modulator set at l/4 retardation. A quartz cell of 1 mm of optical path length was used. Sample was prepared in dry methanol at a concentration of 0.0005 mol. L−1. ECD spectra were recorded using CD3OD as a reference and are presented without smoothing and further data processing. NMR spectra were acquired in CD3OD (δ1H 3.31 ppm, δ13C 49.00 ppm) on a Bruker Avance II+ 600 MHz (TCI cryoprobe) spectrometer at 300 K. NMR spectra were analyzed with the TopSpin (v 4.1.1) software. Structural assignments were based on 1H NMR, 13C NMR, COSY, HSQC and HMBC spectra. The chemical shifts δ are provided in ppm and coupling constants J in Hz. UHPLC-HRESIMS and UHPLC-HRESIMS/MS analyses were performed on an Impact II Bruker Daltonics Qq-TOF spectrometer with an ESI source using a 2.1 × 150 mm 1.6 µm RP-C18 column (Luna Omega C18, Phenomenex, Torrance, CA, USA) and an elution gradient of H2O-CH3CN with 0.1% HCO2H (98:2 to 0:100). Solid reverse-phase extraction was performed over 10 g SPE Strata 55 µm C18 tubes (Phenomenex), with three elution steps (H2O/CH3CN v/v). Preparative HPLCs were performed on a Waters 2545 system using MassLynx software and a 21.2 × 150 mm 5 µm RP-C18 column (Gemini C18, Phenomenex), with an appropriate elution gradient of H2O-CH3CN with 0.1% HCO2H at a flow rate of 20 mL/min. Semi-preparative HPLC was performed on a Dionex Ultimate 3000 system (Thermo Scientific, Waltham, MA, USA) using Chromeleon software and a 10 × 250 mm 5 µm RP-C18 column (Gemini C18, Phenomenex) with an appropriate elution gradient of H2O-CH3CN with 0.1% HCO2H at a flow rate of 4.5 mL/min. Analytical HPLC was performed on a Dionex Ultimate 3000 system (Thermo Scientific) using Chromeleon software and a 4.6 × 150 mm 3 µm RP-C18 column (Gemini C18, Phenomenex) with an appropriate elution gradient of H2O-CH3CN with 0.1% HCO2H at a flow rate of 0.8 mL/min.

2.2. Plant Material

Leaves of Calophyllum tacamahaca were collected in March 2019 on Reunion Island (Saint Denis). The taxonomic identification of the plant species was performed by Mr. H. Thomas (Parc National de La Réunion). A voucher specimen was deposited in the Herbarium of the University of La Réunion for confirmation of identification, with the following accession number: REU024075.

2.3. Extraction and Isolation

Leaves of C. tacamahaca were dried at 40 °C for 48 h and powdered. An accelerated solvent extractor (ASE 300 Dionex) was used to exhaustively extract the ground material (237.0 g). Four successive extractions were performed at 40 °C with EtOAc. The extract was evaporated under reduced pressure at 38 °C to obtain 20.3 g of crude extract.
A total of 3.32 g of crude extract were fractionated by solid reverse-phase extraction using combinations of H2O/CH3CN (v/v) of decreasing polarity. Three fractions (F1–F3) were obtained and evaluated for their cytotoxic activity against cancer cell lines. Fraction F2 (240.1 mg) was then subjected to preparative HPLC using an elution gradient of H2O-CH3CN with 0.1% HCO2H (55:45 over 5 min, 55:45 to 20:80 over 35 min) at a flow rate of 20 mL/min (UV 260 nm). The purification of fraction F2 afforded the pure compounds isocaloteysmannic acid (1, 13.1 mg), amentoflavone (2, 12.0 mg), 6-(4-hydroxy-3-methylbutyl)-1,5-dihydroxyxanthone (3, 1.7 mg), scriblitifolic acid (4, 1.7 mg), pancixanthone B (5, 1.9 mg) and isocalophyllic acid (7, 29.4 mg). Subfraction F2–7 (11.4 mg) was subjected to semi-preparative HPLC using an isocratic elution of H2O-CH3CN with 0.1% HCO2H (35:65) for 18 min at a flow rate of 4.5 mL/min (UV 320 nm) and afforded the pure compounds isocalophyllic acid (7, 1.0 mg) and inophyllum E (8, 2.8 mg). The purification of subfraction F2–8 (13.7 mg) was performed by semi-preparative HPLC using an isocratic elution of H2O-CH3CN with 0.1% HCO2H (35:65) for 20 min at a flow rate of 4.5 mL/min (UV 280 nm) and yielded the pure compound calophyllic acid (6, 2.5 mg). Fraction F3 (673.3 mg) was subjected to preparative HPLC using an elution gradient of H2O-CH3CN with 0.1% HCO2H (30:70 over 2 min, 30:70 to 0:100 over 10 min, 0:100 over 9 min) at a flow rate of 20 mL/min (ELSD). The purification of fraction F3 afforded the pure compounds isocalophyllic acid (7, 35.8 mg), calophyllic acid (6, 15.9 mg), canophyllalic acid (11, 22.8 mg), canophyllol (12, 21.9 mg) and canophyllic acid (13, 25.2 mg). The purification of subfraction F3–6 (5.7 mg) was performed by analytical HPLC using an isocratic elution of H2O-CH3CN with 0.1% HCO2H (30:70) for 16 min at a flow rate of 0.8 mL/min (CAD) and yielded the pure compound 27-hydroxyacetate-canophyllic acid (9, 0.5 mg). Subfraction F3–7 (5.6 mg) was subjected to analytical HPLC using an isocratic elution of H2O-CH3CN with 0.1% HCO2H (22:78) for 13 min at a flow rate of 0.8 mL/min (UV 280 nm) and yielded the pure compound pyranojacareubin (10, 0.9 mg). The purification of subfraction F3–19 was performed by semi-preparative HPLC using an isocratic elution of H2O-CH3CN with 0.1% HCO2H (10:90) for 32 min at a flow rate of 4.5 mL/min (ELSD) and yielded the pure compound canophyllal (14, 0.3 mg).
Isocaloteysmannic acid (1): yellow–green powder, [ α ] D 25 −31.7 (c 0.1, MeOH); UV (MeOH) λmax 200, 264–274, 299–312, 368 nm; IR νmax 3087, 2977, 2926, 2855, 1709, 1627, 1300, 1000 cm−1; for 1H and 13C NMR spectroscopic data, see Table 1; HRESIMS m/z 423.1791 [M+H]+ (calculated for C25H27O6+, 423.1802).
Amentoflavone (2): yellow powder, UV (MeOH) λmax 220, 272, 332 nm; 1H NMR (CD3OD, 600 MHz) 7.96 (1H, brs), 7.84 (1H, brd, J = 7.8 Hz), 7.50 (2H, d, J = 7.8 Hz), 7.08 (1H, brd, J = 7.8), 6.69 (2H, d, J = 7.8), 6.56 (1H, s), 6.55 (1H, s), 6.37 (1H, brs), 6.34 (1H, s), 6.16 (1H, brs); 13C NMR (CD3OD, 150 MHz) 184.2 (C=O), 183.8 (C=O), 166.2 (CO), 166.0 (COH, CO), 164.3 (COH), 163.2 (COH), 162.5 (COH), 161.2 (COH), 159.4 (CO), 156.5 (CO), 132.8 (CH), 129.4 (CH), 128.8 (CH), 123.3 (C), 123.2 (C), 121.9 (C), 117.7 (CH), 116.8 (CH), 105.6 (C), 105.3 (C), 104.0 (CH), 103.4 (CH), 100.4 (CH), 100.2 (CH), 95.2 (CH); HRESIMS m/z 539.0941 [M+H]+ (calculated for C30H19O10+, 539.0973).
6-(4-Hydroxy-3-methylbutyl)-1,5-dihydroxyxanthone (3): yellow powder, UV (MeOH) λmax 250, 316, 370 nm; 1H NMR (CD3OD, 600 MHz) 7.65 (1H, brt, J = 8.2 Hz), 7.65 (1H, d, J = 8.1 Hz), 7.20 (1H, d, J = 8.1 Hz), 7.08 (1H, d, J = 8.2 Hz), 6.76 (1H, d, J = 8.2 Hz), 3.48 (1H, dd, J = 10.7, 5.9 Hz), 3.41 (1H, dd, J = 10.7, 6.5 Hz), 2.89 (1H, ddd, J = 13.3, 10.0, 5.5 Hz), 2.80 (1H, ddd, J = 13.3, 9.0, 6.2 Hz), 1.81 (1H, m), 1.66 (1H, m), 1.46 (1H, m), 1.01 (1H, d, J = 6.8 Hz); 13C NMR (CD3OD, 150 MHz) 183.8 (C=O), 163.1 (COH), 157.5 (CO), 146.8 (CO), 144.6 (COH), 138.6 (C), 137.9 (CH), 126.5 (CH), 120.3 (C), 116.2 (CH), 111.2 (CH), 109.6 (C), 108.2 (CH), 68.3 (CH2OH), 36.8 (CH), 34.4 (CH2), 29.0 (CH2), 17.0 (CH3); HRESIMS m/z 315.1221 [M+H]+ (calculated for C18H19O5+, 315.1227).
Scriblitifolic acid (4): yellow–beige powder, UV (MeOH) λmax 237, 249, 298, 366 nm; 1H NMR (CD3OD, 600 MHz) 7.84 (1H, d, J = 8.0 Hz), 7.63 (1H, t, J = 8.2 Hz), 7.25 (1H, d, J = 8.0 Hz), 7.02 (1H, d, J = 8.2 Hz), 6.75 (1H, d, J = 8.2 Hz), 4.03 (3H, s), 2.81 (2H, t, J = 7.1 Hz), 2.45 (1H, m), 1.98 (2H, m), 1.72 (1H, m), 1.21 (1H, d, J = 6.5 Hz); 13C NMR (CD3OD, 150 MHz) 183.4 (C=O), 182.4 (COOH), 162.9 (COH), 157.3 (CO), 151.1 (CO), 147.1 (CO), 144.8 (C), 138.1 (CH), 126.5 (CH), 121.3 (C), 121.0 (CH), 111.4 (CH), 109.6 (C), 108.3 (CH), 62.2 (OCH3), 42.0 (CH), 36.0 (CH2), 29.3 (CH2), 18.1 (CH3); HRESIMS m/z 343.1166 [M+H]+ (calculated for C19H19O6+, 343.1176).
Pancixanthone B (5): beige powder, UV (MeOH) λmax 219, 248, 325, 363 nm; 1H NMR (CD3OD, 600 MHz) 7.61 (1H, d, J = 7.8 Hz), 7.24 (1H, brs), 7.18 (1H, t, J = 7.8 Hz), 6.15 (1H, s), 4.55 (1H, q, J = 6.6 Hz), 1.61 (3H, s), 1.41 (3H, d, J = 6.6 Hz), 1.33 (3H, s); 13C NMR (CD3OD, 150 MHz) 182.2 (C=O), 167.8 (CO), 165.3 (COH), 154.1 (CO), 148.0 (COH), 146.6 (CO), 124.9 (CH), 122.7 (C), 121.2 (CH), 116.2 (CH), 114.5 (C), 104.6 (C), 94.3 (CH), 92.5 (CH), 45.0 (C), 25.9 (CH3), 21.4 (CH3), 14.6 (CH3); HRESIMS m/z 313.1075 [M+H]+ (calculated for C18H17O5+, 313.1071).
Calophyllic acid (6): dark green powder, UV (MeOH) λmax 200, 270, 320, 366 nm; 1H NMR (CDCl3, 600 MHz) 12.55 (1H, s), 7.38 (2H, m), 7.32 (1H, m), 7.30 (2H, m), 6.53 (1H, d, J = 9.5 Hz), 6.44 (1H, s), 5.42 (1H, d, J = 9.5 Hz), 4.27 (1H, dq, J = 11.5, 5.9 Hz), 2.63 (1H, dq, J = 11.5, 6.9 Hz), 1.54 (3H, d, J = 5.9 Hz), 1.26 (3H, s), 1.22 (3H, d, J = 6.9 Hz), 1.06 (3H, s); 13C NMR (CDCl3, 150 MHz) 198.7 (C=O), 170.2 (COOH), 160.5 (COH), 158.7 (CO), 156.7 (CO), 149.7 (C), 140.8 (C), 129.3 (CH), 128.5 (CH), 127.3 (CH), 126.3 (CH), 120.1 (CH), 115.6 (CH), 108.0 (C), 101.7 (C), 101.4 (C), 79.1 (CH), 78.4 (C), 45.8 (CH), 28.4 (CH3), 28.2 (CH3), 19.9 (CH3), 10.1 (CH3); HRESIMS m/z 421.1651 [M+H]+ (calculated for C25H25O6+, 421.1646).
Isocalophyllic acid (7): dark green powder, UV (MeOH) λmax 200, 270, 320, 366 nm; 1H NMR (CD3OD, 600 MHz) 7.35 (2H, m), 7.31 (3H, m), 6.56 (1H, d, J = 10.1 Hz), 6.43 (1H, s), 5.49 (1H, d, J = 10.1 Hz), 4.68 (1H, qd, J = 6.9, 3.8 Hz), 2.65 (1H, qd, J = 7.3, 3.8 Hz), 1.44 (3H, d, J = 6.9 Hz), 1.29 (3H, s), 1.19 (3H, d, J = 7.3 Hz), 0.97 (3H, s); 13C NMR (CD3OD, 150 MHz) 202.8 (C=O), 169.9 (COOH), 162.0 (COH), 160.0 (CO), 157.7 (CO), 148.6 (C), 142.4 (C), 129.8 (CH), 129.3 (CH), 128.1 (CH), 127.4 (CH), 122.6 (CH), 116.5 (CH), 109.8 (C), 102.7 (C), 102.1 (C), 79.4 (C), 78.0 (CH), 45.6 (CH), 28.7 (CH3), 28.2 (CH3), 16.7 (CH3), 9.7 (CH3); HRESIMS m/z 421.1639 [M+H]+ (calculated for C25H25O6+, 421.1646).
Inophyllum E (8): yellow powder, UV (MeOH) λmax 200, 270, 310, 366 nm; 1H NMR (CD3OD, 600 MHz) 7.28 (2H, m), 7.23 (2H, m), 7.22 (1H, m), 6.49 (1H, d, J = 10.0 Hz), 6.02 (1H, s), 5.46 (1H, d, J = 10.0 Hz), 4.65 (1H, qd, J = 6.5, 3.4 Hz), 2.64 (1H, qd, J = 7.4, 3.4 Hz), 1.41 (3H, d, J = 6.5 Hz), 1.18 (3H, d, J = 7.4 Hz), 1.04 (3H, s), 0.99 (3H, s); 13C NMR (CD3OD, 150 MHz) 202.7 (C=O), 162.0 (OC=O), 160.5 (CO), 157.7 (CO), 141.8 (C), 129.9 (CH), 128.4 (CH), 128.3 (CH), 127.7 (CH), 125.2 (CH), 146.4 (C), 116.3 (CH), 113.3 (C), 102.9 (C), 101.9 (C), 79.3 (C), 77.9 (CH), 45.5 (CH), 27.9 (CH3), 27.7 (CH3), 16.5 (CH3), 9.7 (CH3); HRESIMS m/z 403.1529 [M+H]+ (calculated for C25H23O5+, 403.1540).
27-Hydroxyacetate-canophyllic acid (9): yellow powder, 1H NMR (CDCl3, 600 MHz) 4.43 (1H, d, J = 12.2 Hz), 4.34 (1H, d, J = 12.2Hz), 3.73 (1H, m), 2.43 (1H, m), 2.21 (1H, m), 2.07 (1H, s), 1.96 (1H, m), 1.72 (1H, m), 1.55 (1H, m), 1.51 (2H, m), 1.50 (1H, m), 1.39 (1H, m), 1.38 (1H, m), 1.36 (1H, m), 1.34 (1H, m), 1.32 (1H, m), 1.31 (1H, m), 1.30 (1H, brs), 1.26 (1H, m), 1.24 (2H, m), 1.14 (1H, m), 1.11 (1H, m), 1.02 (3H, s), 0.96 (3H, s), 0.92 (3H, d, J = 7.3 Hz), 0.90 (3H, s), 0.89 (3H, s), 0.85 (1H, brs), 0.85 (3H, s); 13C NMR (CDCl3, 150 MHz) 182.9 (COOH), 171.7 (OC=O), 72.7 (COH), 65.4 (CH2), 61.3 (CH), 53.2 (CH), 49.0 (CH), 44.6 (C), 42.2 (C), 41.3 (CH2), 38.4 (CH), 38.1 (C), 37.8 (C), 37.5 (C), 36.3 (CH2), 36.1 (CH2), 35.7 (CH2), 34.7 (CH3), 32.6 (CH2), 31.9 (CH2), 29.7 (CH2), 29.6 (CH3), 28.3 (C), 25.1 (CH2), 21.6 (CH3), 21.4 (CH3), 18.6 (CH2), 17.9 (CH3), 16.5 (CH3), 15.9 (CH2), 11.9 (CH3).
Pyranojacareubin (10): yellow powder, UV (MeOH) λmax 200, 290–300, 350 nm; 1H NMR (CDCl3, 600 MHz) 13.30 (1H, s), 7.47 (1H, s), 6.72 (1H, d, J = 10.3 Hz), 6.43 (1H, s), 6.43 (1H, d, J = 10.5 Hz), 5.73 (1H, d, J = 10.5 Hz), 5.59 (1H, d, J = 10.3 Hz), 1.53 (6H, s), 1.47 (6H, s); 13C NMR (CDCl3, 150 MHz) 180.0 (C=O), 160.4 (CO), 157.8 (COH), 157.2 (CO), 145.1 (CO), 132.1 (COH), 131.2 (CH), 127.7 (CH), 121.5 (CH), 117.8 (C), 115.6 (CH), 113.7 (CH), 104.8 (C), 103.3 (C), 95.4 (CH), 79.1 (C), 78.2 (C), 28.6 (CH3), 28.5 (CH3).
Canophyllalic acid (11): green powder, 1H NMR (CDCl3, 600 MHz) 2.40 (1H, brdd, J = 13.6, 4.3 Hz), 2.39 (1H, m), 2.34 (1H, m), 2.28 (1H, m), 2.23 (1H, q, J = 6.9 Hz), 1.95 (1H, m), 1.74 (1H, m); 1.68 (1H, m), 1.67 (1H, m), 1.52 (1H, brdd, J = 12.7, 2.7 Hz), 1.51 (1H, m), 1.49 (1H, m), 1.476 (1H, m), 1.472 (1H, m), 1.44 (1H, m), 1.42 (1H, m), 1.41 (1H, brdd, J = 10.1, 2.2), 1.39 (1H, m), 1.35 (1H, brt, J = 13.6 Hz), 1.29 (1H, m), 1.27 (1H, m), 1.25 (1H, m), 1.20 (1H, m), 1.195 (1H, m), 1.17 (1H, brdd, J = 13.6, 4.3 Hz), 1.04 (3H, s), 1.03 (3H, s), 0.94 (3H, s), 0.87 (3H, d, J = 6.9 Hz), 0.86 (3H, s), 0.81 (3H, s), 0.71 (3H, s); 13C NMR (CDCl3, 150 MHz) 213.3 (C=O), 184.9 (COOH), 59.4 (CH), 58.4 (CH), 53.2 (CH), 45.0 (C), 42.2 (C), 41.6 (CH2), 41.3 (CH2), 39.1 (C), 38.0 (CH), 37.9 (C), 37.8 (C), 36.1 (CH2), 35.6 (CH2), 35.0 (CH2), 34.7 (CH3), 32.8 (CH2), 32.6 (CH2), 31.2 (CH2), 29.9 (CH3), 29.6 (CH2), 28.6 (C), 22.4 (CH2), 20.8 (CH3), 18.7 (CH3), 18.3 (CH2), 17.7 (CH3), 14.8 (CH3), 7.0 (CH3).
Canophyllol (12): green powder, 1H NMR (CDCl3, 600 MHz) 3.64 (1H, d, J = 11.9 Hz), 3.61 (1H, d, J = 11, 9 Hz), 2.38 (1H, m), 2.28 (1H, m), 2.24 (1H, q, J = 6.6 Hz), 1.96 (1H, m), 1.84 (1H, m), 1.75 (1H, m), 1.68 (1H, m), 1.53 (1H, brdd, J = 12.3, 2.2 Hz), 1.48 (1H, m), 1.47 (1H, m), 1.46 (2H, m), 1.41 (2H, m), 1.35 (1H, m), 1.32 (2H, m), 1.31 (1H, m), 1.30 (1H, m), 1.29 (2H, m), 1.27 (1H, m), 1.26 (1H, m), 1.12 (3H, s), 0.99 (3H, s), 0.97 (3H, s), 0.91 (3H, s), 0.87 (3H, d, J = 6.6 Hz), 0.86 (3H, s), 0.71 (3H, s); 13C NMR (CDCl3, 150 MHz) 213.3 (C=O), 68.2 (COH), 59.6 (CH), 58.4 (CH), 52.6 (CH), 42.2 (C), 41.6 (CH2), 41.4 (CH2), 39.6 (CH), 39.5 (C), 38.3 (C), 37.6 (C), 35.6 (CH2), 35.3 (C), 34.6 (CH2), 34.4 (CH3), 33.5 (CH2), 33.0 (CH3), 31.5 (CH2), 31.4 (CH2), 30.2 (CH2), 29.3 (CH2), 28.3 (C), 22.4 (CH2), 19.3 (CH3), 19.2 (CH3), 18.4 (CH2), 18.2 (CH3), 14.8 (CH3), 7.0 (CH3).
Canophyllic acid (13): orange powder, 1H NMR (CDCl3, 600 MHz) 3.73 (1H, m), 2.38 (1H, brdd, J = 13.3, 4.0 Hz), 1.89 (1H, m), 1.73 (1H, m), 1.66 (1H, m), 1.55 (1H, m), 1.54 (1H, m), 1.50 (1H, m), 1.45 (1H, m), 1.43 (1H, m), 1.42 (1H, m), 1.35 (1H, m), 1.34 (1H, m), 1.33 (1H, m), 1.29 (1H, m), 1.25 (1H, m), 1.245 (1H, m), 1.23 (2H, m), 1.17 (1H, m), 1.13 (1H, m), 1.03 (3H, s), 1.0 (3H, s), 0.97 (1H, m), 0.96 (3H, s), 0.934 (3H, s), 0.93 (3H, d, J = 7.0 Hz), 0.89 (1H, m), 0.85 (3H, s), 0.80 (3H, s); 13C NMR (CDCl3, 150 MHz) 184.0 (COOH), 72.9 (COH), 61.3 (CH), 53.3 (CH), 49.3 (CH), 44.9 (CH), 41.7 (CH2), 39.1 (C), 38.1 (CH), 38.0 (C), 37.9 (C), 37.5 (C), 36.1 (CH2), 35.6 (CH2), 35.3 (CH2), 35.0 (CH2), 34.7 (CH3), 32.8 (CH2), 32.7 (CH2), 31.4 (CH2), 29.9 (CH3), 29.7 (CH2), 28.6 (C), 20.7 (CH3), 18.7 (CH3), 18.0 (CH3), 17.6 (CH2), 16.5 (CH3), 16.0 (CH2), 11.8 (CH3).
Canophyllal (14): off-white powder, 1H NMR (CDCl3, 600 MHz) 9.47 (1H, s), 2.39 (1H, ddd, J = 13.4, 5.1, 2.0), 2.28 (1H, tdd, J = 13.4, 7.4, 0.9), 2.23 (1H, q, J = 7.7 Hz), 2.18 (1H, dd, J = 13.4, 4.4 Hz), 2.01 (1H, m), 1.99 (1H, m), 1.95 (1H, m), 1.74 (1H, dt, J = 12.5, 3.0 Hz), 1.52 (1H, dd, J = 12.3, 3.0 Hz), 1.50 (1H, m), 1.46 (1H, m), 1.43 (1H, m), 1.38 (1H, m), 1.37 (1H, m), 1.25 (2H, m), 1.07 (3H, s), 0.98 (3H, s), 0.95 (3H, s), 0.87 (3H, d, J = 7.7 Hz), 0.84 (3H, s), 0.71 (3H, s), 0.67 (3H, s); 13C NMR (CDCl3, 150 MHz) 213.3 (C=O), 209.4 (HC=O), 59.4 (CH), 58.3 (CH), 53.0 (CH), 48.0 (C), 42.1 (C), 41.6 (CH2), 41.5 (CH2), 38.5 (C), 38.0 (C), 37.7 (C), 36.5 (C), 35.5 (CH2), 34.9 (CH2), 34.6 (CH3), 32.6 (CH2), 32.5 (CH2), 30.7 (CH2), 29.5 (CH3), 28.2 (C), 27.3 (CH2), 22.5 (CH2), 19.9 (CH3), 18.8 (CH3), 18.2 (CH2), 17.3 (CH3), 14.6 (CH3), 6.8 (CH3).

2.4. Molecular Modeling

2.4.1. Calculation of Averaged NMR Spectra

The GAUSSIAN 09 program [12] using the hybrid B3LYP exchange–correlation functional [13,14] and the 6-31+G(d,p) basis set was used to carry out all DFT calculations. Tight convergence criteria were used for geometry optimization. All stationary points were confirmed as true minima via vibrational frequency calculations. Frequencies calculated in the harmonic approximation were multiplied by 0.98. Density functional theory (DFT) was used to perform the quantum chemical calculations. The molecular geometries were optimized by the DFT/B3LYP/6-31+G(d,p) method. Gauge including atomic orbitals (GIAO) NMR chemical shifts were calculated for the obtained geometries using the polarizable continuum model, PCM, with methanol as solvent, mPW1PW91 DFT functional and 6-31+G(d,p) basis sets to be in agreement with the DP4+ probability calculation. Averaged NMR chemical shifts were calculated from the unscaled chemical shifts of individual conformers according to their contribution calculated by Boltzmann weighting and using TMS as reference standard.

2.4.2. Conformational Study for UV–ECD Calculations

Conformational analysis was performed by stochastic exploration of the potential energy surface (PES) using the simulated annealing algorithm proposed by the Ampac11 software and combined with semi-empirical levels RM1 [15]. For the annealing, a geometry optimized at GD3BJ-B3LYP/6-311G(d,p) level was used as a starting structure. The GD3BJ term stands for empirical dispersion which was added with the D3 version of Grimme’s dispersion with Becke–Johnson damping (GD3BJ) [16]. During each annealing, only the dihedral angles of this initial geometry were allowed to relax, the bond lengths and the valence angles were kept constant. A set of 24 geometries (the conformations with energy lower than 3 kcal mol−1 compared to the lower energy conformation) were selected for each diastereomer from the structures generated by 4 simulated annealing algorithms, each performed either with an initial geometry with some dihedral angles modified or with a different annealing temperature. Then, these geometries were fully optimized (i.e., all internal coordinates released) using GD3BJ-B3LYP/6-311G(d,p) level.

2.4.3. Calculation of Averaged UV and ECD Spectra

Based on the GD3BJ-B3LYP/6-311G(d,p) optimized geometries, the UV and ECD spectra were calculated using time-dependent density functional theory (TDSCF-DFT) with CAM-B3LYP functional and 6-31++G(d,p) basis set and with the SMD(CH3OH) solvation model. SMD indicates the implicit solvent model used which is a dielectric continuum model that simulates the average effects of the solvent [17]. Calculations were performed for vertical 1A singlet excitation for 50 states. For a comparison between theoretical results and the experimental values, the calculated UV and ECD spectra have been modeled with a gaussian function using a half-width of 0.33 eV. Due to the approximations of the theoretical model used, an almost constant offset was observed between measured and calculated wavenumbers. Using UV spectra, all frequencies were calibrated by a factor of 1.05. Gaussian 16 package [18] was used to perform all calculations. It should be noted that similar calculations were performed using the LC-whPBE functional instead of CAM-B3LYP (SMD(CH3OH)/LC-whPBE/6-31++G(d,p)//GD3BJ-B3LYP/6-311G(d,p)) and led to a similar result, which is not presented here.

2.5. In Vitro Cytotoxic Assay

HepG2 (human liver cancer) and HT29 (human colon and colorectal adenocarcinoma) cell lines were used to assess the toxicity of samples. In the performed assay, cytotoxicity was expressed as a concentration-dependent reduction in the uptake of the vital dye Neutral Red (NR) when measured 24 h after treatment. NR is a weak cationic dye that readily penetrates cell membranes by non-diffusion and accumulates intracellularly in lysosomes. Alterations of the sensitive lysosomal membrane lead to lysosomal fragility and other changes that gradually become irreversible. This results in a decreased uptake and binding of NR in non-viable cells. HT29 (ATCC® HTB-38™) and HepG2 (ATCC® HB-8065™), low passage number (<50), were cultivated into DΜΕΜ (Dulbecco’s Minimum Essential Medium, PAN BIOTECH. lot 1874561) supplemented with penicillin 100 IU/mL and streptomycin 100 μg/mL (PAN BIOTECH, Lot 945514), and 10% of inactivated calf serum (PAN BIOTECH, Lot P56314), pH 7.2, freshly prepared, stored no longer than 1 week. Cells were seeded into 96-well tissue culture plates (0.1 mL per well) at a concentration of 1.105 cells/mL and incubated at 37 °C (5% CO2) until semi-confluent. The test material was diluted into sterile DMSO (stock solutions 0.1, 1 and 10 mg/mL) at final concentrations ranging from 0.1 to 250 µg/mL. The culture medium was decanted and replaced by 100 µL of fresh medium containing the various concentrations of the test material; then, cells were incubated for 24 h at 37 °C (5% CO2). At the end of the incubation period, cells were placed into Neutral Red medium (50 μg/mL NR in complete medium) and incubated for 3 h at 37 °C, 5% CO2. Then, the medium was removed, and cells were washed three times with 0.2 mL of HBSS to remove excessive dye. The Neutral Red medium was removed and the distaining solution (50% ethanol, 1% acetic acid, 49% distilled water; 50 µL per well) was added into the wells. Then, the plates were shaken for 15–20 min at room temperature in the dark. The test samples and controls were run in triplicates in three independent experiments. A fluorescence–luminescence reader Infinite M200 Pro (TECAN) was used to measure the degree of membrane damage (i.e., the increase in released NR). For each well, the Optical Density (OD) was read at 540 nm. The results obtained for test material wells were compared to those of untreated control wells (HBSS, 100% viability) and converted to percentage values. The concentrations of the test material causing a 50% release of the preloaded NR (IC50) compared to the control culture were calculated using software Phototox Version 2.0. The mean OD value of blank wells (only NR desorbed solution) was subtracted from the mean OD value of three test/untreated wells.

2.6. Feature-Based Molecular Networking

The leaf crude extract of C. tacamahaca as well as the isolated metabolites were profiled by UHPLC-QqTOF-MS/MS in a mass range from m/z 50 to 1200 using positive (+) mode for the ESI source. The following parameters were used: end plate offset at 500 V; nebulizer gas pressure at 3.5 bar; dry gas flow at 12 L/min; drying temperature at 200 °C; acquisition rate at 4.0 Hz. The capillary voltage was set at 4500 V, with a fragmentation energy of 20–40 eV. The UHPLC conditions were as follows: sample concentrations: 5 mg/mL (crude extract), 0.2 mg/mL (isolated compounds) in 100% MeOH, injection volume: 2 µL, column temperature: 40 °C, elution gradient of H2O-CH3CN with 0.1% HCO2H (98:02 over 2 min, 98:02 to 0:100 over 12 min, 0:100 over 3 min) at a flow rate of 0.5 mL/min. Raw data obtained from the crude extract analysis were converted into open format .mzXML using software Bruker Compass DataAnalysis Version 4.2 and processed using software MZmine Version 2.53 [19,20,21]. Then, a feature-based molecular network (FBMN) was created on the GNPS platform [22], and it is available via the following link https://gnps.ucsd.edu/ProteoSAFe/status.jsp?task=f0c193d2141d463ba34af46df7bfe57c (accessed on 29 March 2022). The Mzmine MS/MS data processing comprises .mzXML file import, MS peak detection, ADAP chromatogram builder, chromatogram deconvolution, isotopic peaks grouper, alignment, filtering, fragment search, adduct search and spectra normalization. Setting parameters were as follows: positive ionization mode, centroid detection, MS1 peak detection limit: 1E3, MS2 peak detection limit: 1E2, m/z tolerance: 10 ppm, peak/top edge ratio: 2, peak duration range: 0.03–1 min, m/z range for MS2 pairing: 0.02 Da, RT range for MS2 pairing: 0.1 min, representative isotope: most intense, alignment weight for m/z: 75, weight for RT: 25, filtering RT tolerance: 0.1 min, filtering m/z tolerance: 0.001 m/z, adduct search [M+Na]+, [M+NH4]+, spectra normalization type: average intensity. Processed files including an mgf and a csv file were uploaded to the GNPS platform. An FBMN was then developed using the Advanced Analysis Tools—Feature Networking workflow [23]. Advanced Network Options parameters were as follows: min pair cos: 0.7, minimum matched fragment ions: 6, network topK: 10, maximum connected component size: 100, mass tolerance for precursor and fragment ions: 0.02 Da. The output was imported into Cytoscape Version 3.8.2 in order to visualize the network. Node annotations were performed manually for isolated compounds and with GNPS spectral databases (score threshold: 0.7) and In Silico MS/MS DataBase ISDB (score threshold: 0.2) [24].

3. Results and Discussion
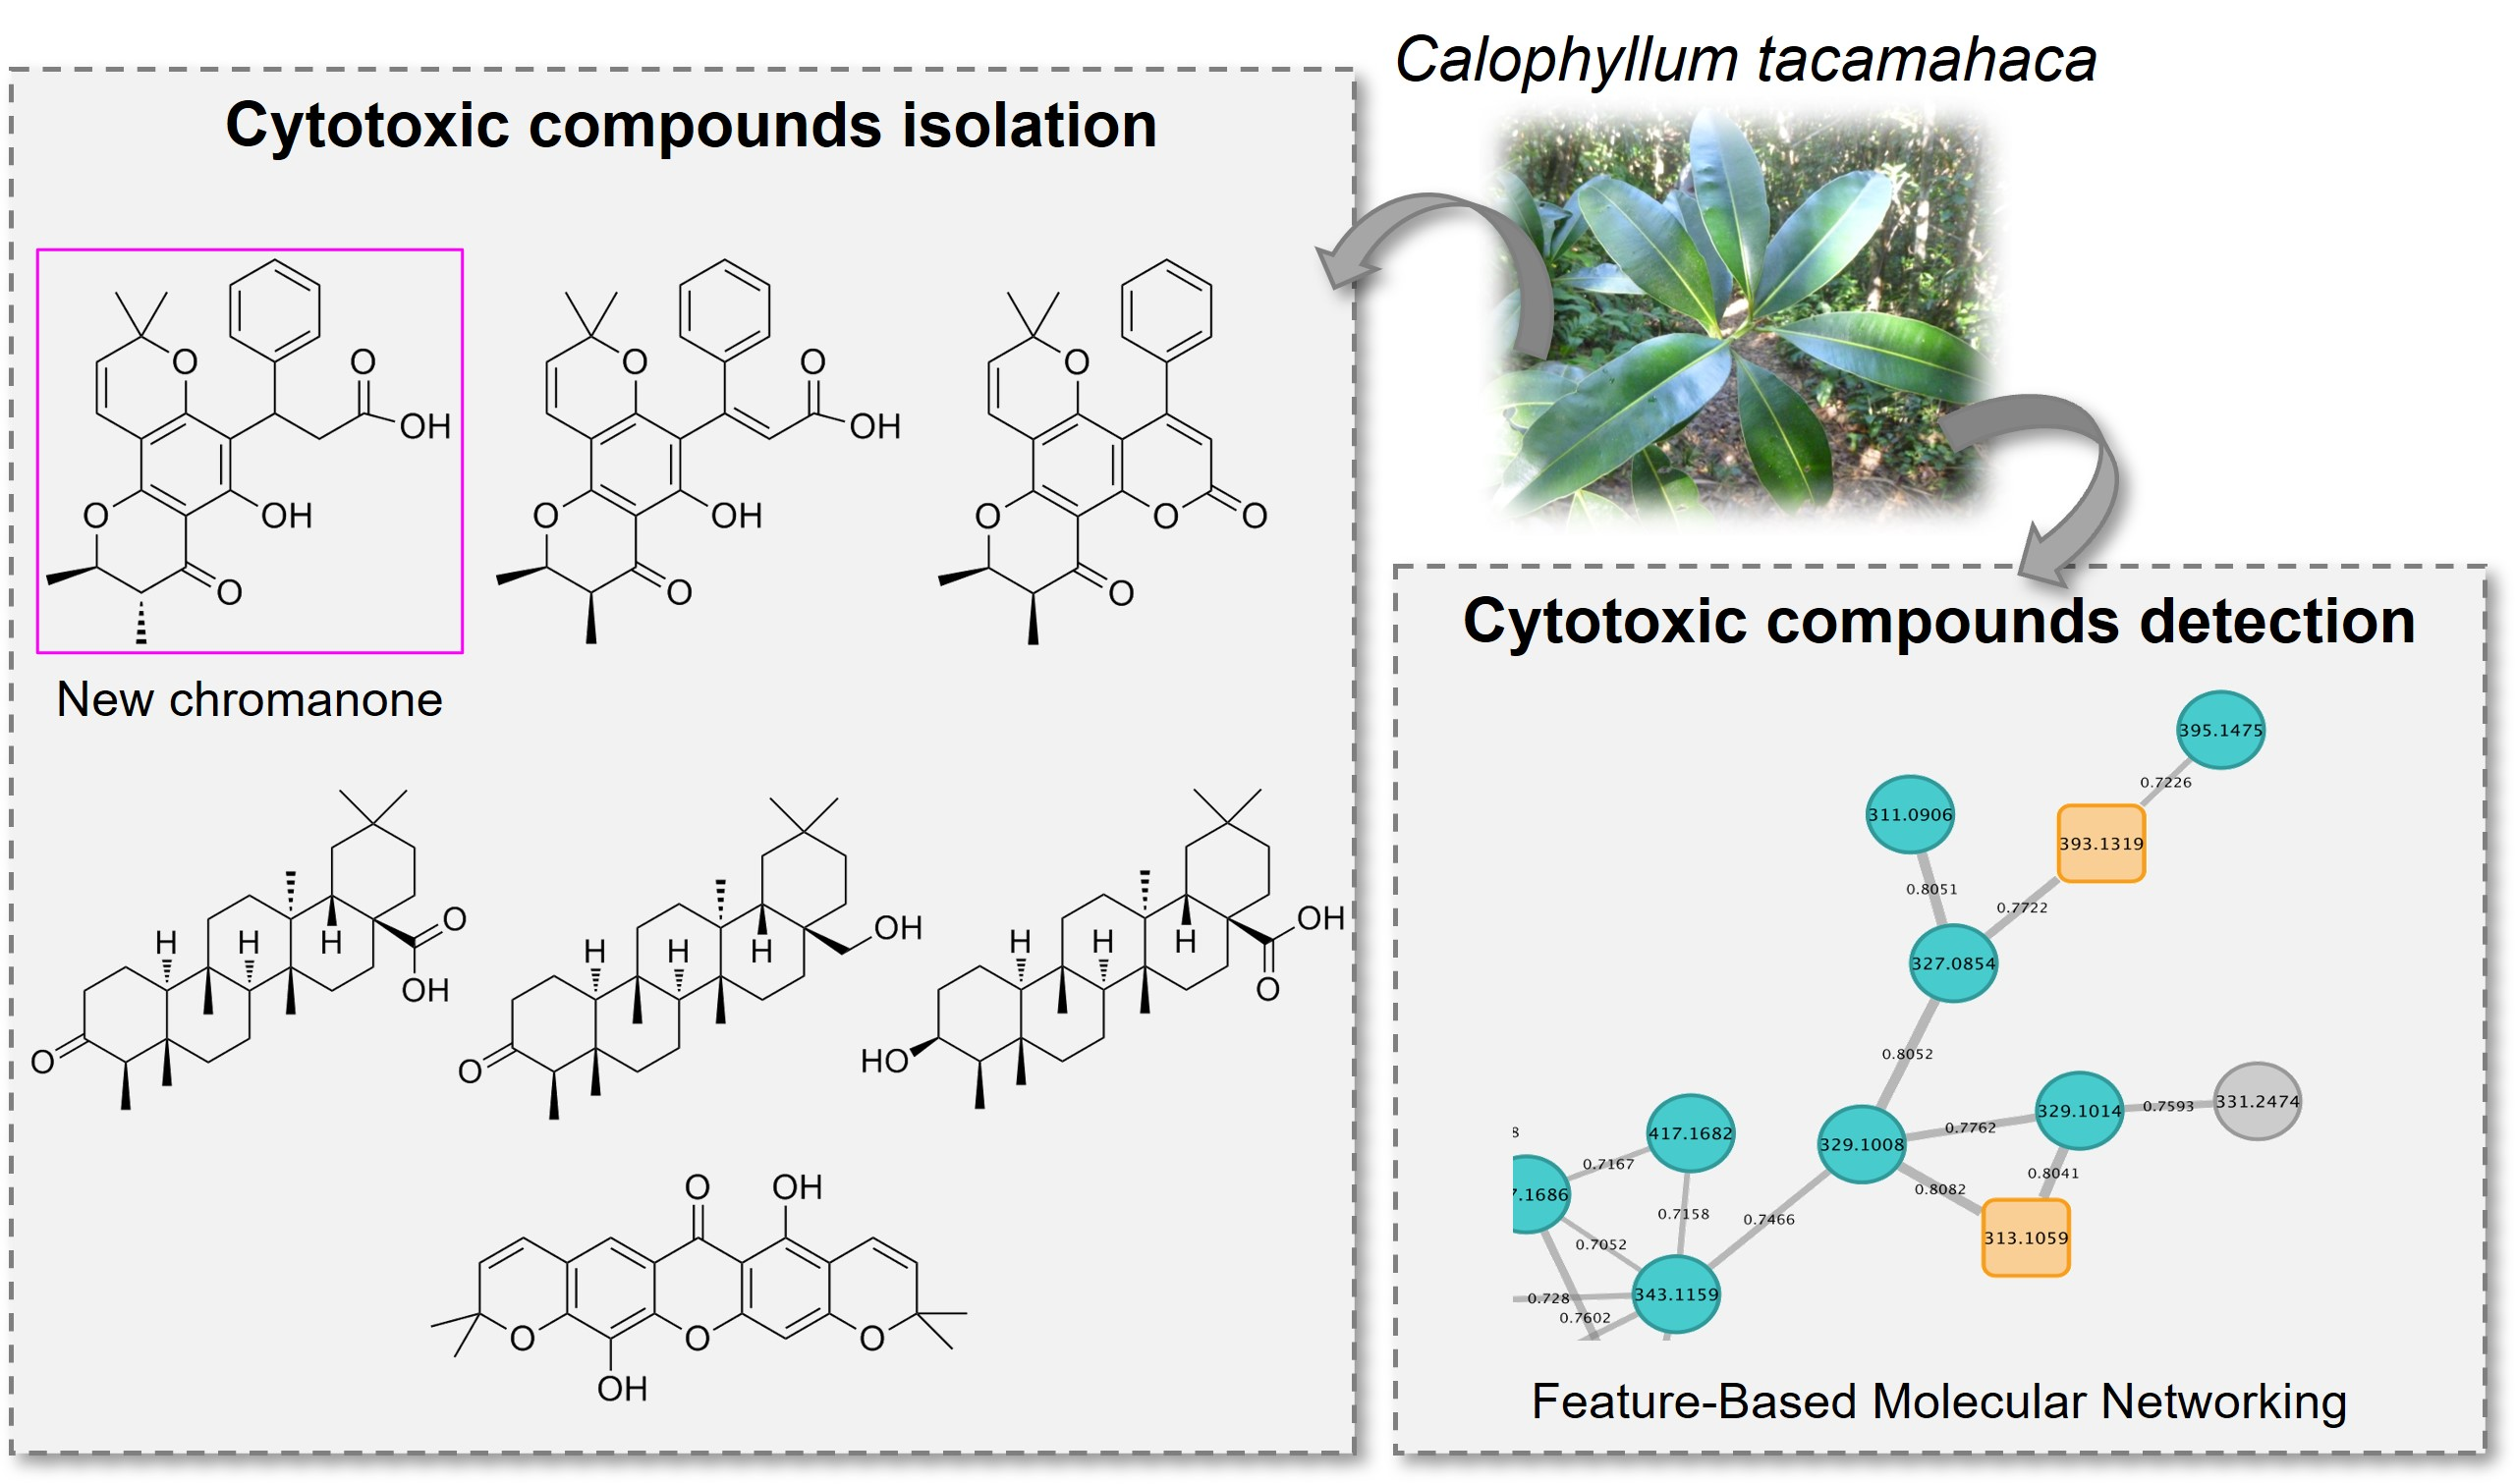
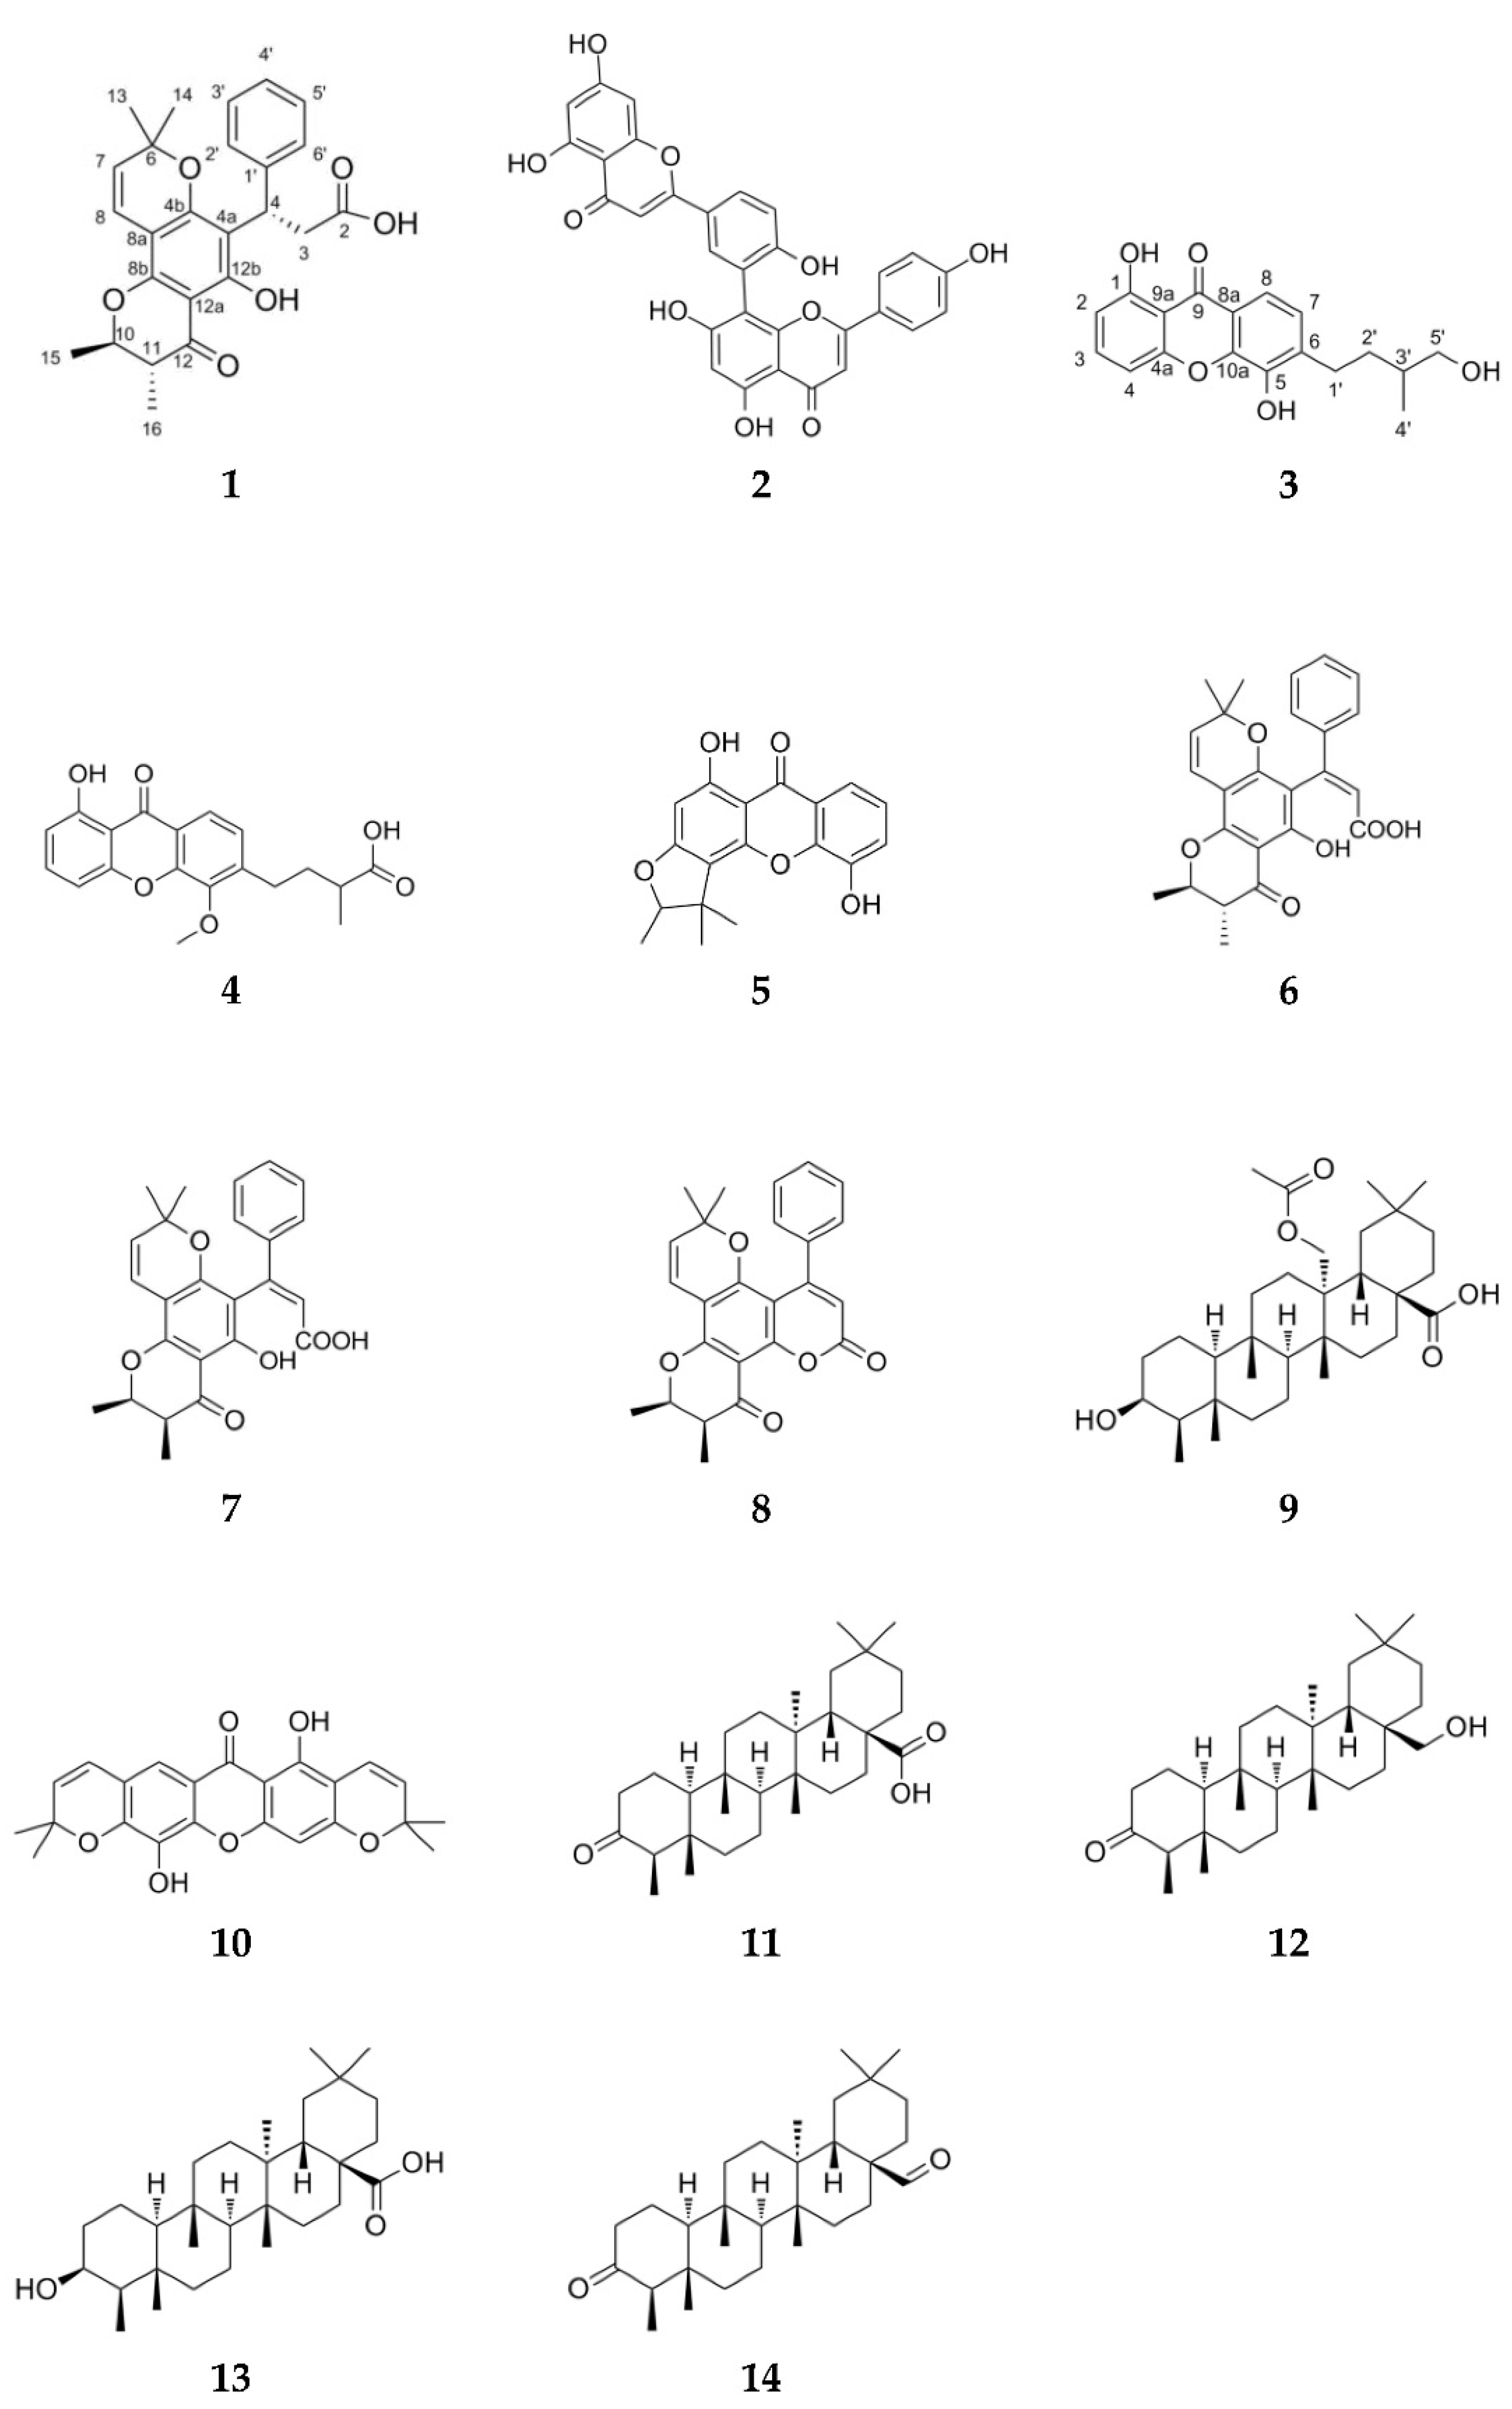
3.1. Isolation of Compounds 114

C. tacamahaca leaf EtOAc extract was subjected to a solid reverse-phase extraction and yielded three fractions (F1–F3). Fractions F2 and F3 were further purified by preparative, semi-preparative and analytical reverse-phase HPLC, resulting in the isolation of one new chromanone (1) and 13 known compounds (214) (Figure 1). The latter were identified by comparison with previously reported spectroscopic data as amentoflavone (2) [25], scriblitifolic acid (4) [26], pancixanthone B (5) [27], calophyllic acid (6) [28] isocalophyllic acid (7) [28], inophyllum E (8) [28,29], 27-hydroxyacetate-canophyllic acid (9) [30], pyranojacareubin (10) [31], canophyllalic acid (11) [32], canophyllol (12) [32], canophyllic acid (13) [32] and canophyllal (14) [33]. Spectroscopic data of the known metabolite 3, identified as 6-(4-hydroxy-3-methylbutyl)-1,5-dihydroxyxanthone [34], have not been published so far and are provided here (Section 2 and Figures S11–S15). The structure of the new compound 1 was established based on 1D and 2D NMR, IR and UV spectroscopic and HRESIMS spectrometric data.

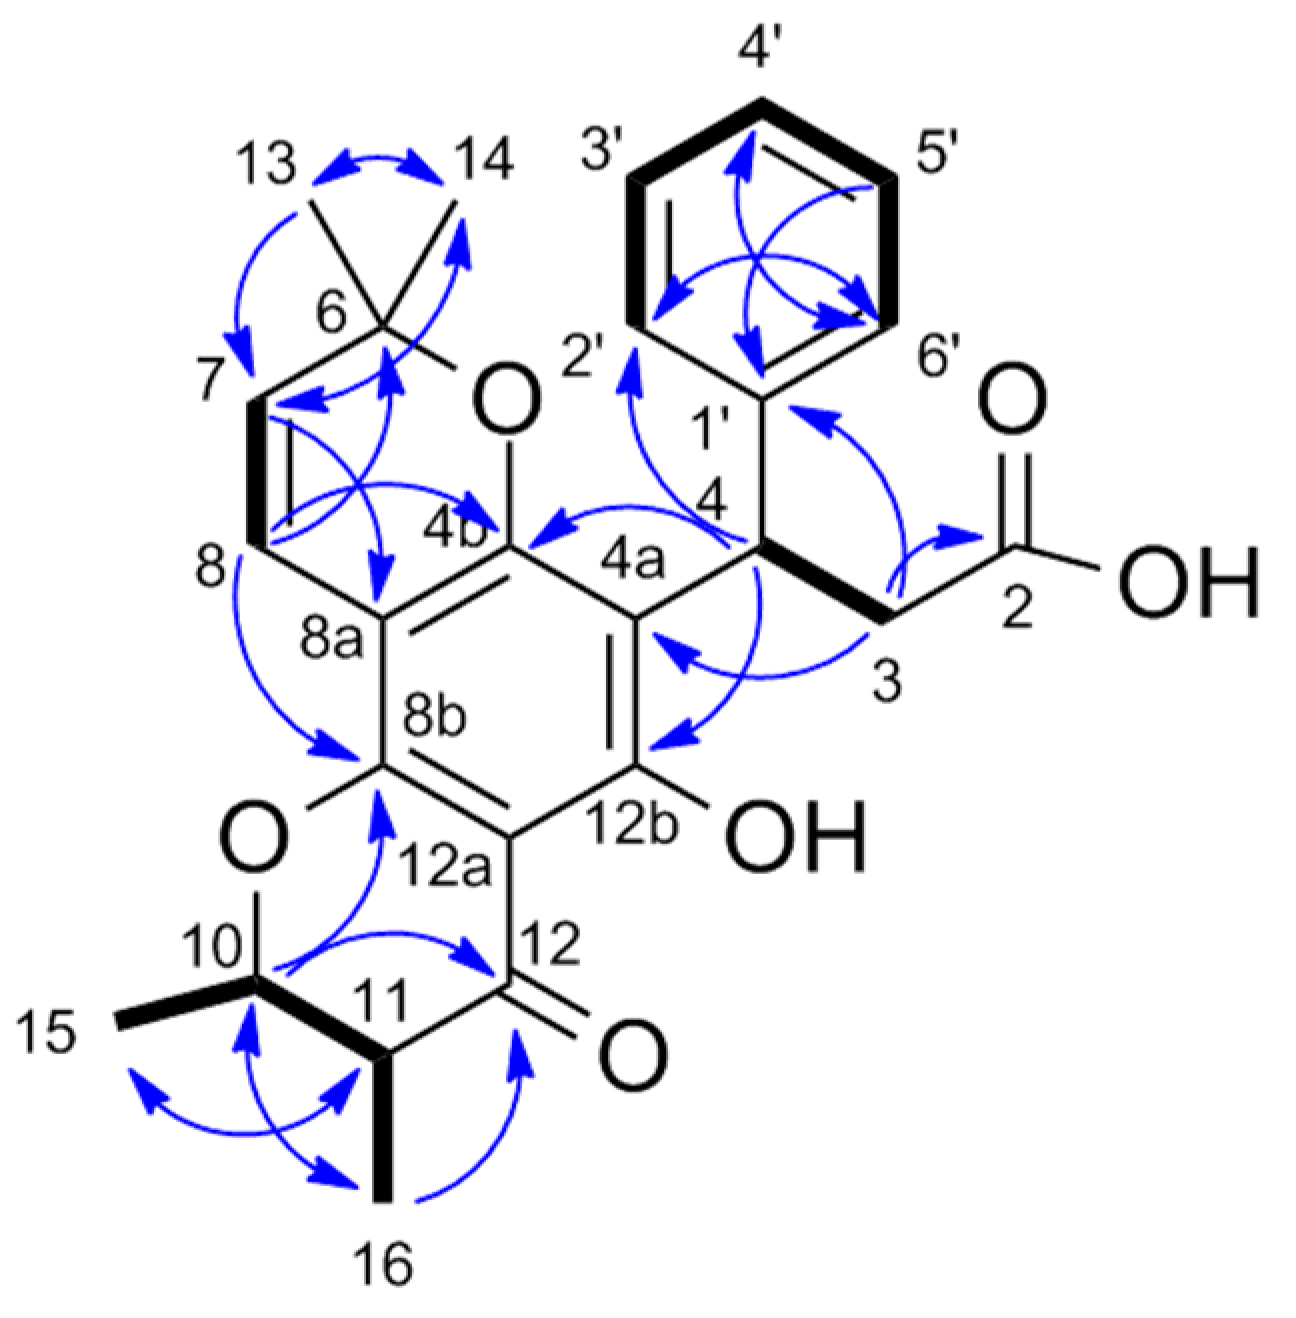
3.2. Structure Elucidation of Isocaloteysmannic Acid (1)

Isocaloteysmannic acid (1), [ α ] D 25 −31.7 (c 0.1, MeOH), was isolated as a yellow–green powder. The molecular formula C25H26O6 was established from HRESIMS data showing a molecular ion peak at m/z 423.1791 [M+H]+ (calculated for C25H27O6+, 423.1802), suggesting the occurrence of 13 degrees of insaturation. The UV spectrum exhibited absorption maxima at 200, 264–274, 299–312 and 368 nm, characteristic of a pyranochromanone moiety [35]. The IR spectrum exhibited characteristic bands of sp3 type CH (2926 cm−1), sp2 type CH (3087 cm−1), carboxylic acid function (1709 cm−1), aromatic rings (1627 cm−1) and ether function (1000 and 1300 cm−1). The 1H and 13C NMR data of (1) (Table 1 and Figures S2 and S3) are similar to those of caloteysmannic acid [35]. The 1H and 13C NMR spectra showed aromatic signals at δH/C 7.33 (H-2′, H-6′, doublet)/128.8 (C-2′, C-6′), δH/C 7.20 (H-3′, H-5′, borad triplet)/128.8 (C-3′, C-5′) and δH/C 7.10 (H-4′, triplet)/126.7 (C-4′), consistent with the phenyl group of the chromanone. The COSY spectrum (Figure S4) showed correlations consistent with the spin system H-2′−H-3′−H-4′−H-5′−H-6′. Signals observed at δH/C 5.48 (H-7, doublet)/127.3 (C-7) and δH/C 6.49 (H-8, doublet)/116.7 (C-8) correspond to the spin-pair of two sp2 methine protons. Characteristic signals of protons H-10 and H-11 are observed at δH/C 4.18 (H-10, doublet of quadruplet)/80.3 (C-10) and δH/C 2.61 (H-11, doublet of quadruplet)/46.9 (C-11). The two signals observed at δH/C 3.07 (H-3a, doublet of doublet)/38.2 (C-3) and 3.27 (H-3b, doublet of doublet)/38.2 (C-3) correspond to diastereotopic protons. The 1H and 13C NMR spectra show a deshielded signal at δH/C 5.07 (H-4, broad triplet)/36.3 (C-4), corresponding to the alkane proton in beta position of the acid carboxylic function. These positions were confirmed with the COSY spectrum (Figure S4) showing a correlation between H-3 (δH 3.07, 3.27) and H-4 (δH 5.07). Four signals corresponding to methyl groups are observed at δH/C 1.01 (H-13, singlet)/27.5 (C-13), δH/C 1.41 (H-14, singlet)/28.5 (C-14), δH/C 1.49 (H-15, doublet)/19.8 (C-15) and δH/C 1.19 (H-16, doublet)/10.3 (C-16). The COSY spectrum (Figure S4) shows correlations between H-15 (δH 1.49) and H-10 (δH 4.18), and between H-16 (δH 1.19) and H-11 (δH 2.61). Finally, the characteristic signals of the acid carboxylic and the ketone functions are observed on the 13C NMR spectrum at δC 177.2 (C-2) and δC 200.7 (C-12), respectively. The linkage and the substitution pattern of (1) is determined from HMBC correlations (Figure 2 and Figure S6). The HMBC correlations of H-4 (δH 5.07) to C-2′ (δC 128.8) and C-6′ (δC 128.8) and those of H-3 (δH 3.07, 3.27) to C-1′ (δC 145.2) indicate the substitution of C-4 (δC 36.3) by the phenyl group. The carboxylic acid function position in C-2 (δC 177.2) is confirmed by the 2JHC correlation of H-3 (δH 3.07, 3.27) to C-2 (δC 177.2). The HMBC correlations of methyl protons H-13 (δH 1.01) and H-14 (δH 1.41) to C-6 (δC 79.2) indicate these two methyl groups are borne by the same carbon C-6 (δC 79.2). The HMBC correlations of H-7 (δH 5.48) to C-14 (δC 28.5) and C-8a (δC 102.9), and of H-8 (δH 6.49) to C-4b (δC 160.9), C-6 (δC 79.2) and C-8b (δC 156.8) confirmed the A and C rings linkage. The HMBC correlations of H-4 (δH 5.07) to C-4b (δC 160.9) and C-12b (δC 162.2), and of H-3 (δH 3.07, 3.27) to C-4a (δC 113.0) indicate the substitution of C-4a (δC 113.0) by the phenyl-bearing saturated chain. Finally, the HMBC correlations of H-10 (δH 4.18) and H-11(δH 2.61) to C-16 (δC 10.3) and C-15 (δC 19.8), respectively, of H-10 (δH 4.18) to C-12 (δC 200.7) and C-8b (δC 156.8), and those of H-16 (δH 1.19) to C-12 (δC 200.6) confirm the D ring configuration. Based on NMR data, the 3JH-10/11 coupling constant (11.3 Hz) between the vicinal protons H-10 and H-11 indicate a dihedral angle consistent with an axial–axial coupling constant [36]. In a previous work, Patil et al. showed that the only possible configuration for these trans-diaxial H-10 and H-11 vicinal protons is a configuration of C-10 and C-11 carbons 10R, 11R [28]. Consequently, two potential diastereoisomers were conceivable for compound 1: (4R,10R,11R) or (4S,10R,11R) (Figure 3).

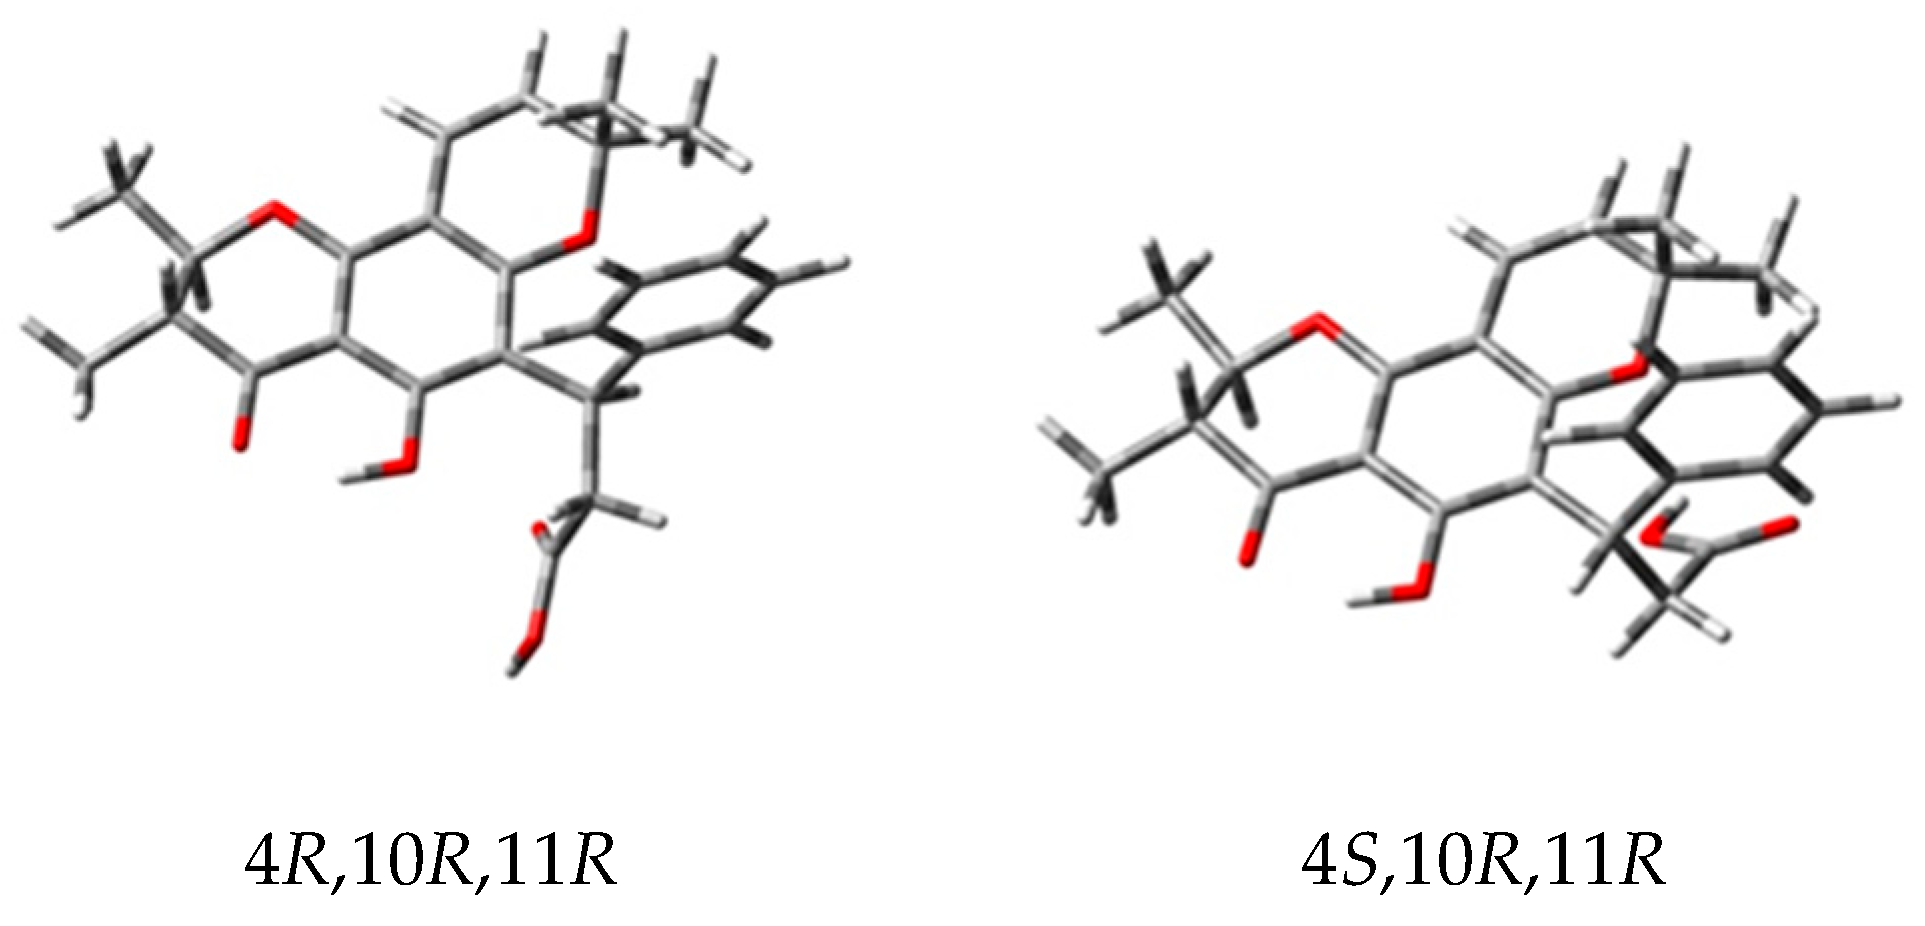
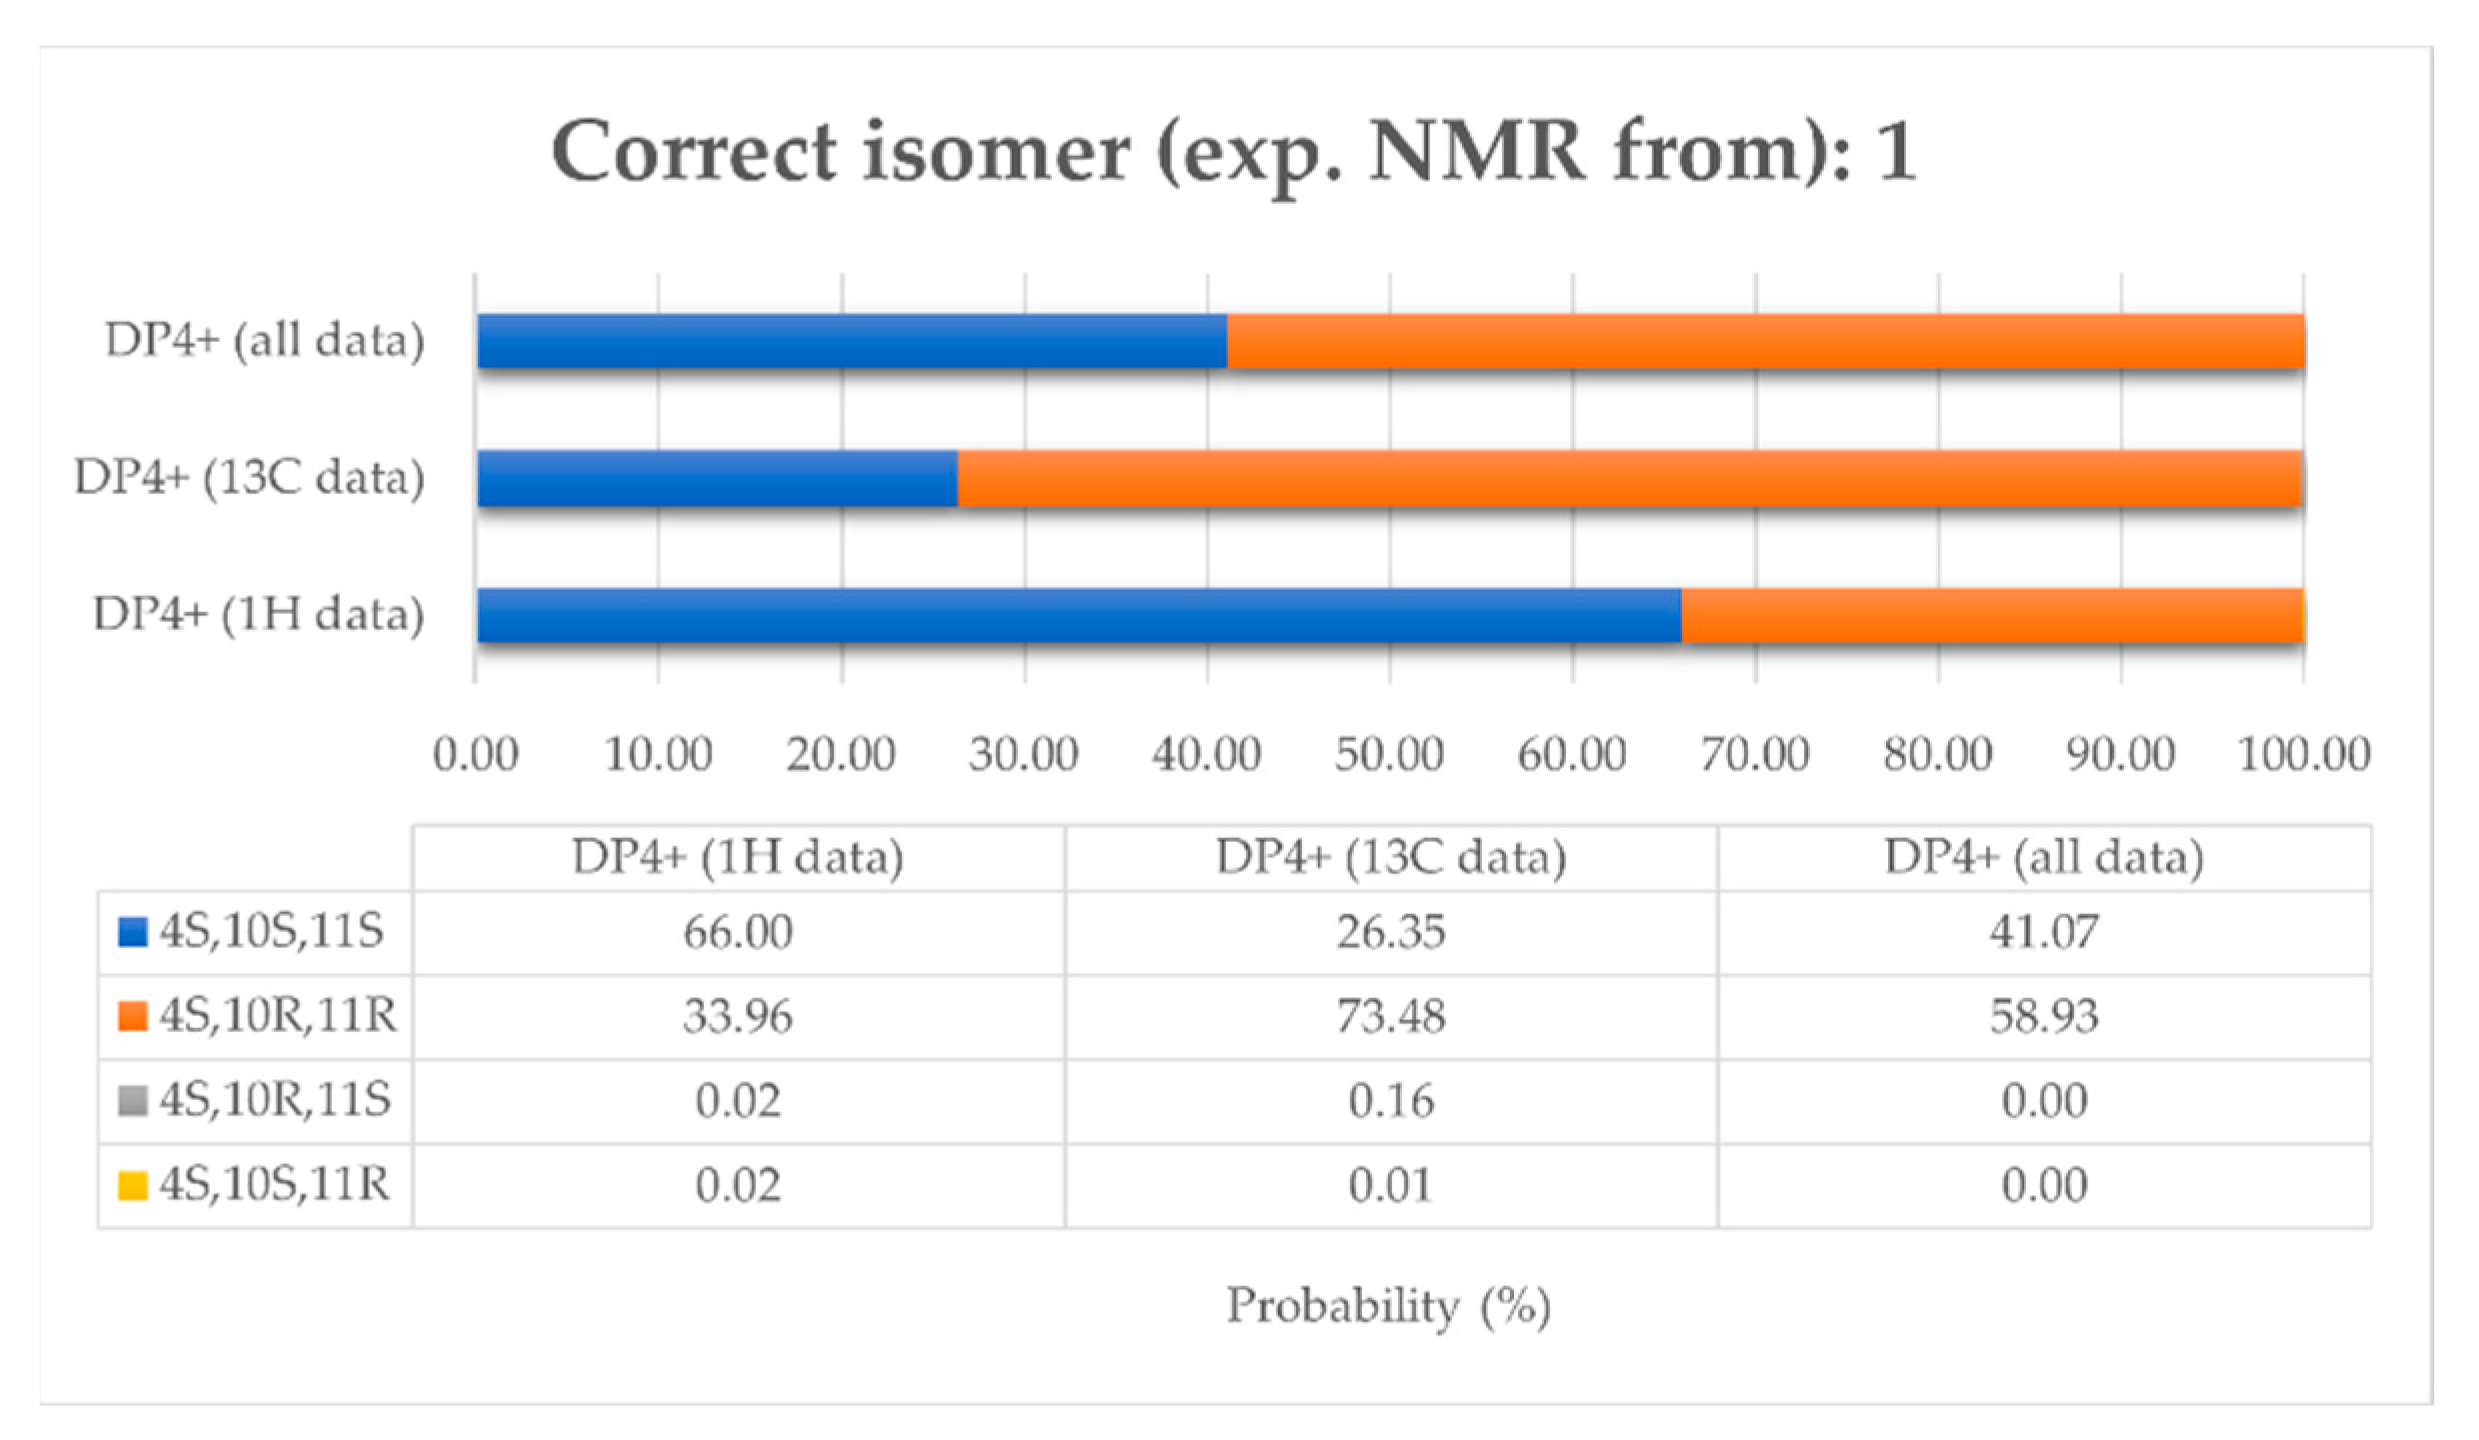
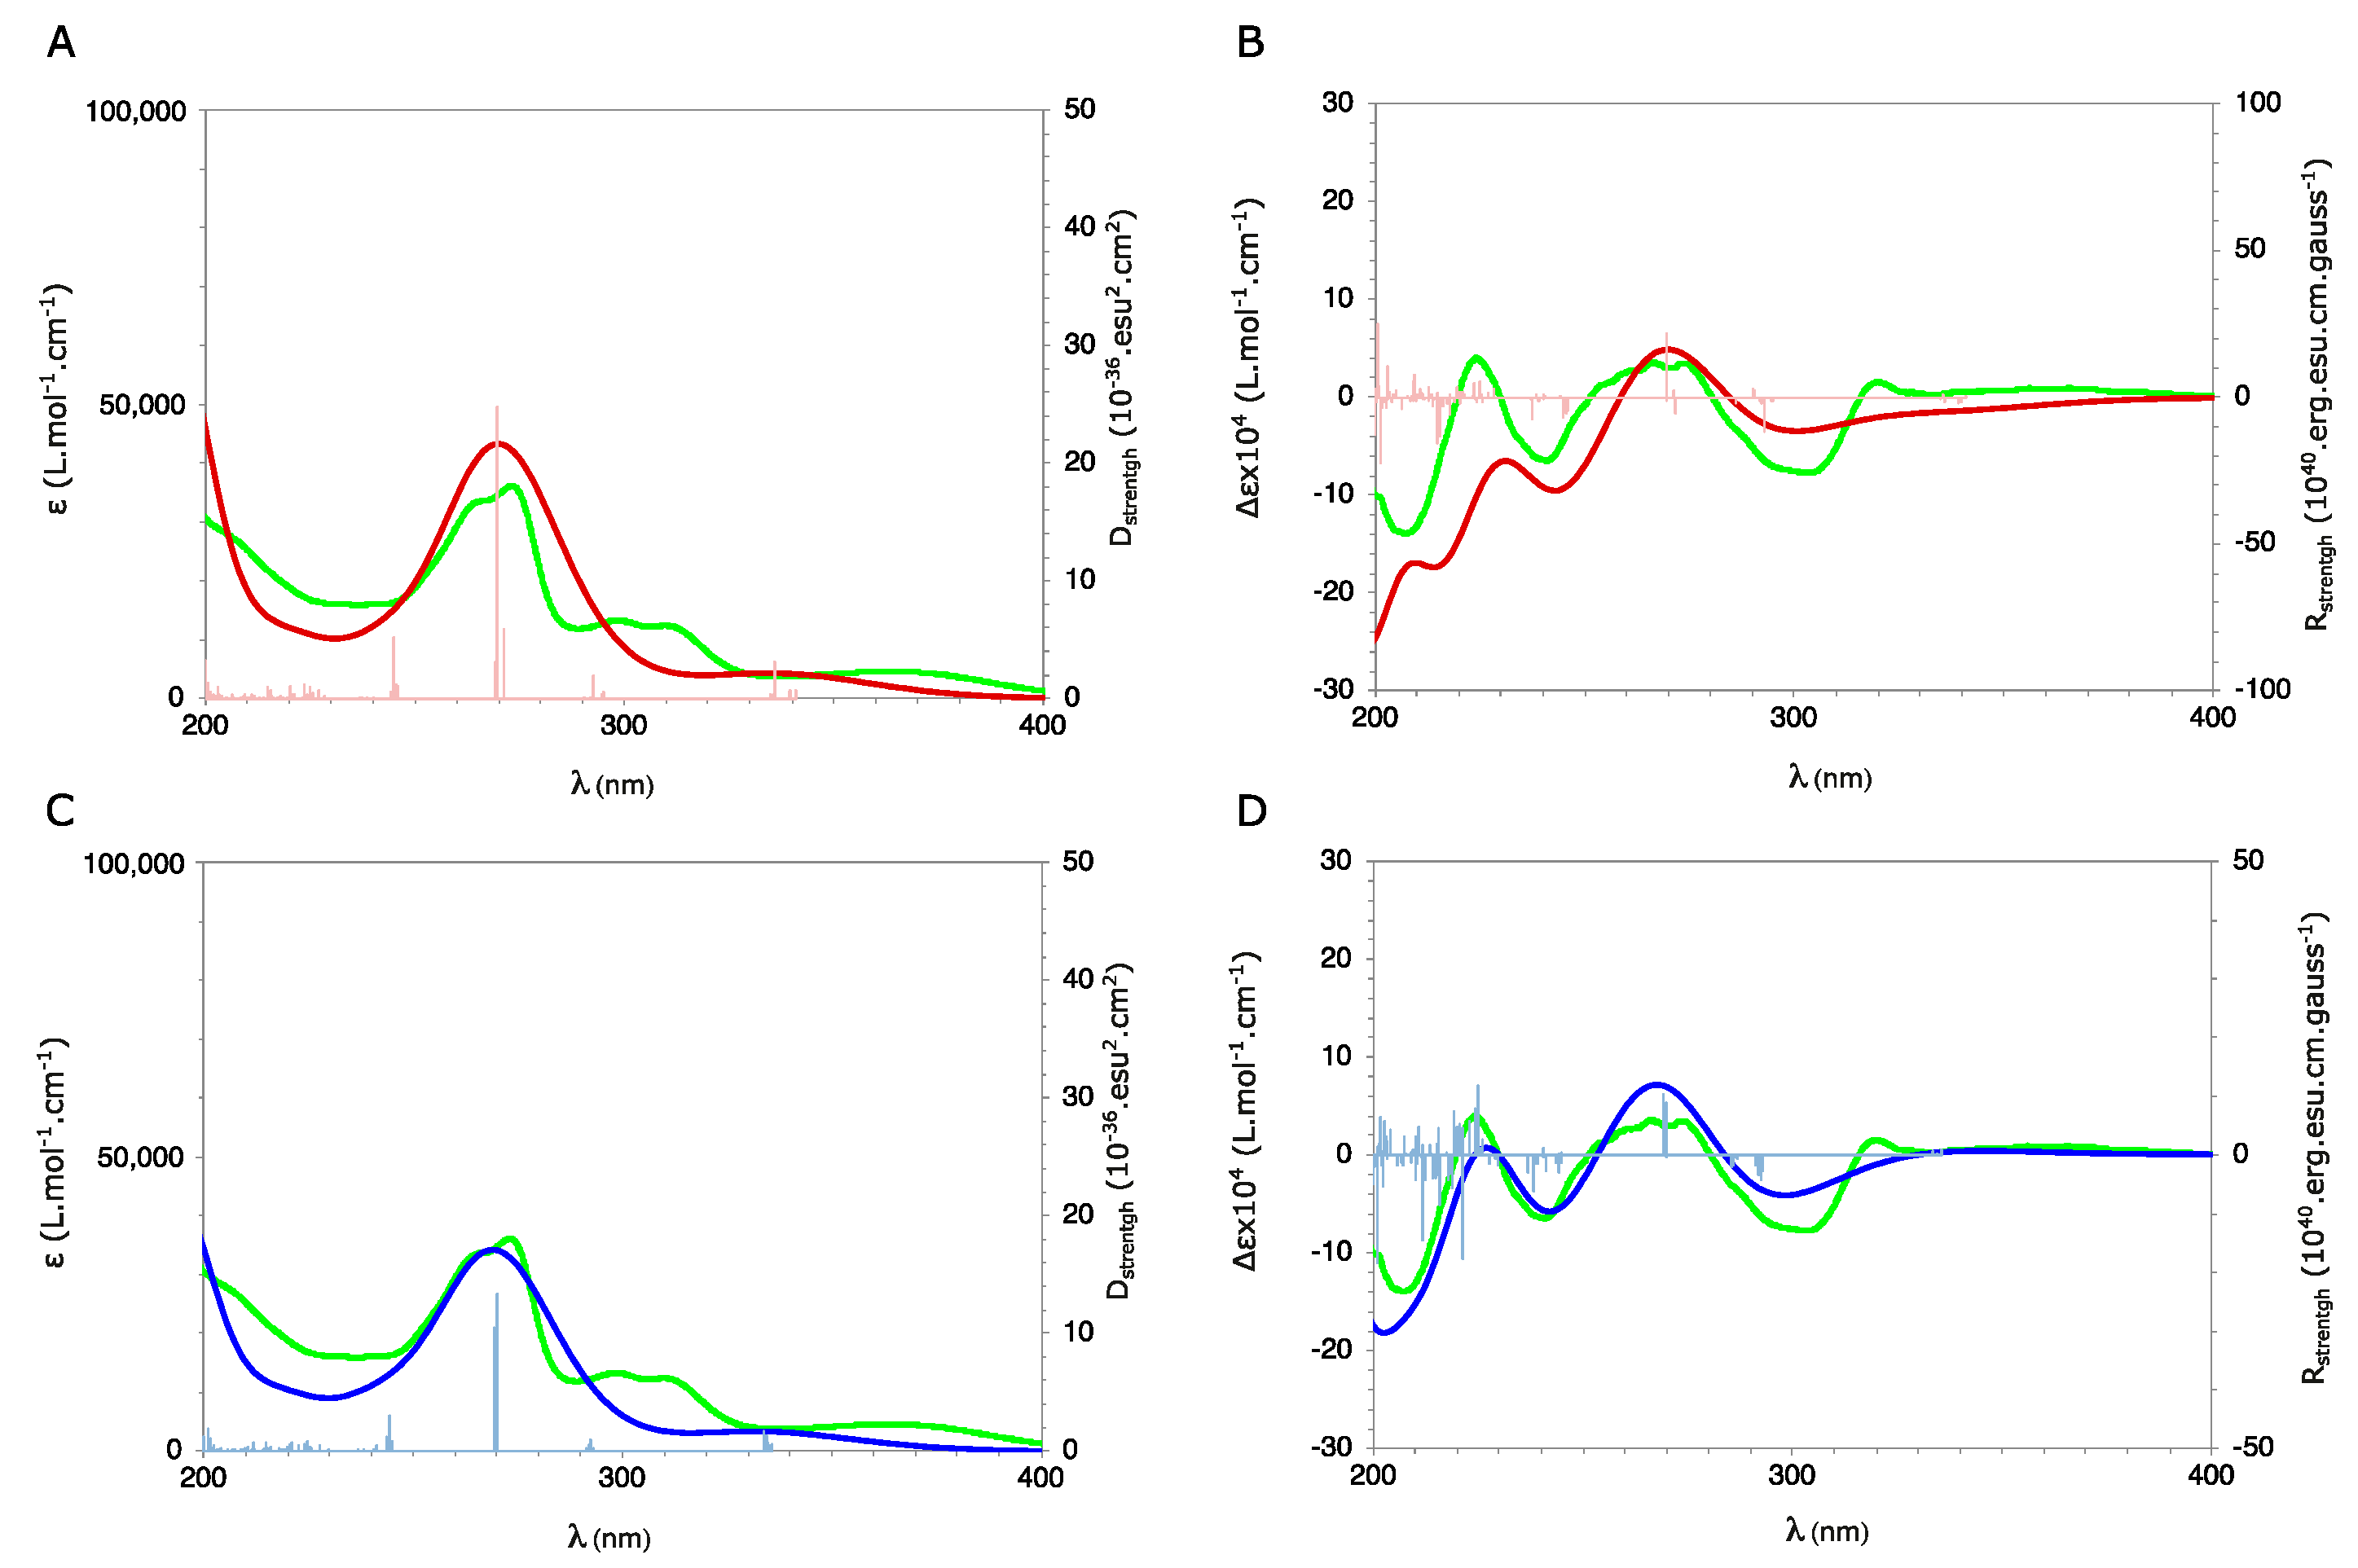
3.3. Absolute Configuration of Isocaloteysmannic Acid (1)

First, to confirm the configuration of C-10 and C-11 carbons and to determine the configuration of C-4 carbon, experimental chemical shifts (1H and 13C) of compound (1) were compared with calculated chemical shifts of four isomers (4S,10S,11S), (4S,10R,11R), (4S,10R,11S), (4S,10S,11R). For these four isomers, the equilibrium population of each conformer was calculated from its relative free energy using Boltzmann statistics, 36 conformers for (4S,10S,11S), 37 conformers for (4S,10R,11R), 39 conformers for (4S,10R,11S), and 48 conformers for (4S,10S,11R) (Tables S1–S4). NMR chemical shifts have been calculated with the GIAO method at the PCM/mPW1PW91/6-31+G(d,p) level allowing to use the DP4+ probability [37]. Experimental chemical shifts have been compared to theorical chemical shifts of each isomer individually by linear regressions of δ1Htheorical = f(δ1Hexperimental) and δ13Ctheorical = f(δ13Cexperimental) and all together with the DP4+ probability (Table S5). Assignment by 1H-DP4+ and 13C-DP4+ did not converge to the same isomer, and when including all the data, probabilities were shared between two isomers (4S,10S,11S) (41.07%) and (4S,10R,11R) (58.93%) (Figure 4). Therefore, the results of these comparisons did not allow unambiguous determination of the absolute configuration of compound 1 but did confirm the trans-configuration of C-10 and C-11.
The absolute configuration of (1) was established by ECD by comparing the measured spectra with those calculated using DFT and TD-DFT for diastereomers (4S,10R,11R) and (4R,10R,11R) according to the previous NMR analysis (Figure 3).
The UV and ECD spectra of (4S,10R,11R) and (4R,10R,11R) were built, respectively, from the individual spectra of the A1–6 and B1–6 conformations weighed by their Boltzmann population (Appendix A). The comparison of the calculated UV spectra for the two diastereomers showed a good agreement with the measured spectrum, without allowing to establish the absolute configuration of the C-4 atom. Furthermore, the calculated ECD spectra showed a clear sign difference around 215 nm: positive bands for (4S,10R,11R) and negative bands for (4R,10R,11R) (Figure 5A–D).
Comparison with the corresponding measured spectrum showed excellent agreement with that calculated for the (4S,10R,11R) configuration (Figure 5A–D). In particular, the band around 215 nm is positive as in the measured spectrum. This ECD analysis therefore confirmed the R-configuration of the C-10 and C-11 atoms, but also unambiguously established that the C-4 atom is of absolute configuration S. Consequently, compound 1 has the absolute configuration (4S,10R,11R).
Compound 1 is a trans-epimer of caloteysmannic acid, a chromanone with (4S) configuration and cis-configuration of vicinal protons H-10, H-11 (10S,11R) previously isolated from Calophyllum teysmannii [35]. Therefore, (1) was named isocaloteysmannic acid.

3.4. Cytotoxic Activity of the Isolated Compounds

Ten isolated compounds were evaluated for their cytotoxic properties against the two cancer cell lines HepG2 and HT29. Due to their paucity, compounds 35 and 14 were not evaluated. Compounds 7, 8, 10, 11, 12 and 13 showed a potent activity against one or both cell lines, with IC50 values ranging from 2.44 to 15.38 µg/mL (Table 2). The new compound 1, as well as compound 6, exhibited a moderate activity against both cell lines with IC50 values ranging from 15.98 to 25.68 µg/mL.
The triterpenes 1113 showed a potent activity, whereas triterpene 9 exhibited only a weak activity, suggesting that the presence of the acetoxy group in 9 could decrease its cytotoxic potential.
These results also suggest that the cis-configuration of the methyl groups in C-10 and C-11 of compounds 7 and 8 leads to a higher cytotoxic activity than the trans-configuration (compounds 1 and 6).

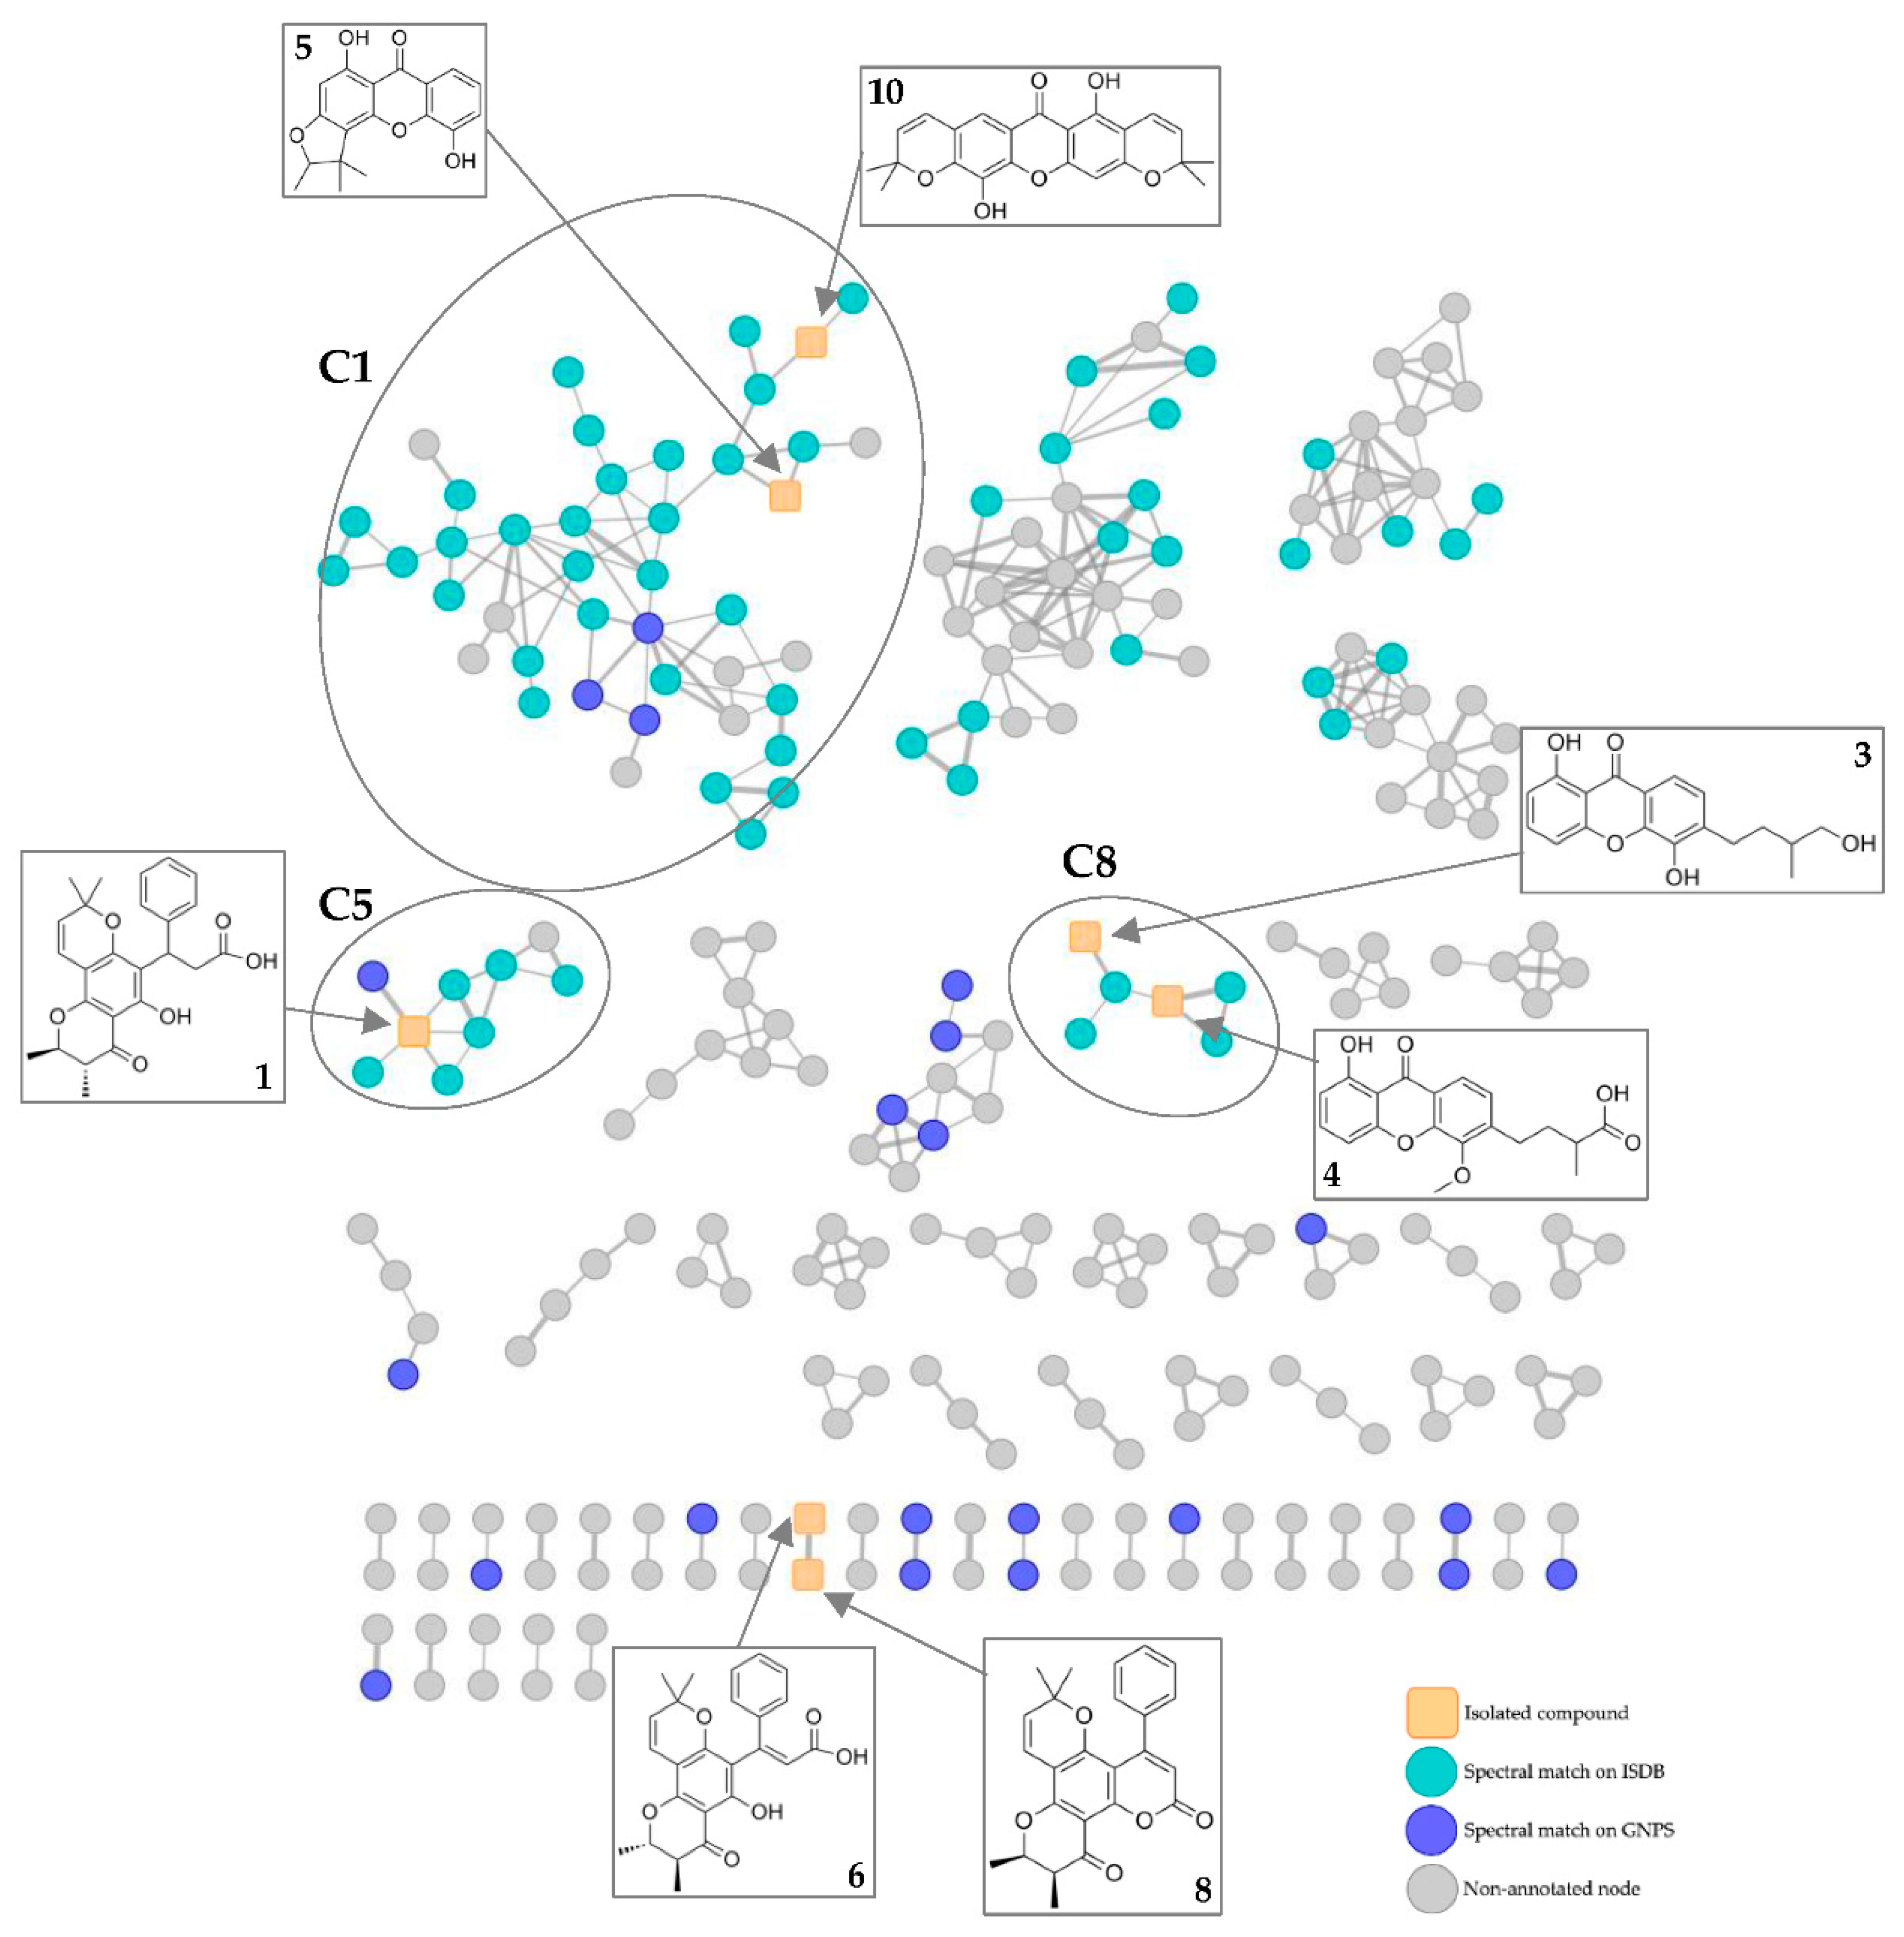
3.5. Feature-Based Molecular Networking Analysis of the Crude Extract

A feature-based molecular networking (FBMN) [23] approach was performed in order to provide more information about the chemodiversity of the species and to detect additional cytotoxic metabolites by highlighting close analogues of the bioactive isolated compounds. For this purpose, leaf EtOAc extract was subjected to an UHPLC-HRESIMS/MS analysis and a molecular network (MN) was generated with the FBMN tool on the GNPS platform.

3.5.1. Chemodiversity of the Species

A molecular network (MN) comprising 520 features and 55 clusters (two features at least) was obtained (Figure 6). Squared orange nodes correspond to the isolated compounds 1, 3, 4, 5, 6, 8 and 10. Green nodes correspond to spectral matches on GNPS or ISDB databases. The edge thickness correlates with the cosine score (CS) value (0.7–1) between two nodes.
Relatively few consistent spectral matches on GNPS or ISDB databases were obtained. Based on these matches, the largest cluster C1 (43 nodes) could correspond to xanthones. Two nodes correspond to the isolated xanthones 5 and 10, and three nodes were putatively identified as xanthones previously reported in the genus Calophyllum: 6-deoxyisojacareubin, mammea B/BA and caloxanthone. Seven nodes could correspond to xanthones reported in close botanical families of Calophyllaceae: elliptoxanthone B (Hypericaceae), garcinexanthone C (Clusiaceae), celebixanthone (Hypericaceae), nigrolineaxanthone K (Clusiaceae), garcinone A (Clusiaceae), hypericumxanthone B (Hypericaceae) and garcimangosone C (Clusiaceae).
Cluster C8 is another cluster of xanthones, containing the isolated metabolites 3 and 4, as well as one node putatively identified as caloxanthone H. The latter was previously reported in the genus Calophyllum.
The new compound 1 is located in cluster C5. In the latter, one node corresponds to a close analogue of 1 (m/z 423.1785, CS > 0.9). Based on ISDB matches, this close analogue was putatively identified as isochapelieric acid, a compound isolated from the species Calophyllum calaba [38].
These observations are consistent with the data in the literature, indicating that xanthones and chromanones are largely represented in the genus Calophyllum.

3.5.2. Detection of Additional Bioactive Metabolites

Two analogues of the cytotoxic isolated compound pyranojacareubin (10) have been detected in cluster C1 (Figure 7) at m/z 395.1475 and m/z 327.0854. Based on structure–activity relationship, these analogues could correspond to cytotoxic metabolites. They were putatively identified as muxiangrine I and elliptoxanthone B, according to ISDB matches. To the best of our knowledge, no cytotoxic properties have been reported in the literature for these compounds. As these identifications are highly hypothetical, it would be necessary to target the isolation of these two compounds, to identify them and assess their biological properties in a future work.

4. Conclusions

Fourteen metabolites (114) were isolated from the EtOAc leaf extract of C. tacamahaca. To the best of our knowledge, compound 1 was reported for the first time. Six compounds (7, 8, 10, 11, 12 and 13) showed a potent cytotoxicity against HepG2 and/or HT29 cell lines. The FBMN approach allowed the detection of a large amount of xanthones in the extract, including two close analogues of the cytotoxic compound 10. Xanthones are well known for their cytotoxic properties [2], so the results of this study suggest that C. tacamahaca leaves are a significant source of cytotoxic metabolites. These compounds could be interesting candidates for future therapeutic applications. Nevertheless, further studies are needed to evaluate their in vivo anticancer activity, as well as their mechanism of action, and thus confirm their therapeutic potential.

Supplementary Materials

The following supporting information can be downloaded at: https://www.mdpi.com/article/10.3390/metabo13050582/s1, Figure S1: HRESIMS spectrum for isocaloteysmannic acid (1); Figure S2: 1H NMR (600 MHz, CD3OD) spectrum for isocaloteysmannic acid (1); Figure S3: 13C NMR (150 MHz, CD3OD) spectrum for isocaloteysmannic acid (1); Figure S4: 1H-1H COSY NMR (600 MHz, CD3OD) spectrum for isocaloteysmannic acid (1); Figure S5: 1H-13C HSQC NMR (600 MHz, CD3OD) spectrum for isocaloteysmannic acid (1); Figure S6: 1H-13C HMBC NMR (600 MHz, CD3OD) spectrum for isocaloteysmannic acid (1); Figure S7: Plot of Boltzmann-weighted calculated NMR δ 13C of 4R,10R,11R and 4S,10R,11R isomers versus experimental NMR δ 13C of isocaloteysmanic acid (1); Figure S8: UV (left) and ECD (right) spectra calculated using SMD(CH3OH)/CAM-B3LYP/6-31++G(d,p)//GD3BJ-B3LYP/6-311G(d,p) level for (4R,10R,11R) (red) and (4S,10R,11R) (blue); Figure S9: Conformations A1 to A6 selected to build the UV and ECD spectra of the diastereomer (4R,10R,11R). Geometries optimized to the level GD3BJ-B3LYP/6-311G(d,p); Figure S10: Conformations B1 to B6 selected to build the UV and ECD spectra of the diastereomer (4S,10R,11R). Geometries optimized to the level GD3BJ-B3LYP/6-311G(d,p); Figure S11: HRESIMS spectrum for 6-(4-Hydroxy-3-methylbutyl)-1,5-dihydroxyxanthone (3); Figure S12: 1H NMR (600 MHz, CD3OD) spectrum for 6-(4-Hydroxy-3-methylbutyl)-1,5-dihydroxyxanthone (3); Figure S13: 1H-1H COSY NMR (600 MHz, CD3OD) spectrum for 6-(4-Hydroxy-3-methylbutyl)-1,5-dihydroxyxanthone (3); Figure S14: 1H-13C HSQC NMR (600 MHz, CD3OD) spectrum for 6-(4-Hydroxy-3-methylbutyl)-1,5-dihydroxyxanthone (3); Figure S15: 1H-13C HMBC NMR (600 MHz, CD3OD) spectrum for 6-(4-Hydroxy-3-methylbutyl)-1,5-dihydroxyxanthone (3); Table S1: Boltzmann-weighted populations of conformations 1–36 used for DP4+ analysis of isomer 4R,10R,11R; Table S2: Boltzmann-weighted populations of conformations 1–36 used for DP4+ analysis of isomer 4R,10R,11S; Table S3: Boltzmann-weighted populations of conformations 1–36 used for DP4+ analysis of isomer 4S,10R,11R; Table S4: Boltzmann-weighted populations of conformations 1–36 used for DP4+ analysis of isomer 4S,10R,11S; Table S5: Coefficients of determination R2 of the linear regressions made between experimental chemical shifts and theorical chemical shifts of each isomer; Table S6: Enthalpies and Boltzmann populations of conformations A1–A14 of (4R,10R,11R) and conformations B1–B14 of (4S,10R,11R), calculated using GD3BJ-B3LYP/6-311G(d,p) level.

Author Contributions

Conceptualization, E.G. (Elise Gerometta), A.G.-B. and I.G.; methodology, E.G. (Elise Gerometta), A.G.-B., I.G., E.G. (Elnur Garayev), G.H., P.-E.C., P.C., A.L. and A.M.; validation, A.G.-B., I.G., G.H., E.G. (Elnur Garayev), M.F., B.B. and P.-E.C.; formal analysis, E.G. (Elise Gerometta) and E.G. (Elnur Garayev); investigation, E.G. (Elise Gerometta), G.H., C.D.G., A.M. and J.-V.N.; resources, A.G.-B.; writing—original draft preparation, E.G. (Elise Gerometta); writing—review and editing, G.H., E.G. (Elnur Garayev), A.M., J.-V.N., C.D.G., P.-E.C., P.C., M.F., A.L., B.B., I.G. and A.G.-B.; visualization, E.G. (Elise Gerometta), I.G. and A.G.-B.; supervision, I.G. and A.G.-B.; project administration, A.G.-B.; funding acquisition, A.G.-B. All authors have read and agreed to the published version of the manuscript.

Funding

This work was supported by the European Regional Development Funds GURDTI 2018-1828-0002370 (FEDER PHAR, EU-Région Réunion-French State national counterpart). Elise Gerometta is a recipient of a fellowship from the Région Réunion.

Institutional Review Board Statement

Not applicable.

Informed Consent Statement

Not applicable.

Data Availability Statement

NMR raw data (1H, 13C, gCOSY, gHSQC, gHMBC) of compounds 1 and 3 are made freely available at https://doi.org/10.5281/zenodo.7728239. Raw MS/MS data (open format .mzXML) have been deposited on MassIVE (https://massive.ucsd.edu): MSV000089771.

Acknowledgments

We thank H. Thomas (Parc National de La Réunion) for locating and identifying the investigated plant species. We thank C. Simmler (IMBE), S. Greff (IMBE) and the Service of Chemical Ecology and Metabolomics (Aix-Marseille Univ) for the acquisition of the LC/MSMS data. This work was supported by the computing facilities of the CRCMM, ‘Centre Régional de Compétences en Modélisation Moléculaire de Marseille’.

Conflicts of Interest

The authors declare no conflict of interest. The funders had no role in the design of the study; in the collection, analyses, or interpretation of data; in the writing of the manuscript; or in the decision to publish the results.

Appendix A

Based on NMR analysis, the UV and ECD spectra of the diastereomer of (1) were calculated for the two potential enantiomers of absolute configuration (4R,10R,11R) and (4S,10R,11R). The calculated enthalpies for the 14 most stable conformations discovered for each diastereomer and the corresponding Boltzmann populations are shown in Table S6. For each optimized conformation, a calculation of the vibrational frequencies established that they were local minima (no imaginary frequency).
The conformations A1 to A6 with Boltzmann populations greater than 5% (Figure S9) and the conformations B1 to B6 with Boltzmann populations greater than 5% (Figure S10) were selected to build the UV and ECD spectra of the diastereomer (4R,10R,11R) and (4S,10R,11R), respectively. The averaged UV and ECD spectra (Figure S8) of the diastereomers were built from the calculated spectra for the selected conformations weighted by their Boltzmann population evaluated from the calculated enthalpy. These averaged spectra were then compared to the measured spectra in order to establish the absolute configuration of (1).

References

  1. Gupta, S.; Gupta, P. The Genus Calophyllum: Review of Ethnomedicinal Uses, Phytochemistry and Pharmacology. In Bioactive Natural Products in Drug Discovery; Singh, J., Meshram, V., Gupta, M., Eds.; Springer: Singapore, 2020; pp. 215–242. ISBN 9789811513930. [Google Scholar]
  2. Zamakshshari, N.H.; Ee, G.C.L.; Ismail, I.S.; Ibrahim, Z.; Mah, S.H. Cytotoxic Xanthones Isolated from Calophyllum Depressinervosum and Calophyllum Buxifolium with Antioxidant and Cytotoxic Activities. Food Chem. Toxicol. 2019, 133, 110800. [Google Scholar] [CrossRef] [PubMed]
  3. Leu, T.; Raharivelomanana, P.; Soulet, S.; Bianchini, J.P.; Herbette, G.; Faure, R. New Tricyclic and Tetracyclic Pyranocoumarins with an Unprecedented C-4 Substituent. Structure Elucidation of Tamanolide, Tamanolide D and Tamanolide P from Calophyllum inophyllum of French Polynesia. Magn. Reson. Chem. 2009, 47, 989–993. [Google Scholar] [CrossRef] [PubMed]
  4. Zailan, A.A.D.; Karunakaran, T.; Bakar, M.H.A.; Mian, V.J.Y. The Malaysian Genus Calophyllum (Calophyllaceae): A Review on Its Phytochemistry and Pharmacological Activities. Nat. Prod. Res. 2022; in press. [Google Scholar] [CrossRef]
  5. Leu, T. Contribution à la Connaissance de la Flore Polynésienne: ÉVALUATION de L’intérêt Pharmacologique de Quelques Plantes Médicinales et Étude Phytochimique du Tamanu (Calophyllum inophyllum, L.—Clusiaceae). Ph.D. Thesis, Université de la Polynésie Française, Tahiti, French Polynesia, 2009. [Google Scholar]
  6. Gómez-Verjan, J.C.; Rodríguez-Hernández, K.D.; Reyes-Chilpa, R. Bioactive Coumarins and Xanthones From Calophyllum Genus and Analysis of Their Druglikeness and Toxicological Properties. In Studies in Natural Products Chemistry; Elsevier: Amsterdam, The Netherlands, 2017; Volume 53, pp. 277–307. ISBN 978-0-444-63930-1. [Google Scholar]
  7. Dorla, E.; Grondin, I.; Hue, T.; Clerc, P.; Dumas, S.; Gauvin-Bialecki, A.; Laurent, P. Traditional Uses, Antimicrobial and Acaricidal Activities of 20 Plants Selected among Reunion Island’s Flora. S. Afr. J. Bot. 2019, 122, 447–456. [Google Scholar] [CrossRef]
  8. Adsersen, A.; Adsersen, H. Plants from Réunion Island with Alleged Antihypertensive and Diuretic Effects—An Experimental and Ethnobotanical Evaluation. J. Ethnopharmacol. 1997, 58, 189–206. [Google Scholar] [CrossRef]
  9. Ledoux, A.; Cao, M.; Jansen, O.; Mamede, L.; Campos, P.-E.; Payet, B.; Clerc, P.; Grondin, I.; Girard-Valenciennes, E.; Hermann, T.; et al. Antiplasmodial, Anti-Chikungunya Virus and Antioxidant Activities of 64 Endemic Plants from the Mascarene Islands. Int. J. Antimicrob. Agents 2018, 52, 622–628. [Google Scholar] [CrossRef] [PubMed]
  10. McKee, T.C.; Covington, C.D.; Fuller, R.W.; Bokesch, H.R.; Young, S.; Cardellina, J.H.; Kadushin, M.R.; Soejarto, D.D.; Stevens, P.F.; Cragg, G.M.; et al. Pyranocoumarins from Tropical Species of the Genus Calophyllum: A Chemotaxonomic Study of Extracts in the National Cancer Institute Collection. J. Nat. Prod. 1998, 61, 1252–1256. [Google Scholar] [CrossRef] [PubMed]
  11. Bordignon, A.E. Evaluation of Antioxidant and Anti-Inflammatory Effects of Medicinal Plants from Reunion Island against Obesity-Related Disorders; Université de Liège: Liège, Belgium, 2014; p. 46. [Google Scholar]
  12. Frisch, M.J.; Trucks, G.W.; Schlegel, H.B.; Scuseria, G.E.; Robb, M.A.; Cheeseman, J.R.; Scalmani, G.; Barone, V.; Mennucci, B.; Petersson, G.A.; et al. Gaussian 09, Revision D.01; Gaussian Inc.: Wallingford, CT, USA, 2013; Available online: http://www.gaussian.com (accessed on 1 June 2022).
  13. Becke, A.D. Density-functional Thermochemistry. III. The Role of Exact Exchange. J. Chem. Phys. 1993, 98, 5648–5652. [Google Scholar] [CrossRef]
  14. Stephens, P.J.; Devlin, F.J.; Chabalowski, C.F.; Frisch, M.J. Ab Initio Calculation of Vibrational Absorption and Circular Dichroism Spectra Using Density Functional Force Fields. J. Phys. Chem. 1994, 98, 11623–11627. [Google Scholar] [CrossRef]
  15. AMPAC 11, 1992–2017 Semichem, Inc. 12456 W 62nd Terrace—Suite D, Shawnee, KS, USA, 66216. Available online: http://www.semichem.com (accessed on 6 June 2022).
  16. Grimme, S.; Ehrlich, S.; Goerigk, L. Effect of the Damping Function in Dispersion Corrected Density Functional Theory. J. Comput. Chem. 2011, 32, 1456–1465. [Google Scholar] [CrossRef]
  17. Marenich, A.V.; Cramer, C.J.; Truhlar, D.G. Universal Solvation Model Based on Solute Electron Density and on a Continuum Model of the Solvent Defined by the Bulk Dielectric Constant and Atomic Surface Tensions. J. Phys. Chem. B 2009, 113, 6378–6396. [Google Scholar] [CrossRef] [PubMed]
  18. Frisch, M.J.; Trucks, G.W.; Schlegel, H.B.; Scuseria, G.E.; Robb, M.A.; Cheeseman, J.R.; Scalmani, G.; Barone, V.; Petersson, G.A.; Nakatsuji, H. Gaussian 16, Revision A.03; Gaussian Inc.: Wallingford, CT, USA, 2016. [Google Scholar]
  19. Pluskal, T.; Castillo, S.; Villar-Briones, A.; Orešič, M. MZmine 2: Modular Framework for Processing, Visualizing, and Analyzing Mass Spectrometry-Based Molecular Profile Data. BMC Bioinform. 2010, 11, 395. [Google Scholar] [CrossRef] [PubMed]
  20. Olivon, F.; Grelier, G.; Roussi, F.; Litaudon, M.; Touboul, D. MZmine 2 Data-Preprocessing To Enhance Molecular Networking Reliability. Anal. Chem. 2017, 89, 7836–7840. [Google Scholar] [CrossRef]
  21. Smirnov, A.; Jia, W.; Walker, D.I.; Jones, D.P.; Du, X. ADAP-GC 3.2: Graphical Software Tool for Efficient Spectral Deconvolution of Gas Chromatography–High-Resolution Mass Spectrometry Metabolomics Data. J. Proteome Res. 2018, 17, 470–478. [Google Scholar] [CrossRef]
  22. Wang, M.; Carver, J.J.; Phelan, V.V.; Sanchez, L.M.; Garg, N.; Peng, Y.; Nguyen, D.D.; Watrous, J.; Kapono, C.A.; Luzzatto-Knaan, T.; et al. Sharing and Community Curation of Mass Spectrometry Data with Global Natural Products Social Molecular Networking. Nat. Biotechnol. 2016, 34, 828–837. [Google Scholar] [CrossRef] [PubMed]
  23. Nothias, L.F.; Petras, D.; Schmid, R.; Dührkop, K.; Rainer, J.; Sarvepalli, A.; Protsyuk, I.; Ernst, M.; Tsugawa, H.; Fleischauer, M.; et al. Feature-Based Molecular Networking in the GNPS Analysis Environment. Nat. Methods 2020, 17, 905–908. [Google Scholar] [CrossRef]
  24. Allard, P.-M.; Péresse, T.; Bisson, J.; Gindro, K.; Marcourt, L.; Pham, V.C.; Roussi, F.; Litaudon, M.; Wolfender, J.-L. Integration of Molecular Networking and In-Silico MS/MS Fragmentation for Natural Products Dereplication. Anal. Chem. 2016, 88, 3317–3323. [Google Scholar] [CrossRef]
  25. Yang, N.-Y.; Tao, W.-W.; Duan, J.-A. Antithrombotic Flavonoids from the Faeces of Trogopterus xanthipes. Nat. Prod. Res. 2010, 24, 1843–1849. [Google Scholar] [CrossRef]
  26. Kijjoa, A.; Gonzalez, M.J.; Afonso, C.M.; Pinto, M.M.M.; Anantachoke, C.; Herz, W. Xanthones from Calophyllum teysmannii Var. Inophylloide. Phytochemistry 2000, 53, 1021–1024. [Google Scholar] [CrossRef]
  27. Ito, C.; Miyamoto, Y.; Rao, K.S.; Furukawa, H. A Novel Dibenzofuran and Two New Xanthones from Calophyllum Panciflorum. Chem. Pharm. Bull. 1996, 44, 441–443. [Google Scholar] [CrossRef]
  28. Patil, A.D.; Freyer, A.J.; Eggleston, D.S.; Haltiwanger, R.C.; Bean, M.F.; Taylor, P.B.; Caranfa, M.J.; Breen, A.L.; Bartus, H.R. The Inophyllums, Novel Inhibitors of HIV-1 Reverse Transcriptase Isolated from the Malaysian Tree, Calophyllum inophyllum Linn. J. Med. Chem. 1993, 36, 4131–4138. [Google Scholar] [CrossRef] [PubMed]
  29. Kawazu, K.; Ohigashi, H.; Mitsui, T. The Psiscicidal Constituents of Calophyllum inophyllum Linn. Tetrahedron Lett. 1968, 19, 2383–2385. [Google Scholar] [CrossRef]
  30. Laure, F.; Herbette, G.; Faure, R.; Bianchini, J.P.; Raharivelomanana, P.; Fogliani, B. Structures of New Secofriedelane and Friedelane Acids from Calophyllum inophyllum of French Polynesia. Magn. Reson. Chem. 2005, 43, 65–68. [Google Scholar] [CrossRef] [PubMed]
  31. Cao, S.-G.; Lim, T.-B.; Sim, K.-Y.; Goh, S.H. A Highly Prenylated Xanthone from the Bark of Calophyllum gracilipes (Guttiferae). Nat. Prod. Lett. 1997, 10, 55–58. [Google Scholar] [CrossRef]
  32. Ragasa, C.Y.; Ebajo, V., Jr.; Brkljača, R.; Urban, S. Triterpenes from Calophyllum inophyllum Linn. Int. J. Pharmacogn. Phytochem. Res. 2015, 7, 718–722. [Google Scholar]
  33. Li, X.J.; Liu, Z.Z.; Kim, K.-W.; Wang, X.; Li, Z.; Kim, Y.-C.; Yook, C.S.; Liu, X.Q. Chemical Constituents from Leaves of Pileostegia viburnoides Hook.f.et Thoms. Nat. Prod. Sci. 2016, 22, 154–161. [Google Scholar] [CrossRef]
  34. Jackson, B.; Locksley, H.D.; Scheinwans, F. Extractives from Guttiferae—VIII. The Isolation of 6-(3,3-Dimethylallyl)-1,5-Dihydroxyxanthone from Calophyllum Scriblitifolium Henderson and Wyatt-Smith. Tetrahedron 1967, 24, 3059–3068. [Google Scholar] [CrossRef]
  35. Lim, C.K.; Subramaniam, H.; Say, Y.H.; Jong, V.Y.M.; Khaledi, H.; Chee, C.F. A New Chromanone Acid from the Stem Bark of Calophyllum teysmannii. Nat. Prod. Res. 2015, 29, 1970–1977. [Google Scholar] [CrossRef]
  36. Huitric, A.C.; Carr, J.B.; Trager, W.F.; Nist, B.J. Configurational and Conformational Analysis. Tetrahedron 1963, 19, 2145–2151. [Google Scholar] [CrossRef]
  37. Grimblat, N.; Zanardi, M.M.; Sarotti, A.M. Beyond DP4: An Improved Probability for the Stereochemical Assignment of Isomeric Compounds Using Quantum Chemical Calculations of NMR Shifts. J. Org. Chem. 2015, 80, 12526–12534. [Google Scholar] [CrossRef]
  38. Gunatilaka, A.A.L.; De Silva, A.M.Y.J.; Sotheeswaran, S.; Balasubramaniam, S.; Wazeer, M.I.M. Terpenoid and Biflavonoid Constituents of Calophyllum Calaba and Garcinia Spicata from Sri Lanka. Phytochemistry 1984, 23, 323–328. [Google Scholar] [CrossRef]
Figure 1. Structures of compounds 114 isolated from C. tacamahaca.
Metabolites 13 00582 g001
Figure 2. Key 1H-1H COSY (bold) and 1H-13C HMBC (blue arrows) correlations of (1).
Metabolites 13 00582 g002
Figure 3. The two potential enantiomers for (1).
Metabolites 13 00582 g003
Figure 4. Graph of 1H-DP4+, 13C-DP4+, and DP4+ (PCM/mPW1PW91/6-31+Gdp) probabilities obtained by correlating the experimental NMR of compound 1 with the calculated data of the four isomers (4S,10S,11S), (4S,10R,11R), (4S,10R,11S), (4S,10S,11R).
Metabolites 13 00582 g004
Figure 5. UV (left-A,C) and ECD (right-B,D) spectra measured in CD3OD for (1) (green) and calculated using SMD(CH3OH)/CAM-B3LYP/6-31++G(d,p)//GD3BJ-B3LYP/6-311G(d,p) level for (4R,10R,11R) (red) and (4S,10R,11R) (blue).
Metabolites 13 00582 g005
Figure 6. Molecular networking (MN) of the isolated compounds (orange squared nodes) and MN annotation based on GNPS and ISDB spectral matches (green and blue nodes).
Metabolites 13 00582 g006
Figure 7. Part of cluster C1 containing analogues of compound 10 (orange squared node at m/z 393.1319). Ion parent mass is indicated in each node and cosine score value is indicated on each edge.
Metabolites 13 00582 g007
Table 1. 1H and 13C NMR data of isocaloteysmannic acid (1) in CD3OD (600 MHz for 1H and 150 MHz for 13C).
PositionδH m (J in Hz)δC
2-177.2
33.07, dd (15.2, 7.2)
3.27, dd (15.2, 8.2)
38.2
45.0, 7 brt a (7.7)36.3
4a-113.0
4b-160.9
6-79.2
75.48, d (10.0)127.3
86.49, d (10.0)116.7
8a-102.9
8b-156.8
104.18, dq (11.3, 6.2)80.3
112.61, dq (11.3, 6.9)46.9
12-200.7
12a-102.6
12b-162.2
131.01, s27.5
141.41, s28.5
151.49, d (6.2)19.8
161.19, d (6.9)10.3
1′-145.2
2′, 6′7.33, d (7.6)128.8
3′, 5′7.20, brt (7.5)128.8
4′7.10, brt (7.3)126.7
a br: broad.
Table 2. Cytotoxic activity of the isolated compounds.
CompoundIC50 (µg/mL) a
HepG2HT29
119.65 ± 2.3425.68 ± 2.08
239.03 ± 3.2341.97 ± 2.54
615.98 ± 3.6518.97 ± 2.94
72.44 ± 0.674.24 ± 0.67
87.03 ± 1.565.94 ± 0.07
945.09 ± 2.0956.98 ± 3.76
109.54 ± 1.2210.46 ± 2.08
113.34 ± 0.945.97 ± 0.99
1215.38 ± 2.0710.26 ± 1.34
136.65 ± 1.544.06 ± 0.29
a IC50 are the means ± standard deviations calculated from three independent assays.
Disclaimer/Publisher’s Note: The statements, opinions and data contained in all publications are solely those of the individual author(s) and contributor(s) and not of MDPI and/or the editor(s). MDPI and/or the editor(s) disclaim responsibility for any injury to people or property resulting from any ideas, methods, instructions or products referred to in the content.

