
Impact of Exercise and Detraining during Childhood on Brown Adipose Tissue Whitening in Obesity

 and
and 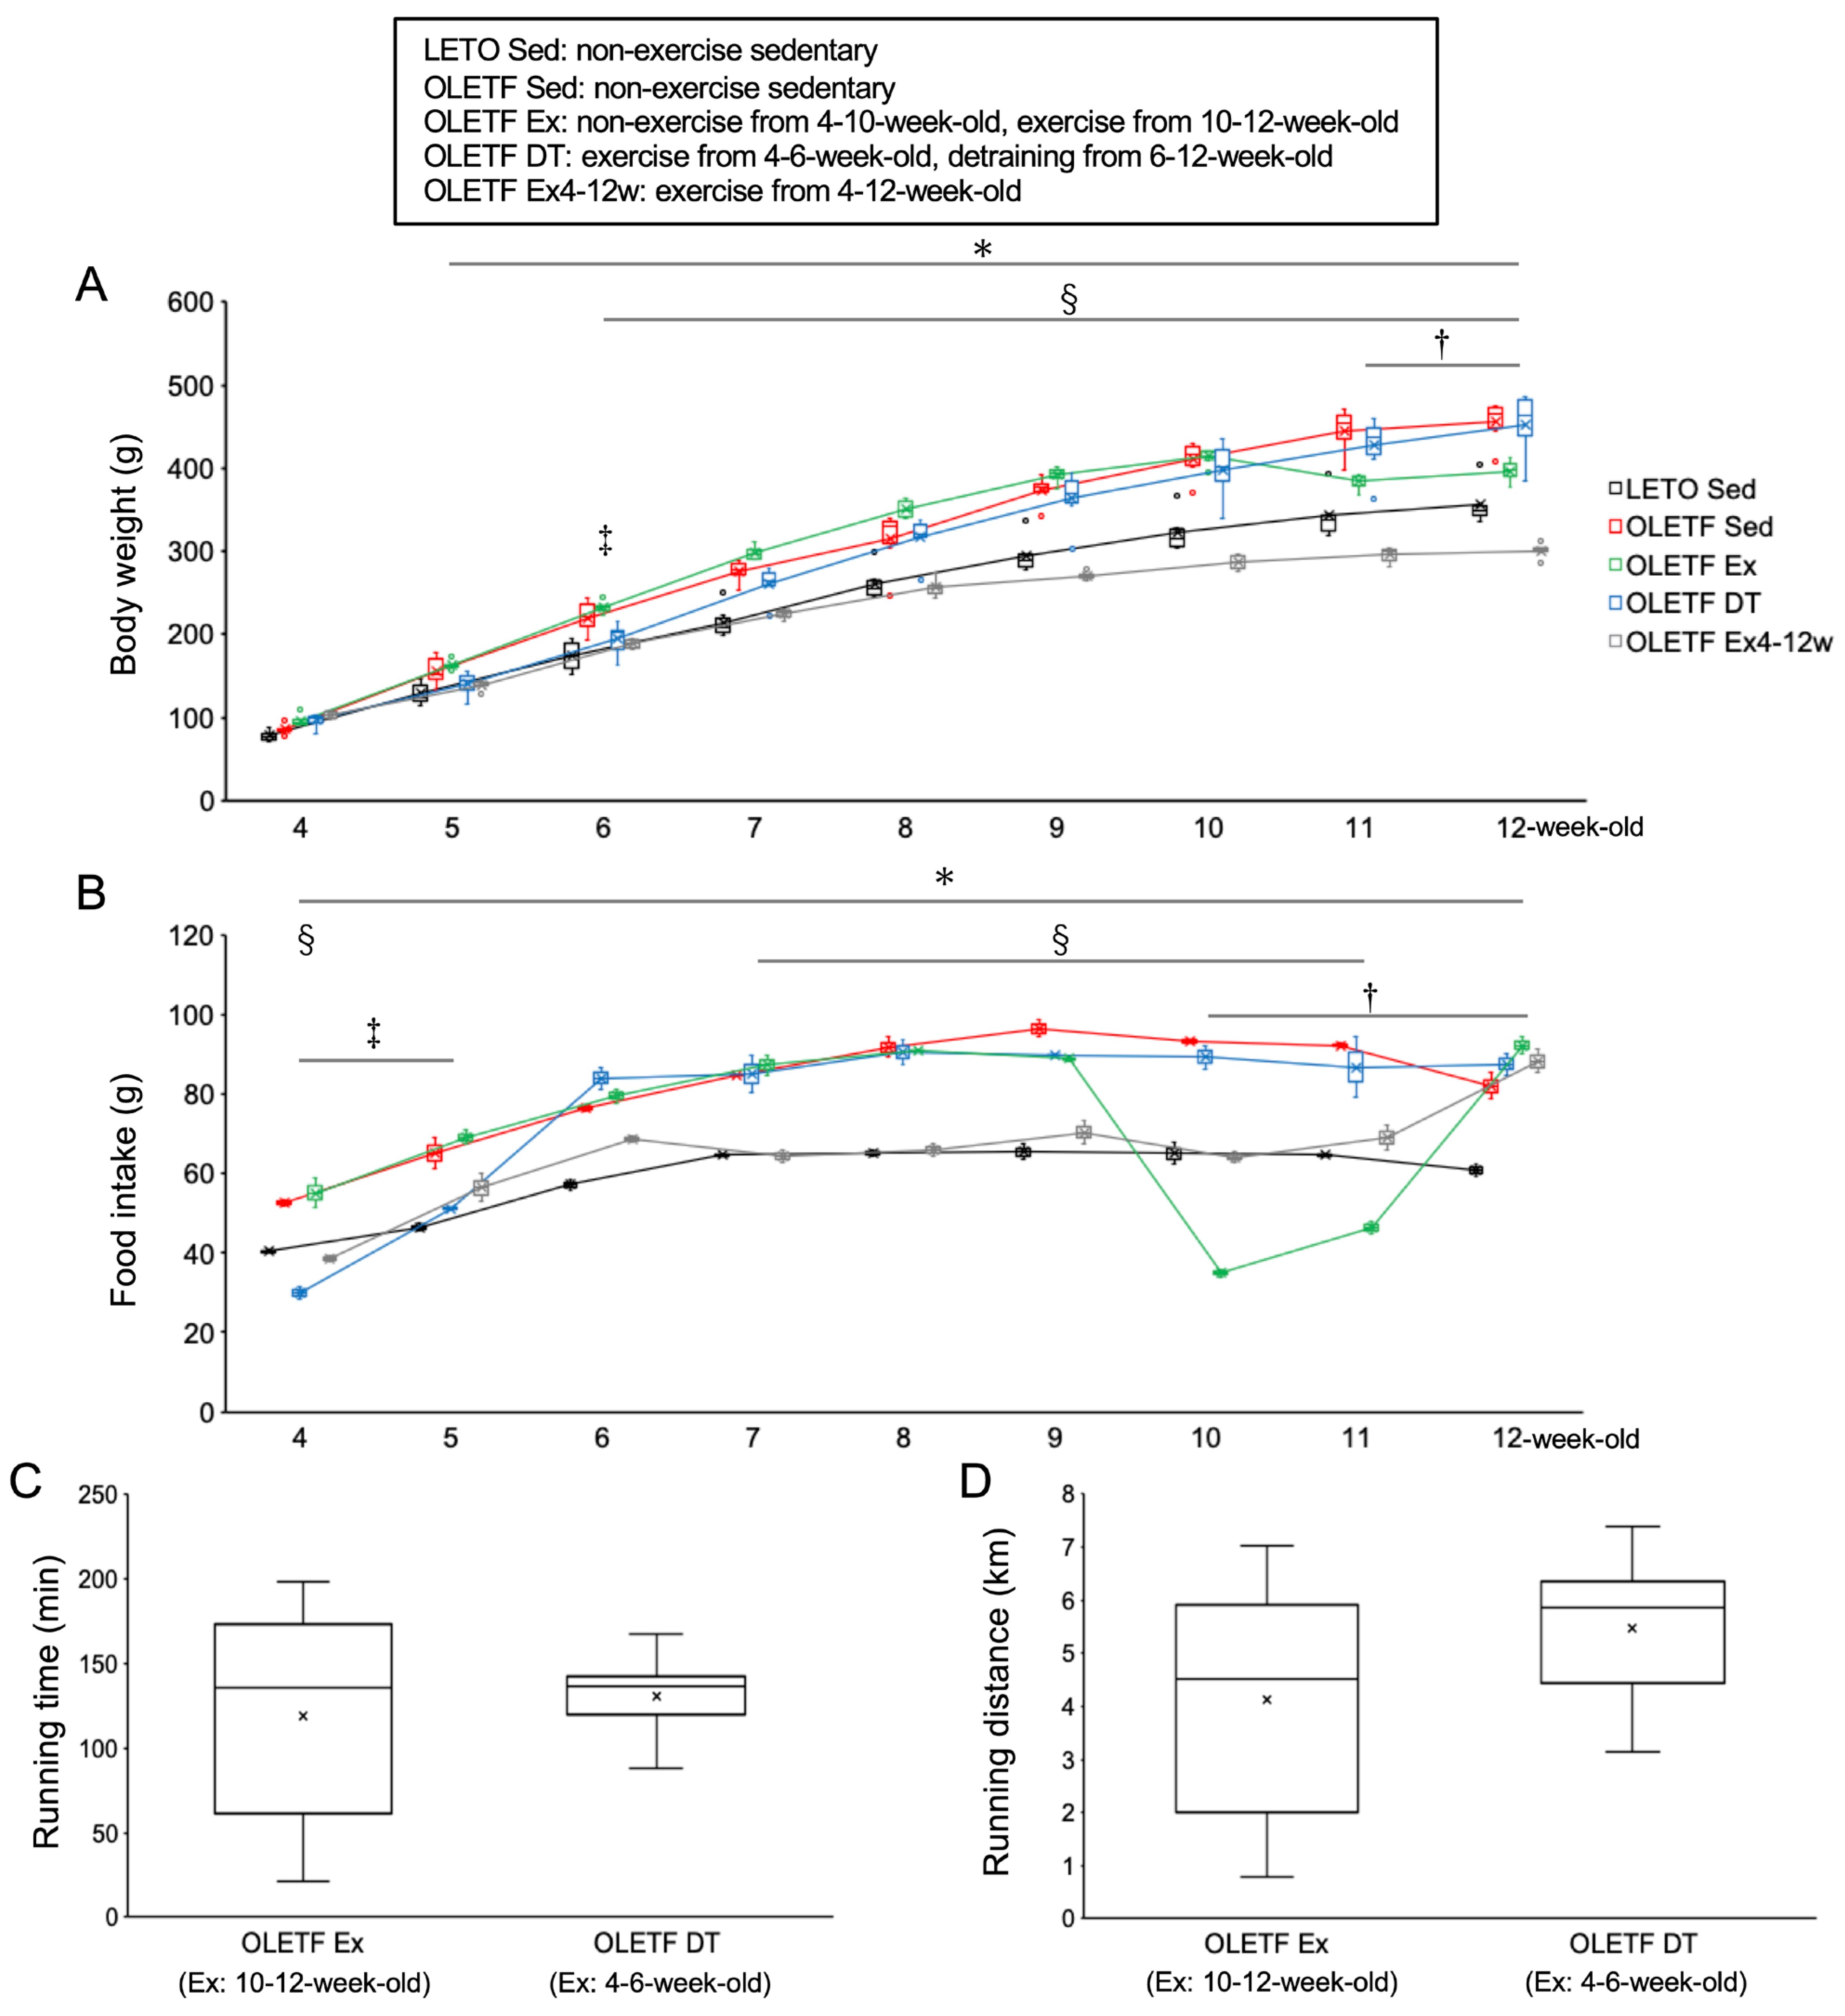
Abstract
:1. Introduction
2. Results
2.1. Changes in Body Weight
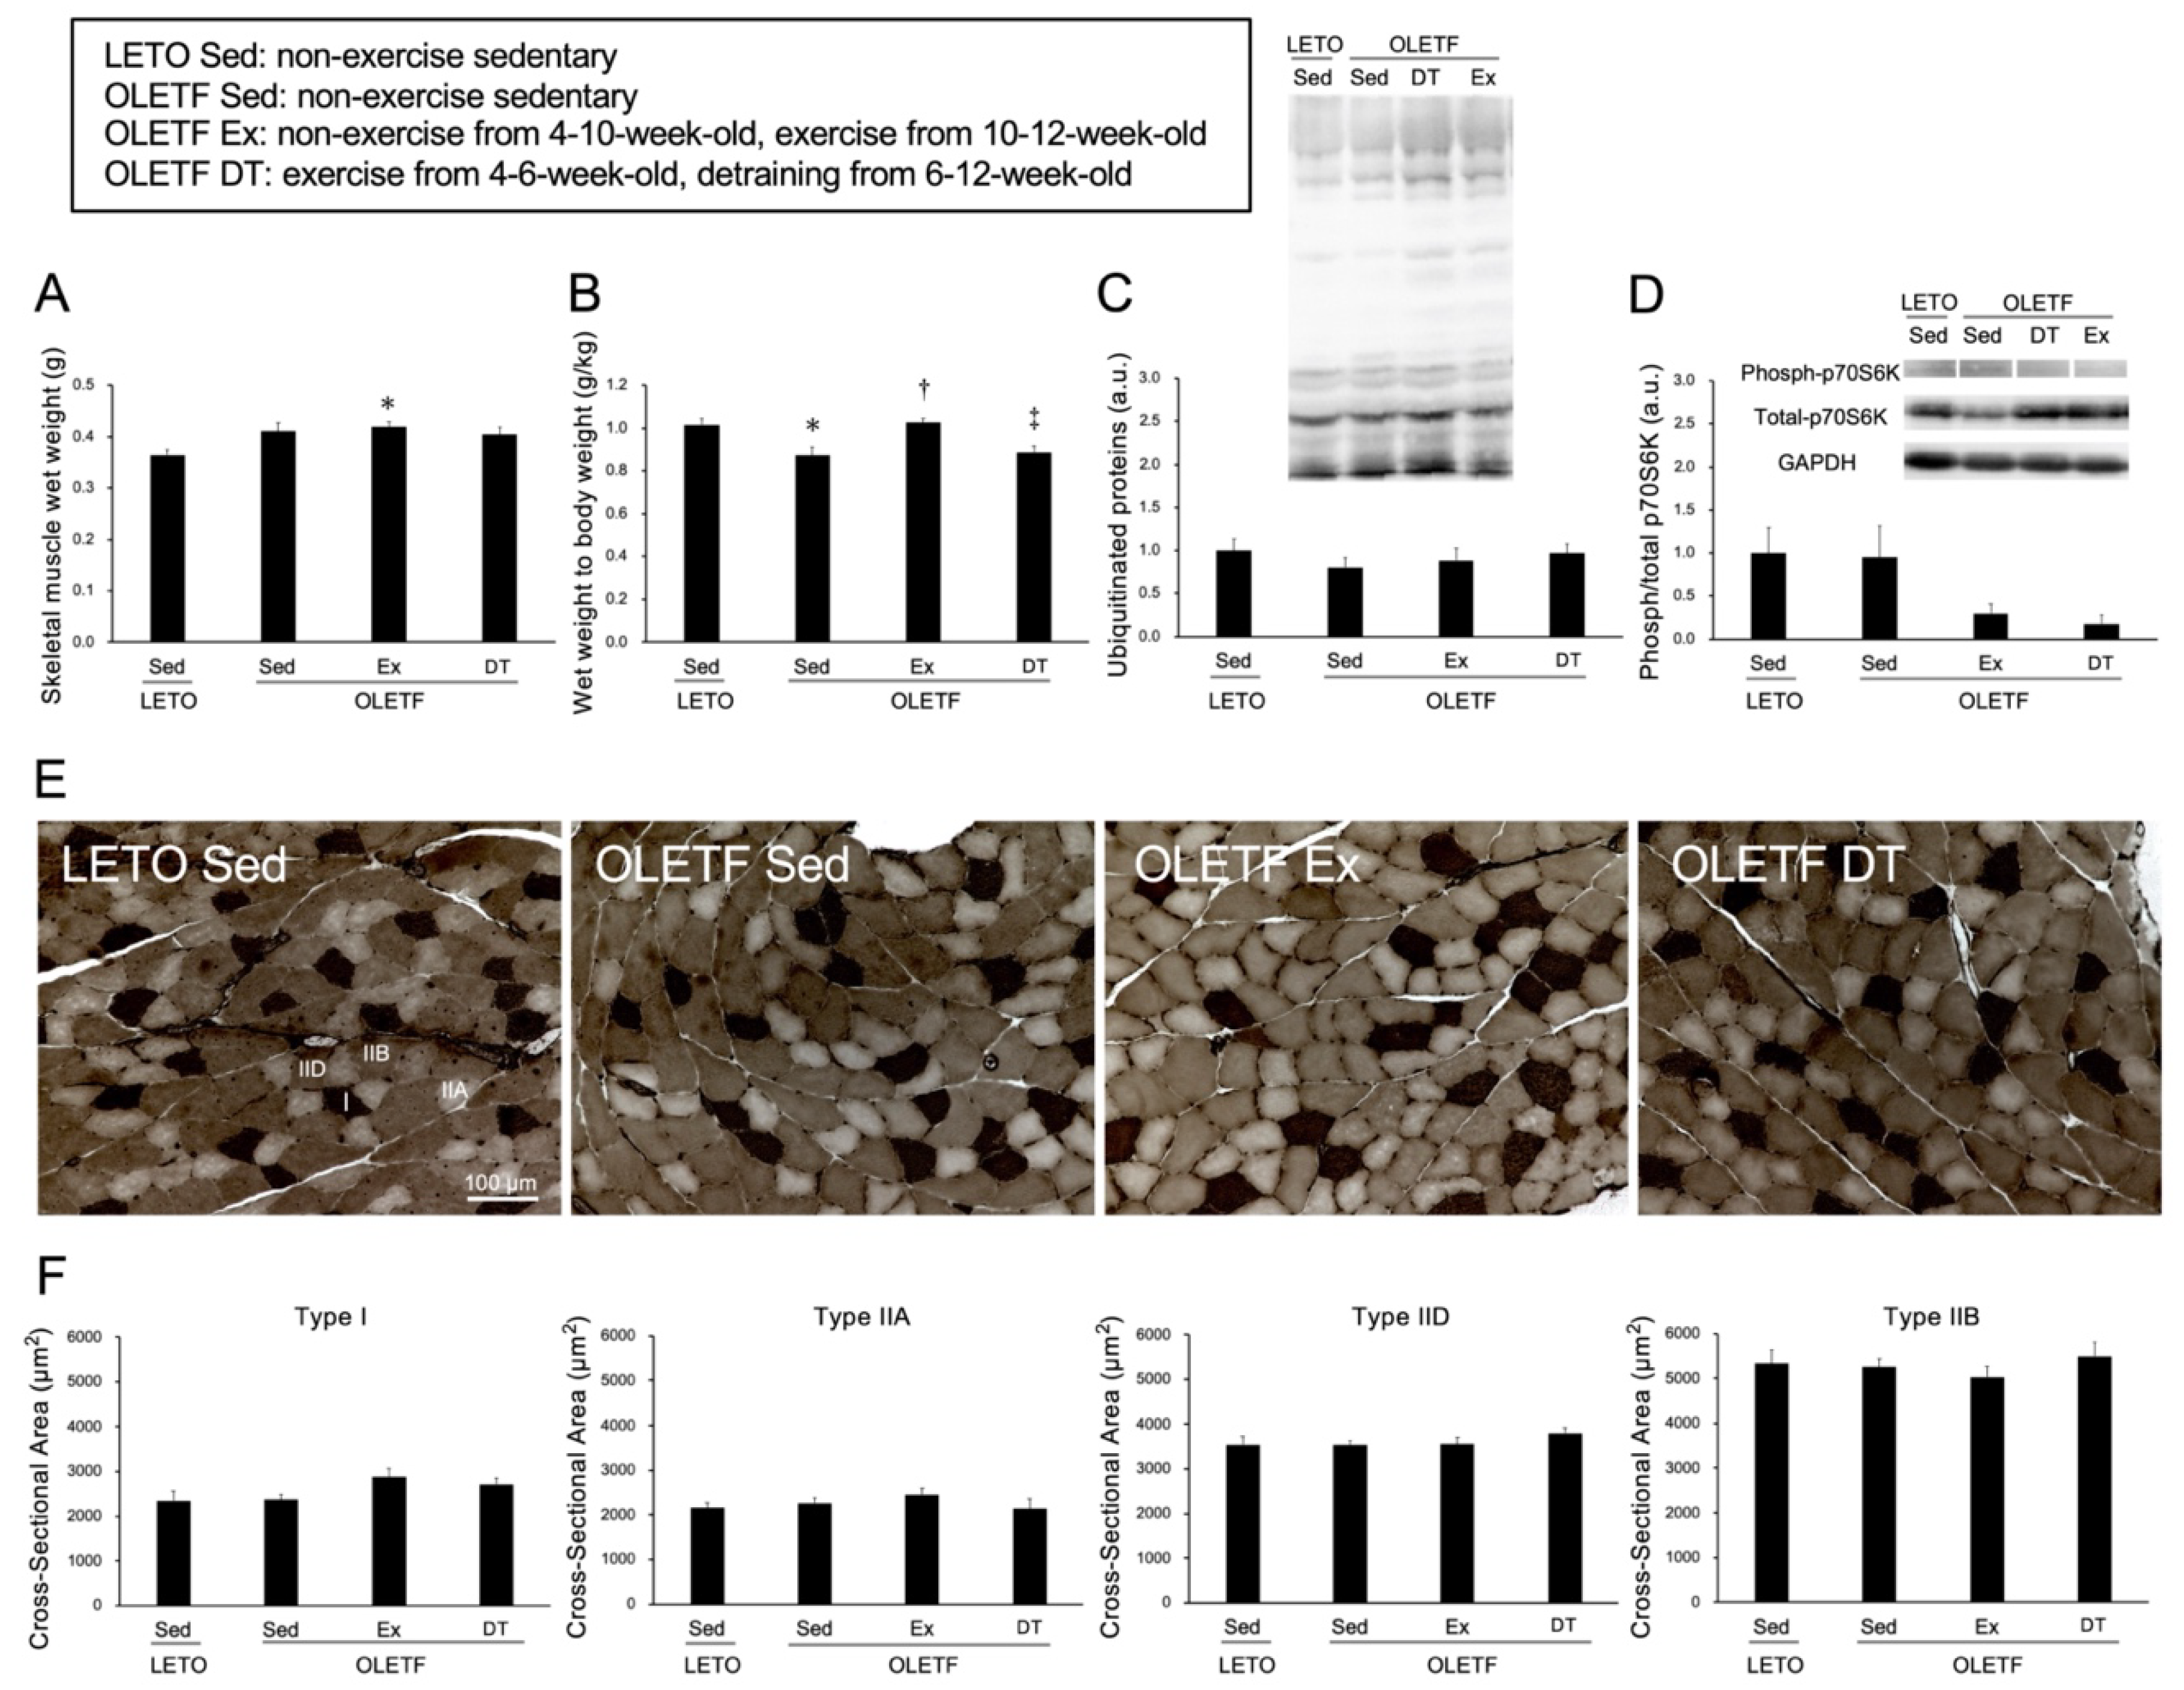
2.2. Skeletal Muscle Responses to Voluntary Wheel Running
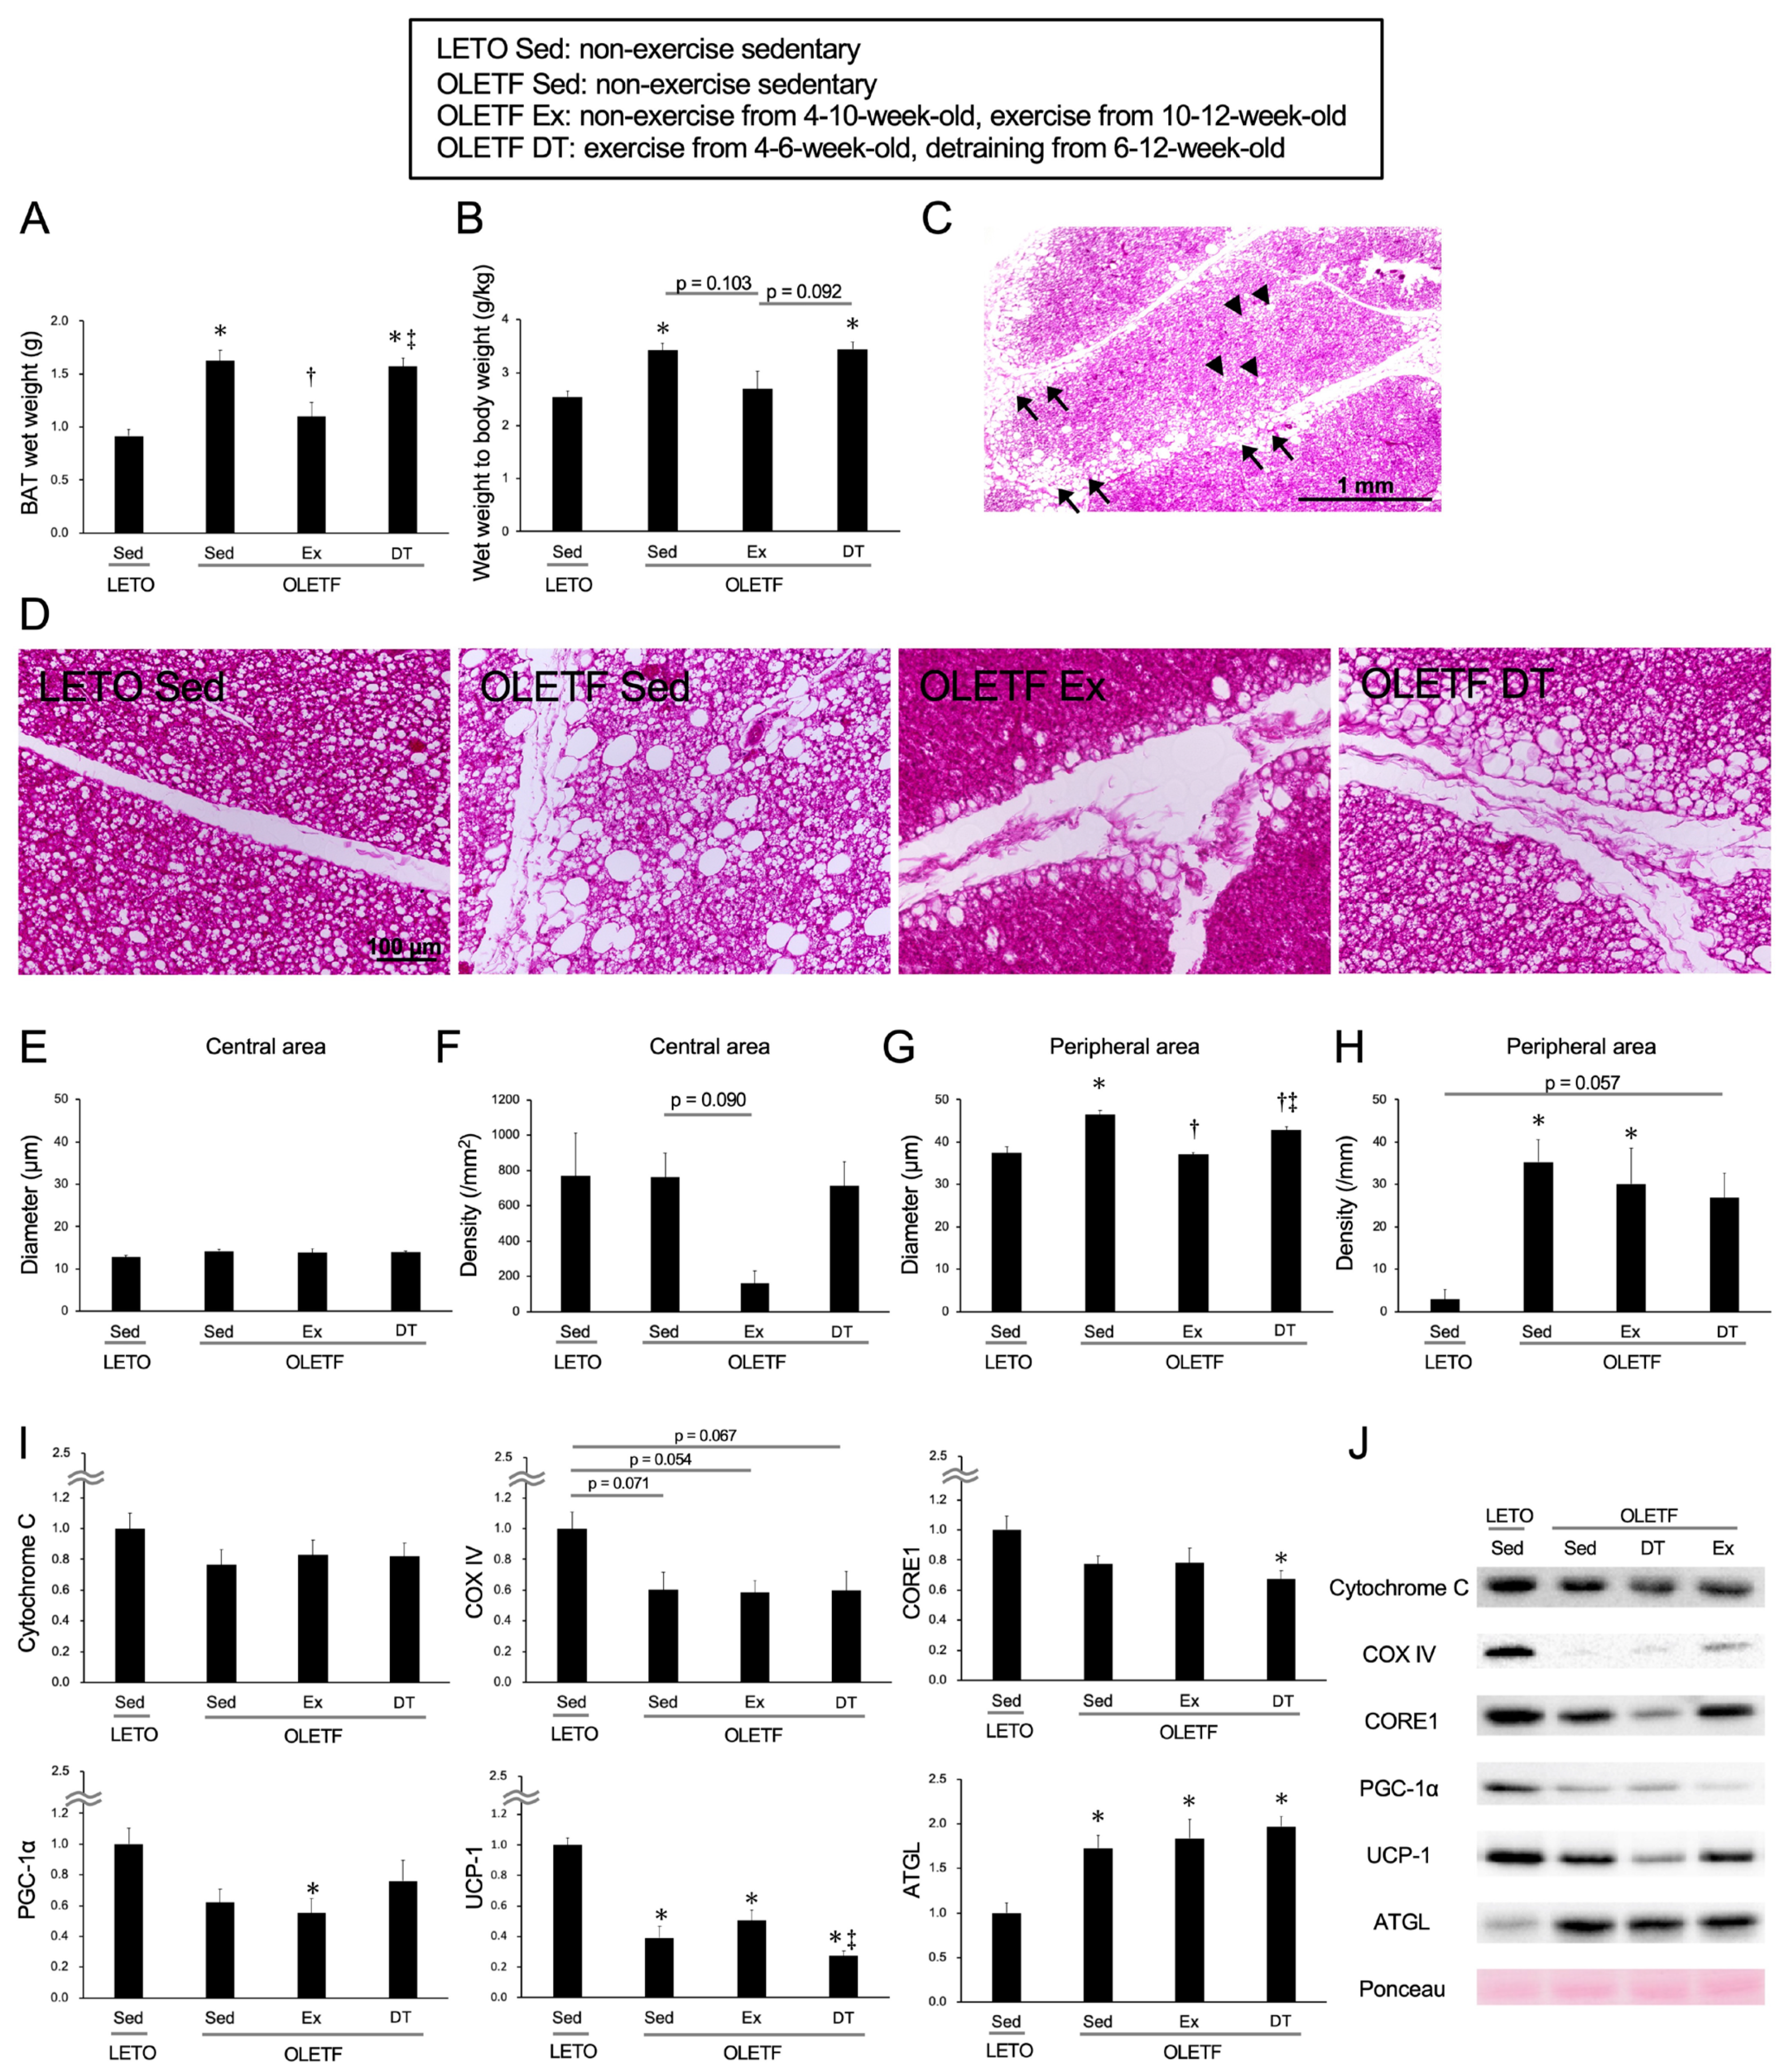
2.3. Exercise and Detraining Effects on Brown Adipose Tissue (Including Chronic Training)
3. Discussion
4. Materials and Methods
4.1. Experimental Design
4.2. Voluntary Wheel Running Exercise Protocol
4.3. Tissue Sampling
4.4. Analysis of the Skeletal Muscle
4.5. Analysis of the Brown Adipose Tissue
4.6. Statistical Analysis
5. Conclusions
Author Contributions
Funding
Institutional Review Board Statement
Informed Consent Statement
Data Availability Statement
Acknowledgments
Conflicts of Interest
References
- Lehnig, A.C.; Stanford, K.I. Exercise-induced adaptations to white and brown adipose tissue. J. Exp. Biol. 2018, 221, jeb161570. [Google Scholar] [CrossRef] [Green Version]
- Tran, T.T.; Kahn, C.R. Transplantation of adipose tissue and stem cells: Role in metabolism and disease. Nat. Rev. Endocrinol. 2010, 6, 195–213. [Google Scholar] [CrossRef] [Green Version]
- Cannon, B.; Nedergaard, J. Brown adipose tissue: Function and physiological significance. Physiol. Rev. 2004, 84, 277–359. [Google Scholar] [CrossRef]
- Marlatt, K.L.; Ravussin, E. Brown Adipose Tissue: An Update on Recent Findings. Curr. Obes. Rep. 2017, 6, 389–396. [Google Scholar] [CrossRef] [PubMed]
- Dewal, R.S.; Stanford, K.I. Effects of exercise on brown and beige adipocytes. Biochim. Biophys. Acta Mol. Cell Biol. Lipids 2019, 1864, 71–78. [Google Scholar] [CrossRef] [PubMed]
- Townsend, K.; Tseng, Y.H. Brown adipose tissue: Recent insights into development, metabolic function and therapeutic potential. Adipocyte 2012, 1, 13–24. [Google Scholar] [CrossRef] [PubMed] [Green Version]
- Cinti, S. Transdifferentiation properties of adipocytes in the adipose organ. Am. J. Physiol. Endocrinol. Metab. 2009, 297, E977–E986. [Google Scholar] [CrossRef]
- Thompson, M.M.; Manning, H.C.; Ellacott, K.L. Translocator protein 18 kDa (TSPO) is regulated in white and brown adipose tissue by obesity. PLoS ONE 2013, 8, e79980. [Google Scholar] [CrossRef]
- Zou, Y.; Sheng, G.; Yu, M.; Xie, G. The association between triglycerides and ectopic fat obesity: An inverted U-shaped curve. PLoS ONE 2020, 15, e0243068. [Google Scholar] [CrossRef]
- Shimizu, I.; Aprahamian, T.; Kikuchi, R.; Shimizu, A.; Papanicolaou, K.N.; MacLauchlan, S.; Maruyama, S.; Walsh, K. Vascular rarefaction mediates whitening of brown fat in obesity. J. Clin. Investig. 2014, 124, 2099–2112. [Google Scholar] [CrossRef] [Green Version]
- Gao, P.; Jiang, Y.; Wu, H.; Sun, F.; Li, Y.; He, H.; Wang, B.; Lu, Z.; Hu, Y.; Wei, X.; et al. Inhibition of Mitochondrial Calcium Overload by SIRT3 Prevents Obesity- or Age-Related Whitening of Brown Adipose Tissue. Diabetes 2020, 69, 165–180. [Google Scholar] [CrossRef]
- Crandall, J.P.; Knowler, W.C.; Kahn, S.E.; Marrero, D.; Florez, J.C.; Bray, G.A.; Haffner, S.M.; Hoskin, M.; Nathan, D.M. The prevention of type 2 diabetes. Nat. Clin. Pract. Endocrinol. Metab. 2008, 4, 382–393. [Google Scholar] [CrossRef]
- De Matteis, R.; Lucertini, F.; Guescini, M.; Polidori, E.; Zeppa, S.; Stocchi, V.; Cinti, S.; Cuppini, R. Exercise as a new physiological stimulus for brown adipose tissue activity. Nutr. Metab. Cardiovasc. Dis. 2013, 23, 582–590. [Google Scholar] [CrossRef]
- Welly, R.J.; Liu, T.W.; Zidon, T.M.; Rowles, J.L.; Park, Y.M.; Smith, T.N.; Swanson, K.S.; Padilla, J.; Vieira-Potter, V.J. Comparison of Diet versus Exercise on Metabolic Function and Gut Microbiota in Obese Rats. Med. Sci. Sports. Exerc. 2016, 48, 1688–1698. [Google Scholar] [CrossRef] [Green Version]
- Peppler, W.T.; Townsend, L.K.; Knuth, C.M.; Foster, M.T.; Wright, D.C. Subcutaneous inguinal white adipose tissue is responsive to, but dispensable for, the metabolic health benefits of exercise. Am. J. Physiol. Endocrinol. Metab. 2018, 314, E66–E77. [Google Scholar] [CrossRef]
- Shirkhani, S.; Marandi, S.M.; Kazeminasab, F.; Esmaeili, M.; Ghaedi, K.; Esfarjani, F.; Shiralian-Esfahani, H.; Nasr-Esfahani, M.H. Comparative studies on the effects of high-fat diet, endurance training and obesity on Ucp1 expression in male C57BL/6 mice. Gene 2018, 676, 16–21. [Google Scholar] [CrossRef] [PubMed]
- Han, J.C.; Lawlor, D.A.; Kimm, S.Y. Childhood obesity. Lancet 2010, 375, 1737–1748. [Google Scholar] [CrossRef]
- Bray, G.A.; Heisel, W.E.; Afshin, A.; Jensen, M.D.; Dietz, W.H.; Long, M.; Kushner, R.F.; Daniels, S.R.; Wadden, T.A.; Tsai, A.G.; et al. The Science of Obesity Management: An Endocrine Society Scientific Statement. Endocr. Rev. 2018, 39, 79–132. [Google Scholar] [CrossRef] [PubMed] [Green Version]
- Ward, Z.J.; Long, M.W.; Resch, S.C.; Giles, C.M.; Cradock, A.L.; Gortmaker, S.L. Simulation of Growth Trajectories of Childhood Obesity into Adulthood. N. Engl. J. Med. 2017, 377, 2145–2153. [Google Scholar] [CrossRef] [PubMed]
- Singh, A.S.; Mulder, C.; Twisk, J.W.; van Mechelen, W.; Chinapaw, M.J. Tracking of childhood overweight into adulthood: A systematic review of the literature. Obes. Rev. 2008, 9, 474–488. [Google Scholar] [CrossRef] [PubMed]
- Whitaker, R.C.; Wright, J.A.; Pepe, M.S.; Seidel, K.D.; Dietz, W.H. Predicting obesity in young adulthood from childhood and parental obesity. N. Engl. J. Med. 1997, 337, 869–873. [Google Scholar] [CrossRef] [PubMed]
- Guo, S.S.; Wu, W.; Chumlea, W.C.; Roche, A.F. Predicting overweight and obesity in adulthood from body mass index values in childhood and adolescence. Am. J. Clin. Nutr. 2002, 76, 653–658. [Google Scholar] [CrossRef] [PubMed] [Green Version]
- Paes, S.T.; Marins, J.C.; Andreazzi, A.E. Metabolic effects of exercise on childhood obesity: A current view. Rev. Paul. Pediatr. 2015, 33, 122–129. [Google Scholar] [CrossRef] [Green Version]
- Guinhouya, B.C. Physical activity in the prevention of childhood obesity. Paediatr Perinat Epidemiol. 2012, 26, 438–447. [Google Scholar] [CrossRef] [PubMed]
- Steene-Johannessen, J.; Hansen, B.H.; Dalene, K.E.; Kolle, E.; Northstone, K.; Møller, N.C.; Grøntved, A.; Wedderkopp, N.; Kriemler, S.; Page, A.D.; et al. Variations in accelerometry measured physical activity and sedentary time across Europe—Harmonized analyses of 47,497 children and adolescents. Int. J. Behav. Nutr. Phys. Act. 2020, 17, 38. [Google Scholar] [CrossRef] [Green Version]
- Trost, S.G.; Pate, R.R.; Sallis, J.F.; Freedson, P.S.; Taylor, W.C.; Dowda, M.; Sirard, J. Age and gender differences in objectively measured physical activity in youth. Med. Sci. Sports. Exerc. 2002, 34, 350–355. [Google Scholar] [CrossRef]
- Afshin, A.; Forouzanfar, M.H.; Reitsma, M.B.; Sur, P.; Estep, K.; Lee, A.; Marczak, L.; Mokdad, A.H.; Moradi-Lakeh, M.; Naghavi, M.; et al. Health Effects of Overweight and Obesity in 195 Countries over 25 Years. N. Engl. J. Med. 2017, 377, 13–27. [Google Scholar] [CrossRef]
- Alcalá, M.; Calderon-Dominguez, M.; Bustos, E.; Ramos, P.; Casals, N.; Serra, D.; Viana, M.; Herrero, L. Increased inflammation, oxidative stress and mitochondrial respiration in brown adipose tissue from obese mice. Sci. Rep. 2017, 7, 16082. [Google Scholar] [CrossRef] [Green Version]
- Deng, L.; Ou, Z.; Huang, D.; Li, C.; Lu, Z.; Liu, W.; Wu, F.; Nong, C.; Gao, J.; Peng, Y. Diverse effects of different Akkermansia muciniphila genotypes on Brown adipose tissue inflammation and whitening in a high-fat-diet murine model. Microb. Pathog. 2020, 147, 104353. [Google Scholar] [CrossRef]
- Goto, N.; Fujita, N.; Nino, W.; Hisatsune, K.; Ochi, R.; Nishijo, H.; Urakawa, S. Hemodynamic response during hyperbaric treatment on skeletal muscle in a type 2 diabetes rat model. Biomed. Res. 2020, 41, 23–32. [Google Scholar] [CrossRef] [Green Version]
- Fujita, N.; Goto, N.; Nakamura, T.; Nino, W.; Ono, T.; Nishijo, H.; Urakawa, S. Hyperbaric Normoxia Improved Glucose Metabolism and Decreased Inflammation in Obese Diabetic Rat. J. Diabetes. Res. 2019, 2019, 2694215. [Google Scholar] [CrossRef] [Green Version]
- Kwon, S.; Janz, K.F.; Letuchy, E.M.; Burns, T.L.; Levy, S.M. Active lifestyle in childhood and adolescence prevents obesity development in young adulthood. Obesity 2015, 23, 2462–2469. [Google Scholar] [CrossRef]
- Farooq, M.A.; Parkinson, K.N.; Adamson, A.J.; Pearce, M.S.; Reilly, J.K.; Hughes, A.R.; Janssen, X.; Basterfield, L.; Reilly, J.J. Timing of the decline in physical activity in childhood and adolescence: Gateshead Millennium Cohort Study. Br. J. Sports. Med. 2018, 52, 1002–1006. [Google Scholar] [CrossRef] [Green Version]
- Heinonen, S.; Jokinen, R.; Rissanen, A.; Pietiläinen, K.H. White adipose tissue mitochondrial metabolism in health and in obesity. Obes. Rev. 2020, 21, e12958. [Google Scholar] [CrossRef]
- Ryu, J.W.; Kim, M.S.; Kim, C.H.; Song, K.H.; Park, J.Y.; Lee, J.D.; Kim, J.B.; Lee, K.U. DHEA administration increases brown fat uncoupling protein 1 levels in obese OLETF rats. Biochem. Biophys. Res. Commun. 2003, 303, 726–731. [Google Scholar] [CrossRef]
- De Las Heras, N.; Klett-Mingo, M.; Ballesteros, S.; Martín-Fernández, B.; Escribano, Ó.; Blanco-Rivero, J.; Balfagón, G.; Hribal, M.L.; Benito, M.; Lahera, V.; et al. Chronic Exercise Improves Mitochondrial Function and Insulin Sensitivity in Brown Adipose Tissue. Front. Physiol. 2018, 9, 1122. [Google Scholar] [CrossRef]
- Crissey, J.M.; Jenkins, N.T.; Lansford, K.A.; Thorne, P.K.; Bayless, D.S.; Vieira-Potter, V.J.; Rector, R.S.; Thyfauly, J.P.; Laughlin, M.H.; Padilla, J. Adipose tissue and vascular phenotypic modulation by voluntary physical activity and dietary restriction in obese insulin-resistant OLETF rats. Am. J. Physiol. Regul. Integr. Comp. Physiol. 2014, 306, R596–R606. [Google Scholar] [CrossRef] [Green Version]
- Fujita, N.; Aono, S.; Karasaki, K.; Sera, F.; Kurose, T.; Fujino, H.; Urakawa, S. Changes in lipid metabolism and capillary density of the skeletal muscle following low-intensity exercise training in a rat model of obesity with hyperinsulinemia. PLoS ONE 2018, 13, e0196895. [Google Scholar] [CrossRef] [PubMed]
- Moran, T.H.; Bi, S. Hyperphagia and obesity in OLETF rats lacking CCK-1 receptors. Philos. Trans. R. Soc. B. Biol. Sci. 2006, 361, 1211–1218. [Google Scholar] [CrossRef] [PubMed] [Green Version]
- Matsumoto, A.; Fujita, N.; Arakawa, T.; Fujino, H.; Miki, A. Influence of electrical stimulation on calpain and ubiquitin-proteasome systems in the denervated and unloaded rat tibialis anterior muscles. Acta Histochem. 2014, 116, 936–942. [Google Scholar] [CrossRef] [PubMed]


Publisher’s Note: MDPI stays neutral with regard to jurisdictional claims in published maps and institutional affiliations. |
© 2021 by the authors. Licensee MDPI, Basel, Switzerland. This article is an open access article distributed under the terms and conditions of the Creative Commons Attribution (CC BY) license (https://creativecommons.org/licenses/by/4.0/).
Share and Cite
Takaishi, K.; Oshima, T.; Eto, H.; Nishihira, M.; Nguyen, S.T.; Ochi, R.; Fujita, N.; Urakawa, S. Impact of Exercise and Detraining during Childhood on Brown Adipose Tissue Whitening in Obesity. Metabolites 2021, 11, 677. https://doi.org/10.3390/metabo11100677
Takaishi K, Oshima T, Eto H, Nishihira M, Nguyen ST, Ochi R, Fujita N, Urakawa S. Impact of Exercise and Detraining during Childhood on Brown Adipose Tissue Whitening in Obesity. Metabolites. 2021; 11(10):677. https://doi.org/10.3390/metabo11100677
Chicago/Turabian StyleTakaishi, Kaho, Takaya Oshima, Hikari Eto, Misuzu Nishihira, Son Tien Nguyen, Ryosuke Ochi, Naoto Fujita, and Susumu Urakawa. 2021. "Impact of Exercise and Detraining during Childhood on Brown Adipose Tissue Whitening in Obesity" Metabolites 11, no. 10: 677. https://doi.org/10.3390/metabo11100677