A Workflow for Missing Values Imputation of Untargeted Metabolomics Data

 , , and
Abstract
:1. Introduction
- (1)
- For each metabolite the missing values are replaced (“imputed”) with a single value, such as the minimum detection level or half the minimum detection level. This approach results in overrepresentation of a single value in the population distribution. This may affect subsequent analyses and may cause biased results, regardless of the cause of missing values [5,6]. Furthermore, metabolites could be missing in some individuals because they are not biologically present in their system. Therefore, imputing these missing values will cause bias in the analysis. For example, if the metabolites for metformin are imputed, both diabetic patients who use the drug as well as and non-diabetic individuals who do not use the drug will have values for the it. This is a prominent issue in platforms such as Metabolon™ (Metabolon Inc., Durham, NC, USA) that include xenobiotic metabolites (e.g., metabolites from external sources such as medications).
- (2)
- Metabolites with a missing percentage above an arbitrary cut-off value (for example 20%) are removed from the dataset due to “too much missingness” regardless of the metabolite identity. By applying a cut-off above which metabolites are removed from the dataset, or, in the most extreme case only using the complete cases, data are unnecessarily discarded, that could have been of importance to the research question. Furthermore, this exclusion can affect further pathway analysis, such as metabolite set enrichment analysis, that explore possible pathway connections for the measured metabolites [7].
- (1)
- kNN on observations with variable pre-selection (“kNN-obs-sel”), a two-step method that incorporates the standard kNN algorithm with a preselection of a group of metabolites that are most correlated with the metabolite with missing values (i.e., auxiliary metabolites). Therefore, the neighbors selected by kNN will have similar metabolomic profiles [6].
- (2)
2. Results
2.1. Metabolomic Data Characteristics
2.2. Availability
2.3. Performance Evaluation
2.3.1. Sample Size
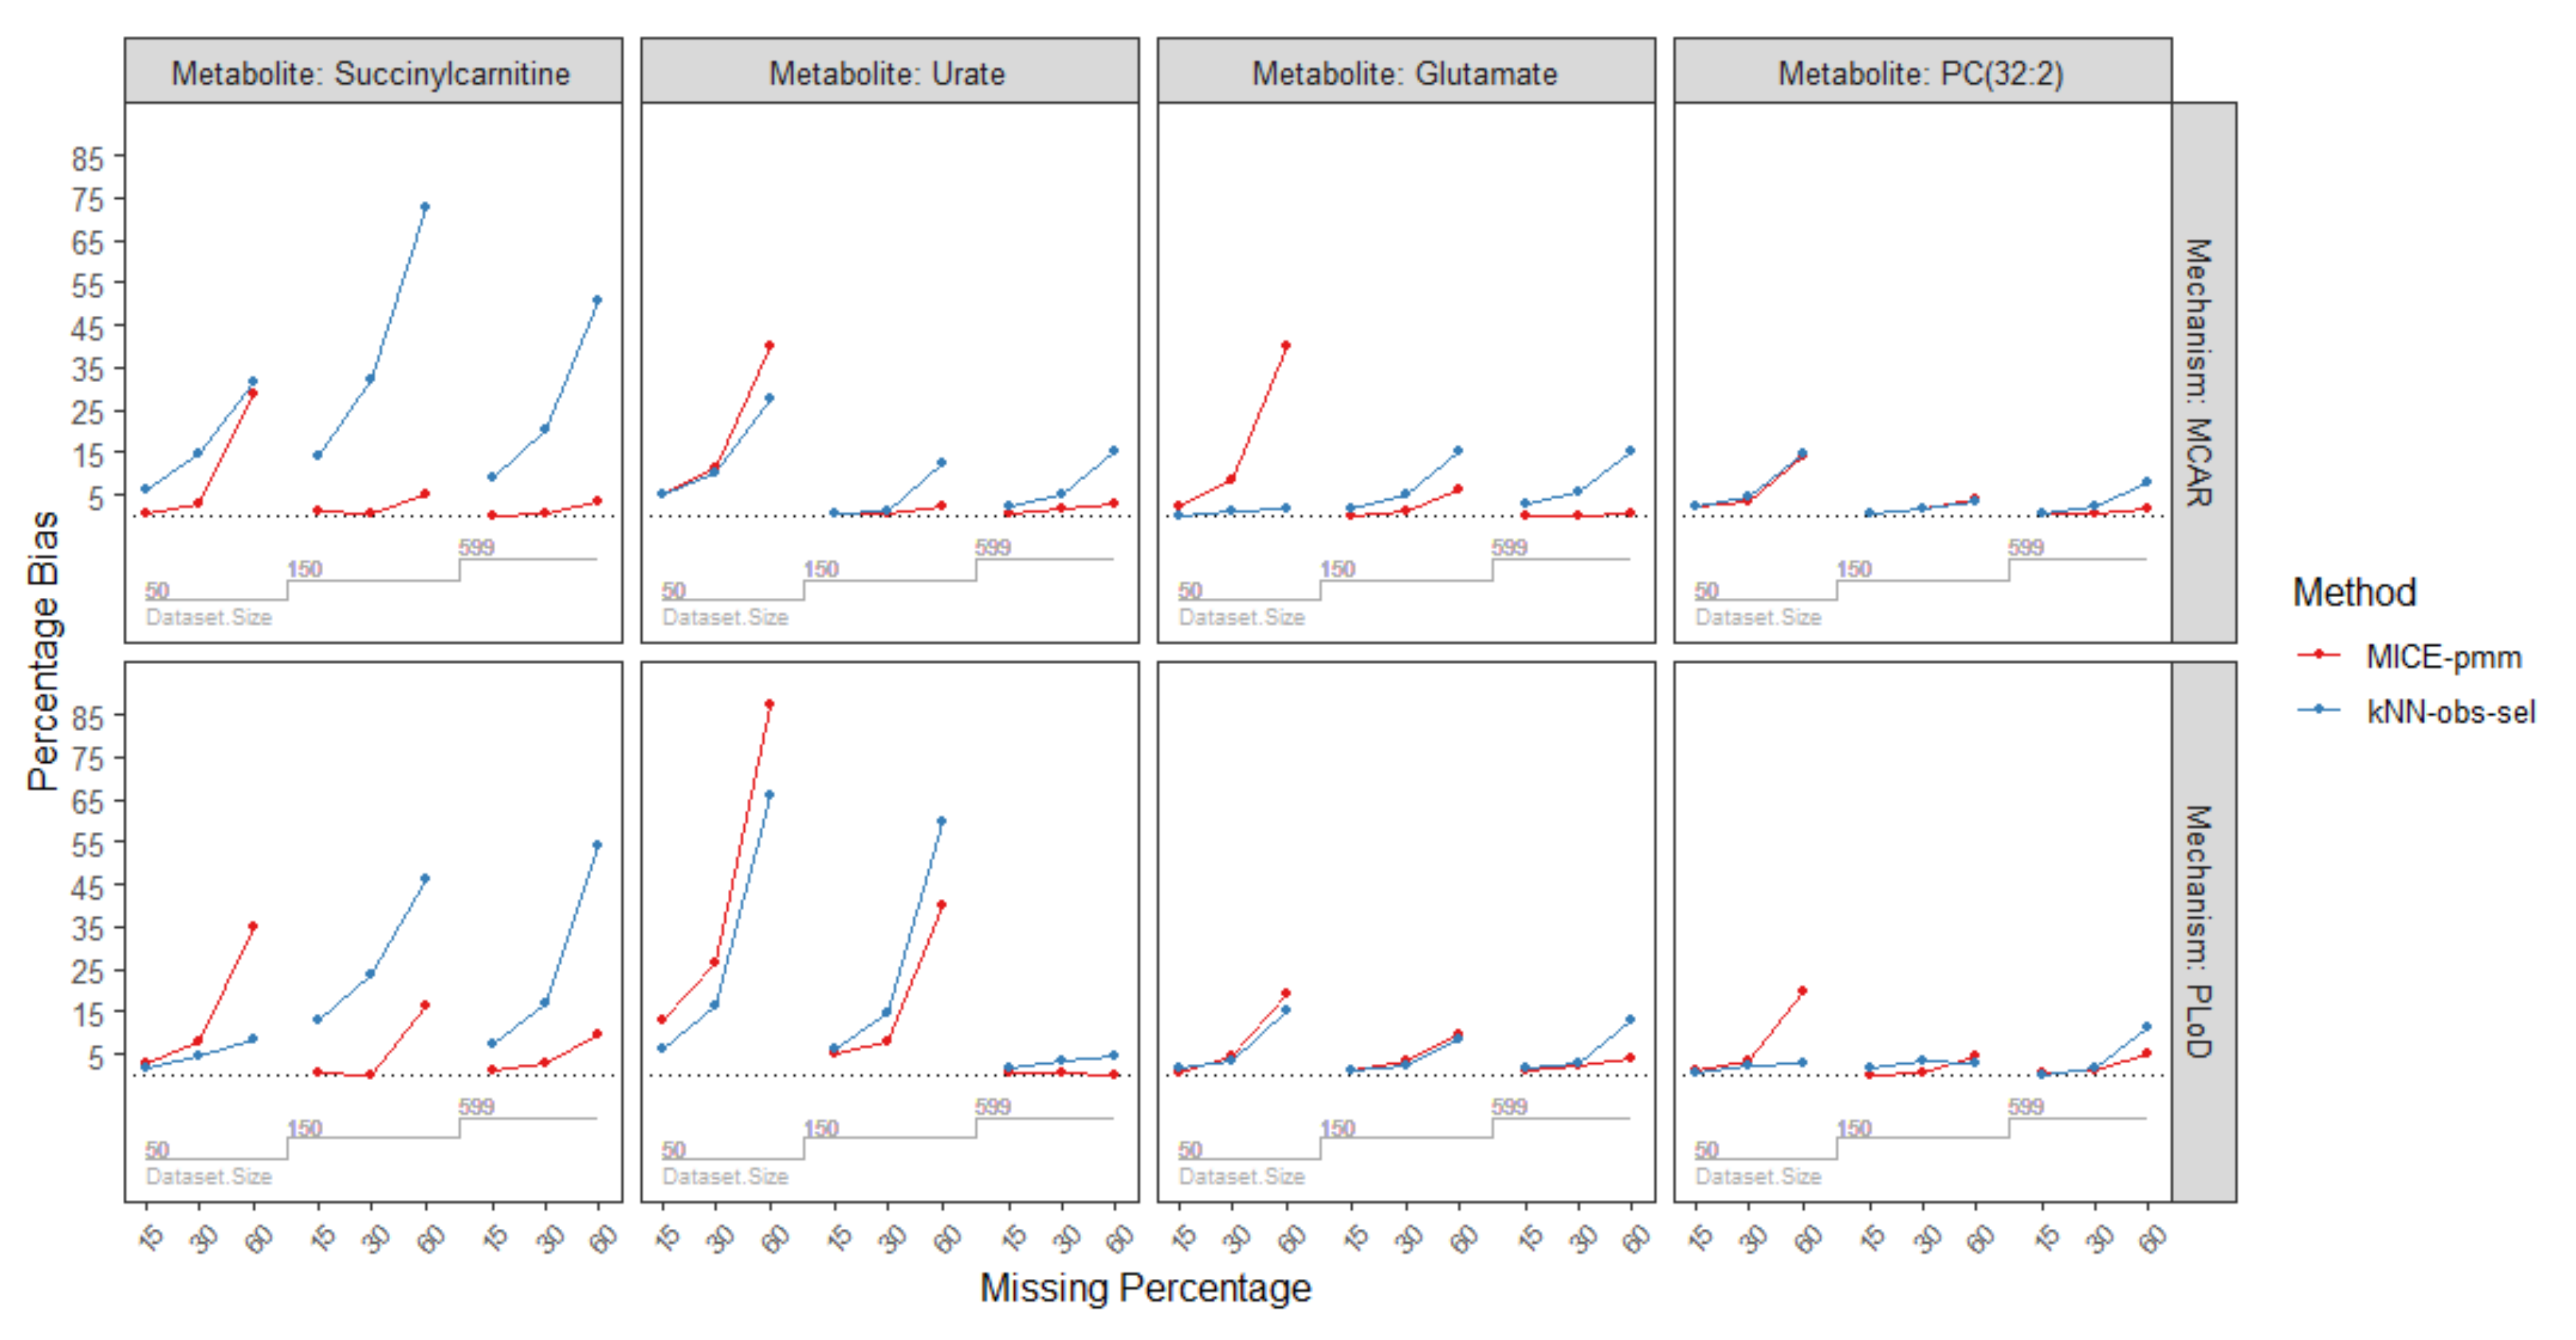
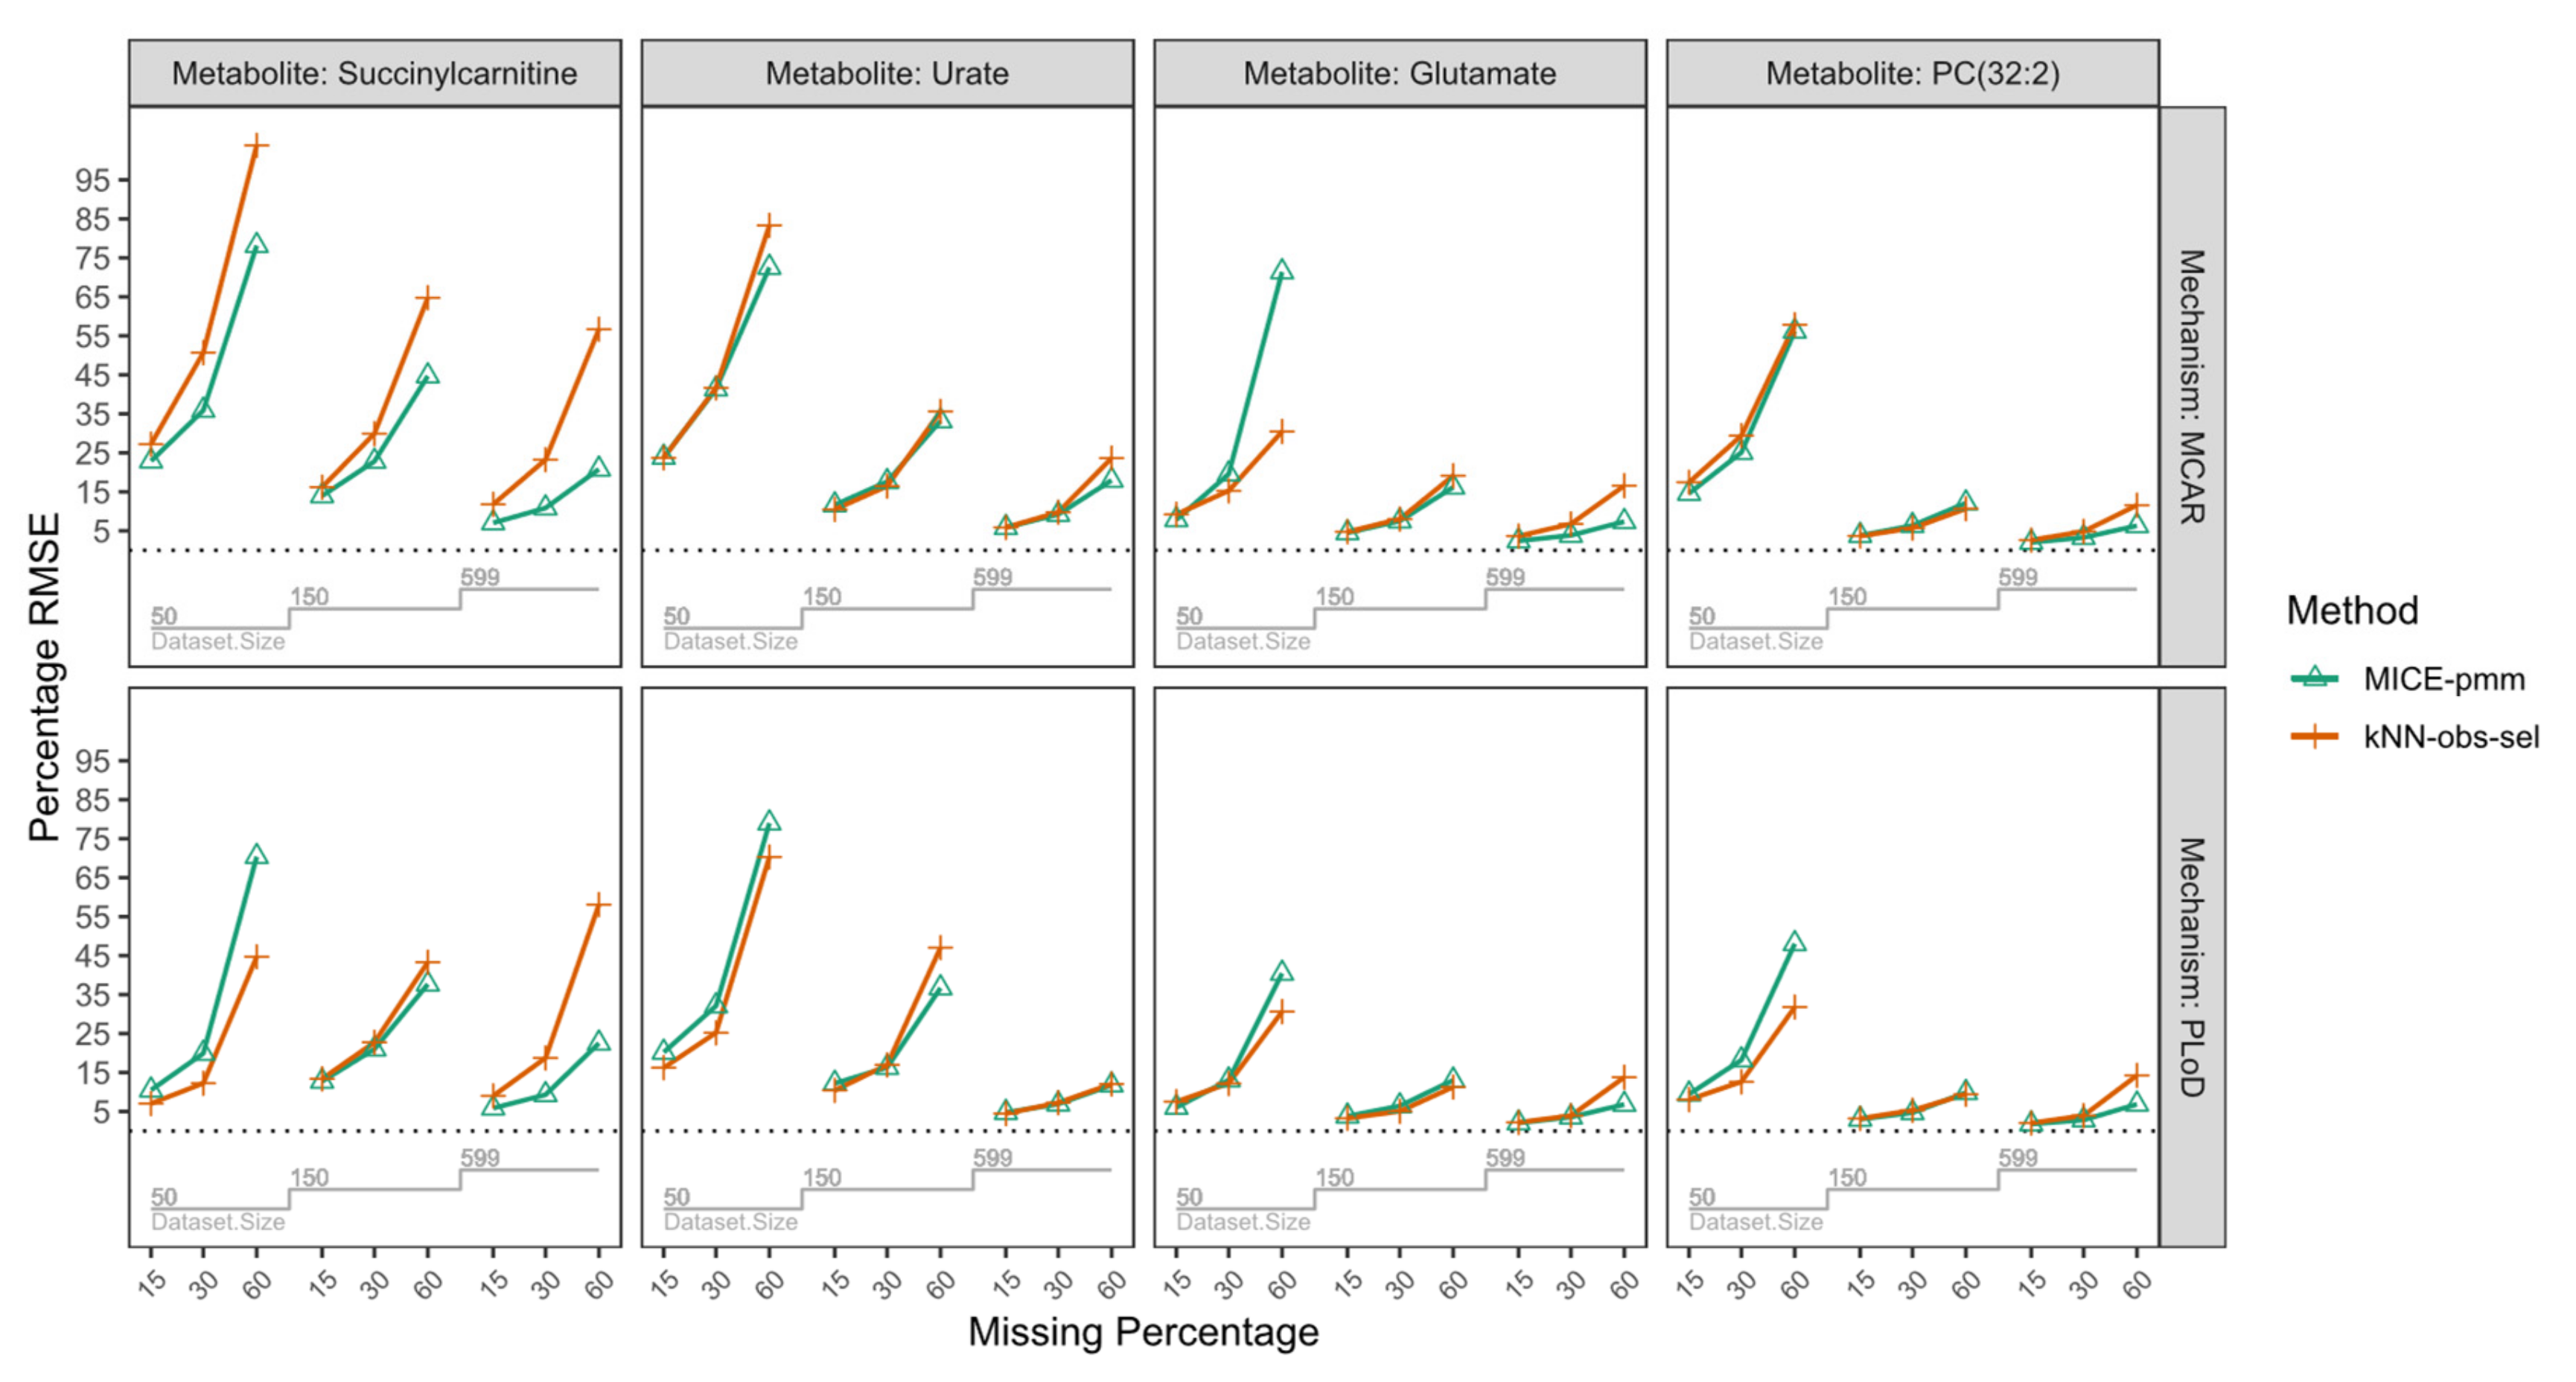
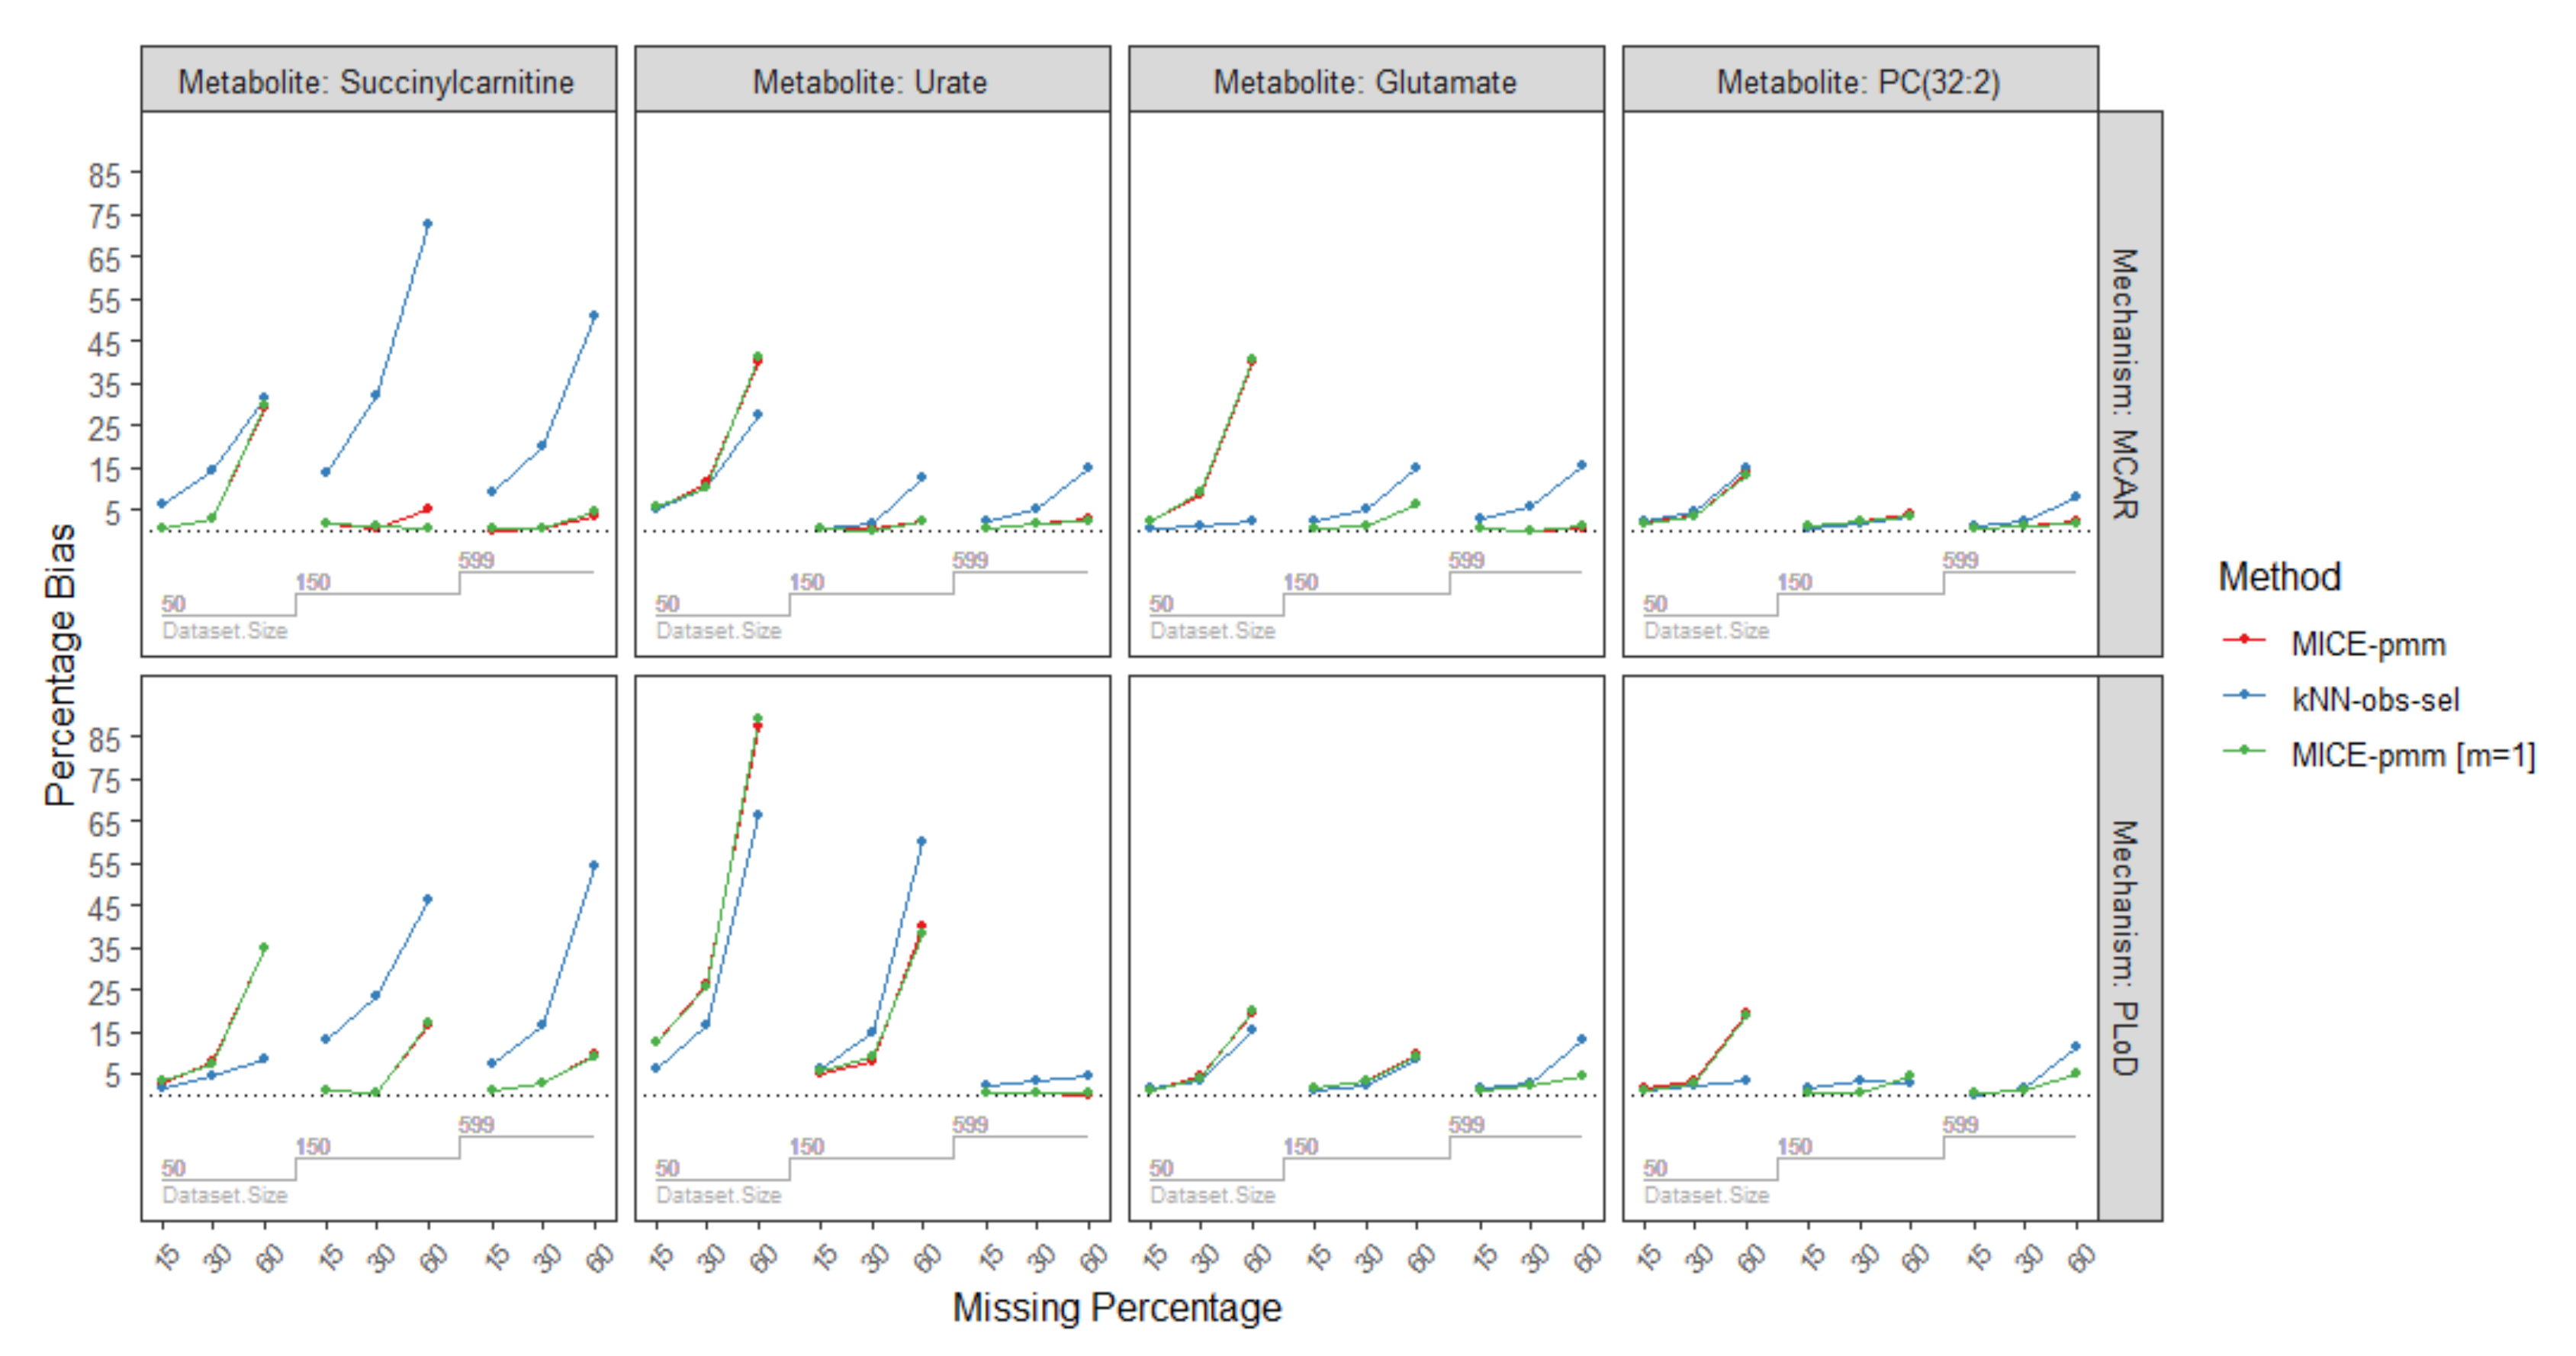
2.3.2. Percentage of Missing
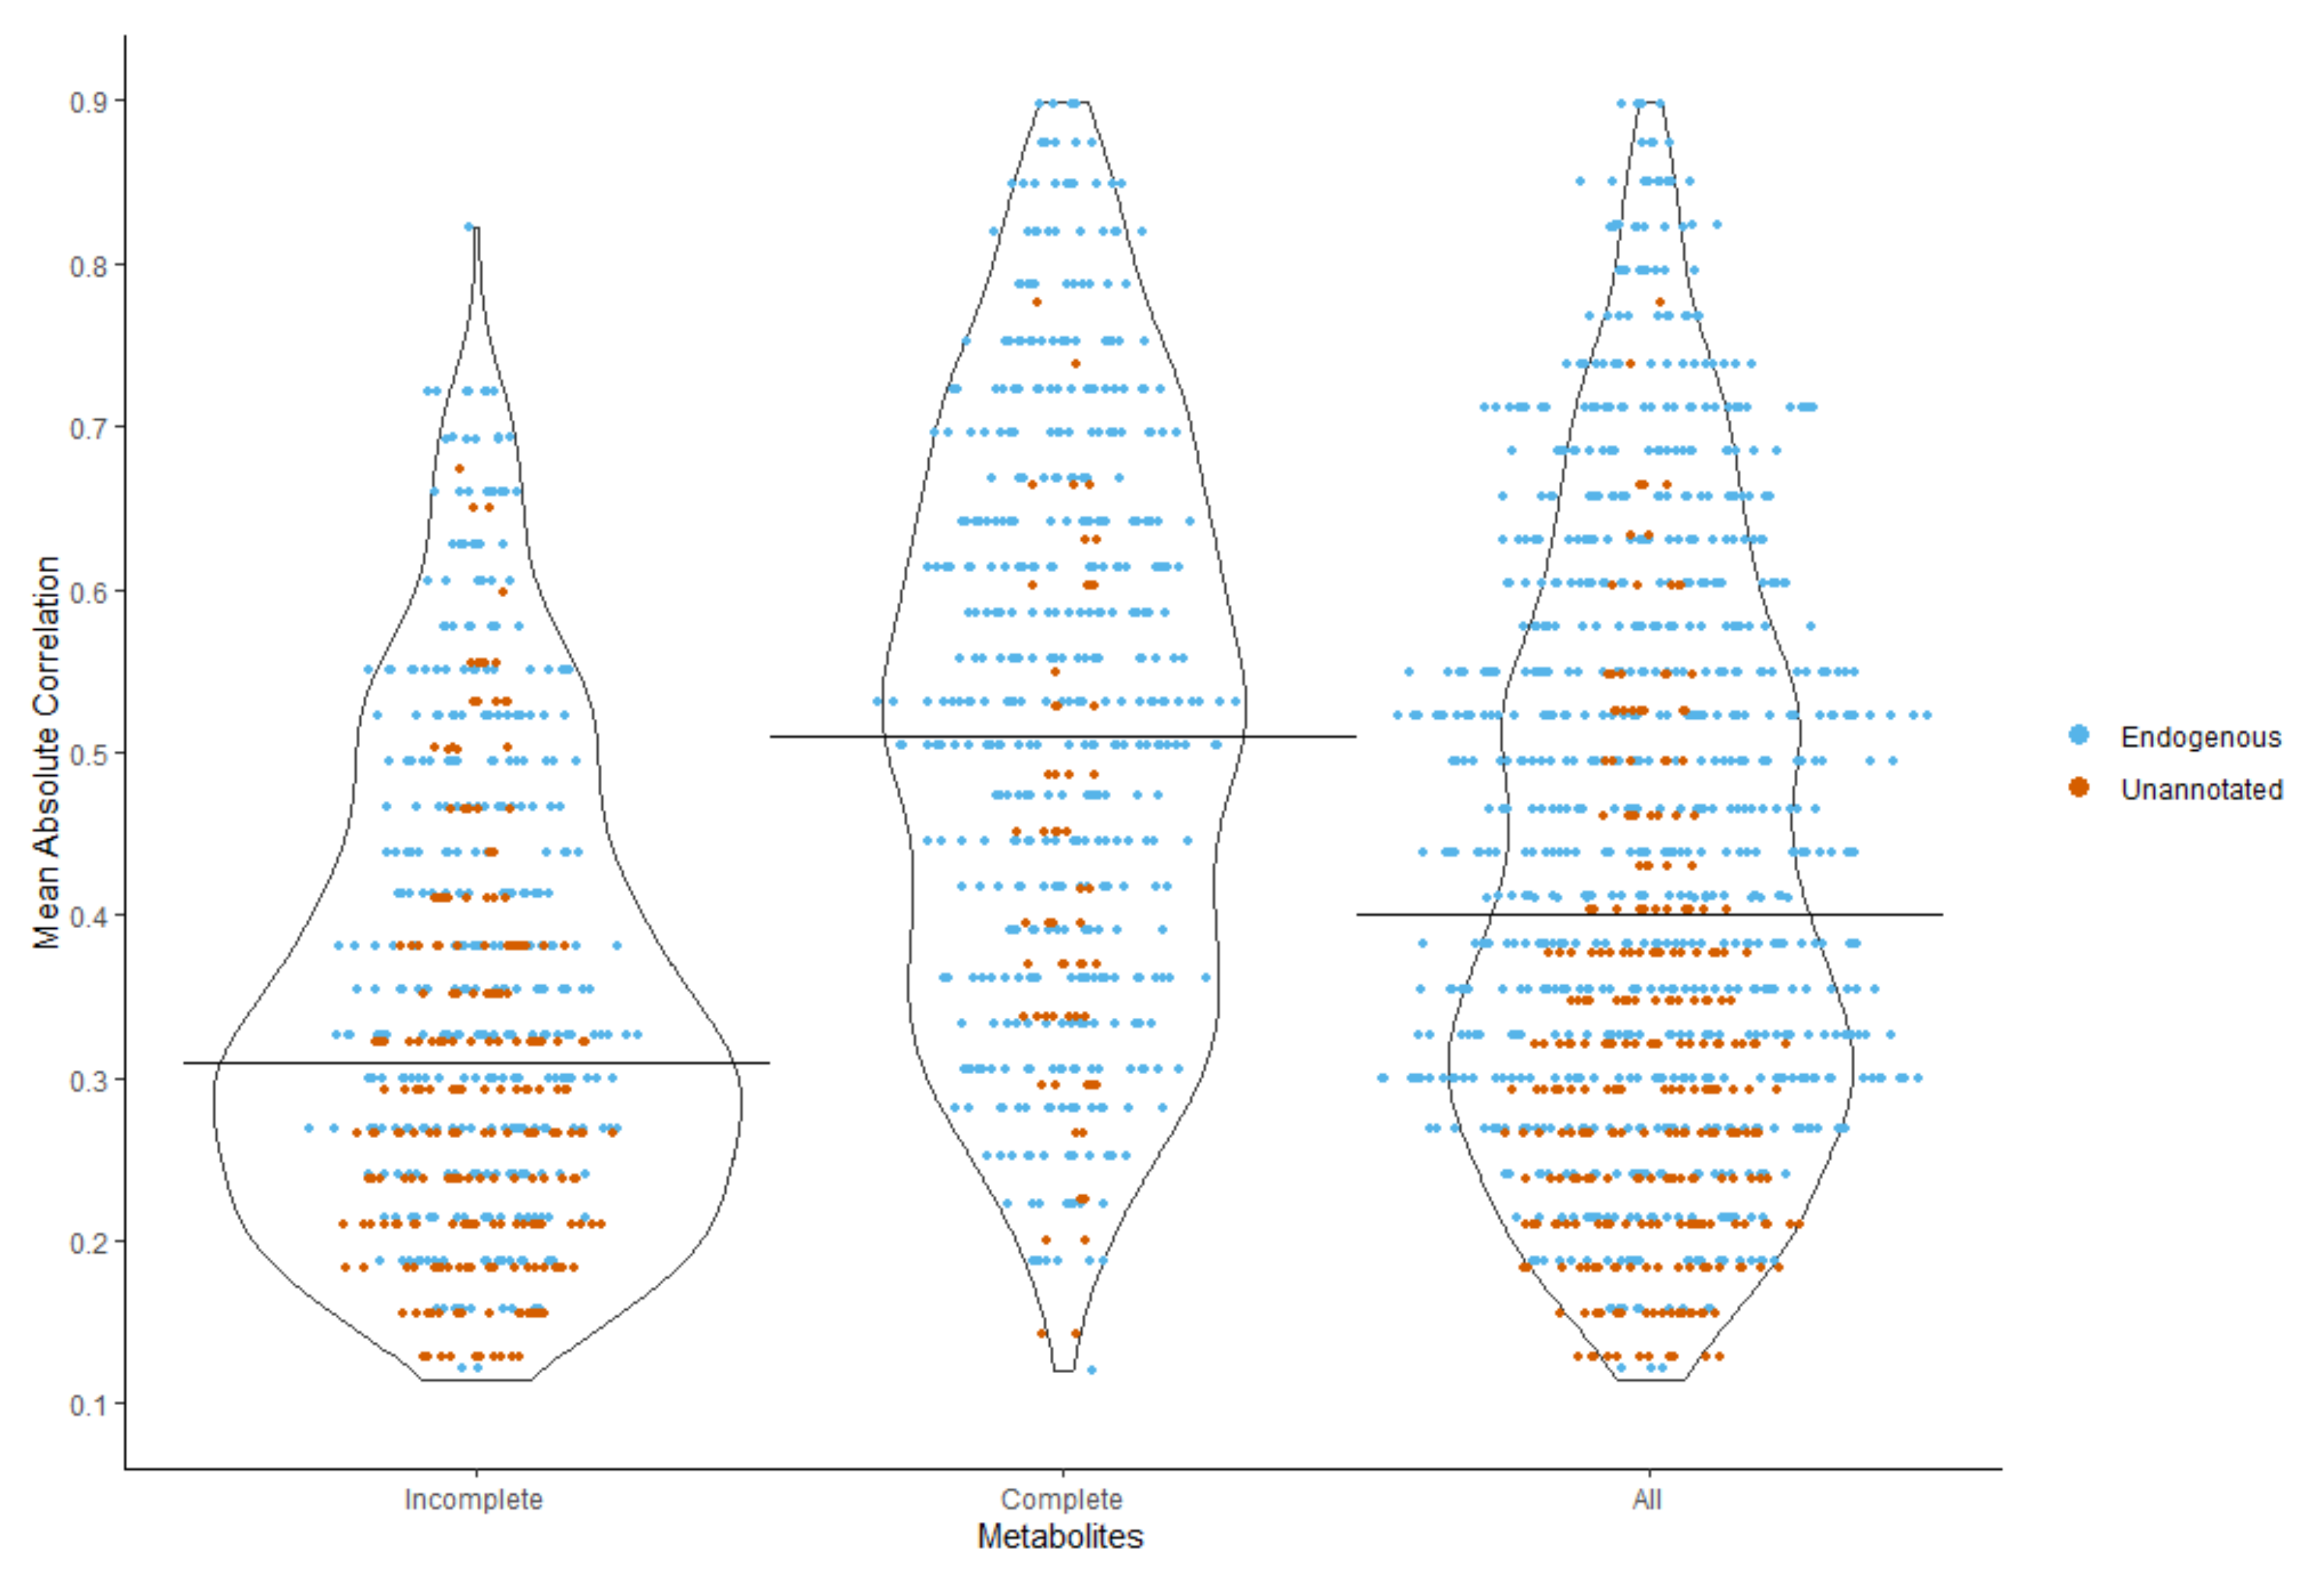
2.3.3. Correlation Strength with the Auxiliary Metabolites
2.3.4. Missing Mechanisms
3. Discussion
3.1. Advantages and Disadvantages of MICE-pmm for Metabolomics
3.2. Limitations
4. Materials and Methods
4.1. Population Characteristics
4.2. Imputation Methods
4.3. Evaluation Analysis and Missing Value Simulation
4.4. Imputation Workflow
5. Conclusions
Author Contributions
Funding
Acknowledgments
Conflicts of Interest
Appendix A. NEO Study Design
Appendix A.1. Evaluation Measures
Appendix A.2. Imputation Methods
Appendix B

| Mean Correlation | 0.1–0.19, n (%) | 0.2–0.29, n (%) | 0.3–0.39, n (%) | 0.4–0.49, n (%) | 0.5–0.59, n (%) | 0.6–0.69, n (%) | 0.7–0.79, n (%) | 0.8–0.89, n (%) | Total |
|---|---|---|---|---|---|---|---|---|---|
| Endogenous | 32 (8.79) | 86 (23.63) | 98 (26.92) | 58 (15.93) | 53 (14.56) | 29 (7.97) | 7 (1.92) | 1 (0.27) | 364 |
| Unannotated | 53 (23.35) | 83 (36.56) | 50 (22.03) | 22 (9.69) | 15 (6.61) | 1 (0.44) | 3 (1.32) | 0 (0) | 227 |
| Combined | 85 (14.38) | 169 (28.6) | 148 (25.04) | 80 (13.54) | 68 (11.51) | 30 (5.08) | 10 (1.69) | 1 (0.17) | 591 |
| Missing Mechanism | Sample Size | Missing Percentage | Metabolites/Imputation Method | |||||||||||
|---|---|---|---|---|---|---|---|---|---|---|---|---|---|---|
| PC(32:2) | Succinylcarnitine | Glutamate | Urate | |||||||||||
| MICE-pmm | kNN-obs-sel | MICE-pmm [m = 1] | MICE-pmm | kNN-obs-sel | MICE-pmm [m = 1] | MICE-pmm | kNN-obs-sel | MICE-pmm [m = 1] | MICE-pmm | kNN-obs-sel | MICE-pmm [m = 1] | |||
| MCAR | n = 50 | 15% | 2.0 | 2.1 | 1.4 | 0.3 | 6.0 | 0.4 | 2.2 | 0.2 | 2.3 | 4.9 | 4.9 | 5.5 |
| 30% | 3.2 | 4.5 | 3.4 | 2.8 | 14.4 | 2.6 | 8.6 | 1.1 | 8.8 | 11.3 | 10.2 | 10.1 | ||
| 60% | 13.9 | 14.5 | 13.2 | 28.9 | 31.3 | 29.7 | 40.2 | 2.0 | 40.7 | 39.9 | 27.6 | 40.9 | ||
| n = 150 | 15% | 0.7 | 0.5 | 0.9 | 1.4 | 13.8 | 1.7 | 0.2 | 1.9 | 0.3 | 0.7 | 0.5 | 0.5 | |
| 30% | 1.9 | 1.8 | 2.2 | 0.4 | 31.9 | 0.9 | 1.1 | 5.1 | 1.1 | 0.7 | 1.3 | 0.1 | ||
| 60% | 3.9 | 3.2 | 3.4 | 5.2 | 72.7 | 0.6 | 6.2 | 15.0 | 6.0 | 2.09 | 12.5 | 2.1 | ||
| n = 599 | 15% | 0.3 | 0.8 | 0.3 | 0.1 | 9.3 | 0.2 | 0.2 | 2.6 | 0.3 | 0.6 | 2.2 | 0.4 | |
| 30% | 0.7 | 2.4 | 0.8 | 0.6 | 20.1 | 0.3 | 0.1 | 5.6 | 0.1 | 1.5 | 4.9 | 1.8 | ||
| 60% | 1.9 | 7.9 | 1.7 | 3.5 | 50.9 | 4.6 | 0.7 | 15.1 | 0.8 | 2.6 | 15.0 | 2.4 | ||
| PLoD | n = 50 | 15% | 1.3 | 0.8 | 1.0 | 2.8 | 1.8 | 3.4 | 0.7 | 1.8 | 0.8 | 12.7 | 6.2 | 12.5 |
| 30% | 3.5 | 2.2 | 2.8 | 7.7 | 4.3 | 7.5 | 4.2 | 3.6 | 4.1 | 26.3 | 16.5 | 25.5 | ||
| 60% | 19.5 | 3.0 | 18.6 | 34.8 | 8.3 | 34.8 | 19.3 | 15.0 | 19.6 | 87.4 | 66.1 | 89.4 | ||
| n = 150 | 15% | 0.2 | 1.6 | 0.2 | 0.7 | 12.8 | 0.7 | 1.3 | 0.8 | 1.4 | 5.3 | 6.3 | 5.4 | |
| 30% | 0.3 | 3.3 | 0.6 | 0.2 | 23.4 | 0.4 | 3.0 | 2.3 | 3.1 | 8.0 | 14.9 | 8.7 | ||
| 60% | 4.2 | 2.6 | 4.2 | 16.2 | 46.1 | 17.2 | 9.4 | 8.6 | 9.1 | 39.8 | 59.7 | 38.2 | ||
| n = 599 | 15% | 0.5 | 0.1 | 0.5 | 0.9 | 7.3 | 1.0 | 0.9 | 1.4 | 0.9 | 0.5 | 1.9 | 0.5 | |
| 30% | 1.1 | 1.6 | 1.2 | 2.5 | 16.7 | 2.9 | 2.1 | 2.9 | 2.2 | 0.6 | 3.3 | 0.6 | ||
| 60% | 4.9 | 11.5 | 4.9 | 9.7 | 54.3 | 9.2 | 4.1 | 13.1 | 4.4 | 0.1 | 4.3 | 0.6 | ||
| Sample Size | Missing Percentage | Metabolites/Imputation Method/Mean Estimate (SD) | |||||||
|---|---|---|---|---|---|---|---|---|---|
| PC(32:2) | kNN-obs-sel | Succinylcarnitine | kNN-obs-sel | Glutamate | kNN-obs-sel | Urate | kNN-obs-sel | ||
| MICE-pmm | MICE-pmm | MICE-pmm | MICE-pmm | ||||||
| n = 50 | 0% | −4.18 × 10⁻⁷ | 2.84 × 10⁻⁶ | 1.83 × 10⁻⁷ | 1.39 × 10⁻⁸ | ||||
| 15% | −4.46 × 10⁻⁷ (6.04 × 10⁻⁸) | −4.47 × 10⁻⁷ (7.24 × 10⁻⁸) | 4.52 × 10⁻⁶ (6.38 × 10⁻⁷) | 4.8 × 10⁻⁶ (7.38 × 10⁻⁷) | 2.82 × 10⁻⁸ (1.29 × 10⁻⁹) | 2.88 × 10⁻⁸ (1.69 × 10⁻⁹) | 9.11 × 10⁻⁹ (3.29 × 10⁻⁹) | 1.01 × 10⁻⁸ (3.27 × 10⁻⁹) | |
| 30% | −4.52 × 10⁻⁷ (1.04 × 10⁻⁷) | −4.57 × 10⁻⁷ (1.21 × 10⁻⁷) | 4.39 × 10⁻⁶ (1.02 × 10⁻⁶) | 5.15 × 10⁻⁶ (1.24 × 10⁻⁶) | 2.64 × 10⁻⁸ (2.61 × 10⁻⁹) | 2.86 × 10⁻⁸ (2.79 × 10⁻⁹) | 8.5 × 10⁻⁹ (5.66 × 10⁻⁹) | 1.06 × 10⁻⁸ (5.72 × 10⁻⁹) | |
| 60% | −3.77 × 10⁻⁷ (2.28 × 10⁻⁷) | −5.01 × 10⁻⁷ (2.34 × 10⁻⁷) | 3.22 × 10⁻⁶ (1.73 × 10⁻⁶) | 5.96 × 10⁻⁶ (2.58 × 10⁻⁶) | 1.73 × 10⁻⁸ (6.06 × 10⁻⁹) | 2.83 × 10⁻⁸ (5.57 × 10⁻⁹) | 5.75 × 10⁻⁹ (9.36 × 10⁻⁹) | 1.22 × 10⁻⁸ (1.13 × 10⁻⁸) | |
| n = 150 | 0% | −3.64 × 10⁻⁷ | 1.53 × 10⁻⁶ | 2.89 × 10⁻⁸ | 9.58 × 10⁻⁹ | ||||
| 15% | −3.66 × 10⁻⁷ (1.57 × 10⁻⁸) | −3.62 × 10⁻⁷ (1.53 × 10⁻⁸) | 1.54 × 10⁻⁶ (4.09 × 10⁻⁷) | 1.77 × 10⁻⁶ (4.17 × 10⁻⁷) | 1.66 × 10⁻⁸ (8.24 × 10⁻¹⁰) | 1.69 × 10⁻⁸ (8.15 × 10⁻¹⁰) | 9.76 × 10⁻⁹ (1.62 × 10⁻⁹) | 9.74 × 10⁻⁹ (1.46 × 10⁻⁹) | |
| 30% | −3.71 × 10⁻⁷ (2.57 × 10⁻⁸) | −3.58 × 10⁻⁷ (2.29 × 10⁻⁸) | 1.52 × 10⁻⁶ (6.43 × 10⁻⁷) | 1.99 × 10⁻⁶ (6.94 × 10⁻⁷) | 1.64 × 10⁻⁸ (1.37 × 10⁻⁹) | 1.74 × 10⁻⁸ (1.21 × 10⁻⁹) | 9.75 × 10⁻⁹ (2.45 × 10⁻⁹) | 9.82 × 10⁻⁹ (2.29 × 10⁻⁹) | |
| 60% | −3.78 × 10⁻⁷ (4.87 × 10⁻⁸) | −3.52 × 10⁻⁷ (4.3 × 10⁻⁸) | 1.48 × 10⁻⁶ (1.2 × 10⁻⁶) | 2.7 × 10⁻⁶ (1.48 × 10⁻⁶) | 1.56 × 10⁻⁸ (2.79 × 10⁻⁹) | 1.91 × 10⁻⁸ (2.47 × 10⁻⁹) | 9.89 × 10⁻⁹ (4.61 × 10⁻⁹) | 1.09 × 10⁻⁸ (4.81 × 10⁻⁹) | |
| n = 599 | 0% | −4.38 × 10⁻⁷ | 4.53 × 10⁻⁶ | 1.66 × 10⁻⁸ | 9.69 × 10⁻⁹ | ||||
| 15% | −4.2 × 10⁻⁷ (8.44 × 10⁻⁹) | −4.22 × 10⁻⁷ (1.05 × 10⁻⁸) | 2.84 × 10⁻⁶ (1.96 × 10⁻⁷) | 3.1 × 10⁻⁶ (1.94 × 10⁻⁷) | 1.84 × 10⁻⁸ (4.43 × 10⁻¹⁰) | 1.88 × 10⁻⁸ (4.77 × 10⁻¹⁰) | 1.4 × 10⁻⁸ (8.08 × 10⁻¹⁰) | 1.42 × 10⁻⁸ (7.59 × 10⁻¹⁰) | |
| 30% | −4.21 × 10⁻⁷ (1.33 × 10⁻⁸) | −4.28 × 10⁻⁷ (1.76 × 10⁻⁸) | 2.85 × 10⁻⁶ (3.08 × 10⁻⁷) | 3.43 × 10⁻⁶ (3.35 × 10⁻⁷) | 1.84 × 10⁻⁸ (7.05 × 10⁻¹⁰) | 1.94 × 10⁻⁸ (7.16 × 10⁻¹⁰) | 1.41 × 10⁻⁸ (1.27 × 10⁻⁹) | 1.46 × 10⁻⁸ (1.19 × 10⁻⁹) | |
| 60% | −4.26 × 10⁻⁷ (2.52 × 10⁻⁸) | −4.51 × 10⁻⁷ (3.54 × 10⁻⁸) | 2.79 × 10⁻⁶ (5.88 × 10⁻⁷) | 4.34 × 10⁻⁶ (7.2 × 10⁻⁷) | 1.82 × 10⁻⁸ (1.34 × 10⁻⁹) | 2.11 × 10⁻⁸ (1.27 × 10⁻⁹) | 1.43 × 10⁻⁸ (2.47 × 10⁻⁹) | 1.6 × 10⁻⁸ (2.55 × 10⁻⁹) | |
| Sample Size | Missing Percentage | Metabolites/Imputation Method/Mean Estimate (SD) | |||||||
|---|---|---|---|---|---|---|---|---|---|
| PC(32:2) | kNN-obs-sel | Succinylcarnitine | kNN-obs-sel | Glutamate | kNN-obs-sel | Urate | kNN-obs-sel | ||
| MICE-pmm | MICE-pmm | MICE-pmm | MICE-pmm | ||||||
| n = 50 | 0% | −4.18 × 10⁻⁷ | 2.84 × 10⁻⁶ | 1.83 × 10⁻⁷ | 1.39 × 10⁻⁸ | ||||
| 15% | −4.32 × 10⁻⁷ (3.91 × 10⁻⁸) | −4.34 × 10⁻⁷ (3.35 × 10⁻⁸) | 4.4 × 10⁻⁶ (2.56 × 10⁻⁷) | 4.62 × 10⁻⁶ (1.79 × 10⁻⁷) | 2.87 × 10⁻⁸ (1.09 × 10⁻⁹) | 2.94 × 10⁻⁸ (1.29 × 10⁻⁹) | 8.36 × 10⁻⁹ (2.53 × 10⁻⁹) | 8.99 × 10⁻⁹ (2.19 × 10⁻⁹) | |
| 30% | −4.22 × 10⁻⁷ (7.47 × 10⁻⁸) | −4.28 × 10⁻⁷ (5.19 × 10⁻⁸) | 4.15 × 10⁻⁶ (4.4 × 10⁻⁷) | 4.72 × 10⁻⁶ (2.83 × 10⁻⁷) | 2.77 × 10⁻⁸ (2.07 × 10⁻⁹) | 2.99 × 10⁻⁸ (1.99 × 10⁻⁹) | 7.07 × 10⁻⁹ (3.7 × 10⁻⁹) | 8 × 10⁻⁹ (3.14 × 10⁻⁹) | |
| 60% | −3.52 × 10⁻⁷ (1.82 × 10⁻⁷) | −4.51 × 10⁻⁷ (1.32 × 10⁻⁷) | 3.05 × 10⁻⁶ (1.18 × 10⁻⁶) | 4.96 × 10⁻⁶ (1.19 × 10⁻⁶) | 2.33 × 10⁻⁸ (4.89 × 10⁻⁹) | 3.32 × 10⁻⁸ (3.59 × 10⁻⁹) | 1.21 × 10⁻⁹ (7.1 × 10⁻⁹) | 3.25 × 10⁻⁹ (7.47 × 10⁻⁹) | |
| n = 150 | 0% | −3.64 × 10⁻⁷ | 1.53 × 10⁻⁶ | 2.89 × 10⁻⁸ | 9.58 × 10⁻⁹ | ||||
| 15% | −3.65 × 10⁻⁷ (1.26 × 10⁻⁸) | −3.58 × 10⁻⁷ (1.22 × 10⁻⁸) | 1.51 × 10⁻⁶ (3.88 × 10⁻⁷) | 1.72 × 10⁻⁶ (3.61 × 10⁻⁷) | 1.64 × 10⁻⁸ (6.63 × 10⁻¹⁰) | 1.67 × 10⁻⁸ (5.85 × 10⁻¹⁰) | 9.18 × 10⁻⁹ (1.62 × 10⁻⁹) | 9.08 × 10⁻⁹ (1.31 × 10⁻⁹) | |
| 30% | −3.65 × 10⁻⁷ (1.96 × 10⁻⁸) | −3.52 × 10⁻⁷ (1.86 × 10⁻⁸) | 1.49 × 10⁻⁶ (6.11 × 10⁻⁷) | 1.86 × 10⁻⁶ (5.51 × 10⁻⁷) | 1.61 × 10⁻⁸ (1.07 × 10⁻⁹) | 1.7 × 10⁻⁸ (8.47 × 10⁻¹⁰) | 8.91 × 10⁻⁹ (2.14 × 10⁻⁹) | 8.25 × 10⁻⁹ (1.87 × 10⁻⁹) | |
| 60% | −3.79 × 10⁻⁷ (3.83 × 10⁻⁸) | −3.74 × 10⁻⁷ (3.83 × 10⁻⁸) | 1.66 × 10⁻⁶ (1.05 × 10⁻⁶) | 2.11 × 10⁻⁶ (9.8 × 10⁻⁷) | 1.5 × 10⁻⁸ (1.8 × 10⁻⁹) | 1.8 × 10⁻⁸ (1.51 × 10⁻⁹) | 5.83 × 10⁻⁹ (3.36 × 10⁻⁹) | 3.91 × 10⁻⁹ (3.08 × 10⁻⁹) | |
| n = 599 | 0% | −4.38 × 10⁻⁷ | 4.53 × 10⁻⁶ | 1.66 × 10⁻⁸ | 9.69 × 10⁻⁹ | ||||
| 15% | −4.2 × 10⁻⁷ (7.17 × 10⁻⁹) | −4.18 × 10⁻⁷ (8.61 × 10⁻⁹) | 2.82 × 10⁻⁶ (1.59 × 10⁻⁷) | 3.05 × 10⁻⁶ (1.5 × 10⁻⁷) | 1.82 × 10⁻⁸ (3.37 × 10⁻¹⁰) | 1.86 × 10⁻⁸ (3.1 × 10⁻¹⁰) | 1.4 × 10⁻⁸ (6.57 × 10⁻¹⁰) | 1.42 × 10⁻⁸ (5.63 × 10⁻¹⁰) | |
| 30% | −4.23 × 10⁻⁷ (1.1 × 10⁻⁸) | −4.25 × 10⁻⁷ (1.52 × 10⁻⁸) | 2.79 × 10⁻⁶ (2.52 × 10⁻⁷) | 3.34 × 10⁻⁶ (2.34 × 10⁻⁷) | 1.8 × 10⁻⁸ (5.37 × 10⁻¹⁰) | 1.89 × 10⁻⁸ (4.81 × 10⁻¹⁰) | 1.4 × 10⁻⁸ (9.58 × 10⁻¹⁰) | 1.44 × 10⁻⁸ (8.97 × 10⁻¹⁰) | |
| 60% | −4.39 × 10⁻⁷ (2.02 × 10⁻⁸) | −4.66 × 10⁻⁷ (3.56 × 10⁻⁸) | 2.58 × 10⁻⁶ (5.62 × 10⁻⁷) | 4.37 × 10⁻⁶ (6.13 × 10⁻⁷) | 1.76 × 10⁻⁸ (9.99 × 10⁻¹⁰) | 2.07 × 10⁻⁸ (8.04 × 10⁻¹⁰) | 1.39 × 10⁻⁸ (1.64 × 10⁻⁹) | 1.45 × 10⁻⁸ (1.57 × 10⁻⁹) | |
| Missing Mechanism | Sample Size | Missing Percentage | Metabolites/Imputation Method | |||||||
|---|---|---|---|---|---|---|---|---|---|---|
| PC(32:2) | Succinylcarnitine | Glutamate | Urate | |||||||
| MICE-pmm | kNN-obs-sel | MICE-pmm | kNN-obs-sel | MICE-pmm | kNN-obs-sel | MICE-pmm | kNN-obs-sel | |||
| MCAR | n = 50 | 15% | 6.56 × 10⁻⁸ | 7.48 × 10⁻⁸ | 6.5 × 10⁻⁷ | 7.73 × 10⁻⁷ | 3.32 × 10⁻⁹ | 3.3 × 10⁻⁹ | 1.44 × 10⁻⁹ | 1.69 × 10⁻⁹ |
| 30% | 1.04 × 10⁻⁷ | 1.22 × 10⁻⁷ | 1.02 × 10⁻⁶ | 1.44 × 10⁻⁶ | 5.76 × 10⁻⁹ | 5.8 × 10⁻⁹ | 3.59 × 10⁻⁹ | 2.8 × 10⁻⁹ | ||
| 60% | 2.33 × 10⁻⁷ | 2.49 × 10⁻⁷ | 2.22 × 10⁻⁶ | 2.95 × 10⁻⁶ | 1.01 × 10⁻⁸ | 1.16 × 10⁻⁸ | 1.31 × 10⁻⁸ | 5.59 × 10⁻⁹ | ||
| n = 150 | 15% | 1.71 × 10⁻⁸ | 1.69 × 10⁻⁸ | 3.97 × 10⁻⁷ | 4.6 × 10⁻⁷ | 1.62 × 10⁻⁹ | 1.46 × 10⁻⁹ | 8.24 × 10⁻¹⁰ | 8.75 × 10⁻¹⁰ | |
| 30% | 2.63 × 10⁻⁸ | 2.49 × 10⁻⁸ | 6.48 × 10⁻⁷ | 8.5 × 10⁻⁷ | 2.45 × 10⁻⁹ | 2.29 × 10⁻⁹ | 1.38 × 10⁻⁹ | 1.47 × 10⁻⁹ | ||
| 60% | 5.23 × 10⁻⁸ | 4.78 × 10⁻⁸ | 1.27 × 10⁻⁶ | 1.84 × 10⁻⁶ | 4.62 × 10⁻⁹ | 4.96 × 10⁻⁹ | 2.97 × 10⁻⁹ | 3.51 × 10⁻⁹ | ||
| n = 599 | 15% | 8.64 × 10⁻⁹ | 1.08 × 10⁻⁸ | 2,00 × 10⁻⁷ | 3.35 × 10⁻⁷ | 8.12 × 10⁻¹⁰ | 8.17 × 10⁻¹⁰ | 4.45 × 10⁻¹⁰ | 6.71 × 10⁻¹⁰ | |
| 30% | 1.28 × 10⁻⁸ | 1.95 × 10⁻⁸ | 3.08 × 10⁻⁷ | 6.6 × 10⁻⁷ | 1.28 × 10⁻⁹ | 1.36 × 10⁻⁹ | 7.05 × 10⁻¹⁰ | 1.24 × 10⁻⁹ | ||
| 60% | 2.63 × 10⁻⁸ | 5.04 × 10⁻⁸ | 5.91 × 10⁻⁷ | 1.61 × 10⁻⁶ | 2.5 × 10⁻⁹ | 3.29 × 10⁻⁹ | 1.35 × 10⁻⁹ | 3.04 × 10⁻⁹ | ||
| PLoD | n = 50 | 15% | 3.99 × 10⁻⁸ | 3.23 × 10⁻⁸ | 2.98 × 10⁻⁷ | 2,00 × 10⁻⁷ | 2.81 × 10⁻⁹ | 2.26 × 10⁻⁹ | 1.11 × 10⁻⁹ | 1.38 × 10⁻⁹ |
| 30% | 7.36 × 10⁻⁸ | 5.36 × 10⁻⁸ | 5.66 × 10⁻⁷ | 3.48 × 10⁻⁷ | 4.47 × 10⁻⁹ | 3.51 × 10⁻⁹ | 2.4 × 10⁻⁹ | 2.24 × 10⁻⁹ | ||
| 60% | 1.87 × 10⁻⁷ | 1.25 × 10⁻⁷ | 2,00 × 10⁻⁶ | 1.27 × 10⁻⁶ | 1.1 × 10⁻⁸ | 9.79 × 10⁻⁹ | 7.42 × 10⁻⁹ | 5.62 × 10⁻⁹ | ||
| n = 150 | 15% | 1.33 × 10⁻⁸ | 1.36 × 10⁻⁸ | 3.62 × 10⁻⁷ | 3.8 × 10⁻⁷ | 1.7 × 10⁻⁹ | 1.45 × 10⁻⁹ | 6.97 × 10⁻¹⁰ | 5.99 × 10⁻¹⁰ | |
| 30% | 1.96 × 10⁻⁸ | 2.15 × 10⁻⁸ | 5.97 × 10⁻⁷ | 6.46 × 10⁻⁷ | 2.27 × 10⁻⁹ | 2.36 × 10⁻⁹ | 1.18 × 10⁻⁹ | 9.27 × 10⁻¹⁰ | ||
| 60% | 4.42 × 10⁻⁸ | 3.98 × 10⁻⁸ | 1.07 × 10⁻⁶ | 1.23 × 10⁻⁶ | 5.11 × 10⁻⁹ | 6.55 × 10⁻⁹ | 2.39 × 10⁻⁹ | 2.07 × 10⁻⁹ | ||
| n = 599 | 15% | 7.54 × 10⁻⁹ | 8.52 × 10⁻⁹ | 1.67 × 10⁻⁷ | 2.56 × 10⁻⁷ | 6.6 × 10⁻¹⁰ | 6.22 × 10⁻¹⁰ | 3.77 × 10⁻¹⁰ | 4.03 × 10⁻¹⁰ | |
| 30% | 1.17 × 10⁻⁸ | 1.64 × 10⁻⁸ | 2.64 × 10⁻⁷ | 5.32 × 10⁻⁷ | 9.61 × 10⁻¹⁰ | 1.01 × 10⁻⁹ | 6.55 × 10⁻¹⁰ | 7.2 × 10⁻¹⁰ | ||
| 60% | 2.96 × 10⁻⁸ | 5.82 × 10⁻⁸ | 6.4 × 10⁻⁷ | 1.65 × 10⁻⁶ | 1.64 × 10⁻⁹ | 1.68 × 10⁻⁹ | 1.25 × 10⁻⁹ | 2.53 × 10⁻⁹ | ||
| Missing Mechanism | Sample Size | Missing Percentage | Metabolites/Imputation Method | |||||||||||
|---|---|---|---|---|---|---|---|---|---|---|---|---|---|---|
| PC(32:2) | Succinylcarnitine | Glutamate | Urate | |||||||||||
| MICE-pmm | kNN-obs-sel | MICE-pmm [m = 1] | MICE-pmm | kNN-obs-sel | MICE-pmm [m = 1] | MICE-pmm | kNN-obs-sel | MICE-pmm [m = 1] | MICE-pmm | kNN-obs-sel | MICE-pmm [m = 1] | |||
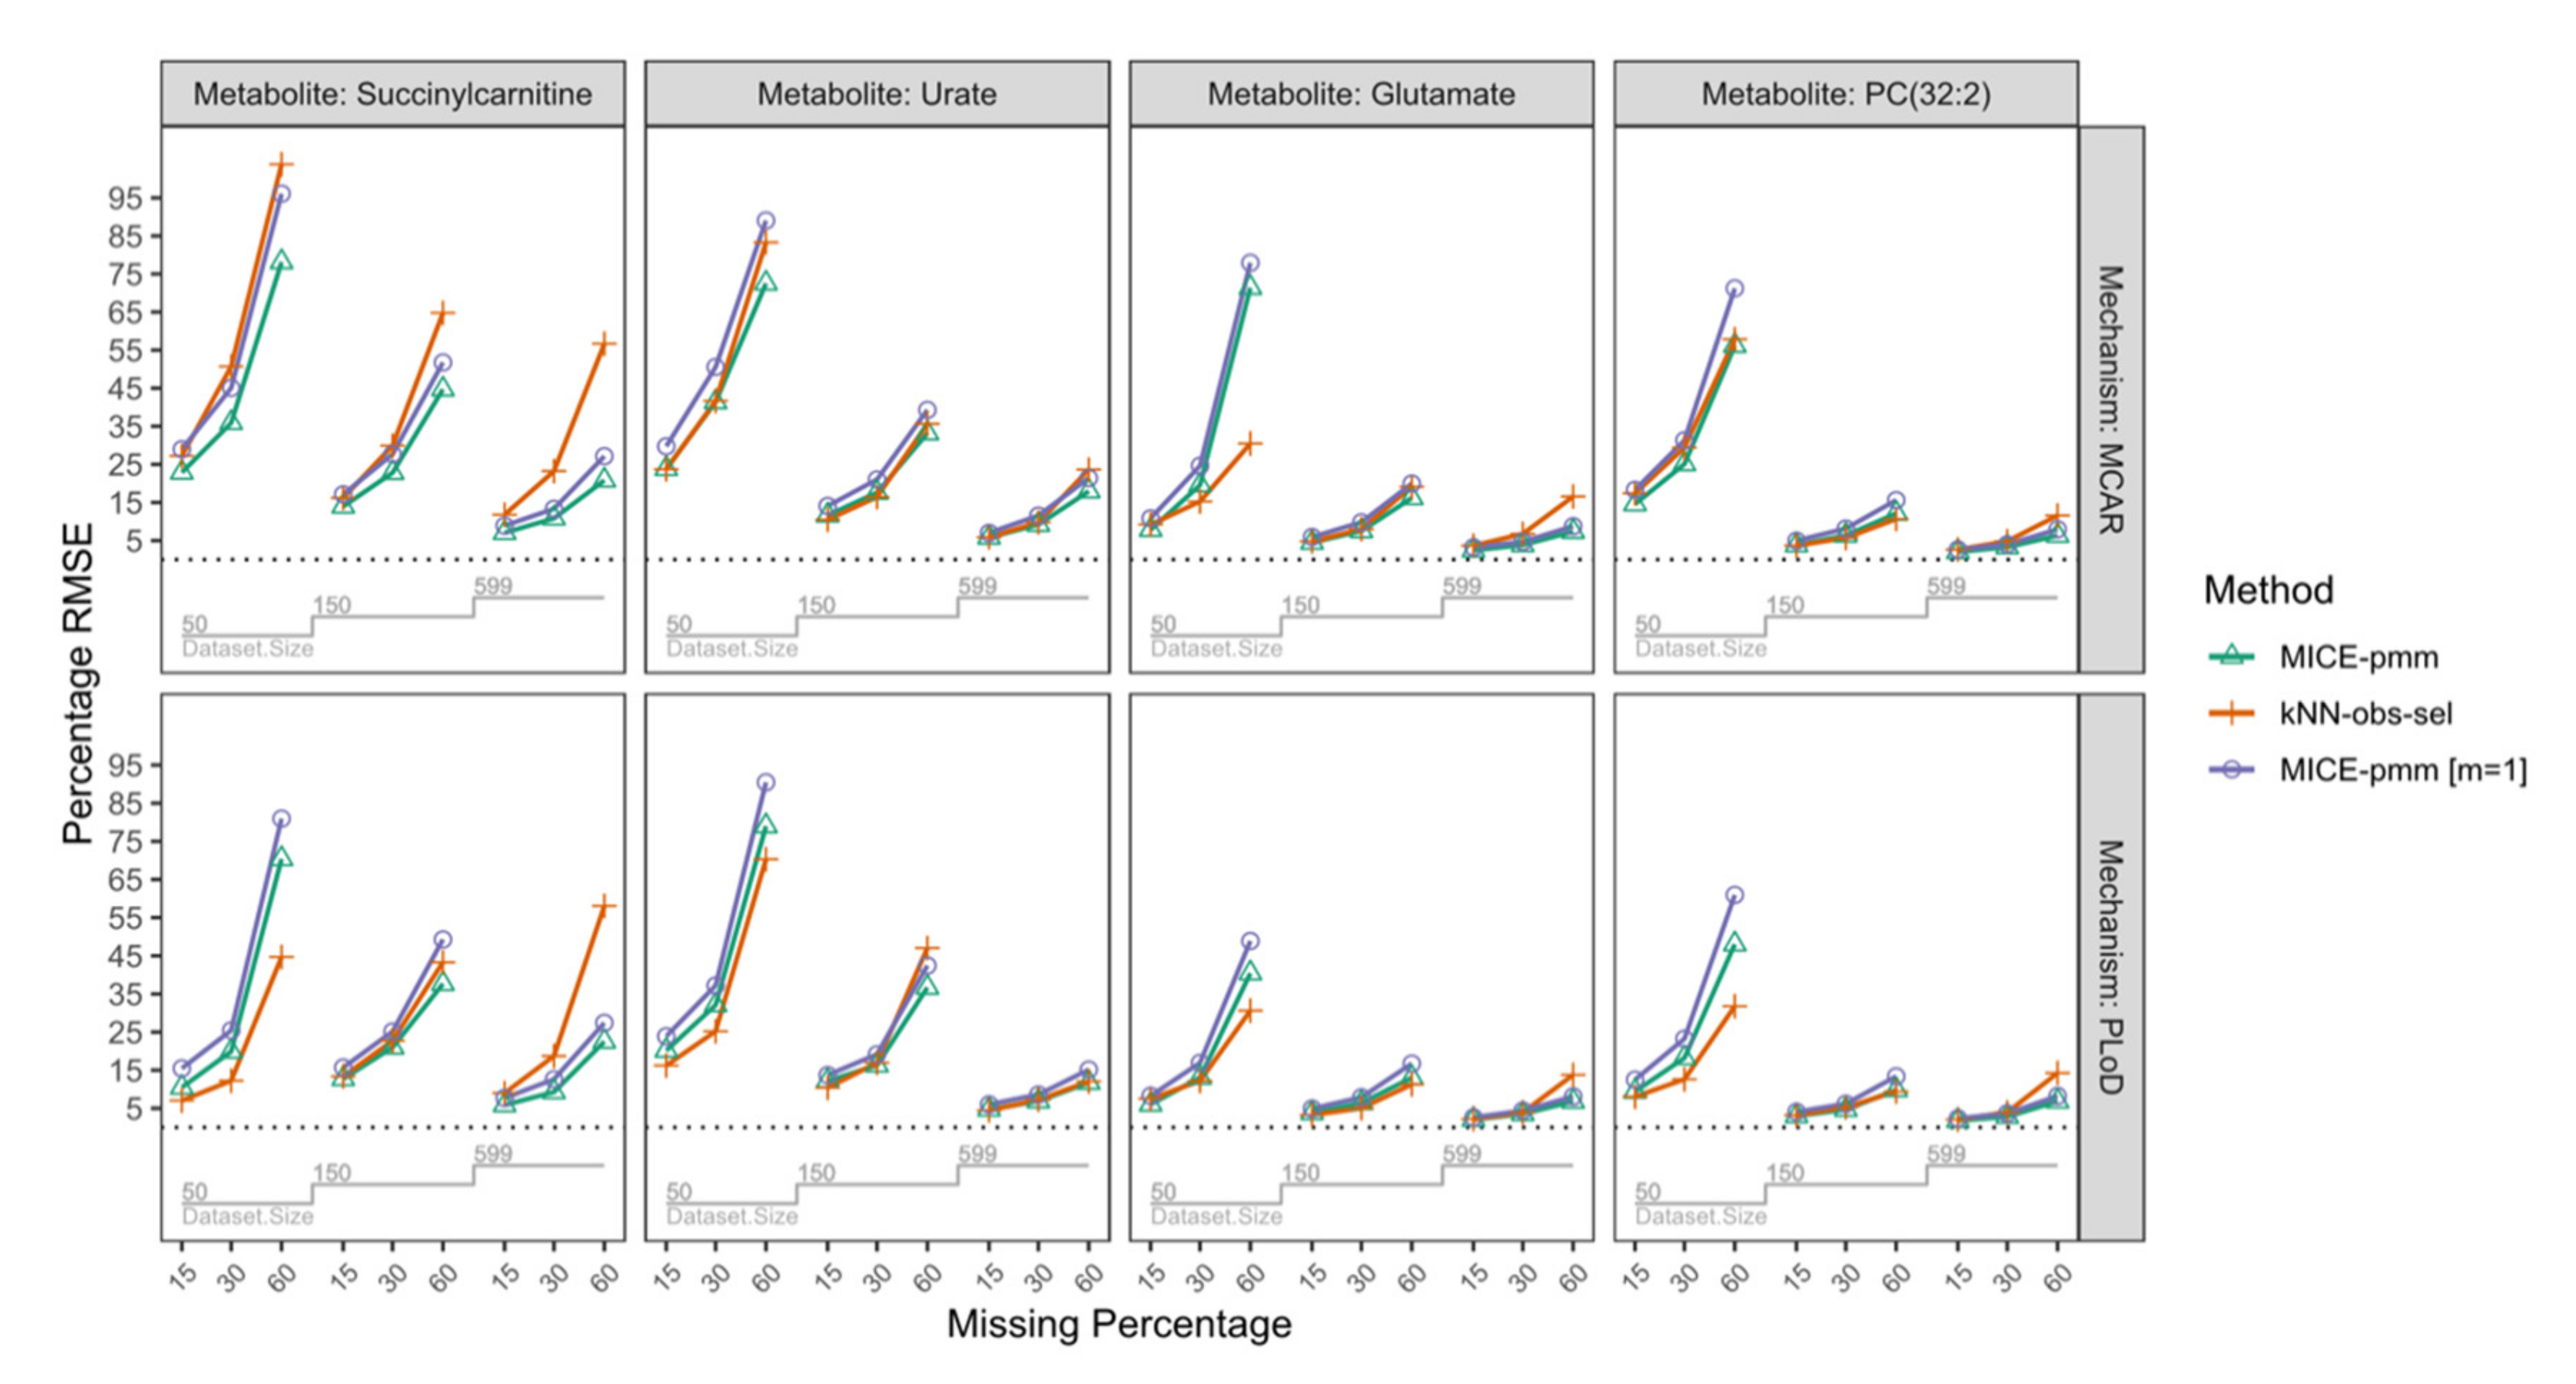
| MCAR | n = 50 | 15% | 14.6 | 17.4 | 18.3 | 22.9 | 27.2 | 29.0 | 7.9 | 9.2 | 10.9 | 23.9 | 23.7 | 29.7 |
| 30% | 25.1 | 29.4 | 31.3 | 35.9 | 50.7 | 45.1 | 19.6 | 15.3 | 24.6 | 41.4 | 41.7 | 50.6 | ||
| 60% | 56.2 | 57.9 | 71.2 | 78.2 | 103.9 | 96.1 | 71.4 | 30.5 | 78.0 | 72.5 | 83.3 | 89.1 | ||
| n = 150 | 15% | 3.8 | 3.7 | 5.0 | 14.0 | 16.2 | 17.1 | 4.5 | 4.8 | 5.9 | 11.6 | 10.5 | 14.1 | |
| 30% | 6.4 | 5.7 | 8.2 | 22.8 | 29.9 | 27.7 | 7.5 | 8.0 | 9.8 | 17.6 | 16.5 | 21.1 | ||
| 60% | 12.1 | 10.7 | 15.6 | 44.7 | 64.8 | 51.8 | 16.2 | 19.1 | 20.0 | 33.2 | 35.6 | 39.3 | ||
| n = 599 | 15% | 2.0 | 2.6 | 2.7 | 7.0 | 11.8 | 8.9 | 2.4 | 3.7 | 3.2 | 5.8 | 5.9 | 7.0 | |
| 30% | 3.3 | 4.8 | 4.0 | 10.8 | 23.2 | 13.3 | 3.8 | 6.8 | 4.7 | 9.2 | 9.8 | 11.6 | ||
| 60% | 6.3 | 11.6 | 8.0 | 20.8 | 56.7 | 27.1 | 7.4 | 16.6 | 8.8 | 18.0 | 23.6 | 21.4 | ||
| PLoD | n = 50 | 15% | 9.4 | 8.1 | 12.5 | 10.5 | 7.0 | 15.5 | 6.1 | 7.5 | 8.3 | 20.2 | 16.2 | 23.9 |
| 30% | 18.2 | 12.6 | 23.3 | 19.9 | 12.3 | 25.5 | 13.1 | 12.2 | 17.0 | 32.1 | 25.2 | 37.2 | ||
| 60% | 48.1 | 31.8 | 61.0 | 70.4 | 44.7 | 81.0 | 40.4 | 30.6 | 48.9 | 79.0 | 70.3 | 90.5 | ||
| n = 150 | 15% | 3.0 | 3.2 | 4.1 | 12.7 | 13.4 | 15.7 | 3.8 | 3.3 | 4.9 | 12.2 | 10.4 | 13.7 | |
| 30% | 4.7 | 5.3 | 6.2 | 21.0 | 22.7 | 25.2 | 6.4 | 5.1 | 7.9 | 16.3 | 17.0 | 19.2 | ||
| 60% | 9.9 | 9.4 | 13.4 | 37.7 | 43.3 | 49.3 | 13.0 | 11.3 | 16.7 | 36.7 | 47.1 | 42.5 | ||
| n = 599 | 15% | 1.8 | 2.1 | 2.4 | 5.9 | 9.0 | 7.7 | 2.1 | 2.2 | 2.6 | 4.7 | 4.5 | 6.0 | |
| 30% | 2.8 | 3.9 | 3.7 | 9.3 | 18.7 | 12.6 | 3.6 | 3.9 | 4.4 | 6.9 | 7.3 | 8.6 | ||
| 60% | 6.9 | 14.3 | 8.3 | 22.5 | 58.1 | 27.4 | 6.8 | 13.8 | 8.1 | 11.8 | 12.1 | 15.2 | ||
| Imputation Method | Dataset Sizes | ||
|---|---|---|---|
| n = 599 | n = 5400 | n = 20,000 | |
| MICE-pmm (minutes) | 1.9 | 13.4 | 138.9 |
| kNN-obs-sel (minutes) | 0.7 | 16.2 | 210.7 |


References
- Suhre, K.; Meisinger, C.; Döring, A.; Altmaier, E.; Belcredi, P.; Gieger, C.; Chang, D.; Milburn, M.V.; Gall, W.E.; Weinberger, K.M.; et al. Metabolic Footprint of Diabetes: A Multiplatform Metabolomics Study in an Epidemiological Setting. PLoS ONE 2010, 5, e13953. [Google Scholar] [CrossRef] [Green Version]
- Schrimpe-Rutledge, A.C.; Codreanu, S.G.; Sherrod, S.D.; McLean, J.A. Untargeted Metabolomics Strategies—Challenges and Emerging Directions. J. Am. Soc. Mass Spectrom. 2016, 27, 1897–1905. [Google Scholar] [CrossRef] [PubMed] [Green Version]
- Wei, R.; Wang, J.; Su, M.; Jia, E.; Chen, S.; Chen, T.; Ni, Y. Missing Value Imputation Approach for Mass Spectrometry-based Metabolomics Data. Sci. Rep. 2018, 8, 1–10. [Google Scholar] [CrossRef] [PubMed] [Green Version]
- Karpievitch, Y.V.; Dabney, A.R.; Smith, R.D. Normalization and missing value imputation for label-free LC-MS analysis. BMC Bioinform. 2012, 13, S5. [Google Scholar] [CrossRef] [PubMed] [Green Version]
- Hrydziuszko, O.; Viant, M.R. Missing values in mass spectrometry based metabolomics: An undervalued step in the data processing pipeline. Metabolomics 2012, 8, 161–174. [Google Scholar] [CrossRef]
- Do, K.T.; Wahl, S.; Raffler, J.; Molnos, S.; Laimighofer, M.; Adamski, J.; Suhre, K.; Strauch, K.; Peters, A.; Gieger, C.; et al. Characterization of missing values in untargeted MS-based metabolomics data and evaluation of missing data handling strategies. Metabolomics 2018, 14, 128. [Google Scholar] [CrossRef] [Green Version]
- Alonso, A.; Marsal, S.; Juliã, A. Analytical Methods in Untargeted Metabolomics: State of the Art in 2015. Front. Bioeng. Biotechnol. 2015, 3, 23. [Google Scholar] [CrossRef] [Green Version]
- Deng, Y.; Chang, C.; Ido, M.S.; Long, Q. Multiple Imputation for General Missing Data Patterns in the Presence of High-dimensional Data. Sci. Rep. 2016, 6, 21689. [Google Scholar] [CrossRef] [Green Version]
- Gromski, P.S.; Xu, Y.; Kotze, H.L.; Correa, E.; Ellis, D.I.; Armitage, E.G.; Turner, M.L.; Goodacre, R. Influence of Missing Values Substitutes on Multivariate Analysis of Metabolomics Data. Metabolites 2014, 4, 433–452. [Google Scholar] [CrossRef] [Green Version]
- Van Buuren, S. Flexible Imputation of Missing Data; Chapman and Hall/CRC: Boca Raton, FL, USA, 2018. [Google Scholar]
- Little, R.J.A. Missing-Data Adjustments in Large Surveys. J. Bus. Econ. Stat. 1988, 6, 287–296. [Google Scholar]
- Rubin, D.B. Statistical Matching Using File Concatenation with Adjusted Weights and Multiple Imputations. J. Bus. Econ. Stat. 1986, 4, 87–94. [Google Scholar]
- Faquih, T. Imputation of Untargeted Metabolites Official Release, Version v1.3; Zenodo: Meyrin, Switzerland, 2020; Available online: https://zenodo.org/record/4167193 (accessed on 31 October 2020).
- Rücker, G.; Schwarzer, G. Presenting simulation results in a nested loop plot. BMC Med. Res. Methodol. 2014, 14, 129. [Google Scholar] [CrossRef] [PubMed] [Green Version]
- Shah, J.; Rai, S.N.; DeFilippis, A.P.; Hill, B.G.; Bhatnagar, A.; Brock, G. Distribution based nearest neighbor imputation for truncated high dimensional data with applications to pre-clinical and clinical metabolomics studies. BMC Bioinform. 2017, 18, 114. [Google Scholar] [CrossRef] [PubMed] [Green Version]
- Di Guida, R.; Engel, J.; Allwood, J.W.; Weber, R.J.M.; Jones, M.R.; Sommer, U.; Viant, M.R.; Dunn, W.B. Non-targeted UHPLC-MS metabolomic data processing methods: A comparative investigation of normalisation, missing value imputation, transformation and scaling. Metabolomics 2016, 12, 1–14. [Google Scholar] [CrossRef] [Green Version]
- Molenberghs, G.; Kenward, M. Missing Data in Clinical Studies; Wiley: Hoboken, NJ, USA, 2007. [Google Scholar]
- Wang, J.; Li, Z.F.; Chen, J.; Zhao, H.; Luo, L.; Chen, C.; Xu, X.; Zhang, W.; Gao, K.; Li, B.; et al. Metabolomic identification of diagnostic plasma biomarkers in humans with chronic heart failure. Mol. BioSyst. 2013, 9, 2618. [Google Scholar] [CrossRef] [PubMed]
- Yousri, N.A.; Bayoumy, K.; Elhaq, W.G.; Mohney, R.P.; Al Emadi, S.; Hammoudeh, M.; Halabi, H.; Masri, B.; Badsha, H.; Uthman, I.; et al. Large Scale Metabolic Profiling identifies Novel Steroids linked to Rheumatoid Arthritis. Sci. Rep. 2017, 7, 1–9. [Google Scholar] [CrossRef]
- De Mutsert, R.; Heijer, M.D.; Rabelink, T.J.; Smit, J.W.A.; Romijn, J.A.; Jukema, J.W.; De Roos, A.; Cobbaert, C.M.; Kloppenburg, M.; Le Cessie, S.; et al. The Netherlands Epidemiology of Obesity (NEO) study: Study design and data collection. Eur. J. Epidemiol. 2013, 28, 513–523. [Google Scholar] [CrossRef]
- Evans, A.; Bridgewater, B.; Liu, Q.; Mitchell, M.; Robinson, R.; Dai, H.; Stewart, S.; DeHaven, C.; Miller, L.J.M. High Resolution Mass Spectrometry Improves Data Quantity and Quality as Compared to Unit Mass Resolution Mass Spectrometry in High-Throughput Profiling Metabolomics. J. Postgenomics Drug Biomark. Dev. 2014, 4, 1–7. [Google Scholar] [CrossRef] [Green Version]
- Rhee, E.P.; Waikar, S.S.; Rebholz, C.M.; Zheng, Z.; Perichon, R.; Clish, C.B.; Evans, A.M.; Avila, J.; Denburg, M.R.; Anderson, A.H.; et al. Variability of Two Metabolomic Platforms in CKD. Clin. J. Am. Soc. Nephrol. 2019, 14, 40. [Google Scholar] [CrossRef] [Green Version]
- White, I.R.; Royston, P.; Wood, A.M. Multiple imputation using chained equations: Issues and guidance for practice. Stat. Med. 2011, 30, 377–399. [Google Scholar] [CrossRef]
- Moons, K.G.; Donders, R.A.; Stijnen, T.; Harrell, F.E. Using the outcome for imputation of missing predictor values was preferred. J. Clin. Epidemiol. 2006, 59, 1092–1101. [Google Scholar] [CrossRef] [PubMed]
- Kowarik, A.; Templ, M. Imputation with the R Package VIM. J. Stat. Softw. 2016, 74, 16. [Google Scholar] [CrossRef] [Green Version]
- Cirulli, E.T.; Guo, L.; Swisher, C.L.; Shah, N.; Huang, L.; Napier, L.A.; Kirkness, E.F.; Spector, T.D.; Caskey, C.T.; Thorens, B.; et al. Profound Perturbation of the Metabolome in Obesity Is Associated with Health Risk. Cell Metab. 2019, 29, 488–500.e2. [Google Scholar] [CrossRef] [PubMed] [Green Version]
- Demirtas, H.; Freels, S.A.; Yucel, R.M. Plausibility of multivariate normality assumption when multiply imputing non-Gaussian continuous outcomes: A simulation assessment. J. Stat. Comput. Simul. 2008, 78, 69–84. [Google Scholar] [CrossRef]
- Morris, T.P.; White, I.R.; Crowther, M.J. Using simulation studies to evaluate statistical methods. Stat. Med. 2019, 38, 2074–2102. [Google Scholar] [CrossRef] [PubMed] [Green Version]
- Van Buuren, S.; Groothuis-Oudshoorn, K. mice: Multivariate Imputation by Chained Equations in R. J. Stat. Softw. 2011, 45, 1–67. [Google Scholar] [CrossRef] [Green Version]
- Rubin, D.B. Multiple Imputation for Nonresponse in Surveys; John Wiley & Sons, Inc.: New York, NY, USA, 1987. [Google Scholar]
- Rubin, D.B. Multiple Imputation After 18+ Years. J. Am. Stat. Assoc. 1996, 91, 473–489. [Google Scholar] [CrossRef]


| Missing Data | Metabolite Groups | |||
|---|---|---|---|---|
| Endogenous (n = 840) | Unannotated (n = 296) | Xenobiotics (n = 229) | Total (n = 1365) | |
| Metabolites with missing values, n (%) | 367 (43.7) | 236 (79.7) | 197 (86.0) | 800 (58.6) |
| Missing metabolites per observation, median (range) | 57 (23–94) | 59 (31–112) | 110 (79–149) | 228 (152–343) |
| Missing Mechanism | Sample Size | Missing Percentage | Metabolites/Imputation Method | |||||||
|---|---|---|---|---|---|---|---|---|---|---|
| PC(32:2) | Succinylcarnitine | Glutamate | Urate | |||||||
| MICE-pmm | kNN-obs-sel | MICE-pmm | kNN-obs-sel | MICE-pmm | kNN-obs-sel | MICE-pmm | kNN-obs-sel | |||
| MCAR | n = 50 | 15% | 2.0 | 2.1 | 0.3 | 6.0 | 2.2 | 0.2 | 4.9 | 4.9 |
| 30% | 3.2 | 4.5 | 2.8 | 14.4 | 8.6 | 1.1 | 11.3 | 10.2 | ||
| 60% | 13.9 | 14.5 | 28.9 | 31.3 | 40.2 | 2.0 | 39.9 | 27.6 | ||
| n = 150 | 15% | 0.7 | 0.5 | 1.4 | 13.8 | 0.2 | 1.9 | 0.7 | 0.5 | |
| 30% | 1.9 | 1.8 | 0.4 | 31.9 | 1.1 | 5.1 | 0.7 | 1.3 | ||
| 60% | 3.9 | 3.2 | 5.2 | 72.7 | 6.2 | 15.0 | 2.09 | 12.5 | ||
| n = 599 | 15% | 0.3 | 0.8 | 0.1 | 9.3 | 0.2 | 2.6 | 0.6 | 2.2 | |
| 30% | 0.7 | 2.4 | 0.6 | 20.1 | 0.1 | 5.6 | 1.5 | 4.9 | ||
| 60% | 1.9 | 7.9 | 3.5 | 50.9 | 0.7 | 15.1 | 2.6 | 15.0 | ||
| PLoD | n = 50 | 15% | 1.3 | 0.8 | 2.8 | 1.8 | 0.7 | 1.8 | 12.7 | 6.2 |
| 30% | 3.5 | 2.2 | 7.7 | 4.3 | 4.2 | 3.6 | 26.3 | 16.5 | ||
| 60% | 19.5 | 3.0 | 34.8 | 8.3 | 19.3 | 15.0 | 87.4 | 66.1 | ||
| n = 150 | 15% | 0.2 | 1.6 | 0.7 | 12.8 | 1.3 | 0.8 | 5.3 | 6.3 | |
| 30% | 0.3 | 3.3 | 0.2 | 23.4 | 3.0 | 2.3 | 8.0 | 14.9 | ||
| 60% | 4.2 | 2.6 | 16.2 | 46.1 | 9.4 | 8.6 | 39.8 | 59.7 | ||
| n = 599 | 15% | 0.5 | 0.1 | 0.9 | 7.3 | 0.9 | 1.4 | 0.5 | 1.9 | |
| 30% | 1.1 | 1.6 | 2.5 | 16.7 | 2.1 | 2.9 | 0.6 | 3.3 | ||
| 60% | 4.9 | 11.5 | 9.7 | 54.3 | 4.1 | 13.1 | 0.1 | 4.3 | ||
| Metabolite Full Name | Mean Absolute Correlation | Super Pathway | Sub Pathway | Estimate n = 599 | Estimate n = 150 | Estimate n = 50 |
|---|---|---|---|---|---|---|
| PC(32:2) | 0.64 | Lipid | Plasmalogen | −4.18 × 10⁻⁷ | −3.64 × 10⁻⁷ | −4.38 × 10⁻⁷ |
| Urate | 0.49 | Nucleotide | Purine Metabolism | 1.39 × 10⁻⁸ | 9.58 × 10⁻⁹ | 9.69 × 10⁻⁹ |
| Glutamate | 0.49 | Amino Acid | Glutamate Metabolism | 1.83 × 10⁻⁷ | 2.89 × 10⁻⁸ | 1.66 × 10⁻⁸ |
| Succinylcarnitine | 0.36 | Energy | TCA Cycle | 2.84 × 10⁻⁶ | 1.53 × 10⁻⁶ | 4.53 × 10⁻⁶ |
Publisher’s Note: MDPI stays neutral with regard to jurisdictional claims in published maps and institutional affiliations. |
© 2020 by the authors. Licensee MDPI, Basel, Switzerland. This article is an open access article distributed under the terms and conditions of the Creative Commons Attribution (CC BY) license (http://creativecommons.org/licenses/by/4.0/).
Share and Cite
Faquih, T.; van Smeden, M.; Luo, J.; le Cessie, S.; Kastenmüller, G.; Krumsiek, J.; Noordam, R.; van Heemst, D.; Rosendaal, F.R.; van Hylckama Vlieg, A.; et al. A Workflow for Missing Values Imputation of Untargeted Metabolomics Data. Metabolites 2020, 10, 486. https://doi.org/10.3390/metabo10120486
Faquih T, van Smeden M, Luo J, le Cessie S, Kastenmüller G, Krumsiek J, Noordam R, van Heemst D, Rosendaal FR, van Hylckama Vlieg A, et al. A Workflow for Missing Values Imputation of Untargeted Metabolomics Data. Metabolites. 2020; 10(12):486. https://doi.org/10.3390/metabo10120486
Chicago/Turabian StyleFaquih, Tariq, Maarten van Smeden, Jiao Luo, Saskia le Cessie, Gabi Kastenmüller, Jan Krumsiek, Raymond Noordam, Diana van Heemst, Frits R. Rosendaal, Astrid van Hylckama Vlieg, and et al. 2020. "A Workflow for Missing Values Imputation of Untargeted Metabolomics Data" Metabolites 10, no. 12: 486. https://doi.org/10.3390/metabo10120486