Multi-Targeted Metabolic Profiling of Carotenoids, Phenolic Compounds and Primary Metabolites in Goji (Lycium spp.) Berry and Tomato (Solanum lycopersicum) Reveals Inter and Intra Genus Biomarkers

 and
and 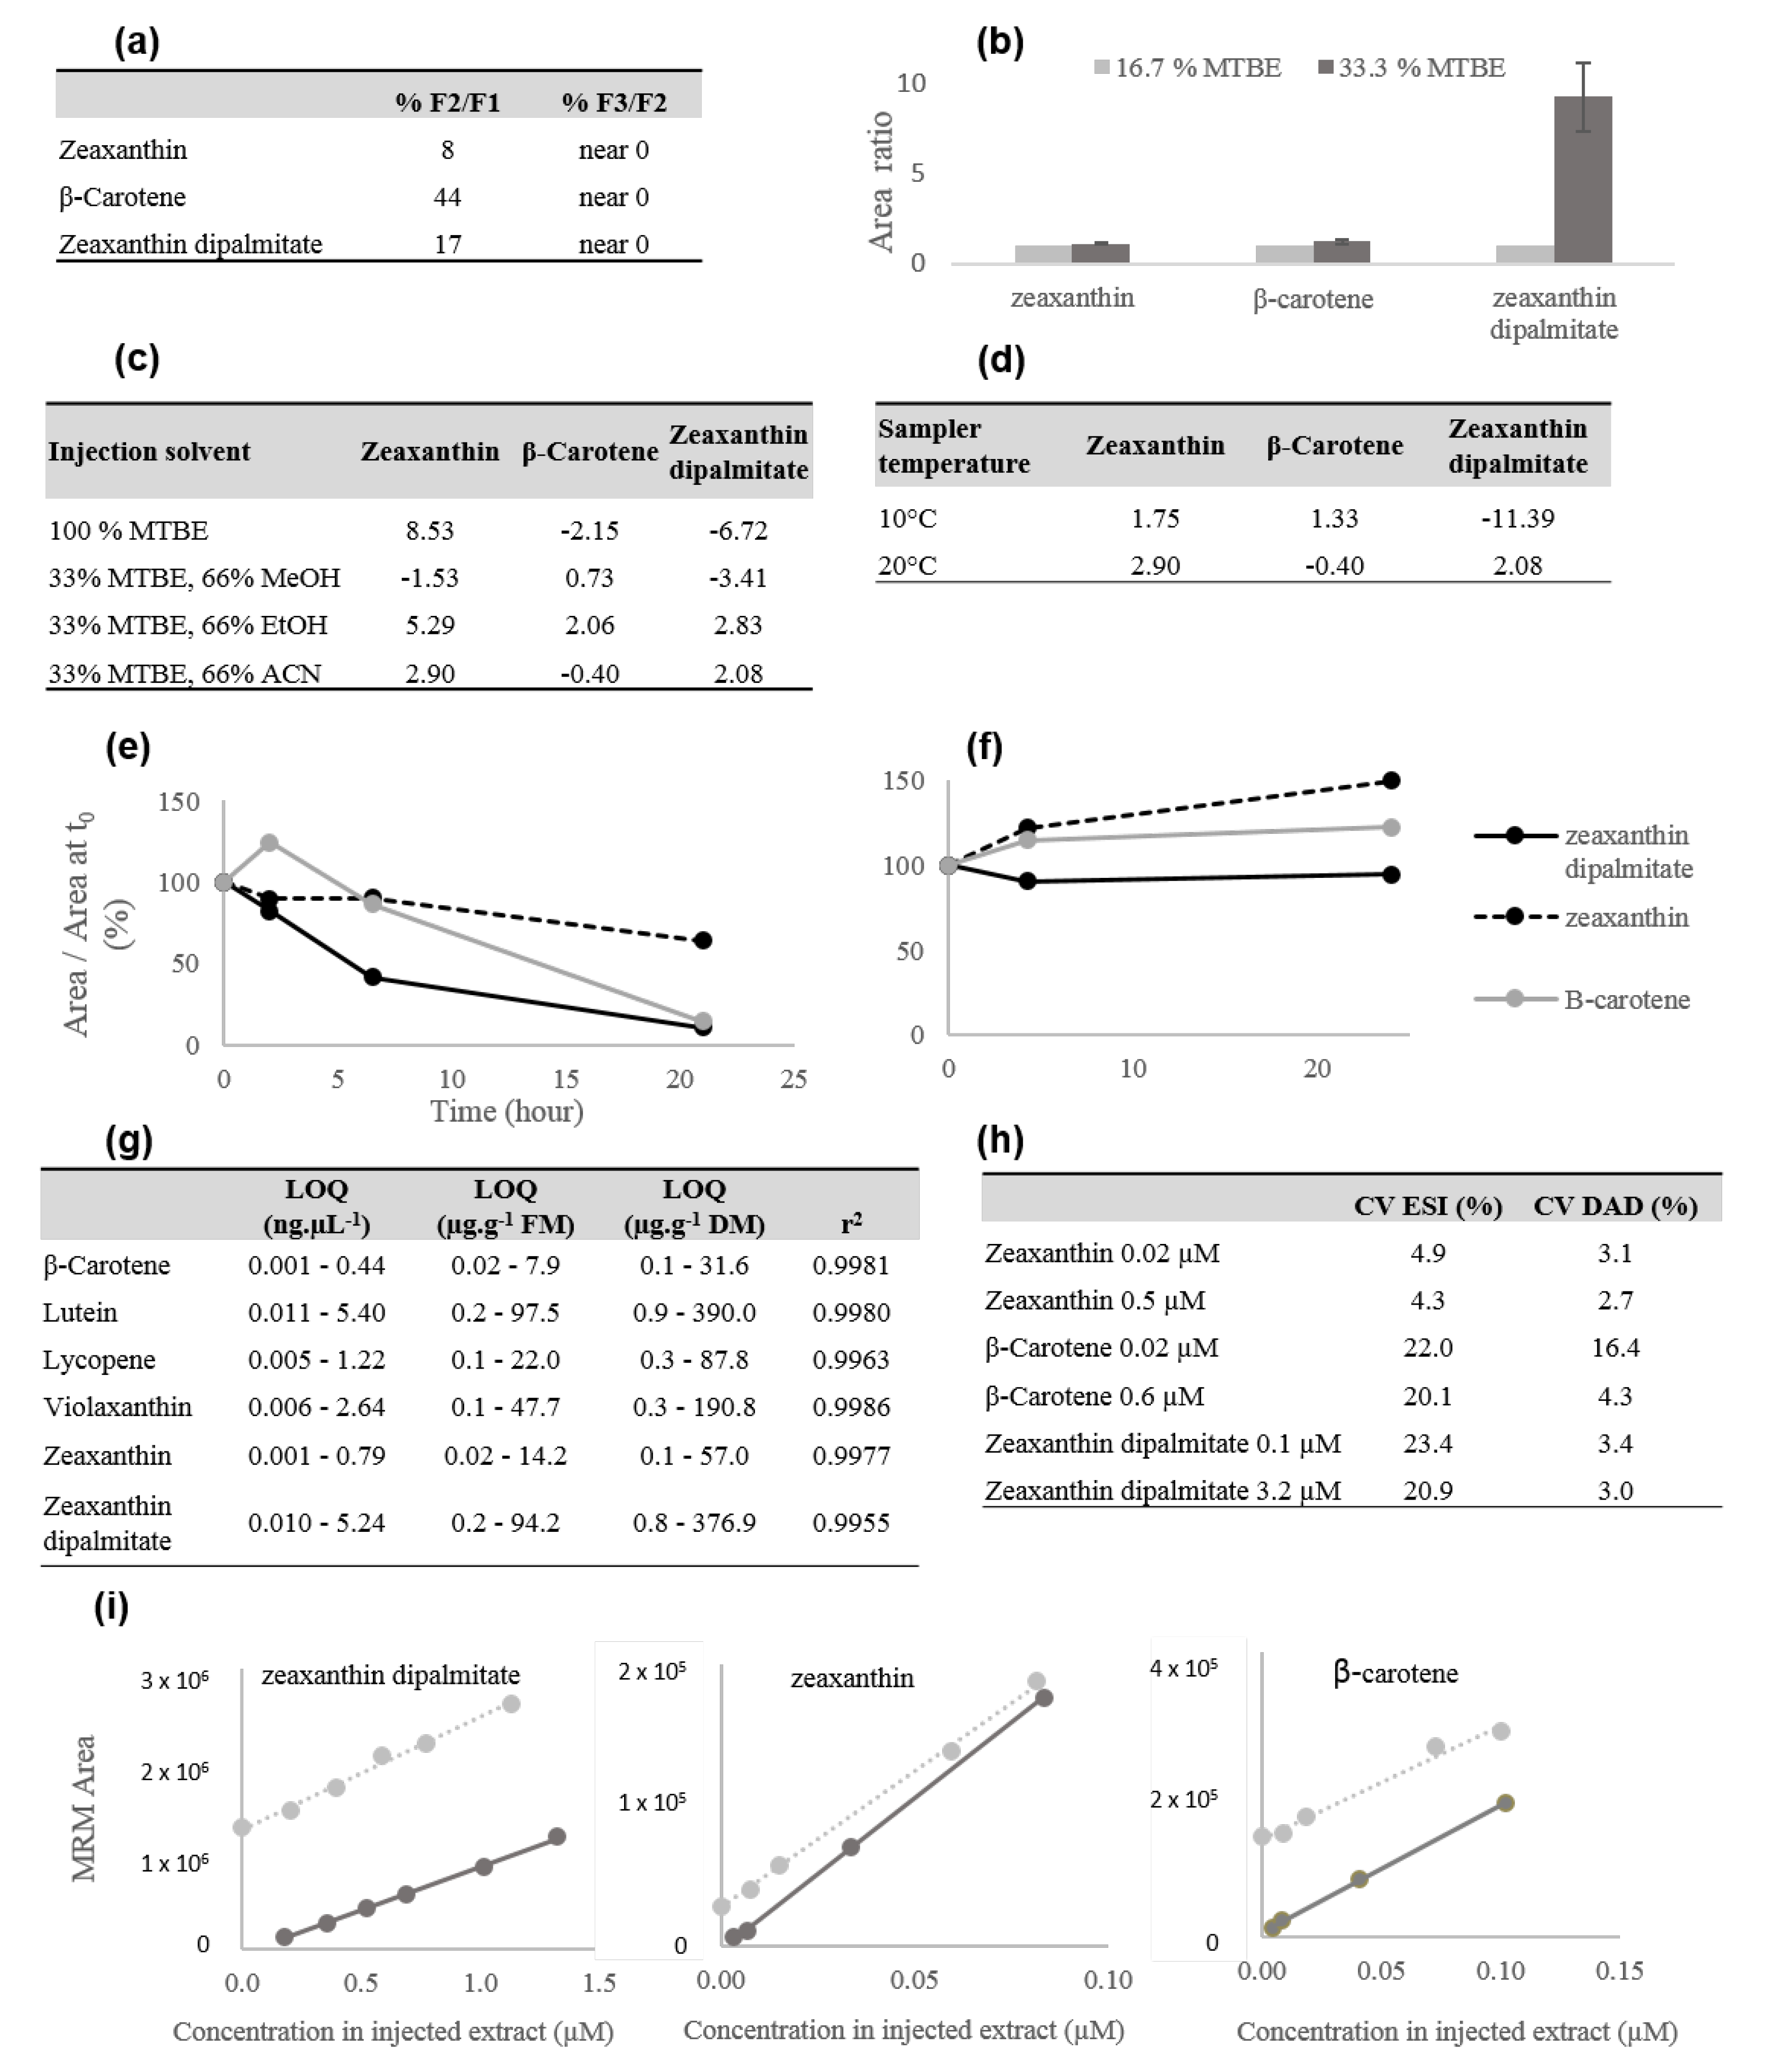
Abstract
:1. Introduction
2. Results and Discussion
2.1. Carotenoid Profiling Optimization and Validation
2.1.1. Extraction
2.1.2. UPLC–MS
2.1.3. Quantification
2.2. Phenolic Compound Profiling Optimization and Validation
2.2.1. UPLC–MS
2.2.2. Quantification
2.3. Primary Metabolite Profiling Optimization and Validation
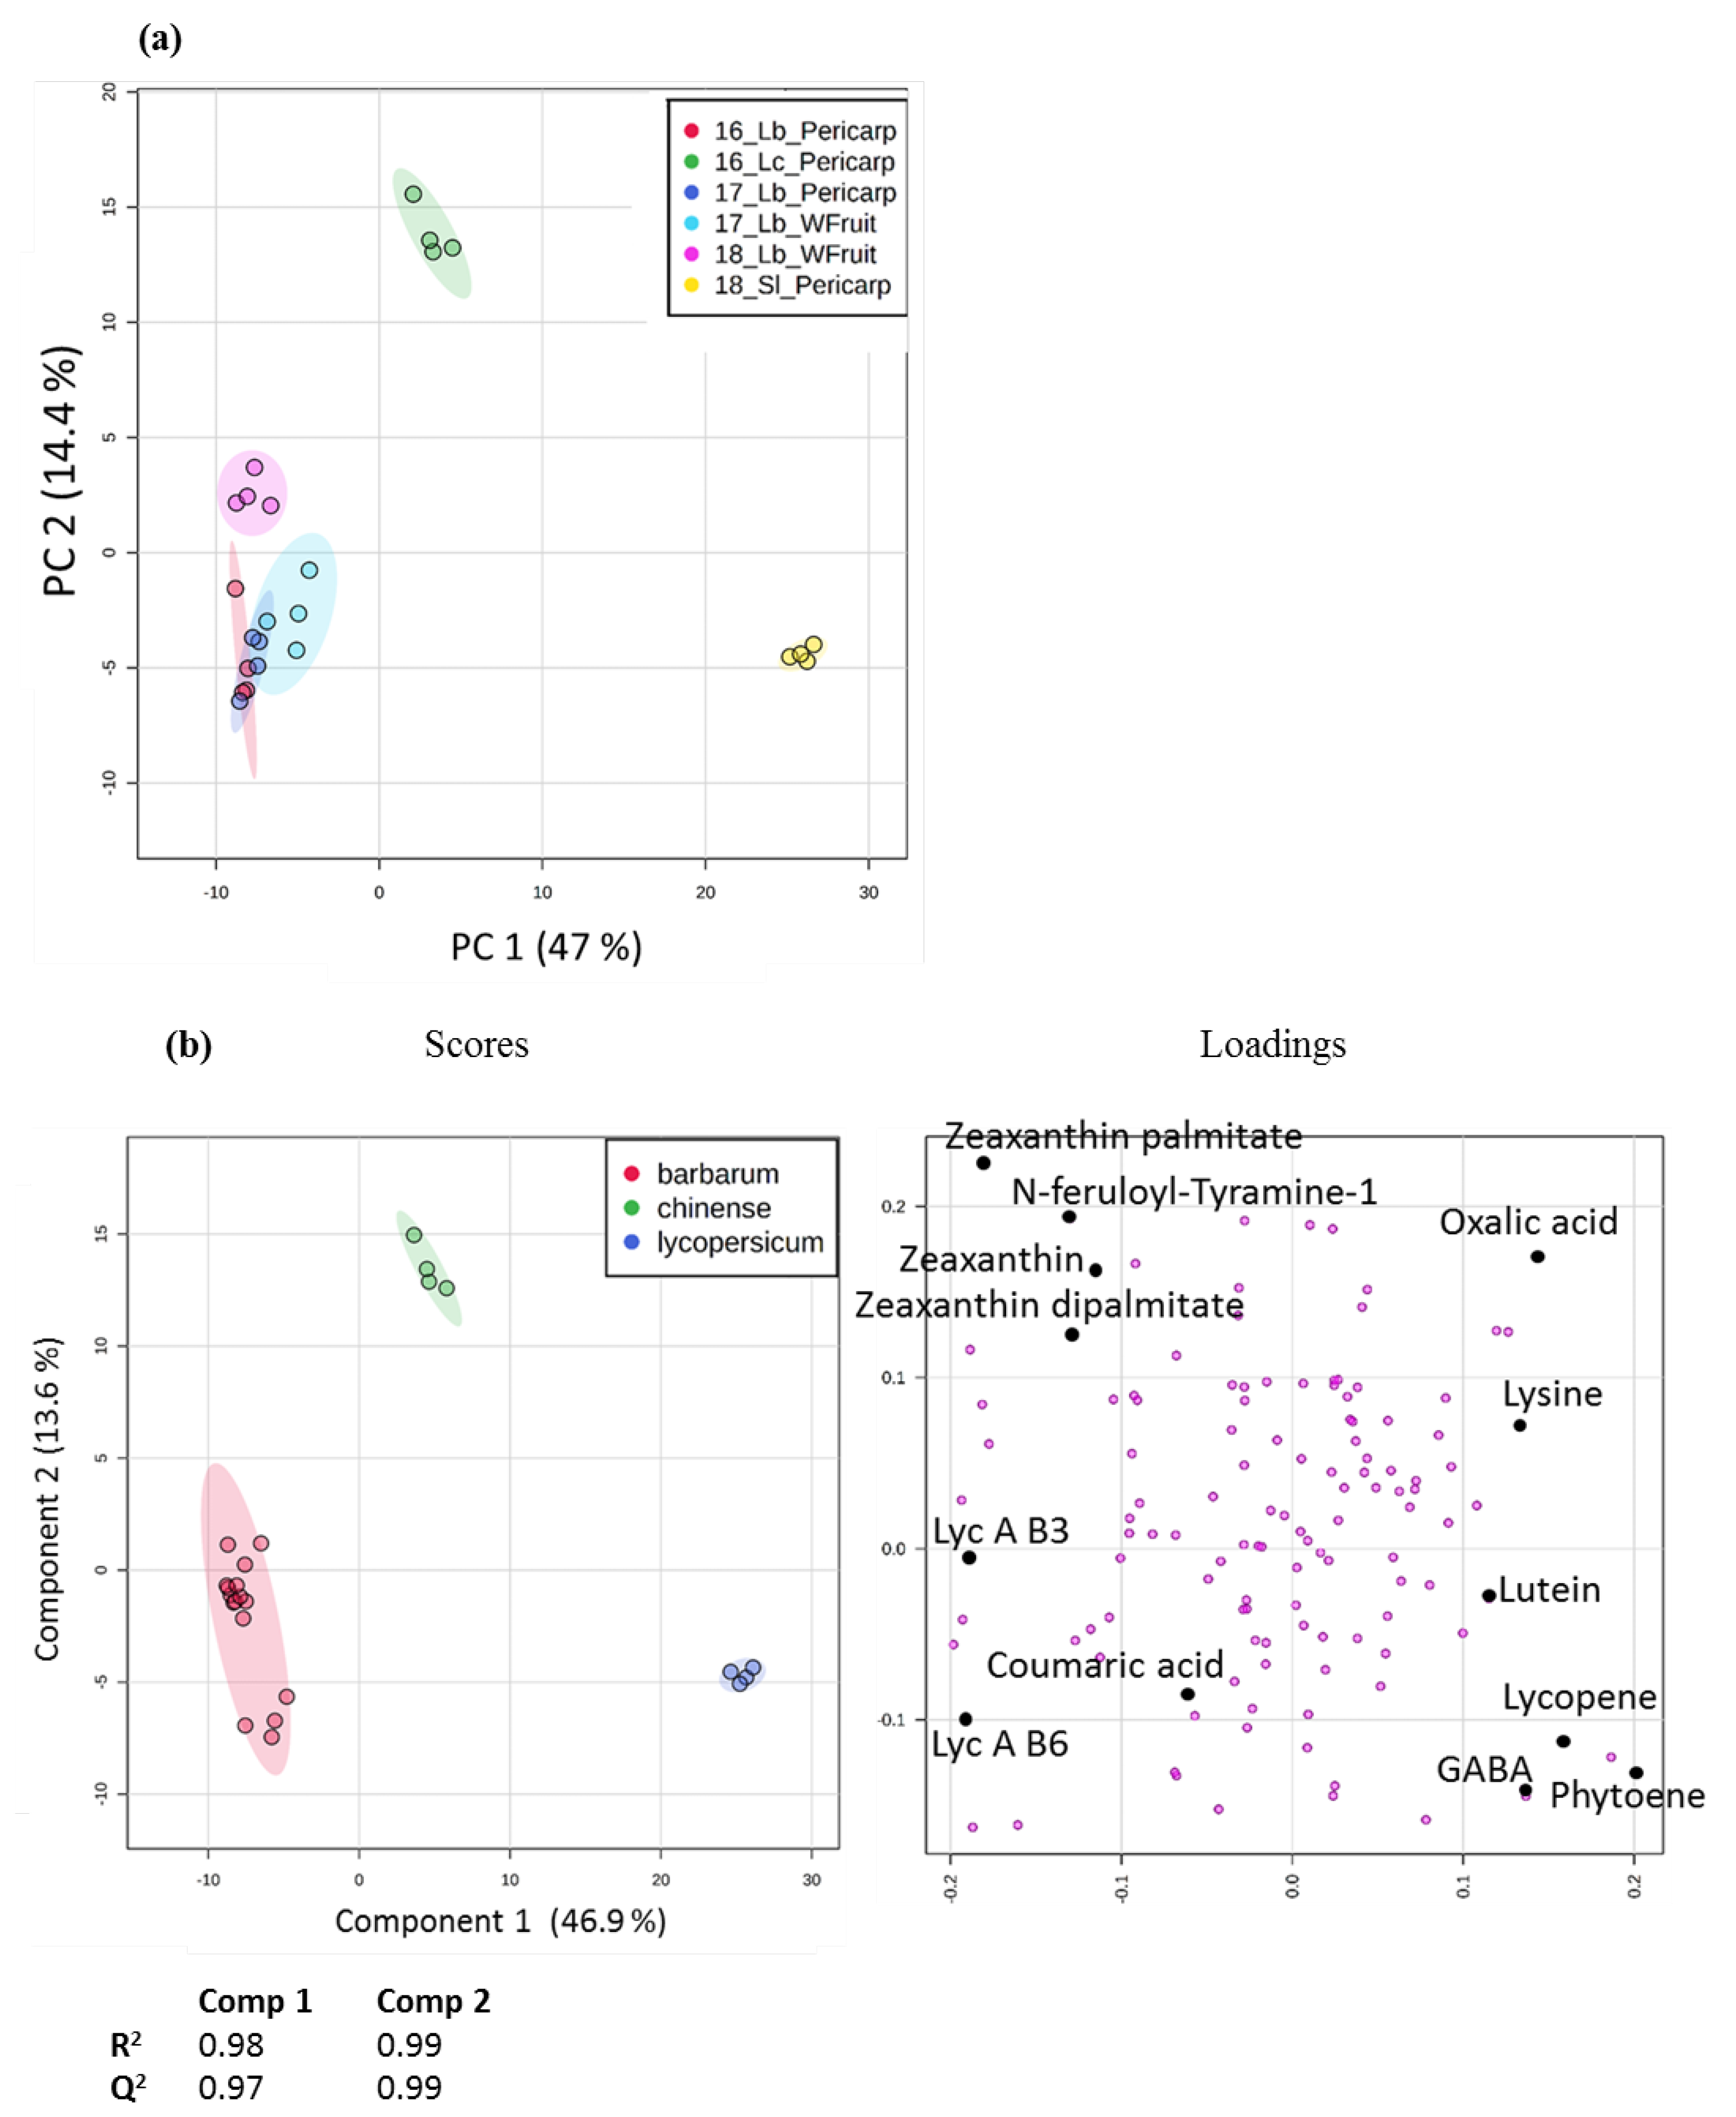
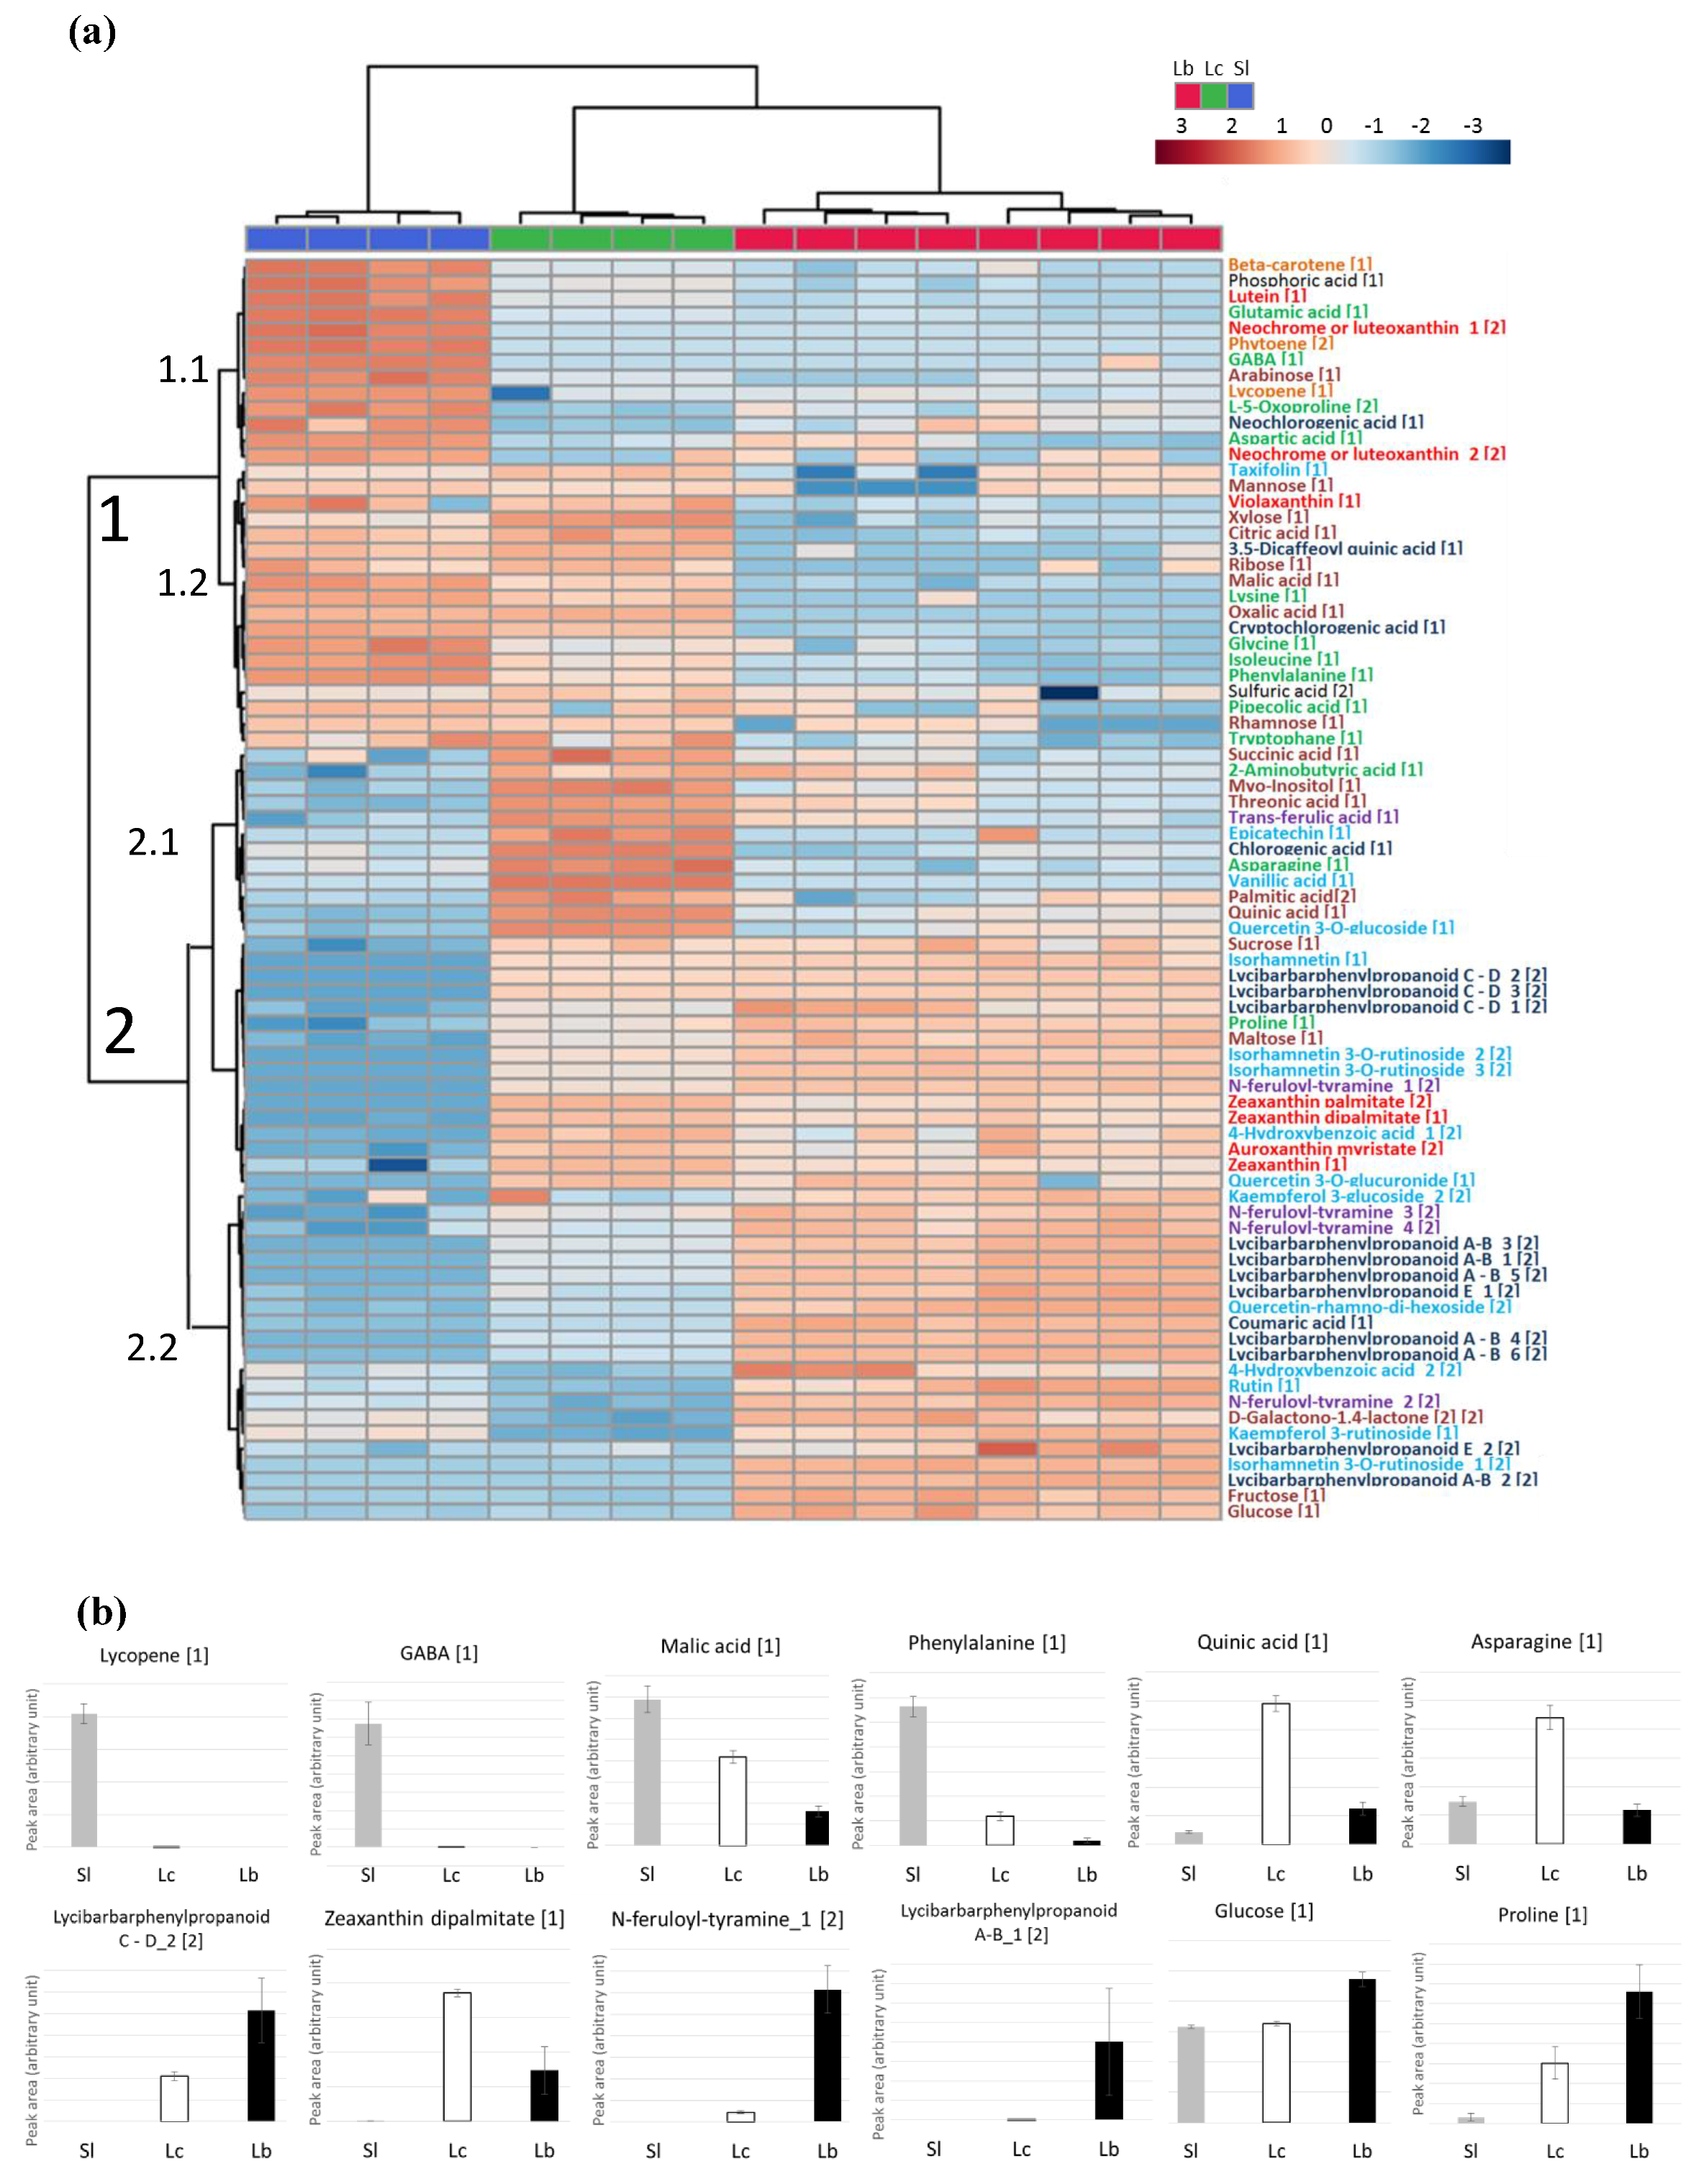
2.4. Application to the Comparison of Several Solanaceae Species
3. Materials and Methods
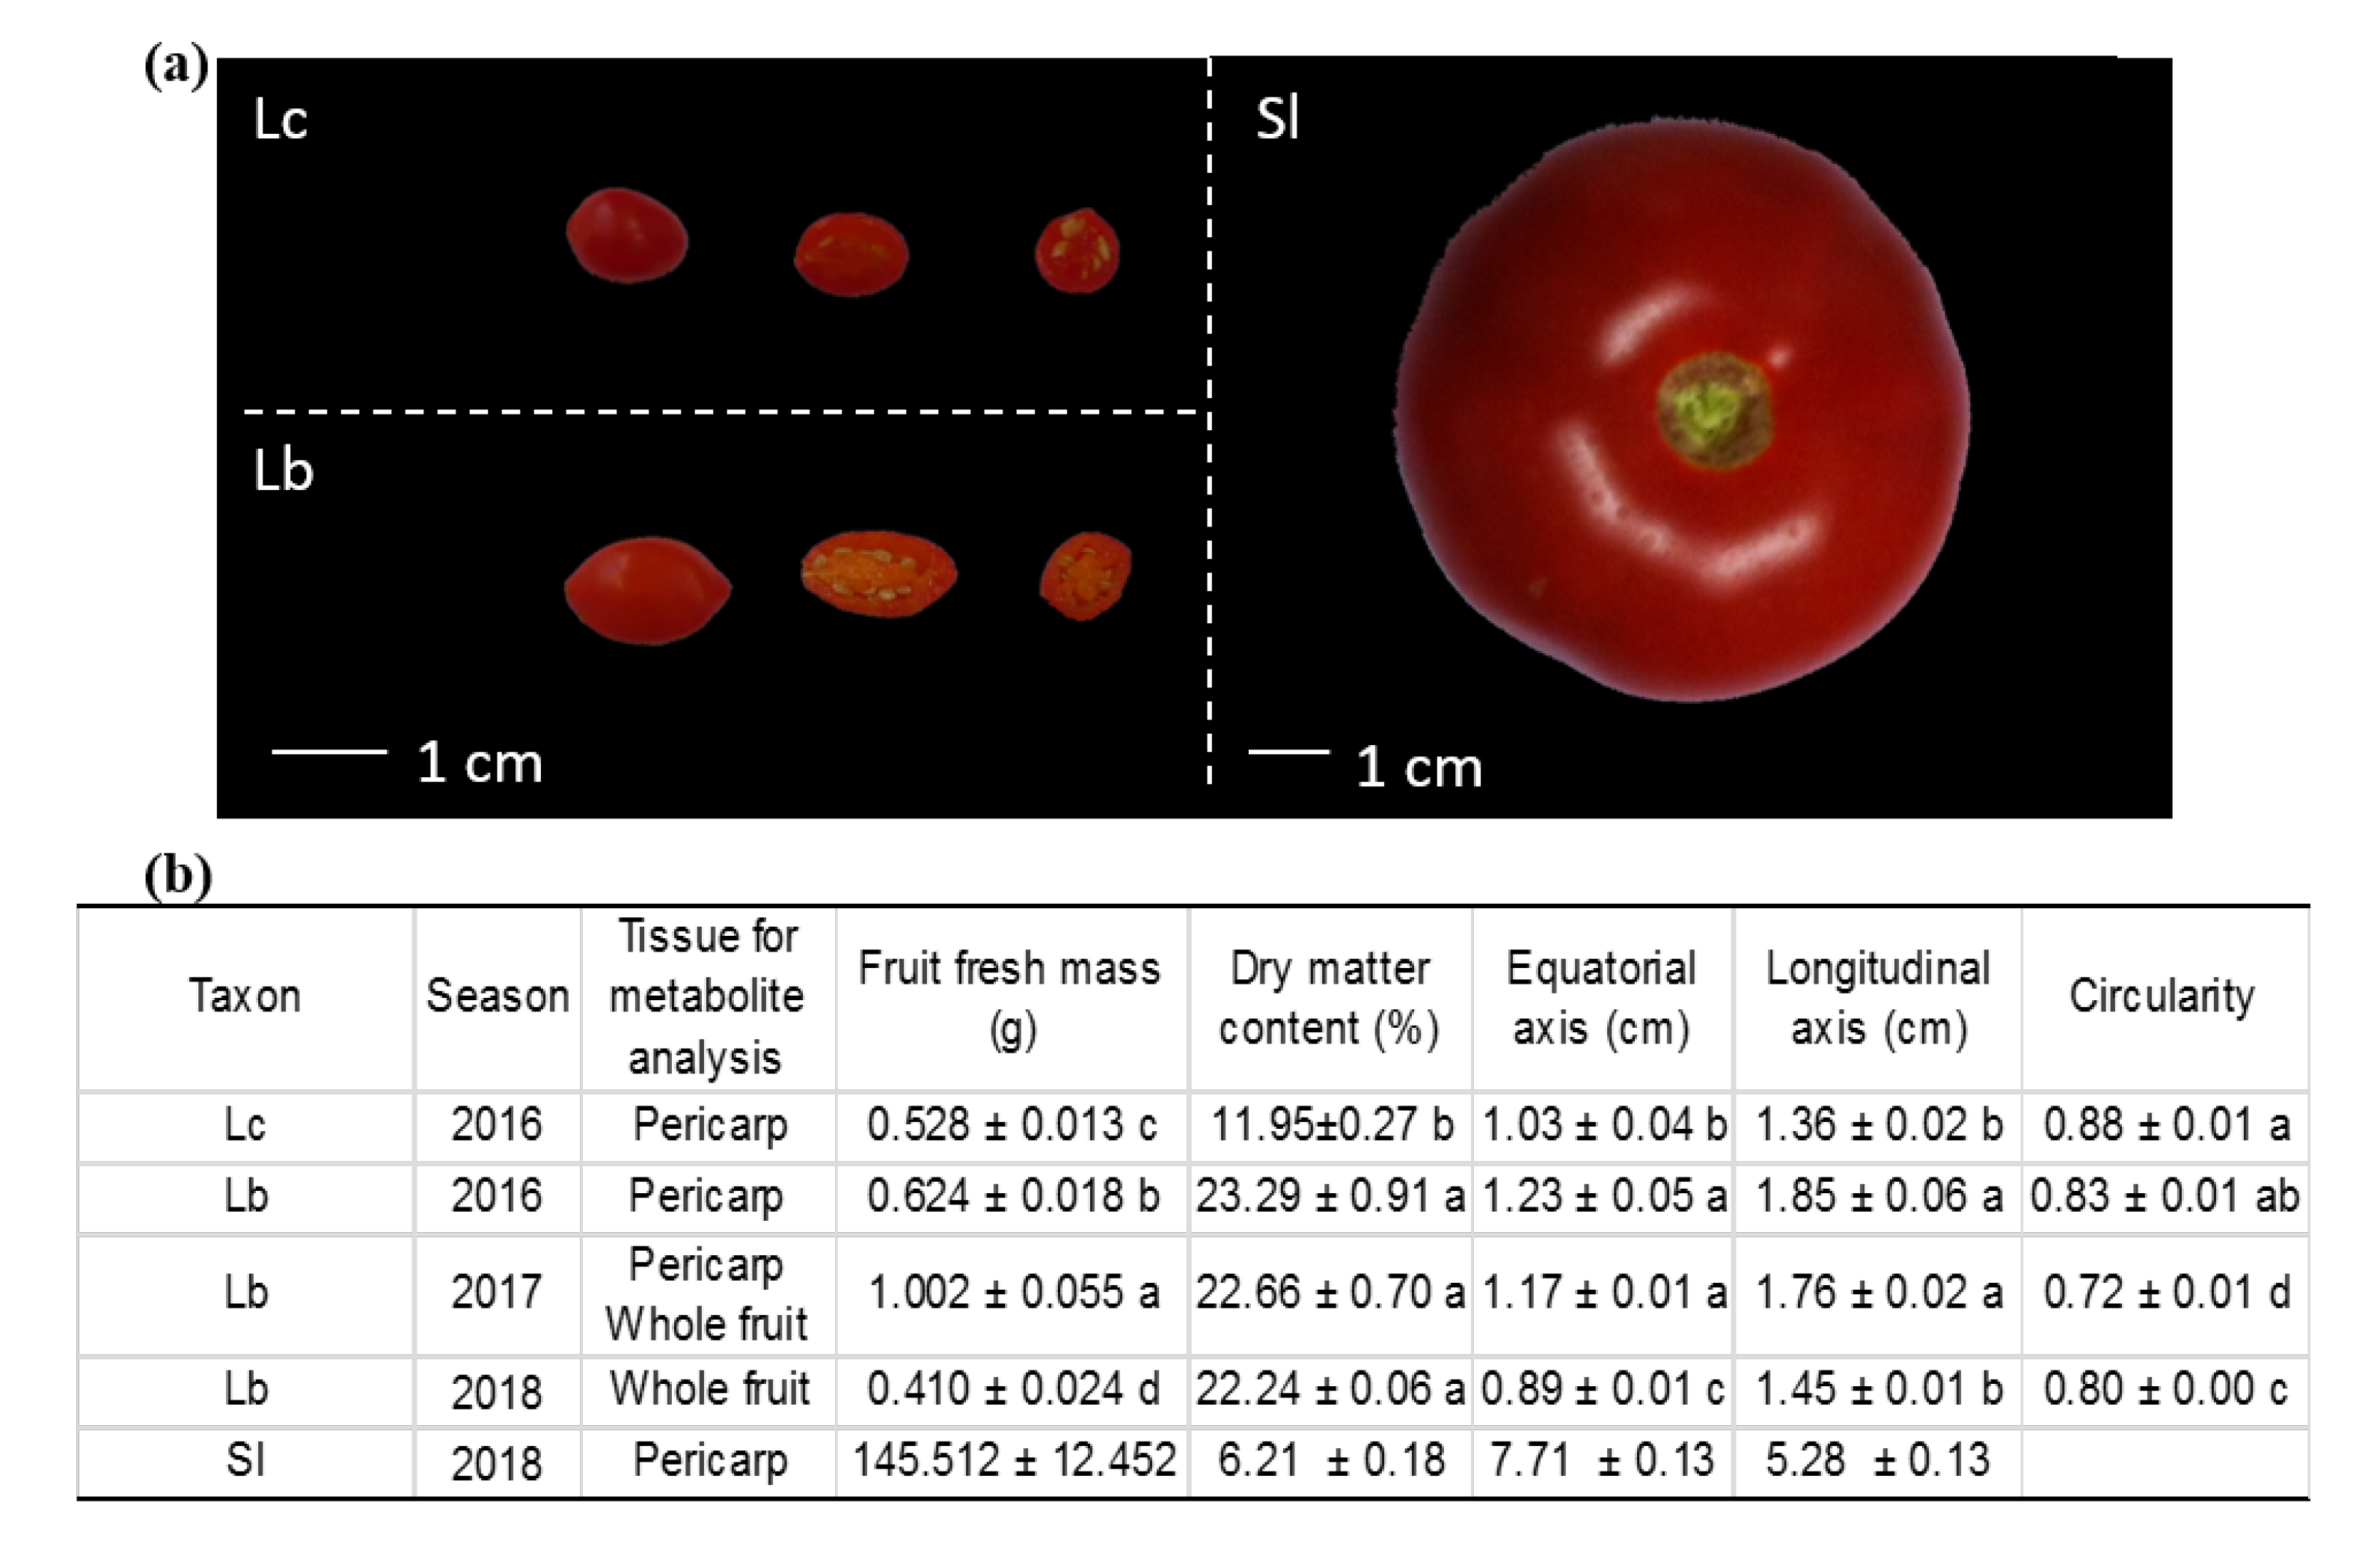
3.1. Plant Materials
3.2. Metabolite Extraction
3.2.1. Carotenoids
3.2.2. Phenolic Compounds
3.2.3. Primary Metabolites
3.3. Metabolic Profiling by UPLC–DAD–ESI–TQ and GC–EI–TOF
3.3.1. UPLC–DAD–ESI–TQ Analysis
3.3.2. GC–EI–TOF Analysis
3.3.3. Data Processing and Statistical Analysis
4. Conclusions
Supplementary Materials
Author Contributions
Funding
Acknowledgments
Conflicts of Interest
References
- Martin, C.; Li, J. Medicine is not health care, food is health care: Plant metabolic engineering, diet and human health. New Phytol. 2017, 216, 699–719. [Google Scholar] [CrossRef] [Green Version]
- Amagase, H.; Farnsworth, N.R. A review of botanical characteristics, phytochemistry, clinical relevance in efficacy and safety of Lycium barbarum fruit (Goji). Food Res. Int. 2011, 44, 1702–1717. [Google Scholar] [CrossRef]
- Gomez-Romero, M.; Segura-Carretero, A.; Fernandez-Gutierrez, A. Metabolite profiling and quantification of phenolic compounds in methanol extracts of tomato fruit. Phytochemistry 2010, 71, 1848–1864. [Google Scholar] [CrossRef] [PubMed]
- Bondia-Pons, I.; Savolainen, O.; Torronen, R.; Martinez, J.A.; Poutanen, K.; Hanhineva, K. Metabolic profiling of Goji berry extracts for discrimination of geographical origin by non-targeted liquid chromatography coupled to quadrupole time-of-flight mass spectrometry. Food Res. Int. 2014, 63, 132–138. [Google Scholar] [CrossRef]
- Lv, W.; Zhao, N.; Zhao, Q.; Huang, S.; Liu, D.; Wang, Z.; Yang, J.; Zhang, X. Discovery and validation of biomarkers for Zhongning goji berries using liquid chromatography mass spectrometry. J. Chromatogr. B 2020, 1142, 122037. [Google Scholar] [CrossRef] [PubMed]
- Patsilinakos, A.; Ragno, R.; Carradori, S.; Petralito, S.; Cesa, S. Carotenoid content of Goji berries: CIELAB, HPLC-DAD analyses and quantitative correlation. Food Chem. 2018, 268, 49–56. [Google Scholar] [CrossRef]
- Bertoldi, D.; Cossignani, L.; Blasi, F.; Perini, M.; Barbero, A.; Pianezze, S.; Montesano, D. Characterisation and geographical traceability of Italian goji berries. Food Chem. 2019, 275, 585–593. [Google Scholar] [CrossRef] [PubMed]
- Zhang, Q.Y.; Chen, W.W.; Zhao, J.H.; Xi, W.P. Functional constituents and antioxidant activities of eight Chinese native goji genotypes. Food Chem. 2016, 200, 230–236. [Google Scholar] [CrossRef]
- Wang, Y.J.; Liang, X.J.; Li, Y.K.; Fan, Y.F.; Li, Y.L.; Cao, Y.L.; An, W.; Shi, Z.G.; Zhao, J.H.; Guo, S.J. Changes in metabolome and nutritional quality of Lycium barbarum fruits from three typical growing areas of China as revealed by widely targeted metabolomics. Metabolites 2020, 10, 46. [Google Scholar] [CrossRef] [Green Version]
- Poiroux-Gonord, F.; Bidel, L.P.R.; Fanciullino, A.L.; Gautier, H.; Lauri-Lopez, F.; Urban, L. Health benefits of vitamins and secondary metabolites of fruits and vegetables and prospects to increase their concentrations by agronomic approaches. J. Agric. Food Chem. 2010, 58, 12065–12082. [Google Scholar] [CrossRef]
- Ripoll, J.; Urban, L.; Staudt, M.; Lopez-Lauri, F.; Bidel, L.P.R.; Bertin, N. Water shortage and quality of fleshy fruits-making the most of the unavoidable. J. Exp. Bot. 2014, 65, 4097–4117. [Google Scholar] [CrossRef] [PubMed] [Green Version]
- Potterat, O. Goji (Lycium barbarum and L-chinense): Phytochemistry, pharmacology and safety in the perspective of traditional uses and recent popularity. Planta Med. 2010, 76, 7–19. [Google Scholar] [CrossRef] [Green Version]
- Donno, D.; Beccaro, G.L.; Mellano, M.G.; Cerutti, A.K.; Bounous, G. Goji berry fruit (Lycium spp.): Antioxidant compound fingerprint and bioactivity evaluation. J. Funct. Foods 2015, 18, 1070–1085. [Google Scholar] [CrossRef]
- Wetters, S.; Horn, T.; Nick, P. Goji who? Morphological and DNA based authentication of a “superfood”. Front. Plant Sci. 2018, 9, 1859. [Google Scholar] [CrossRef] [PubMed] [Green Version]
- Mercadante, A.Z.; Rodrigues, D.B.; Petry, F.C.; Mariutti, L.R.B. Carotenoid esters in foods—A review and practical directions on analysis and occurrence. Food Res. Int. 2017, 99, 830–850. [Google Scholar] [CrossRef]
- Roessner, U.; Wagner, C.; Kopka, J.; Trethewey, R.N.; Willmitzer, L. Simultaneous analysis of metabolites in potato tuber by gas chromatography-mass spectrometry. Plant J. 2000, 23, 131–142. [Google Scholar] [CrossRef]
- Lugan, R.; Niogret, M.F.; Leport, L.; Guegan, J.P.; Larher, F.R.; Savoure, A.; Kopka, J.; Bouchereau, A. Metabolome and water homeostasis analysis of Thellungiella salsuginea suggests that dehydration tolerance is a key response to osmotic stress in this halophyte. Plant J. 2010, 64, 215–229. [Google Scholar] [CrossRef]
- Fu, W.; Magnusdottir, M.; Brynjolfson, S.; Palsson, B.O.; Paglia, G. UPLC-UV-MSE analysis for quantification and identification of major carotenoid and chlorophyll species in algae. Anal. Bioanal. Chem. 2012, 404, 3145–3154. [Google Scholar] [CrossRef]
- Aubert, C.; Bony, P.; Chalot, G.; Landry, P.; Lurol, S. Effects of storage temperature, storage duration, and subsequent ripening on the physicochemical characteristics, volatile compounds, and phytochemicals of western red nectarine (Prunus persica L. Batsch). J. Agric. Food Chem. 2014, 62, 4707–4724. [Google Scholar] [CrossRef]
- Hempel, J.; Schädle, C.N.; Sprenger, J.; Heller, A.; Carle, R.; Schweiggert, R.M. Ultrastructural deposition forms and bioaccessibility of carotenoids and carotenoid esters from goji berries (Lycium barbarum L.). Food Chem. 2017, 218, 525–533. [Google Scholar] [CrossRef]
- Britton, G.; Liaaen-Jensen, S.; Pfander, H. Carotenoids, Volume 1A: Isolation and Analysis; Birkhäuser Verlag: Basel, Switzerland, 1995; Volume 1A. [Google Scholar]
- Gupta, P.; Sreelakshmi, Y.; Sharma, R. A rapid and sensitive method for determination of carotenoids in plant tissues by high performance liquid chromatography. Plant Methods 2015, 11, 5. [Google Scholar] [CrossRef] [PubMed] [Green Version]
- de Quiros, A.R.B.; Costa, H.S. Analysis of carotenoids in vegetable and plasma samples: A review. J. Food Compos. Anal. 2006, 19, 97–111. [Google Scholar] [CrossRef]
- Sancho, L.; Yahia, E.M.; Gonzalez-Aguilar, G.A. Identification and quantification of phenols, carotenoids, and vitamin C from papaya (Carica papaya L., cv. Maradol) fruit determined by HPLC-DAD-MS/MS-ESI. Food Res. Int. 2011, 44, 1284–1291. [Google Scholar] [CrossRef]
- Pop, R.M.; Weesepoel, Y.; Socaciu, C.; Pintea, A.; Vincken, J.P.; Gruppen, H. Carotenoid composition of berries and leaves from six Romanian sea buckthorn (Hippophae rhamnoides L.) varieties. Food Chem. 2014, 147, 1–9. [Google Scholar] [CrossRef]
- Schymanski, E.L.; Jeon, J.; Gulde, R.; Fenner, K.; Ruff, M.; Singer, H.P.; Hollender, J. Identifying small molecules via high resolution mass spectrometry: Communicating confidence. Environ. Sci. Technol. 2014, 48, 2097–2098. [Google Scholar] [CrossRef]
- Inbaraj, B.S.; Lu, H.; Hung, C.F.; Wu, W.B.; Lin, C.L.; Chen, B.H. Determination of carotenoids and their esters in fruits of Lycium barbarum Linnaeus by HPLC-DAD-APCI-MS. J. Pharm. Biomed. Anal. 2008, 47, 812–818. [Google Scholar] [CrossRef]
- Pott, I.; Breithaupt, D.E.; Carle, R. Detection of unusual carotenoid esters in fresh mango (Mangifera indica L. cv. ‘Kent’). Phytochemistry 2003, 64, 825–829. [Google Scholar] [CrossRef]
- Rodrigues, D.B.; Mercadante, A.Z.; Mariutti, L.R.B. Marigold carotenoids: Much more than lutein esters. Food Res. Int. 2019, 119, 653–664. [Google Scholar] [CrossRef]
- Dugo, P.; Herrero, M.; Giuffrida, D.; Kumm, T.; Dugo, G.; Mondello, L. Application of comprehensive two-dimensional liquid chromatography to elucidate the native carotenoid composition in red orange essential oil. J. Agric. Food Chem. 2008, 56, 3478–3485. [Google Scholar] [CrossRef]
- Protti, M.; Gualandi, I.; Mandrioli, R.; Zappoli, S.; Tonelli, D.; Mercolini, L. Analytical profiling of selected antioxidants and total antioxidant capacity of goji (Lycium spp.) berries. J. Pharm. Biomed. Anal. 2017, 143, 252–260. [Google Scholar] [CrossRef]
- Lin, H.Y.; Lin, T.S.; Chien, H.J.; Juang, Y.M.; Chen, C.J.; Wang, C.S.; Lai, C.C. A rapid, simple, and high-throughput UPLC-MS/MS method for simultaneous determination of bioactive constituents in Salvia miltiorrhiza with positive/negative ionization switching. J. Pharm. Biomed. Anal. 2018, 161, 94–100. [Google Scholar] [CrossRef] [PubMed]
- Goupy, P.; Vian, M.A.; Chemat, F.; Caris-Veyrat, C. Identification and quantification of flavonols, anthocyanins and lutein diesters in tepals of Crocus sativus by ultra performance liquid chromatography coupled to diode array and ion trap mass spectrometry detections. Ind. Crops Prod. 2013, 44, 496–510. [Google Scholar] [CrossRef]
- Inbaraj, B.S.; Lu, H.; Kao, T.H.; Chen, B.H. Simultaneous determination of phenolic acids and flavonoids in Lycium barbarum Linnaeus by HPLC-DAD-ESI-MS. J. Pharm. Biomed. Anal. 2010, 51, 549–556. [Google Scholar] [CrossRef] [PubMed]
- Rocchetti, G.; Chiodelli, G.; Giuberti, G.; Ghisoni, S.; Baccolo, G.; Blasi, F.; Montesano, D.; Trevisan, M.; Lucini, L. UHPLC-ESI-QTOF-MS profile of polyphenols in Goji berries (Lycium barbarum L.) and its dynamics during in vitro gastrointestinal digestion and fermentation. J. Funct. Foods 2018, 40, 564–572. [Google Scholar] [CrossRef]
- Horai, H.; Arita, M.; Kanaya, S.; Nihei, Y.; Ikeda, T.; Suwa, K.; Ojima, Y.; Tanaka, K.; Tanaka, S.; Aoshima, K.; et al. MassBank: A public repository for sharing mass spectral data for life sciences. J. Mass Spectrom. 2010, 45, 703–714. [Google Scholar] [CrossRef]
- Pedro, A.C.; Maurer, J.B.B.; Zawadzki-Baggio, S.F.; Avila, S.; Maciel, G.M.; Haminiuk, C.W.I. Bioactive compounds of organic goji berry (Lycium barbarum L.) prevents oxidative deterioration of soybean oil. Ind. Crops Prod. 2018, 112, 90–97. [Google Scholar] [CrossRef]
- Zhou, Z.Q.; Xiao, J.; Fan, H.X.; Yu, Y.; He, R.R.; Feng, X.L.; Kurihara, H.; So, K.F.; Yao, X.S.; Gao, H. Polyphenols from wolfberry and their bioactivities. Food Chem. 2017, 214, 644–654. [Google Scholar] [CrossRef]
- Forino, M.; Tartaglione, L.; Dell’Aversano, C.; Ciminiello, P. NMR-based identification of the phenolic profile of fruits of Lycium barbarum (goji berries). Isolation and structural determination of a novel N-feruloyl tyramine dimer as the most abundant antioxidant polyphenol of goji berries. Food Chem. 2016, 194, 1254–1259. [Google Scholar] [CrossRef]
- Zhao, J.H.; Li, H.X.; Xi, W.P.; An, W.; Niu, L.L.; Cao, Y.L.; Wang, H.F.; Wang, Y.J.; Yin, Y. Changes in sugars and organic acids in wolfberry (Lycium barbarum L.) fruit during development and maturation. Food Chem. 2015, 173, 718–724. [Google Scholar] [CrossRef] [PubMed]
- Zheng, J. Anthocyanins composition and antioxidant activity of wild Lycium ruthenicum Murr. from Qinghai-Tibet plateau. Food Chem. 2010, 126, 859–865. [Google Scholar] [CrossRef]
- Xin, T.Y.; Yao, H.; Gao, H.H.; Zhou, X.Z.; Ma, X.C.; Xu, C.Q.; Chen, J.; Han, J.P.; Pang, X.H.; Xu, R.; et al. Super food Lycium barbarum (Solanaceae) traceability via an internal transcribed spacer 2 barcode. Food Res. Int. 2013, 54, 1699–1704. [Google Scholar] [CrossRef]
- Benard, C.; Bernillon, S.; Biais, B.; Osorio, S.; Maucourt, M.; Ballias, P.; Deborde, C.; Colombie, S.; Cabasson, C.; Jacob, D.; et al. Metabolomic profiling in tomato reveals diel compositional changes in fruit affected by source-sink relationships. J. Exp. Bot. 2015, 66, 3391–3404. [Google Scholar] [CrossRef] [Green Version]
- Alba, R.; Payton, P.; Fei, Z.J.; McQuinn, R.; Debbie, P.; Martin, G.B.; Tanksley, S.D.; Giovannoni, J.J. Transcriptome and selected metabolite analyses reveal multiple points of ethylene control during tomato fruit development. Plant Cell 2005, 17, 2954–2965. [Google Scholar] [CrossRef] [PubMed] [Green Version]
- Moco, S.; Bino, R.J.; Vorst, O.; Verhoeven, H.A.; de Groot, J.; van Beek, T.A.; Vervoort, J.; De Vos, C.R. A liquid chromatography-mass spectrometry-based metabolome database for tomato. Plant Physiol. 2006, 141, 1205–1218. [Google Scholar] [CrossRef] [PubMed] [Green Version]
- Zhang, Y.; Butelli, E.; Alseekh, S.; Tohge, T.; Rallapalli, G.; Luo, J.; Kawar, P.G.; Hill, L.; Santino, A.; Fernie, A.R.; et al. Multi-level engineering facilitates the production of phenylpropanoid compounds in tomato. Nat. Commun. 2015, 6, 11. [Google Scholar] [CrossRef] [Green Version]
- Lu, Y.Y.; Guo, S.; Zhang, F.; Yan, H.; Qian, D.W.; Wang, H.Q.; Jin, L.; Duan, J.A. Comparison of functional components and antioxidant activity of Lycium barbarum L. fruits from different regions in China. Molecules 2019, 24, 2228. [Google Scholar] [CrossRef] [Green Version]
- Qian, J.Y.; Liu, D.; Huang, A.G. The efficiency of flavonoids in polar extracts of Lycium chinense Mill fruits as free radical scavenger. Food Chem. 2004, 87, 283–288. [Google Scholar] [CrossRef]
- Wang, C.C.; Chang, S.C.; Inbaraj, B.S.; Chen, B.H. Isolation of carotenoids, flavonoids and polysaccharides from Lycium barbarum L. and evaluation of antioxidant activity. Food Chem. 2010, 120, 184–192. [Google Scholar] [CrossRef]
- Chong, J.; Wishart, D.S.; Xia, J. Using MetaboAnalyst 4.0 for comprehensive and Integrative metabolomics data analysis. Curr. Protoc. Bioinf. 2019, 68, e86. [Google Scholar] [CrossRef]


Publisher’s Note: MDPI stays neutral with regard to jurisdictional claims in published maps and institutional affiliations. |
© 2020 by the authors. Licensee MDPI, Basel, Switzerland. This article is an open access article distributed under the terms and conditions of the Creative Commons Attribution (CC BY) license (http://creativecommons.org/licenses/by/4.0/).
Share and Cite
Dumont, D.; Danielato, G.; Chastellier, A.; Hibrand Saint Oyant, L.; Fanciullino, A.-L.; Lugan, R. Multi-Targeted Metabolic Profiling of Carotenoids, Phenolic Compounds and Primary Metabolites in Goji (Lycium spp.) Berry and Tomato (Solanum lycopersicum) Reveals Inter and Intra Genus Biomarkers. Metabolites 2020, 10, 422. https://doi.org/10.3390/metabo10100422
Dumont D, Danielato G, Chastellier A, Hibrand Saint Oyant L, Fanciullino A-L, Lugan R. Multi-Targeted Metabolic Profiling of Carotenoids, Phenolic Compounds and Primary Metabolites in Goji (Lycium spp.) Berry and Tomato (Solanum lycopersicum) Reveals Inter and Intra Genus Biomarkers. Metabolites. 2020; 10(10):422. https://doi.org/10.3390/metabo10100422
Chicago/Turabian StyleDumont, Doriane, Giorgia Danielato, Annie Chastellier, Laurence Hibrand Saint Oyant, Anne-Laure Fanciullino, and Raphaël Lugan. 2020. "Multi-Targeted Metabolic Profiling of Carotenoids, Phenolic Compounds and Primary Metabolites in Goji (Lycium spp.) Berry and Tomato (Solanum lycopersicum) Reveals Inter and Intra Genus Biomarkers" Metabolites 10, no. 10: 422. https://doi.org/10.3390/metabo10100422