LC–MS Lipidomics: Exploiting a Simple High-Throughput Method for the Comprehensive Extraction of Lipids in a Ruminant Fat Dose-Response Study


Abstract
:
1. Introduction
2. Results
3. Discussion
4. Materials and Methods
4.1. Chemicals and Standards
4.2. Extraction
4.2.1. Protein Precipitation Liquid Extraction Protocol (PPLE)
4.2.2. Folch Liquid–Liquid Extraction Protocol (Folch LLE)
4.3. LC–MS Method
4.4. Data Processing
4.5. Animal Intervention
5. Conclusions
Supplementary Materials
Author Contributions
Funding
Conflicts of Interest
References
- LIPID MAPS® Lipidomics Gateway LIPID MAPS® Lipidomics Gateway. Available online: https://www.lipidmaps.org/ (accessed on 20 April 2020).
- Jenkins, B.; West, J.A.; Koulman, A. A Review of Odd-Chain Fatty Acid Metabolism and the Role of Pentadecanoic Acid (C15:0) and Heptadecanoic Acid (C17:0) in Health and Disease. Molecules 2015, 20, 2425–2444. [Google Scholar] [CrossRef] [PubMed] [Green Version]
- Berg, J.M.; Tymoczko, J.L.; Stryer, L. Biochemistry, 5th ed.; W.H. Freeman: New York, NY, USA, 2002. [Google Scholar]
- Nakamura, M.T.; Yudell, B.E.; Loor, J.J. Regulation of energy metabolism by long-chain fatty acids. Progress Lipid Res. 2014, 53, 124–144. [Google Scholar] [CrossRef] [PubMed]
- Wymann, M.P.; Schneiter, R. Lipid signalling in disease. Nat. Rev. Mol. Cell Biol. 2008, 9, 162–176. [Google Scholar] [CrossRef] [PubMed]
- Harayama, T.; Riezman, H. Understanding the diversity of membrane lipid composition. Nat. Rev. Mol. Cell Biol. 2018, 19, 281–296. [Google Scholar] [CrossRef]
- Jenkins, B.J.; Seyssel, K.; Chiu, S.; Pan, P.-H.; Lin, S.-Y.; Stanley, E.; Ament, Z.; West, J.A.; Summerhill, K.; Griffin, J.L.; et al. Odd Chain Fatty Acids; New Insights of the Relationship Between the Gut Microbiota, Dietary Intake, Biosynthesis and Glucose Intolerance. Sci. Rep. 2017, 7, 44845. [Google Scholar] [CrossRef] [Green Version]
- Jenkins, B.; de Schryver, E.; Van Veldhoven, P.P.; Koulman, A. Peroxisomal 2-Hydroxyacyl-CoA Lyase Is Involved in Endogenous Biosynthesis of Heptadecanoic Acid. Molecules 2017, 22, 1718. [Google Scholar] [CrossRef] [Green Version]
- Zarrouk, A.; Debbabi, M.; Bezine, M.; Karym, E.M.; Badreddine, A.; Rouaud, O.; Moreau, T.; Cherkaoui-Malki, M.; El Ayeb, M.; Nasser, B.; et al. Lipid Biomarkers in Alzheimer’s Disease. Curr. Alzheimer Res. 2018, 15, 303–312. [Google Scholar] [CrossRef]
- Dorcely, B.; Katz, K.; Jagannathan, R.; Chiang, S.S.; Oluwadare, B.; Goldberg, I.J.; Bergman, M. Novel biomarkers for prediabetes, diabetes, and associated complications. Diabetes Metab. Syndr. Obes. 2017, 10, 345–361. [Google Scholar] [CrossRef] [Green Version]
- Niki, E. Biomarkers of lipid peroxidation in clinical material. Biochim. Biophys. Acta (BBA) Gen. Subj. 2014, 1840, 809–817. [Google Scholar] [CrossRef]
- Folch, J.; Lees, M.; Stanley, G.H.S. A Simple Method for the Isolation and Purification of Total Lipides from Animal Tissues. J. Biol. Chem. 1957, 226, 497–509. [Google Scholar]
- Bligh, E.G.; Dyer, W.J. A Rapid Method of Total Lipid Extraction and Purification. Can. J. Biochem. Physiol. 1959, 37, 911–917. [Google Scholar] [CrossRef] [Green Version]
- Matyash, V.; Liebisch, G.; Kurzchalia, T.V.; Shevchenko, A.; Schwudke, D. Lipid extraction by methyl-tert-butyl ether for high-throughput lipidomics. J. Lipid Res. 2008, 49, 1137–1146. [Google Scholar] [CrossRef] [PubMed] [Green Version]
- Gil, A.; Zhang, W.; Wolters, J.C.; Permentier, H.; Boer, T.; Horvatovich, P.; Heiner-Fokkema, M.R.; Reijngoud, D.-J.; Bischoff, R. One- vs two-phase extraction: Re-evaluation of sample preparation procedures for untargeted lipidomics in plasma samples. Anal. Bioanal. Chem. 2018, 410, 5859–5870. [Google Scholar] [CrossRef] [PubMed] [Green Version]
- Pellegrino, R.M.; Di Veroli, A.; Valeri, A.; Goracci, L.; Cruciani, G. LC/MS lipid profiling from human serum: A new method for global lipid extraction. Anal. Bioanal. Chem. 2014, 406, 7937–7948. [Google Scholar] [CrossRef] [PubMed]
- Cajka, T.; Fiehn, O. Comprehensive analysis of lipids in biological systems by liquid chromatography-mass spectrometry. Trends Anal. Chem. 2014, 61, 192–206. [Google Scholar] [CrossRef] [Green Version]
- Cajka, T.; Fiehn, O. Increasing lipidomic coverage by selecting optimal mobile-phase modifiers in LC–MS of blood plasma. Metabolomics 2016, 12, 34. [Google Scholar] [CrossRef]
- Isaac, G.; McDonald, S.; Astarita, G. Lipid Separation Using UPLC with Charged Surface Hybrid Technology; Waters Corp: Milford, MA, USA, 2011; pp. 1–8. [Google Scholar]
- Ulmer, C.Z.; Patterson, R.E.; Koelmel, J.P.; Garrett, T.J.; Yost, R.A. A Robust Lipidomics Workflow for Mammalian Cells, Plasma, and Tissue Using Liquid-Chromatography High- Resolution Tandem Mass Spectrometry. Methods Mol. Biol. 2017, 1609, 91–106. [Google Scholar] [CrossRef]
- Haider, A.; Wei, Y.-C.; Lim, K.; Barbosa, A.D.; Liu, C.-H.; Weber, U.; Mlodzik, M.; Oras, K.; Collier, S.; Hussain, M.M.; et al. PCYT1A Regulates Phosphatidylcholine Homeostasis from the Inner Nuclear Membrane in Response to Membrane Stored Curvature Elastic Stress. Dev. Cell 2018, 45, 481–495.e8. [Google Scholar] [CrossRef] [Green Version]
- Petkevicius, K.; Virtue, S.; Bidault, G.; Jenkins, B.; Çubuk, C.; Morgantini, C.; Aouadi, M.; Dopazo, J.; Serlie, M.; Koulman, A.; et al. Accelerated phosphatidylcholine turnover in macrophages promotes adipose tissue inflammation in obesity. eLife 2019, 8, e47990. [Google Scholar] [CrossRef]
- Pagadala, M.; Kasumov, T.; McCullough, A.J.; Zein, N.N.; Kirwan, J.P. Role of ceramides in nonalcoholic fatty liver disease. Trends Endocrinol. Metab. 2012, 23, 365–371. [Google Scholar] [CrossRef] [Green Version]
- Shi, Y. Emerging roles of cardiolipin remodeling in mitochondrial dysfunction associated with diabetes, obesity, and cardiovascular diseases. J. Biomed. Res. 2010, 24, 6–15. [Google Scholar] [CrossRef] [Green Version]
- Kawano, Y.; Cohen, D.E. Mechanisms of hepatic triglyceride accumulation in non-alcoholic fatty liver disease. J. Gastroenterol. 2013, 48, 434–441. [Google Scholar] [CrossRef] [PubMed] [Green Version]
- Ronis, M.J.J.; Baumgardner, J.N.; Sharma, N.; Vantrease, J.; Ferguson, M.; Tong, Y.; Wu, X.; Cleves, M.A.; Badger, T.M. Medium chain triglycerides dose-dependently prevent liver pathology in a rat model of non-alcoholic fatty liver disease. Exp. Biol. Med. 2013, 238, 151–162. [Google Scholar] [CrossRef] [PubMed]
- Alkhouri, N.; Dixon, L.J.; Feldstein, A.E. Lipotoxicity in Nonalcoholic Fatty Liver Disease: Not All Lipids Are Created Equal. Expert Rev. Gastroenterol. Hepatol. 2009, 3, 445–451. [Google Scholar] [CrossRef] [PubMed] [Green Version]
- Gonzalez-Cantero, J.; Martin-Rodriguez, J.L.; Gonzalez-Cantero, A.; Arrebola, J.P.; Gonzalez-Calvin, J.L. Insulin resistance in lean and overweight non-diabetic Caucasian adults: Study of its relationship with liver triglyceride content, waist circumference and BMI. PLoS ONE 2018, 13, e192663. [Google Scholar] [CrossRef]
- Dongiovanni, P.; Stender, S.; Pietrelli, A.; Mancina, R.M.; Cespiati, A.; Petta, S.; Pelusi, S.; Pingitore, P.; Badiali, S.; Maggioni, M.; et al. Causal relationship of hepatic fat with liver damage and insulin resistance in nonalcoholic fatty liver. J. Intern. Med. 2018, 283, 356–370. [Google Scholar] [CrossRef]
- Liebisch, G.; Ahrends, R.; Arita, M.; Arita, M.; Bowden, J.A.; Ejsing, C.S.; Griffiths, W.J.; Holčapek, M.; Köfeler, H.; Mitchell, T.W.; et al. Lipidomics needs more standardization. Nat. Metab. 2019, 1, 745–747. [Google Scholar] [CrossRef] [Green Version]
- Virtue, S.; Petkevicius, K.; Moreno-Navarrete, J.M.; Jenkins, B.; Hart, D.; Dale, M.; Koulman, A.; Fernández-Real, J.M.; Vidal-Puig, A. Peroxisome Proliferator-Activated Receptor γ2 Controls the Rate of Adipose Tissue Lipid Storage and Determines Metabolic Flexibility. Cell Rep. 2018, 24, 2005–2012.e7. [Google Scholar] [CrossRef] [Green Version]
- Forouhi, N.G.; Koulman, A.; Sharp, S.J.; Imamura, F.; Kröger, J.; Schulze, M.B.; Crowe, F.L.; Huerta, J.M.; Guevara, M.; Beulens, J.W.; et al. Differences in the prospective association between individual plasma phospholipid saturated fatty acids and incident type 2 diabetes: The EPIC-InterAct case-cohort study. Lancet Diabetes Endocrinol. 2014, 2, 810–818. [Google Scholar] [CrossRef] [Green Version]
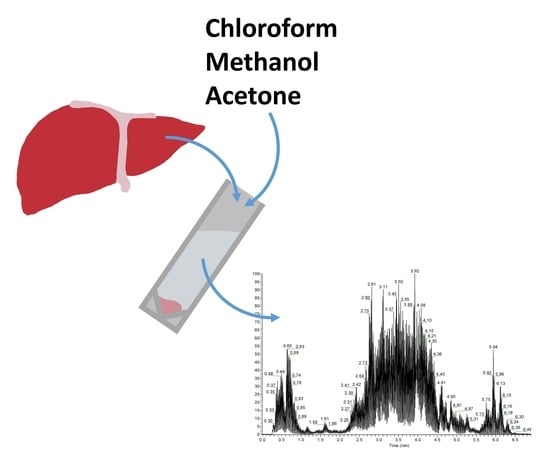
 , and Protein precipitation liquid extraction: chloroform: methanol: acetone, ~7:3:4
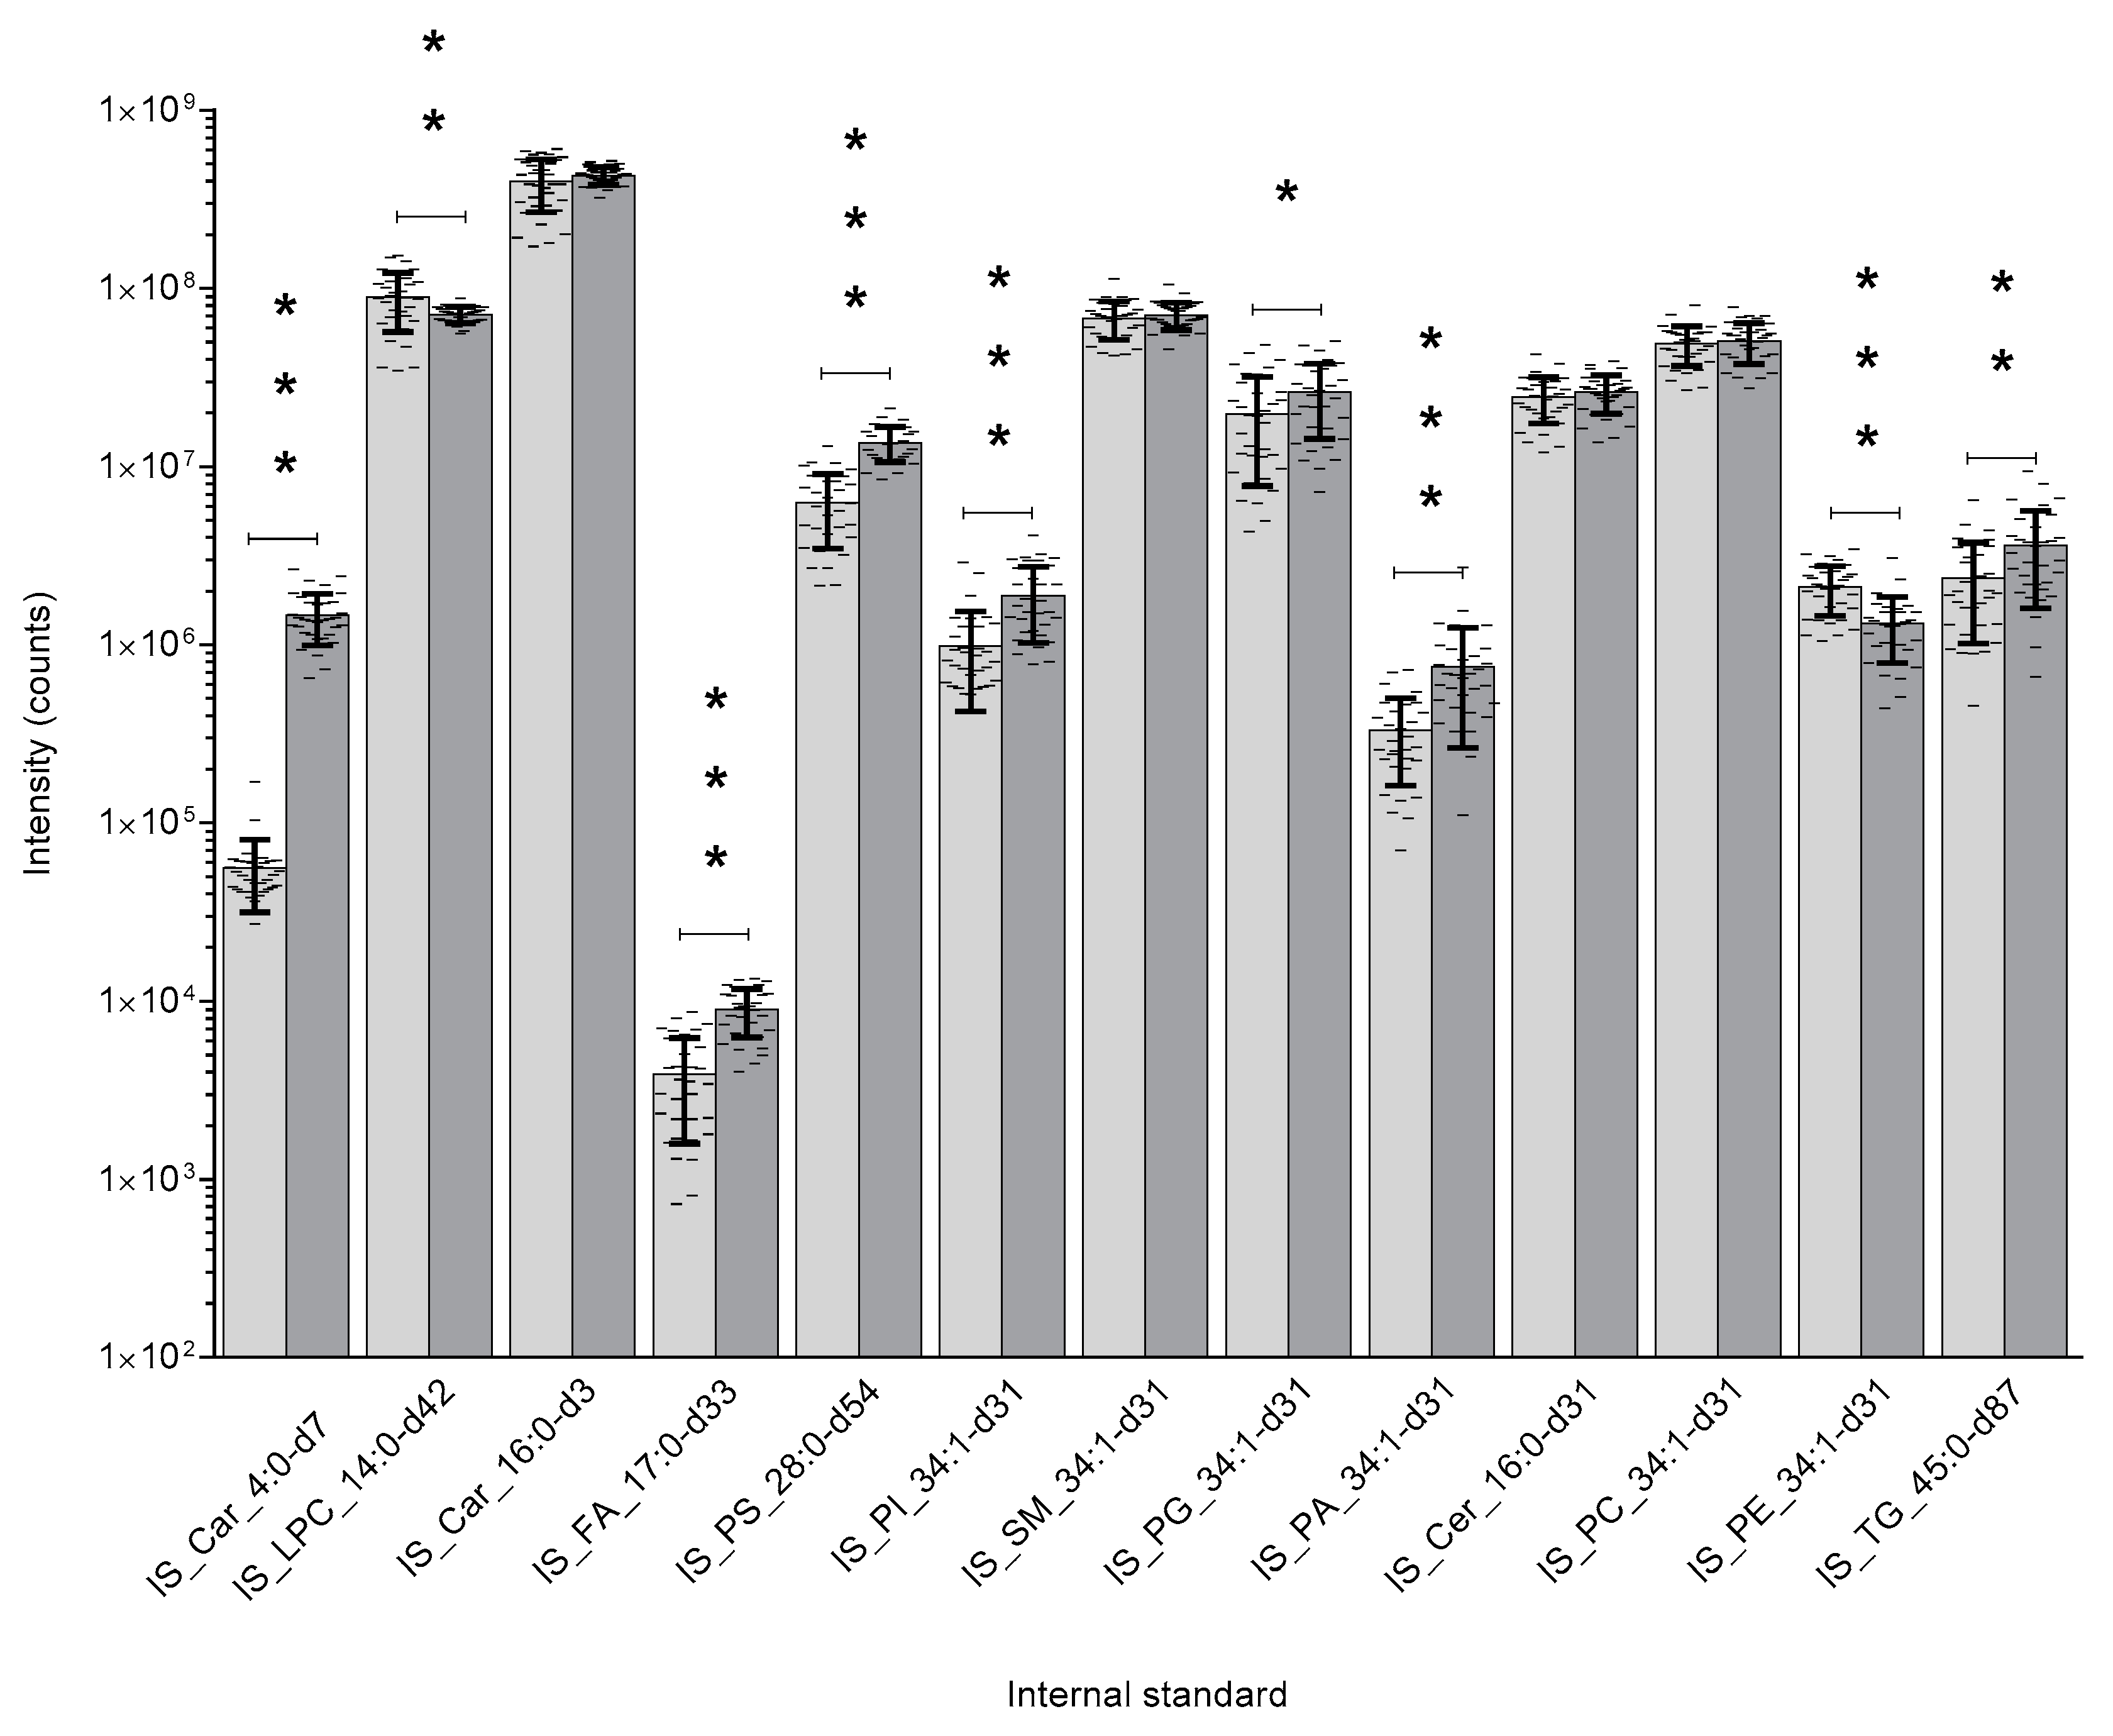
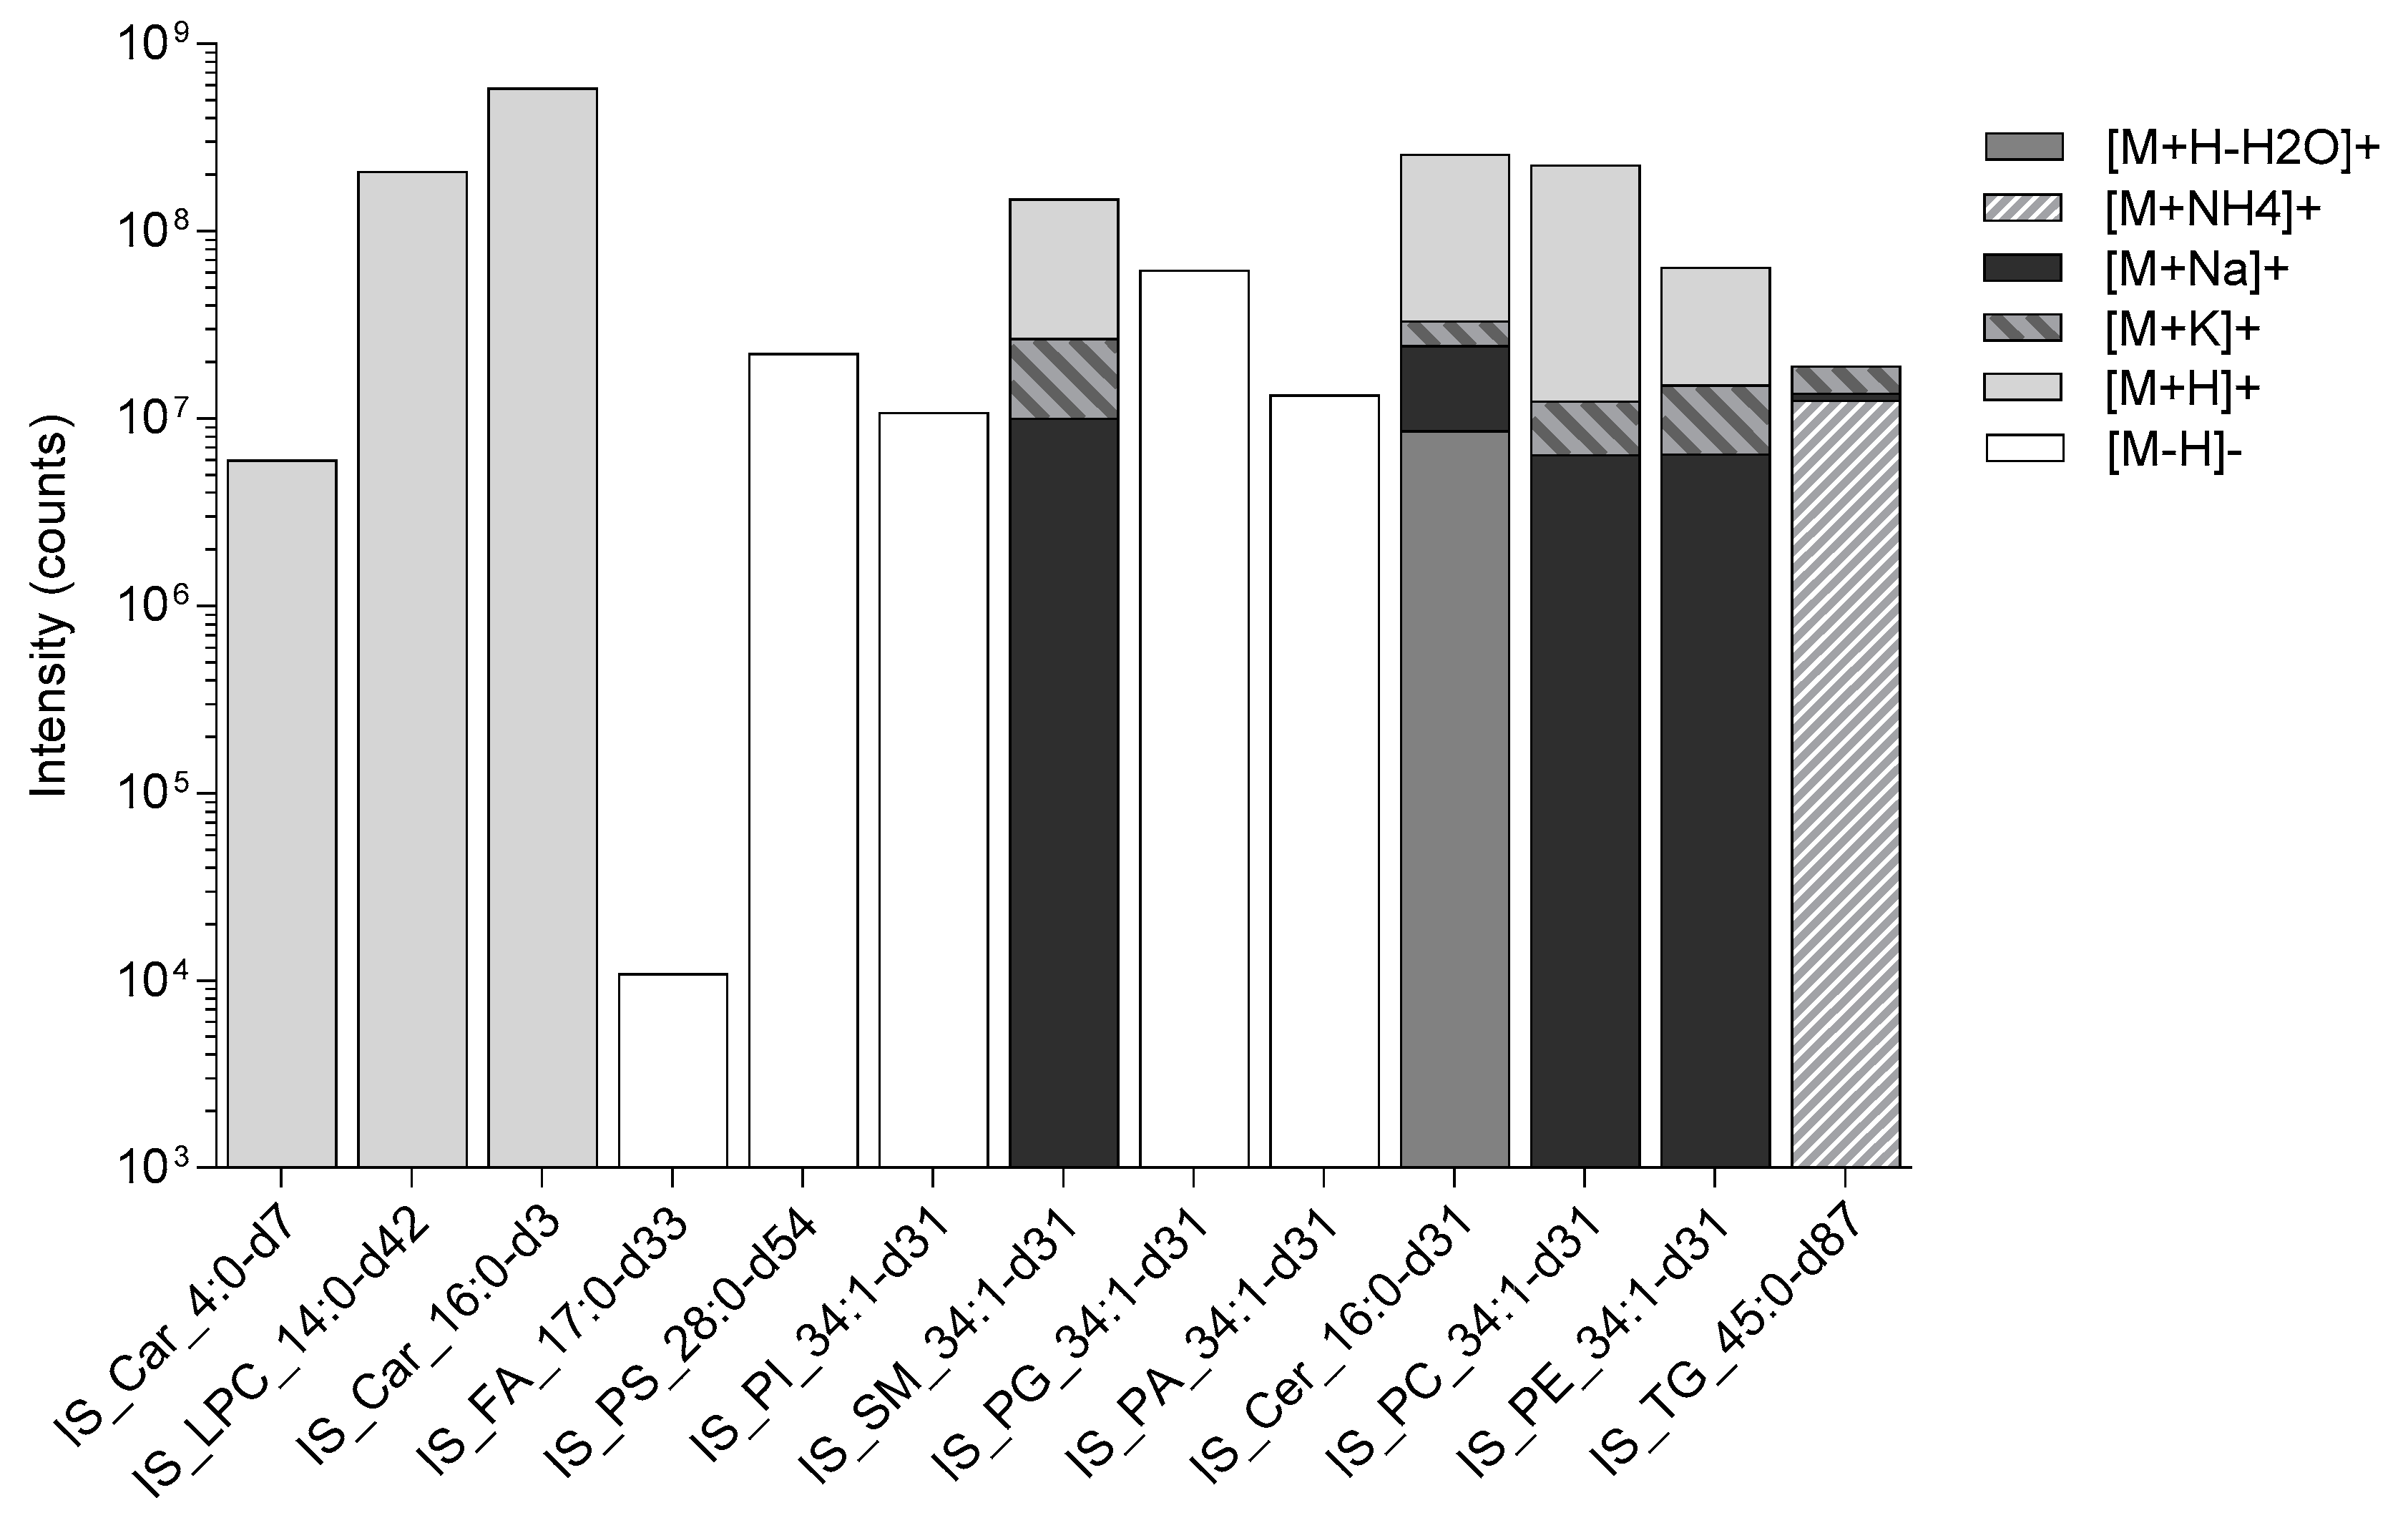
  ). n = 34 rat liver samples per extraction method. The intensity of the internal standards were measured by liquid chromatography with mass spectrometry. The significance of the difference between the two extraction protocols are shown by the p-value star system; where p ≤ 0.05 was considered statistically significant (* p < 0.05, ** p < 0.01, *** p < 0.001). Error bars represent ± standard deviation. Lipid internal standard include: Butyryl-d7-L-carnitine (abbreviated to IS_Car_4:0-d7), N-tetradecylphosphocholine-d42 (abbreviated to IS_LPC_14:0-d42), hexadecanoyl-L-carnitine-d3 (abbreviated to IS_Car_16:0-d3), heptadecanoic-d33 acid (abbreviated to IS_FA_17:0-d33), 1,2-dimyristoyl-d54-sn-glycero-3-[phospho-L-serine] (abbreviated to IS_PS_28:0-d54), 1-palmitoyl-d31-2-oleoyl-sn-glycero-3-phosphoinositol (abbreviated to IS_PI_34:1-d31), N-palmitoyl-d31-D-erythro-sphingosylphosphorylcholine (abbreviated to IS_SM_34:1-d31), 1-palmitoyl-d31-2-oleoyl-sn-glycero-3-[phospho-rac-(1-glycerol)] (abbreviated to IS_PG_34:1-d31), 1-palmitoyl-d31-2-oleoyl-sn-glycero-3-phosphate (abbreviated to IS_PA_34:1-d31), N-palmitoyl-d31-D-erythro-sphingosine (abbreviated to IS_Cer_16:0-d31), 1-palmitoyl-d31-2-oleoyl-sn-glycero-3-phosphocholine (abbreviated to IS_PC_34:1-d31), 1-palmitoyl-d31-2-oleoyl-sn-glycero-3-phosphoethanolamine (abbreviated to IS_PE_34:1-d31), glyceryl tri(pentadecanoate-d29) (abbreviated to IS_TG_45:0-d87).
, and Protein precipitation liquid extraction: chloroform: methanol: acetone, ~7:3:4 ). n = 34 rat liver samples per extraction method. The intensity of the internal standards were measured by liquid chromatography with mass spectrometry. The significance of the difference between the two extraction protocols are shown by the p-value star system; where p ≤ 0.05 was considered statistically significant (* p < 0.05, ** p < 0.01, *** p < 0.001). Error bars represent ± standard deviation. Lipid internal standard include: Butyryl-d7-L-carnitine (abbreviated to IS_Car_4:0-d7), N-tetradecylphosphocholine-d42 (abbreviated to IS_LPC_14:0-d42), hexadecanoyl-L-carnitine-d3 (abbreviated to IS_Car_16:0-d3), heptadecanoic-d33 acid (abbreviated to IS_FA_17:0-d33), 1,2-dimyristoyl-d54-sn-glycero-3-[phospho-L-serine] (abbreviated to IS_PS_28:0-d54), 1-palmitoyl-d31-2-oleoyl-sn-glycero-3-phosphoinositol (abbreviated to IS_PI_34:1-d31), N-palmitoyl-d31-D-erythro-sphingosylphosphorylcholine (abbreviated to IS_SM_34:1-d31), 1-palmitoyl-d31-2-oleoyl-sn-glycero-3-[phospho-rac-(1-glycerol)] (abbreviated to IS_PG_34:1-d31), 1-palmitoyl-d31-2-oleoyl-sn-glycero-3-phosphate (abbreviated to IS_PA_34:1-d31), N-palmitoyl-d31-D-erythro-sphingosine (abbreviated to IS_Cer_16:0-d31), 1-palmitoyl-d31-2-oleoyl-sn-glycero-3-phosphocholine (abbreviated to IS_PC_34:1-d31), 1-palmitoyl-d31-2-oleoyl-sn-glycero-3-phosphoethanolamine (abbreviated to IS_PE_34:1-d31), glyceryl tri(pentadecanoate-d29) (abbreviated to IS_TG_45:0-d87).
). n = 34 rat liver samples per extraction method. The intensity of the internal standards were measured by liquid chromatography with mass spectrometry. The significance of the difference between the two extraction protocols are shown by the p-value star system; where p ≤ 0.05 was considered statistically significant (* p < 0.05, ** p < 0.01, *** p < 0.001). Error bars represent ± standard deviation. Lipid internal standard include: Butyryl-d7-L-carnitine (abbreviated to IS_Car_4:0-d7), N-tetradecylphosphocholine-d42 (abbreviated to IS_LPC_14:0-d42), hexadecanoyl-L-carnitine-d3 (abbreviated to IS_Car_16:0-d3), heptadecanoic-d33 acid (abbreviated to IS_FA_17:0-d33), 1,2-dimyristoyl-d54-sn-glycero-3-[phospho-L-serine] (abbreviated to IS_PS_28:0-d54), 1-palmitoyl-d31-2-oleoyl-sn-glycero-3-phosphoinositol (abbreviated to IS_PI_34:1-d31), N-palmitoyl-d31-D-erythro-sphingosylphosphorylcholine (abbreviated to IS_SM_34:1-d31), 1-palmitoyl-d31-2-oleoyl-sn-glycero-3-[phospho-rac-(1-glycerol)] (abbreviated to IS_PG_34:1-d31), 1-palmitoyl-d31-2-oleoyl-sn-glycero-3-phosphate (abbreviated to IS_PA_34:1-d31), N-palmitoyl-d31-D-erythro-sphingosine (abbreviated to IS_Cer_16:0-d31), 1-palmitoyl-d31-2-oleoyl-sn-glycero-3-phosphocholine (abbreviated to IS_PC_34:1-d31), 1-palmitoyl-d31-2-oleoyl-sn-glycero-3-phosphoethanolamine (abbreviated to IS_PE_34:1-d31), glyceryl tri(pentadecanoate-d29) (abbreviated to IS_TG_45:0-d87).
, and Protein precipitation liquid extraction: chloroform: methanol: acetone, ~7:3:4 ). n = 34 rat liver samples per extraction method. The intensity of the internal standards were measured by liquid chromatography with mass spectrometry. The significance of the difference between the two extraction protocols are shown by the p-value star system; where p ≤ 0.05 was considered statistically significant (* p < 0.05, ** p < 0.01, *** p < 0.001). Error bars represent ± standard deviation. Lipid internal standard include: Butyryl-d7-L-carnitine (abbreviated to IS_Car_4:0-d7), N-tetradecylphosphocholine-d42 (abbreviated to IS_LPC_14:0-d42), hexadecanoyl-L-carnitine-d3 (abbreviated to IS_Car_16:0-d3), heptadecanoic-d33 acid (abbreviated to IS_FA_17:0-d33), 1,2-dimyristoyl-d54-sn-glycero-3-[phospho-L-serine] (abbreviated to IS_PS_28:0-d54), 1-palmitoyl-d31-2-oleoyl-sn-glycero-3-phosphoinositol (abbreviated to IS_PI_34:1-d31), N-palmitoyl-d31-D-erythro-sphingosylphosphorylcholine (abbreviated to IS_SM_34:1-d31), 1-palmitoyl-d31-2-oleoyl-sn-glycero-3-[phospho-rac-(1-glycerol)] (abbreviated to IS_PG_34:1-d31), 1-palmitoyl-d31-2-oleoyl-sn-glycero-3-phosphate (abbreviated to IS_PA_34:1-d31), N-palmitoyl-d31-D-erythro-sphingosine (abbreviated to IS_Cer_16:0-d31), 1-palmitoyl-d31-2-oleoyl-sn-glycero-3-phosphocholine (abbreviated to IS_PC_34:1-d31), 1-palmitoyl-d31-2-oleoyl-sn-glycero-3-phosphoethanolamine (abbreviated to IS_PE_34:1-d31), glyceryl tri(pentadecanoate-d29) (abbreviated to IS_TG_45:0-d87).
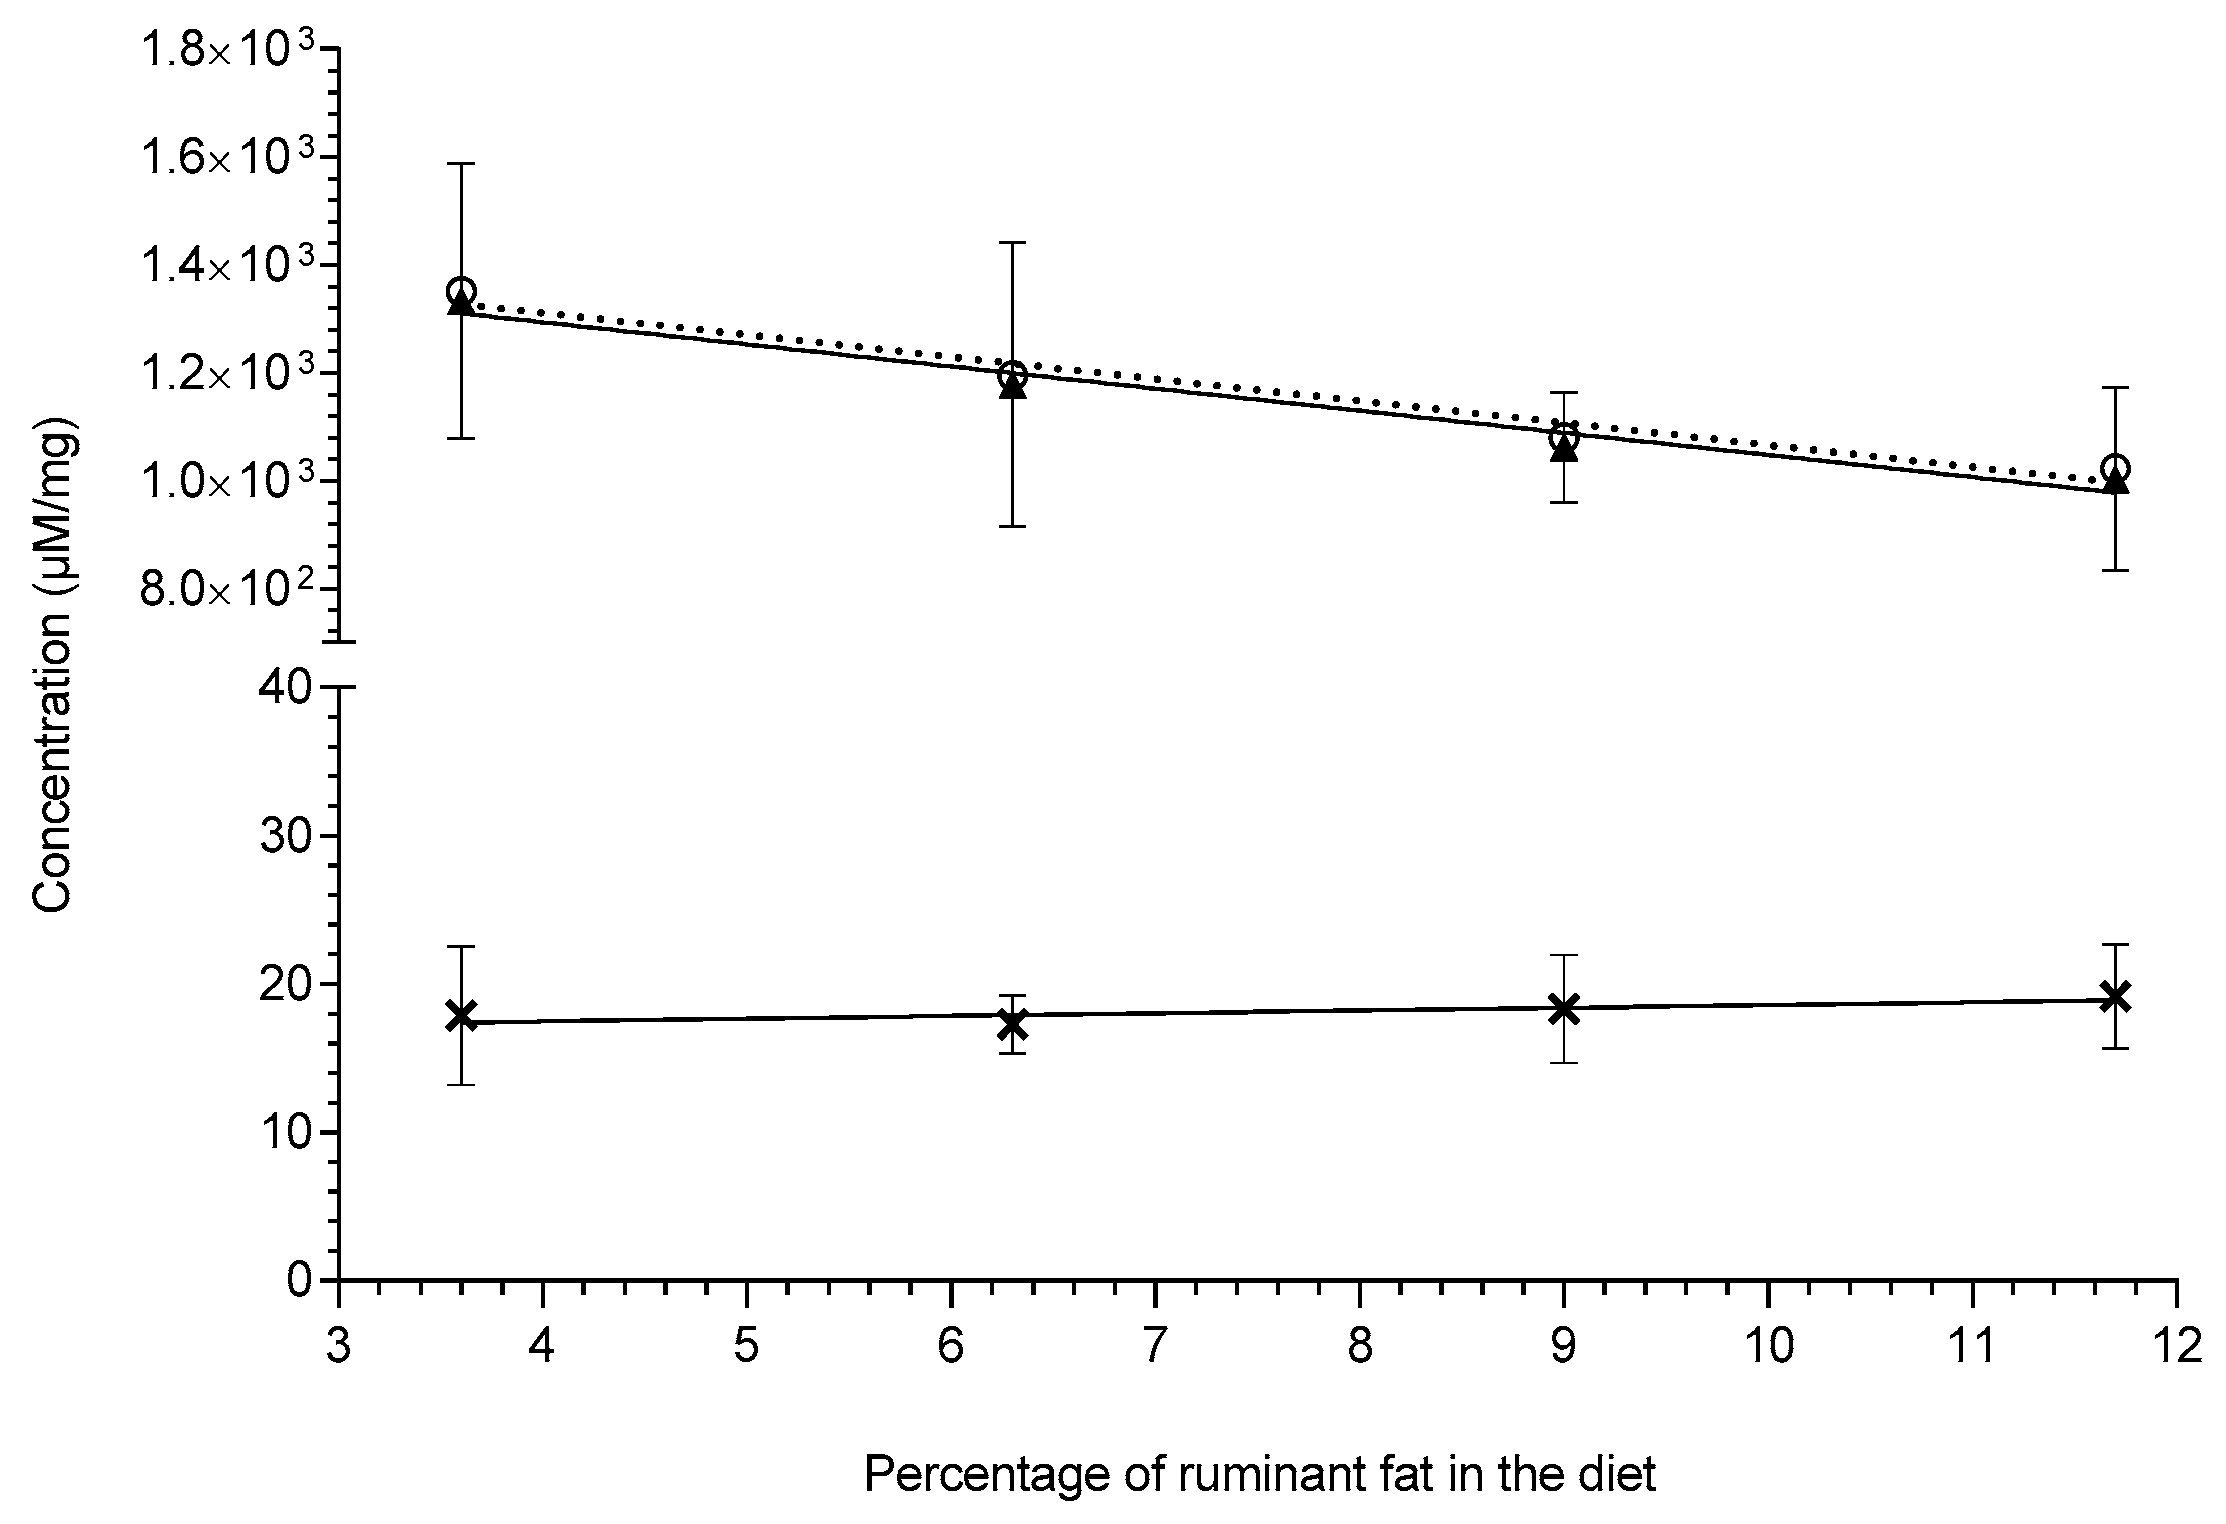
 , gradient: 0.183 ± 0.0962, R2 = 0.64, slope significance p-value: 0.197); total even chain lipids (symbol:
  , trendline:
  , gradient: −41.0 ± 5.71, R2 = 0.963, slope significance p-value: 0.0189); total lipids containing both even and of odd chain (symbol: O, trendline:
  , gradient: −40.8 ± 5.79, R2 = 0.961, slope significance p-value: 0.0195. Lipid concentrations (µM/mg) are shown as means ± standard deviation and were extracted via the protein precipitation liquid extraction protocol (chloroform: methanol: acetone, ~7:3:4).
, gradient: 0.183 ± 0.0962, R2 = 0.64, slope significance p-value: 0.197); total even chain lipids (symbol: , trendline: , gradient: −41.0 ± 5.71, R2 = 0.963, slope significance p-value: 0.0189); total lipids containing both even and of odd chain (symbol: O, trendline: , gradient: −40.8 ± 5.79, R2 = 0.961, slope significance p-value: 0.0195. Lipid concentrations (µM/mg) are shown as means ± standard deviation and were extracted via the protein precipitation liquid extraction protocol (chloroform: methanol: acetone, ~7:3:4).
, gradient: −40.8 ± 5.79, R2 = 0.961, slope significance p-value: 0.0195. Lipid concentrations (µM/mg) are shown as means ± standard deviation and were extracted via the protein precipitation liquid extraction protocol (chloroform: methanol: acetone, ~7:3:4).
, gradient: 0.183 ± 0.0962, R2 = 0.64, slope significance p-value: 0.197); total even chain lipids (symbol: , trendline: , gradient: −41.0 ± 5.71, R2 = 0.963, slope significance p-value: 0.0189); total lipids containing both even and of odd chain (symbol: O, trendline: , gradient: −40.8 ± 5.79, R2 = 0.961, slope significance p-value: 0.0195. Lipid concentrations (µM/mg) are shown as means ± standard deviation and were extracted via the protein precipitation liquid extraction protocol (chloroform: methanol: acetone, ~7:3:4).
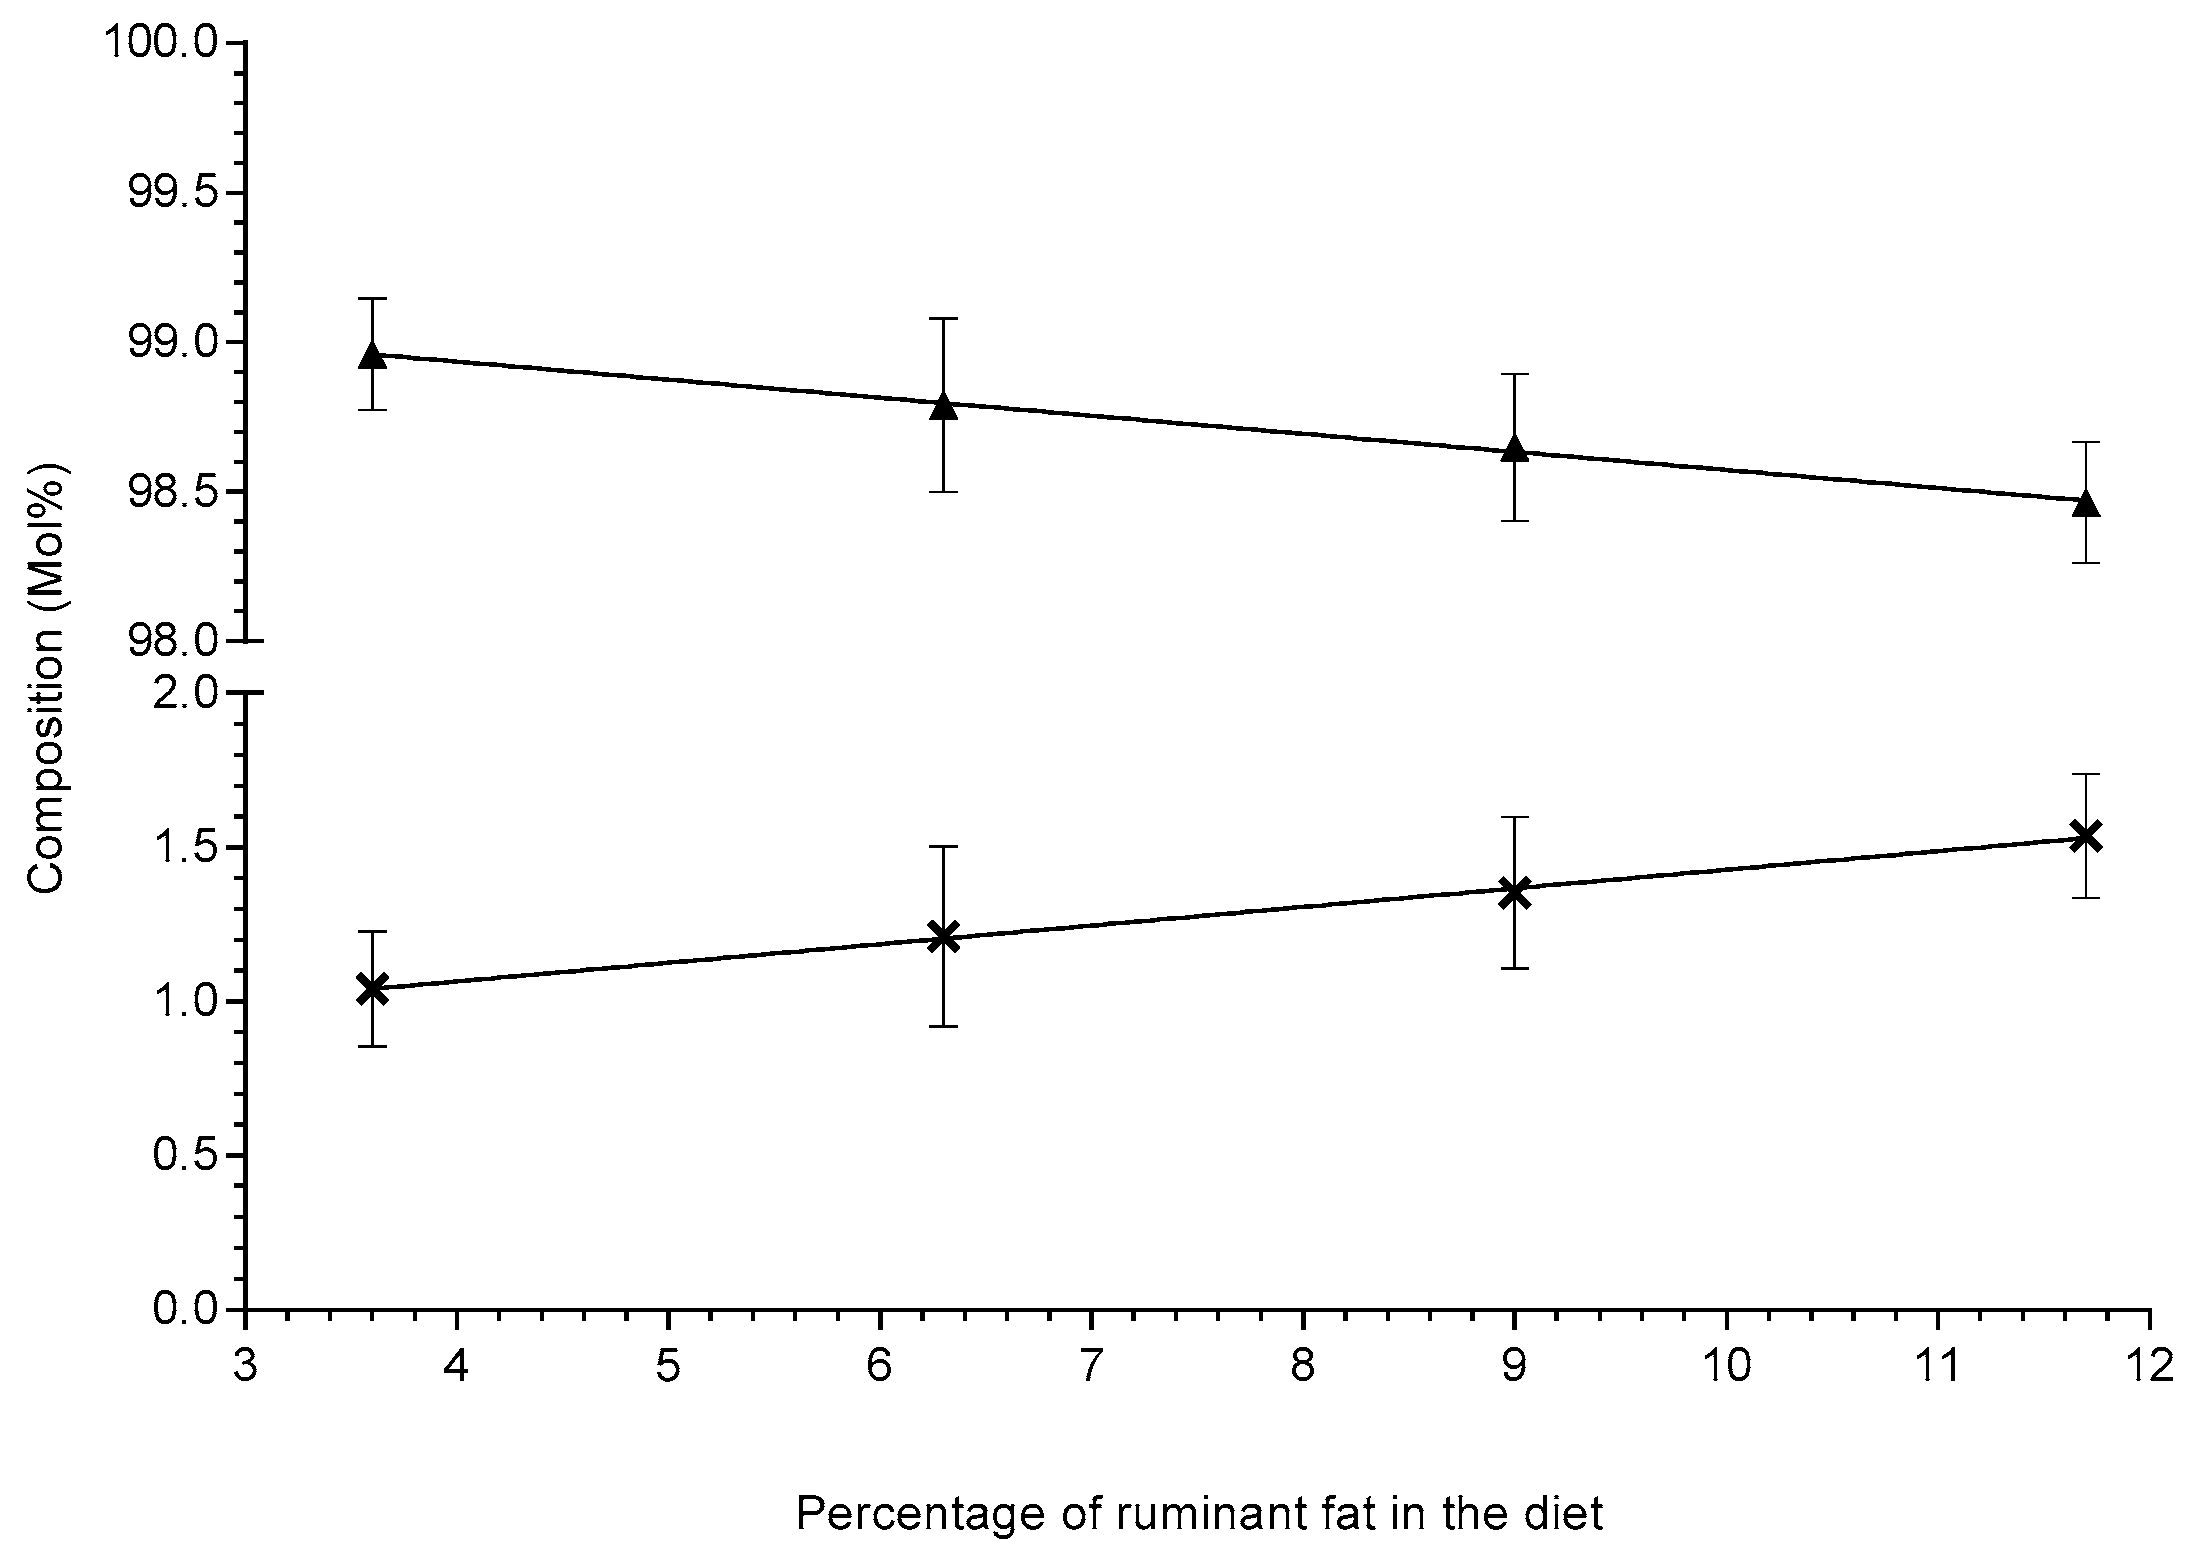
 , gradient: 0.0604 ± 0.00203, R2 = 0.998, slope significance p-value: 0.0011) and the total even chain lipids (symbol:
  , trendline:
  , gradient: −0.0604 ± 0.00203, R2 = 0.998, slope significance p-value: 0.0011) across the four high-fat diets in Sprague–Dawley rats (n = 8–9 per group). Lipid compositions (Mol%) are shown as means ± standard deviation and were extracted via the protein precipitation liquid extraction protocol (chloroform: methanol: acetone, ~7:3:4). Diet one: 3.6% beef tallow; diet two: 6.3% beef tallow; diet three: 9.0% beef tallow; diet four: 11.7% beef tallow.
, gradient: 0.0604 ± 0.00203, R2 = 0.998, slope significance p-value: 0.0011) and the total even chain lipids (symbol: , trendline: , gradient: −0.0604 ± 0.00203, R2 = 0.998, slope significance p-value: 0.0011) across the four high-fat diets in Sprague–Dawley rats (n = 8–9 per group). Lipid compositions (Mol%) are shown as means ± standard deviation and were extracted via the protein precipitation liquid extraction protocol (chloroform: methanol: acetone, ~7:3:4). Diet one: 3.6% beef tallow; diet two: 6.3% beef tallow; diet three: 9.0% beef tallow; diet four: 11.7% beef tallow.
, gradient: −0.0604 ± 0.00203, R2 = 0.998, slope significance p-value: 0.0011) across the four high-fat diets in Sprague–Dawley rats (n = 8–9 per group). Lipid compositions (Mol%) are shown as means ± standard deviation and were extracted via the protein precipitation liquid extraction protocol (chloroform: methanol: acetone, ~7:3:4). Diet one: 3.6% beef tallow; diet two: 6.3% beef tallow; diet three: 9.0% beef tallow; diet four: 11.7% beef tallow.
, gradient: 0.0604 ± 0.00203, R2 = 0.998, slope significance p-value: 0.0011) and the total even chain lipids (symbol: , trendline: , gradient: −0.0604 ± 0.00203, R2 = 0.998, slope significance p-value: 0.0011) across the four high-fat diets in Sprague–Dawley rats (n = 8–9 per group). Lipid compositions (Mol%) are shown as means ± standard deviation and were extracted via the protein precipitation liquid extraction protocol (chloroform: methanol: acetone, ~7:3:4). Diet one: 3.6% beef tallow; diet two: 6.3% beef tallow; diet three: 9.0% beef tallow; diet four: 11.7% beef tallow.


| Diet 1 | Diet 2 | Diet 3 | Diet 4 | Trendline Equation | R2 | Successive Change Across Groups | |
|---|---|---|---|---|---|---|---|
| Carn_(C00:0) | 99,100 ± 19,200 | 90,200 ± 38,800 | 126,000 ± 29,000 | 92,400 ± 49,600 | y = 581x + 97,500 | 0.02 | |
| Carn_(C02:0) | 10,400 ± 4150 | 10,700 ± 3280 | 12,900 ± 6740 | 11,700 ± 5300 | y = 226x + 9700 | 0.49 | |
| Carn_(C03:0) | 3430 ± 1380 | 3590 ± 1820 | 3760 ± 2170 | 3830 ± 2240 | y = 50.7x + 3260 * | 0.97 | Increasing |
| Carn_(C03:0-2COOH) | 713 ± 326 | 436 ± 299 | 943 ± 438 | 700 ± 604 | y = 17.3x + 565 | 0.08 | |
| Carn_(C03:0-OH) | ND ± ND | 1.46 ± 4.39 | 2.1 ± 5.94 | 6.16 ± 13 | y = 0.87x − 4.59 | 0.85 | |
| Carn_(C03:1) | 108 ± 64.2 | 105 ± 58.2 | 101 ± 75.6 | 75.5 ± 35.3 | y = −3.76x + 126 | 0.78 | Decreasing |
| Carn_(C04:0) | 1040 ± 847 | 675 ± 342 | 1560 ± 659 | 793 ± 309 | y = 5.33x + 976 | 0.00 | |
| Carn_(C04:0-OH) | 952 ± 429 | 702 ± 503 | 1730 ± 944 | 1230 ± 619 | y = 69x + 626 | 0.30 | |
| Carn_(C04:1) | 134 ± 56 | 102 ± 94.4 | 89.6 ± 63.3 | 104 ± 78.4 | y = −3.79x + 136 | 0.49 | |
| Carn_(C05:0) | 490 ± 534 | 359 ± 173 | 857 ± 577 | 553 ± 437 | y = 25.4x + 370 | 0.18 | |
| Carn_(C05:1) | 319 ± 125 | 255 ± 87.3 | 317 ± 205 | 227 ± 99.5 | y = −7.93x + 340 | 0.36 | |
| Carn_(C06:0) | 324 ± 287 | 183 ± 61.5 | 635 ± 296 | 234 ± 123 | y = 6.74x + 292 | 0.01 | |
| Carn_(C06:0-2COOH) | 511 ± 145 | 362 ± 124 | 742 ± 246 | 477 ± 213 | y = 10.3x + 444 | 0.05 | |
| Carn_(C08:0) | 168 ± 174 | 107 ± 66.6 | 412 ± 185 | 186 ± 215 | y = 13.3x + 117 | 0.12 | |
| Carn_(C08:1) | 81.7 ± 50.9 | 102 ± 56.5 | 124 ± 54.8 | 88.3 ± 62.7 | y = 1.55x + 87.2 | 0.08 | |
| Carn_(C10:0-2COOH) | 353 ± 178 | 361 ± 124 | 378 ± 146 | 296 ± 177 | y = −5.7x + 391 | 0.31 | |
| Carn_(C12:0) | 0.265 ± 0.339 | 0.147 ± 0.353 | 0.495 ± 0.291 | 0.412 ± 0.402 | y = 0.0292x + 0.106 | 0.43 | |
| Carn_(C14:0) | 11.1 ± 6.52 | 9.39 ± 8.48 | 14.8 ± 5.36 | 13 ± 5.69 | y = 0.411x + 8.92 | 0.38 | |
| Carn_(C15:0) | 4.33 ± 2.64 | 3.76 ± 2.87 | 4.88 ± 1.52 | 3.65 ± 0.927 | y = −0.0341x + 4.42 | 0.04 | |
| Carn_(C16:0) | 618 ± 339 | 457 ± 315 | 739 ± 411 | 462 ± 226 | y = −6.89x + 622 | 0.03 | |
| Carn_(C16:0-OH) | 1.2 ± 1.56 | 1.52 ± 1.98 | 1.61 ± 1.35 | 2.46 ± 2.18 | y = 0.143x + 0.601 | 0.86 | Increasing |
| Carn_(C16:2) | 9.89 ± 7.09 | 9.69 ± 4.49 | 7.61 ± 4.01 | 10.9 ± 4.92 | y = 0.0352x + 9.25 | 0.01 | |
| Carn_(C17:0) | 19.2 ± 8.93 | 13.9 ± 6.7 | 22.3 ± 9.04 | 18.4 ± 7.41 | y = 0.222x + 16.8 | 0.05 | |
| Carn_(C18:0) | 627 ± 220 | 541 ± 170 | 656 ± 154 | 620 ± 221 | y = 3.48x + 584 | 0.06 | |
| Carn_(C18:0-OH) | 5.47 ± 3.31 | 6.8 ± 3.5 | 5.41 ± 4.18 | 8.14 ± 4.52 | y = 0.245x + 4.58 | 0.44 | |
| Carn_(C18:1) | 1530 ± 1090 | 1230 ± 931 | 1900 ± 958 | 1130 ± 449 | y = −19.6x + 1600 | 0.04 | |
| Carn_(C18:2) | 824 ± 754 | 631 ± 525 | 374 ± 157 | 505 ± 259 | y = −45x + 927 | 0.67 | |
| Carn_(C18:3) | 16.8 ± 16.4 | 14.7 ± 13.3 | 11.5 ± 6.38 | 14.8 ± 5.16 | y = −0.341x + 17.1 | 0.29 | |
| Carn_(C20:0) | 43.1 ± 38.9 | 41.9 ± 28.2 | 32.5 ± 20.4 | 45.9 ± 22.9 | y = −0.037x + 41.1 | 0.00 | |
| Carn_(C22:5) | 2.6 ± 3.13 | 2.34 ± 2.81 | 1.7 ± 1.25 | 1.66 ± 1.06 | y = −0.128x + 3.06 * | 0.91 | Decreasing |
| Cer_(32:1) | 5.17 ± 1.26 | 4.31 ± 0.783 | 5.34 ± 1.78 | 5.4 ± 1.75 | y = 0.0637x + 4.57 | 0.19 | |
| Cer_(33:1) | 2.29 ± 1.92 | 1.68 ± 1.26 | 1.48 ± 0.544 | 1.27 ± 0.925 | y = −0.121x + 2.6 * | 0.92 | Decreasing |
| Cer_(34:0) | 0.918 ± 0.57 | 1.19 ± 1.13 | 2.53 ± 2.19 | 1.93 ± 1.51 | y = 0.162x + 0.402 | 0.60 | |
| Cer_(34:1) | 1.49 ± 0.581 | 1.23 ± 0.881 | 1.79 ± 1.01 | 2.56 ± 0.989 | y = 0.14x + 0.699 | 0.71 | |
| Cer_(35:0) | ND ± ND | ND ± ND | 0.0674 ± 0.191 | ND ± ND | |||
| Cer_(35:1) | 1.03 ± 1.06 | 1.61 ± 1.06 | 1.63 ± 1.08 | 2.16 ± 1.45 | y = 0.126x + 0.641 * | 0.91 | Increasing |
| Cer_(36:0) | 7.26 ± 2.79 | 9.98 ± 5.3 | 10.5 ± 4.07 | 13.1 ± 2.89 | y = 0.668x + 5.1 * | 0.95 | Increasing |
| Cer_(36:1) | 54.5 ± 26.2 | 55.4 ± 10.4 | 59.7 ± 16.3 | 71.7 ± 24.5 | y = 2.07x + 44.5 | 0.83 | Increasing |
| Cer_(36:2) | 6.59 ± 3.55 | 5.23 ± 1.18 | 5.94 ± 2.23 | 6.81 ± 3.13 | y = 0.0507x + 5.75 | 0.06 | |
| Cer_(37:1) | 2.23 ± 0.767 | 1.9 ± 0.723 | 2.31 ± 0.772 | 4.23 ± 1.09 | y = 0.237x + 0.851 | 0.61 | |
| Cer_(37:2) | ND ± ND | ND ± ND | 0.066 ± 0.187 | ND ± ND | |||
| Cer_(38:0) | 2.14 ± 1.19 | 3.82 ± 3.78 | 2.1 ± 0.715 | 2.9 ± 0.626 | y = 0.0207x + 2.58 | 0.01 | |
| Cer_(38:1) | 47.9 ± 18.8 | 34.1 ± 7.21 | 39.5 ± 10.3 | 56 ± 13 | y = 1.1x + 36 | 0.16 | |
| Cer_(38:2) | 6.76 ± 3.87 | 4.76 ± 1.57 | 4.7 ± 0.967 | 8.02 ± 1.98 | y = 0.138x + 5.01 | 0.09 | |
| Cer_(39:0) | 0.188 ± 0.0814 | 0.221 ± 0.149 | 0.243 ± 0.153 | 0.724 ± 0.454 | y = 0.0604x − 0.118 | 0.68 | Increasing |
| Cer_(39:1) | 10.5 ± 3.44 | 8.36 ± 1.6 | 10.6 ± 1.62 | 20.3 ± 3.17 | y = 1.17x + 3.48 | 0.58 | |
| Cer_(39:2) | 0.436 ± 0.447 | 0.332 ± 0.333 | 0.416 ± 0.342 | 1.65 ± 0.755 | y = 0.138x − 0.347 | 0.58 | |
| Cer_(40:0) | 3.71 ± 0.85 | 4.12 ± 0.933 | 4.74 ± 1.44 | 6.17 ± 0.98 | y = 0.296x + 2.42 * | 0.92 | Increasing |
| Cer_(40:1) | 126 ± 37.9 | 116 ± 18.7 | 146 ± 51 | 227 ± 39.1 | y = 12.3x + 59.4 | 0.73 | |
| Cer_(40:2) | 65.5 ± 24.7 | 50.8 ± 8.2 | 63 ± 13.4 | 105 ± 12.7 | y = 4.84x + 34 | 0.52 | |
| Cer_(41:0) | 2.95 ± 0.547 | 3.91 ± 1.03 | 4.94 ± 1.2 | 7.37 ± 1.36 | y = 0.529x + 0.744 * | 0.94 | Increasing |
| Cer_(41:1) | 72.1 ± 18.6 | 89.7 ± 20.4 | 130 ± 88.3 | 210 ± 48.4 | y = 16.8x − 3.18 * | 0.91 | Increasing |
| Cer_(41:2) | 51.4 ± 19.1 | 49.6 ± 11.4 | 63.3 ± 6.75 | 144 ± 22.5 | y = 10.8x − 5.52 | 0.70 | |
| Cer_(42:0) | 6.21 ± 2.01 | 8.11 ± 2.54 | 11.5 ± 5.17 | 12.2 ± 3.76 | y = 0.791x + 3.45 * | 0.95 | Increasing |
| Cer_(42:1) | 310 ± 63.3 | 444 ± 130 | 624 ± 539 | 773 ± 305 | y = 58.1x + 93.2 * | 1.00 | Increasing |
| Cer_(42:2) | 575 ± 161 | 599 ± 87.4 | 721 ± 120 | 1180 ± 187 | y = 71.7x + 220 | 0.79 | Increasing |
| Cer_(42:3) | 105 ± 40.2 | 92 ± 19.5 | 103 ± 26.1 | 151 ± 16.5 | y = 5.52x + 70.5 | 0.54 | |
| Cer_(43:0) | 1.31 ± 0.425 | 2.05 ± 0.699 | 2.43 ± 0.806 | 3.07 ± 0.982 | y = 0.21x + 0.611 * | 0.99 | Increasing |
| Cer_(43:1) | 131 ± 31.2 | 218 ± 62.9 | 253 ± 87.4 | 396 ± 111 | y = 30.7x + 14.3 * | 0.94 | Increasing |
| Cer_(43:2) | 42.9 ± 7.62 | 58.9 ± 11.9 | 64.2 ± 12.8 | 115 ± 17.2 | y = 8.21x + 7.46 | 0.84 | Increasing |
| Cer_(44:1) | 16.7 ± 4.31 | 28.5 ± 8.34 | 38.9 ± 26.1 | 43 ± 14.8 | y = 3.31x + 6.47 * | 0.96 | Increasing |
| Cer_(44:2) | 0.908 ± 0.271 | 1.19 ± 0.288 | 1.72 ± 1.08 | 2.08 ± 0.644 | y = 0.15x + 0.328 * | 0.99 | Increasing |
| Cer_(45:1) | 0.46 ± 0.215 | 1.19 ± 0.531 | 1.32 ± 0.618 | 1.58 ± 0.746 | y = 0.129x + 0.149 | 0.88 | Increasing |
| Cer_(45:2) | ND ± ND | 0.00348 ± 0.0104 | 0.00503 ± 0.0142 | ND ± ND | y = 0.000574x − 0.000137 | 1.00 | |
| Cer_(46:1) | 0.0023 ± 0.0069 | 0.0192 ± 0.0266 | 0.0409 ± 0.0568 | 0.0568 ± 0.0824 | y = 0.00686x − 0.0227 * | 1.00 | Increasing |
| Cer_(46:2) | 0.83 ± 0.187 | 1.53 ± 0.439 | 1.57 ± 0.516 | 1.79 ± 0.679 | y = 0.108x + 0.603 | 0.82 | Increasing |
| CL_(66:02) | 8.65 ± 6.02 | 22.3 ± 17.1 | 32.3 ± 17.1 | 37.7 ± 31.3 | y = 3.6x − 2.29 * | 0.97 | Increasing |
| CL_(66:03) | 15.8 ± 10.1 | 23.6 ± 16.4 | 24.2 ± 13.2 | 17.3 ± 8.8 | y = 0.189x + 18.8 | 0.02 | |
| CL_(66:04) | 15.5 ± 10.7 | 21.8 ± 10.4 | 29.7 ± 16.7 | 27 ± 15.3 | y = 1.57x + 11.5 | 0.76 | |
| CL_(66:05) | 40.5 ± 20 | 39.1 ± 10.7 | 18.5 ± 10.3 | 1 ± 0.911 | y = −5.15x + 64.2 * | 0.92 | Decreasing |
| CL_(66:06) | 66.1 ± 37 | 67.9 ± 26.4 | 65.1 ± 38.1 | 22.6 ± 13.2 | y = −4.94x + 93.2 | 0.62 | |
| CL_(67:02) | 4.6 ± 5.88 | 15.8 ± 13.3 | 11.3 ± 6.02 | 10.1 ± 10 | y = 0.444x + 7.05 | 0.11 | |
| CL_(67:03) | 13.4 ± 9.85 | 22.4 ± 14 | 14.1 ± 6.36 | 5.97 ± 4.69 | y = −1.13x + 22.6 | 0.35 | |
| CL_(67:05) | 0.848 ± 1.74 | 1.4 ± 2.57 | 2.58 ± 2.02 | 3.16 ± 1.62 | y = 0.301x − 0.303 * | 0.98 | Increasing |
| CL_(68:00) | 0.484 ± 0.502 | 0.898 ± 1.1 | 0.998 ± 1.12 | 0.519 ± 1.01 | y = 0.00759x + 0.667 | 0.01 | |
| CL_(68:01) | 105 ± 91.1 | 260 ± 222 | 190 ± 107 | 142 ± 163 | y = 1.52x + 163 | 0.01 | |
| CL_(68:02) | 469 ± 385 | 1010 ± 799 | 664 ± 355 | 434 ± 480 | y = −16.7x + 772 | 0.05 | |
| CL_(68:03) | 631 ± 421 | 1030 ± 670 | 560 ± 261 | 237 ± 199 | y = −61.2x + 1080 | 0.43 | |
| CL_(68:04) | 367 ± 179 | 439 ± 197 | 294 ± 113 | 184 ± 112 | y = −25.7x + 518 | 0.68 | |
| CL_(69:04) | 40.4 ± 31.9 | 66.9 ± 41.7 | 56.3 ± 27.3 | 28.8 ± 18.6 | y = −1.68x + 61 | 0.12 | |
| CL_(69:05) | 64.8 ± 37.5 | 67.7 ± 29.7 | 51.2 ± 20.4 | 31.1 ± 15.2 | y = −4.36x + 87 | 0.83 | |
| CL_(69:06) | 49.7 ± 32.3 | 49.7 ± 20.5 | 29.3 ± 11 | 25.1 ± 10.8 | y = −3.49x + 65.1 | 0.86 | |
| CL_(69:07) | 0.245 ± 0.736 | 1.06 ± 0.942 | 1.33 ± 1.17 | 0.685 ± 0.79 | y = 0.0589x + 0.38 | 0.19 | |
| CL_(70:01) | 1.45 ± 1.87 | 6.38 ± 7.09 | 4.32 ± 2.94 | 3.91 ± 5.53 | y = 0.197x + 2.51 | 0.12 | |
| CL_(70:02) | 61.2 ± 59.7 | 102 ± 90.1 | 54.6 ± 31.2 | 33.4 ± 40.7 | y = −4.84x + 99.9 | 0.35 | |
| CL_(70:03) | 470 ± 379 | 796 ± 600 | 559 ± 271 | 340 ± 303 | y = −23.2x + 719 | 0.18 | |
| CL_(70:04) | 1270 ± 814 | 2010 ± 1300 | 1510 ± 656 | 950 ± 761 | y = −54.1x + 1850 | 0.18 | |
| CL_(70:05) | 1770 ± 889 | 2210 ± 1060 | 1670 ± 641 | 1200 ± 780 | y = −83.3x + 2350 | 0.49 | |
| CL_(70:06) | 1280 ± 629 | 1570 ± 595 | 1560 ± 688 | 1440 ± 897 | y = 17.4x + 1330 | 0.20 | |
| CL_(70:07) | 882 ± 480 | 1110 ± 399 | 1210 ± 657 | 971 ± 551 | y = 13.6x + 939 | 0.11 | |
| CL_(70:08) | 256 ± 199 | 245 ± 108 | 147 ± 56.7 | 89.7 ± 52.6 | y = −22.1x + 354 * | 0.93 | Decreasing |
| CL_(70:09) | 25.8 ± 18.3 | 27.1 ± 13.6 | 17.7 ± 8.62 | 14.1 ± 7.15 | y = −1.65x + 33.8 | 0.83 | |
| CL_(71:02) | 0.744 ± 1.36 | 2.59 ± 3 | 1.41 ± 1.38 | 0.451 ± 0.714 | y = −0.0763x + 1.88 | 0.08 | |
| CL_(71:03) | 7.35 ± 7.45 | 20.2 ± 18.2 | 18.2 ± 11 | 9.9 ± 8.38 | y = 0.209x + 12.3 | 0.01 | |
| CL_(71:04) | 19.5 ± 12.7 | 51.1 ± 39.5 | 65.7 ± 41.9 | 43 ± 33 | y = 3.15x + 20.7 | 0.32 | |
| CL_(71:05) | 56.9 ± 35 | 116 ± 76.6 | 130 ± 56.9 | 107 ± 69.8 | y = 6.09x + 55.9 | 0.44 | |
| CL_(71:06) | 106 ± 65.4 | 164 ± 78.1 | 192 ± 74.8 | 164 ± 88.4 | y = 7.48x + 99.3 | 0.52 | |
| CL_(71:07) | 76.3 ± 55.8 | 104 ± 37.6 | 120 ± 42.8 | 101 ± 54.8 | y = 3.34x + 74.8 | 0.41 | |
| CL_(71:08) | 23.9 ± 25.3 | 17.1 ± 6.59 | 5.98 ± 4.09 | 0.44 ± 0.928 | y = −3.02x + 34.9 * | 0.98 | Decreasing |
| CL_(72:01) | 0.251 ± 0.441 | 1.36 ± 1.4 | 0.758 ± 0.648 | 0.825 ± 1.56 | y = 0.0415x + 0.481 | 0.10 | |
| CL_(72:02) | 0.874 ± 1.29 | 10.3 ± 12.3 | 4.1 ± 2.73 | 4.24 ± 7.52 | y = 0.144x + 3.77 | 0.02 | |
| CL_(72:03) | 22.6 ± 21.7 | 55.2 ± 54.7 | 23.4 ± 12.2 | 17.9 ± 25 | y = −1.7x + 42.8 | 0.12 | |
| CL_(72:04) | 246 ± 202 | 374 ± 291 | 228 ± 110 | 237 ± 229 | y = −6.41x + 320 | 0.11 | |
| CL_(72:05) | 2310 ± 1300 | 3190 ± 1750 | 2650 ± 1080 | 2000 ± 1500 | y = −54.4x + 2950 | 0.14 | |
| CL_(72:06) | 10,800 ± 5640 | 12,200 ± 4950 | 9770 ± 3660 | 5820 ± 3810 | y = −643x + 14,600 | 0.67 | |
| CL_(72:07) | 28,500 ± 15,500 | 25,400 ± 6760 | 17,100 ± 6180 | 7210 ± 4430 | y = −2670x + 40,000 * | 0.96 | Decreasing |
| CL_(72:08) | 31,100 ± 17,500 | 24,200 ± 5090 | 13,800 ± 4820 | 4420 ± 2860 | y = −3350x + 44,000 * | 0.99 | Decreasing |
| CL_(72:09) | 1280 ± 774 | 1150 ± 378 | 798 ± 339 | 456 ± 284 | y = −105x + 1720 * | 0.97 | Decreasing |
| CL_(72:10) | 66.9 ± 45.2 | 62.8 ± 21.4 | 62 ± 40.5 | 70.8 ± 37.4 | y = 0.404x + 62.5 | 0.12 | |
| CL_(74:06) | 1080 ± 745 | 930 ± 448 | 489 ± 203 | 395 ± 366 | y = −92.4x + 1430 * | 0.94 | Decreasing |
| CL_(74:07) | 4550 ± 2900 | 3350 ± 1190 | 2000 ± 712 | 1650 ± 1280 | y = −372x + 5740 * | 0.95 | Decreasing |
| CL_(74:08) | 8200 ± 4930 | 6210 ± 1800 | 4510 ± 1460 | 3490 ± 2360 | y = −586x + 10,100 * | 0.98 | Decreasing |
| CL_(74:09) | 7180 ± 3960 | 6480 ± 1830 | 5090 ± 1530 | 3460 ± 2210 | y = −465x + 9110 * | 0.97 | Decreasing |
| CL_(74:10) | 3980 ± 2390 | 3050 ± 652 | 1860 ± 595 | 1030 ± 673 | y = −372x + 5320 * | 1.00 | Decreasing |
| CL_(74:11) | 1240 ± 707 | 784 ± 177 | 454 ± 136 | 284 ± 181 | y = −118x + 1600 * | 0.96 | Decreasing |
| CL_(76:09) | 802 ± 495 | 560 ± 202 | 416 ± 152 | 633 ± 566 | y = −24.1x + 787 | 0.27 | |
| CL_(76:10) | 1300 ± 724 | 974 ± 335 | 723 ± 242 | 960 ± 768 | y = −47.1x + 1350 | 0.48 | |
| CL_(76:11) | 1580 ± 894 | 1140 ± 399 | 678 ± 217 | 710 ± 530 | y = −114x + 1900 | 0.87 | |
| CL_(76:12) | 1200 ± 704 | 925 ± 337 | 513 ± 163 | 441 ± 328 | y = −99.6x + 1530 * | 0.94 | Decreasing |
| DG_(32:0) | 194 ± 108 | 64.5 ± 72.4 | 75.8 ± 122 | 99.9 ± 108 | y = −10x + 185 | 0.35 | |
| DG_(34:0) | 84.3 ± 167 | 48.3 ± 145 | ND ± ND | ND ± ND | y = -13.3x + 132 | 1.00 | |
| DG_(34:1) | 6950 ± 4570 | 3290 ± 1420 | 3300 ± 1600 | 4690 ± 4060 | y = −251x + 6480 | 0.26 | |
| GM1_(34:0) | 1.47 ± 1.39 | 5.46 ± 4.45 | 4.11 ± 4.43 | 3.26 ± 2.36 | y = 0.149x + 2.44 | 0.10 | |
| GM1_(34:1) | 4.89 ± 3.76 | 15.3 ± 11.1 | 10.6 ± 9.26 | 9.27 ± 6.24 | y = 0.313x + 7.62 | 0.06 | |
| GM1_(34:1-OH) | 0.054 ± 0.0451 | 0.0988 ± 0.0944 | 0.0491 ± 0.0531 | 0.0338 ± 0.0588 | y = −0.00409x + 0.0902 | 0.26 | |
| GM1_(36:0) | ND ± ND | 0.0285 ± 0.0603 | ND ± ND | ND ± ND | |||
| GM1_(36:1) | ND ± ND | 0.157 ± 0.356 | 0.125 ± 0.158 | 0.152 ± 0.285 | y = −0.000926x + 0.153 | 0.02 | |
| Hex-Cer_(32:0) | 0.578 ± 0.44 | 0.383 ± 0.558 | 0.199 ± 0.291 | 0.332 ± 0.324 | y = −0.0341x + 0.634 | 0.57 | |
| Hex-Cer_(32:1) | ND ± ND | 0.0486 ± 0.104 | 0.0269 ± 0.076 | 0.0396 ± 0.112 | y = −0.00167x + 0.0534 | 0.17 | |
| Hex-Cer_(34:0-OH) | 0.0882 ± 0.264 | 0.0548 ± 0.164 | 0.0611 ± 0.173 | ND ± ND | y = −0.00502x + 0.0997 | 0.58 | |
| Hex-Cer_(34:1) | 0.565 ± 0.791 | 1.27 ± 1.2 | 1.74 ± 1.87 | 4.68 ± 1.85 | y = 0.475x − 1.57 | 0.84 | Increasing |
| Hex-Cer_(34:1-OH) | 0.295 ± 0.719 | ND ± ND | 0.0372 ± 0.105 | 0.208 ± 0.587 | y = −0.016x + 0.31 | 0.25 | |
| Hex-Cer_(34:2) | 0.32 ± 0.418 | 0.318 ± 0.598 | ND ± ND | 0.424 ± 1.2 | y = 0.0138x + 0.255 | 0.88 | |
| Hex-Cer_(34:2-OH) | 0.614 ± 0.37 | 0.518 ± 0.375 | 0.39 ± 0.512 | 0.306 ± 0.488 | y = −0.039x + 0.755 * | 0.99 | Decreasing |
| Hex-Cer_(35:0) | 0.0425 ± 0.127 | ND ± ND | 0.663 ± 0.389 | 1.37 ± 1.56 | y = 0.157x − 0.579 | 0.95 | |
| Hex-Cer_(35:1) | 0.551 ± 0.625 | 0.649 ± 0.567 | 1.03 ± 0.58 | 1.66 ± 1.57 | y = 0.137x − 0.0781 * | 0.91 | Increasing |
| Hex-Cer_(36:0-OH) | 2.03 ± 1.06 | 2.58 ± 2.01 | 3.51 ± 1.07 | 4.75 ± 2.01 | y = 0.337x + 0.642 * | 0.97 | Increasing |
| Hex-Cer_(36:1) | 0.235 ± 0.413 | ND ± ND | 0.688 ± 0.661 | 0.264 ± 0.491 | y = 0.0151x + 0.274 | 0.06 | |
| Hex-Cer_(36:2) | ND ± ND | 0.0816 ± 0.245 | 0.289 ± 0.574 | 0.638 ± 0.942 | y = 0.103x − 0.591 | 0.98 | |
| Hex-Cer_(37:0) | ND ± ND | 0.0835 ± 0.167 | 0.0639 ± 0.181 | 0.151 ± 0.295 | y = 0.0125x − 0.013 | 0.55 | |
| Hex-Cer_(37:0-OH) | 9.56 ± 9.47 | 14.3 ± 11.8 | 38 ± 31.6 | 80.1 ± 67.3 | y = 8.72x − 31.2 | 0.89 | Increasing |
| Hex-Cer_(37:1) | 0.0494 ± 0.148 | 0.167 ± 0.252 | 0.0497 ± 0.141 | ND ± ND | y = 0.0000556x + 0.0884 | 0.00 | |
| Hex-Cer_(37:2) | 2.12 ± 2.98 | 3.57 ± 5.06 | 0.717 ± 2.03 | 0.957 ± 2.02 | y = −0.235x + 3.64 | 0.39 | |
| Hex-Cer_(38:0-OH) | ND ± ND | 3.91 ± 5.51 | 2.8 ± 4.29 | 7.46 ± 8.35 | y = 0.657x − 1.19 | 0.53 | |
| Hex-Cer_(38:1) | 14.8 ± 16 | 13.4 ± 12.3 | 22.6 ± 25.1 | 32.2 ± 25.2 | y = 2.27x + 3.35 | 0.84 | |
| Hex-Cer_(38:2) | 0.569 ± 0.899 | 2.09 ± 1.23 | 1.81 ± 1.58 | 0.813 ± 0.906 | y = 0.0167x + 1.19 | 0.01 | |
| Hex-Cer_(39:0-OH) | 5.62 ± 3.39 | 2.48 ± 3.2 | 4.86 ± 13.8 | 19.3 ± 21.8 | y = 1.61x − 4.24 | 0.54 | |
| Hex-Cer_(39:2) | 20.7 ± 4.71 | 21.6 ± 7.5 | 24.1 ± 7.77 | 32.5 ± 7.01 | y = 1.4x + 14 | 0.83 | Increasing |
| Hex-Cer_(40:0) | 10.1 ± 12.2 | 9.47 ± 10 | 15.5 ± 15 | 19.7 ± 9.5 | y = 1.29x + 3.82 | 0.87 | |
| Hex-Cer_(40:0-OH) | ND ± ND | 5 ± 15 | ND ± ND | ND ± ND | |||
| Hex-Cer_(40:1) | 174 ± 204 | 221 ± 120 | 275 ± 249 | 403 ± 206 | y = 27.4x + 58.3 * | 0.94 | Increasing |
| Hex-Cer_(40:1-OH) | 7.04 ± 2.48 | 6.38 ± 2.94 | 7.95 ± 2.57 | 5.14 ± 1.51 | y = −0.153x + 7.8 | 0.20 | |
| Hex-Cer_(40:2) | 0.266 ± 0.178 | 0.854 ± 0.804 | 0.806 ± 1.66 | 0.672 ± 1.21 | y = 0.0433x + 0.318 | 0.32 | |
| Hex-Cer_(40:2-OH) | 2.1 ± 1.32 | 2.17 ± 0.891 | 2.76 ± 1.9 | 1.86 ± 1.91 | y = −0.00481x + 2.26 | 0.00 | |
| Hex-Cer_(41:0-OH) | 23.9 ± 8.7 | 33 ± 10.5 | 26.8 ± 4.88 | 20.1 ± 7.48 | y = −0.652x + 30.9 | 0.17 | |
| Hex-Cer_(41:1) | 4.01 ± 1.31 | 5.78 ± 1.62 | 7.62 ± 3.75 | 17.7 ± 5.68 | y = 1.59x − 3.38 | 0.82 | Increasing |
| Hex-Cer_(41:2) | 4.6 ± 1.03 | 4.78 ± 1.62 | 3.34 ± 1.5 | 3.71 ± 1.89 | y = −0.152x + 5.27 | 0.59 | |
| Hex-Cer_(42:0) | 0.394 ± 0.271 | 0.329 ± 0.289 | 0.466 ± 0.227 | 0.705 ± 0.432 | y = 0.0396x + 0.17 | 0.71 | |
| Hex-Cer_(42:0-OH) | 21.8 ± 14.5 | 21.3 ± 6.34 | 30.3 ± 20.7 | 34.6 ± 14.3 | y = 1.76x + 13.6 | 0.88 | |
| Hex-Cer_(42:1) | 14.1 ± 4.31 | 20.5 ± 5.26 | 22.5 ± 10.5 | 34.5 ± 12.3 | y = 2.34x + 4.99 * | 0.92 | Increasing |
| Hex-Cer_(42:2) | 7.61 ± 2.29 | 11.3 ± 3.91 | 14.3 ± 7.05 | 23.1 ± 7.39 | y = 1.83x + 0.061 * | 0.93 | Increasing |
| Hex-Cer_(42:2-OH) | 4.99 ± 1.66 | 5.86 ± 2.35 | 5.19 ± 1.86 | 7.37 ± 3.43 | y = 0.24x + 4.02 | 0.60 | |
| Hex-Cer_(43:0) | 0.0149 ± 0.0296 | 0.0155 ± 0.0308 | 0.145 ± 0.175 | 0.129 ± 0.153 | y = 0.0175x − 0.0576 | 0.74 | |
| Hex-Cer_(43:0-OH) | 0.416 ± 0.255 | 0.583 ± 0.36 | 0.338 ± 0.18 | 0.32 ± 0.277 | y = −0.0197x + 0.565 | 0.33 | |
| Hex-Cer_(43:1) | 1.69 ± 0.642 | 3.13 ± 1.14 | 3.47 ± 1.46 | 7.28 ± 2.91 | y = 0.634x − 0.955 | 0.86 | Increasing |
| Hex-Cer_(43:2) | 0.866 ± 0.212 | 0.858 ± 0.321 | 0.799 ± 0.314 | 1.24 ± 0.718 | y = 0.0394x + 0.64 | 0.46 | |
| LPC_(14:0) | 1.4 ± 0.645 | 1.58 ± 0.732 | 2.09 ± 0.96 | 2.96 ± 1.34 | y = 0.192x + 0.537 * | 0.92 | Increasing |
| LPC_(15:0) | 6.02 ± 1.49 | 7.53 ± 2.48 | 7.69 ± 2.62 | 8.38 ± 2.62 | y = 0.268x + 5.35 | 0.88 | Increasing |
| LPC_(16:0) | 1430 ± 246 | 1560 ± 272 | 1690 ± 300 | 1900 ± 427 | y = 57x + 1210 * | 0.98 | Increasing |
| LPC_(16:1) | 8.56 ± 4.67 | 11.3 ± 6.3 | 19.6 ± 8.38 | 33.1 ± 10.5 | y = 3.03x − 5.07 * | 0.92 | Increasing |
| LPC_(17:0) | 64.5 ± 10.8 | 72.2 ± 13.1 | 74.9 ± 11.2 | 75.6 ± 27.5 | y = 1.33x + 61.6 | 0.84 | Increasing |
| LPC_(17:1) | 0.395 ± 0.314 | 0.576 ± 0.537 | 2.2 ± 1.09 | 6.08 ± 1.62 | y = 0.692x − 2.98 | 0.83 | Increasing |
| LPC_(18:0) | 3720 ± 504 | 3550 ± 634 | 3450 ± 619 | 3300 ± 520 | y = −50.4x + 3890 * | 0.99 | Decreasing |
| LPC_(18:1) | 252 ± 47.9 | 247 ± 56.4 | 332 ± 51.2 | 549 ± 121 | y = 36.1x + 68.5 | 0.79 | |
| LPC_(18:2) | 266 ± 52.6 | 232 ± 46.8 | 217 ± 19.7 | 198 ± 38.2 | y = −8.11x + 290 * | 0.97 | Decreasing |
| LPC_(18:3) | 80 ± 15.2 | 88.6 ± 22.2 | 93 ± 19.4 | 102 ± 22.5 | y = 2.61x + 71 * | 0.98 | Increasing |
| LPC_(18:4) | 0.515 ± 0.37 | 0.758 ± 0.481 | 1.45 ± 0.744 | 3.08 ± 1.42 | y = 0.311x − 0.926 | 0.88 | Increasing |
| LPC_(19:0) | 47.8 ± 5.54 | 37.7 ± 12.1 | 36.2 ± 8.19 | 40.1 ± 12.9 | y = −0.911x + 47.4 | 0.38 | |
| LPC_(20:0) | 45.5 ± 12 | 29 ± 9.84 | 22.8 ± 4.24 | 18.5 ± 5.39 | y = −3.23x + 53.7 * | 0.90 | Decreasing |
| LPC_(20:4) | 344 ± 121 | 289 ± 32.6 | 288 ± 82.8 | 282 ± 53.7 | y = −6.93x + 354 | 0.69 | Decreasing |
| LPC_(20:5) | 26.9 ± 9.49 | 21.5 ± 4.39 | 20.2 ± 2.89 | 21 ± 5.62 | y = −0.704x + 27.8 | 0.65 | |
| LPC_(21:0) | 1.11 ± 0.227 | 0.89 ± 0.305 | 0.75 ± 0.257 | 0.896 ± 0.324 | y = −0.029x + 1.13 | 0.46 | |
| LPC_(22:4) | 5.12 ± 2.83 | 3.37 ± 0.794 | 3.21 ± 0.909 | 3.52 ± 1 | y = −0.184x + 5.21 | 0.52 | |
| LPC_(22:5) | 12.3 ± 9.44 | 6.01 ± 2.43 | 5.97 ± 2.51 | 9.46 ± 4.97 | y = −0.317x + 10.9 | 0.13 | |
| LPC_(22:6) | 21.1 ± 13 | 14.4 ± 3.33 | 15.4 ± 4.74 | 26.5 ± 5.75 | y = 0.637x + 14.5 | 0.16 | |
| LPE_(16:0) | 9.94 ± 2.69 | 11.4 ± 3.82 | 16.7 ± 4.93 | 25.8 ± 11.7 | y = 1.96x + 0.977 * | 0.91 | Increasing |
| LPE_(16:1) | ND ± ND | 0.0351 ± 0.0709 | 0.0116 ± 0.0329 | 0.177 ± 0.163 | y = 0.0263x − 0.162 | 0.63 | |
| LPE_(17:0) | 0.637 ± 0.392 | 0.724 ± 0.401 | 1.1 ± 0.151 | 1.61 ± 0.982 | y = 0.122x + 0.0842 * | 0.92 | Increasing |
| LPE_(18:0) | 50.7 ± 12.9 | 50.3 ± 14.6 | 57.1 ± 12.6 | 67.7 ± 29.3 | y = 2.14x + 40.1 | 0.84 | |
| LPE_(18:1) | 5.94 ± 1.16 | 4.7 ± 1.21 | 6.6 ± 1.36 | 11 ± 3.41 | y = 0.633x + 2.22 | 0.65 | |
| LPE_(18:2) | 5.04 ± 3.8 | 2.76 ± 1.33 | 2.93 ± 1.15 | 2.42 ± 1.28 | y = −0.285x + 5.47 | 0.70 | |
| LPE_(18:3) | 1.85 ± 0.528 | 2.14 ± 0.76 | 2.96 ± 0.944 | 4.22 ± 1.93 | y = 0.294x + 0.546 * | 0.93 | Increasing |
| LPE_(20:0) | 0.444 ± 0.114 | 0.358 ± 0.169 | 0.31 ± 0.121 | 0.247 ± 0.17 | y = −0.0237x + 0.521 * | 0.99 | Decreasing |
| LPE_(20:3) | 0.472 ± 0.645 | 0.556 ± 0.49 | 0.945 ± 0.831 | 1.49 ± 1.22 | y = 0.128x − 0.11 * | 0.92 | Increasing |
| LPE_(20:4) | 22.9 ± 12.3 | 17.9 ± 4.53 | 20.8 ± 7.66 | 28.6 ± 11.8 | y = 0.741x + 16.9 | 0.33 | |
| LPE_(20:5) | 1.53 ± 1.12 | 0.932 ± 0.388 | 0.827 ± 0.252 | 0.645 ± 0.248 | y = −0.102x + 1.77 | 0.86 | Decreasing |
| LPE_(22:4) | 0.264 ± 0.791 | ND ± ND | 0.0209 ± 0.0389 | 0.35 ± 0.382 | y = 0.00267x + 0.19 | 0.00 | |
| LPI_(16:0) | 64.1 ± 21.4 | 82.6 ± 36.1 | 113 ± 39.7 | 103 ± 45 | y = 5.45x + 49 | 0.76 | |
| LPI_(17:0) | 5.04 ± 3.17 | 6.56 ± 3.13 | 7.63 ± 3.8 | 5.1 ± 4.85 | y = 0.0463x + 5.73 | 0.02 | |
| LPI_(18:0) | 1210 ± 404 | 1510 ± 647 | 1510 ± 376 | 1200 ± 547 | y = −1.11x + 1370 | 0.00 | |
| LPI_(18:1) | 46.2 ± 22.3 | 47.6 ± 17.7 | 57.4 ± 21.6 | 59.5 ± 26.8 | y = 1.84x + 38.6 * | 0.90 | Increasing |
| LPI_(18:2) | 18.9 ± 10.4 | 17.8 ± 8 | 16.9 ± 5.86 | 7.43 ± 4.45 | y = −1.31x + 25.3 | 0.74 | Decreasing |
| LPI_(20:0) | 0.0835 ± 0.1 | ND ± ND | 0.18 ± 0.264 | 0.0895 ± 0.127 | y = 0.00319x + 0.0918 | 0.06 | |
| LPI_(20:2) | 1.7 ± 1.09 | 1.18 ± 1.36 | 1.09 ± 0.93 | 0.661 ± 1.15 | y = −0.119x + 2.07 * | 0.94 | Decreasing |
| LPI_(20:3) | 25.8 ± 14.7 | 47.1 ± 27.2 | 85.6 ± 35.3 | 125 ± 49.4 | y = 12.4x − 24.4 * | 0.98 | Increasing |
| LPI_(20:4) | 288 ± 102 | 453 ± 238 | 447 ± 108 | 360 ± 145 | y = 7.78x + 328 | 0.12 | |
| LPI_(22:4) | 4.72 ± 2.12 | 3.96 ± 2.88 | 4.26 ± 2.1 | 3.26 ± 1.91 | y = −0.151x + 5.21 | 0.74 | |
| LPI_(22:5) | 1.15 ± 1.67 | 1.51 ± 1.76 | 0.418 ± 0.701 | 1.98 ± 1.41 | y = 0.0518x + 0.868 | 0.08 | |
| LPI_(22:6) | 2.06 ± 1.55 | 2.04 ± 1.58 | 0.605 ± 0.968 | 2.65 ± 2.37 | y = 0.0124x + 1.74 | 0.00 | |
| Lyso_CL_(52:01) | 0.698 ± 1.02 | 1.75 ± 1.42 | 1.51 ± 0.755 | 1.99 ± 1.82 | y = 0.135x + 0.457 | 0.70 | |
| Lyso_CL_(52:02) | 11.4 ± 10.4 | 13.7 ± 7.67 | 10.7 ± 4.9 | 12.5 ± 11.6 | y = 0.0111x + 12 | 0.00 | |
| Lyso_CL_(52:03) | 50.5 ± 42.8 | 32.9 ± 12.7 | 18.7 ± 8.32 | 17.2 ± 14.1 | y = −4.23x + 62.2 * | 0.90 | Decreasing |
| Lyso_CL_(52:04) | 30.3 ± 36.6 | 19.7 ± 9.87 | 9.23 ± 4.21 | 10.4 ± 9.01 | y = −2.6x + 37.3 | 0.86 | |
| Lyso_CL_(52:05) | ND ± ND | ND ± ND | ND ± ND | 0.785 ± 1.84 | |||
| Lyso_CL_(53:04) | ND ± ND | 0.154 ± 0.261 | 0.221 ± 0.404 | 1.55 ± 1.72 | y = 0.259x − 1.69 | 0.79 | |
| Lyso_CL_(54:02) | ND ± ND | 0.0851 ± 0.178 | 0.0412 ± 0.117 | 0.655 ± 1.15 | y = 0.106x − 0.689 | 0.69 | |
| Lyso_CL_(54:03) | 24.8 ± 26.6 | 13.2 ± 7.1 | 9.89 ± 3.88 | 19.5 ± 18.6 | y = −0.711x + 22.3 | 0.14 | |
| Lyso_CL_(54:04) | 172 ± 166 | 94.9 ± 32.4 | 67.3 ± 25.2 | 87 ± 72.4 | y = −10.5x + 185 | 0.63 | |
| Lyso_CL_(54:05) | 405 ± 411 | 234 ± 94 | 144 ± 60.4 | 133 ± 104 | y = −33.6x + 486 | 0.87 | Decreasing |
| Lyso_CL_(54:06) | 548 ± 555 | 247 ± 117 | 122 ± 47.8 | 65.7 ± 51.8 | y = −58.2x + 691 | 0.89 | Decreasing |
| Lyso_CL_(56:05) | 42.9 ± 55.3 | 13.1 ± 3.27 | 4.18 ± 2.41 | 13.5 ± 16.1 | y = −3.6x + 45.9 | 0.55 | |
| Lyso_CL_(56:06) | 135 ± 153 | 42.7 ± 13.4 | 20.9 ± 8.33 | 40.2 ± 42.2 | y = −11.3x + 146 | 0.60 | |
| PA_(30:0) | 1.19 ± 2.41 | 2.63 ± 2.77 | 6.15 ± 4.83 | 30 ± 23.7 | y = 3.33x − 15.5 | 0.74 | Increasing |
| PA_(30:1) | 17.2 ± 17.8 | 17.1 ± 11.8 | 20.7 ± 9.98 | 73.9 ± 41.3 | y = 6.43x − 17 | 0.65 | |
| PA_(32:1) | 43.2 ± 46.5 | 56.3 ± 17.7 | 84.6 ± 30.3 | 291 ± 143 | y = 28.6x − 99.9 | 0.74 | Increasing |
| PA_(32:2) | 223 ± 216 | 180 ± 96 | 154 ± 86.4 | 166 ± 70.4 | y = −7.3x + 237 | 0.71 | |
| PA_(34:1) | 387 ± 401 | 402 ± 135 | 538 ± 176 | 1010 ± 307 | y = 74.3x + 16.2 | 0.79 | Increasing |
| PA_(34:2) | 2330 ± 2170 | 1990 ± 756 | 1600 ± 787 | 1230 ± 358 | y = −137x + 2830 * | 1.00 | Decreasing |
| PA_(36:1) | 1440 ± 924 | 1640 ± 435 | 1410 ± 877 | 1240 ± 323 | y = −30.7x + 1670 | 0.43 | |
| PA_(36:2) | 3310 ± 1750 | 2480 ± 918 | 2250 ± 1360 | 1910 ± 1020 | y = −164x + 3740 * | 0.92 | Decreasing |
| PA_(36:4) | 10,300 ± 9970 | 6760 ± 2840 | 7130 ± 3790 | 9580 ± 4540 | y = −66.3x + 8950 | 0.02 | |
| PA_(38:3) | 1390 ± 910 | 1150 ± 544 | 1590 ± 683 | 2590 ± 1230 | y = 150x + 535 | 0.68 | |
| PA_(38:4) | 42,400 ± 40,100 | 27,100 ± 11,700 | 25,400 ± 17,000 | 23,000 ± 7630 | y = −2220x + 46,400 | 0.78 | Decreasing |
| PA_(38:5) | 3280 ± 2800 | 2230 ± 911 | 2430 ± 1180 | 3310 ± 1300 | y = 10.7x + 2730 | 0.00 | |
| PA_(40:5) | 1730 ± 1530 | 838 ± 336 | 871 ± 449 | 1110 ± 412 | y = −67.7x + 1650 | 0.33 | |
| PC_(30:0) | 6.27 ± 6.94 | 21.5 ± 23.9 | 39.3 ± 18.4 | 81.4 ± 23.1 | y = 9.01x − 31.8 * | 0.94 | Increasing |
| PC_(30:1) | 8.63 ± 6.24 | 12.9 ± 8.52 | 40.6 ± 32.6 | 188 ± 120 | y = 21x − 97.8 | 0.74 | Increasing |
| PC_(31:0) | 54.7 ± 17.4 | 78.7 ± 33.5 | 85.4 ± 22.6 | 179 ± 44.5 | y = 14.1x − 8.1 | 0.80 | Increasing |
| PC_(32:0) | 1750 ± 251 | 1930 ± 493 | 1650 ± 237 | 1950 ± 234 | y = 11.9x + 1730 | 0.08 | |
| PC_(32:1) | 222 ± 110 | 352 ± 101 | 1240 ± 835 | 4860 ± 1550 | y = 548x − 2530 | 0.77 | Increasing |
| PC_(32:2) | 565 ± 249 | 496 ± 222 | 646 ± 223 | 1350 ± 659 | y = 92.8x + 54.5 | 0.67 | |
| PC_(33:0) | 28.2 ± 8.55 | 39.9 ± 13 | 49.6 ± 7.5 | 102 ± 25.7 | y = 8.56x − 10.6 | 0.84 | Increasing |
| PC_(33:1) | 148 ± 45.4 | 267 ± 71.4 | 540 ± 136 | 1700 ± 388 | y = 183x − 733 | 0.80 | Increasing |
| PC_(33:2) | 470 ± 56.2 | 515 ± 187 | 574 ± 241 | 566 ± 180 | y = 12.9x + 433 | 0.85 | |
| PC_(34:0) | 789 ± 267 | 732 ± 165 | 615 ± 45.6 | 644 ± 83.3 | y = −20.4x + 851 | 0.79 | |
| PC_(34:1) | 4160 ± 763 | 5580 ± 931 | 8080 ± 829 | 15,100 ± 1050 | y = 1310x − 1780 | 0.88 | Increasing |
| PC_(34:2) | 11,900 ± 2050 | 14,700 ± 1880 | 15,200 ± 1930 | 20,400 ± 2030 | y = 963x + 8180 | 0.90 | Increasing |
| PC_(34:3) | 3270 ± 1090 | 3620 ± 834 | 5400 ± 998 | 9050 ± 1860 | y = 708x − 82.3 | 0.87 | Increasing |
| PC_(35:0) | 28.3 ± 9.27 | 32.3 ± 9.11 | 38.3 ± 6.8 | 71.2 ± 15.2 | y = 4.99x + 4.36 | 0.79 | Increasing |
| PC_(35:1) | 108 ± 32 | 166 ± 36.7 | 297 ± 52.6 | 891 ± 153 | y = 91.9x − 337 | 0.79 | Increasing |
| PC_(35:2) | 1240 ± 238 | 1530 ± 305 | 1530 ± 433 | 1640 ± 369 | y = 44.4x + 1150 | 0.82 | |
| PC_(36:0) | 76.2 ± 27.6 | 66.4 ± 16.6 | 55.2 ± 22.9 | 83.4 ± 16.5 | y = 0.385x + 67.4 | 0.01 | |
| PC_(36:1) | 3060 ± 753 | 3610 ± 756 | 5450 ± 944 | 11,600 ± 974 | y = 1020x − 1850 | 0.82 | Increasing |
| PC_(36:2) | 6650 ± 1180 | 7290 ± 1320 | 7890 ± 1490 | 10,700 ± 954 | y = 472x + 4520 | 0.85 | Increasing |
| PC_(36:3) | 8480 ± 912 | 9060 ± 1570 | 11,800 ± 1920 | 23,900 ± 2150 | y = 1810x − 573 | 0.77 | Increasing |
| PC_(36:4) | 18,900 ± 3120 | 20,200 ± 2700 | 19,500 ± 1190 | 27,500 ± 1900 | y = 930x + 14,400 | 0.65 | |
| PC_(37:0) | 0.557 ± 0.4 | 0.542 ± 0.232 | 0.338 ± 0.231 | 0.689 ± 0.551 | y = 0.00711x + 0.477 | 0.03 | |
| PC_(37:1) | 40.9 ± 20.8 | 38 ± 19.4 | 75.1 ± 38.1 | 283 ± 96.2 | y = 28.3x − 107 | 0.71 | |
| PC_(37:2) | 301 ± 88.2 | 217 ± 62.9 | 210 ± 61.6 | 301 ± 56.6 | y = −0.259x + 259 | 0.00 | |
| PC_(37:3) | 83.4 ± 17.3 | 86.2 ± 25.1 | 131 ± 33.9 | 160 ± 31.9 | y = 10.2x + 37.3 * | 0.92 | Increasing |
| PC_(37:4) | 2810 ± 648 | 3180 ± 738 | 2520 ± 674 | 2430 ± 461 | y = −66.7x + 3250 | 0.47 | |
| PC_(37:5) | 157 ± 59.9 | 171 ± 36.4 | 270 ± 103 | 445 ± 77.3 | y = 35.7x − 12.1 | 0.88 | Increasing |
| PC_(37:6) | 85 ± 34.3 | 76 ± 37.5 | 55.8 ± 29.9 | 101 ± 29.7 | y = 1.03x + 71.6 | 0.04 | |
| PC_(38:0) | 1.83 ± 0.323 | 1.77 ± 0.432 | 1.79 ± 0.773 | 2.67 ± 0.91 | y = 0.0941x + 1.3 | 0.56 | |
| PC_(38:1) | 39.4 ± 20.9 | 14.1 ± 12.8 | 28.9 ± 21.3 | 103 ± 42.3 | y = 7.61x − 11.9 | 0.46 | |
| PC_(38:2) | 649 ± 137 | 521 ± 186 | 493 ± 137 | 871 ± 171 | y = 23.6x + 453 | 0.23 | |
| PC_(38:3) | 3030 ± 346 | 3260 ± 708 | 5020 ± 1050 | 12,200 ± 1770 | y = 1080x − 2420 | 0.77 | Increasing |
| PC_(38:4) | 10,300 ± 2010 | 11,700 ± 2240 | 10,200 ± 1090 | 12,100 ± 2290 | y = 144x + 9970 | 0.27 | |
| PC_(38:5) | 6010 ± 2050 | 5500 ± 1900 | 5290 ± 916 | 8730 ± 1930 | y = 294x + 4130 | 0.41 | |
| PC_(38:6) | 16,000 ± 3530 | 14,000 ± 1550 | 12,900 ± 1690 | 18,900 ± 2600 | y = 281x + 13,300 | 0.14 | |
| PC_(40:2) | 19.1 ± 8.48 | 14.8 ± 4.37 | 13.2 ± 3.21 | 20.1 ± 5.31 | y = 0.0519x + 16.4 | 0.00 | |
| PC_(40:3) | 52.8 ± 15 | 44 ± 15.1 | 52.7 ± 13.6 | 124 ± 22.6 | y = 8.23x + 5.39 | 0.59 | |
| PC_(40:4) | 1200 ± 402 | 884 ± 230 | 726 ± 182 | 665 ± 175 | y = −65.3x + 1370 * | 0.90 | Decreasing |
| PC_(40:5) | 947 ± 577 | 704 ± 574 | 514 ± 208 | 980 ± 459 | y = −3.37x + 812 | 0.00 | |
| PC_(40:6) | 3800 ± 936 | 3630 ± 913 | 3090 ± 720 | 4370 ± 960 | y = 43.3x + 3390 | 0.08 | |
| PC_C18(plas)-18:1 | ND ± ND | ND ± ND | ND ± ND | 0.766 ± 1.43 | |||
| PE_(30:0) | 4.78 ± 10.7 | 2.19 ± 4.47 | ND ± ND | 1.82 ± 5.14 | y = −0.323x + 5.26 | 0.68 | |
| PE_(32:1) | 12.4 ± 20.9 | 26 ± 38.5 | 468 ± 553 | 1920 ± 896 | y = 228x − 1140 | 0.78 | Increasing |
| PE_(34:0) | 80.3 ± 34.4 | 106 ± 24 | 54.8 ± 20.8 | 30.5 ± 35.6 | y = −7.43x + 125 | 0.63 | |
| PE_(34:1) | 4110 ± 2220 | 4930 ± 1800 | 9030 ± 1940 | 18,100 ± 6000 | y = 1710x − 4010 | 0.86 | Increasing |
| PE_(34:2) | 71,600 ± 27,000 | 69,300 ± 42,400 | 48,600 ± 14,200 | 29,500 ± 12,000 | y = −5440x + 96,400 * | 0.92 | Decreasing |
| PE_(35:1) | 4.9 ± 2 | 10.6 ± 3.84 | 23.9 ± 7.89 | 42.4 ± 13 | y = 4.66x − 15.2 * | 0.95 | Increasing |
| PE_(36:0) | 24.4 ± 11.3 | 35 ± 15 | 22.8 ± 6.68 | 17 ± 12.8 | y = −1.27x + 34.5 | 0.35 | |
| PE_(36:1) | 6560 ± 4060 | 5730 ± 2600 | 6590 ± 1730 | 11,300 ± 4870 | y = 559x + 3270 | 0.59 | |
| PE_(36:2) | 46,300 ± 18,900 | 36,900 ± 20,900 | 24,400 ± 6230 | 19,300 ± 7930 | y = −3460x + 58,200 * | 0.98 | Decreasing |
| PE_(36:3) | 39,000 ± 15,000 | 28,800 ± 17,100 | 20,000 ± 4520 | 14,300 ± 5490 | y = −3070x + 49,000 * | 0.99 | Decreasing |
| PE_(36:4) | 110,000 ± 44,700 | 107,000 ± 49,200 | 96,600 ± 12,500 | 126,000 ± 34,500 | y = 1390x + 99,200 | 0.16 | |
| PE_(38:1) | 219 ± 130 | 144 ± 84.5 | 115 ± 22 | 121 ± 46.7 | y = −12x + 241 | 0.76 | |
| PE_(38:2) | 1530 ± 645 | 822 ± 467 | 539 ± 98.4 | 535 ± 140 | y = −121x + 1780 | 0.81 | Decreasing |
| PE_(38:3) | 13400 ± 4930 | 13,000 ± 7700 | 14,400 ± 2710 | 17,700 ± 3860 | y = 530x + 10,600 | 0.75 | |
| PE_(38:4) | 165,000 ± 74,800 | 148,000 ± 59,300 | 113,000 ± 20,200 | 118,000 ± 26,000 | y = −6520x + 186,000 | 0.84 | |
| PE_(38:5) | 72,900 ± 38,400 | 52,700 ± 23,200 | 39,700 ± 7150 | 44,700 ± 11,600 | y = −3610x + 80,200 | 0.74 | |
| PE_(38:6) | 25,000 ± 12,000 | 18,200 ± 8270 | 12,300 ± 2890 | 19,100 ± 5400 | y = −874x + 25,300 | 0.34 | |
| PG_(32:0) | 1.64 ± 0.748 | 1.59 ± 0.834 | 5.29 ± 4.05 | 11 ± 3.46 | y = 1.18x − 4.12 | 0.86 | |
| PG_(33:0) | ND ± ND | ND ± ND | ND ± ND | 0.0213 ± 0.0434 | |||
| PG_(34:1) | ND ± ND | ND ± ND | 2.24 ± 3.19 | 65.1 ± 51.8 | y = 23.3x − 207 | 1.00 | |
| PG_(35:1) | 0.256 ± 0.325 | 0.467 ± 0.67 | 0.816 ± 0.888 | 1.62 ± 0.913 | y = 0.164x − 0.469 * | 0.91 | Increasing |
| PG_(36:0) | 11.8 ± 3.75 | 25.6 ± 18 | 13.4 ± 4.49 | 7.6 ± 5.1 | y = −0.919x + 21.6 | 0.17 | |
| PG_(36:1) | 0.0408 ± 0.122 | 1.84 ± 2.72 | 0.525 ± 0.62 | 0.294 ± 0.831 | y = −0.0206x + 0.832 | 0.01 | |
| PG_(36:2) | 125 ± 25.3 | 169 ± 81.3 | 106 ± 43.1 | 53.5 ± 21 | y = −10.3x + 192 | 0.56 | |
| PG_(36:3) | 48.8 ± 14.2 | 62.3 ± 30 | 32.3 ± 9.53 | 28.1 ± 20.5 | y = −3.41x + 69 | 0.57 | |
| PG_(36:4) | 25.6 ± 13.6 | 45.9 ± 26.9 | 33.6 ± 15.7 | 29.1 ± 15.4 | y = −0.0667x + 34.1 | 0.00 | |
| PG_(38:3) | 1.72 ± 1.42 | 1.04 ± 0.753 | 3.19 ± 3.43 | 7.34 ± 3.64 | y = 0.704x − 2.06 | 0.75 | |
| PG_(38:4) | 11.7 ± 5.76 | 19.5 ± 9.9 | 13.3 ± 5.22 | 11.9 ± 5.31 | y = −0.207x + 15.7 | 0.04 | |
| PG_(38:5) | 6.31 ± 2.82 | 9.55 ± 5.47 | 6.6 ± 2.34 | 7.16 ± 4.03 | y = −0.0148x + 7.52 | 0.00 | |
| PG_(38:6) | 0.0292 ± 0.0876 | 0.0656 ± 0.0754 | 0.0529 ± 0.067 | 0.0457 ± 0.0527 | y = 0.00136x + 0.0379 | 0.10 | |
| PG_(40:6) | 0.306 ± 0.378 | 0.211 ± 0.434 | 0.028 ± 0.0792 | 0.773 ± 0.913 | y = 0.0451x − 0.0156 | 0.25 | |
| PG_(42:07) | 0.469 ± 0.411 | 0.424 ± 0.714 | 0.269 ± 0.332 | 0.305 ± 0.316 | y = −0.024x + 0.55 | 0.77 | |
| PG_(42:08) | 0.0147 ± 0.0192 | 0.0893 ± 0.11 | 0.112 ± 0.116 | ND ± ND | y = 0.018x − 0.0415 | 0.91 | Increasing |
| PG_(42:10) | 0.0638 ± 0.191 | 0.314 ± 0.943 | ND ± ND | 0.0417 ± 0.118 | y = -0.00954x + 0.209 | 0.07 | |
| PI_(34:0) | 455 ± 385 | 482 ± 396 | 354 ± 237 | 318 ± 196 | y = −20x + 555 | 0.78 | |
| PI_(34:1) | 5070 ± 1420 | 5070 ± 909 | 7620 ± 1620 | 10,100 ± 2670 | y = 653x + 1970 | 0.89 | |
| PI_(34:2) | 6510 ± 3850 | 9740 ± 4140 | 9450 ± 3880 | 3260 ± 1640 | y = −372x + 10,100 | 0.18 | |
| PI_(35:0) | 0.0814 ± 0.244 | 0.0917 ± 0.275 | ND ± ND | ND ± ND | y = 0.00381x + 0.0677 | 1.00 | |
| PI_(35:2) | 134 ± 112 | 319 ± 164 | 261 ± 137 | 82.5 ± 68.9 | y = −7.87x + 259 | 0.06 | |
| PI_(36:1) | 186 ± 165 | 450 ± 292 | 659 ± 339 | 814 ± 589 | y = 77.5x − 65.8 * | 0.99 | Increasing |
| PI_(36:2) | 3680 ± 2670 | 5400 ± 2720 | 4920 ± 2300 | 2020 ± 1140 | y = −202x + 5550 | 0.22 | |
| PI_(36:4) | 16,000 ± 6720 | 25,800 ± 10,600 | 27,900 ± 8740 | 21,000 ± 9500 | y = 633x + 17,800 | 0.17 | |
| PI_(38:3) | 6340 ± 4020 | 10,500 ± 6710 | 14,200 ± 8060 | 6420 ± 3950 | y = 146x + 8250 | 0.02 | |
| PI_(38:4) | 86,600 ± 41,000 | 124,000 ± 50,900 | 119,000 ± 34,000 | 79,600 ± 40,400 | y = −963x + 110,000 | 0.02 | |
| PI_(38:5) | 11,100 ± 5400 | 15,000 ± 5750 | 16,600 ± 4890 | 12,400 ± 5840 | y = 204x + 12,200 | 0.08 | |
| PI_(40:3) | 120 ± 56.6 | 94 ± 51.8 | 49.8 ± 19 | 25.2 ± 8.08 | y = −12.2x + 165 * | 0.99 | Decreasing |
| PI_(40:4) | 1040 ± 615 | 1830 ± 1050 | 1380 ± 608 | 885 ± 607 | y = −33.9x + 1540 | 0.08 | |
| PI_(40:6) | 4080 ± 1020 | 5270 ± 1350 | 4820 ± 901 | 6870 ± 1270 | y = 293x + 3020 | 0.75 | |
| PI_(40:8) | 42.9 ± 25 | 48.9 ± 23.4 | 47.4 ± 22.1 | 50.8 ± 21 | y = 0.822x + 41.2 | 0.72 | |
| PS_(32:0) | 0.673 ± 0.587 | 0.661 ± 0.918 | 0.321 ± 0.135 | 0.802 ± 0.336 | y = 0.00174x + 0.601 | 0.00 | |
| PS_(32:1) | 0.00219 ± 0.00658 | 0.0339 ± 0.0329 | 0.00448 ± 0.0127 | 0.00374 ± 0.0106 | y = −0.000917x + 0.0181 | 0.04 | |
| PS_(33:1) | 1.25 ± 0.504 | 1.76 ± 0.541 | 1.8 ± 0.553 | 1.19 ± 1.06 | y = −0.00519x + 1.54 | 0.00 | |
| PS_(34:0) | 0.0337 ± 0.101 | 0.291 ± 0.452 | 0.16 ± 0.211 | 0.0675 ± 0.096 | y = −0.0011x + 0.146 | 0.00 | |
| PS_(34:1) | ND ± ND | 0.0315 ± 0.0945 | ND ± ND | 0.73 ± 0.911 | y = 0.129x − 0.783 | 1.00 | |
| PS_(34:2) | 10.3 ± 4.05 | 13.8 ± 4.69 | 15.3 ± 4.34 | 11.7 ± 5.1 | y = 0.211x + 11.2 | 0.11 | |
| PS_(34:3) | 0.051 ± 0.0821 | 0.0582 ± 0.115 | 0.202 ± 0.314 | 0.911 ± 0.888 | y = 0.101x − 0.466 | 0.74 | Increasing |
| PS_(35:2) | 0.215 ± 0.514 | 0.379 ± 0.946 | 0.0732 ± 0.207 | 0.101 ± 0.286 | y = −0.024x + 0.376 | 0.36 | |
| PS_(36:0) | 0.242 ± 0.479 | 0.34 ± 0.527 | 0.261 ± 0.489 | 0.485 ± 0.672 | y = 0.0241x + 0.148 | 0.58 | |
| PS_(36:1) | 63.9 ± 28.7 | 135 ± 76.6 | 101 ± 23.5 | 75.4 ± 43 | y = 0.0185x + 93.7 | 0.00 | |
| PS_(36:2) | 115 ± 47 | 136 ± 51.5 | 123 ± 33.2 | 83 ± 23.2 | y = −4.04x + 145 | 0.39 | |
| PS_(38:2) | 0.434 ± 0.578 | 1.66 ± 1.78 | 0.712 ± 0.42 | 0.536 ± 0.84 | y = −0.0238x + 1.02 | 0.02 | |
| PS_(38:5) | ND ± ND | 0.0745 ± 0.224 | ND ± ND | ND ± ND | |||
| PS_(38:6) | 113 ± 23.8 | 126 ± 29.7 | 140 ± 34.3 | 201 ± 55.3 | y = 10.3x + 66.2 | 0.85 | Increasing |
| PS_(40:0) | 0.352 ± 0.406 | 1.18 ± 0.599 | 0.755 ± 0.566 | 1.46 ± 0.838 | y = 0.107x + 0.115 | 0.59 | |
| PS_(40:2) | 0.485 ± 1.31 | 1.23 ± 2.17 | ND ± ND | ND ± ND | y = 0.276x − 0.508 | 1.00 | |
| PS_(40:3) | 215 ± 36.3 | 243 ± 49.1 | 206 ± 51.9 | 147 ± 28.2 | y = −8.93x + 271 | 0.59 | |
| PS_(42:6) | 185 ± 75.9 | 262 ± 104 | 237 ± 95.8 | 87.8 ± 37.6 | y = −11.7x + 283 | 0.28 | |
| S_(32:0) | 0.134 ± 0.0379 | 0.128 ± 0.0538 | 0.112 ± 0.0157 | 0.0075 ± 0.014 | y = −0.0146x + 0.207 | 0.74 | Decreasing |
| S_(32:1) | ND ± ND | ND ± ND | ND ± ND | 0.000566 ± 0.0016 | |||
| S_(34:0) | 1.04 ± 0.105 | 2.09 ± 1.77 | 1.54 ± 0.259 | 1.31 ± 0.586 | y = 0.00963x + 1.42 | 0.01 | |
| S_(34:1-OH) | 1.47 ± 0.48 | 1.72 ± 0.795 | 1.08 ± 0.388 | 1.35 ± 0.9 | y = −0.037x + 1.69 | 0.24 | |
| S_(34:2) | 0.592 ± 0.147 | 0.769 ± 0.36 | 0.402 ± 0.187 | 0.327 ± 0.128 | y = −0.043x + 0.852 | 0.57 | |
| S_(35:0) | 0.0316 ± 0.0617 | 0.022 ± 0.0369 | 0.0626 ± 0.123 | 0.0338 ± 0.0371 | y = 0.00175x + 0.0241 | 0.12 | |
| S_(35:1) | 0.0235 ± 0.041 | 0.021 ± 0.0344 | 0.0404 ± 0.0922 | 0.16 ± 0.307 | y = 0.0159x − 0.0603 | 0.70 | |
| S_(35:1-OH) | 0.209 ± 0.281 | 0.127 ± 0.381 | ND ± ND | ND ± ND | y = −0.0304x + 0.318 | 1.00 | |
| S_(35:2) | ND ± ND | ND ± ND | 0.00482 ± 0.00897 | 0.00385 ± 0.00881 | y = −0.000359x + 0.00805 | 1.00 | |
| S_(36:1) | 0.999 ± 0.437 | 1 ± 0.661 | 0.824 ± 0.375 | 0.561 ± 0.391 | y = −0.0552x + 1.27 | 0.86 | |
| S_(37:2) | 0.159 ± 0.092 | 0.296 ± 0.22 | 0.206 ± 0.125 | 0.08 ± 0.0753 | y = −0.0121x + 0.278 | 0.22 | |
| S_(38:0) | 1.88 ± 0.631 | 3.39 ± 2.13 | 1.89 ± 0.684 | 1.03 ± 0.594 | y = −0.15x + 3.2 | 0.28 | |
| S_(38:1-OH) | 0.153 ± 0.242 | 0.197 ± 0.308 | 0.116 ± 0.253 | 0.0765 ± 0.109 | y = −0.0115x + 0.224 | 0.61 | |
| S_(39:1) | 0.111 ± 0.0948 | 0.41 ± 0.632 | 0.194 ± 0.249 | 0.0621 ± 0.12 | y = −0.0134x + 0.297 | 0.09 | |
| S_(40:0) | 7.77 ± 1.43 | 17.9 ± 12.7 | 10.5 ± 4.51 | 7.67 ± 4.6 | y = −0.285x + 13.1 | 0.04 | |
| S_(40:1-OH) | 1.48 ± 0.815 | 1.78 ± 1.37 | 1.57 ± 0.909 | 1.46 ± 1.39 | y = −0.01x + 1.65 | 0.06 | |
| S_(40:2) | 1.04 ± 0.637 | 1.44 ± 0.841 | 1.03 ± 0.425 | 0.566 ± 0.349 | y = −0.0679x + 1.54 | 0.44 | |
| S_(41:0) | 0.352 ± 0.195 | 1.1 ± 0.943 | 0.253 ± 0.162 | 0.0222 ± 0.0413 | y = −0.068x + 0.952 | 0.26 | |
| S_(41:2) | ND ± ND | 0.0108 ± 0.0324 | 0.021 ± 0.0318 | 0.0543 ± 0.0655 | y = 0.00806x − 0.0438 | 0.91 | |
| S_(42:0) | 0.322 ± 0.225 | 0.59 ± 0.876 | 0.491 ± 0.223 | 0.294 ± 0.162 | y = −0.00678x + 0.476 | 0.03 | |
| S_(42:2) | 0.395 ± 0.385 | 1.1 ± 1.26 | 0.958 ± 0.837 | 0.983 ± 0.763 | y = 0.0601x + 0.399 | 0.44 | |
| S_(42:2-OH) | 2.43 ± 0.843 | 1.55 ± 0.588 | 0.786 ± 0.406 | 0.789 ± 0.434 | y = −0.211x + 3 | 0.88 | |
| S_(46:2-OH) | 0.0599 ± 0.0337 | 0.0149 ± 0.0269 | 0.0228 ± 0.018 | 0.0258 ± 0.031 | y = −0.0035x + 0.0576 | 0.37 | |
| S_(48:2-OH) | 0.00958 ± 0.0163 | ND ± ND | 0.00395 ± 0.00731 | 0.00115 ± 0.00326 | y = −0.00104x + 0.0133 | 1.00 | |
| SM_(30:1) | 1.61 ± 0.262 | 1.59 ± 0.611 | 1.89 ± 0.679 | 1.84 ± 0.667 | y = 0.0367x + 1.45 | 0.68 | |
| SM_(32:0) | 4.99 ± 0.941 | 4.66 ± 2.13 | 3.81 ± 1.08 | 2.85 ± 1.21 | y = −0.269x + 6.14 * | 0.96 | Decreasing |
| SM_(32:1) | 428 ± 88.3 | 368 ± 107 | 334 ± 87.3 | 256 ± 63.6 | y = −20.4x + 502 * | 0.98 | Decreasing |
| SM_(33:1) | 273 ± 37.3 | 238 ± 62.2 | 168 ± 32.2 | 135 ± 44.4 | y = −17.9x + 341 * | 0.98 | Decreasing |
| SM_(34:0) | 21.8 ± 5.98 | 26 ± 6.49 | 22.2 ± 6.65 | 18 ± 4.85 | y = −0.563x + 26.3 | 0.36 | |
| SM_(34:0-OH) | 7.39 ± 2.3 | 5.26 ± 2.46 | 3.5 ± 1.7 | 1.4 ± 1.69 | y = −0.731x + 9.98 * | 1.00 | Decreasing |
| SM_(34:1) | 3400 ± 495 | 3830 ± 796 | 3240 ± 427 | 2620 ± 346 | y = −109x + 4100 | 0.57 | |
| SM_(34:1-OH) | 4.36 ± 1.63 | 10.1 ± 8 | 5.89 ± 3.22 | 2.74 ± 2.48 | y = −0.336x + 8.34 | 0.14 | |
| SM_(34:2) | 397 ± 102 | 401 ± 106 | 320 ± 50.4 | 282 ± 94.6 | y = −15.8x + 471 | 0.88 | |
| SM_(34:2-OH) | 4.44 ± 1.37 | 4.15 ± 1.73 | 3.2 ± 0.88 | 2.68 ± 0.928 | y = −0.231x + 5.38 * | 0.96 | Decreasing |
| SM_(35:0) | 0.957 ± 1.35 | 0.969 ± 0.848 | 0.457 ± 0.267 | 0.389 ± 0.404 | y = −0.0821x + 1.32 | 0.84 | |
| SM_(35:1) | 36.3 ± 3.74 | 48.6 ± 6.53 | 40.9 ± 7.5 | 41.1 ± 8.38 | y = 0.248x + 39.8 | 0.03 | |
| SM_(35:2) | 0.632 ± 0.456 | 0.335 ± 0.314 | 0.144 ± 0.149 | 0.137 ± 0.18 | y = −0.0621x + 0.787 | 0.87 | Decreasing |
| SM_(36:1) | 449 ± 43.4 | 529 ± 103 | 446 ± 58.3 | 298 ± 50.5 | y = −19.9x + 582 | 0.52 | |
| SM_(36:2) | 32 ± 6.24 | 38.6 ± 9.35 | 30.9 ± 4.52 | 23.1 ± 5.49 | y = −1.27x + 40.9 | 0.49 | |
| SM_(36:3) | 2.19 ± 0.784 | 1.71 ± 0.891 | 0.76 ± 0.384 | 0.406 ± 0.326 | y = −0.233x + 3.05 * | 0.97 | Decreasing |
| SM_(37:2) | 0.0328 ± 0.0984 | 0.024 ± 0.0721 | ND ± ND | 0.0197 ± 0.0556 | y = −0.0015x + 0.0363 | 0.86 | |
| SM_(38:0) | 7.73 ± 1.45 | 7.83 ± 3.24 | 6.35 ± 1.81 | 4.64 ± 1.6 | y = −0.398x + 9.68 | 0.86 | |
| SM_(38:1) | 342 ± 56.4 | 293 ± 59.3 | 200 ± 27.7 | 106 ± 19.4 | y = −29.7x + 462 * | 0.98 | Decreasing |
| SM_(39:0) | 8.55 ± 3.43 | 8.71 ± 6.78 | 12.5 ± 7.79 | ND ± ND | y = 0.731x + 5.31 | 0.78 | Increasing |
| SM_(39:1) | 178 ± 28.6 | 142 ± 35.5 | 109 ± 28.1 | 85.4 ± 10.7 | y = −11.5x + 217 * | 0.99 | Decreasing |
| SM_(40:0) | 17.3 ± 5.88 | 14.2 ± 4.27 | 10.8 ± 2.35 | 4.03 ± 1.2 | y = −1.6x + 23.8 * | 0.96 | Decreasing |
| SM_(40:0-OH) | 5.96 ± 1.62 | 4.29 ± 1.17 | 3.53 ± 1.12 | 0.919 ± 0.868 | y = −0.588x + 8.17 * | 0.95 | Decreasing |
| SM_(40:1) | 989 ± 137 | 867 ± 181 | 704 ± 125 | 520 ± 71.7 | y = −58.1x + 1210 * | 0.99 | Decreasing |
| SM_(40:2) | 138 ± 21.3 | 123 ± 21.6 | 91.7 ± 16.9 | 55.3 ± 11.1 | y = −10.3x + 181 * | 0.97 | Decreasing |
| SM_(41:0) | 8.36 ± 2.45 | 8.68 ± 2.13 | 7.03 ± 1.56 | 5.33 ± 1.63 | y = −0.398x + 10.4 | 0.83 | |
| SM_(41:1) | 893 ± 123 | 839 ± 144 | 772 ± 135 | 695 ± 133 | y = −24.5x + 987 * | 0.99 | Decreasing |
| SM_(42:0) | 8.67 ± 2.47 | 10.5 ± 3.94 | 7.13 ± 2.87 | 3.17 ± 1.49 | y = −0.736x + 13 | 0.68 | |
| SM_(42:0-OH) | 12.7 ± 2.47 | 11.1 ± 1.98 | 9.01 ± 2.88 | 4.92 ± 1.53 | y = −0.942x + 16.6 * | 0.95 | Decreasing |
| SM_(42:1) | 1610 ± 185 | 1540 ± 227 | 1280 ± 206 | 1020 ± 194 | y = −75.2x + 1940 * | 0.95 | Decreasing |
| SM_(42:2) | 1160 ± 180 | 1180 ± 185 | 1010 ± 197 | 880 ± 109 | y = −37.4x + 1340 | 0.86 | |
| SM_(43:0) | 0.202 ± 0.119 | 0.527 ± 0.275 | 0.368 ± 0.199 | 0.115 ± 0.152 | y = −0.0156x + 0.422 | 0.09 | |
| SM_(43:1) | 158 ± 43.1 | 200 ± 35.8 | 163 ± 44.2 | 153 ± 57 | y = −1.93x + 183 | 0.10 | |
| SM_(44:1) | 13.5 ± 4.24 | 17.9 ± 3.6 | 14.1 ± 4.99 | 9.32 ± 3.95 | y = −0.605x + 18.3 | 0.36 | |
| SM_(44:2) | 27 ± 6.17 | 29.6 ± 5.31 | 27 ± 7.84 | 23.1 ± 5.83 | y = −0.53x + 30.7 | 0.47 | |
| TG_(18:0) | 11 ± 8.91 | 11.3 ± 4.51 | 6.54 ± 4.04 | 2.47 ± 2.6 | y = −1.12x + 16.4 | 0.88 | |
| TG_(24:0) | 920 ± 2500 | 39.9 ± 59.6 | 84.9 ± 195 | 177 ± 372 | y = −80.9x + 924 | 0.46 | |
| TG_(36:0) | 170 ± 214 | 52.4 ± 36.9 | 93.4 ± 83.8 | 441 ± 288 | y = 31.6x − 52.8 | 0.40 | |
| TG_(44:1) | 970 ± 941 | 325 ± 175 | 1550 ± 2130 | 2250 ± 1250 | y = 188x − 161 | 0.63 | |
| TG_(45:1) | 14.3 ± 19 | 7.72 ± 5.87 | 32.3 ± 32.3 | 83.7 ± 49.3 | y = 8.62x − 31.4 | 0.76 | |
| TG_(45:2) | 92.6 ± 86.2 | 31.6 ± 14.8 | 64.1 ± 58.7 | 84.2 ± 53.8 | y = 0.27x + 66.1 | 0.00 | |
| TG_(46:1) | 85.4 ± 104 | 22.5 ± 16.1 | 87.6 ± 112 | 269 ± 189 | y = 22.8x − 58.4 | 0.56 | |
| TG_(46:2) | 1060 ± 1040 | 293 ± 167 | 412 ± 311 | 787 ± 609 | y = -25.9x + 836 | 0.07 | |
| TG_(46:4) | 3530 ± 3550 | 700 ± 350 | 464 ± 357 | 316 ± 241 | y = −366x + 4050 | 0.70 | Decreasing |
| TG_(47:0) | 7.11 ± 7 | 2.59 ± 2.23 | 2.86 ± 4.1 | 6.91 ± 2.88 | y = −0.0122x + 4.96 | 0.00 | |
| TG_(47:1) | 1.39 ± 3.19 | 0.253 ± 0.76 | 6.65 ± 10.2 | 19.6 ± 9.01 | y = 2.26x − 10.3 | 0.79 | |
| TG_(47:2) | 11.5 ± 11.3 | 3.39 ± 2.87 | 10.9 ± 6.94 | 22.3 ± 17.7 | y = 1.48x + 0.715 | 0.44 | |
| TG_(48:0) | 133 ± 69.6 | 63 ± 10.9 | 75.7 ± 98.4 | 92.4 ± 43.9 | y = −4.04x + 122 | 0.21 | |
| TG_(48:1) | 142 ± 100 | 83 ± 29.2 | 279 ± 343 | 435 ± 172 | y = 39.8x − 69.8 | 0.78 | |
| TG_(48:2) | 241 ± 196 | 115 ± 38.3 | 319 ± 401 | 440 ± 165 | y = 29.7x + 51.8 | 0.57 | |
| TG_(48:3) | 250 ± 185 | 83.7 ± 27 | 112 ± 80.1 | 102 ± 49.9 | y = −15.4x + 255 | 0.49 | |
| TG_(49:0) | 18 ± 9.16 | 10.7 ± 2.12 | 11 ± 5.69 | 10.2 ± 3.69 | y = −0.856x + 19 | 0.65 | |
| TG_(49:1) | 35.7 ± 18.6 | 28.3 ± 9.67 | 67.9 ± 55.5 | 96.3 ± 30.3 | y = 8.2x − 5.68 | 0.83 | |
| TG_(49:2) | 70.2 ± 29.8 | 50.1 ± 12.1 | 77.6 ± 55.4 | 86.3 ± 30.3 | y = 2.81x + 49.6 | 0.40 | |
| TG_(49:3) | 27.3 ± 12.9 | 18.2 ± 5.03 | 26.8 ± 15.4 | 19.3 ± 7.36 | y = −0.57x + 27.3 | 0.17 | |
| TG_(50:0) | 178 ± 68.6 | 118 ± 20.3 | 125 ± 57.6 | 102 ± 37.6 | y = −8.19x + 193 | 0.75 | |
| TG_(50:1) | 1440 ± 548 | 1030 ± 339 | 1870 ± 1370 | 1870 ± 858 | y = 78.9x + 949 | 0.47 | |
| TG_(50:2) | 2750 ± 1210 | 1830 ± 458 | 2920 ± 2200 | 2920 ± 1010 | y = 59.3x + 2150 | 0.16 | |
| TG_(50:3) | 1500 ± 858 | 1050 ± 283 | 1760 ± 1370 | 1040 ± 452 | y = −24.8x + 1530 | 0.06 | |
| TG_(51:1) | 79 ± 30.9 | 78.4 ± 31.8 | 138 ± 102 | 124 ± 39.6 | y = 7.21x + 49.7 | 0.67 | |
| TG_(51:2) | 296 ± 163 | 274 ± 82.5 | 532 ± 293 | 509 ± 148 | y = 33.2x + 149 | 0.72 | |
| TG_(51:3) | 648 ± 459 | 467 ± 133 | 437 ± 175 | 186 ± 86.3 | y = −52.4x + 836 * | 0.92 | Decreasing |
| TG_(51:4) | 662 ± 568 | 330 ± 121 | 150 ± 55.5 | 37.2 ± 17.5 | y = −76.1x + 877 * | 0.94 | Decreasing |
| TG_(52:0) | 128 ± 70.4 | 80.4 ± 17.6 | 69.5 ± 28.8 | 47.4 ± 24.1 | y = −9.36x + 153 * | 0.92 | Decreasing |
| TG_(52:1) | 849 ± 304 | 716 ± 311 | 1130 ± 904 | 823 ± 275 | y = 12.4x + 784 | 0.06 | |
| TG_(52:2) | 12,300 ± 6460 | 9670 ± 3230 | 12,700 ± 6000 | 8610 ± 3300 | y = −298x + 13,100 | 0.27 | |
| TG_(52:3) | 36,800 ± 25,800 | 22,700 ± 5870 | 15,800 ± 5770 | 5160 ± 2670 | y = −3770x + 49,000 * | 0.98 | Decreasing |
| TG_(52:4) | 45,200 ± 36,700 | 21,100 ± 7240 | 9760 ± 3330 | 2220 ± 1880 | y = −5200x + 59,300 * | 0.93 | Decreasing |
| TG_(53:1) | 28.5 ± 8.42 | 23.8 ± 10.3 | 36.4 ± 29.3 | 25.5 ± 8.57 | y = 0.133x + 27.5 | 0.01 | |
| TG_(53:2) | 253 ± 129 | 240 ± 109 | 353 ± 259 | 214 ± 67.8 | y = −0.148x + 266 | 0.00 | |
| TG_(53:3) | 801 ± 527 | 518 ± 145 | 470 ± 175 | 183 ± 73.3 | y = −70.4x + 1030 * | 0.94 | Decreasing |
| TG_(53:4) | 877 ± 722 | 489 ± 180 | 277 ± 100 | 75.2 ± 38.5 | y = −96.9x + 1170 * | 0.97 | Decreasing |
| TG_(54:0) | 20.1 ± 12.8 | 11.5 ± 2.27 | 9.51 ± 3.73 | 7.25 ± 5.07 | y = −1.5x + 23.6 | 0.87 | Decreasing |
| TG_(54:1) | 117 ± 54.8 | 79 ± 24.1 | 96.6 ± 86.6 | 57.2 ± 25.8 | y = −5.99x + 133 | 0.67 | |
| TG_(54:2) | 866 ± 326 | 637 ± 373 | 805 ± 731 | 408 ± 146 | y = −44.7x + 1020 | 0.58 | |
| TG_(54:3) | 5400 ± 3270 | 2880 ± 1140 | 2350 ± 1060 | 1000 ± 436 | y = −509x + 6800 * | 0.93 | Decreasing |
| TG_(54:4) | 14,200 ± 10,600 | 6230 ± 2180 | 3450 ± 1230 | 977 ± 444 | y = −1570x + 18,200 * | 0.91 | Decreasing |
| TG_(54:5) | 26,100 ± 21,100 | 10,200 ± 4050 | 4300 ± 1350 | 1010 ± 595 | y = −3010x + 33,400 | 0.89 | Decreasing |
| TG_(54:6) | 24,900 ± 20,300 | 9310 ± 3280 | 2980 ± 1090 | 554 ± 426 | y = −2940x + 31,900 | 0.88 | Decreasing |
| TG_(55:2) | 13.8 ± 4.81 | 9.88 ± 6.38 | 16.2 ± 17.2 | 8.35 ± 3.23 | y = −0.371x + 14.9 | 0.13 | |
| TG_(55:3) | 77.5 ± 39.7 | 46.2 ± 18.2 | 44.1 ± 29.4 | 19.7 ± 8.29 | y = −6.5x + 96.6 * | 0.91 | Decreasing |
| TG_(55:4) | 142 ± 102 | 65.1 ± 25.8 | 44.9 ± 20.2 | 10.8 ± 6.06 | y = −15.3x + 183 * | 0.92 | Decreasing |
| TG_(55:5) | 161 ± 137 | 92.4 ± 44 | 49.8 ± 23.4 | 14.4 ± 11 | y = −17.9x + 216 * | 0.98 | Decreasing |
| TG_(55:6) | 122 ± 143 | 100 ± 46.1 | 50.3 ± 18.8 | 8.95 ± 8.19 | y = −14.4x + 180 * | 0.98 | Decreasing |
| TG_(56:2) | 31.6 ± 11.6 | 20.8 ± 10.4 | 30.9 ± 40 | 11.7 ± 4.55 | y = −1.84x + 37.8 | 0.46 | |
| TG_(56:3) | 189 ± 87.4 | 100 ± 43.6 | 93.3 ± 74.8 | 31.4 ± 14.6 | y = −17.8x + 239 * | 0.91 | Decreasing |
| TG_(56:6) | 6970 ± 6060 | 3330 ± 1460 | 1200 ± 414 | 246 ± 173 | y = −826x + 9260 * | 0.93 | Decreasing |
| TG_(56:7) | 8570 ± 7750 | 3690 ± 1650 | 1190 ± 519 | 282 ± 194 | y = −1010x + 11,200 * | 0.90 | Decreasing |
| TG_(56:8) | 7360 ± 7600 | 2990 ± 1460 | 893 ± 372 | 186 ± 119 | y = −875x + 9550 | 0.89 | Decreasing |
| TG_(57:2) | 0.611 ± 0.405 | 0.434 ± 0.601 | 1 ± 1.89 | 0.371 ± 0.399 | y = −0.0057x + 0.648 | 0.00 | |
| TG_(57:6) | 83.1 ± 100 | 39.6 ± 24.4 | 16.6 ± 3.26 | 5.21 ± 5.03 | y = −9.51x + 109 * | 0.93 | Decreasing |
| TG_(58:10) | 1370 ± 1470 | 564 ± 268 | 161 ± 77.3 | 29.9 ± 23.1 | y = −164x + 1780 | 0.90 | Decreasing |
| TG_(58:7) | 1160 ± 1150 | 484 ± 241 | 123 ± 65.2 | 20 ± 18.1 | y = −140x + 1520 | 0.90 | Decreasing |
| TG_(58:8) | 1600 ± 1440 | 654 ± 354 | 186 ± 77.9 | 42.6 ± 30.7 | y = −190x + 2080 | 0.89 | Decreasing |
| TG_(58:9) | 1730 ± 1730 | 730 ± 418 | 206 ± 106 | 41.2 ± 28.3 | y = −207x + 2260 | 0.90 | Decreasing |
| TG_(59:3) | 0.283 ± 0.273 | 0.333 ± 0.708 | 0.539 ± 1.26 | 0.0277 ± 0.0537 | y = −0.0207x + 0.454 | 0.12 | |
| TG_(59:4) | 0.348 ± 0.474 | 0.22 ± 0.449 | 0.372 ± 0.807 | 0.00429 ± 0.0121 | y = −0.0326x + 0.485 | 0.45 | |
| TG_(59:5) | 0.212 ± 0.241 | 0.104 ± 0.128 | ND ± ND | ND ± ND | y = −0.04x + 0.356 | 1.00 | |
| TG_(59:6) | 0.382 ± 0.578 | 0.178 ± 0.227 | 0.137 ± 0.174 | 0.108 ± 0.197 | y = −0.032x + 0.446 | 0.81 | Decreasing |
| TG_(59:7) | 0.214 ± 0.434 | 0.147 ± 0.232 | ND ± ND | 0.0326 ± 0.0607 | y = −0.0222x + 0.291 | 1.00 | |
| TG_(59:8) | 9.09 ± 14.6 | 6.77 ± 11.9 | 5.83 ± 9.99 | 1.75 ± 2.04 | y = −0.85x + 12.4 * | 0.94 | Decreasing |
| TG_(60:10) | 194 ± 194 | 73.7 ± 56.6 | 4.21 ± 4.15 | 0.838 ± 1.23 | y = −24x + 252 | 0.86 | Decreasing |
| TG_(60:12) | 79.5 ± 74.4 | 39.6 ± 28 | 13 ± 12.1 | 1.42 ± 2.02 | y = −9.66x + 107 * | 0.94 | Decreasing |
| TG_(62:12) | 63.3 ± 43.7 | 31.3 ± 17.4 | 11 ± 5.05 | 0.863 ± 0.716 | y = −7.69x + 85.4 * | 0.95 | Decreasing |
| TG_(62:13) | 4.22 ± 2.92 | 2.86 ± 3.13 | 0.546 ± 1.15 | 0.0336 ± 0.0949 | y = −0.551x + 6.13 * | 0.95 | Decreasing |
| Internal Standard | Ionisation Product (m/z) | Ionisation Mode | Expected Retention Time (mins) |
|---|---|---|---|
| IS_Car_4:0-d7 | 239.1983 | +ve | 0.3 |
| IS_LPC_14:0-d42 | 422.5560, 421.5498, 420.5435 | +ve | 0.4 |
| IS_Car_16:0-d3 | 403.3610 | +ve | 0.5 |
| IS_FA_17:0-d33 | 302.4557, 301.4495, 300.4432 | −ve | 1.1 |
| IS_PS_28:0-d54 | 732.7741, 731.7678, 730.7615, 729.7553, 728.7490 | −ve | 1.4 |
| IS_PI_34:1-d31 | 864.7162, 865.7225, 866.7288 | −ve | 2.9 |
| IS_SM_34:1-d31 | 733.7632, 734.7670, 755.7451, 756.7514, 771.7190, 772.7253 | +ve | 3.0 |
| IS_PG_34:1-d31 | 775.6939, 776.7002, 777.7065, 778.7127 | −ve | 3.0 |
| IS_PA_34:1-d31 | 700.6509, 701.6571, 702.6634, 703.6697, 704.6760 | −ve | 3.4 |
| IS_Cer_16:0-d31 | 548.6851, 549.6914, 550.6977, 551.7039, 566.6951, 567.7014, 568.7076, 569.7139, 590.6896, 591.6959, 606.6636, 607.6698 | +ve | 3.9 |
| IS_PC_34:1-d31 | 790.7700, 791.7750, 812.7553, 813.7616, 828.7292, 829.7355 | +ve | 3.9 |
| IS_PE_34:1-d31 | 747.7181, 748.7254, 749.7327, 769.7021, 770.7084, 771.7146, 785.6760, 786.6823, 787.6886 | +ve | 4.0 |
| IS_TG_45:0-d87 | 850.2239, 851.2301, 852.2364, 853.2427, 867.2504, 868.2567, 869.2630, 870.2693, 872.2059, 873.2121, 874.2184, 875.2247, 888.1798, 889.1861, 890.1923, 891.1986 | +ve | 5.8 |
| Analyte Class | No. of Species | Adducts | Internal Standard |
|---|---|---|---|
| Acyl-carnitines | 48 | [M+H]+ | IS_Car_4:0-d7, IS_Car_16:0-d3 |
| Ceramides | 85 | [M+H]+, [M+H-H2O]+ | IS_Cer_16:0-d31 |
| Cardiolipins | 56 | [M-H]− | IS_TG_45:0-d87 |
| Diacylglycerols | 6 | [M+H-H2O]+, [M+Na]+, [M+K]+ | IS_TG_45:0-d87 |
| Gangliosides (GM1) | 24 | [M-H]− | IS_PG_34:1-d31 |
| Hexosylceramides | 56 | [M+H]+, [M+H-H2O]+ | IS_Cer_16:0-d31 |
| Lyso-phosphatidylcholines | 23 | [M+H]+ | IS_LPC_14:0-d42 |
| Lyso-phosphatidyethanolamines | 19 | [M+H]+ | IS_LPC_14:0-d42 |
| Lyso-phosphatidylinositols | 19 | [M-H]− | IS_PI_34:1-d31 |
| Lyso-phosphoserines | 20 | [M-H]− | IS_PS_28:0-d54 |
| Lyso-cardiolipins | 23 | [M-H]− | IS_TG_45:0-d87 |
| Monoacylglycerols | 1 | [M+H-H2O]+, [M+Na]+, [M+K]+ | IS_TG_45:0-d87 |
| Phosphatidic acids | 26 | [M-H]− | IS_PA_34:1-d31 |
| Phosphatidylcholines | 43 | [M+H]+ | IS_PC_34:1-d31 |
| Phosphatidylethanolamines | 19 | [M+H]+ | IS_PE_34:1-d31 |
| Phosphatidylglycerol | 34 | [M-H]− | IS_PG_34:1-d31 |
| Phosphatidylinositols | 21 | [M-H]− | IS_PI_34:1-d31 |
| Phosphatidylserines | 36 | [M-H]− | IS_PS_28:0-d54 |
| Sulfatides | 72 | [M-H]− | IS_PG_34:1-d31 |
| Sphingomyelins | 54 | [M+H]+, [M+Na]+, [M+K]+ | IS_SM_34:1-d31 |
| Triacylglycerides | 89 | [M+H]+, [M+NH4]+, [M+Na]+, [M+K]+ | IS_TG_45:0-d87 |
| Diet | Corn Oil | MCT Oil | Beef Tallow |
|---|---|---|---|
| 1 | 50% | 16.4% | 3.6% |
| 2 | 35% | 28.7% | 6.3% |
| 3 | 20% | 41.0% | 9.0% |
| 4 | 5% | 53.3% | 11.7% |
© 2020 by the authors. Licensee MDPI, Basel, Switzerland. This article is an open access article distributed under the terms and conditions of the Creative Commons Attribution (CC BY) license (http://creativecommons.org/licenses/by/4.0/).
Share and Cite
Jenkins, B.; Ronis, M.; Koulman, A. LC–MS Lipidomics: Exploiting a Simple High-Throughput Method for the Comprehensive Extraction of Lipids in a Ruminant Fat Dose-Response Study. Metabolites 2020, 10, 296. https://doi.org/10.3390/metabo10070296
Jenkins B, Ronis M, Koulman A. LC–MS Lipidomics: Exploiting a Simple High-Throughput Method for the Comprehensive Extraction of Lipids in a Ruminant Fat Dose-Response Study. Metabolites. 2020; 10(7):296. https://doi.org/10.3390/metabo10070296
Chicago/Turabian StyleJenkins, Benjamin, Martin Ronis, and Albert Koulman. 2020. "LC–MS Lipidomics: Exploiting a Simple High-Throughput Method for the Comprehensive Extraction of Lipids in a Ruminant Fat Dose-Response Study" Metabolites 10, no. 7: 296. https://doi.org/10.3390/metabo10070296