Micro-Macro Relationship between Microstructure, Porosity, Mechanical Properties, and Build Mode Parameters of a Selective-Electron-Beam-Melted Ti-6Al-4V Alloy


Abstract
:1. Introduction
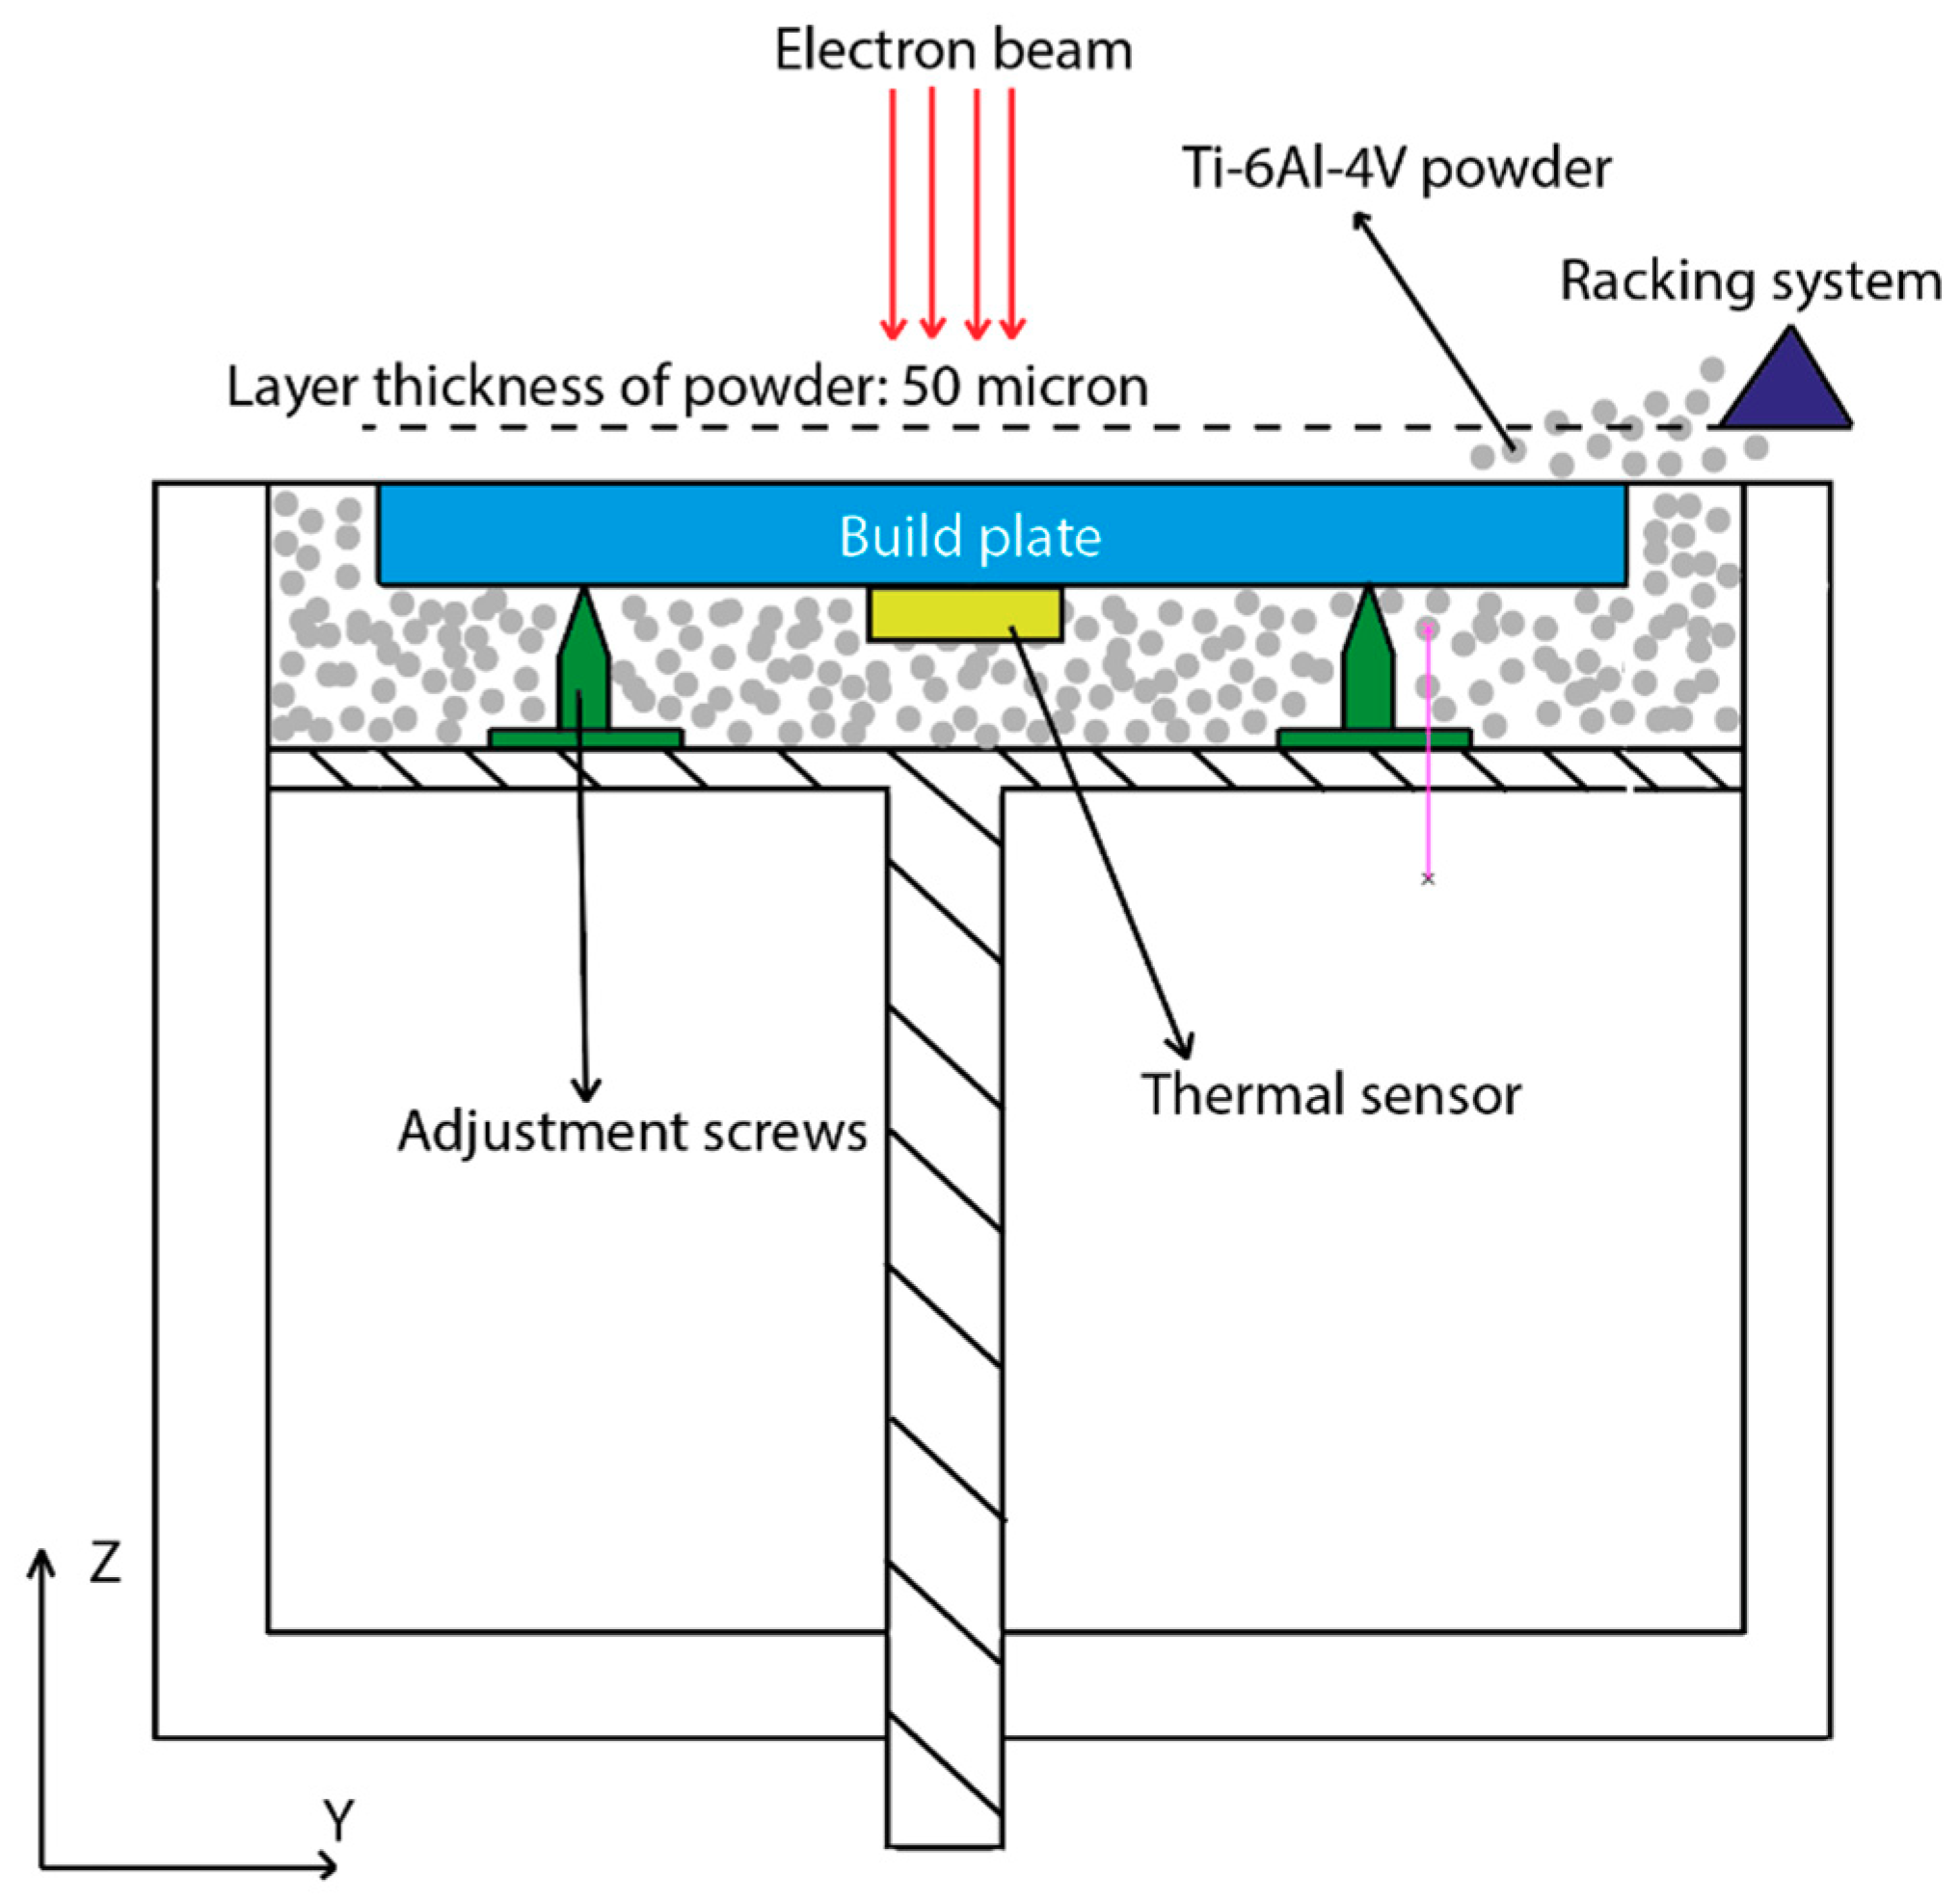
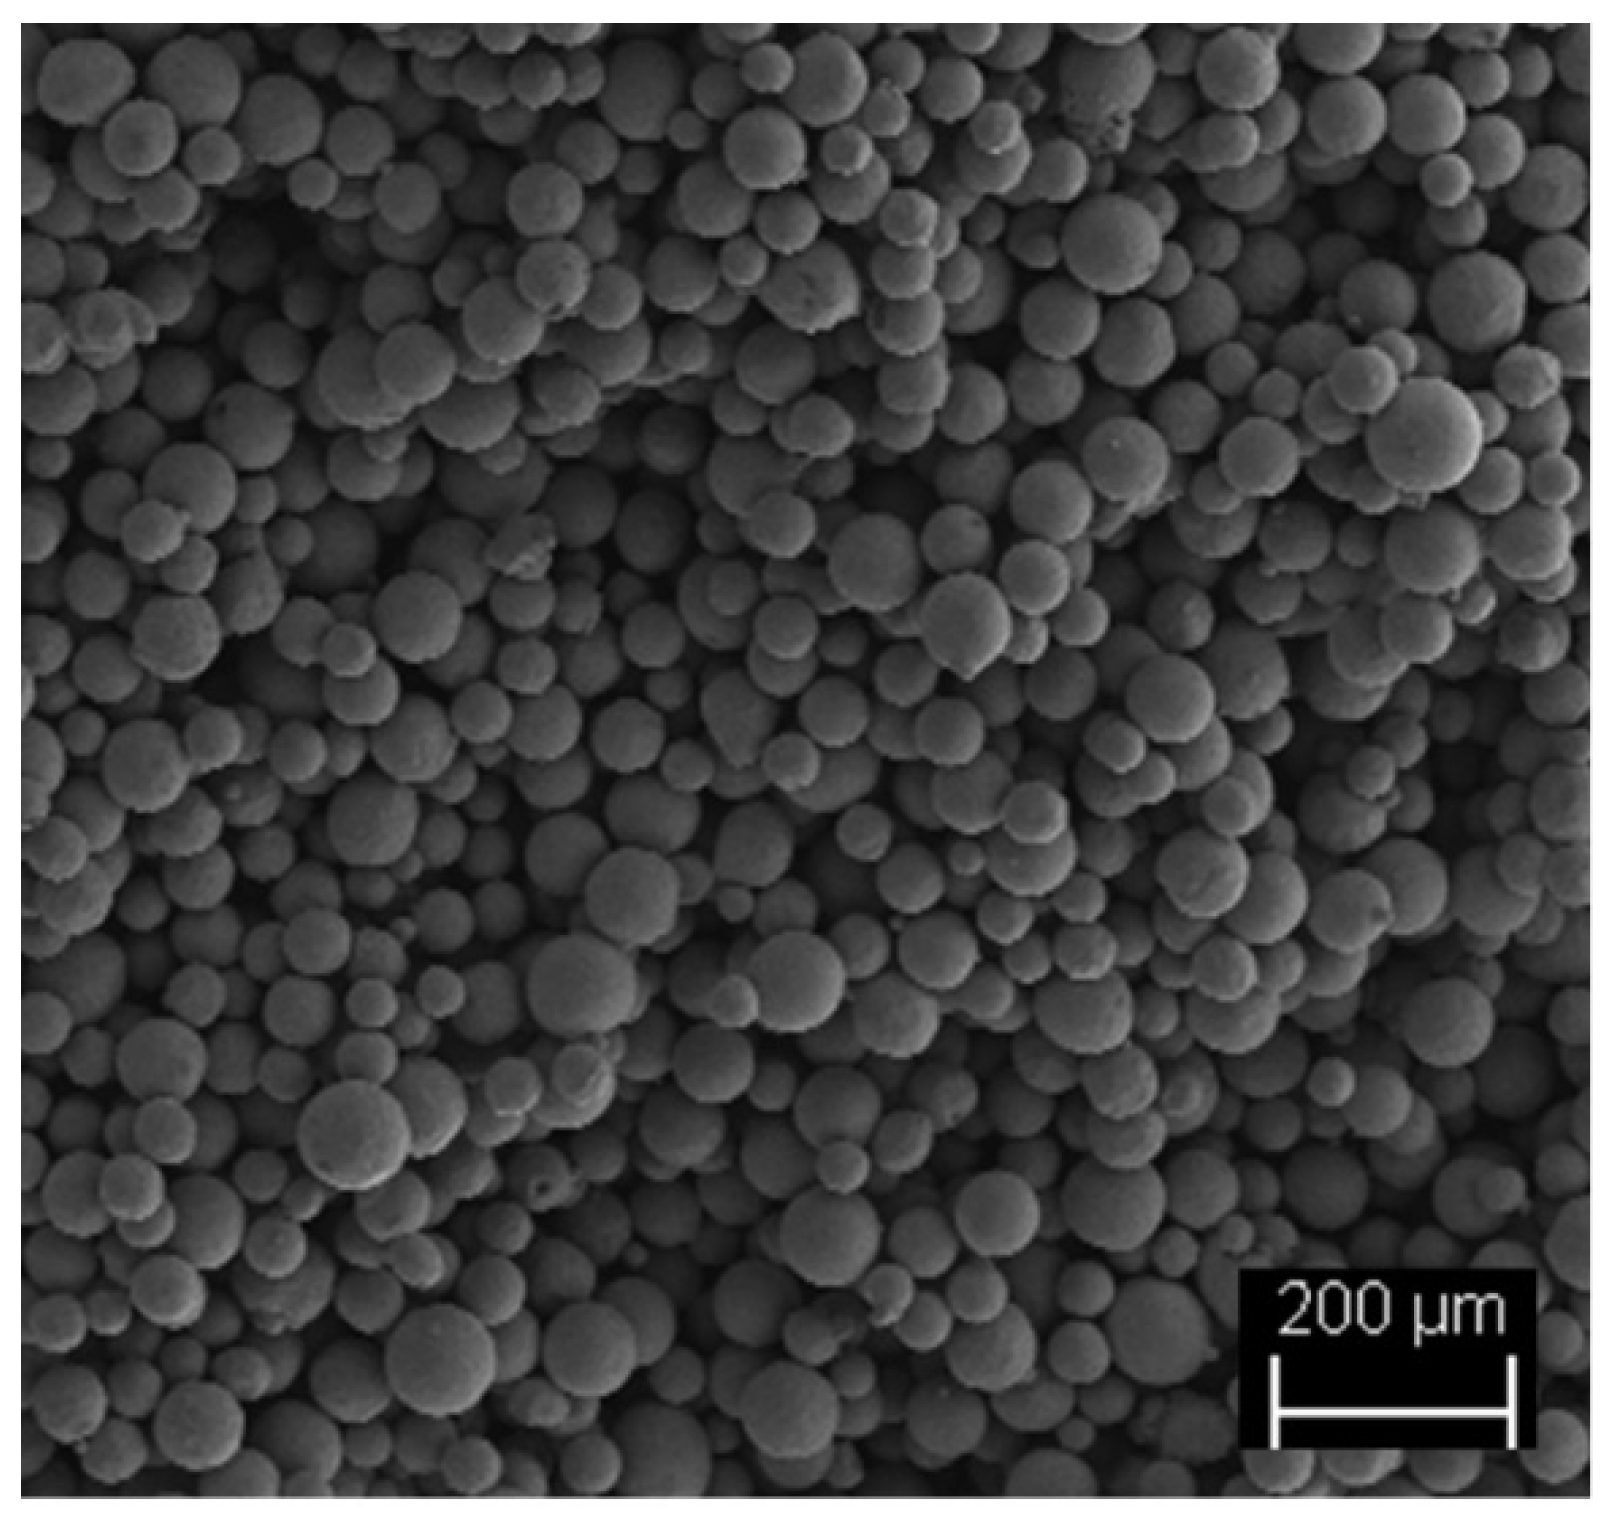
2. Materials and Methods
3. Results and Discussion
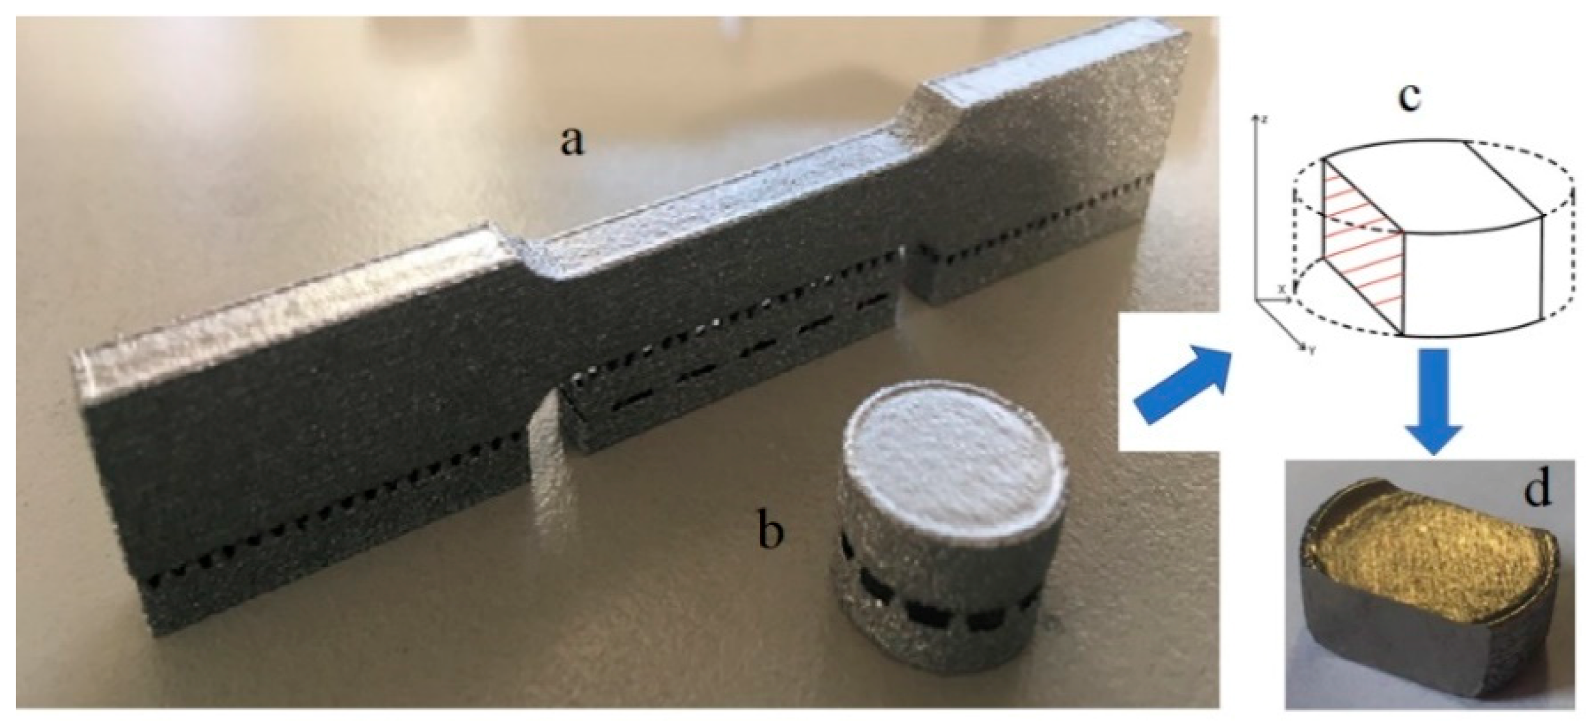
3.1. Visual Inspection
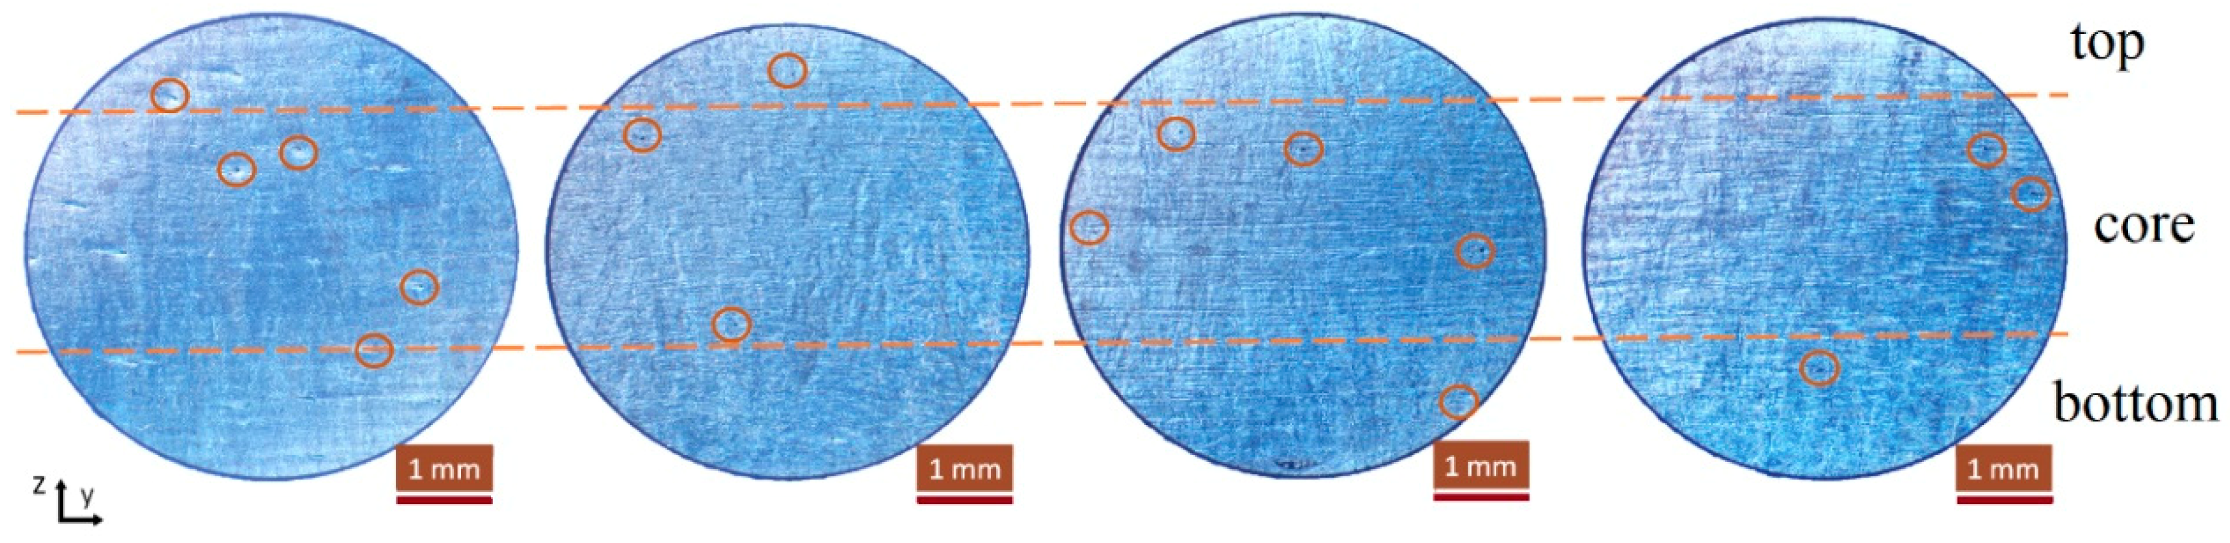
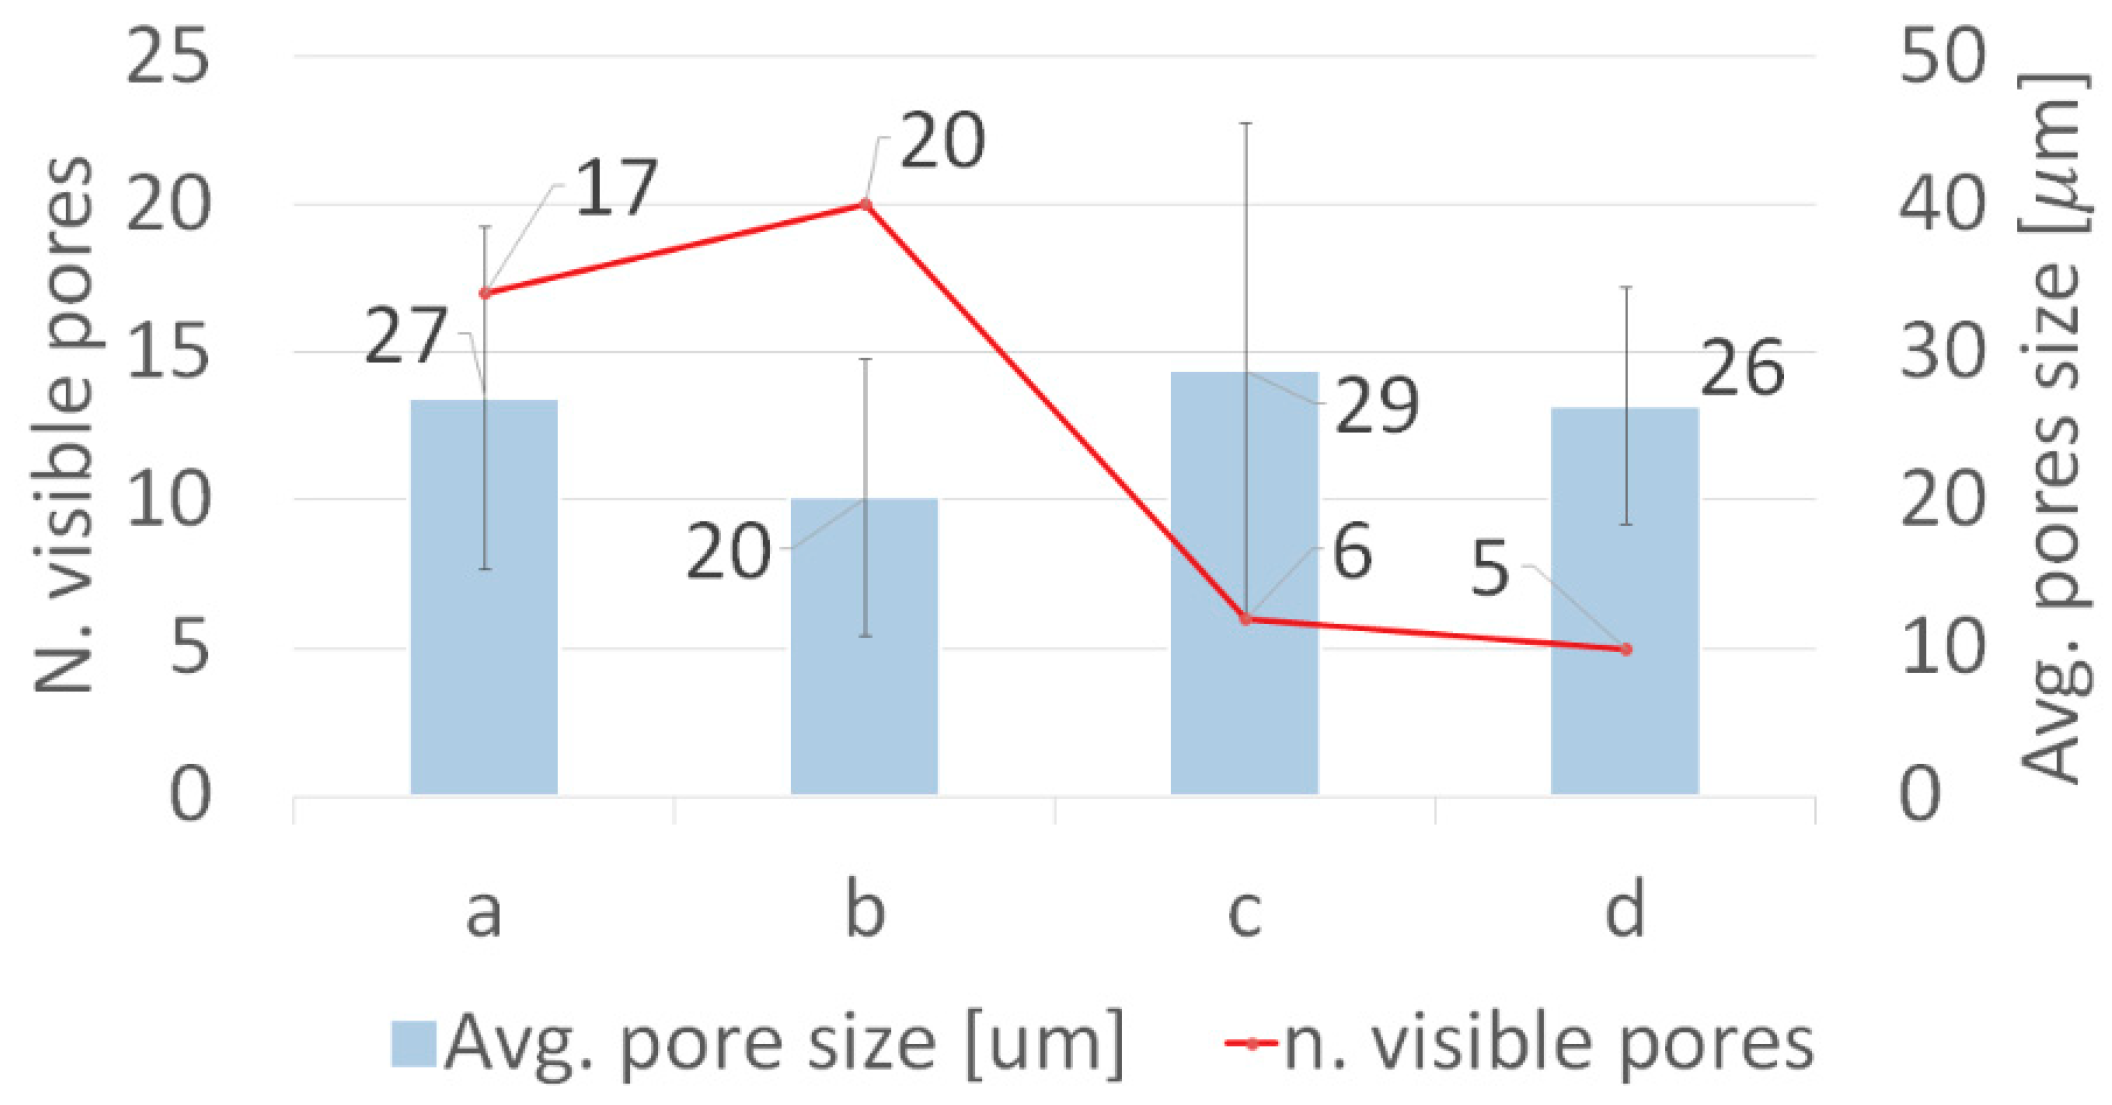
3.2. Porosity and Density
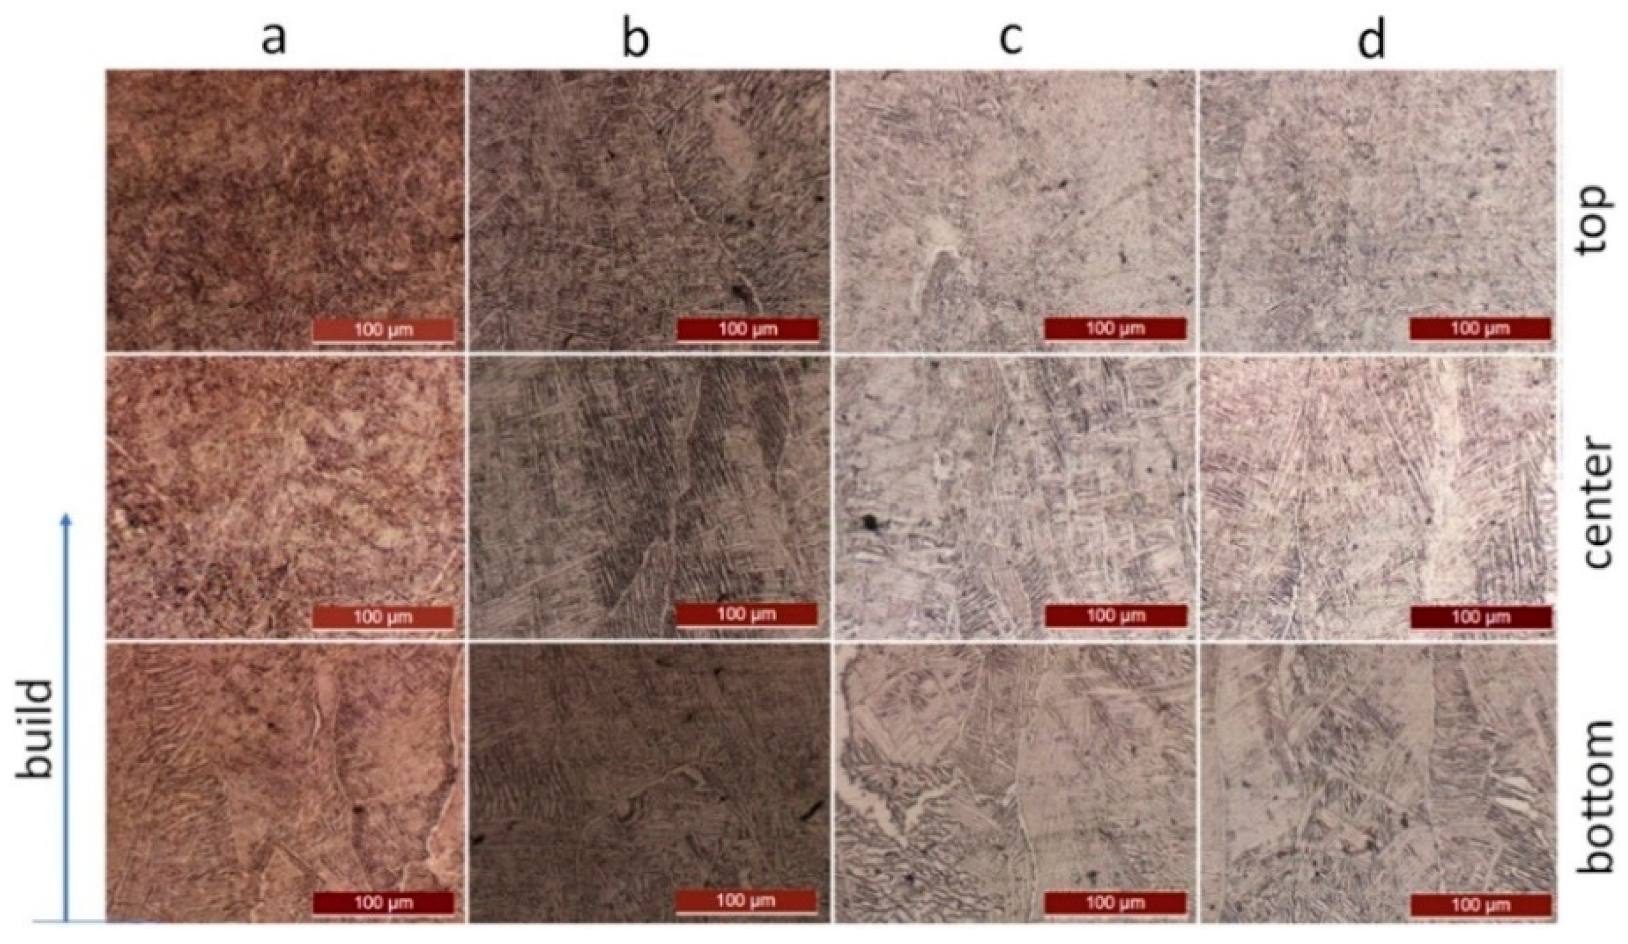
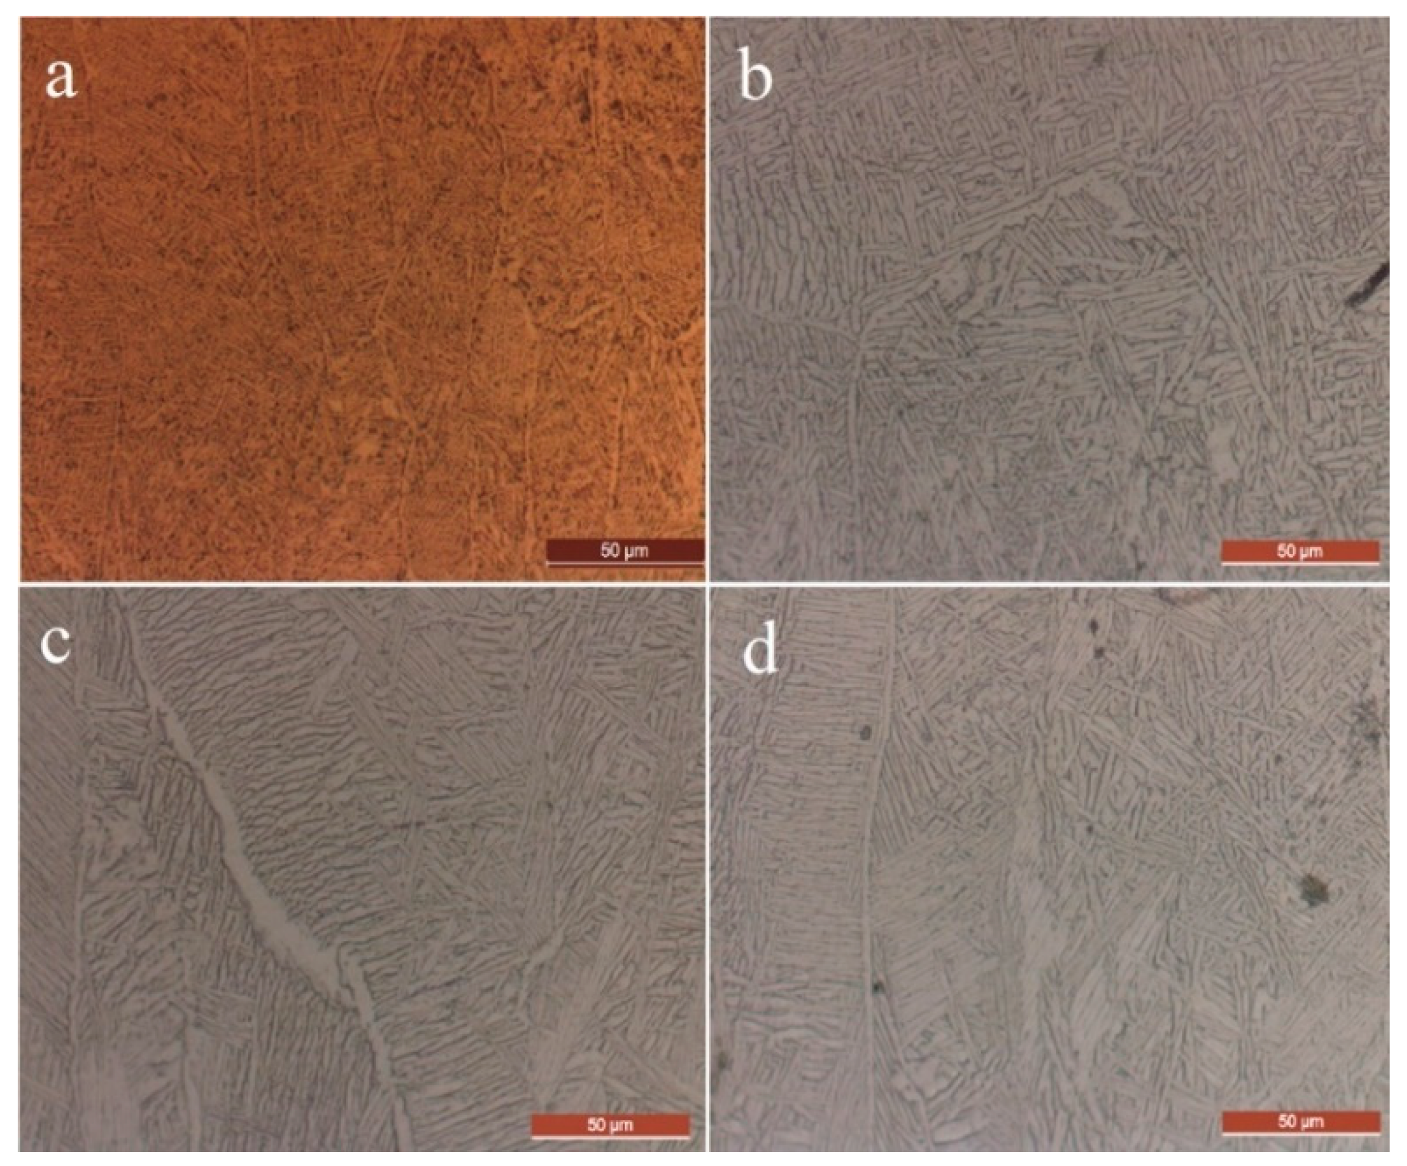
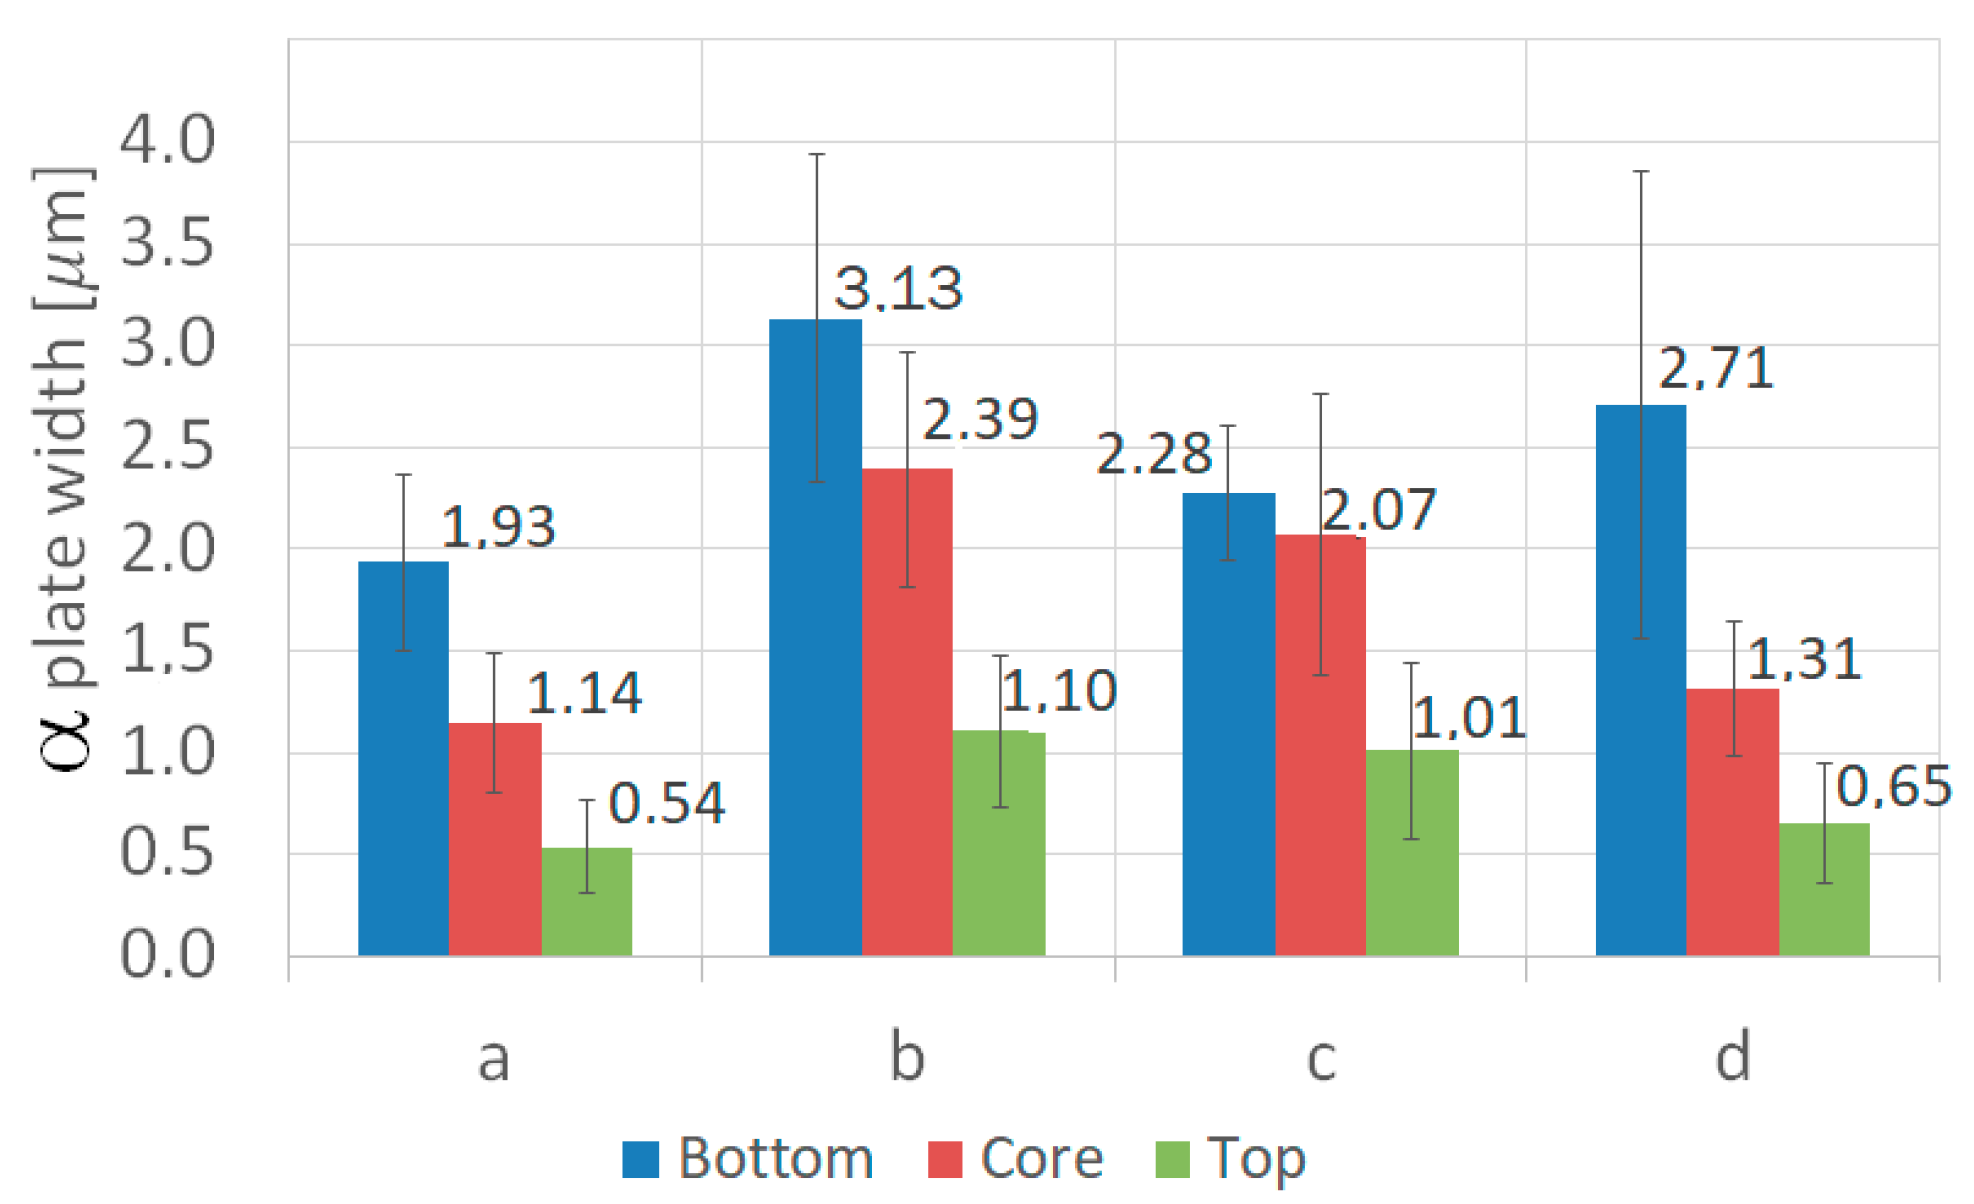
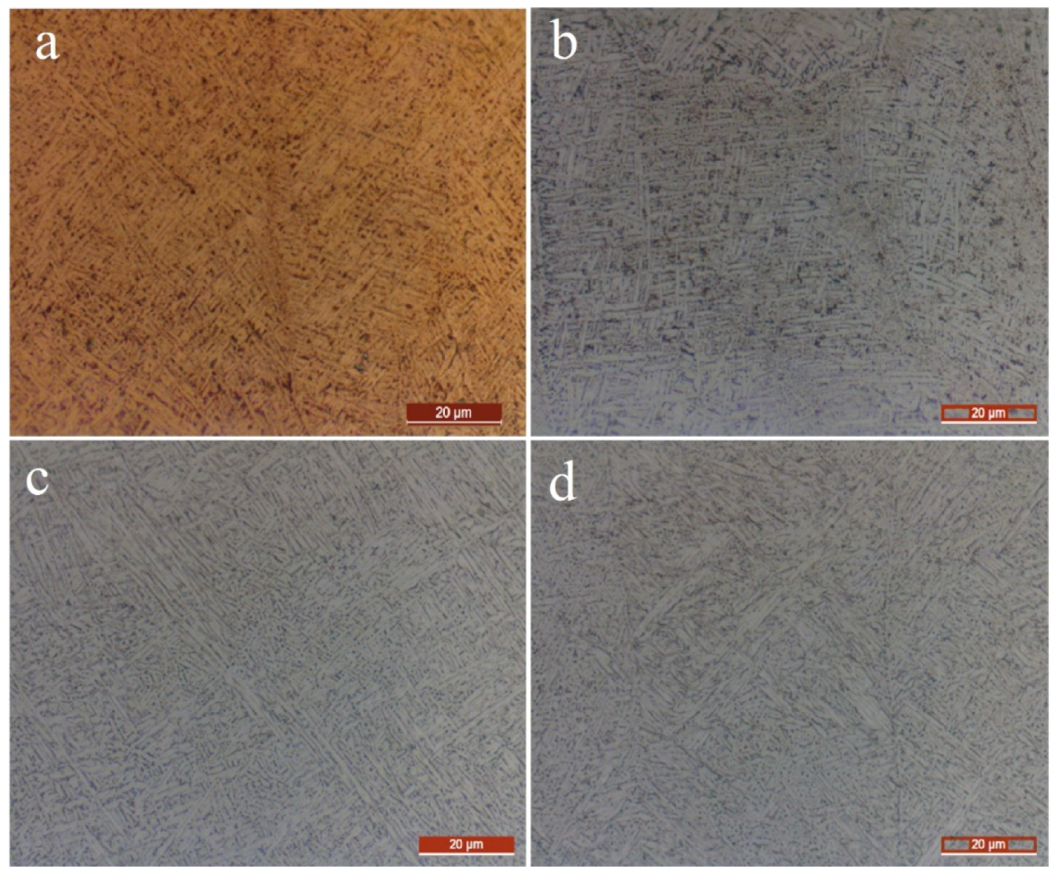
3.3. Microstructures
3.3.1. Bottom Region
3.3.2. Core Region
3.3.3. Top Region
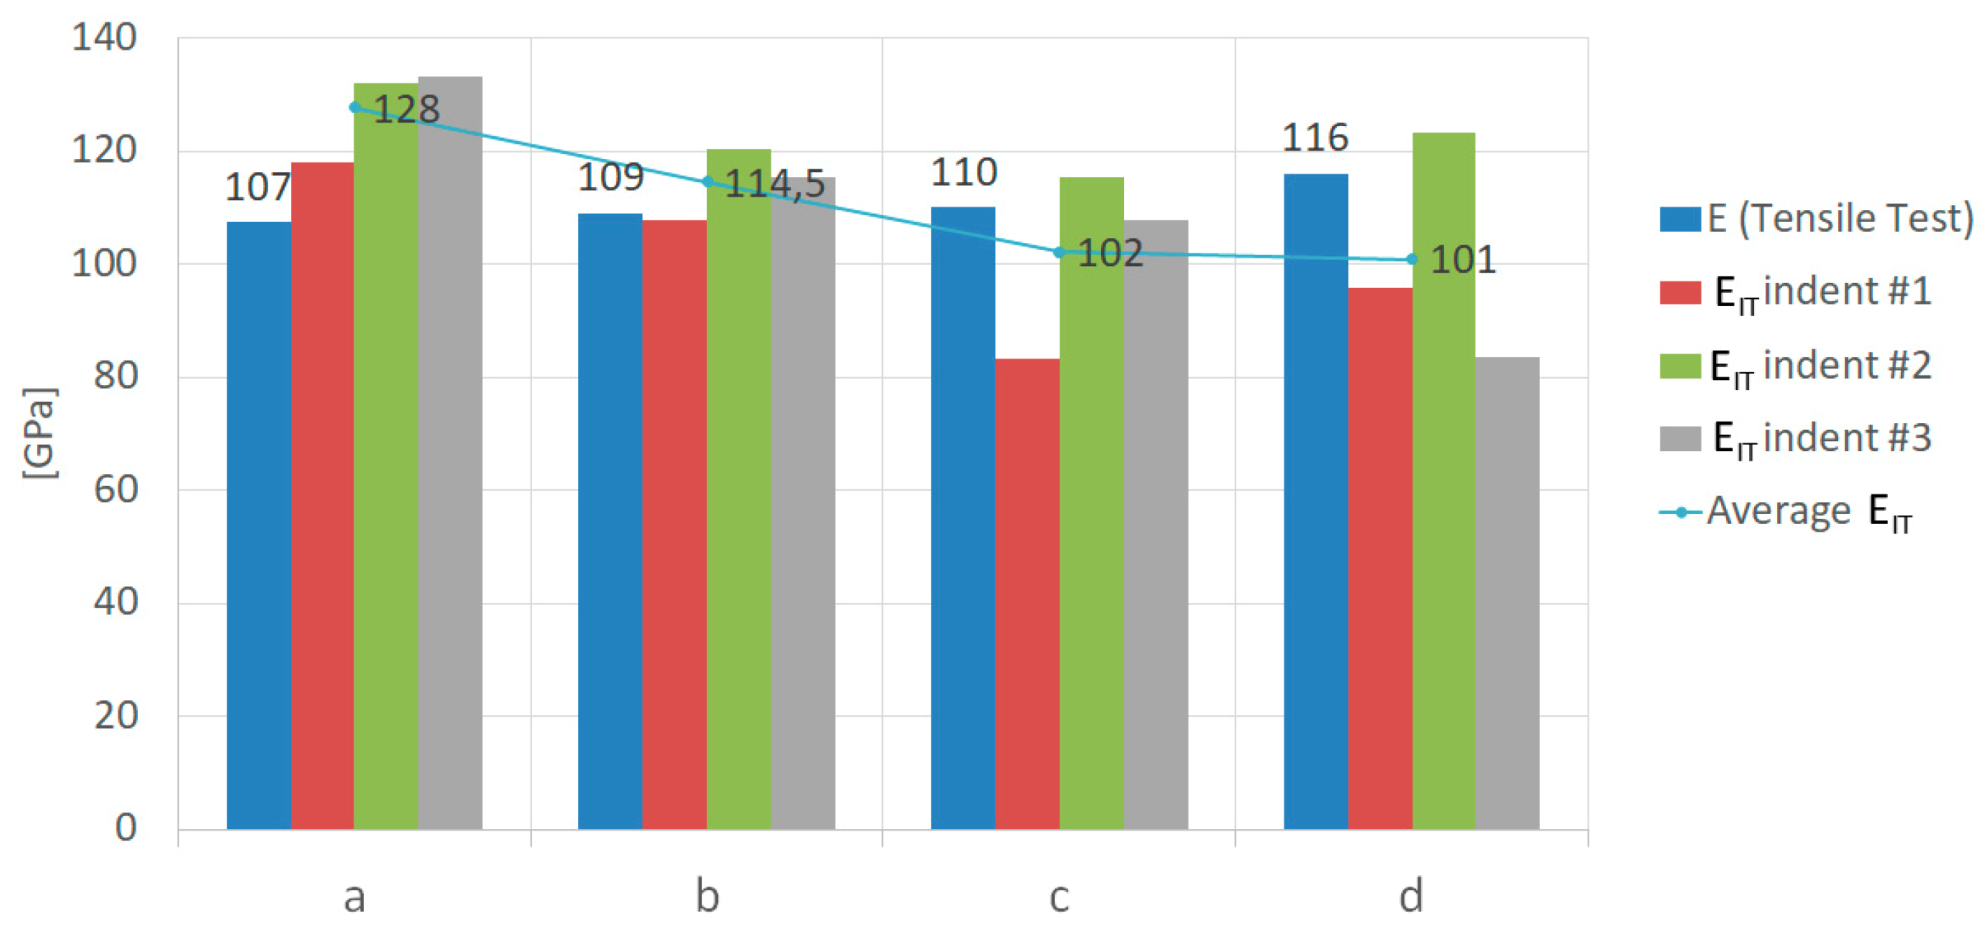
3.4. Tensile Test
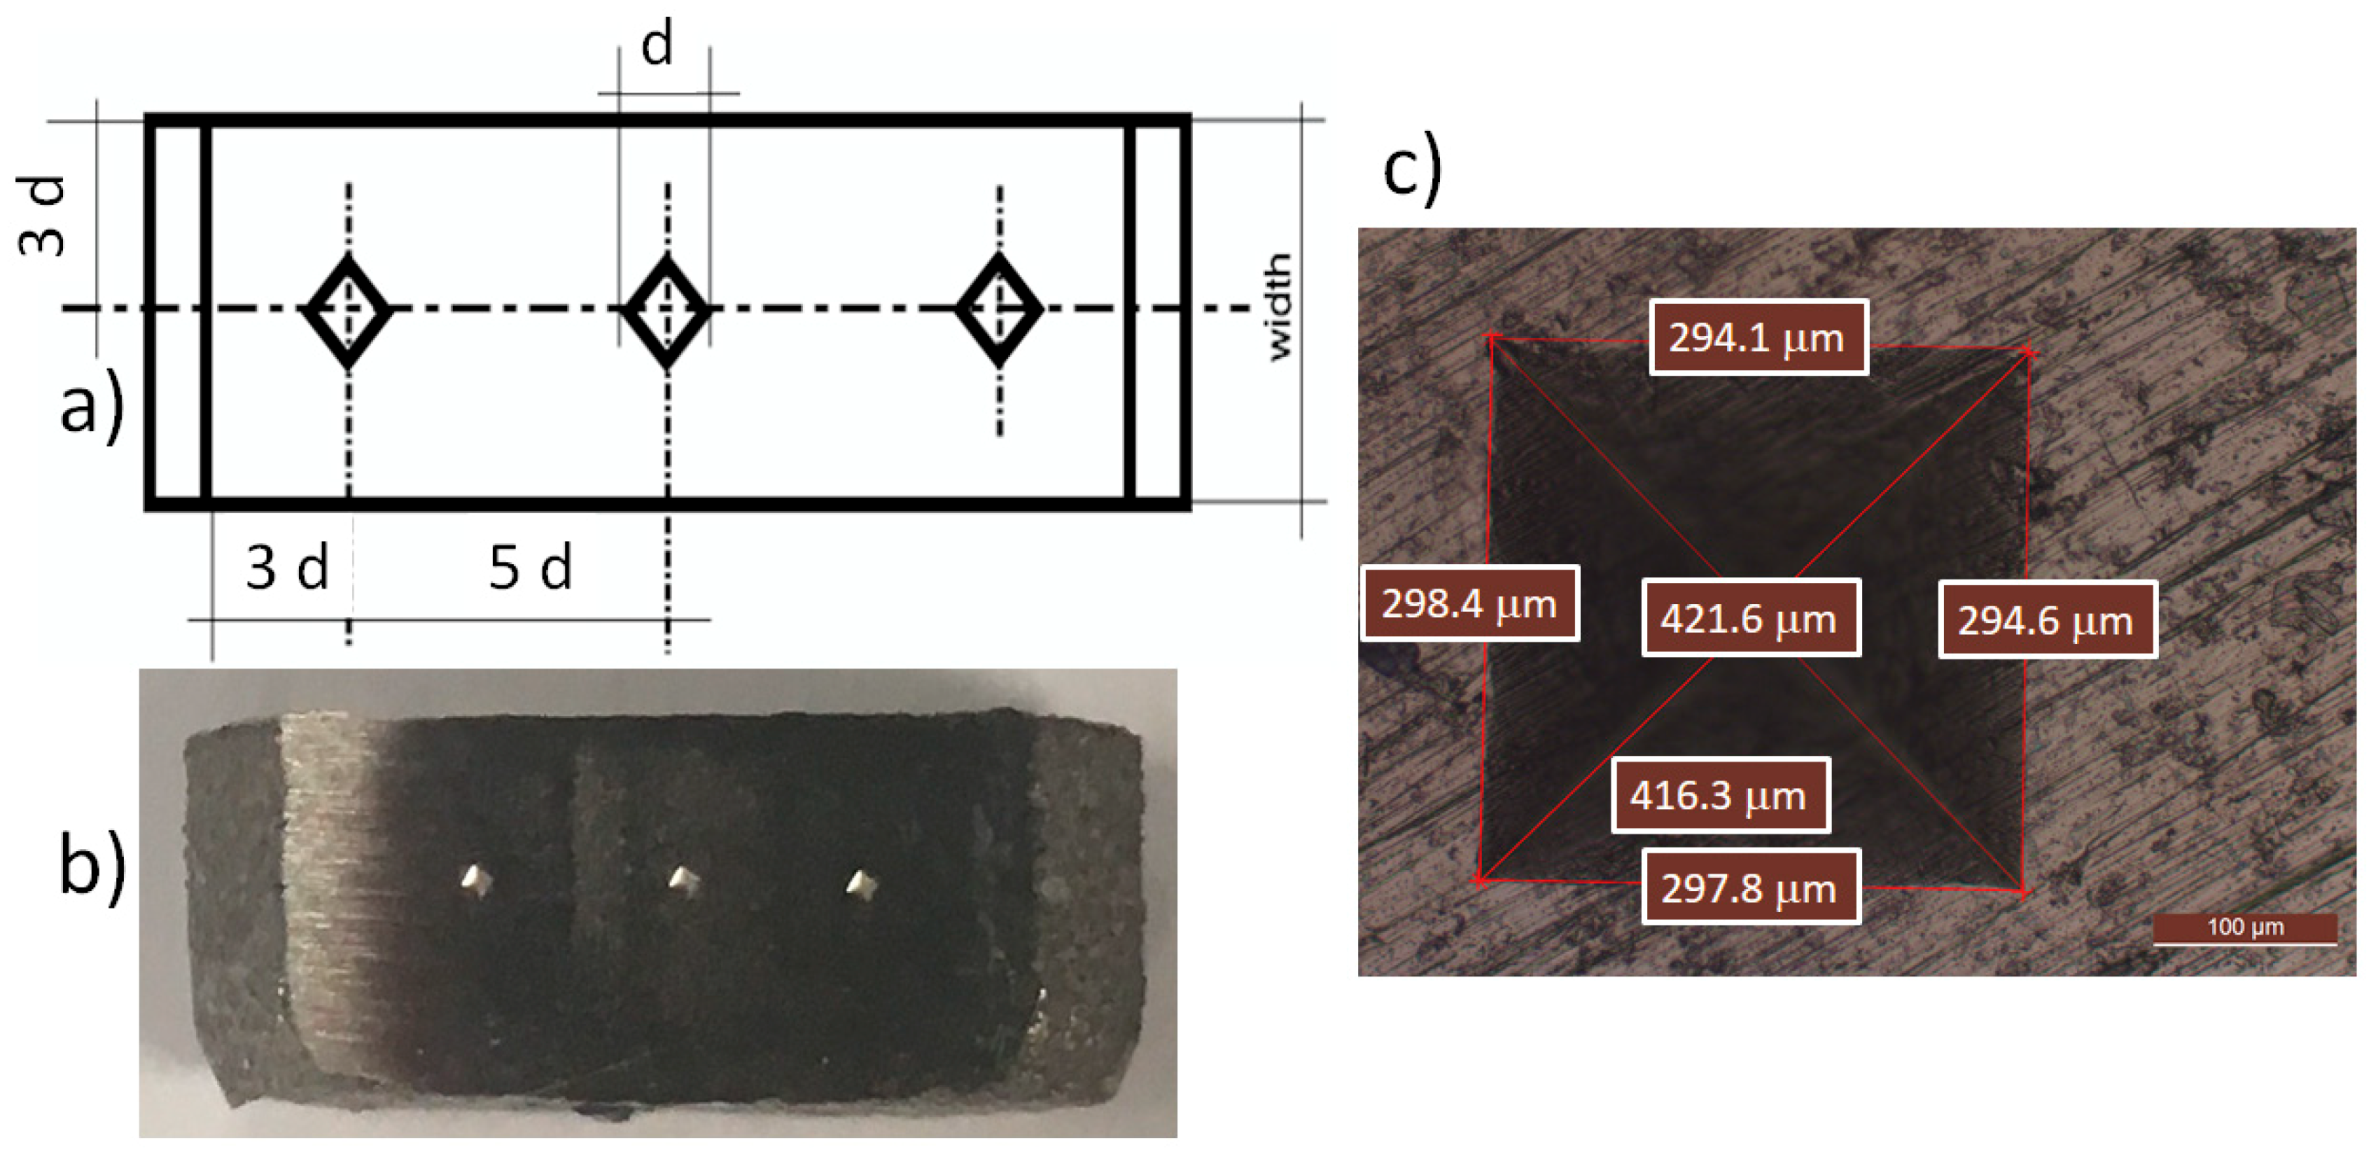
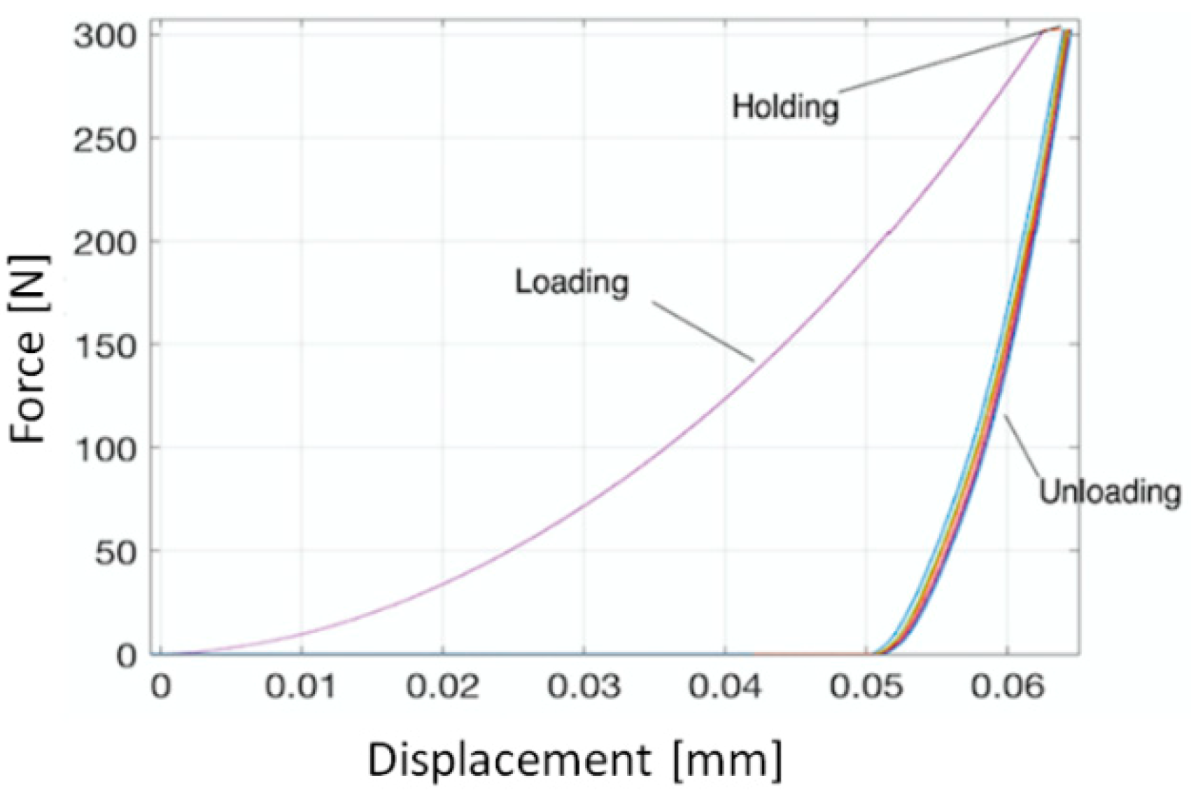
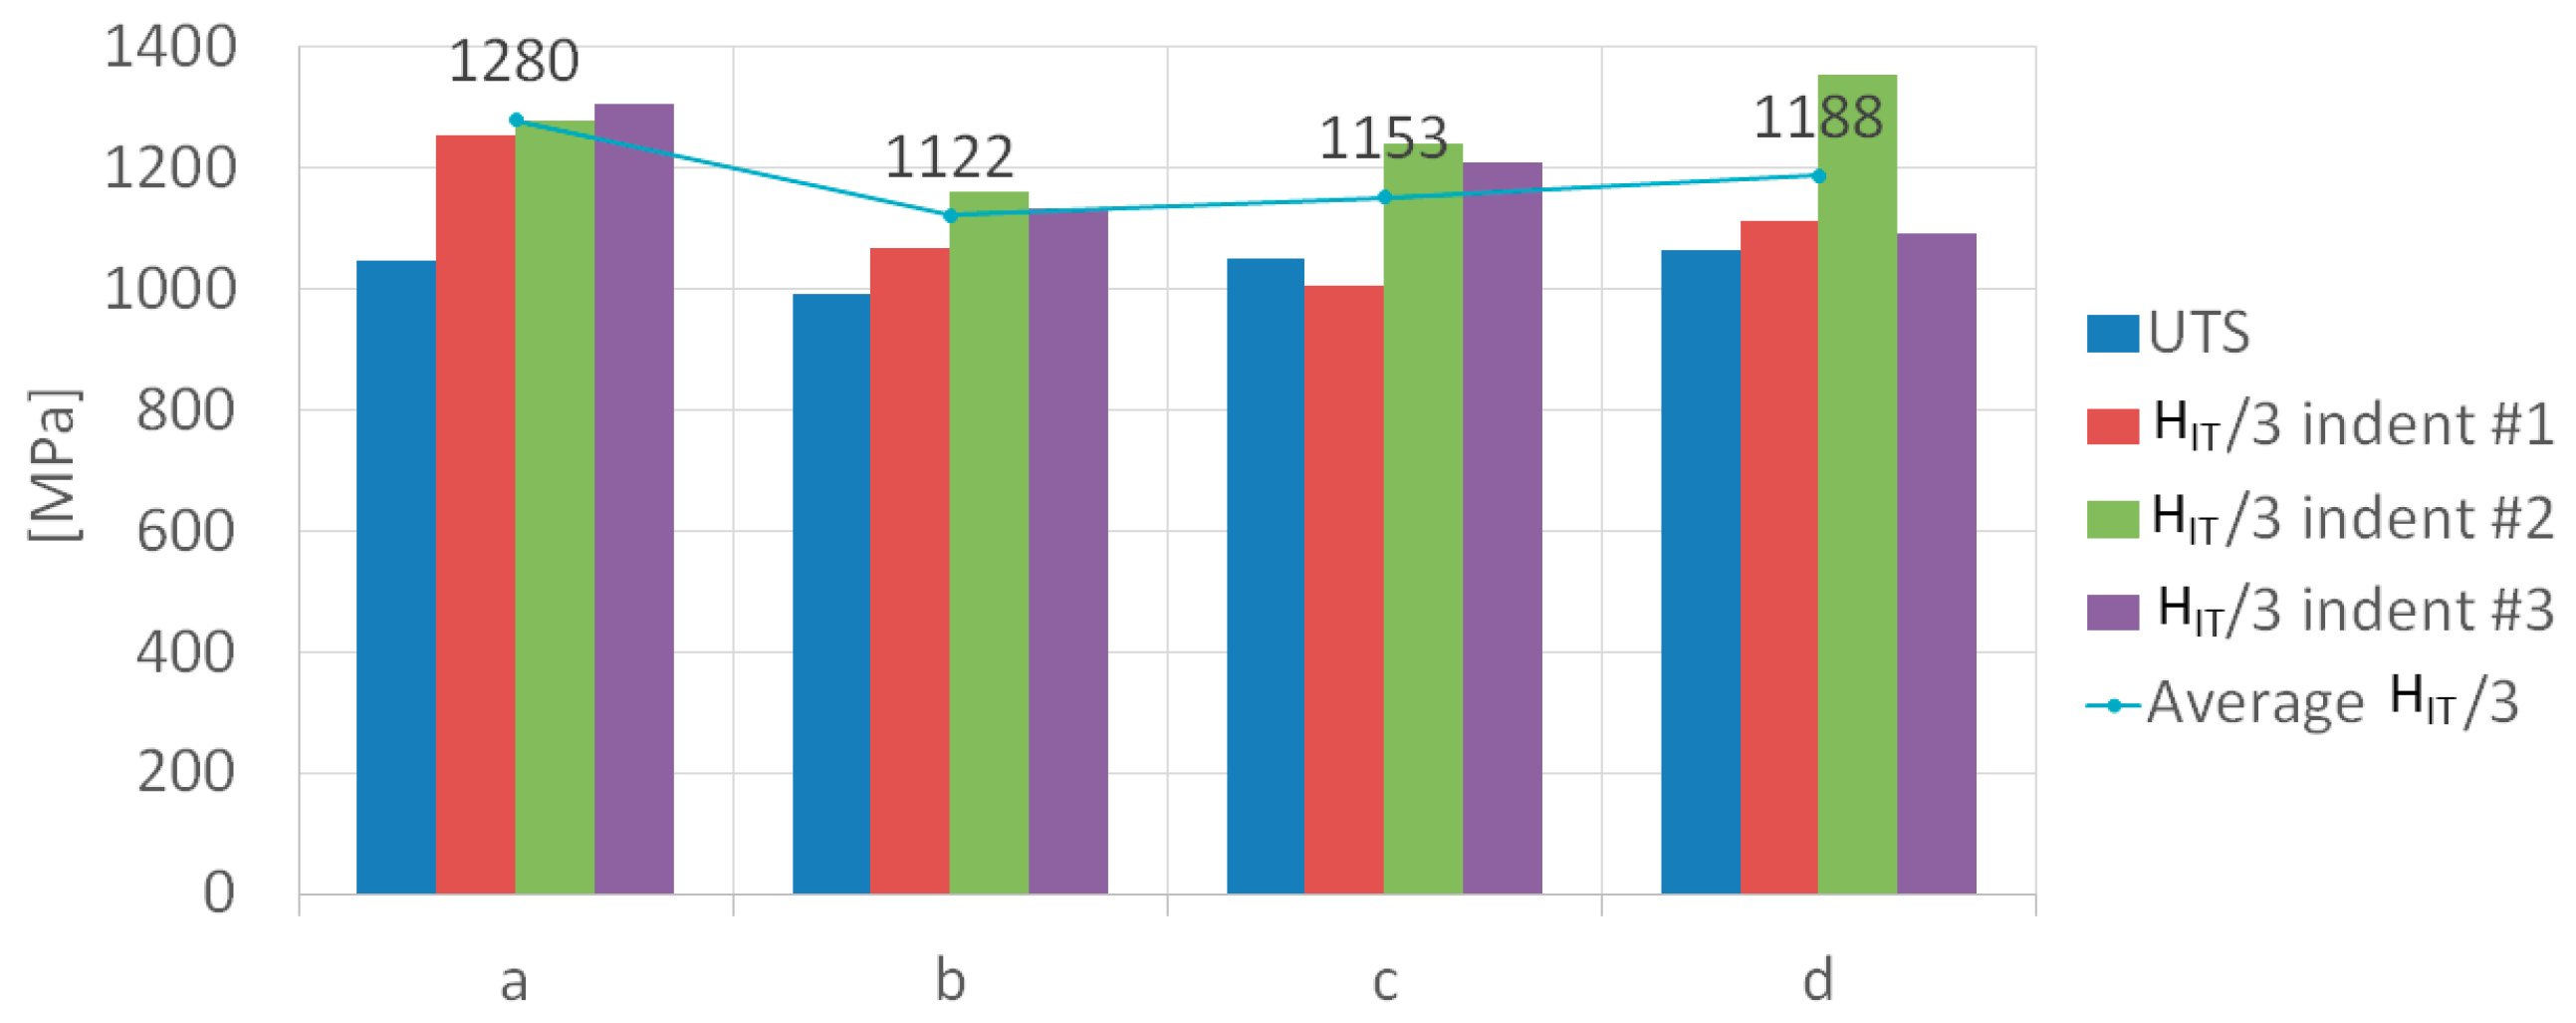
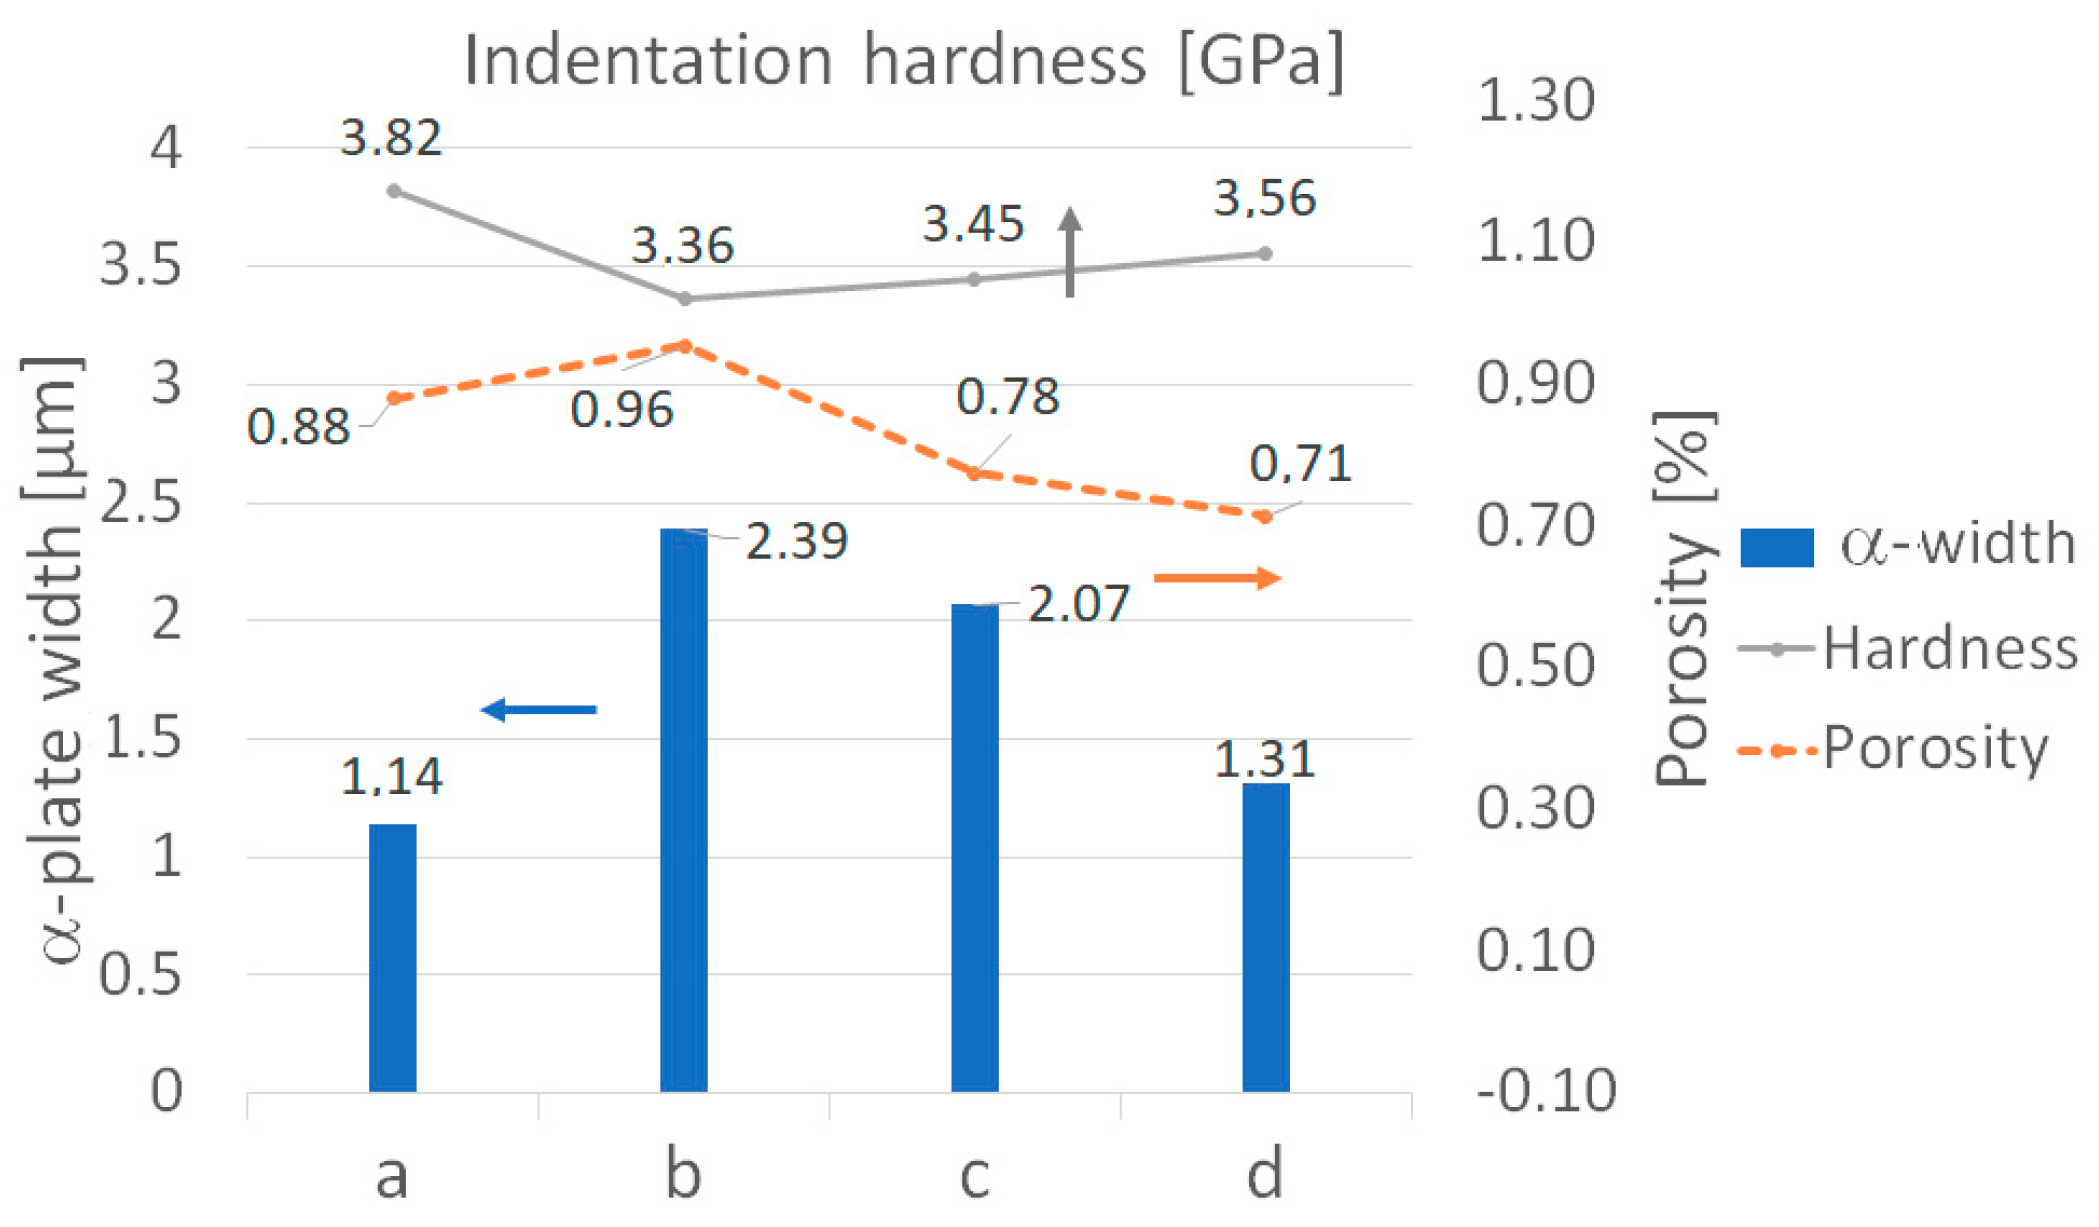
3.5. Macro-Instrumented Indentation Test
4. Conclusions
Author Contributions
Funding
Conflicts of Interest
References
- Körner, C. Additive manufacturing of metallic components by selective electron beam melting—A review. Int. Mater. Rev. 2016, 61, 361–377. [Google Scholar] [CrossRef]
- Guo, N.; Leu, M.C. Additive manufacturing: technology, applications and research needs. Front. Mech. Eng. Chin. 2013, 8, 215–243. [Google Scholar] [CrossRef]
- Murr, L.E.; Quinones, S.A.; Gaytan, S.M.; Lopez, M.I.; Rodela, A.; Martinez, E.Y.; Hernandez, D.H.; Martinez, E.; Medina, F.; Wicker, R.B. Microstructure and mechanical behavior of Ti-6Al-4V produced by rapid-layer manufacturing, for biomedical applications. J. Mech. Behav. Biomed. Mater. 2009, 2, 20–32. [Google Scholar] [CrossRef] [PubMed]
- Koike, M.; Martinez, K.; Guo, L.; Chahine, G.; Kovacevic, R.; Okabe, T. Evaluation of titanium alloy fabricated using electron beam melting system for dental applications. J. Mater. Process. Technol. 2009, 211, 1400–1408. [Google Scholar] [CrossRef]
- Syam, W.P.; Al-Shehri, H.A.; Al-Ahmari, A.M.; Al-Wazzan, K.A.; Mannan, M.A. Preliminary fabrication of thin-wall structure of Ti-6Al-4V for dental restoration by electron beam melting. Rapid Prototyping J. 2012, 18, 230–240. [Google Scholar] [CrossRef]
- Seifi, M.; Salem, A.; Beuth, J.; Harrysson, O.; Lewandowski, J.J. Overview of materials qualification needs for metal additive manufacturing. JOM 2016, 68, 747–764. [Google Scholar] [CrossRef]
- Gorsse, S.; Hutchinson, C.; Gouné, M.; Banerjee, R. Additive manufacturing of metals: a brief review of the characteristic microstructures and properties of steels, Ti-6Al-4V and high-entropy alloys. Sci. Technol. Adv. Mater. 2017, 18, 584–610. [Google Scholar] [CrossRef] [Green Version]
- Murr, L.E.; Gaytan, S.M.; Ramirez, D.A.; Martinez, E.; Hernandez, J.; Amato, K.N.; Shindo, P.W.; Medina, F.R.; Wicker, R.B. Metal fabrication by additive manufacturing using laser and electron beam melting technologies. J. Mater. Sci. Technol. 2012, 28, 1–14. [Google Scholar] [CrossRef]
- Neira-Arce, A. Thermal Modeling and Simulation of Electron Beam Melting for Rapid Prototyping on Ti6Al4V Alloys; North Carolina State University: Raleigh, NC, USA, 2012. [Google Scholar]
- Puebla, K.; Murr, L.E.; Gaytan, S.M.; Martinez, E.; Medina, F.; Wicker, R.B. Effect of melt scan rate on microstructure and macrostructure for electron beam melting of Ti-6Al-4V. Mater. Sci. Appl. 2012, 3, 259. [Google Scholar] [CrossRef]
- Tan, X.; Kok, Y.; Toh, W.Q.; Tan, Y.J.; Descoins, M.; Mangelinck, D.; Tor, S.B.; Leong, K.F.; Chua, C.K. Revealing martensitic transformation and α/β interface evolution in electron beam melting three-dimensional-printed Ti-6Al-4V. Sci. Rep. 2016, 6, 26039. [Google Scholar] [CrossRef]
- Koike, M.; Greer, P.; Owen, K.; Lilly, G.; Murr, L.E.; Gaytan, S.M.; Martinez, E.; Okabe, T. Evaluation of titanium alloys fabricated using rapid prototyping technologies—Electron beam melting and laser beam melting. Materials 2011, 4, 1776–1792. [Google Scholar] [CrossRef] [PubMed]
- Rafi, H.K.; Karthik, N.V.; Gong, H.; Starr, T.L.; Stucker, B.E. Microstructures and mechanical properties of Ti6Al4V parts fabricated by selective laser melting and electron beam melting. J. Mater. Eng. Perform. 2013, 22, 3872–3883. [Google Scholar] [CrossRef]
- Weißmann, V.; Drescher, P.; Bader, R.; Seitz, H.; Hansmann, H.; Laufer, N. Comparison of single Ti6Al4V struts made using selective laser melting and electron beam melting subject to part orientation. Metals 2017, 7, 91. [Google Scholar] [CrossRef]
- Hrabe, N.; Quinn, T. Effects of processing on microstructure and mechanical properties of a titanium alloy (Ti-6Al-4V) fabricated using electron beam melting (EBM), part 1: Distance from build plate and part size. Mater. Sci. Eng., A 2013, 573, 264–270. [Google Scholar] [CrossRef]
- Gaytan, S.M.; Murr, L.E.; Medina, F.; Martinez, E.; Lopez, M.I.; Wicker, R.B. Advanced metal powder based manufacturing of complex components by electron beam melting. Mater. Technol. 2009, 24, 180–190. [Google Scholar] [CrossRef]
- Zhang, P.; Li, S.X.; Zhang, Z.F. General relationship between strength and hardness. Mater. Sci. Eng. A 2011, 529, 62–73. [Google Scholar] [CrossRef]
- Al-Bermani, S.S.; Blackmore, M.L.; Zhang, W.; Todd, I. The origin of microstructural diversity, texture, and mechanical properties in electron beam melted Ti-6Al-4V. Metall. Mater. Trans. A 2010, 41, 3422–3434. [Google Scholar] [CrossRef]
- Mandil, G.; Paris, H.; Suard, M. Building new entities from existing titanium part by electron beam melting: microstructures and mechanical properties. Int. J. Adv. Manuf. Technol. 2016, 85, 1835–1846. [Google Scholar] [CrossRef]
- Guo, C.; Ge, W.; Lin, F. Effects of scanning parameters on material deposition during Electron Beam Selective Melting of Ti-6Al-4V powder. J. Mater. Process. Technol. 2015, 217, 148–157. [Google Scholar] [CrossRef]
- Safdar, A.; Wei, L.Y.; Snis, A.; Lai, Z. Evaluation of microstructural development in electron beam melted Ti-6Al-4V. Mater. Charact. 2012, 65, 8–15. [Google Scholar] [CrossRef]
- Milberg, J.; Sigl, M. Electron beam sintering of metal powder. Prod. Eng. 2008, 2, 117–122. [Google Scholar] [CrossRef]
- Weiwei, H.; Wenpeng, J.; Haiyan, L.; Huiping, T.; Xinting, K.; Yu, H. Research on preheating of titanium alloy powder in electron beam melting technology. Rare Metal Mater. Eng. 2011, 40, 2072–2075. [Google Scholar] [CrossRef]
- Drescher, P.; Sarhan, M.; Seitz, H. An investigation of sintering parameters on titanium powder for electron beam melting processing optimization. Materials 2016, 9, 974. [Google Scholar] [CrossRef] [PubMed]
- Tan, X.; Kok, Y.; Tan, Y.J.; Descoins, M.; Mangelinck, D.; Tor, S.B.; Leong, K.F.; Chua, C.K. Graded microstructure and mechanical properties of additive manufactured Ti-6Al-4V via electron beam melting. Acta Mater. 2015, 97, 1–16. [Google Scholar] [CrossRef]
- Karlsson, J.; Snis, A.; Engqvist, H.; Lausmaa, J. Characterization and comparison of materials produced by Electron Beam Melting (EBM) of two different Ti-6Al-4V powder fractions. J. Mater. Process. Technol. 2013, 213, 2109–2118. [Google Scholar] [CrossRef]
- Williams, T.; Zhao, H.; Léonard, F.; Derguti, F.; Todd, I.; Prangnell, P.B. XCT analysis of the influence of melt strategies on defect population in Ti-6Al-4V components manufactured by Selective Electron Beam Melting. Mater. Charact. 2015, 102, 47–61. [Google Scholar] [CrossRef]
- Zhang, L.C.; Liu, Y.; Hao, Y. Additive manufacturing of Titanium alloys by Electron Beam Melting: A Review. Adv. Eng. Mater. 2018, 20, 1700842. [Google Scholar] [CrossRef]
- Dinwiddie, R.B.; Kirka, M.M.; Lloyd, P.D.; Dehoff, R.R.; Lowe, L.E.; Marlow, G.S. Calibrating IR Cameras for in-Situ Temperature Measurement during the Electron Beam Melt Processing of Inconel 718 and Ti-Al6-V4. Proceeding of the Thermosense: Thermal Infrared Applications XXXVIII, Baltimore, MD, USA, 18–21 April 2016. [Google Scholar]
- Raplee, J.; Plotkowski, A.; Kirka, M.M.; Dinwiddie, R.; Okello, A.; Dehoff, R.R.; Babu, S.S. Thermographic microstructure monitoring in electron beam additive manufacturing. Sci. Rep. 2017, 7, 43554. [Google Scholar] [CrossRef]
- SridharBabu, B.; Kumaraswamy, A.; AnjaneyaPrasad, B. Effect of Indentation Size and Strain Rate on Nanomechanical Behavior of Ti-6Al-4VAlloy. Trans. Indian Inst. Met. 2015, 68, 143–150. [Google Scholar] [CrossRef]
- Lancaster, R.; Davies, G.; Illsley, H.; Jeffs, S.; Baxter, G. Structural Integrity of an Electron Beam Melted Titanium Alloy. Materials 2016, 9, 470. [Google Scholar] [CrossRef]
- International Organization for Standardization. Metallic Materials: Instrumented Indentation Test for Hardness and Materials Parameters. Verification and Calibration of Testing Machines; ISO: Geneva, Switzerland, 2002. [Google Scholar]
- Chahine, G.; Koike, M.; Okabe, T.; Smith, P.; Kovacevic, R. The design and production of Ti-6Al-4V ELI customized dental implants. JOM 2008, 60, 50–55. [Google Scholar] [CrossRef]
- Drescher, P.; Reimann, T.; Seitz, H. Investigation of powder removal of net–structured titanium parts made from electron beam melting. Int. J. Rapid Manuf. 2014, 4, 81–89. [Google Scholar] [CrossRef]
- Delo, D.P.; Piehler, H.R. Early stage consolidation mechanisms during hot isostatic pressing of Ti-6Al-4V powder compacts. Acta Mater. 1999, 47, 2841–2852. [Google Scholar] [CrossRef]
- Facchini, L.; Magalini, E.; Robotti, P.; Molinari, A. Microstructure and mechanical properties of Ti-6Al-4V produced by electron beam melting of pre-alloyed powders. Rapid Prototyping J. 2009, 15, 171–178. [Google Scholar] [CrossRef]
- Froes, F.H. Titanium Physical Metallurgy, Processing and Applications; ASM International: Geauga County, OH, USA, 2015. [Google Scholar]
- Cagliero, R.; Barbato, G.; Maizza, G.; Genta, G. Measurement of elastic modulus by instrumented indentation in the macro-range: Uncertainty evaluation. Int. J. Mech. Sci. 2015, 101, 161–169. [Google Scholar] [CrossRef]
- Cagliero, R.; Maizza, G.; Barbato, G. Unconventional Mechanical Testing for process set up and product qualification in additive manufacturing. Polaris Innov. J. 2016, 25, 28–32. [Google Scholar]
- Tabor, D. The Hardness of Metals; Clarendon Press: Oxford, UK, 1951. [Google Scholar]
- Boyer, H.E.; Gall, T.L. Metals Handbook: Desk Edition; ASM International: Geauga County, OH, USA, 1985. [Google Scholar]
- Callister, W.D.; Rethwisch, D.G. Materials Science and Engineering: An Introduction; John Wiley & Sons: New York, NY, USA, 2007; pp. 665–715. [Google Scholar]


© 2019 by the authors. Licensee MDPI, Basel, Switzerland. This article is an open access article distributed under the terms and conditions of the Creative Commons Attribution (CC BY) license (http://creativecommons.org/licenses/by/4.0/).
Share and Cite
Maizza, G.; Caporale, A.; Polley, C.; Seitz, H. Micro-Macro Relationship between Microstructure, Porosity, Mechanical Properties, and Build Mode Parameters of a Selective-Electron-Beam-Melted Ti-6Al-4V Alloy. Metals 2019, 9, 786. https://doi.org/10.3390/met9070786
Maizza G, Caporale A, Polley C, Seitz H. Micro-Macro Relationship between Microstructure, Porosity, Mechanical Properties, and Build Mode Parameters of a Selective-Electron-Beam-Melted Ti-6Al-4V Alloy. Metals. 2019; 9(7):786. https://doi.org/10.3390/met9070786
Chicago/Turabian StyleMaizza, Giovanni, Antonio Caporale, Christian Polley, and Hermann Seitz. 2019. "Micro-Macro Relationship between Microstructure, Porosity, Mechanical Properties, and Build Mode Parameters of a Selective-Electron-Beam-Melted Ti-6Al-4V Alloy" Metals 9, no. 7: 786. https://doi.org/10.3390/met9070786