Strain-Rate-Dependent Deformation Behavior and Mechanical Properties of a Multi-Phase Medium-Manganese Steel


Steel Institute, RWTH Aachen University, 52072 Aachen, Germany
*
Author to whom correspondence should be addressed.
Metals 2019, 9(3), 344; https://doi.org/10.3390/met9030344
Submission received: 3 March 2019
/
Revised: 14 March 2019
/
Accepted: 15 March 2019
/
Published: 18 March 2019
(This article belongs to the Special Issue Physical Metallurgy of High Manganese Steels)
Abstract
:The strain-rate-dependent deformation behavior of an intercritically annealed X6MnAl12-3 medium-manganese steel was analyzed with respect to the mechanical properties, activation of deformation-induced martensitic phase transformation, and strain localization behavior. Intercritical annealing at 675 °C for 2 h led to an ultrafine-grained multi-phase microstructure with 45% of mostly equiaxed, recrystallized austenite and 55% ferrite or recovered, lamellar martensite. In-situ digital image correlation methods during tensile tests revealed strain localization behavior during the discontinuous elastic-plastic transition, which was due to the localization of strain in the softer austenite in the early stages of plastic deformation. The dependence of the macroscopic mechanical properties on the strain rate is due to the strain-rate sensitivity of the microscopic deformation behavior. On the one hand, the deformation-induced phase transformation of austenite to martensite showed a clear strain-rate dependency and was partially suppressed at very low and very high strain rates. On the other hand, the strain-rate-dependent relative strength of ferrite and martensite compared to austenite influenced the strain partitioning during plastic deformation, and subsequently, the work-hardening rate. As a result, the tested X6MnAl12-3 medium-manganese steel showed a negative strain-rate sensitivity at very low to medium strain rates and a positive strain-rate sensitivity at medium to high strain rates.
1. Introduction
Increasing demands for fuel-efficient vehicles led to the development of Advanced High-Strength Steels (AHSS). First generation AHSS usually possess a ferritic matrix and employs phase fractions of harder phases like martensite, bainite, and metastable retained austenite to increase the product of ultimate tensile strength (UTS) and elongation to fracture εf < 20 GPa% [1,2]. In search of further improvement of this so-called ECO-Index, the second generation of AHSS with fully austenitic microstructures was developed. Reaching an ECO-Index of >50 GPa%, the remarkable mechanical properties result from very high dislocation densities in combination with the activation of additional deformation mechanisms in addition to dislocation slip which increase the work-hardening rate (WHR) [3,4]. The critical parameter governing the activation of those secondary deformation mechanisms, such as deformation twinning (TWinning-Induced Plasticity–TWIP) and deformation-induced phase transformation (TRansformation-Induced Plasticity–TRIP), is the material’s stacking fault energy (SFE), which is primarily a function of the chemical composition [5,6,7,8]. As the main alloying element of the second generation AHSS is Mn with alloying contents <35 wt.%, those steels are also termed high-manganese steels (HMnS).
While the total energy-absorption potential of HMnS makes them an attractive option for crash-relevant parts in the automotive industry, several aspects have hindered widespread industrial application. Due to the design criteria of automotive parts, the available deformation volume is rather low, emphasizing the importance of a high yield strength (YS), which HMnS do not possess compared to their UTS [9,10]. Additionally, during quasistatic tensile tests, strain localization phenomena have frequently been observed that result in the propagation of deformation bands in the sample and subsequent serrated flow curves [11,12,13,14]. The third generation of AHSS has drawn significant interest, as they have reduced Mn contents of 3–12 wt.% and are described as medium-manganese steels (MMnS). Intercritical annealing (IA) in the two-phase region of austenite (γ) and ferrite (α) is conventionally employed to develop an ultrafine-grained (UFG) multi-phase microstructure consisting of γ, α, and martensite (α’), which increases the YS considerably, while retaining good ductility [1,2]. However, a discontinuous elastic-plastic transition during quasistatic tensile testing has frequently been reported [15].
In the past, there have been numerous efforts to analyze the impact of annealing parameters during the IA on the initial microstructure and the partitioning of alloying elements on the individual phases [1,16,17,18,19,20,21,22]. Subsequent studies have dealt with the activation of secondary deformation mechanisms in γ and the strain partitioning in the microstructural constituents of different hardness [23,24,25,26]. However, most of the work on the analysis of mechanical properties has been performed within a small range of strain rates in the quasistatic tensile testing regime. On the other hand, for application in crash-relevant automotive parts, understanding the deformation behavior at very high strain rates is critical. It has been observed in the past that the UTS of HMnS and MMnS increases with increasing strain rate at high-speed tensile tests while also retaining good ductility. While microstructural investigations have revealed that adiabatic heating effects during high-speed tensile tests partially suppress the TWIP and TRIP effect, the strain partitioning behavior in multi-phase MMnS has primarily been investigated during quasistatic tensile testing. [2,4,22,23,27,28,29]
However, the microstructural response in combination with the strain partitioning behavior is especially interesting in the case of MMnS. This is because of possible differences in the response to the plastic deformation at high strain rates of the individual microstructural constituents of the multi-phase microstructure. In this work, the strain rate-dependent mechanical properties and deformation behavior of a X6MnAl12-3 MMnS are investigated. To this end, the strain partitioning behavior on a microstructural scale is investigated by means of interrupted tensile tests at different strain rates coupled with electron backscatter diffraction (EBSD) experiments. Additionally, in-situ digital image correlation (DIC) methods during tensile testing are employed to analyze the strain localization behavior in the specimen with respect to the occurrence of deformation bands.
2. Materials and Methods
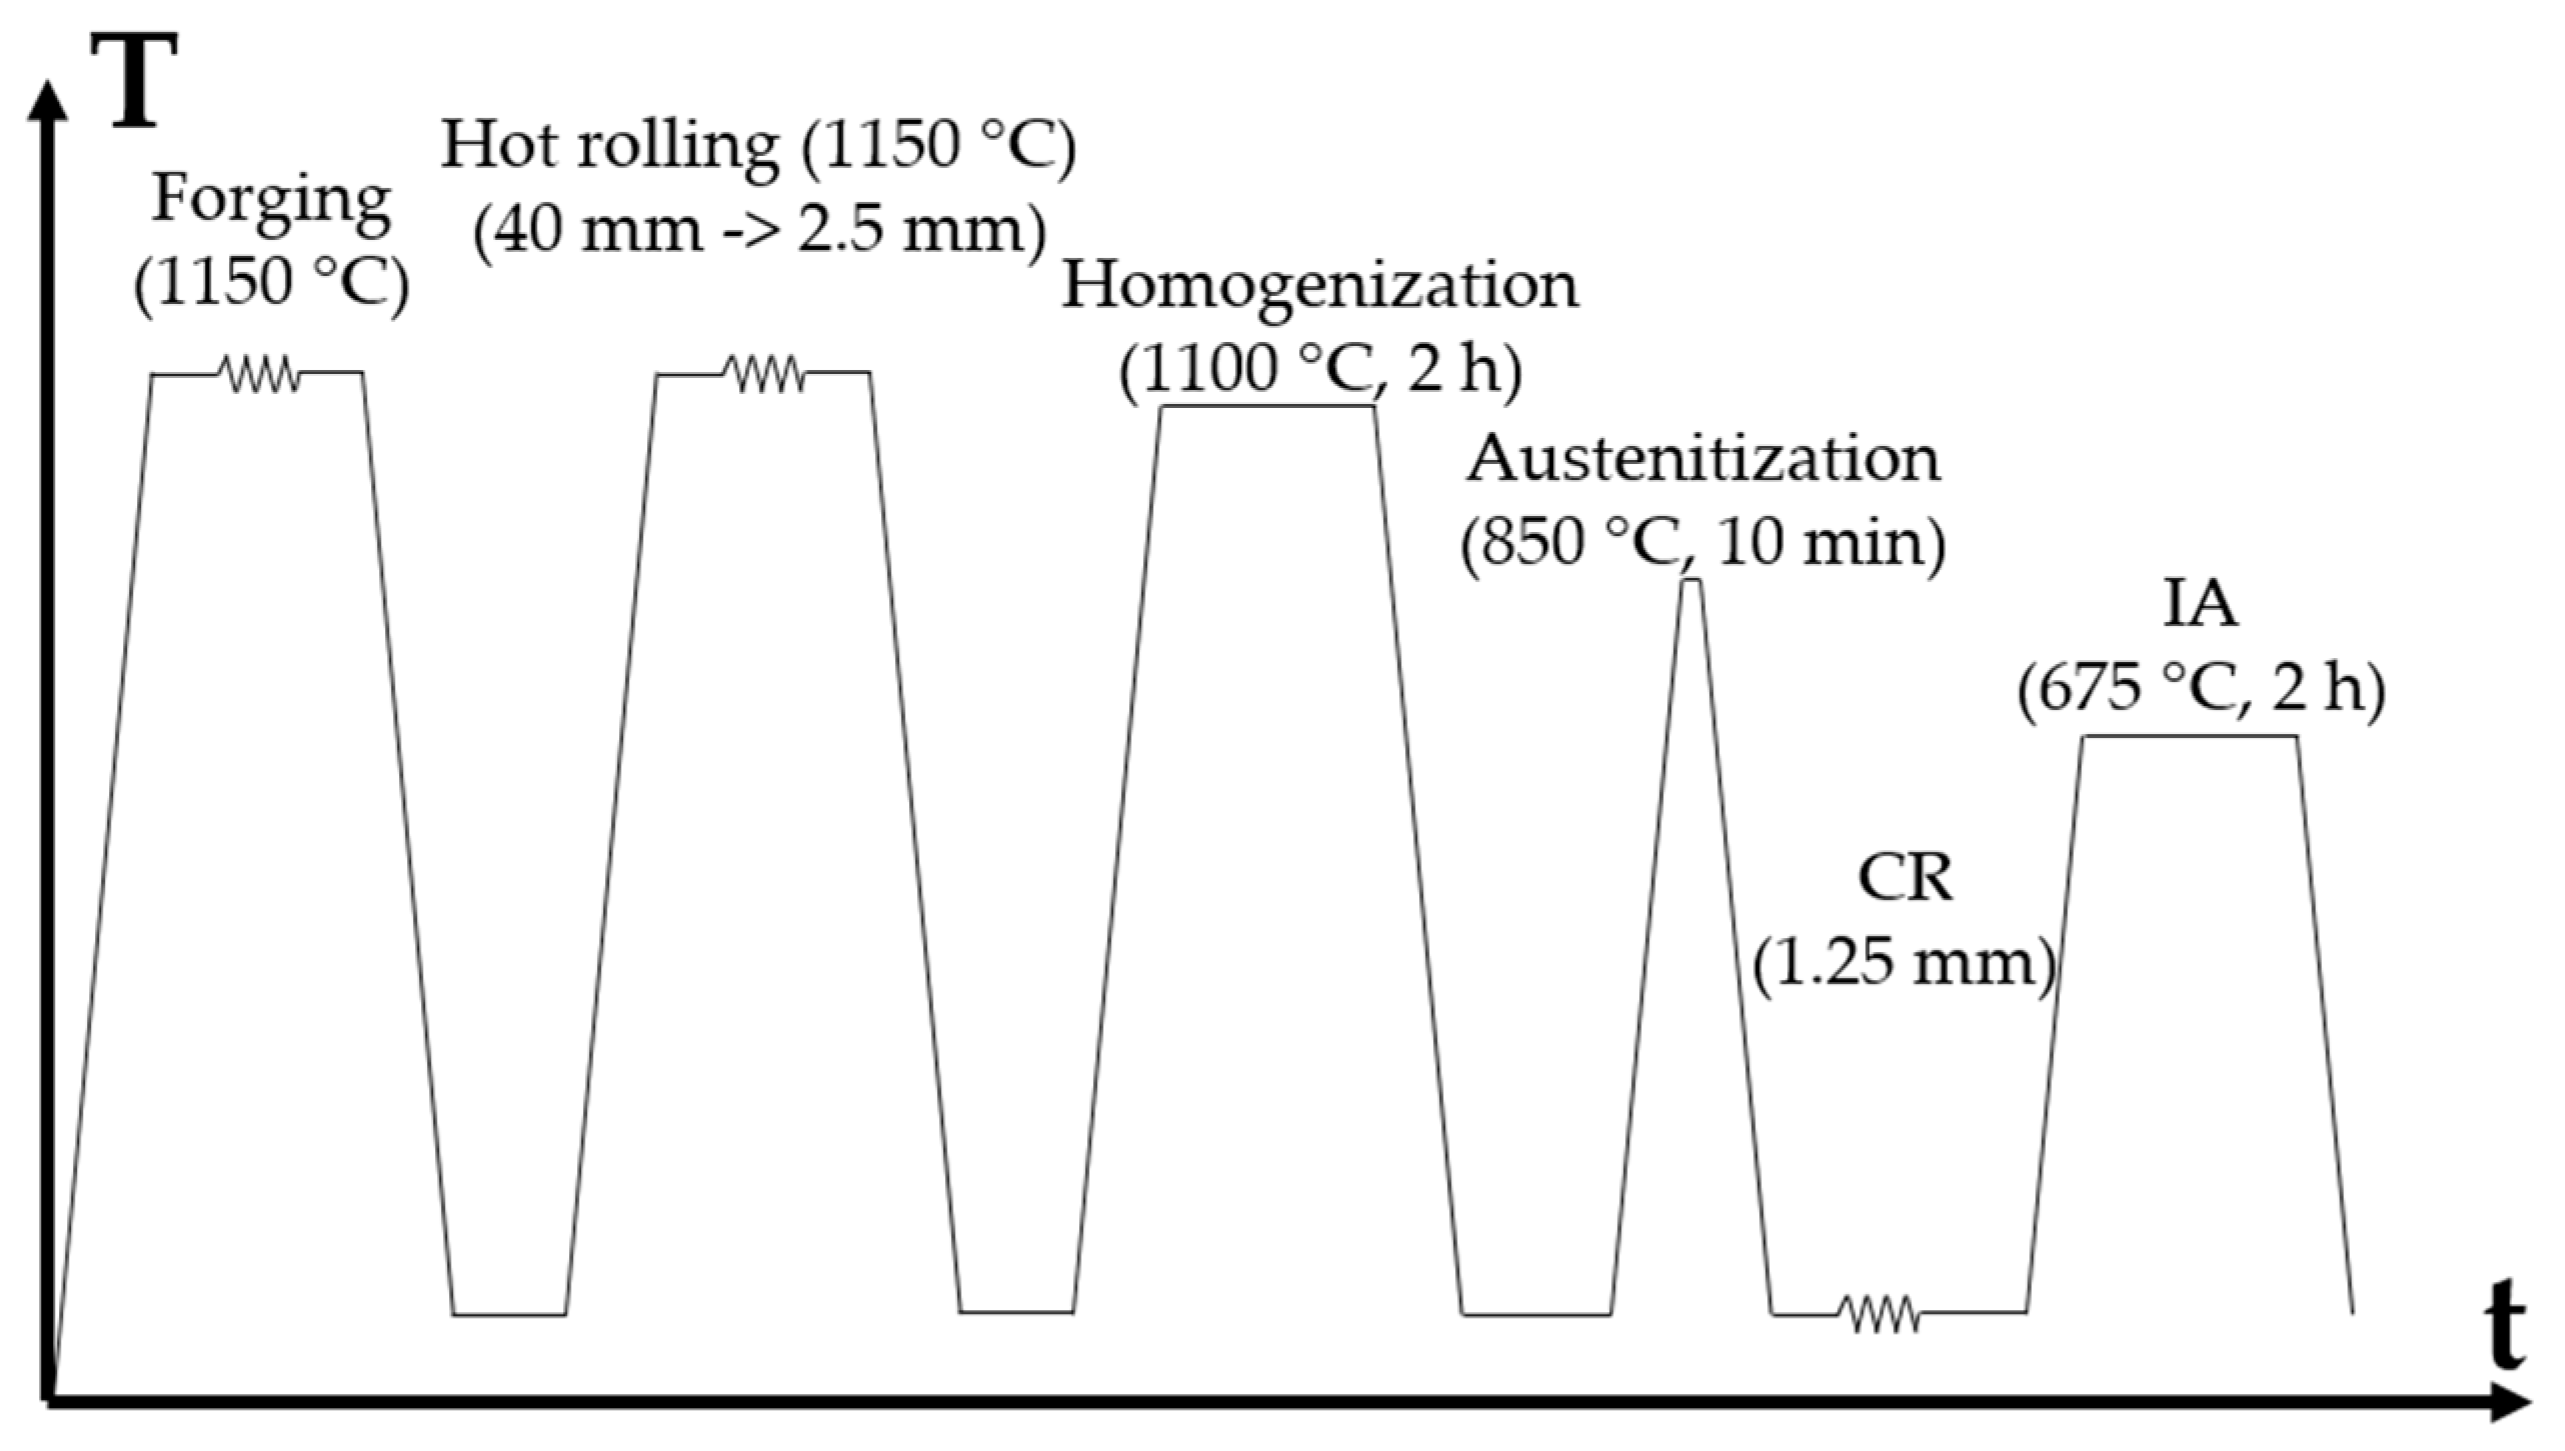
The X6MnAl12-3 alloy was ingot-cast in an ALD vacuum induction furnace with ingot dimensions of 140 mm × 140 mm × 500 mm. Afterward, the MMnS was hot-forged at 1150 °C in 3 forging passes to a cross section of 160 mm × 40 mm. Subsequent hot rolling to a sheet thickness of 2.5 mm was performed at 1150 °C with reheating between passes. The MMnS was then homogenization annealed at 1100 °C for 2 h, followed by water quenching and an additional austenitization annealing at 850 °C for 10 min with subsequent water quenching to reduce eigenstrains. Finally, the MMnS was cold-rolled (CR) to a final thickness of 1.25 mm (50% thickness reduction).
Before intercritical annealing (IA) at 675 °C for 2 h in a salt bath furnace (THERMCONCEPT GmbH, Bremen, Germany), tensile test specimens with 30 mm initial gauge length and 6 mm gauge width were machined after cold rolling using water jet cutting. The tensile axis (TA) was perpendicular to the rolling direction (RD). The temperatures for the austenitization annealing and the IA were selected based on previous studies for a MMnS with a very similar chemical composition [22,23]. Additionally, dilatometer measurements were performed after cold rolling to determine Ac1 and Ac3, ensuring that the IA was performed in the α-γ two-phase region and that the temperature for the austenitization was higher than Ac3. Ac1, Ac3, and the nominal chemical composition of the MMnS tested in this work are summarized in Table 1. The processing route, including the final heat treatment, is summarized in Figure 1.
Tensile testing was performed on two different devices. A minimum number of three tensile tests per strain rate were performed and a representative test result was selected for the diagrams in this work. The tensile tests at constant strain rates of 0.00001 1/s, 0.0001 1/s, 0.001 1/s, 0.01 1/s, and 0.1 1/s were conducted using a Z250 tensile testing machine by ZwickRoell (Ulm, Germany). Strains were measured with the contact-type extensometer MultiXtens by ZwickRoell. The Aramis 12 Megapixel DIC system (GOM GmbH, Braunschweig, Germany) was employed during the quasistatic tensile tests to analyze the local and the strain distribution in the specimens. For the higher of 1.0 1/s, 11 1/s, 140 1/s, and 230 1/s, dynamic tensile test samples with 20 mm gauge length and 6 mm width were used. The dynamic tensile tests were conducted at room temperature on a servo-hydraulic HTM2012 testing machine by ZwickRoell (Ulm, Germany). Strain was measured using a high-speed opto-electronic device. A piezo-electric type load cell was used to measure the applied load. At 140 1/s and 230 1/s, additional strain gauges were attached to the sample shoulders linked in a Wheatstone bridge circuit to reduce the oscillation of the input load signal, which occurs at high testing speeds. In order to determine the flow curves, the force signal was smoothed with a polynomial spline function to eliminate the remaining oscillations.
Optical microscopy was conducted using a 5% Nital etchant. Metallographic preparation for electron backscatter diffraction (EBSD) measurements was performed by means of mechanical grinding with SiC paper up to 4000 grit with subsequent mechanical polishing using 3 μm and 1 μm diamond suspension. Electropolishing was then performed at 28 V for 20 s using an electrolyte containing 700 mL ethanol (C2H5OH), 100 mL butyl glycol (C6H14O2), and 78 mL perchloric acid (60%) (HClO4). EBSD analyses were performed on the sheet surface for two different kinds of specimens. The measurements of the initial microstructure and after fracture were performed on A30 tensile test specimens. For the measurements after fracture, the measured area was selected as close to the fracture surface as possible. Interrupted tensile tests of specimens with 12 mm gauge length and 2 mm gauge width were used to analyze the microstructural evolution after 2%, 10%, and 20% elongation, respectively. A Zeiss Sigma scanning electron microscope (SEM) (Carl Zeiss Microscopy GmbH, Jena, Germany) was used for all SEM experiments. Secondary electron (SE) images were taken at an acceleration voltage of 20 kV and coupled with Energy Dispersive X-ray Spectroscopy (EDS) for line-scans with 20 nm step size. The chemical composition of γ was determined via EDS and was used for the calculation of the SFE, based on a subregular solution thermodynamic model that takes the impact of temperature into account too [7]. For larger-area EBSD measurements before deformation, after 20% uniform elongation at 0.001 1/s and after fracture of the 0.00001 1/s and 0.001 1/s strain rates, an acceleration voltage of 15 kV and a step size of 100 nm were selected. For the other high-resolution (HR) EBSD measurements, an acceleration voltage of 10 kV and a step size of 70 nm was used. The phase fractions given in this manuscript are based on those HR EBSD measurements, however, the phase fractions determined by the large-area EBSD measurements did not deviate significantly. The working distance was between 18 mm and 24 mm and a post-processing routine employing the HKL Channel 5 software (version 5.12j, Oxford Instruments, Abingdon-on-Thames, UK) was utilized, as well as the MATLAB-based MTEX toolbox [30,31]. Noise reduction was employed by removing wild spikes and considering at least 5 neighboring data points.
3. Results
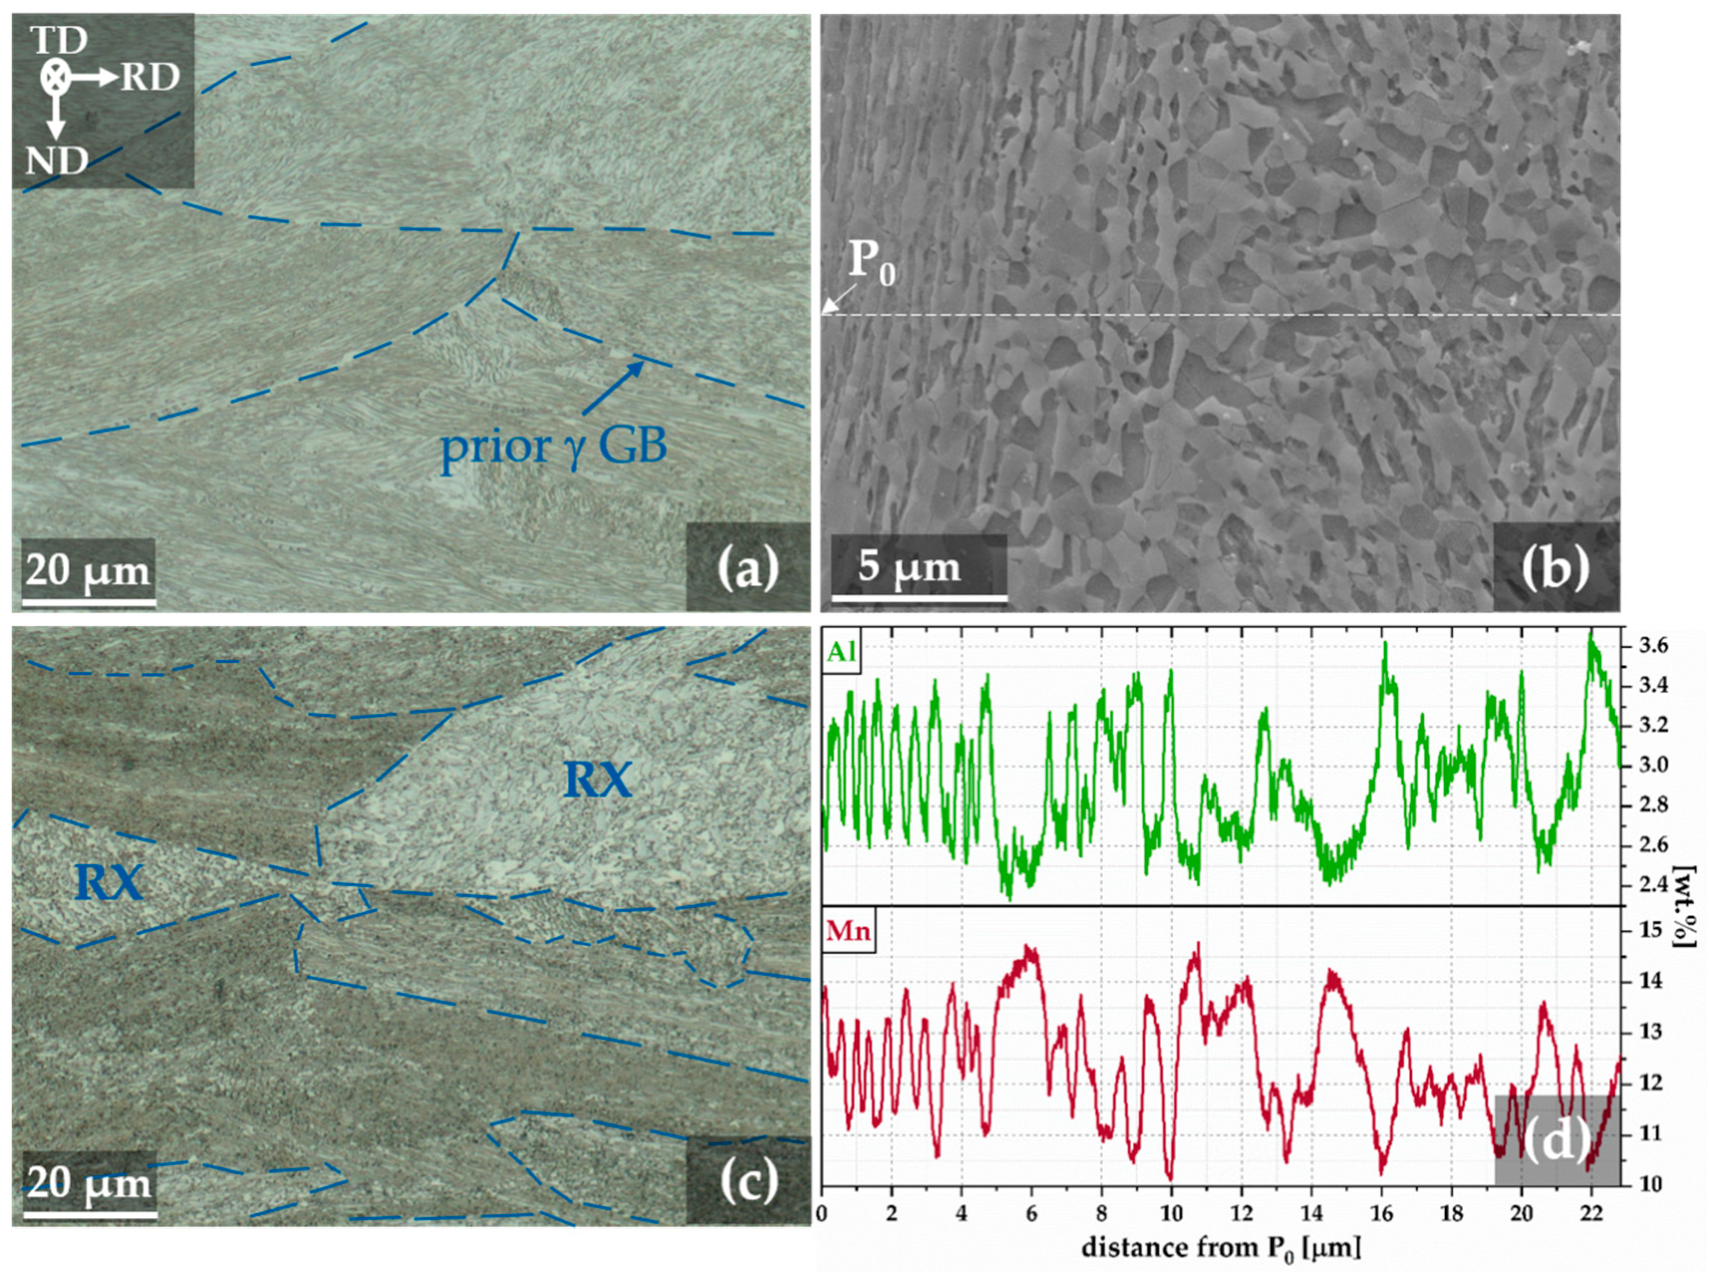
The microstructures of the MMnS after cold-rolling prior to IA and after intercritical annealing at 675 °C for 2 h are shown in Figure 2. After cold-rolling (cf. Figure 2a), a very fine-grained lamellar microstructure was present. Prior γ grain boundaries (GB) were still visible in optical micrographs and separated regions of lamellar martensite. After intercritical annealing (cf. Figure 2c), a high fraction of the lamellar morphology was retained. However, in some areas (highlighted in Figure 2c), a more equiaxed recrystallized grain morphology was present. The SE image in Figure 2b with the corresponding EDS analysis in Figure 2d indicates that elemental partitioning of Al and Mn was present after intercritical annealing. Al-enriched regions showed approximately 3.4 wt.% Al and corresponded with Mn-depleted regions with about 10.5 wt.% Mn. Mn-rich regions showed about 14.0 wt.% Mn and corresponded with Al-depleted regions, where only approximately 2.5 wt.% Al was present. Comparing the microstructure in Figure 2b with the phase fractions from EBSD measurements shown in Figure 4a revealed that the Mn-rich regions correspond to austenite while the Al-rich regions correspond to ferrite and α’-martensite.
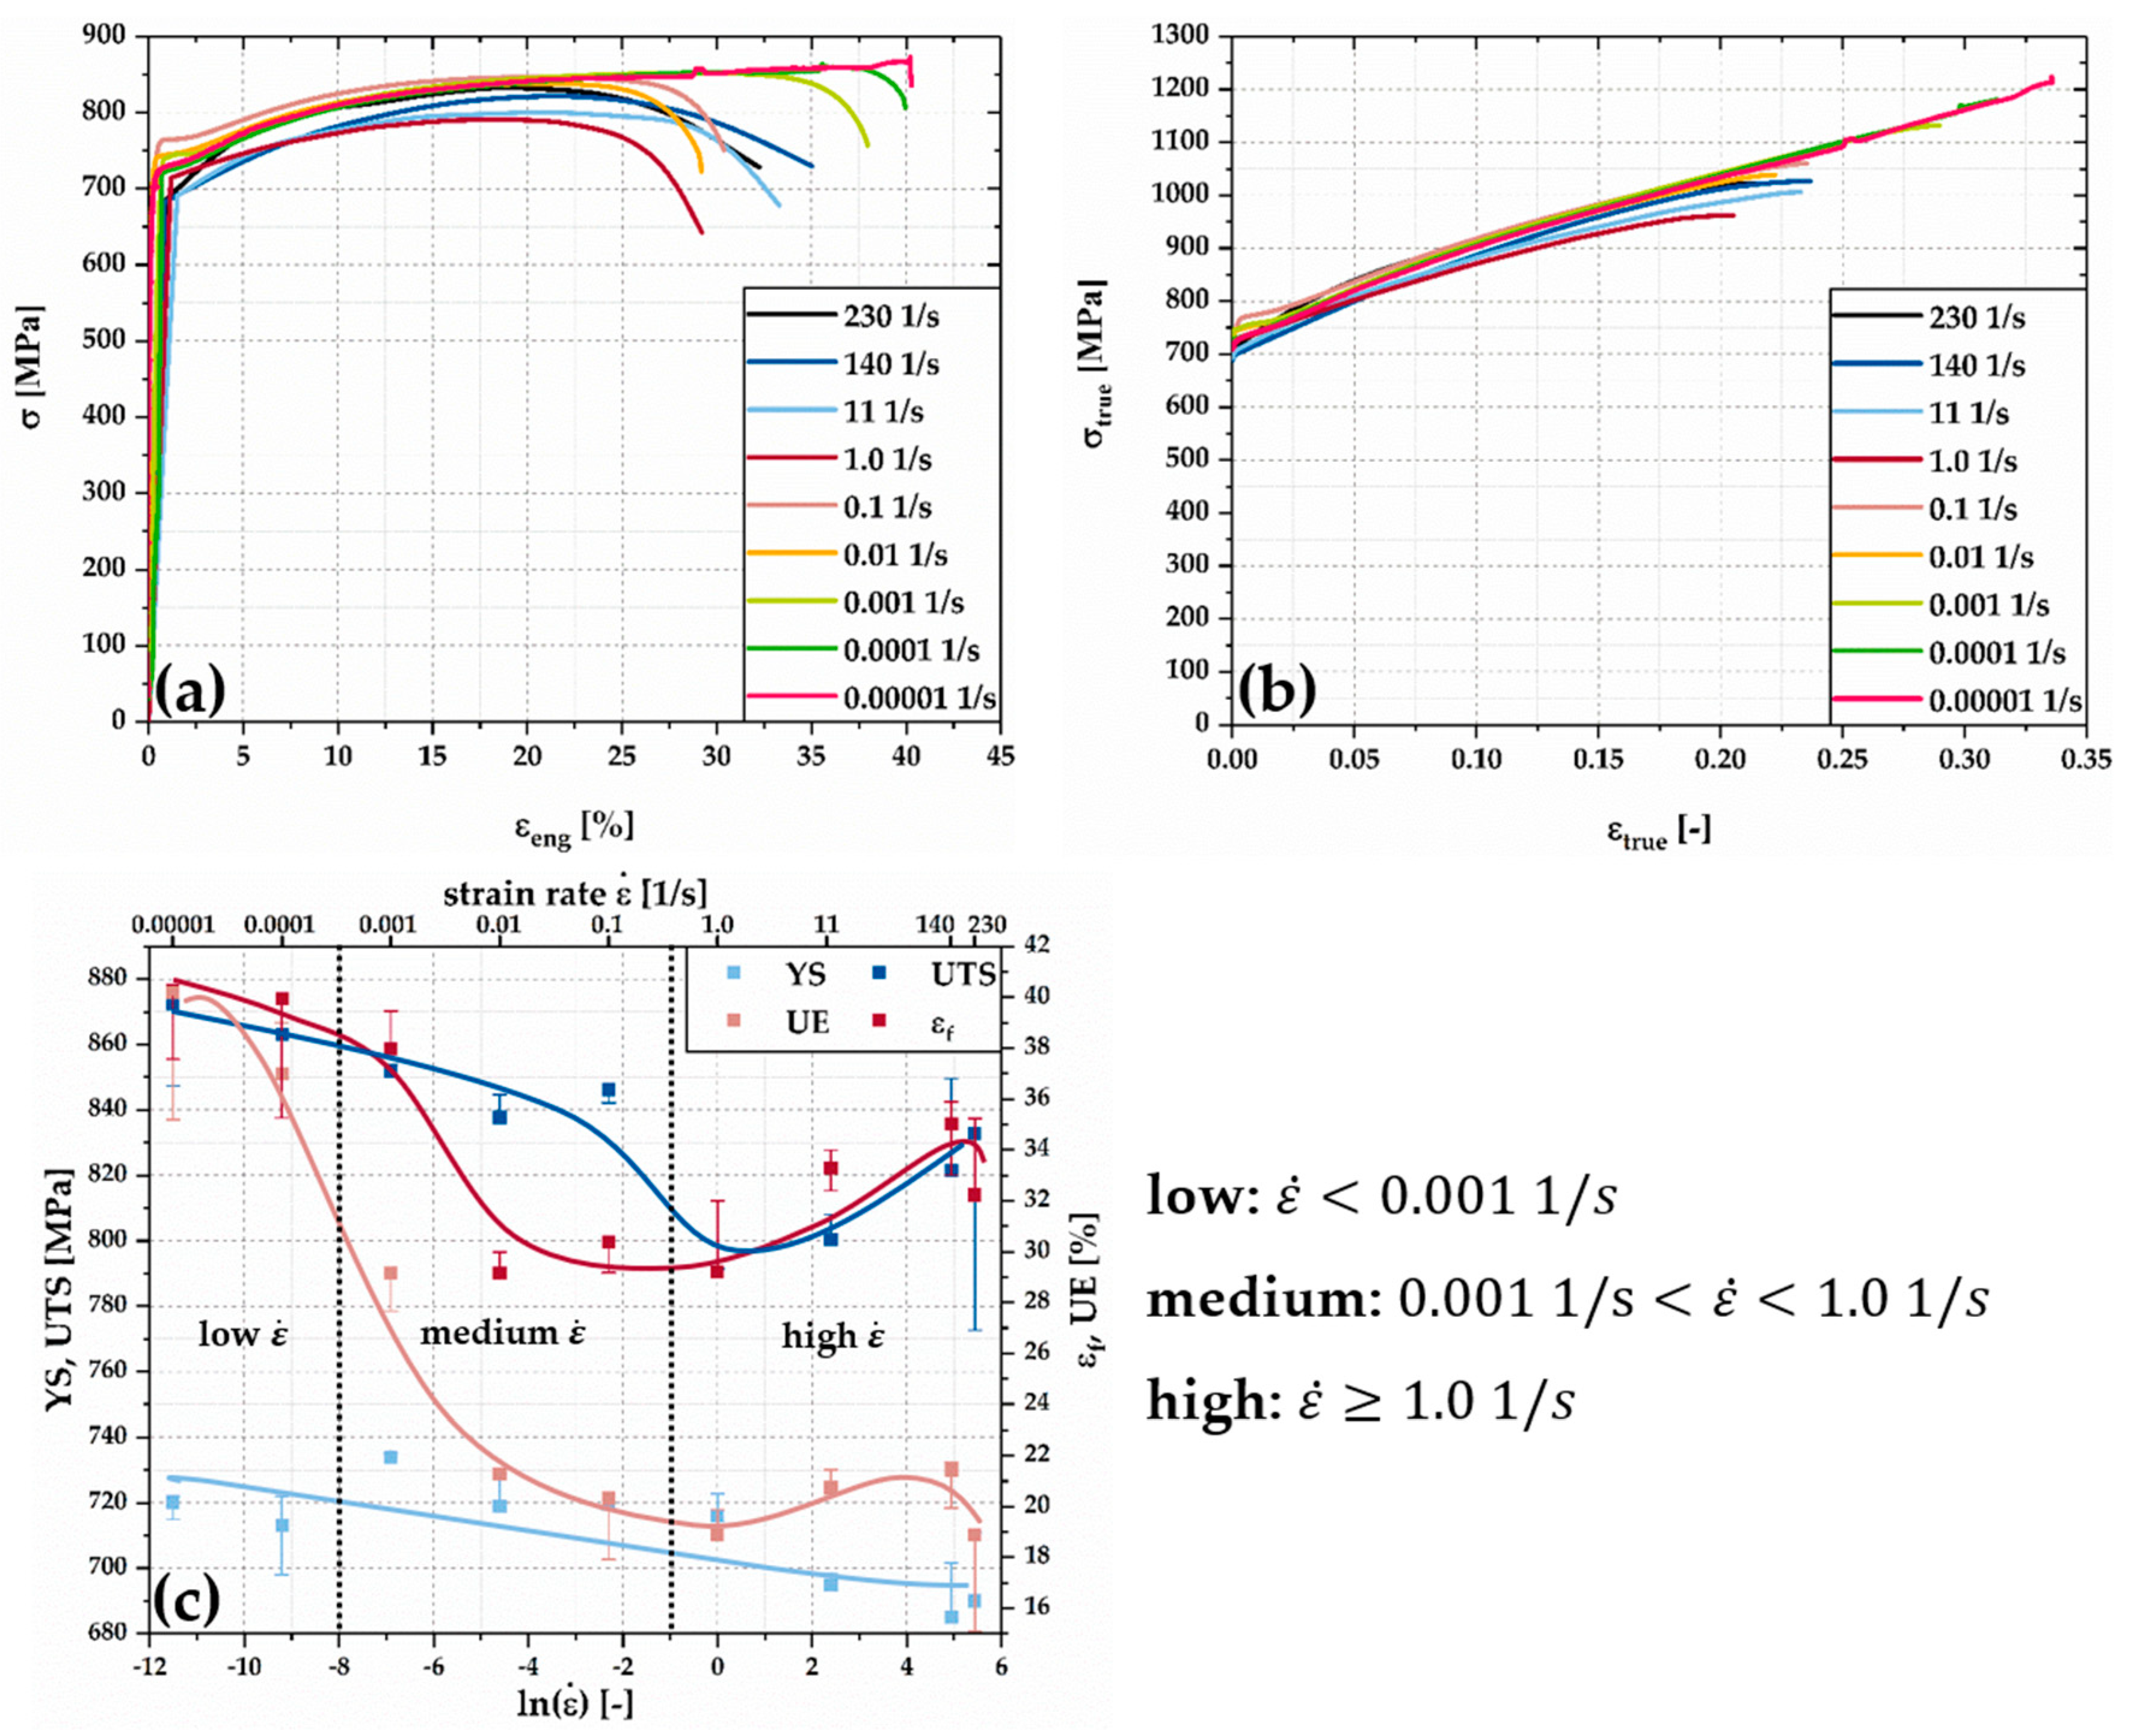
The strain-rate-dependent mechanical properties as determined by tensile tests are shown in Figure 3, in addition to the strain-rate-dependent YS and stress values corresponding to engineering strains εeng of 5% and 10%. The mechanical response of the tested X6MnAl12-3 MMnS to an increase of can be divided into strain rate changes in the regime of low, medium, and high strain rates, as shown in Table 2. In general, the ductility was affected the most, as the uniform elongation (UE) and εf decreased from approximately UE = εf = 40% at 0.00001 1/s to about UE = 18% and εf = 30% at 1.0 1/s respectively. During dynamic tensile testing ( ≥ 1.0 1/s), the UE was not affected significantly, while εf increased slightly to 35% and 32% at 140 1/s and 230 1/s. The YS only decreased slightly from 720 MPa at 0.00001 1/s to 690 MPa at 230 1/s, which equals a variation in YS of less than 5%. The UTS decreased from 875 MPa at 0.00001 1/s to 790 MPa at 1.0 1/s. During the dynamic tensile tests, the UTS increased up to 835 MPa at 230 1/s. At strain rates of 0.0001 1/s and 0.00001 1/s, serrated flow occurred, as shown in Figure 3b. Additionally, Figure 3a shows that at <1.0 1/s, a discontinuous elastic-plastic transition was observed which extended up to approximately 2% εeng. For the high-speed dynamic tensile tests, the necessary application of the smoothing function for the force data did not allow for accurate observation of the transition phase. However, at 1.0 1/s, the discontinuous elastic-plastic transition was also observed in the raw data of the force signal.
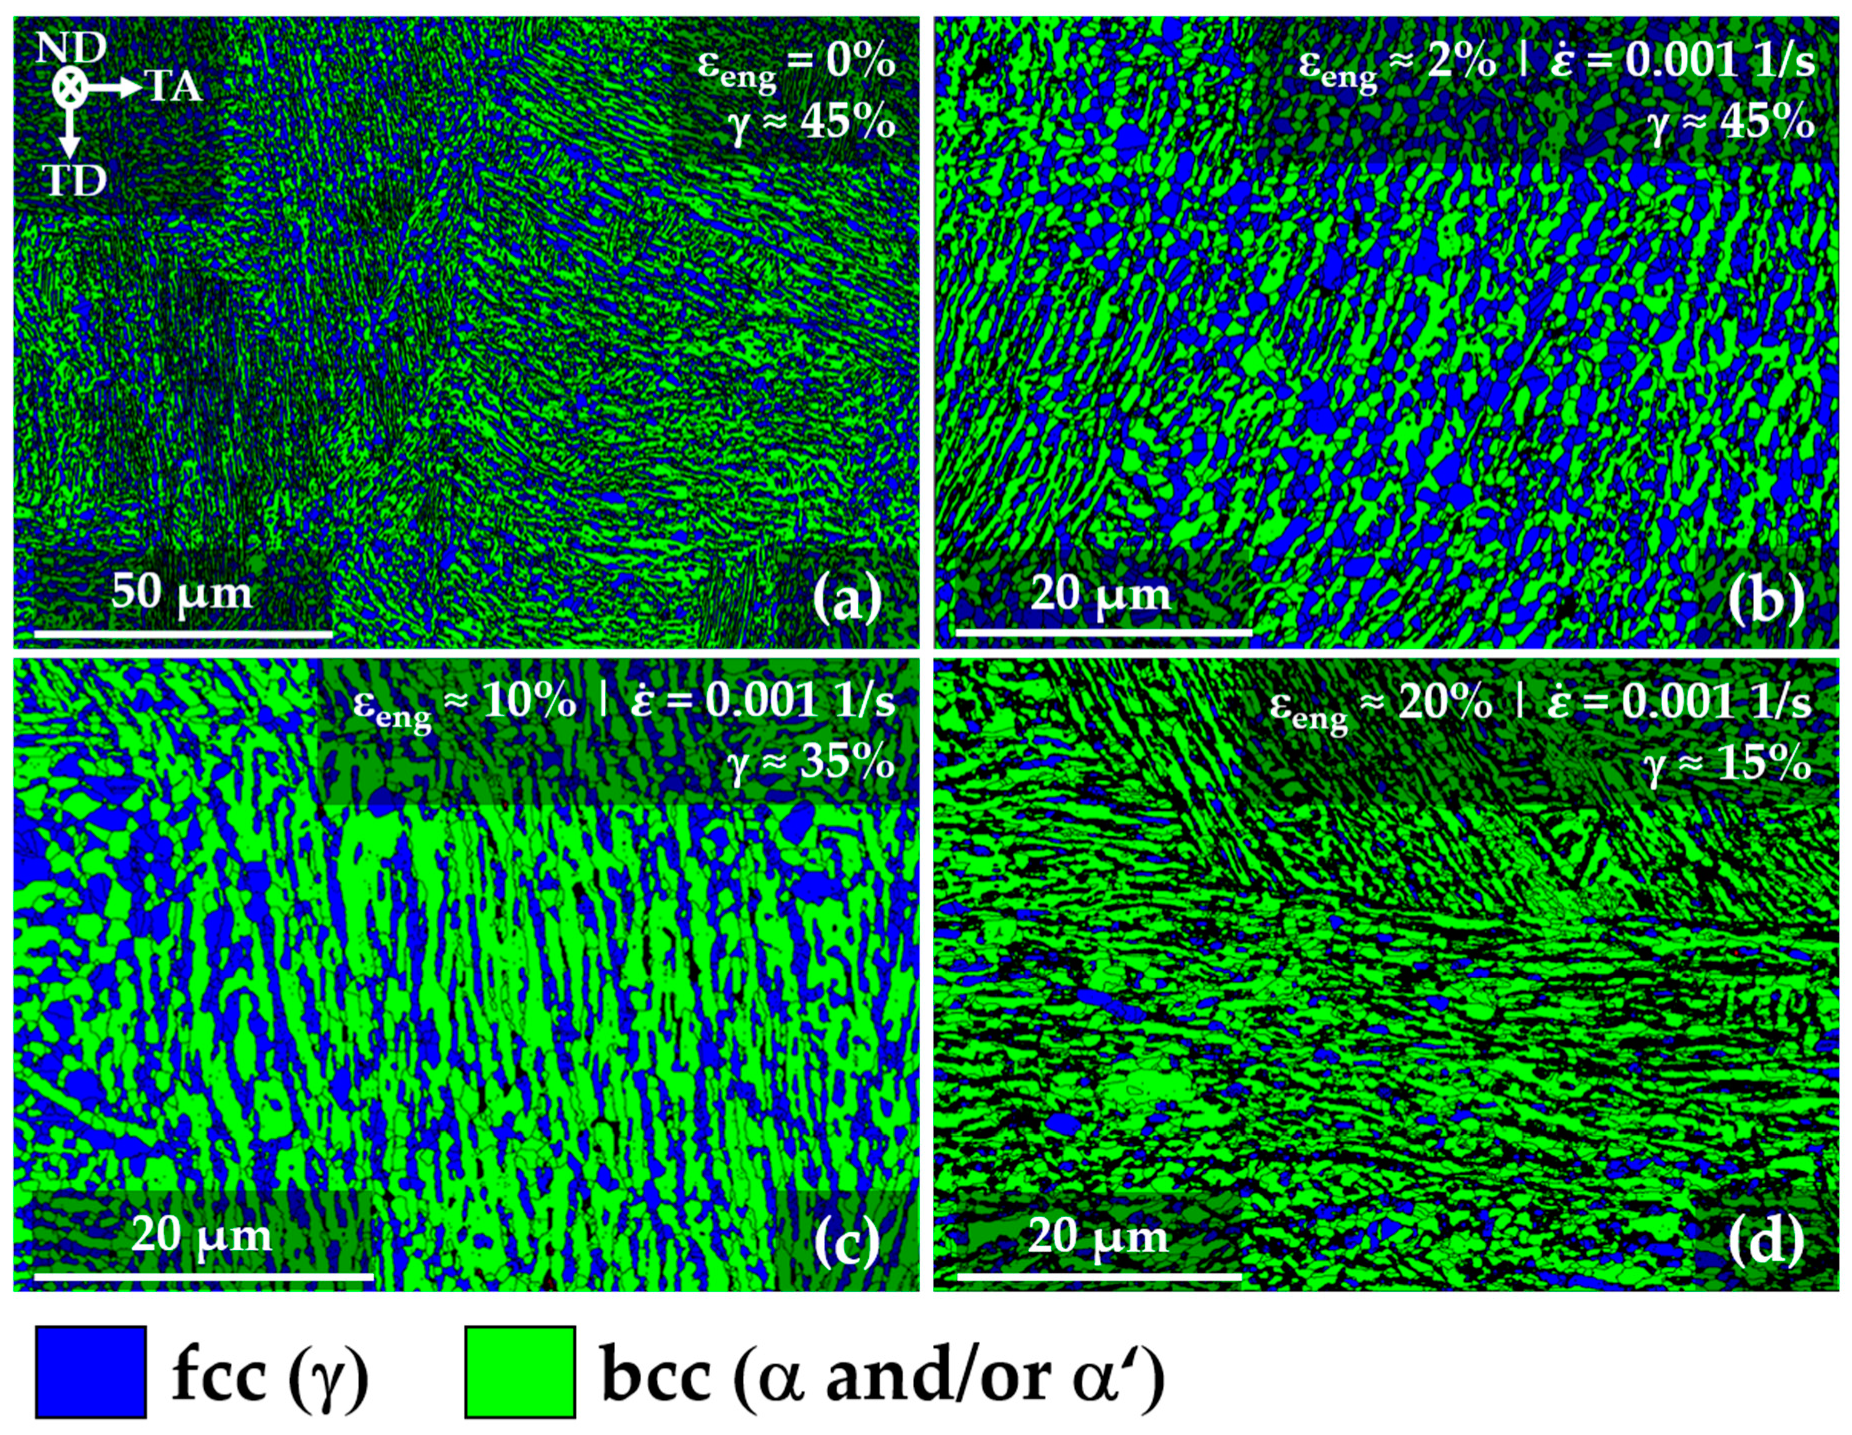
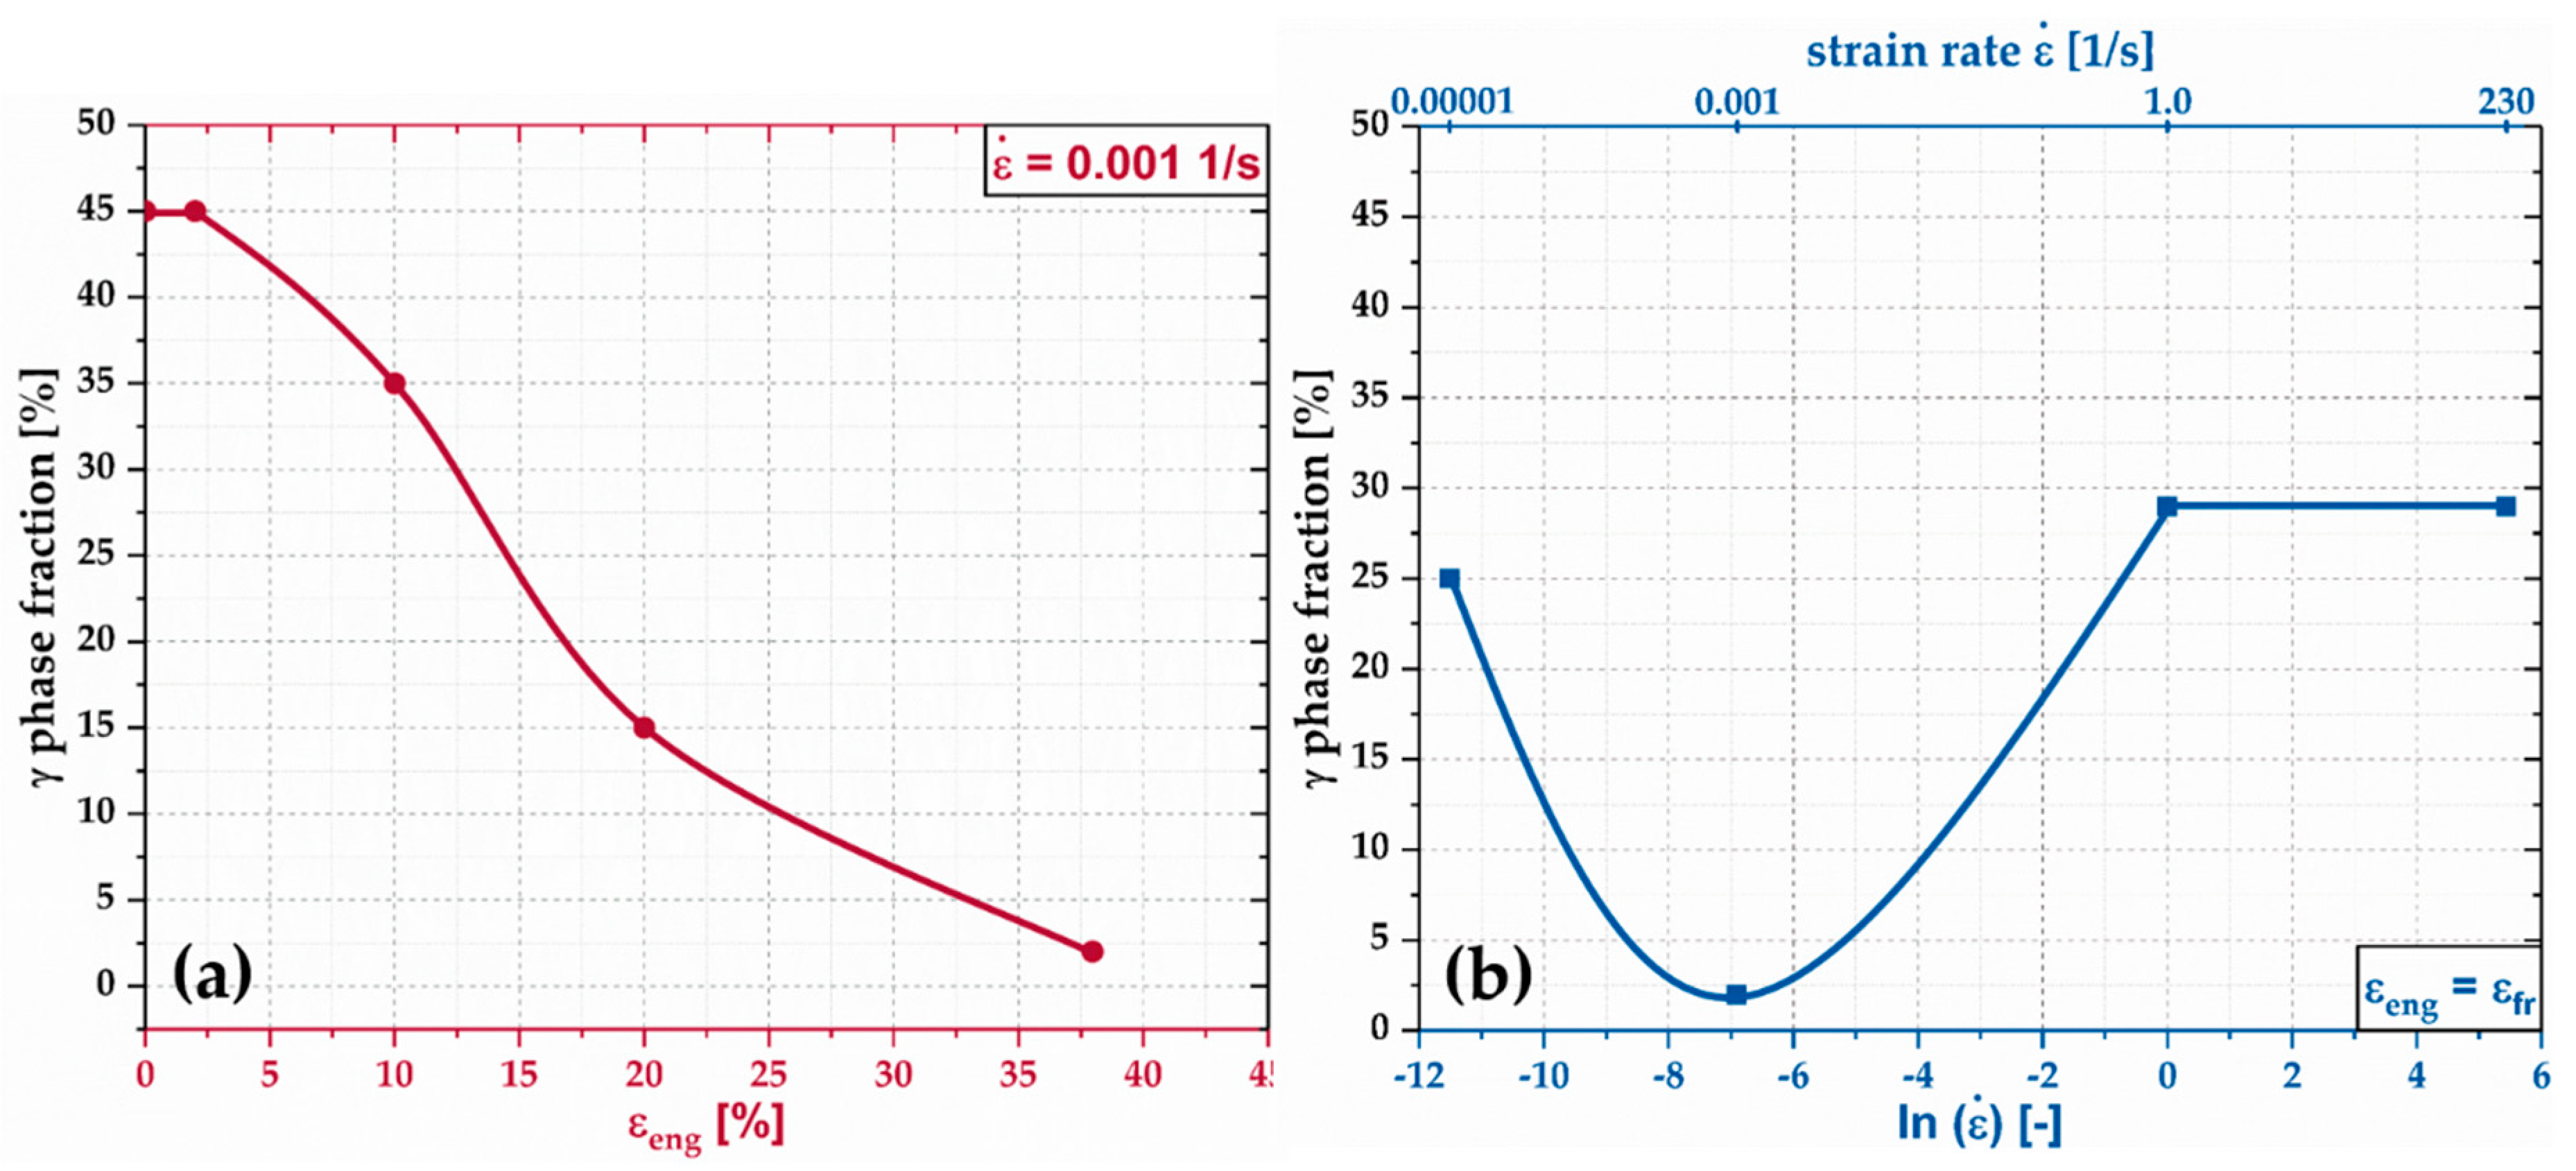
In Figure 4, the initial austenite (γ), ferrite (α), and martensite (α’) phase fractions after IA and the evolution of austenite phase fraction during quasistatic tensile testing at 0.001 1/s are shown, as measured by EBSD experiments. After IA at 675 °C for 2 h (cf. Figure 4a), the initial microstructure was lath-like with phase fractions of approximately 45% γ (face-centered cubic) and 55% α and/or recovered α’ (body-centered cubic). At the end of the discontinuous elastic-plastic transition after approximately 2% elongation (cf. Figure 4b), no change in the γ phase fraction was detected. During straining at 0.001 1/s to εeng of 10% (Figure 4c) and 20% (Figure 4d), a significant fraction of γ underwent a martensitic phase transformation, resulting in a detected γ phase fraction of 35% and 15% respectively. No ε-martensite was detected.
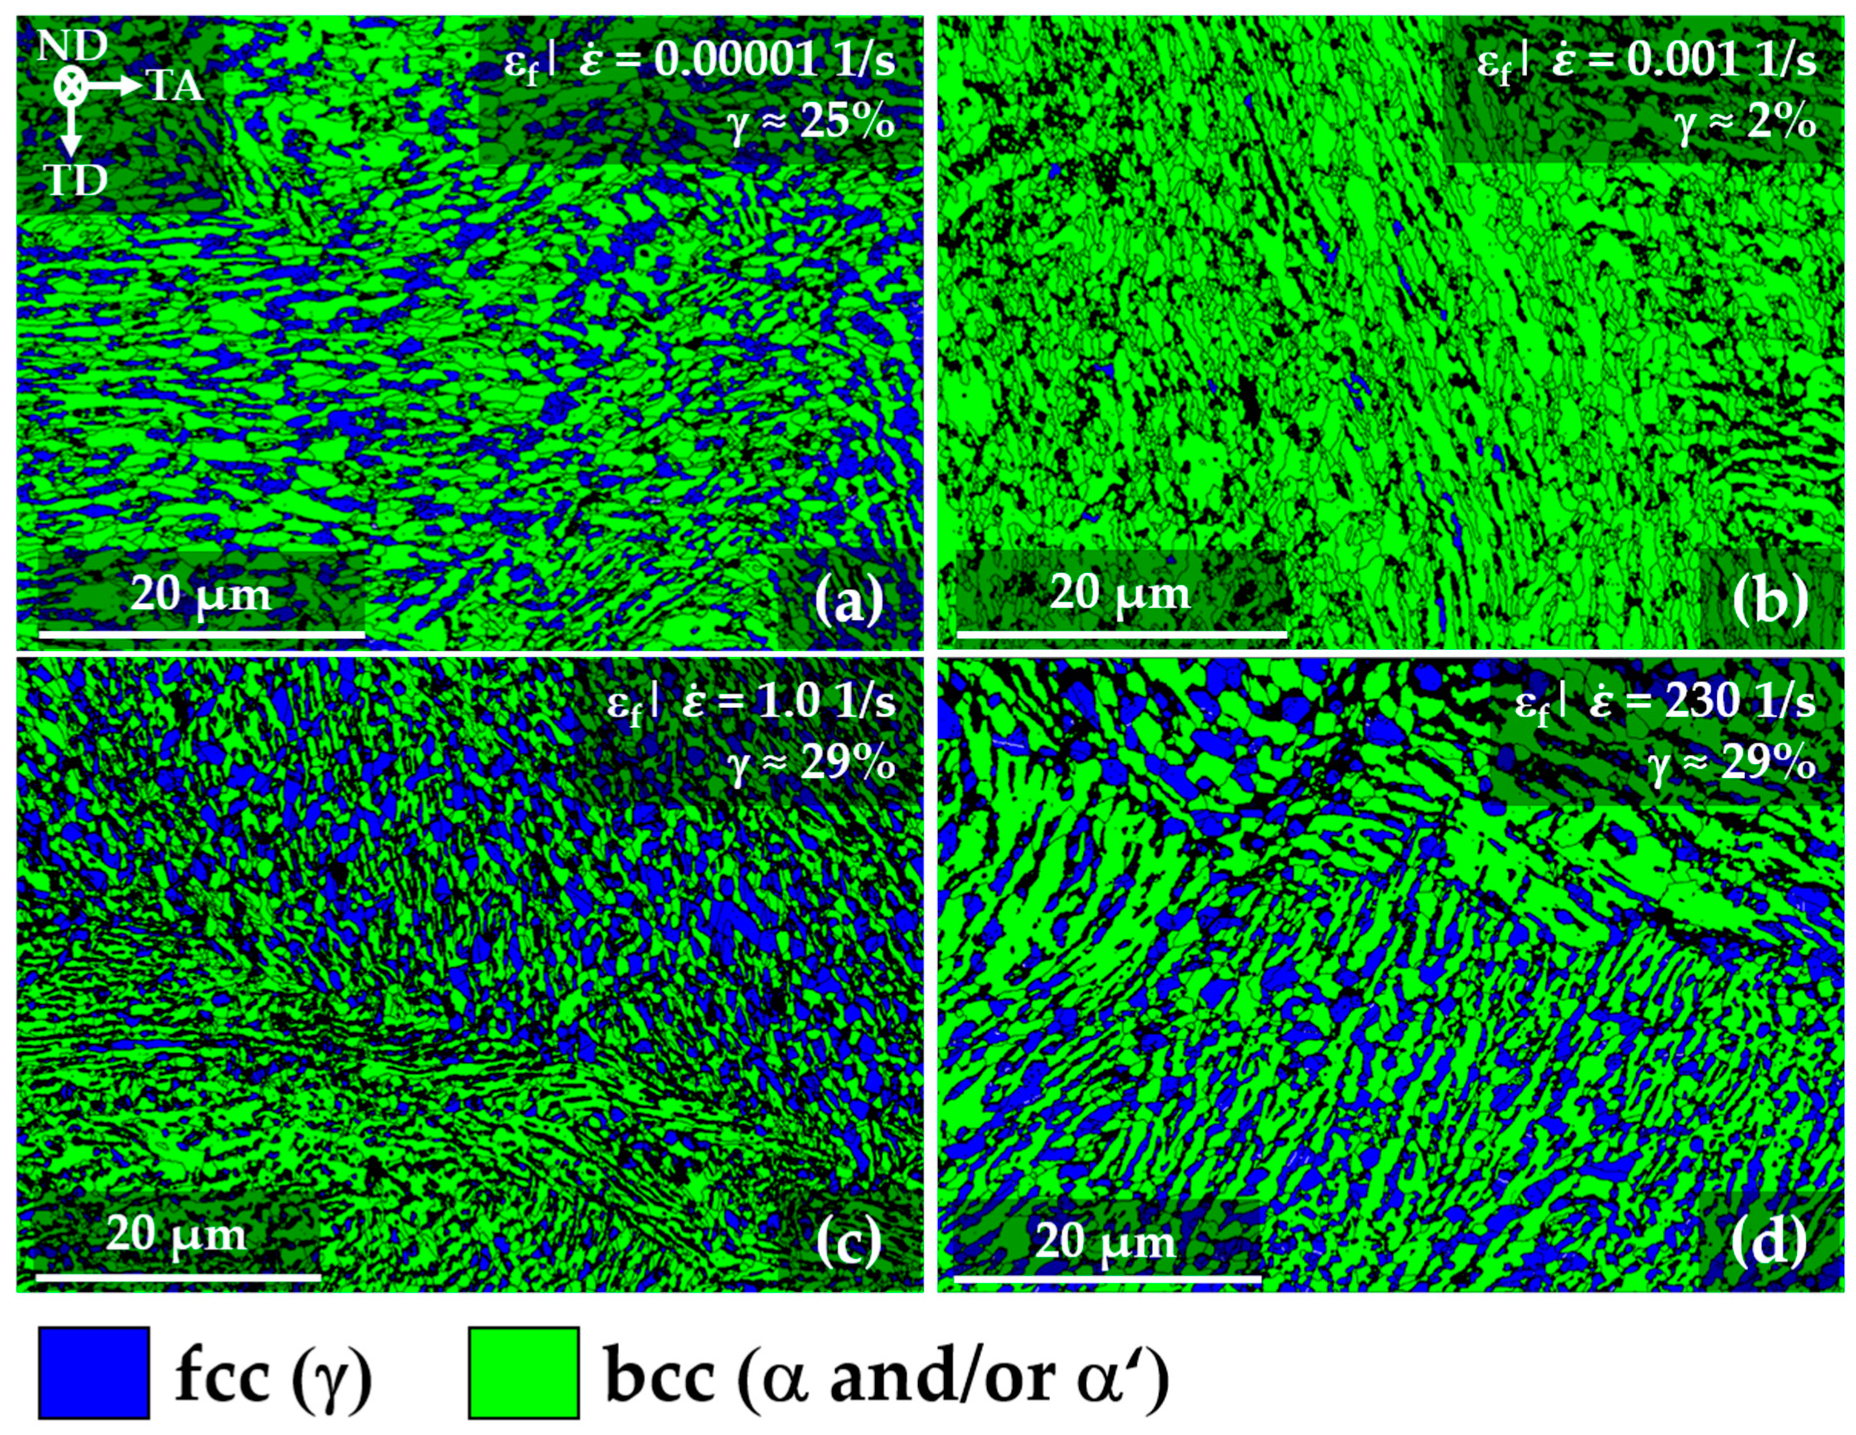
To investigate the impact of strain rate on the phase transformation, Figure 5 compares the microstructure after tensile testing at different until fracture. While the medium of 0.001 1/s led to a nearly complete transformation at fracture (cf. Figure 5b), both very high strain rates of 1 1/s and 230 1/s (cf. Figure 5c,d) as well as a very low of 0.00001 1/s (cf. Figure 5a) facilitated significantly higher retained γ phase fractions of 29% and 25% after fracture, respectively.
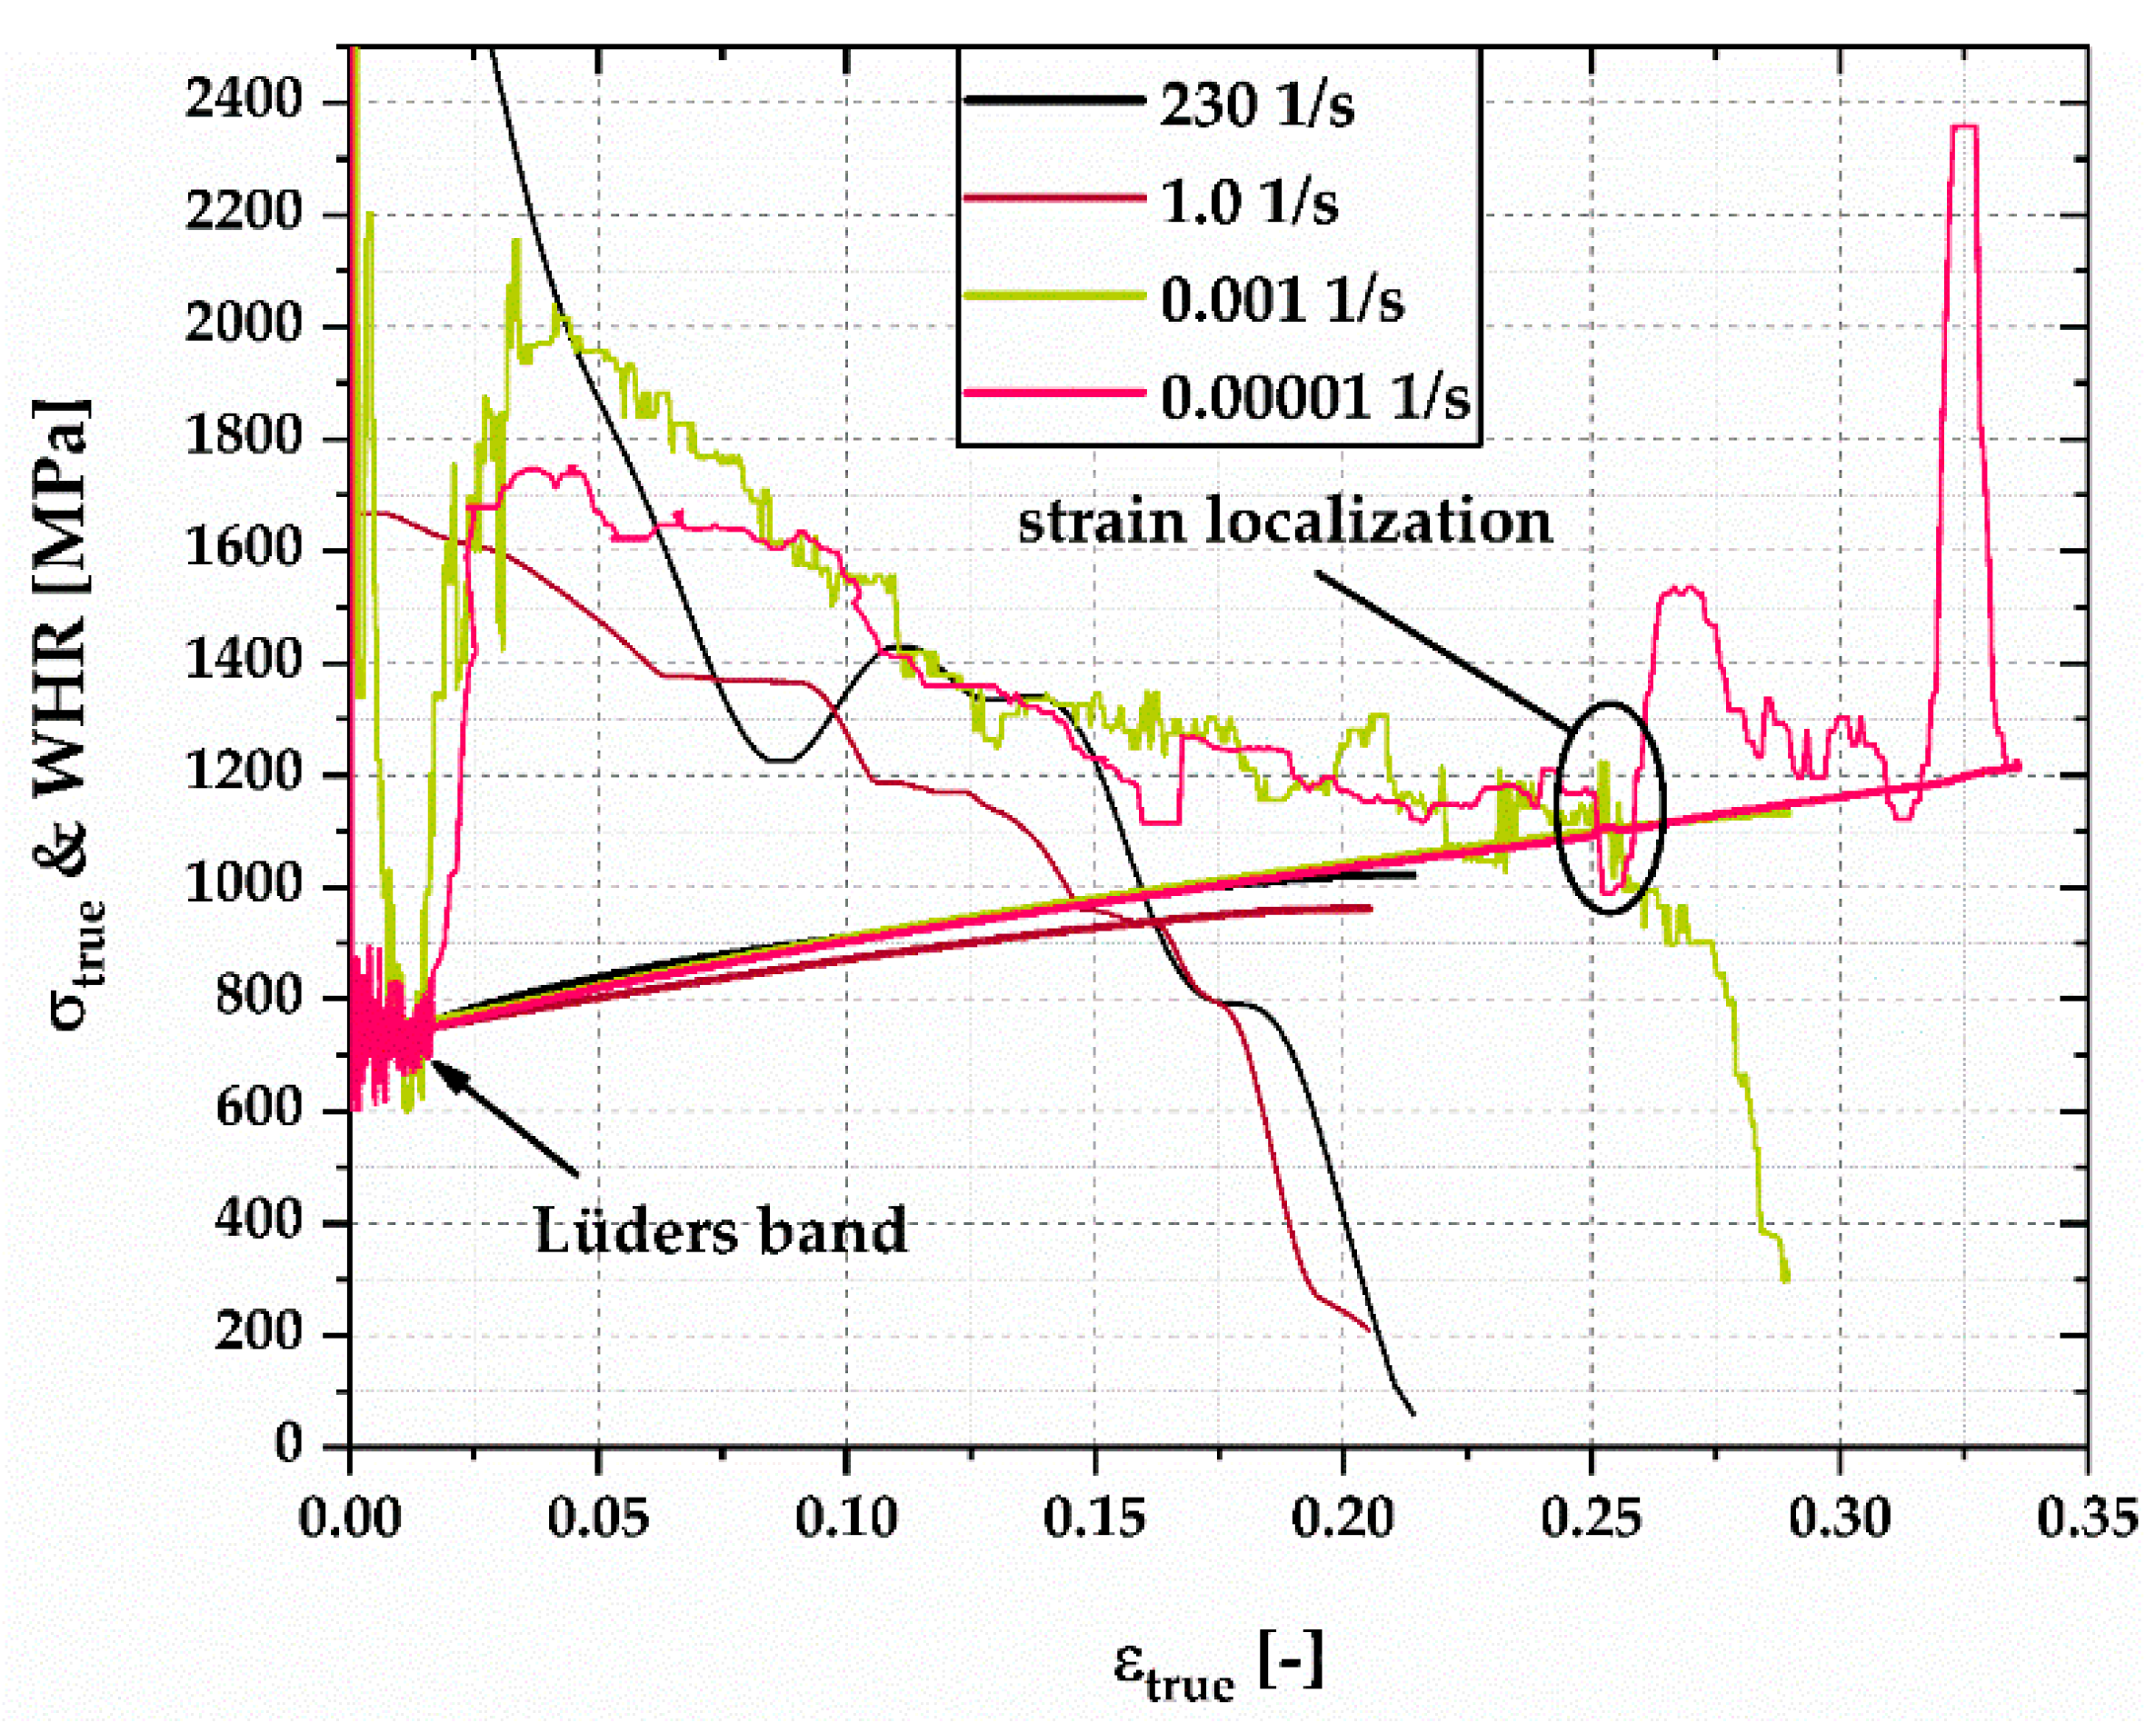
To highlight the onset of serrated flow at 0.00001 1/s, Figure 6 compares the flow curves and WHR of the tensile tests at 0.00001 1/s, 0.001 1/s, 1.0 1/s, and 230 1/s. While the flow curves at quasistatic strain rates of 0.001 1/s and 0.00001 1/s were almost identical, εf at the slower of 0.00001 1/s was significantly higher. The WHR during the initial stages of deformation were similar, as both curves dropped significantly during the Lüders band propagation. Afterwards the WHR increased and evolved in a similar way. However, at a true strain of approximately 0.25, the onset of the serrated flow at 0.00001 1/s was highlighted by a peak in the WHR curve, whereas the WHR at 0.001 1/s decreased to the flow curve, and necking was initiated. Similarly, the second serration in the flow curve at εtrue of approximately 0.33 marked the onset of the second peak in the WHR curve of the MMnS tested at 0.00001 1/s. Overall, the significantly more pronounced decrease in austenite phase fraction for 0.001 1/s did not result in a higher WHR compared to testing at 0.00001 1/s. Furthermore, tensile testing at 1.0 1/s led to a decrease of the WHR below those of 0.001 1/s and 0.00001 1/s, resulting in a reduction of uniform elongation. Increasing from 1.0 1/s to 230 1/s led to a small increase in the WHR to slightly lower levels than for the quasistatic tensile tests, which resulted in an increase in UTS, UE, and εf.
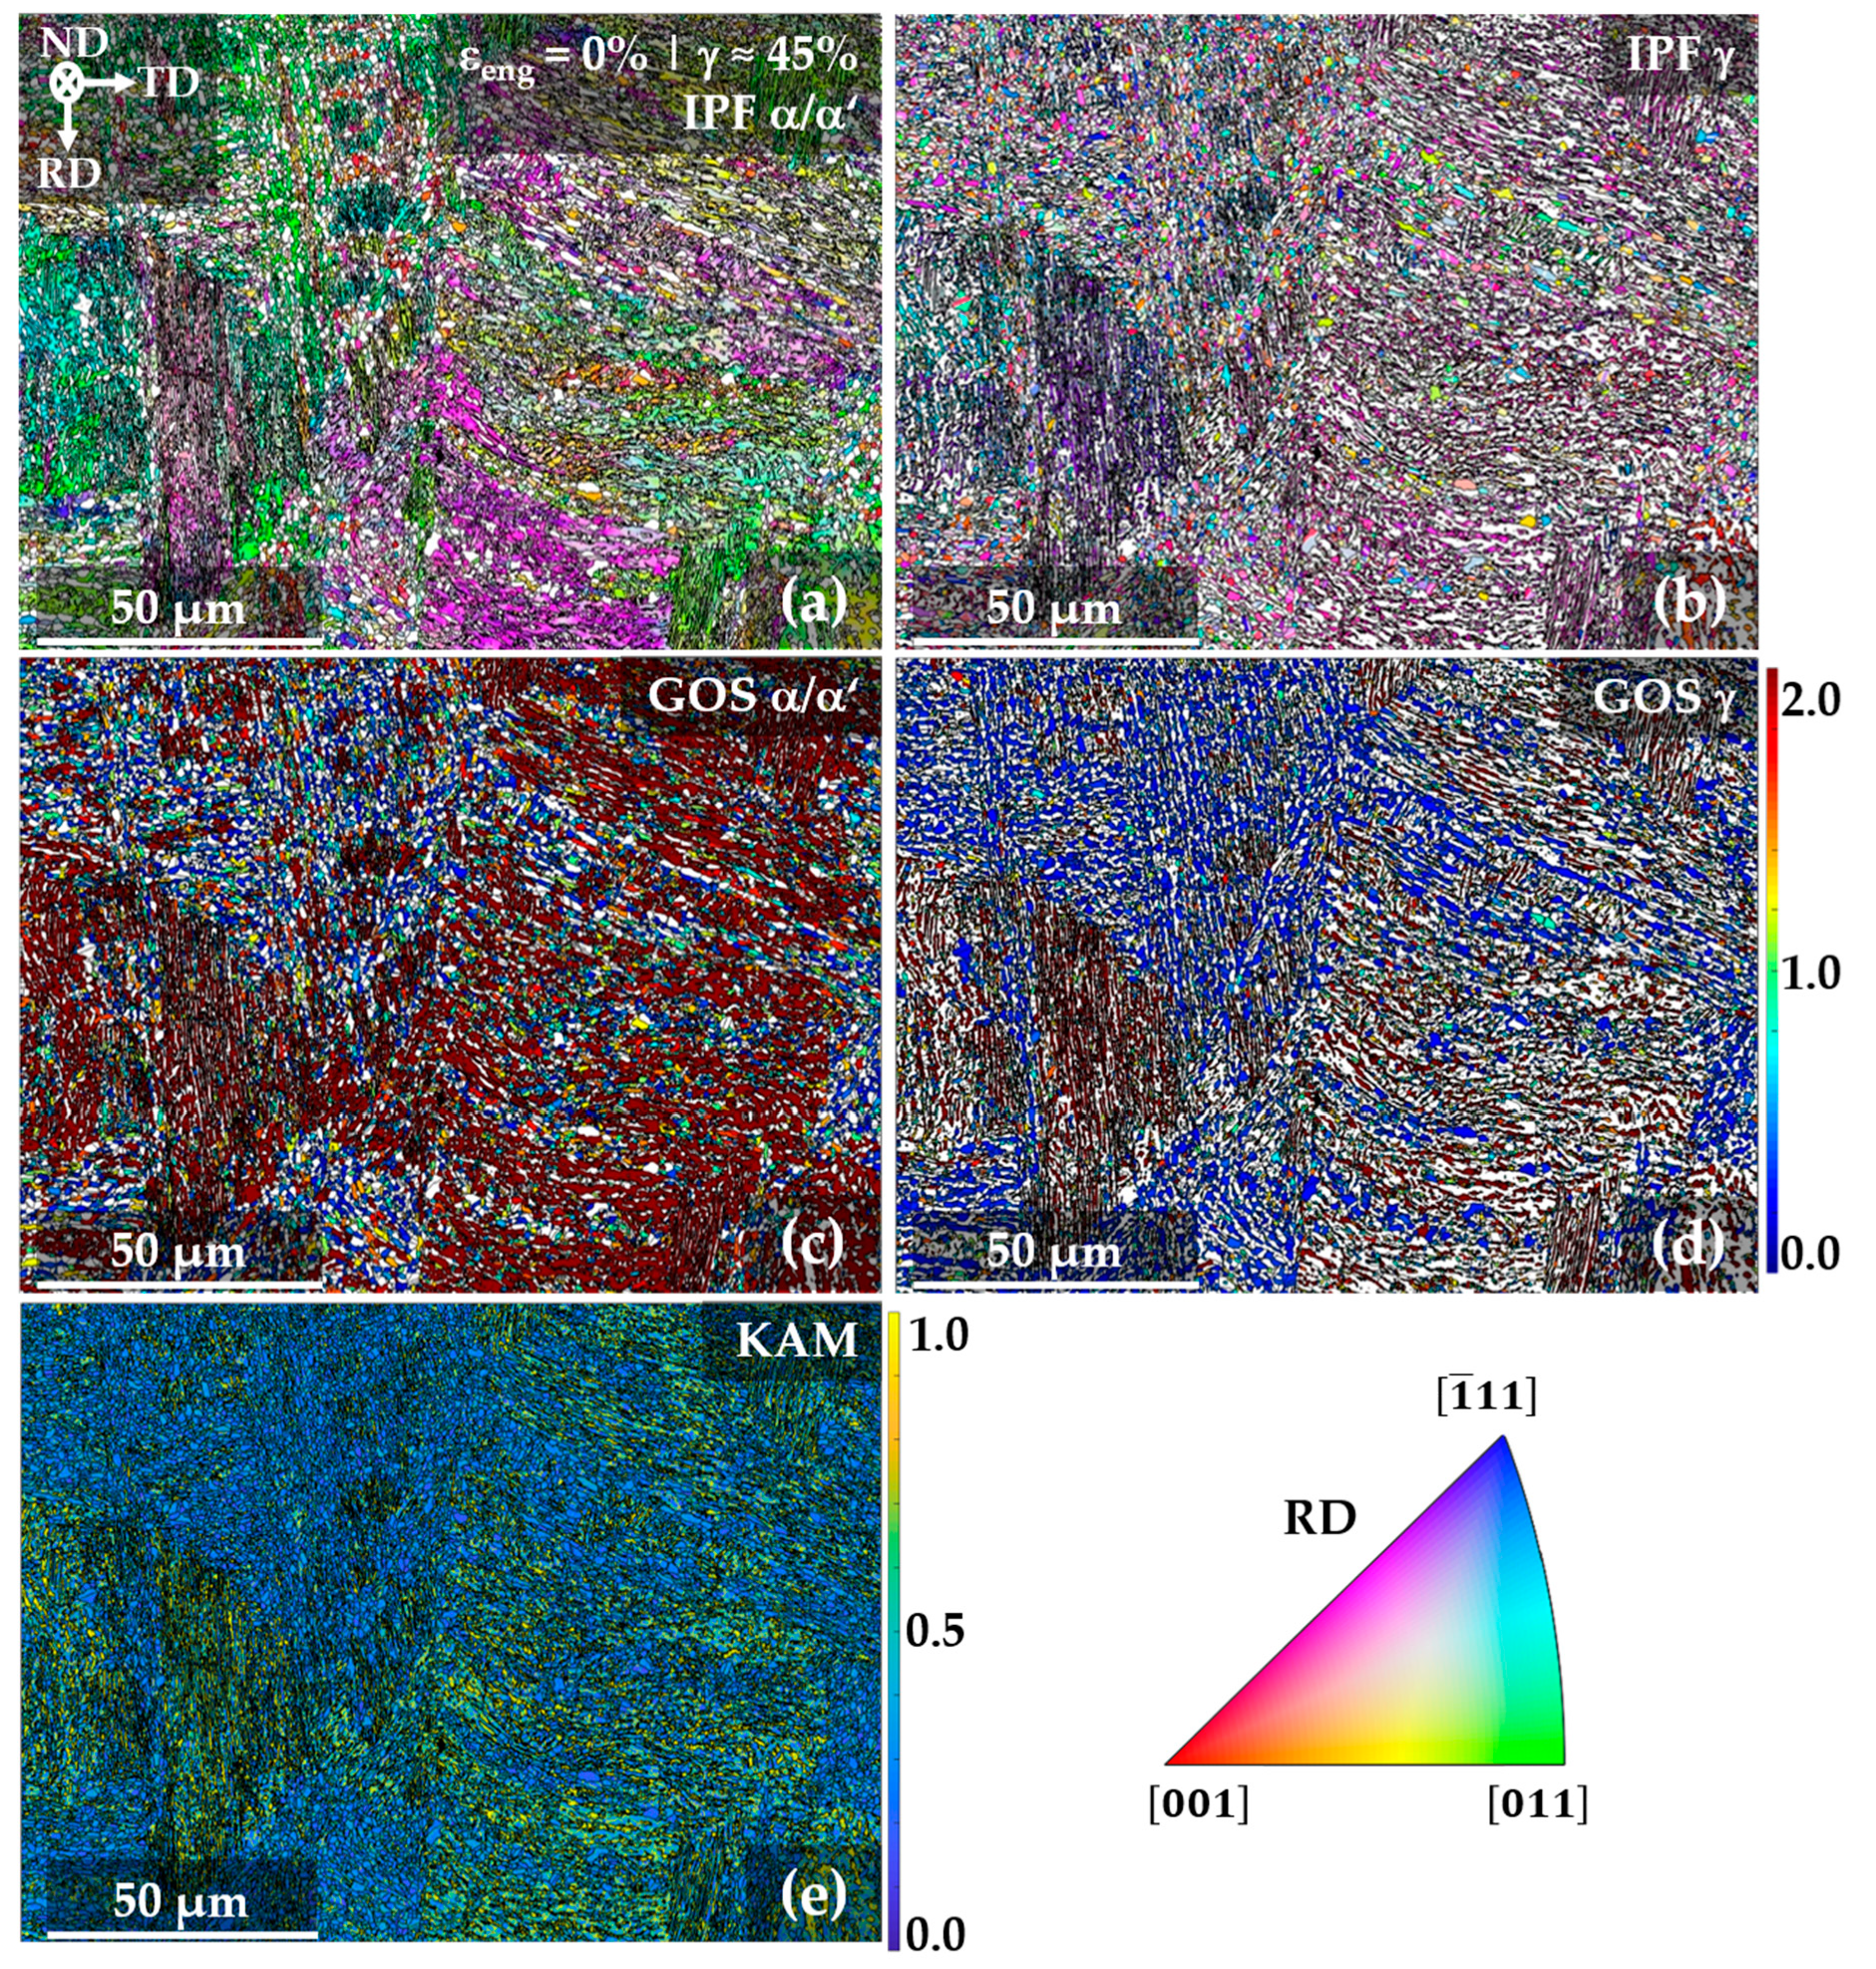
Figure 7 shows the EBSD inverse pole figure (IPF) maps and grain orientation spread (GOS) maps for α and α’, as well as γ and the kernel average misorientation (KAM) map. The GOS for α and γ was usually below 1.0 in equiaxed grains, indicating recrystallized grains, whereas the GOS values in lamellar morphologies were 2.0 or higher (cf. Figure 7c,d). The IPF maps in Figure 7 show that the orientation of the γ, α and α’ grains within the lamellar structures did not vary significantly. On the other hand, the regions in the microstructure, where granular grains occurred frequently, did not show any preferred orientations. Those regions also showed significantly lower KAM values (cf. Figure 7e).
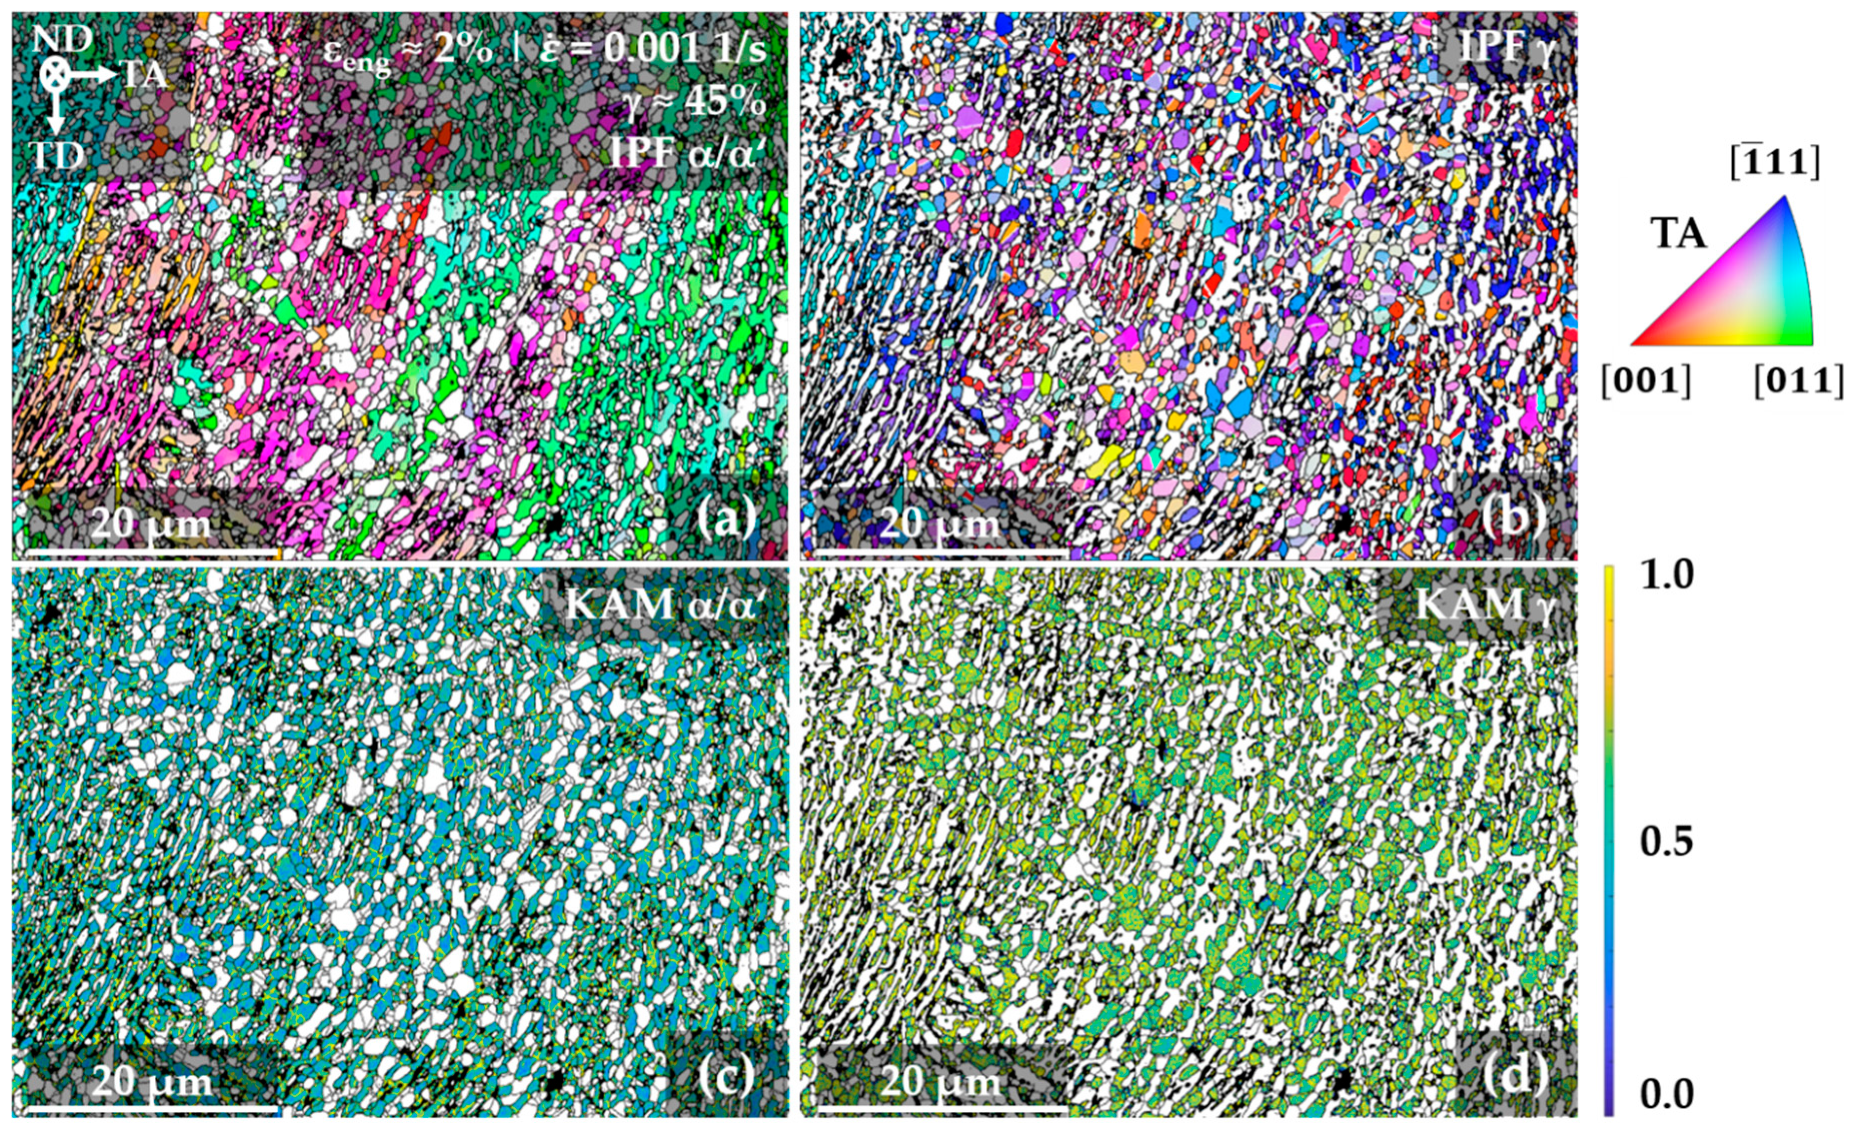
The EBSD IPF maps and KAM maps in Figure 8 show the microstructure of the X6MnAl12-3 alloy after uniform elongation to 2% strain. Comparing the EBSD IPF maps in Figure 8a,b showed that, similar to the undeformed state in Figure 7, the orientation of lamellar α and α’ grains did not deviate much, while the equiaxed γ grains between those lamellae were comparably randomly oriented. However, the KAM values of the γ grains were significantly higher than those of most equiaxed α grains (cf. Figure 8c,d) and also significantly higher than the KAM values of the γ grains in the undeformed state, as shown in Figure 7e.
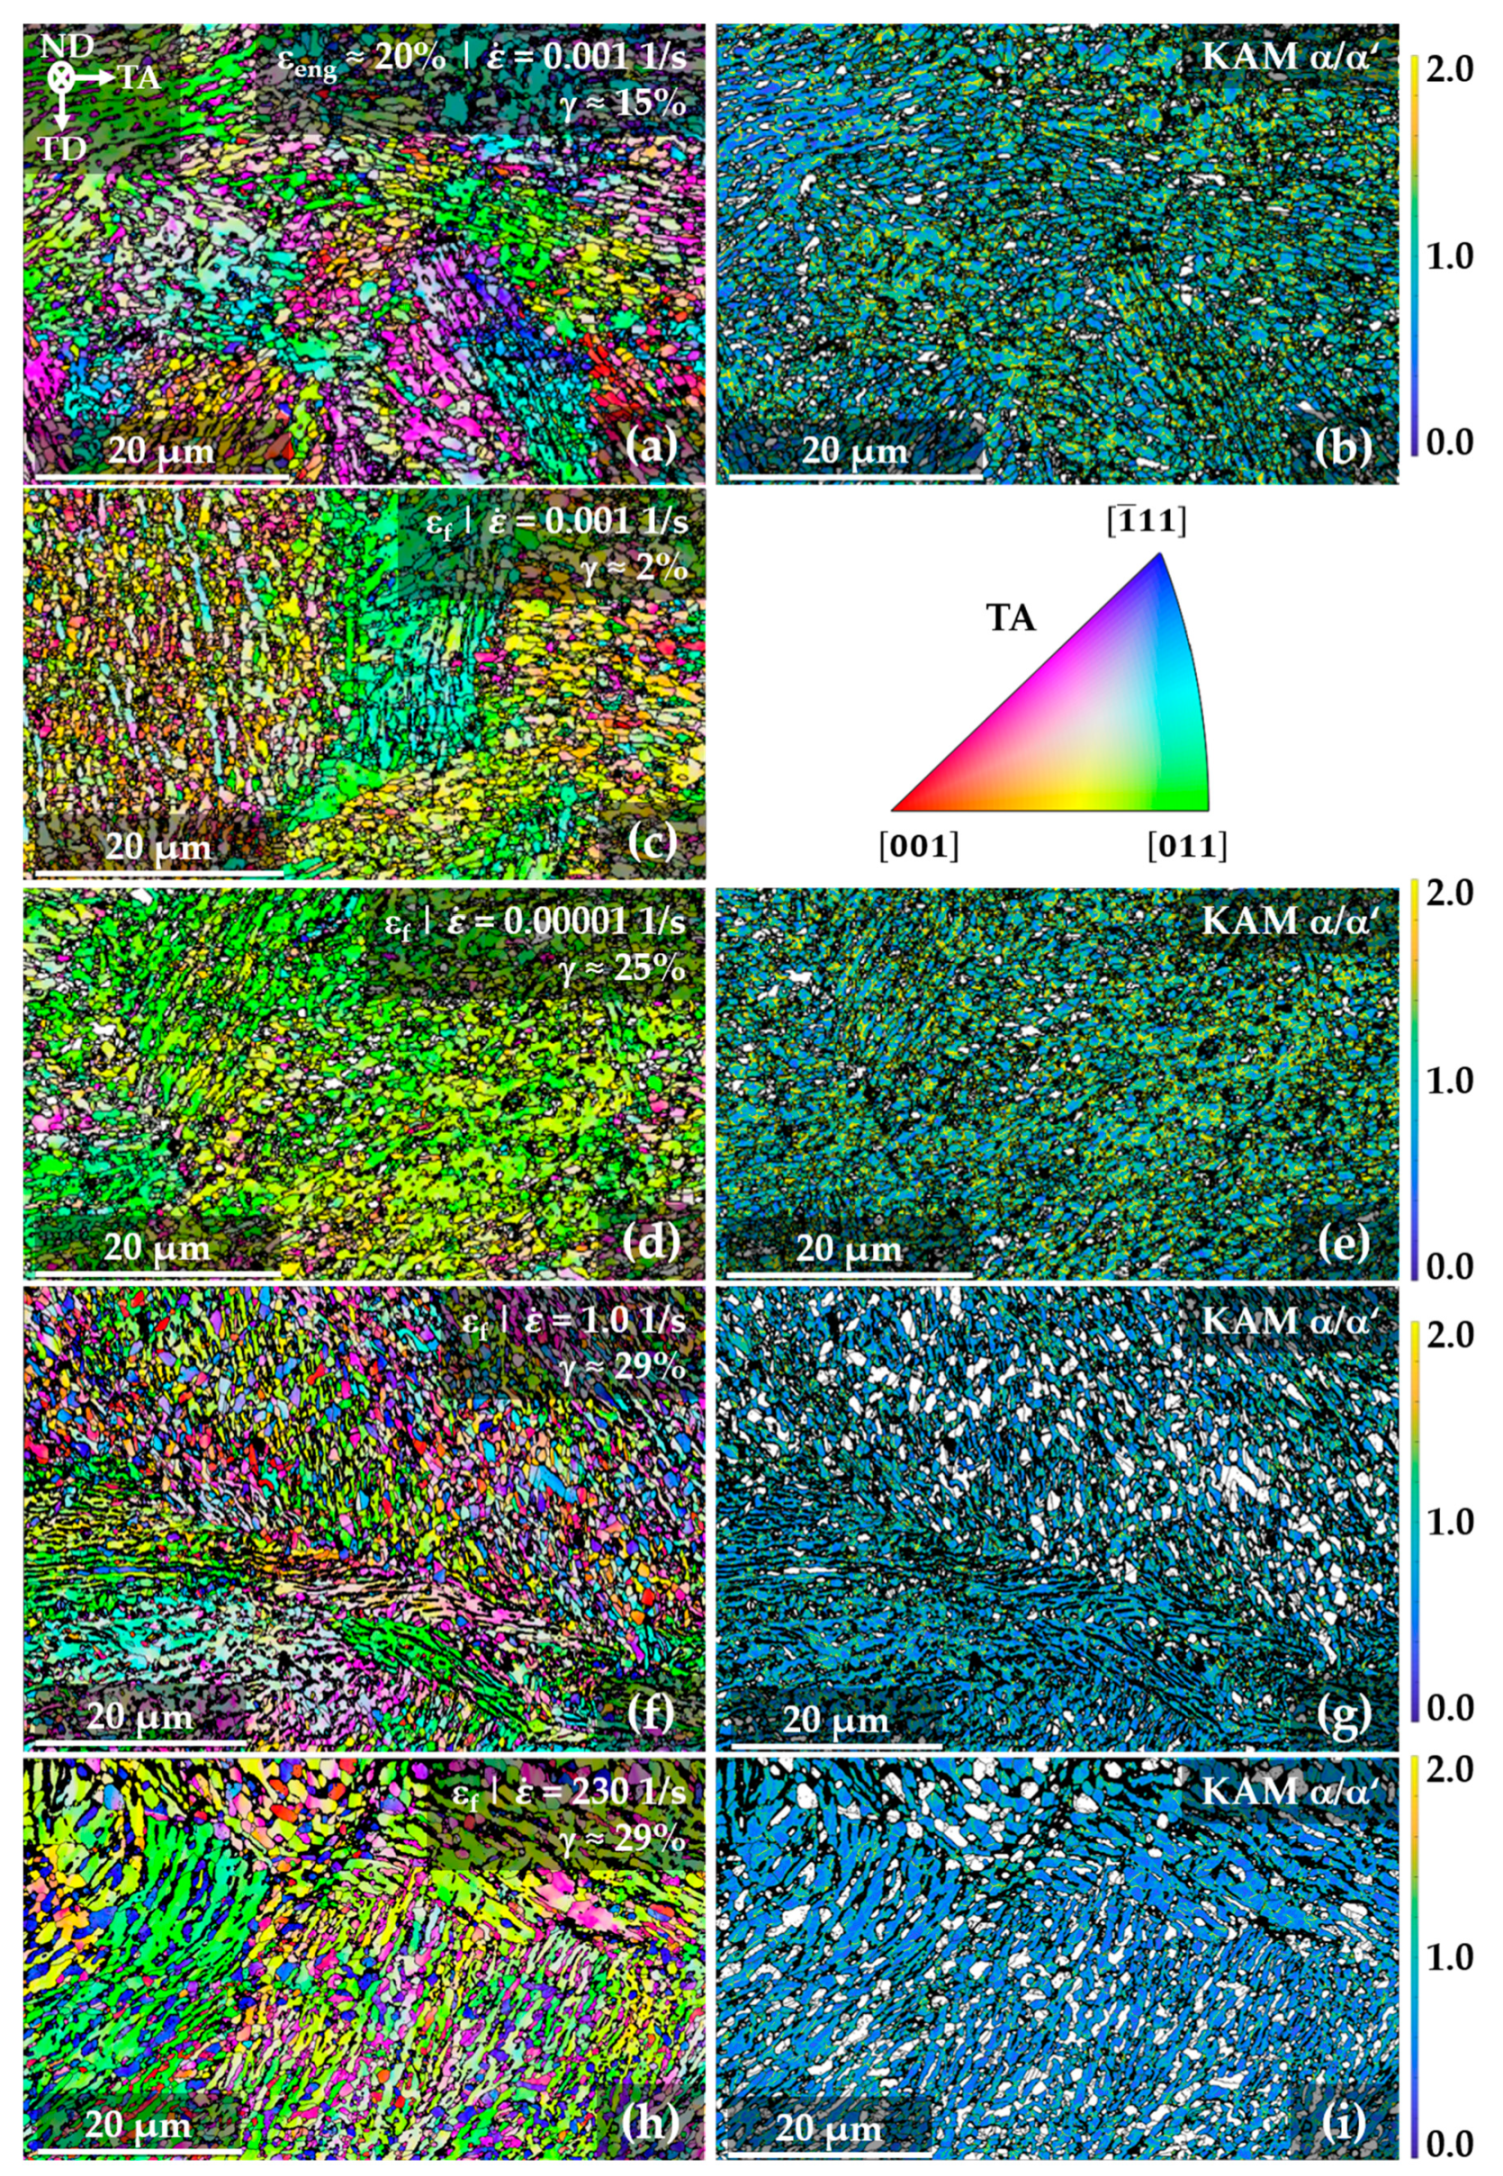
The evolution of the microstructure and the distribution of strain between phases of the X6MnAl12-3 during further straining and after fracture for of 0.00001 1/s, 0.001 1/s, 1.0 1/s, and 230 1/s is shown in Figure 9 by means of EBSD IPF maps and KAM maps for α and α’. The EBSD IPF maps in Figure 9 show that the microstructure at higher elongations mainly consisted of blocks of lamellar α and α’ grains, in which the orientations of α and α’ were similar to each other. Comparing the KAM maps of α and α’ grains after fracture for 0.00001 1/s, 1.0 1/s, and 230 1/s (cf. Figure 9b,f,h,j), the KAM values overall decreased with increasing strain rate. The KAM values of α and α’ grains after elongation to fracture at 0.00001 1/s (cf. Figure 9e) and after 20% elongation at 0.001 1/s (cf. Figure 9b) were similar.
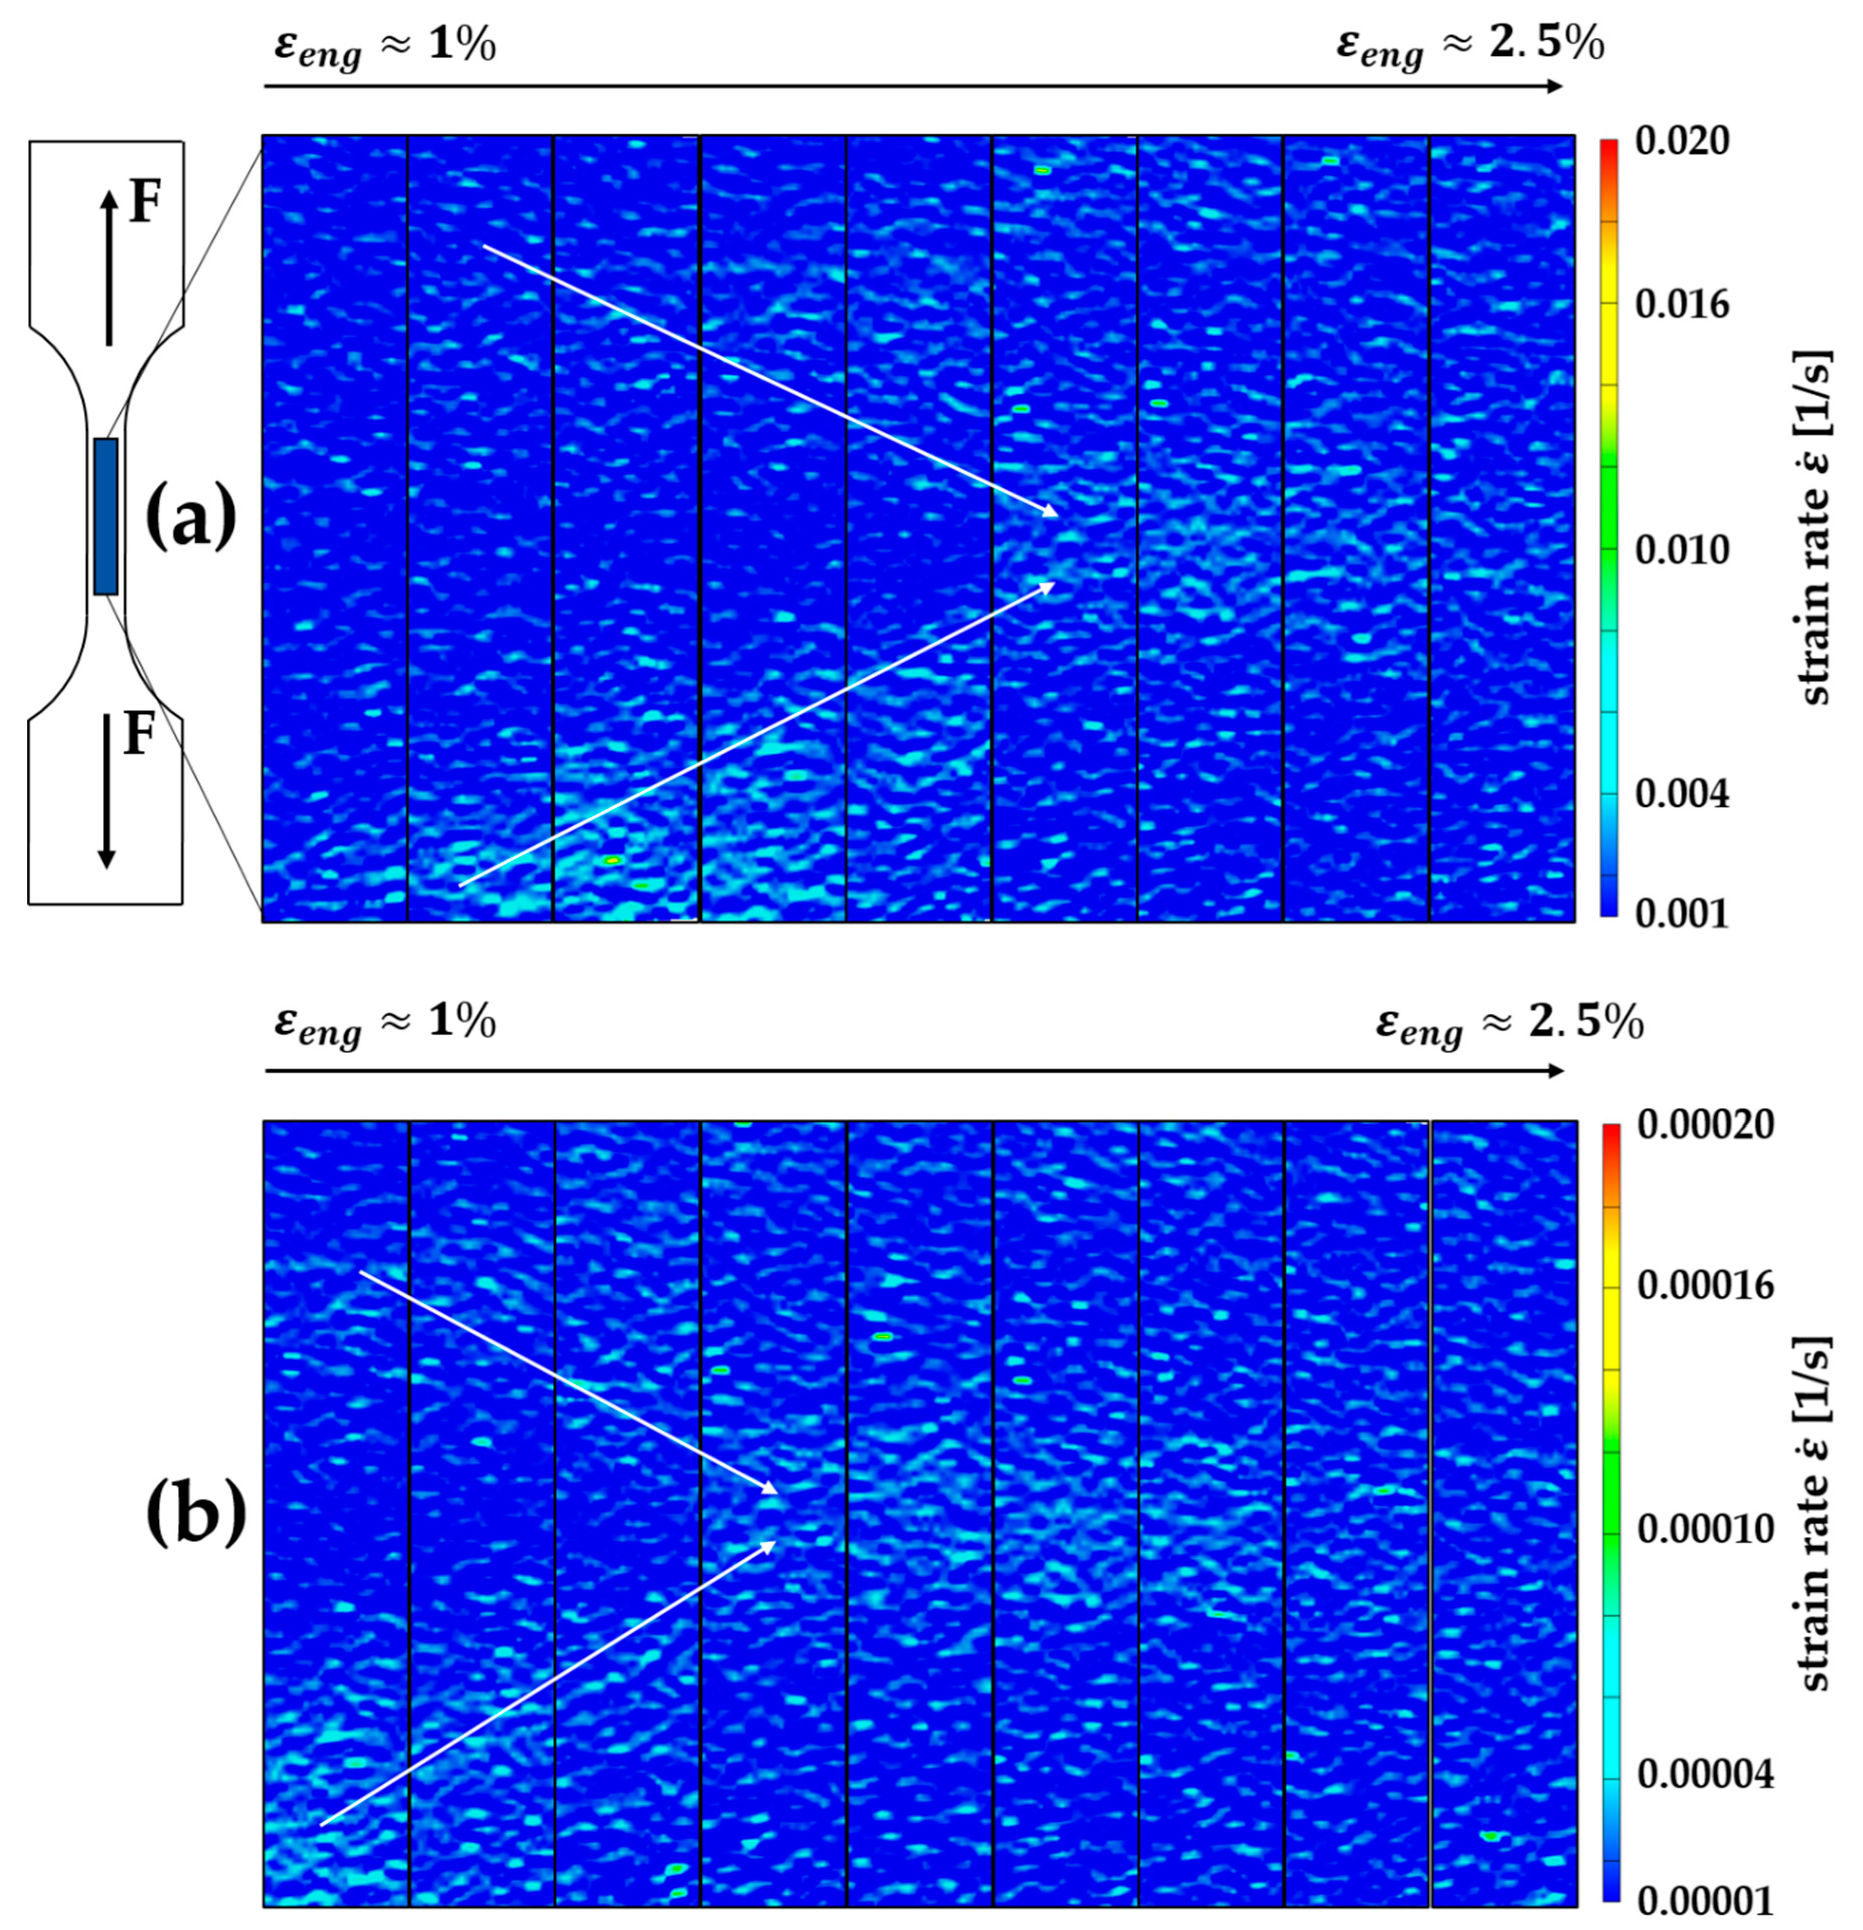
The in-situ DIC measurements in Figure 10 show the local strain rate, which indicates localized deformation behavior, on the surface of the tensile test specimen during the discontinuous elastic-plastic transition for the strain rates of 0.001 1/s and 0.00001 1/s. As shown in Figure 10, the discontinuous yield phenomenon was accompanied by a Lüders-band type of strain localization, which initiates in the clamping sections of the tensile test specimen and subsequently progresses towards the middle of the sample. The bands meet at the end of the Lüders strain at approximately 2.0% εeng. At higher strains, the plastic deformation proceeded homogeneously.
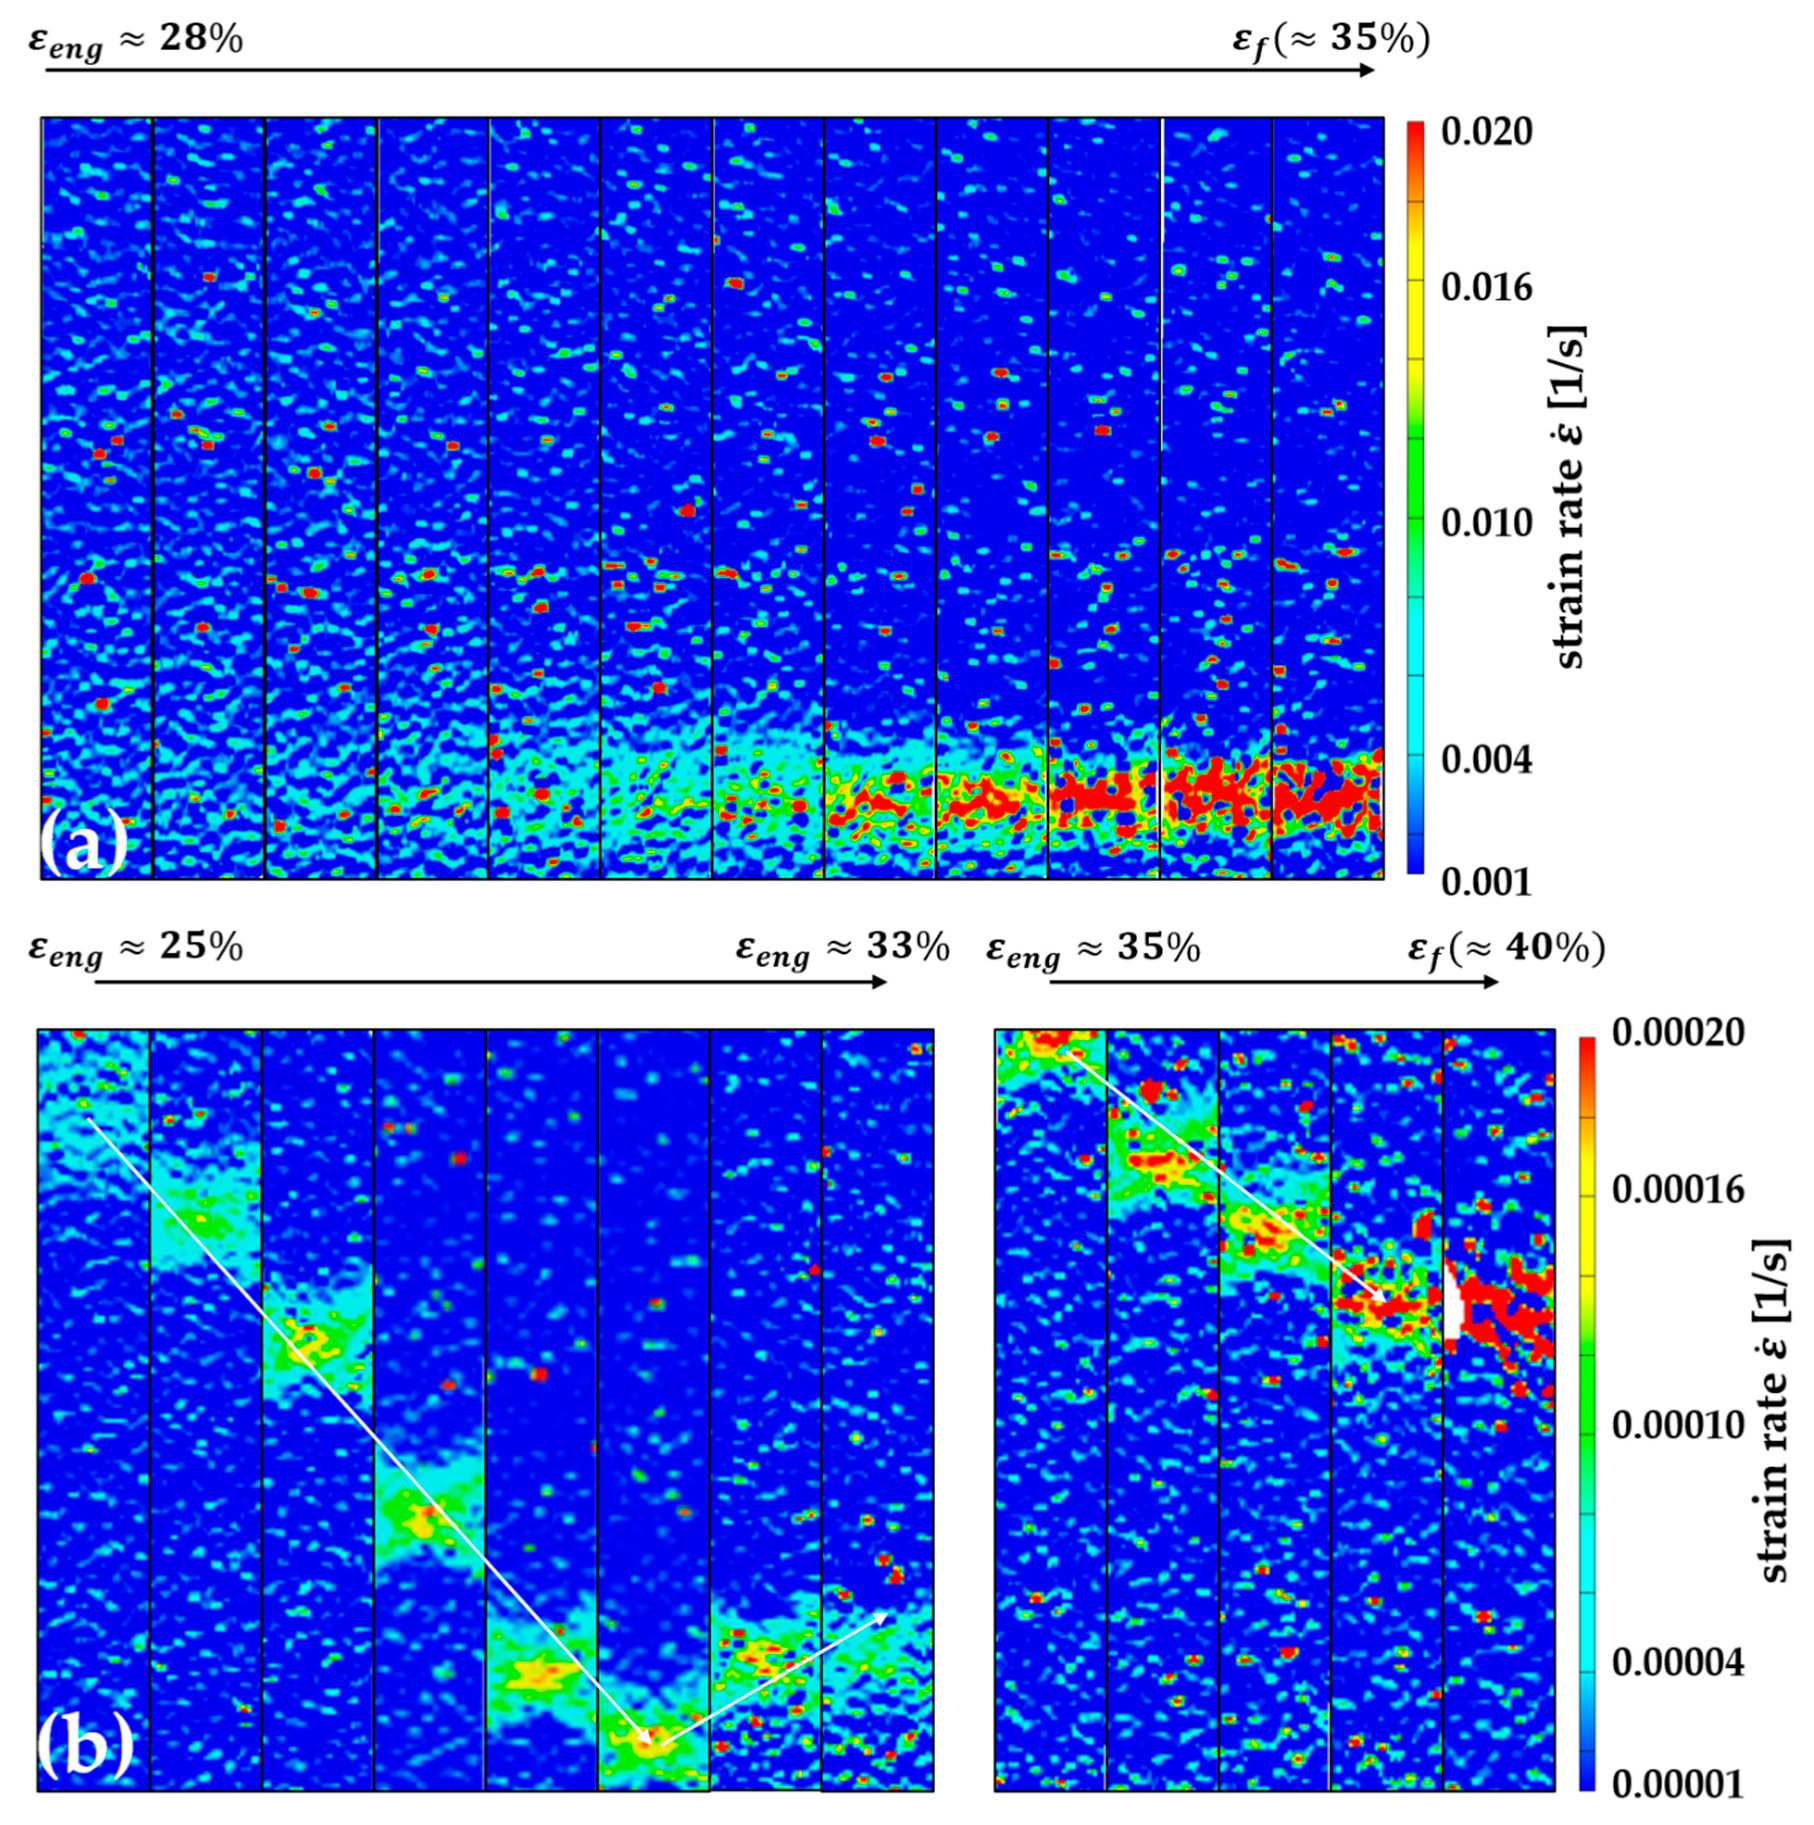
Figure 11 shows the strain localization behavior at high plastic strains for the specimens at 0.001 1/s and 0.00001 1/s. Comparing Figure 11a,b, tensile testing at 0.001 1/s did not lead to pronounced localized deformation behavior before necking, while two “X”-shaped areas (“X-bands”) of strain localization occurred before necking during tensile testing at 0.00001 1/s. The onset of those deformation bands coincided with the spikes in the flow curve shown in Figure 6. The deformation bands propagated only in one direction and changed direction at the end of the parallel gauge length (cf. left part of Figure 11b).
4. Discussion
In this work, the strain-rate-dependent mechanical properties and strain localization behavior of an intercritically annealed medium-manganese X6MnAl12-3 steel were investigated.
IA at 675 °C for 2 h after cold rolling led to a mixed microstructure consisting of γ, α, and α’. The distinction between α and α’ can be made based on the lamellar morphology and the GOS values (cf. Figure 7), for which a threshold value of 2 can be used to distinguish recrystallized grains with low internal stress (GOS below 2) and deformed grains with higher internal stress (GOS over 2) [32]. For the purpose of distinguishing between α and α’ in this work, a lamellar morphology in combination with a GOS value over 2 is considered to indicate α’. However, it should be noted that recovered α’ could also show GOS values below 2, as the diffusion of C out of the distorted bcc lattice could reduce the lattice distortion of α’ and accordingly reduce the GOS value. Applying the GOS criterion for γ (cf. Figure 7d) reveals that the majority of γ grains, except lamellar grains of reverted γ situated between α’-lamellae, showed GOS values significantly lower than 1. Whereas the microstructure after cold rolling can be identified as fully martensitic (cf. Figure 2c), IA led to a microstructure consisting of lamellar reverted γ and α and α’ grains as well as recrystallized, mostly equiaxed γ and α grains. Al and Mn were partitioned with Mn being enriched and Al being depleted in γ (cf. Figure 2d and Figure 4a). The approximated Mn and Al contents of 14.0 wt.% and 2.5 wt.% for the calculation of the SFE using a subregular solution thermodynamic model [7] resulted in an SFE of γ at room temperature (RT) of 10 mJ/m2. The low alloying content of 0.064 wt.% does not allow for an accurate determination of the actual C content in austenite via EDS. However, it can be assumed that the SFE is not significantly impacted by the partitioning of C to γ because of the very low alloying content of C compared to the significant γ phase fraction of 45% [6,7,8,33]. Accordingly, for the calculation of the SFE in this work, the C content is approximated to be 0.064 wt.%. This is in line with the findings of experimental approaches using atom probe tomography and EDS on a MMnS with very similar chemical composition and phase fractions after IA [22].
Overall, the high YS in the X6MnAl12-3 alloy, despite the low C content, can be explained by the presence of hard α’ and the ultrafine-grained microstructure, which affects the flow stress significantly [34,35]. In the case of the microstructure of the X6MnAl12-3 alloy after IA, the critical stress required for plastic deformation is different for each α’, α, and γ. Due to the low C content, the critical stress value for γ is significantly lower than for α and especially for α’. As a result, the initial plastic deformation is mainly accommodated by deformation in γ, which is pointed out by the comparison of KAM values for γ, α, and α’ in Figure 8. High KAM values are an indication of the existence of geometrically necessary dislocations [36]. The different critical stress values of γ, α, and α’ for plastic deformation are also the reason for the discontinuous elastic-plastic transition during quasistatic tensile testing. Due to the polynomial function that is used to smooth the oscillating force signal during the analysis of the high-speed dynamic tensile tests, it remains unclear whether the discontinuous elastic-plastic transition also occurs at higher strain rates, as a previous study has found to be the case for a multi-phase MMnS [28].
During deformation, the TRIP effect leads to a reduction in γ phase fraction, as summarized in Figure 12.
The activation of the TRIP effect is determined by the stability of γ, which depends on the chemical composition, temperature and internal stress σγ [37]. With progressing plastic deformation, σγ increases and reaches a critical level for the activation of the TRIP effect. Accordingly, as shown in Figure 7 and Figure 12, the phase fraction of γ is reduced. As stated in the previous paragraph, the flow stress of multi-phase steels like the X6MnAl12-3 MMnS is determined by the individual effective flow stress of each microstructural component γ, α, and α’. As evidenced by the discontinuous elastic-plastic transition, plastic deformation will be accommodated to different degrees by γ, α, and α’, and intergranular strain accommodation is impeded [24,25,26]. However, at low , strain accommodation processes like dislocation generation in neighboring grains can occur over a longer period of time until the critical stress for initiation of the TRIP effect is reached. As Figure 8 and Figure 12 show, this results in higher phase fractions of γ after fracture for a strain rate of 0.00001 1/s. This is also reflected by the higher KAM values in α and α’ after deformation in Figure 9 for lower strain rates and is in agreement with previous reports of decreasing twin volume fractions with lower strain rates in high-manganese TWIP steels [38], where dislocation activity increased at lower strain rates [39]. Accordingly, the strain-rate sensitivity at low and medium of the tested X6MnAl12-3 MMnS on the microscale regarding the activation of secondary deformation mechanisms is high.
At ≥1.0 1/s, adiabatic heating effects can cause drastic temperature increases of up to 100–150 °C in the tensile test specimen during deformation [29,36]. As such, the SFE is increased in-situ to 27–38 mJ/m2 in γ based on the chemical composition derived from EDS [7], which is higher than the critical value of 18 mJ/m2, above which the TRIP effect is suppressed or partially suppressed, as has been shown previously for HMnS and multi-phase MMnS [4,27,28,29,40,41,42]. Therefore, higher γ phase fractions are present after fracture (cf. Figure 8 and Figure 12). This results in an increase in UTS with increasing strain rate >1.0 1/s (cf. Figure 3c), because strain accommodation processes between γ, α, and α’ do not occur to the same extent as at lower strain rates. This is also reflected by the low KAM values of α and α’ at higher strain rates (cf. Figure 9), as a higher fraction of plastic deformation is accommodated by γ at 1.0 1/s than at lower strain rates.
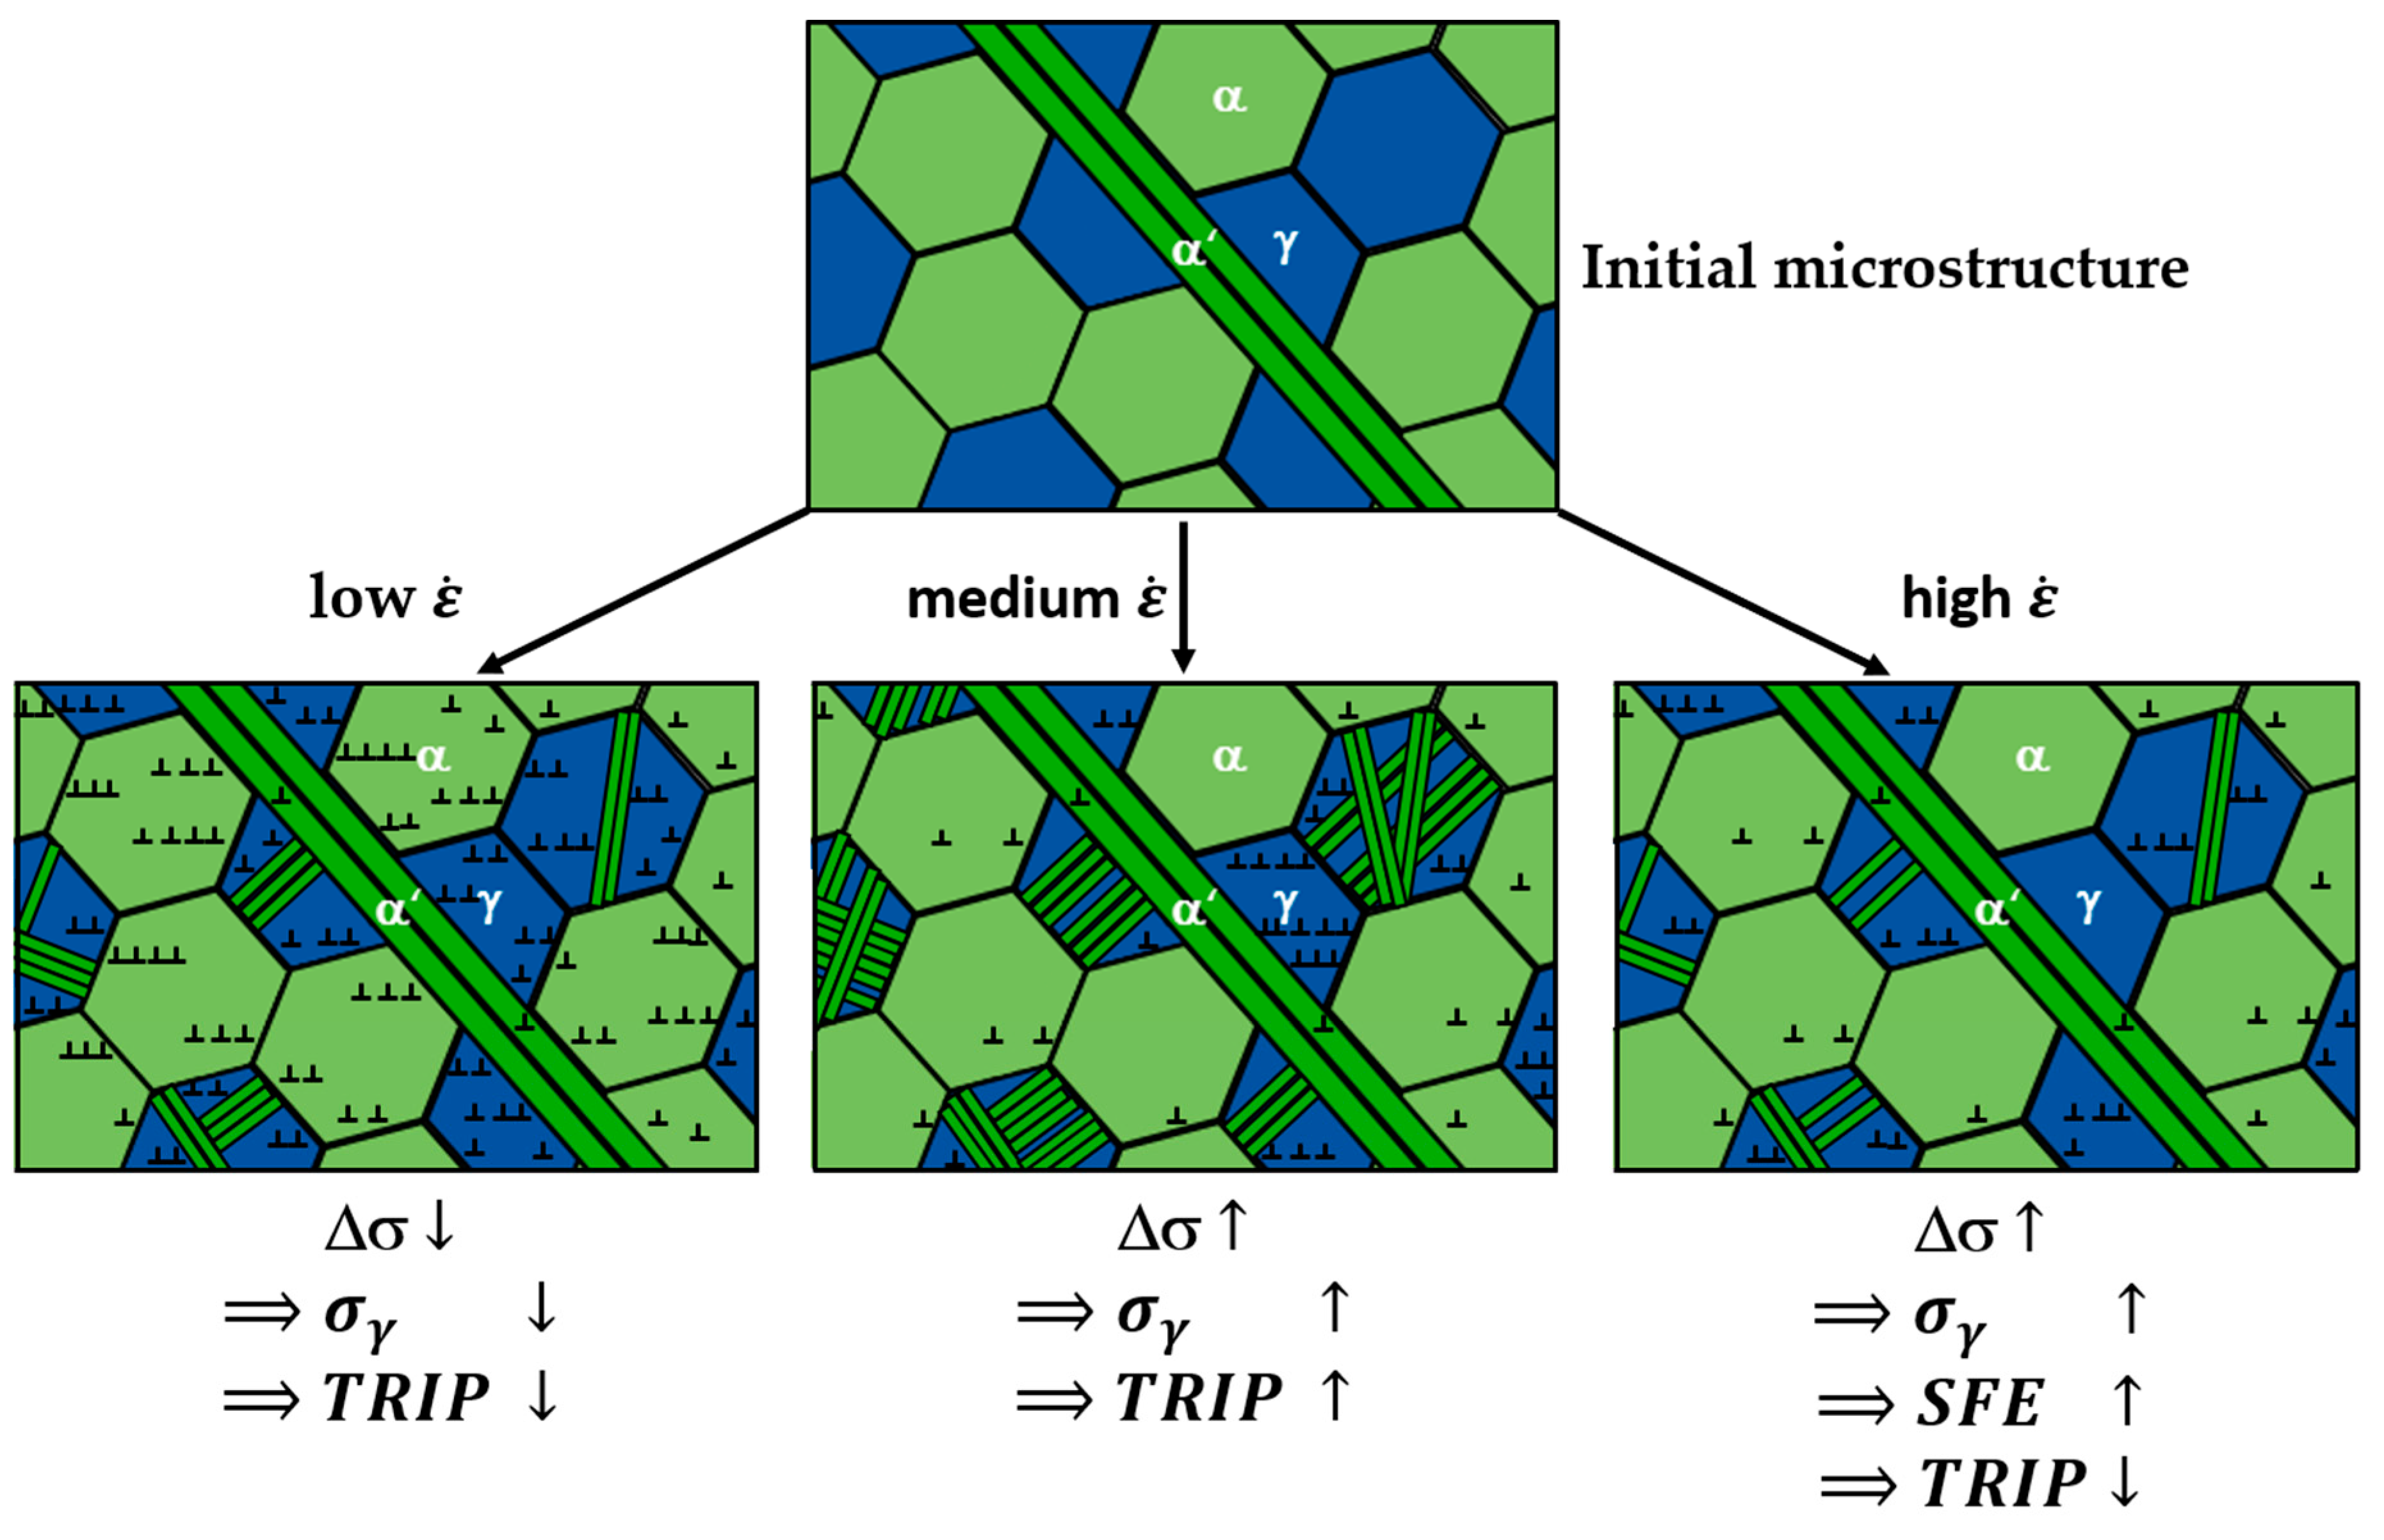
Following the remarks of the previous paragraphs, the impact of on the accommodation of plastic deformation in the X6MnAl12-3 MMnS can be described as a strain-rate-dependent strength of α and α’ relative to γ (Δσ). At high strain rates, strain accommodation processes are partially inhibited, increasing Δσ. At low strain rates, sufficient time for the dislocation generation at grain boundaries of α and α’ is available to accommodate the increased stress level in neighboring γ grains. Accordingly, Δσ is lower than at high strain rates. As a result, the accommodation of plastic deformation is much more homogeneously distributed over γ, α, and α’ at very slow strain rates. Consequently, the TRIP effect, which is activated above a critical stress value for σγ, is partially suppressed at very low strain rates. Figure 13 illustrates the strain-rate-dependent microstructural development.
The low WHR, UE, and εf at 1.0 1/s compared to quasistatic (cf. Figure 6) can be explained by three effects. Firstly, adiabatic heating at high enables dynamic recovery processes in γ, which decreases the WHR [4,27]. Additionally, the adiabatic heating also increases the SFE of γ and leads to a partial suppression of the TRIP effect during plastic deformation (cf. Figure 4 and Figure 5) [7,8,27,28,29]. Thirdly, the high Δσ suppresses the participation of the harder α and α’ phases in accommodating plastic deformation to a large extent. Increasing >1.0 1/s led to an increase in WHR and, accordingly, to higher UTS and εf (cf. Figure 3), which is typically observed in conventional TRIP steels, dual-phase (DP) steels, and high-manganese TWIP steels with positive strain-rate sensitivity [27,43,44], as well as in multi-phase MMnS [28]. However, at 1.0 1/s, this effect is not strong enough to compensate for the partial suppression of the TRIP effect, which results in a low WHR compared to quasistatic . This minimum in UE and εf at medium-high has also been previously observed in high-manganese TWIP steels [27]. Comparing the γ phase fractions after elongation to fracture (cf. Figure 5 and Figure 12) reveals that increasing >1.0 1/s did not lead to an increase in the retained γ phase fraction, as has also previously been reported in multi-phase MMnS [28]. This is because the adiabatic heating effect primarily occurs during necking so that during the initial stages of plastic deformation, the TRIP effect can still occur. Due to this, the UE does not increase significantly. Overall, the interplay of effects on a microscale leads to a negative strain-rate sensitivity in the quasistatic regime with regards to the macroscopic mechanical properties, especially for the UTS, UE and εf. At high , the strain-rate sensitivity is slightly positive, similar to conventional TRIP and DP steels.
Although the α’ phase fraction after straining to fracture at 0.00001 1/s is not as high as at 0.001 1/s (cf. Figure 8 and Figure 12), indicating a lower activity of the TRIP effect, the WHR is similar (cf. Figure 6). Usually, the TRIP effect leads to a strong increase in WHR [1,27]. However, as the participation of the harder phases α and α’ in accommodating plastic deformation increases at lower strain rates due to a lower relative Δσ, the necessary stress for further straining increases to a similar extent. Accordingly, the WHR in the quasistatic tensile testing regime is not impacted significantly by the strain rate.
Recently, the impact of microstructural heterogeneity and the activation of secondary deformation mechanisms has been found to be of critical importance for the initiation and propagation of deformation bands, resulting in serrated flow curves [14,45]. Following the remarks of the previous paragraphs, the occurrence of serrated flow in the X6MnAl12-3 alloy at very slow strain rates could be due to the enhanced accommodation of plastic deformation by relatively low Δσ, which enables the propagation of deformation bands and the occurrence of serrated flow. Comparing the flow curves of the X6MnAl12-3 alloy at 0.001 1/s and 0.00001 1/s in Figure 6 reveals that the onset of strain localization during plastic deformation at 0.00001 1/s and 0.001 1/s occurs at approximately 28% strain, as is also shown by the in-situ DIC measurements in Figure 11. However, as the propagation of stresses is inhibited by the higher Δσ at 0.001 1/s, necking is initiated in contrast to the occurrence of the serrated flow at 0.00001 1/s. This also explains the higher total elongation at 0.00001 1/s.
5. Conclusions
The strain-rate-dependent deformation behavior and mechanical properties of a X6MnAl12-3 medium-manganese steel (MMnS) were investigated. Intercritical annealing at 675 °C for 2 h led to an ultrafine-grained multi-phase microstructure consisting of approximately 45% reverted austenite (γ) and 55% recrystallized ferrite (α) and recovered martensite (α’). The following conclusions can be drawn:
- The strain-rate sensitivity of the macroscopic mechanical properties is different for low quasistatic strain rates and high strain rates , which is due to the high strain-rate sensitivity of the deformation behavior on the microscale. On the microscale, the strain-rate-dependent strength of α and α’ relative to γ (∆σ) leads to the observed strain-rate sensitivity of the phase transformation (TRIP).
- At low , ∆σ is relatively small, which enables the accommodation of plastic deformation by α or α’ and compensates the negative impact of the partial suppression of the TRIP effect on the work-hardening rate (WHR). At very low , serrated flow occurs, which is due to the TRIP mechanism in combination with a significant accommodation of plastic deformation by α and α’.
- At high , plastic deformation is not accommodated by α and α’ to a large extent due to a very high ∆σ. Additionally, adiabatic heating effects partially suppress the TRIP effect in γ.
- At a medium quasistatic (e.g., 0.001 1/s), ∆σ is relatively high, and plastic deformation is primarily accommodated by γ, which induces the pronounced activation of the TRIP mechanism.
Author Contributions
Conceptualization, S.S.; formal analysis, S.S.; investigation, S.S.; project administration, W.B.; supervision, C.H. and W.B.; visualization, S.S.; writing–original draft, S.S.; writing–review & editing, S.S., C.H. and W.B.
Funding
This research was funded by the “Deutsche Forschungsgemeinschaft” (DFG) within the Sonderforschungsbereich (Collaborative Research Center) 761 “Steel–ab initio”.
Conflicts of Interest
The authors declare no conflict of interest. The funders had no role in the design of the study; in the collection, analyses, or interpretation of data; in the writing of the manuscript, or in the decision to publish the results.
References
- Lee, Y.-K.; Han, J. Current opinion in medium manganese steel. Mater. Sci. Technol. 2015, 31, 843–856. [Google Scholar] [CrossRef]
- DeCooman, B.C. High Mn TWIP steel and medium Mn steel. In Automotive Steels: Design, Metallurgy, Processing and Applications; Rana, R., Singh, S.B., Eds.; Woodhead Publishing: Cambridge, UK, 2017; pp. 317–385. [Google Scholar]
- Bouaziz, O.; Allain, S.; Scott, C.P.; Cugy, P.; Barbier, D. High manganese austenitic twinning induced plasticity steels: A review of the microstructure properties relationships. Curr. Opin. Solid State Mater. Sci. 2011, 15, 141–168. [Google Scholar] [CrossRef]
- DeCooman, B.C.; Estrin, Y.; Kim, S.K. Twinning-induced plasticity (TWIP) steels. Acta Mater. 2018, 142, 283–362. [Google Scholar] [CrossRef]
- Bouaziz, O. Strain-hardening of twinning-induced plasticity steels. Scr. Mater. 2012, 66, 982–985. [Google Scholar] [CrossRef]
- Pierce, D.T.; Jiménez, J.A.; Bentley, J.; Raabe, D.; Oskay, C.; Wittig, J.E. The influence of manganese content on the stacking fault and austenite/ε-martensite interfacial energies in Fe–Mn–(Al–Si) steels investigated by experiment and theory. Acta Mater. 2014, 68, 238–253. [Google Scholar] [CrossRef]
- Saeed-Akbari, A.; Imlau, J.; Prahl, U.; Bleck, W. Derivation and Variation in Composition-Dependent Stacking Fault Energy Maps Based on Subregular Solution Model in High-Manganese Steels. Metall. Mater. Trans. A 2009, 40, 3076–3090. [Google Scholar] [CrossRef]
- Dumay, A.; Chateau, J.P.; Allain, S.; Migot, S.; Bouaziz, O. Influence of addition elements on the stacking-fault energy and mechanical properties of an austenitic Fe–Mn–C steel. Mater. Sci. Eng. A 2008, 483–484, 184–187. [Google Scholar] [CrossRef]
- Bambach, M.; Conrads, L.; Daamen, M.; Güvenç, O.; Hirt, G. Enhancing the crashworthiness of high-manganese steel by strain-hardening engineering, and tailored folding by local heat-treatment. Mater. Des. 2016, 110, 157–168. [Google Scholar] [CrossRef]
- Haase, C.; Barrales-Mora, L.A.; Roters, F.; Molodov, D.A.; Gottstein, G. Applying the texture analysis for optimizing thermomechanical treatment of high manganese twinning-induced plasticity steel. Acta Mater. 2014, 80, 327–340. [Google Scholar] [CrossRef]
- Allain, S.; Bouaziz, O.; Lebedkina, T.; Lebyodkin, M. Relationship between relaxation mechanisms and strain aging in an austenitic FeMnC steel. Scr. Mater. 2011, 64, 741–744. [Google Scholar] [CrossRef]
- Hoffmann, S.; Bleck, W.; Berme, B. In Situ Characterization of Deformation Behavior of Austenitic High Manganese Steels. Steel Res. Int. 2012, 83, 379–384. [Google Scholar] [CrossRef]
- Renard, K.; Ryelandt, S.; Jacques, P.J. Characterisation of the Portevin-Le Châtelier effect affecting an austenitic TWIP steel based on digital image correlation. Mater. Sci. Eng. A 2010, 527, 2969–2977. [Google Scholar] [CrossRef]
- Sevsek, S.; Brasche, F.; Haase, C.; Bleck, W. Combined deformation twinning and short-range ordering causes serrated flow in high-manganese steels. Mater. Sci. Eng. A 2019. [Google Scholar] [CrossRef]
- Wang, X.G.; Wang, L.; Huang, M.X. In-situ evaluation of Lüders band associated with martensitic transformation in a medium Mn transformation-induced plasticity steel. Mater. Sci. Eng. A 2016, 674, 59–63. [Google Scholar] [CrossRef]
- Ma, Y.; Song, W.; Bleck, W. Investigation of the Microstructure Evolution in a Fe-17Mn-1.5Al-0.3C Steel via In Situ Synchrotron X-ray Diffraction during a Tensile Test. Materials 2017, 10, 1129. [Google Scholar] [CrossRef]
- Ma, Y. Medium-manganese steels processed by austenite-reverted-transformation annealing for automotive applications. Mater. Sci. Technol. 2017, 33, 1713–1727. [Google Scholar] [CrossRef]
- Lee, S.; DeCooman, B.C. Annealing Temperature Dependence of the Tensile Behavior of 10 pct Mn Multi-phase TWIP-TRIP Steel. Metall. Mater. Trans. A 2014, 45, 6039–6052. [Google Scholar] [CrossRef] [Green Version]
- Lee, S.-J.; Lee, S.; DeCooman, B.C. Mn partitioning during the intercritical annealing of ultrafine-grained 6% Mn transformation-induced plasticity steel. Scr. Mater. 2011, 64, 649–652. [Google Scholar] [CrossRef]
- Cai, Z.H.; Ding, H.; Misra, R.D.K.; Ying, Z.Y. Austenite stability and deformation behavior in a cold-rolled transformation-induced plasticity steel with medium manganese content. Acta Mater. 2015, 84, 229–236. [Google Scholar] [CrossRef]
- Emo, J.; Maugis, P.; Perlade, A. Austenite growth and stability in medium Mn, medium Al Fe-C-Mn-Al steels. Comput. Mater. Sci. 2016, 125, 206–217. [Google Scholar] [CrossRef]
- Benzing, J.T.; Kwiatkowski da Silva, A.; Morsdorf, L.; Bentley, J.; Ponge, D.; Dutta, A.; Han, J.; McBride, J.R.; Van Leer, B.; Gault, B.; Raabe, D.; Wittig, J.E. Multi-scale characterization of austenite reversion and martensite recovery in cold-rolled medium-Mn steel. Acta Mater. 2019, 166, 512–530. [Google Scholar] [CrossRef]
- Dutta, A.; Ponge, D.; Sandlöbes, S.; Raabe, D. Strain partitioning and strain localization in medium manganese steels measured by in situ microscopic digital image correlation. Materialia 2019, 5, 100252. [Google Scholar] [CrossRef]
- Tan, X.; Ponge, D.; Lu, W.; Xu, Y.; Yang, X.; Rao, X.; Wu, D.; Raabe, D. Carbon and strain partitioning in a quenched and partitioned steel containing ferrite. Acta Mater. 2019, 165, 561–576. [Google Scholar] [CrossRef]
- Gibbs, P.J.; de Cooman, B.C.; Brown, D.W.; Clausen, B.; Schroth, J.G.; Merwin, M.J.; Matlock, D.K. Strain partitioning in ultra-fine grained medium-manganese transformation induced plasticity steel. Mater. Sci. Eng. A 2014, 609, 323–333. [Google Scholar] [CrossRef]
- Latypov, M.I.; Shin, S.; DeCooman, B.C.; Kim, H.S. Micromechanical finite element analysis of strain partitioning in multiphase medium manganese TWIP+TRIP steel. Acta Mater. 2016, 108, 219–228. [Google Scholar] [CrossRef]
- Brüx, U.; Frommeyer, G.; Grässel, O.; Meyer, L.W.; Weise, A. Development and characterization of high strength impact resistant Fe-Mn-(Al-, Si) TRIP/TWIP steels. Steel Res. Int. 2002, 73, 294–298. [Google Scholar] [CrossRef]
- Poling, W.A. Tensile Deformation of Third Generation Advanced High Strength Sheet Steels under High Strain Rates. Ph.D. Dissertation, Colorado School of Mines, Golden, CO, USA, 2016. Available online: http://hdl.handle.net/11124/170454 (accessed on 14 March 2019).
- Rana, R.; De Moor, E.; Speer, J.G.; Matlock, D.K. On the Importance of Adiabatic Heating on Deformation Behavior of Medium-Manganese Sheet Steels. JOM 2018, 70, 706–713. [Google Scholar] [CrossRef]
- Bachmann, F.; Hielscher, R.; Schaeben, H. Texture Analysis with MTEX—Free and Open Source Software Toolbox. SSP 2010, 160, 63–68. [Google Scholar] [CrossRef]
- Hielscher, R.; Schaeben, H. A novel pole figure inversion method: Specification of the MTEX algorithm. J. Appl. Crystallogr. 2008, 41, 1024–1037. [Google Scholar] [CrossRef]
- Field, D.; Bradford, L.; Nowell, M.; Lillo, T. The role of annealing twins during recrystallization of Cu. Acta Mater. 2007, 55, 4233–4241. [Google Scholar] [CrossRef]
- Bouaziz, O.; Zurob, H.; Chehab, B.; Embury, J.D.; Allain, S.; Huang, M. Effect of chemical composition on work hardening of Fe-Mn-C TWIP steels. Mater. Sci. Technol. 2011, 27, 707–709. [Google Scholar] [CrossRef]
- Gutierrez-Urrutia, I.; Zaefferer, S.; Raabe, D. The effect of grain size and grain orientation on deformation twinning in a Fe–22wt.% Mn–0.6wt.% C TWIP steel. Mater. Sci. Eng. A 2010, 527, 3552–3560. [Google Scholar] [CrossRef]
- Dini, G.; Ueji, R.; Najafizadeh, A. Grain Size Dependence of the Flow Stress of TWIP Steel. MSF 2010, 654–656, 294–297. [Google Scholar] [CrossRef]
- Calcagnotto, M.; Ponge, D.; Demir, E.; Raabe, D. Orientation gradients and geometrically necessary dislocations in ultrafine grained dual-phase steels studied by 2D and 3D EBSD. Mater. Sci. Eng. A 2010, 527, 2738–2746. [Google Scholar] [CrossRef]
- Twardowski, R.; Prahl, U. Microstructure based flow curve modeling of high-Mn steels with TWIP and TRIP effect. Comput. Methods Mater. Sci. 2012, 12, 130–136. [Google Scholar]
- Meyers, M.A.; Vöhringer, O.; Lubarda, V.A. The onset of twinning in metals: A constitutive description. Acta Mater. 2001, 49, 4025–4039. [Google Scholar] [CrossRef]
- Li, K.; Yu, B.; Misra, R.D.K.; Han, G.; Tsai, Y.T.; Shao, C.W.; Shang, C.J.; Yang, J.R.; Zhang, Z.F. Strain rate dependence on the evolution of microstructure and deformation mechanism during nanoscale deformation in low carbon-high Mn TWIP steel. Mater. Sci. Eng. A 2019, 742, 116–123. [Google Scholar] [CrossRef]
- Saeed-Akbari, A.; Mosecker, L.; Schwedt, A.; Bleck, W. Characterization and Prediction of Flow Behavior in High-Manganese Twinning Induced Plasticity Steels: Part, I. Mechanism Maps and Work-Hardening Behavior. Metall. Mater. Trans. A 2012, 43, 1688–1704. [Google Scholar] [CrossRef]
- Gutierrez-Urrutia, I.; Raabe, D. Grain size effect on strain hardening in twinning-induced plasticity steels. Scr. Mater. 2012, 66, 992–996. [Google Scholar] [CrossRef]
- Gutierrez-Urrutia, I.; Zaefferer, S.; Raabe, D. Electron channeling contrast imaging of twins and dislocations in twinning-induced plasticity steels under controlled diffraction conditions in a scanning electron microscope. Scr. Mater. 2009, 61, 737–740. [Google Scholar] [CrossRef]
- Kim, J.-H.; Kim, D.; Han, H.N.; Barlat, F.; Lee, M.-G. Strain rate dependent tensile behavior of advanced high strength steels: Experiment and constitutive modeling. Mater. Sci. Eng. A 2013, 559, 222–231. [Google Scholar] [CrossRef]
- Curtze, S.; Kuokkala, V.-T.; Hokka, M.; Peura, P. Deformation behavior of TRIP and DP steels in tension at different temperatures over a wide range of strain rates. Mater. Sci. Eng. A 2009, 507, 124–131. [Google Scholar] [CrossRef]
- Jo, M.C.; Choi, J.H.; Lee, H.; Zargaran, A.; Ryu, J.H.; Sohn, S.S.; Kim, N.J.; Lee, S. Effects of solute segregation on tensile properties and serration behavior in ultra-high-strength high-Mn TRIP steels. Mater. Sci. Eng. A 2019, 740–741, 16–27. [Google Scholar] [CrossRef]
Figure 1.
The processing route for the X6MnAl12-3 MMnS.

Figure 2.
(a,c) Optical micrographs of the X6MnAl12-3 MMnS (a) after 50% cold rolling and (c) after intercritical annealing. Easily identifiable prior γ grain boundaries in (a) and grain boundaries of recrystallized grains in (c) are highlighted in blue. (b) Secondary electron (SE) image of the microstructure after intercritical annealing, and (d) the corresponding Energy Dispersive X-ray Spectroscopy (EDS) analysis of the local Al and Mn contents are shown.

Figure 3.
(a) Engineering stress-strain and (b) true stress-true strain curves of the X6MnAl12-3 alloy tested at different strain rates. (c) Overview of the strain-rate-dependent mechanical properties.
Figure 3.
(a) Engineering stress-strain and (b) true stress-true strain curves of the X6MnAl12-3 alloy tested at different strain rates. (c) Overview of the strain-rate-dependent mechanical properties.

Figure 4.
Electron backscatter diffraction (EBSD) phase maps of the investigated MMnS (a) before deformation and after straining to εeng of (b) 2%, (c) 10%, and (d) 20% at 0.001 1/s. Green areas indicate a body-centered cubic crystal structure, α and/or α’, whereas blue areas indicate face-centered cubic austenite, γ.

Figure 5.
γ phase fractions (blue) as determined by EBSD measurements after tensile testing to fracture at (a) 0.00001 1/s, (b) 0.001 1/s, (c) 1.0 1/s, and (d) 230 1/s. Green areas indicate a body-centered cubic crystal structure, α and/or α’.
Figure 5.
γ phase fractions (blue) as determined by EBSD measurements after tensile testing to fracture at (a) 0.00001 1/s, (b) 0.001 1/s, (c) 1.0 1/s, and (d) 230 1/s. Green areas indicate a body-centered cubic crystal structure, α and/or α’.

Figure 6.
Flow curve and work-hardening rate (WHR) of the X6MnAl12-3 alloy tested at 0.00001 1/s, 0.001 1/s, 1.0 1/s, and 230 1/s, respectively.
Figure 6.
Flow curve and work-hardening rate (WHR) of the X6MnAl12-3 alloy tested at 0.00001 1/s, 0.001 1/s, 1.0 1/s, and 230 1/s, respectively.

Figure 7.
EBSD maps of the X6MnAl12-3 alloy prior to deformation (a,b) with inverse pole figure (IPF) color coding relative to the rolling direction (RD) for (a) α and α’ and (b) γ. Grain orientation spread (GOS) maps for (c) α and α’, (d) γ, and (e) the kernel average misorientation (KAM) map are shown. White areas in (a–d) correspond to (a,c) γ and (b,d) α or α’, respectively.

Figure 8.
EBSD maps of the X6MnAl12-3 alloy at the end of the discontinuous elastic-plastic transition with (a,b) IPF color coding relative to the tensile axis (TA) for (a) α and α’and (b) γ. Corresponding KAM maps are shown for (c) α and α’ and (d) γ. White areas in (a–d) correspond to (a,c) γ and (b,d) α or α’, respectively.

Figure 9.
EBSD IPF maps for 0.001 1/s after (a) 20% εeng and (c) εf, as well as for the microstructure after straining until fracture at (e) 0.00001 1/s, (g) 1.0 1/s, and (i) 230 1/s. Corresponding EBSD maps with color coding according to KAM values of α and α’ in (b,f,h) and (j) are shown. White areas in the KAM maps correspond to γ.

Figure 10.
Visualization of local strain rate distribution in a tensile test sample during the discontinuous elastic-plastic transition using in-situ DIC during tensile testing at (a) 0.001 1/s and (b) 0.00001 1/s. White arrows highlight the propagation of localized peaks in strain rate during straining.

Figure 11.
Visualization of the local strain rate distribution in a tensile test sample prior to necking initiation using in-situ DIC during tensile testing at (a) 0.001 1/s and (b) 0.00001 1/s. White arrows highlight the propagation of localized peaks in strain rate during straining.
Figure 11.
Visualization of the local strain rate distribution in a tensile test sample prior to necking initiation using in-situ DIC during tensile testing at (a) 0.001 1/s and (b) 0.00001 1/s. White arrows highlight the propagation of localized peaks in strain rate during straining.

Figure 12.
Summary of the evolution of γ phase fraction (a) during straining at 0.001 1/s and (b) comparison of strain-rate-dependent γ phase fractions after fracture.
Figure 12.
Summary of the evolution of γ phase fraction (a) during straining at 0.001 1/s and (b) comparison of strain-rate-dependent γ phase fractions after fracture.

Figure 13.
Impact of the strain-rate-dependent strength of α and α’ relative to γ (Δσ) on the microstructural evolution during straining at different strain rates.
Figure 13.
Impact of the strain-rate-dependent strength of α and α’ relative to γ (Δσ) on the microstructural evolution during straining at different strain rates.


Table 1.
Ac1, Ac3, and nominal chemical composition of the X6MnAl12-3 MMnS.
| Designation | Nominal Chemical Composition [wt.%] | Ac1 [°C] | Ac3 [°C] | ||
|---|---|---|---|---|---|
| C | Mn | Al | |||
| X6MnAl12-3 | 0.064 | 11.7 | 2.9 | 503 | 825 |
Table 2.
Impact of an increase in strain rate for low, medium, and high strain rates (cf. Figure 3).
Table 2.
Impact of an increase in strain rate for low, medium, and high strain rates (cf. Figure 3).
| Mechanical Property | |||
|---|---|---|---|
| YS | |||
| UTS | |||
| UE | |||
| εf |
© 2019 by the authors. Licensee MDPI, Basel, Switzerland. This article is an open access article distributed under the terms and conditions of the Creative Commons Attribution (CC BY) license (http://creativecommons.org/licenses/by/4.0/).
Share and Cite
MDPI and ACS Style
Sevsek, S.; Haase, C.; Bleck, W. Strain-Rate-Dependent Deformation Behavior and Mechanical Properties of a Multi-Phase Medium-Manganese Steel. Metals 2019, 9, 344. https://doi.org/10.3390/met9030344
AMA Style
Sevsek S, Haase C, Bleck W. Strain-Rate-Dependent Deformation Behavior and Mechanical Properties of a Multi-Phase Medium-Manganese Steel. Metals. 2019; 9(3):344. https://doi.org/10.3390/met9030344
Chicago/Turabian StyleSevsek, Simon, Christian Haase, and Wolfgang Bleck. 2019. "Strain-Rate-Dependent Deformation Behavior and Mechanical Properties of a Multi-Phase Medium-Manganese Steel" Metals 9, no. 3: 344. https://doi.org/10.3390/met9030344
Note that from the first issue of 2016, this journal uses article numbers instead of page numbers. See further details here.