The Effect of Microstructural Characteristics on the Hydrogen Permeation Transient in Quenched and Tempered Martensitic Alloys


1
Department of Materials, Textiles and Chemical Engineering-MaTCh, Sustainable Materials Science-SMS, Tech Lane Ghent Science Park, Campus A, Technologiepark 903, Ghent University (UGent), 9052 Zwijnaarde, Belgium
2
SIM vzw, Technologiepark 935, 9052 Zwijnaarde, Belgium
*
Author to whom correspondence should be addressed.
Metals 2018, 8(10), 779; https://doi.org/10.3390/met8100779
Submission received: 21 September 2018
/
Revised: 26 September 2018
/
Accepted: 27 September 2018
/
Published: 29 September 2018
Abstract
:This work evaluates the permeation curve characteristics for four quenched and tempered generic, ternary alloys, each containing one specific carbide. The different carbides (W2C, Cr23C6, TiC, and V4C3, respectively) are induced by a quench and tempering treatment. The correlation is made between the different microstructural characteristics, including the carbides and the martensitic matrix, and the observed hydrogen diffusivity and thus the permeation transient. The permeation curves, obtained via the Devanathan and Stachurski method, are therefore compared with thermal desorption spectroscopy and hot extraction results. The delay of the permeation transient can be associated with the overall trap density, while the slope is related to the amount of reversible trapping sites. Generally, the obtained hydrogen permeation transient of the different ternary or Fe–C–X materials correlates with the hydrogen trapping ability. The following order of hydrogen diffusion is determined, i.e., Fe–C–V < Fe–C–Ti << Fe–C–Cr < Fe–C–W. The hydrogen trapping ability of the tempered induced carbides plays a decisive role in the value of the hydrogen diffusion coefficient.
1. Introduction
The detrimental effect of hydrogen was already discussed by Johnson [1] in 1875 and still, a complete understanding of the exact damaging mechanism has not been achieved. As hydrogen is able to deteriorate the materials mechanical properties, research on this topic is of high importance in order to avoid unforeseen failure. The phenomenon of the ductility loss due to hydrogen is generally called hydrogen embrittlement (HE), and steels with high stresses and a large number of potential fracture initiation sites show high susceptibility [2,3,4,5]. This raises questions concerning the promising advanced high-strength steels for many types of applications. Therefore, during the last decade, much research has been done on the hydrogen interaction with these high-strength steels [4,6,7,8,9,10]. Depover et al. [4] examined the hydrogen induced ductility loss of four different high-strength steels, i.e., a Transformation Induced Plasticity (TRIP), Dual Phase (DP), Ferritic Bainitic (FB), and High Strength Low Alloy (HSLA) steel. All materials showed a considerable degree of HE except for the HSLA steel, which was almost unaffected by hydrogen. This satisfying result was attributed to the beneficial effect of Ti- and Nb-carbonitrides and led to the conclusion that the investigation of the hydrogen interaction with different carbides in a metal matrix is of crucial importance to comprehend the hydrogen related issues. However, as a result of the complex microstructure of the abovementioned commercial steel grades, simplified microstructures are required as they allow a more straightforward interpretation of the hydrogen related phenomena.
Alongside precipitation hardening increasing the strength of the material, precipitates are indeed also considered to be beneficial hydrogen trapping sites. Since they lower the amount of harmful highly diffusible hydrogen, the susceptibility of the material to HE is decreased [11,12]. However, when trapping sites have irreversible hydrogen trapping characteristics, they lose their effectiveness once they are filled [13]. Consequently, deep trapping sites are only beneficial when the hydrogen charging is not continuous but only a one-off event such as in welding, material processing, or electroplating. TiC and NbC precipitates in low alloy steels are examples of particles that act as deep trapping sites capturing hydrogen with a very low release rate. Hence, the time for hydrogen to reach possible cracking initiation places is drastically reduced. The ideal trap site for decreasing the susceptibility to HE has a very large hydrogen desorption activation energy together with a small activation energy for hydrogen to enter the trap site [14].
Hydrogen diffusion through a metal is one of the main factors that determines the HE behavior. Therefore, permeation experiments have been used to study hydrogen diffusion properties and the corresponding HE phenomenon [15,16]. Although electrochemical charging changes the surface conditions of the metallic specimen and the measured hydrogen diffusivity does perhaps not fully reflect the actual diffusion taking place in the substrate, permeation tests can provide valuable information concerning trapping sites, for instance when materials with different microstructural features are compared. It should be noted that a comparative study is only valid when the materials are tested in one set of experimental conditions as the apparent diffusion coefficient (Dapp) may depend on the applied experimental parameters of the permeation test set-up.
Grain boundaries, dislocations, precipitates, and vacancies are among the microstructural features which affect the hydrogen diffusivity. On the basis of their hydrogen desorption activation energy, these traps are commonly classified as reversible or irreversible ones. Carbides like TiC and NbC are examples of potential irreversible traps in contrast with dislocations and grain boundaries, which are considered to be reversible ones [17,18,19]. It is generally known that all of these trapping sites decrease the diffusion of hydrogen, as evaluated by the permeation technique [20,21]. Sakamoto and Hanada [22] observed a decrease of the Dapp by tempering a martensitic stainless steel in the tempering range of 300–550 °C. This decrease was correlated to the precipitation of Cr containing carbides which were coherent with the ferritic matrix. As such, micro strains, i.e., dislocations, were introduced acting predominantly as trapping sites for hydrogen and decreasing the hydrogen diffusivity. When tempering at higher temperatures, coherency was lost and the diffusion rate through the microstructure increased again.
Whether a certain trap is beneficial for the HE susceptibility depends on the trap release rate, residual stresses in the metal matrix, and hydrogen concentration [23]. V4C3 carbides, for example, contain an empty carbon site which may act as a hydrogen trap next to traps at the interface between the matrix and precipitates. However, in the work of Depover et al. [24], their presence increased the HE susceptibility. This observation was attributed to the higher hydrogen concentration, upon saturation level, in the carbide containing material compared to the as-quenched condition where no V-based carbides were present. Nevertheless, Nagao et al. [13] showed that a high density of nanosized (Ti,Mo)C precipitates had the ability to trap hydrogen and as such improved the hydrogen resistance of a high-strength tempered lath martensitic steel. Moreover, Spencer and Duquette [25] stated that Mo2C is a beneficial hydrogen trap with respect to decreasing the HE susceptibility. Their findings were confirmed by Depover and Verbeken [26].
The present work discusses the influence of W2C, Cr23C6, TiC, and V4C3, respectively, together with other potential trapping features in the microstructure, on the permeation transient and hydrogen diffusivity. Therefore, input was beneficially used from earlier extensive work on the trapping ability of the different carbide containing materials via thermal desorption spectroscopy (TDS) and hot extraction results [24,26,27,28,29,30]. The permeation transients were compared with those results to thoroughly evaluate the hydrogen diffusivity in the different materials. It is very relevant to indicate the fact that the alloy processing as well as all experimental analyses were executed in an identical and systematic way to allow a fair comparison of the different materials.
2. Experimental Procedure
2.1. Materials
Four laboratory Fe–C–X alloys with a stoichiometric amount of a ternary alloying element (=X) were cast and processed. The chemical composition is given in Table 1. To avoid nitride formation, Al was added. The different steel grades were produced in a Pfeiffer VSG100 (Pfeiffer, Asslar, Hessen, Germany) vacuum melting and casting unit, operating under an argon gas atmosphere. After hot rolling until 1.5 mm, an appropriate heat treatment was applied to obtain a quenched and tempered (Q&T) microstructure into which carbides were introduced. At first, an austenitizing treatment at 1250 °C for 10 min was performed and was followed by brine water quenching. This procedure was carried out to obtain a complete martensitic structure and to dissolve as much as possible of the existing carbides from the materials processing. The Q&T state of all materials, except for the Cr-alloy, was obtained by a tempering treatment of 1 h at 600 °C, followed by brine quenching. For the Fe–C–Cr alloy, the tempering was carried out at 550 °C. These temperatures were chosen based on the most outspoken secondary hardening effect due to carbide formation. The hardness profiles versus different tempering temperatures illustrating this behavior can be found elsewhere [24,27,28,30]. Transmission electron microscopy (TEM) (JEOL JEM-2200FS, JEOL, Tokyo, Japan) was carried out to characterize the carbides in terms of their size, distribution, and morphology. Diffraction patterns were further taken to identify the tempered induced precipitates, for which we refer to the corresponding works [24,27,28,30]. The carbides were identified as W2C, Cr23C6, TiC, and V4C3, respectively.
2.2. Determination of the Hydrogen Diffusion Coefficient
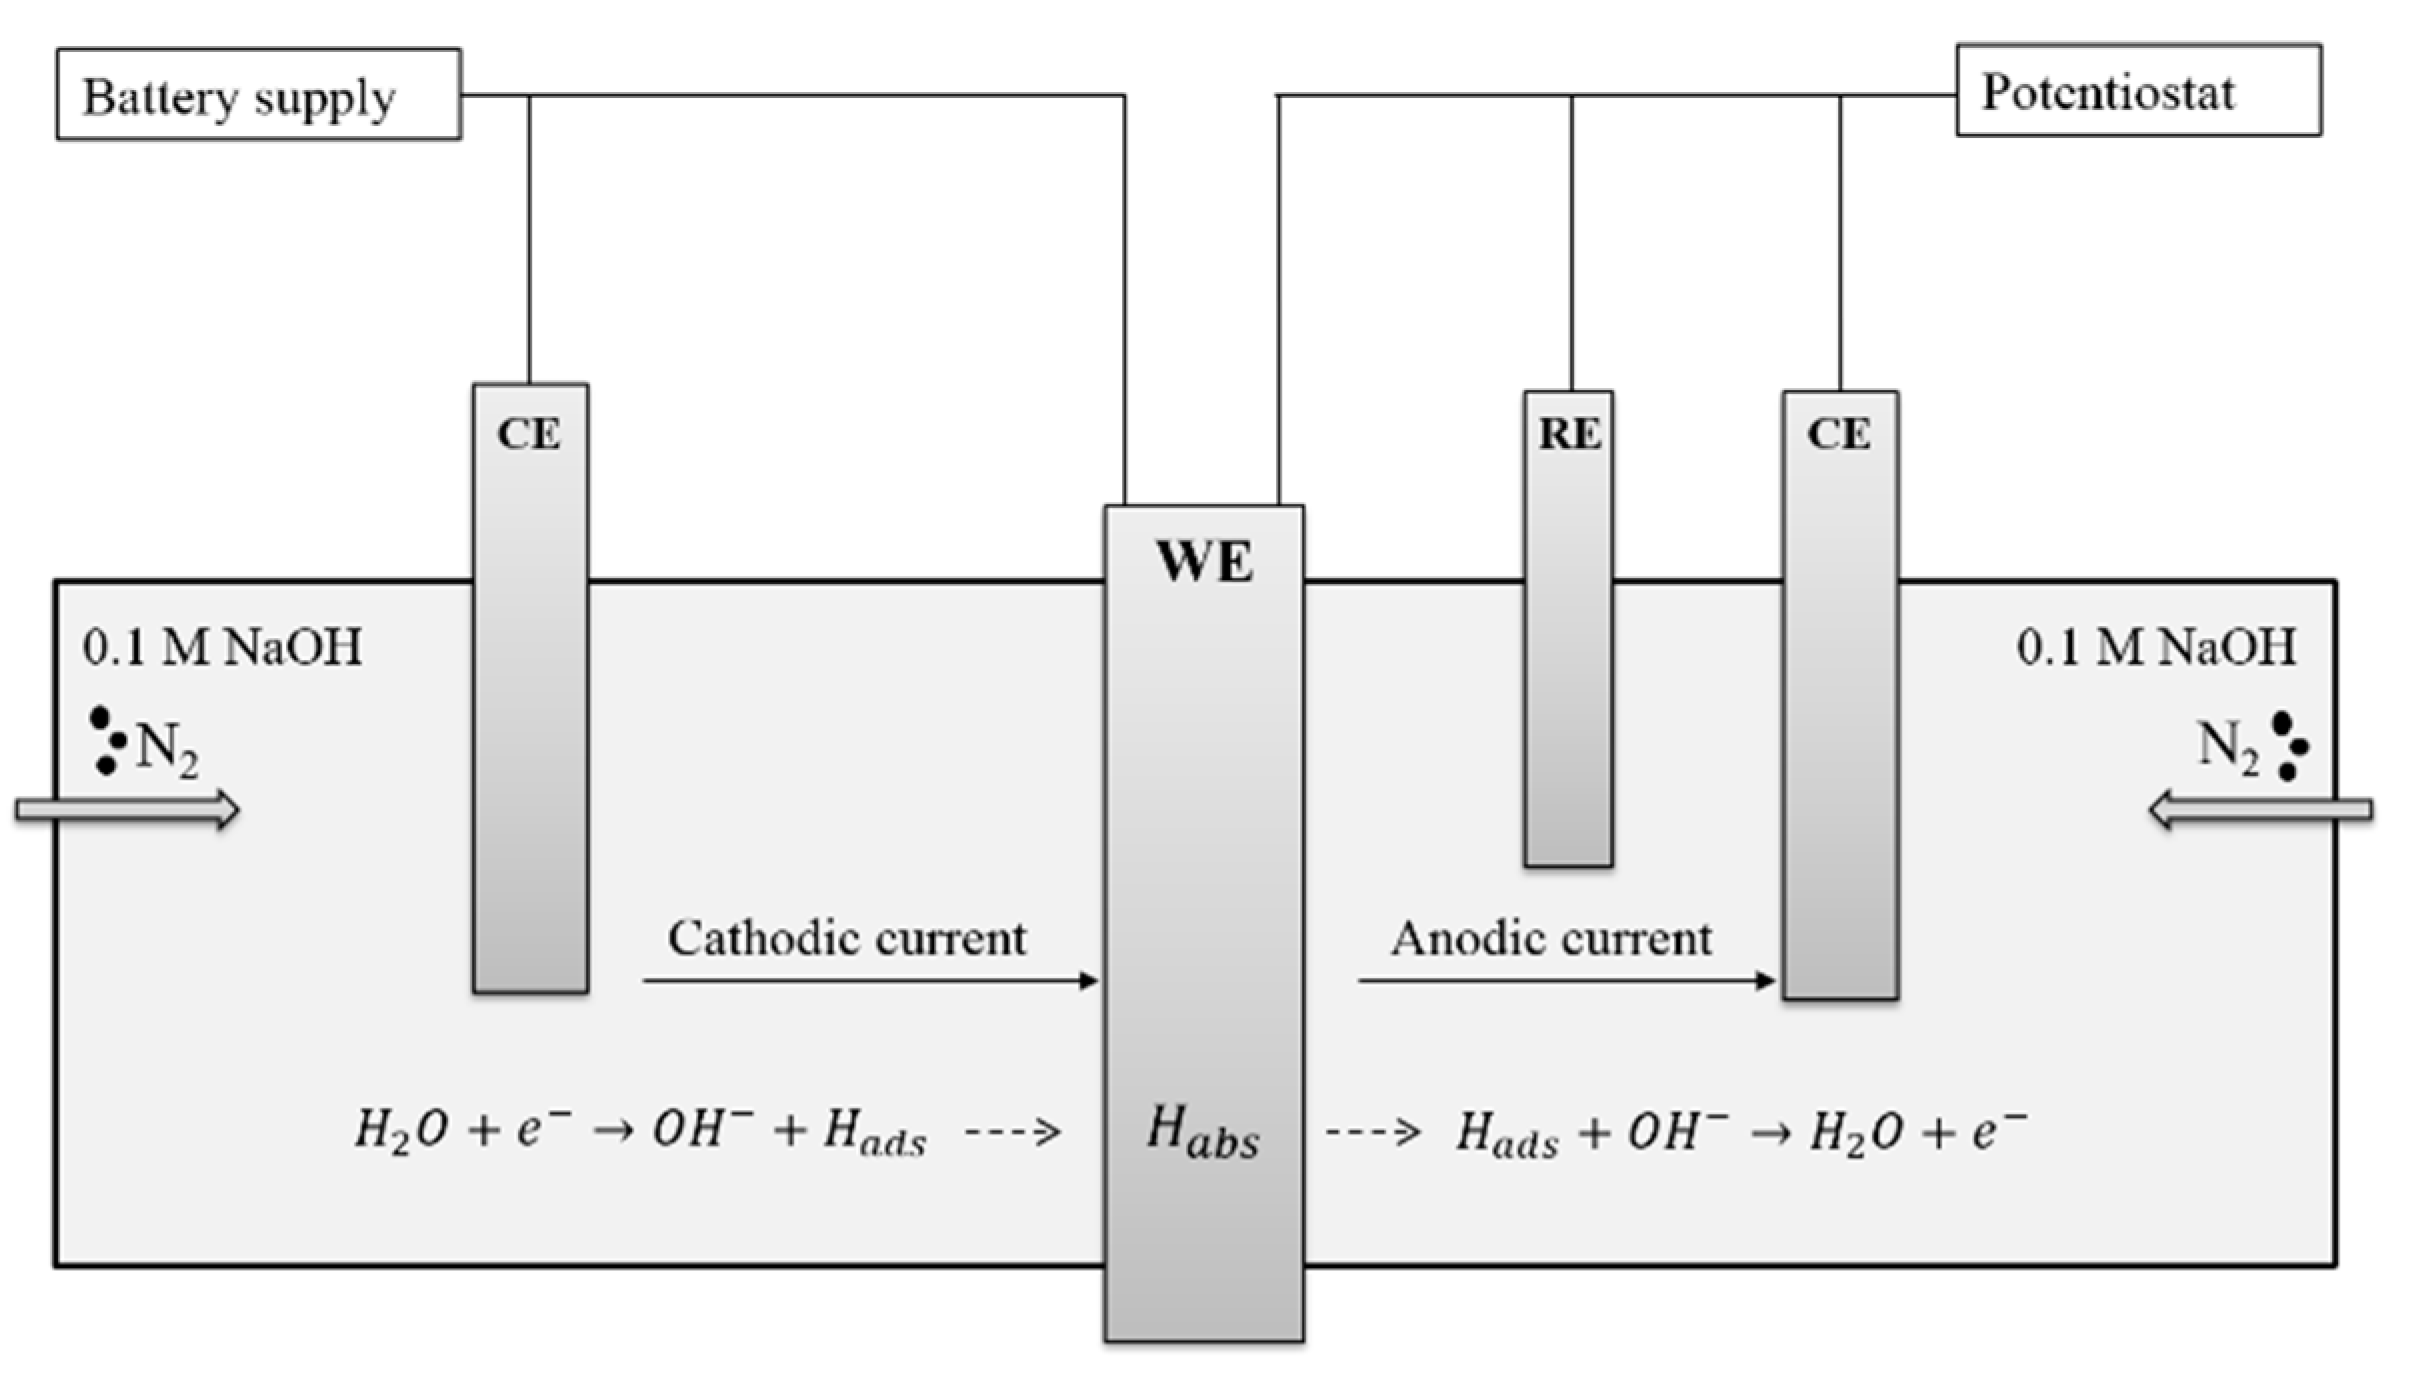
To determine the diffusion coefficient, all alloys were subjected to a permeation test based on the Devanathan and Stachurski technique [31]. A schematic representation of the set-up is given in Figure 1. In both cell compartments, the electrolyte (0.1 M NaOH) was stirred using a nitrogen flow and as such, the amount of dissolved oxygen was minimized. Throughout the experiment, the ambient temperature was kept constant at 25 °C. The polished sample was polarized in a cathodic manner at the left side of the set-up by applying a constant cathodic current density of 3 mA/cm². In this way, a hydrogen flux was produced by following reaction:
The subsequently absorbed hydrogen diffused through the sample to the anodic cell, illustrated on the right hand side of Figure 1. There, the hydrogen was oxidized, producing an external current recorded by a Versastat 3F potentiostat. In order to accomplish this oxidation reaction, i.e., the reversed reaction of Equation (1), the sample was anodically polarized by applying a constant potential of −500 mV with respect to the reference electrode (Hg/Hg2SO4 + 650 mV vs. Standard Hydrogen Electrode). Dapp was calculated using the hydrogen oxidation current in combination with following formula:
where Dapp is the apparent diffusion coefficient (m²/s), t the time (s) when the normalized steady-state value has reached a value of 0.1 and L the specimen thickness (m), which was about 1 mm.
2.3. Hot Extraction
Hot extraction experiments were performed to determine the diffusible hydrogen (Hdiff) content. Hydrogen was introduced in the specimen by electrochemical pre-charging for one hour using a 0.5 M H2SO4 electrolyte containing 1 g/L thiourea at a current density of 0.8 mA/cm². During the charging step, no internal damage was detected and no blisters appeared at the surface [32,33]. Subsequently, the sample was rinsed and dried with water and ethanol, respectively, and was placed in a pre-heated oven at 300 °C for 15 min. As such, the effusing hydrogen was measured by a thermal conductivity detector [30].
2.4. Thermal Desorption Spectroscopy
Thermal desorption spectroscopy analysis was executed on all materials to characterize the hydrogen trapping sites and their corresponding activation energies. Samples were charged with hydrogen by electrochemical pre-charging for one hour using a 1 g/L thiourea in a 0.5 M H2SO4 electrolyte at a current density of 0.8 mA/cm². Three different heating rates (200 °C/h, 600 °C/h, and 1200 °C/h) were used. The desorption activation energy Ea of the hydrogen traps was calculated by Equation (3) which is a simplification of the original Kissinger formula [34]:
where is the heating rate (K/min), Tmax (K) the TDS peak temperature, R (J∙K−1∙mol−1) the universal gas constant, and Ea (J/mol) the detrapping activation energy for the hydrogen trap associated with Tmax. The peak temperatures were determined by deconvolution of the TDS results and ln(/) vs. (1/Tmax) was plotted in order to calculate the corresponding Ea.
Although the hydrogen charging conditions for hot extraction and TDS experiments differ from permeation tests, the resulting trends can be compared as the relative behavior of the different alloys with respect to each other is of main importance. In permeation tests, where long charging times are required, a sulphuric acid based electrolyte is too severe affecting the entrance side of the specimen in a way that can lead to inaccurate measurements. In contrast with the hydrogen charging conditions for hot extraction and TDS experiments, a higher amount of hydrogen could be obtained upon saturation level when using an electrolyte having a higher activity. This higher H concentration allows a straightforward analysis and subsequent evaluation of the available hydrogen trapping sites present in the material.
3. Results and Discussion
Structures, sizes, and size distributions of the carbides present in the different alloys were determined. The hydrogen diffusivity of the different materials was measured by the permeation technique and the permeation transient was analyzed. Hot extraction results were given to evaluate the slope of the permeation curve. TDS spectra are shown, and in order to attain more information concerning the overall trapping ability of the different carbides, permeation and TDS results were compared.
3.1. Material Characterization
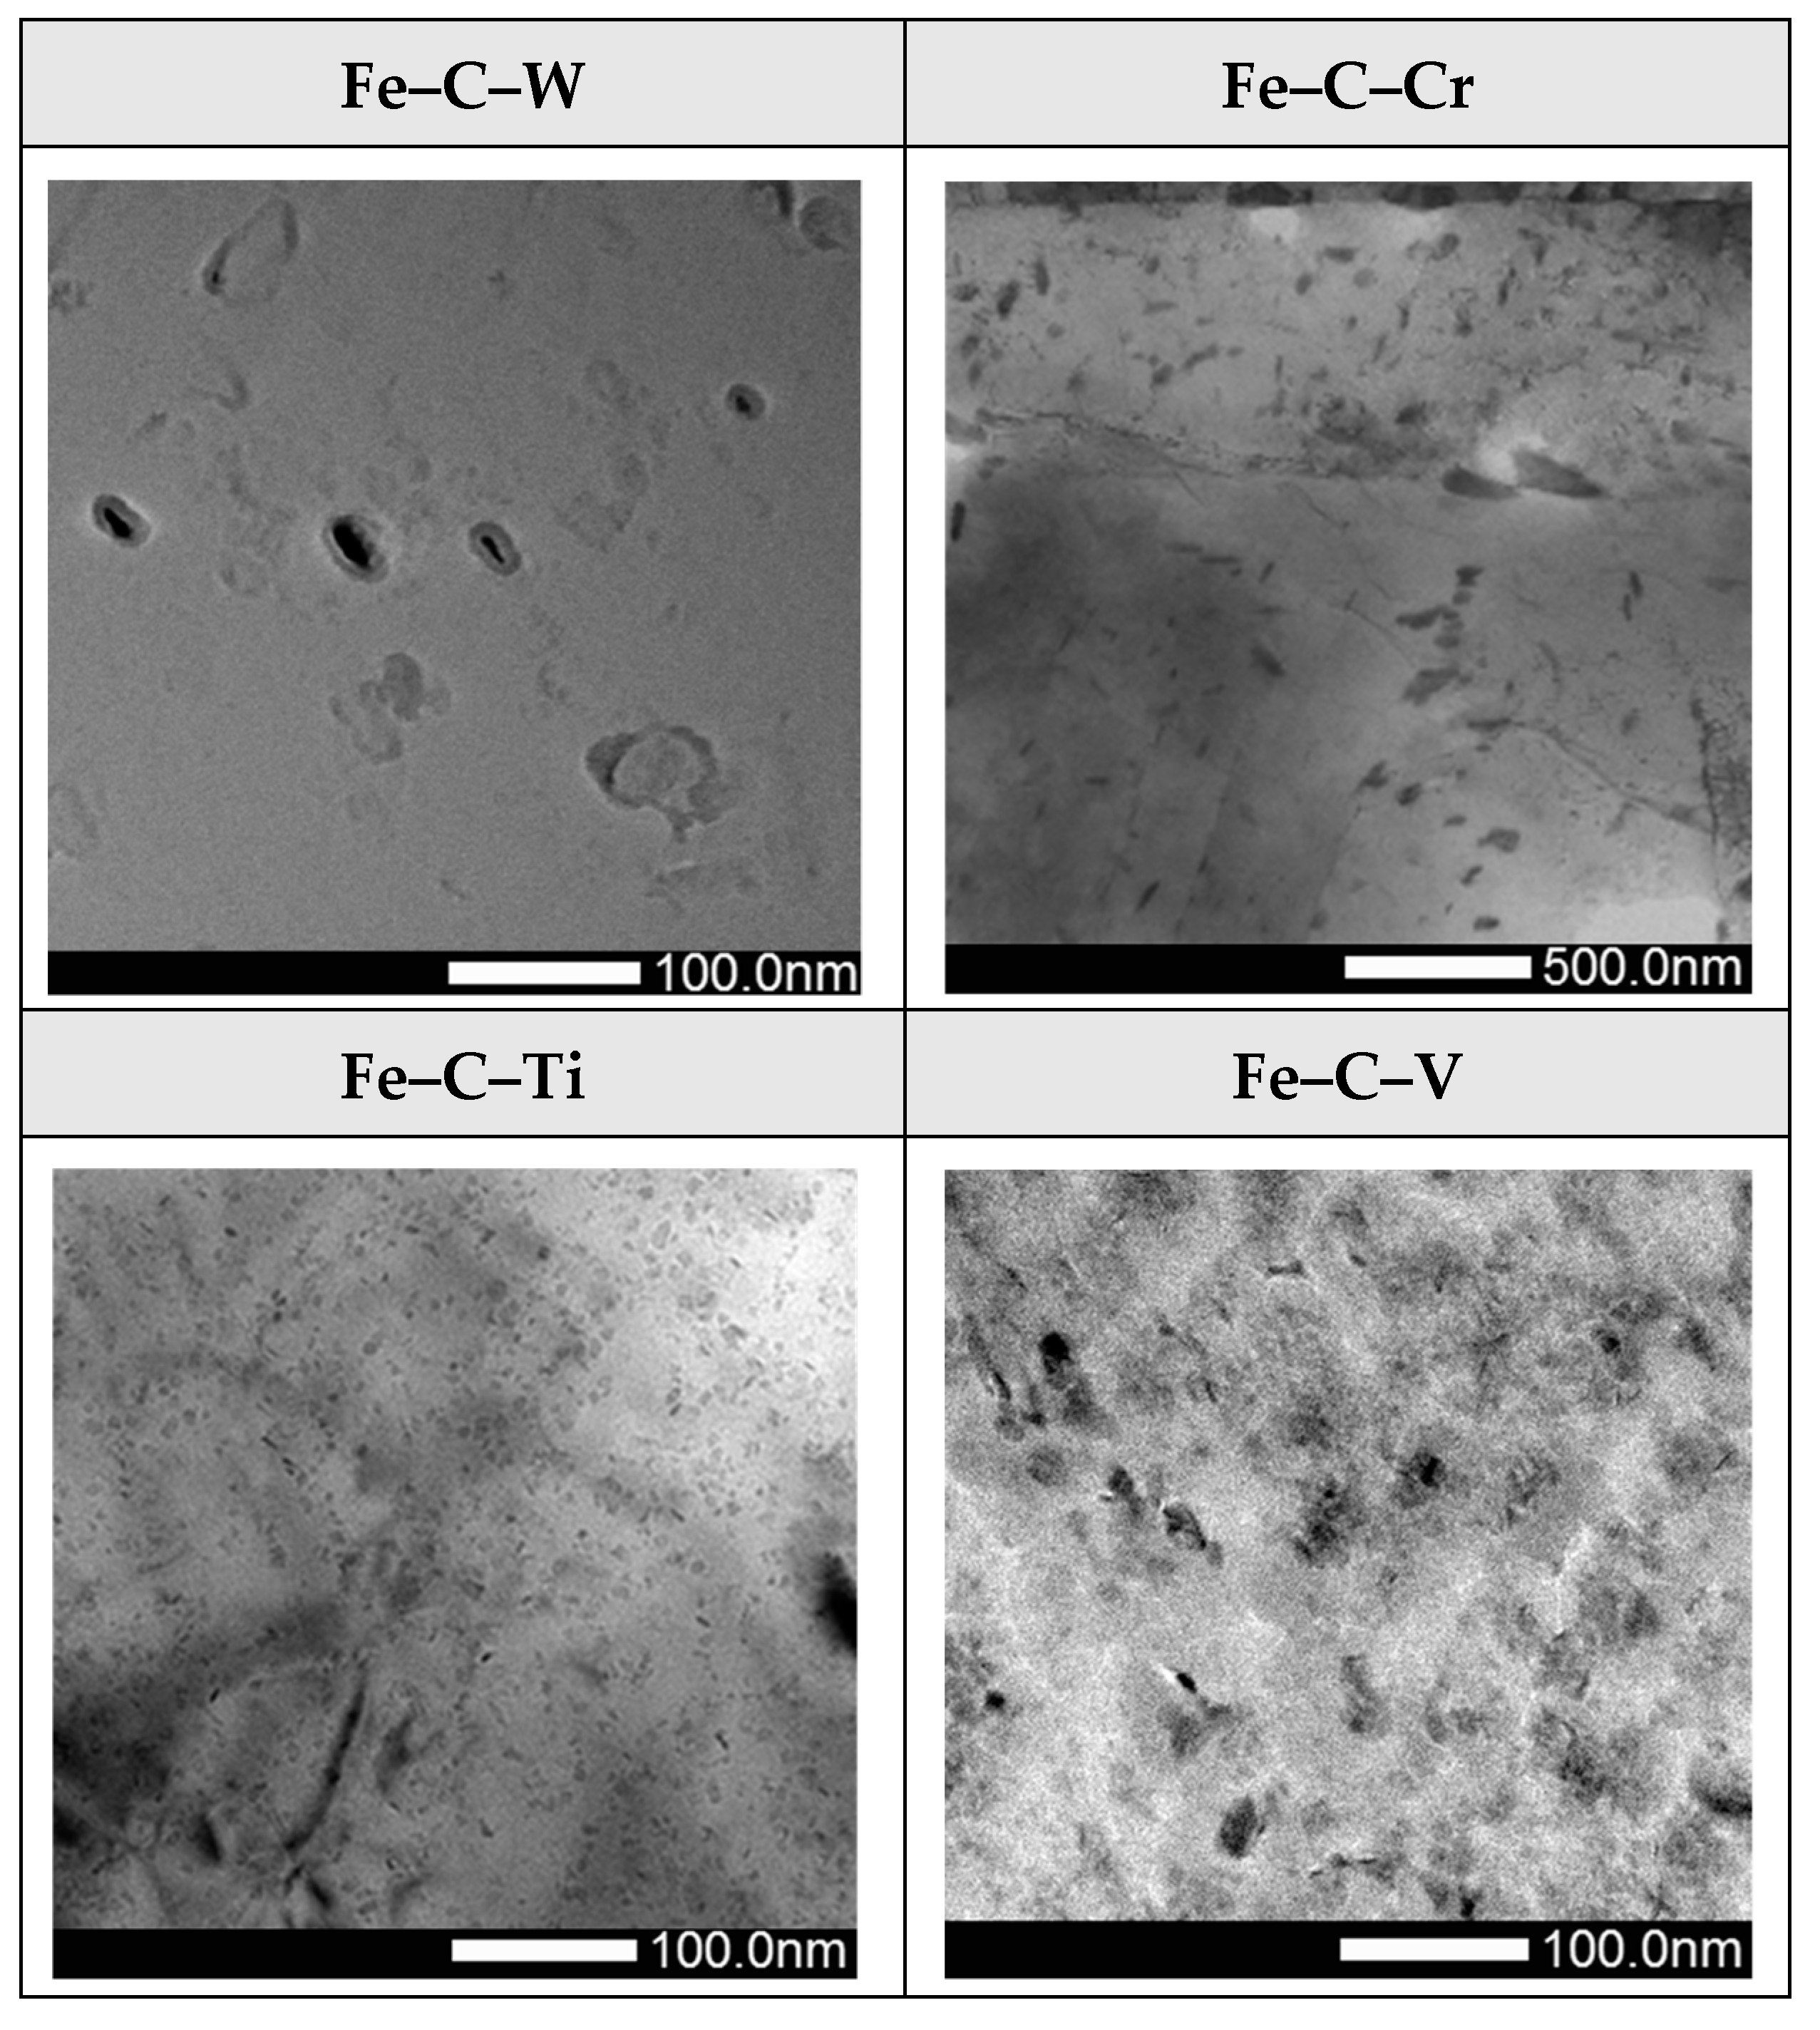
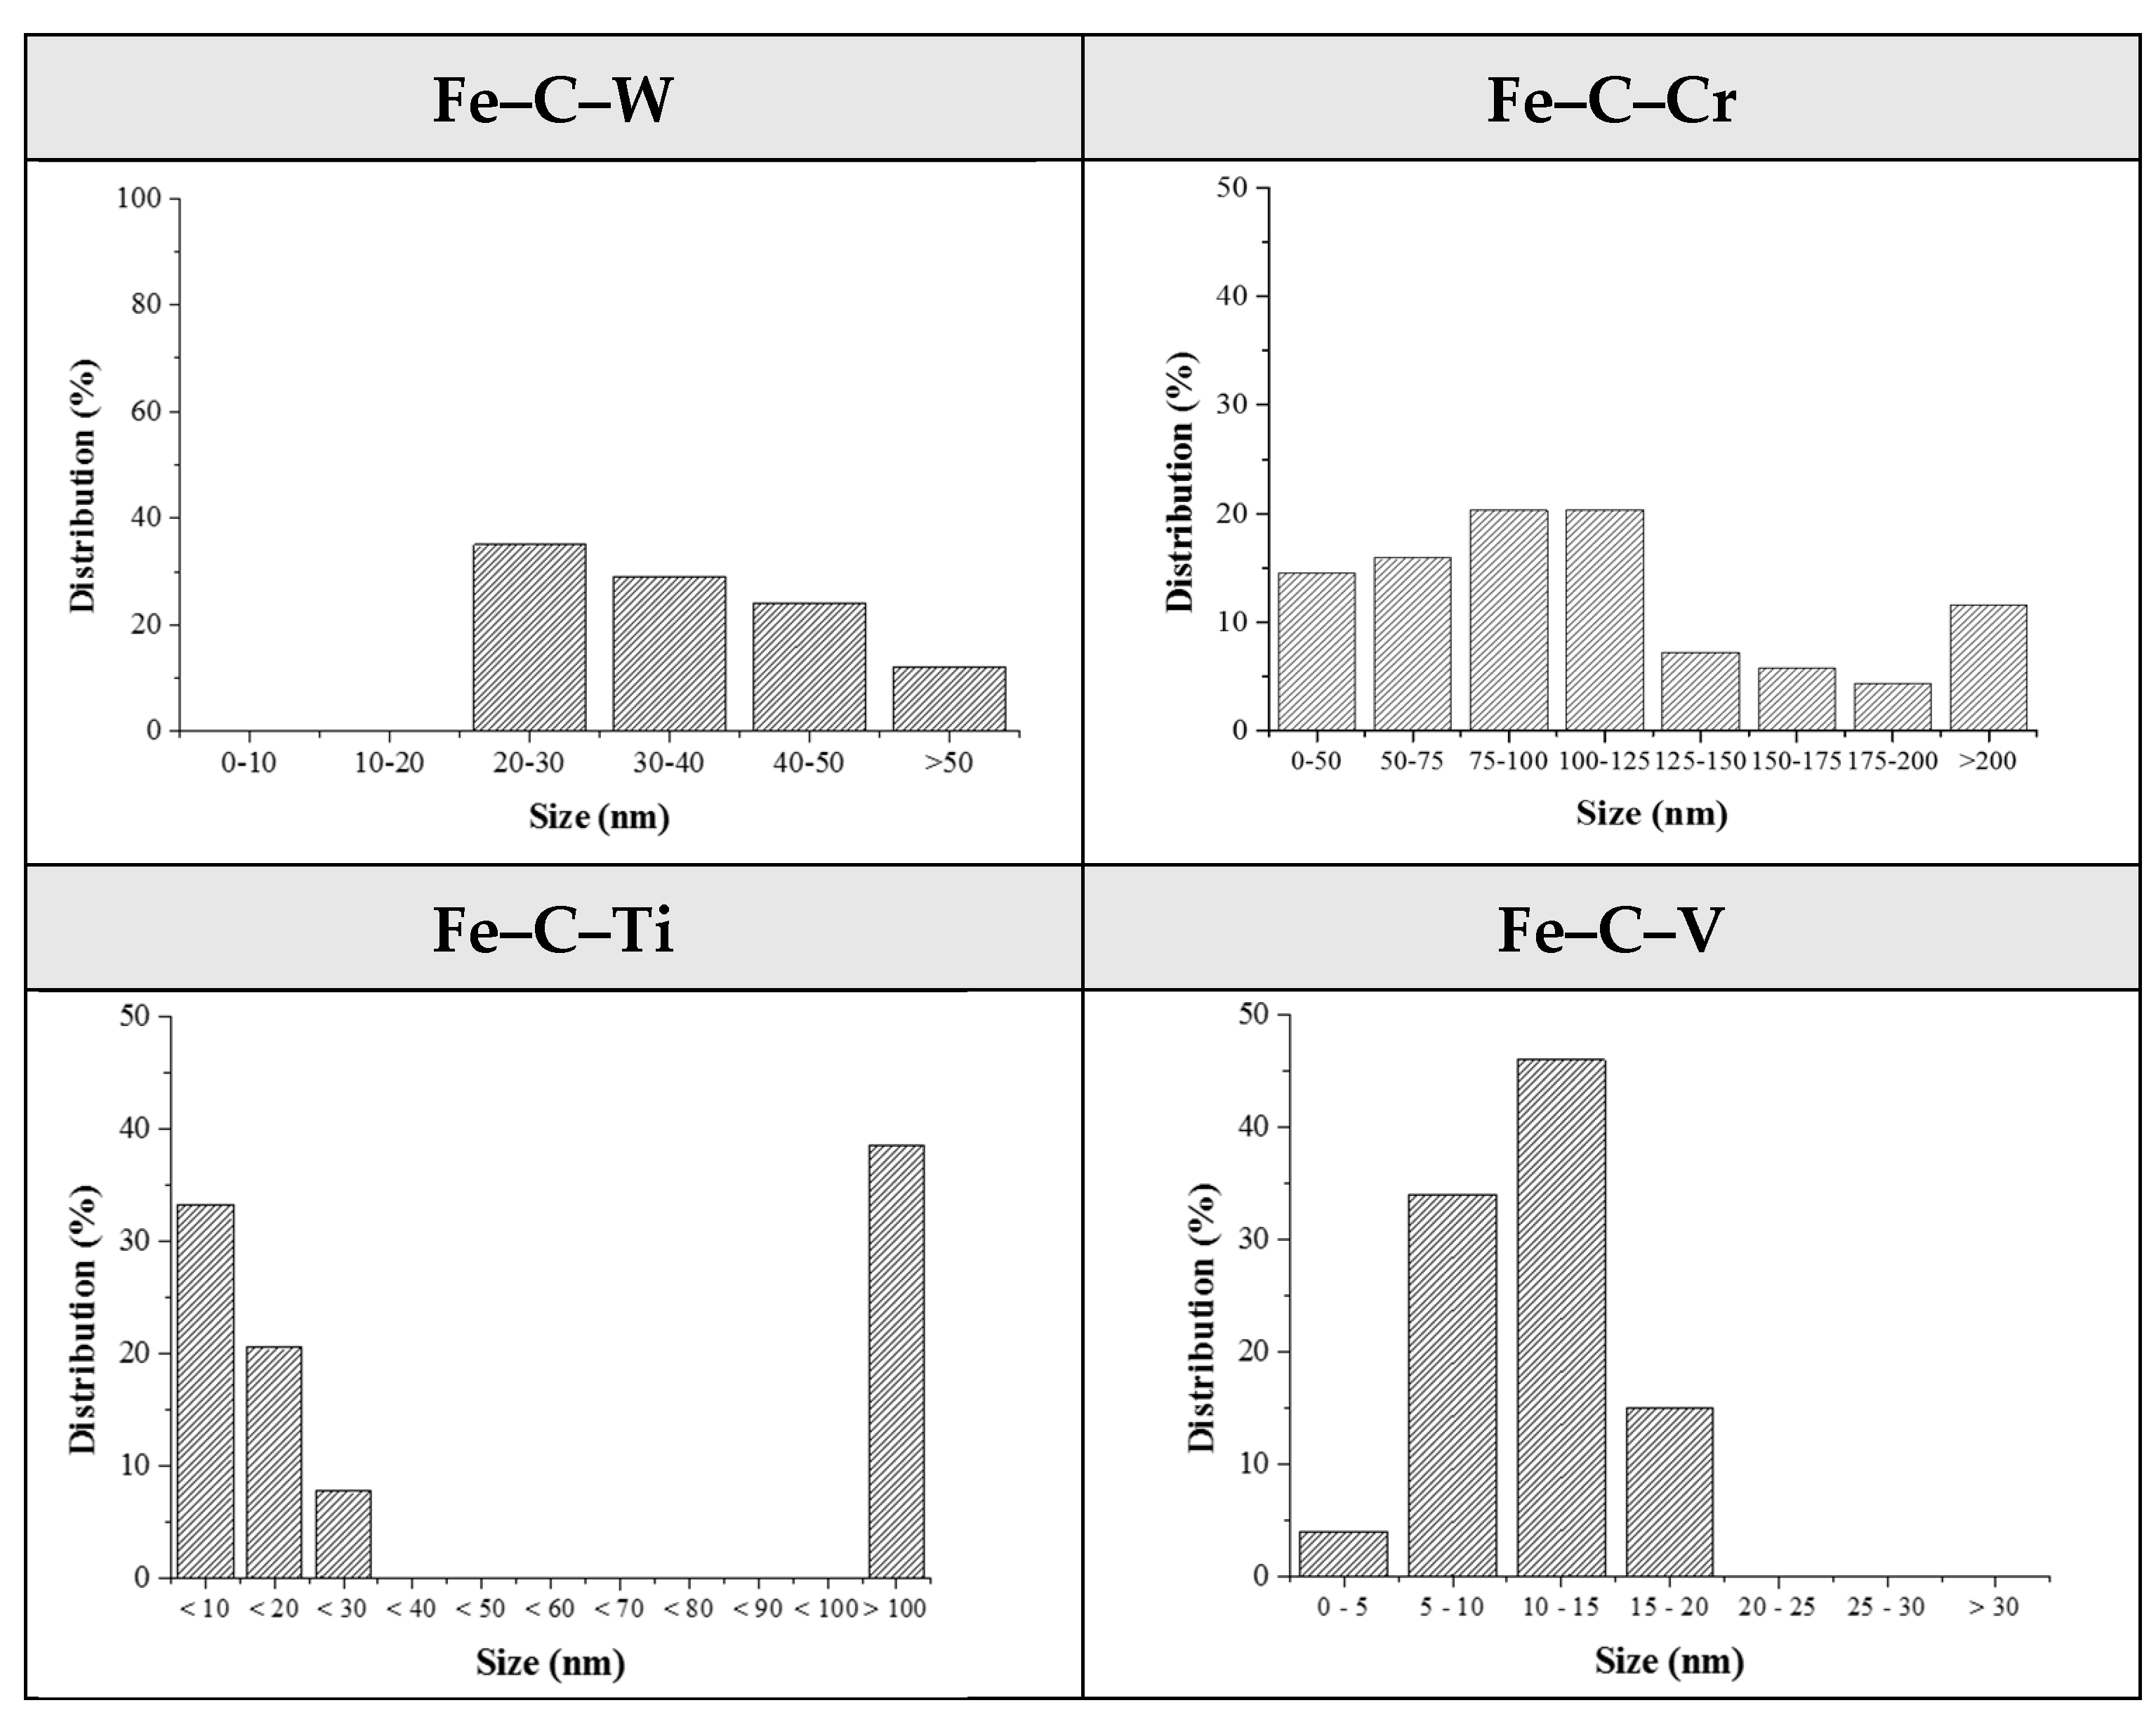
Tempered martensitic materials were studied in which precipitates were induced during tempering. A martensitic matrix was observed for all different alloys. The four types of carbides were W2C, Cr23C6, TiC, and V4C3 which are presented in Figure 2. Their corresponding size distribution maps are shown in Figure 3. Particles with sizes less than 10 nm were observed in all alloys, except for Fe–C–W, where the particles were between 20 and 50 nm. In Fe–C–Cr, a broad variety of carbides with sizes ranging from 0 to 200 nm were identified. Alongside large (>100 nm) incoherent carbides remaining from the material processing and undissolved during austenitizing, Fe–C–Ti also showed tempered induced carbides having a maximum size of 30 nm. Finally, Fe–C–V only contained nanosized carbides smaller than 20 nm.
3.2. Determination of the Hydrogen Diffusion Coefficient
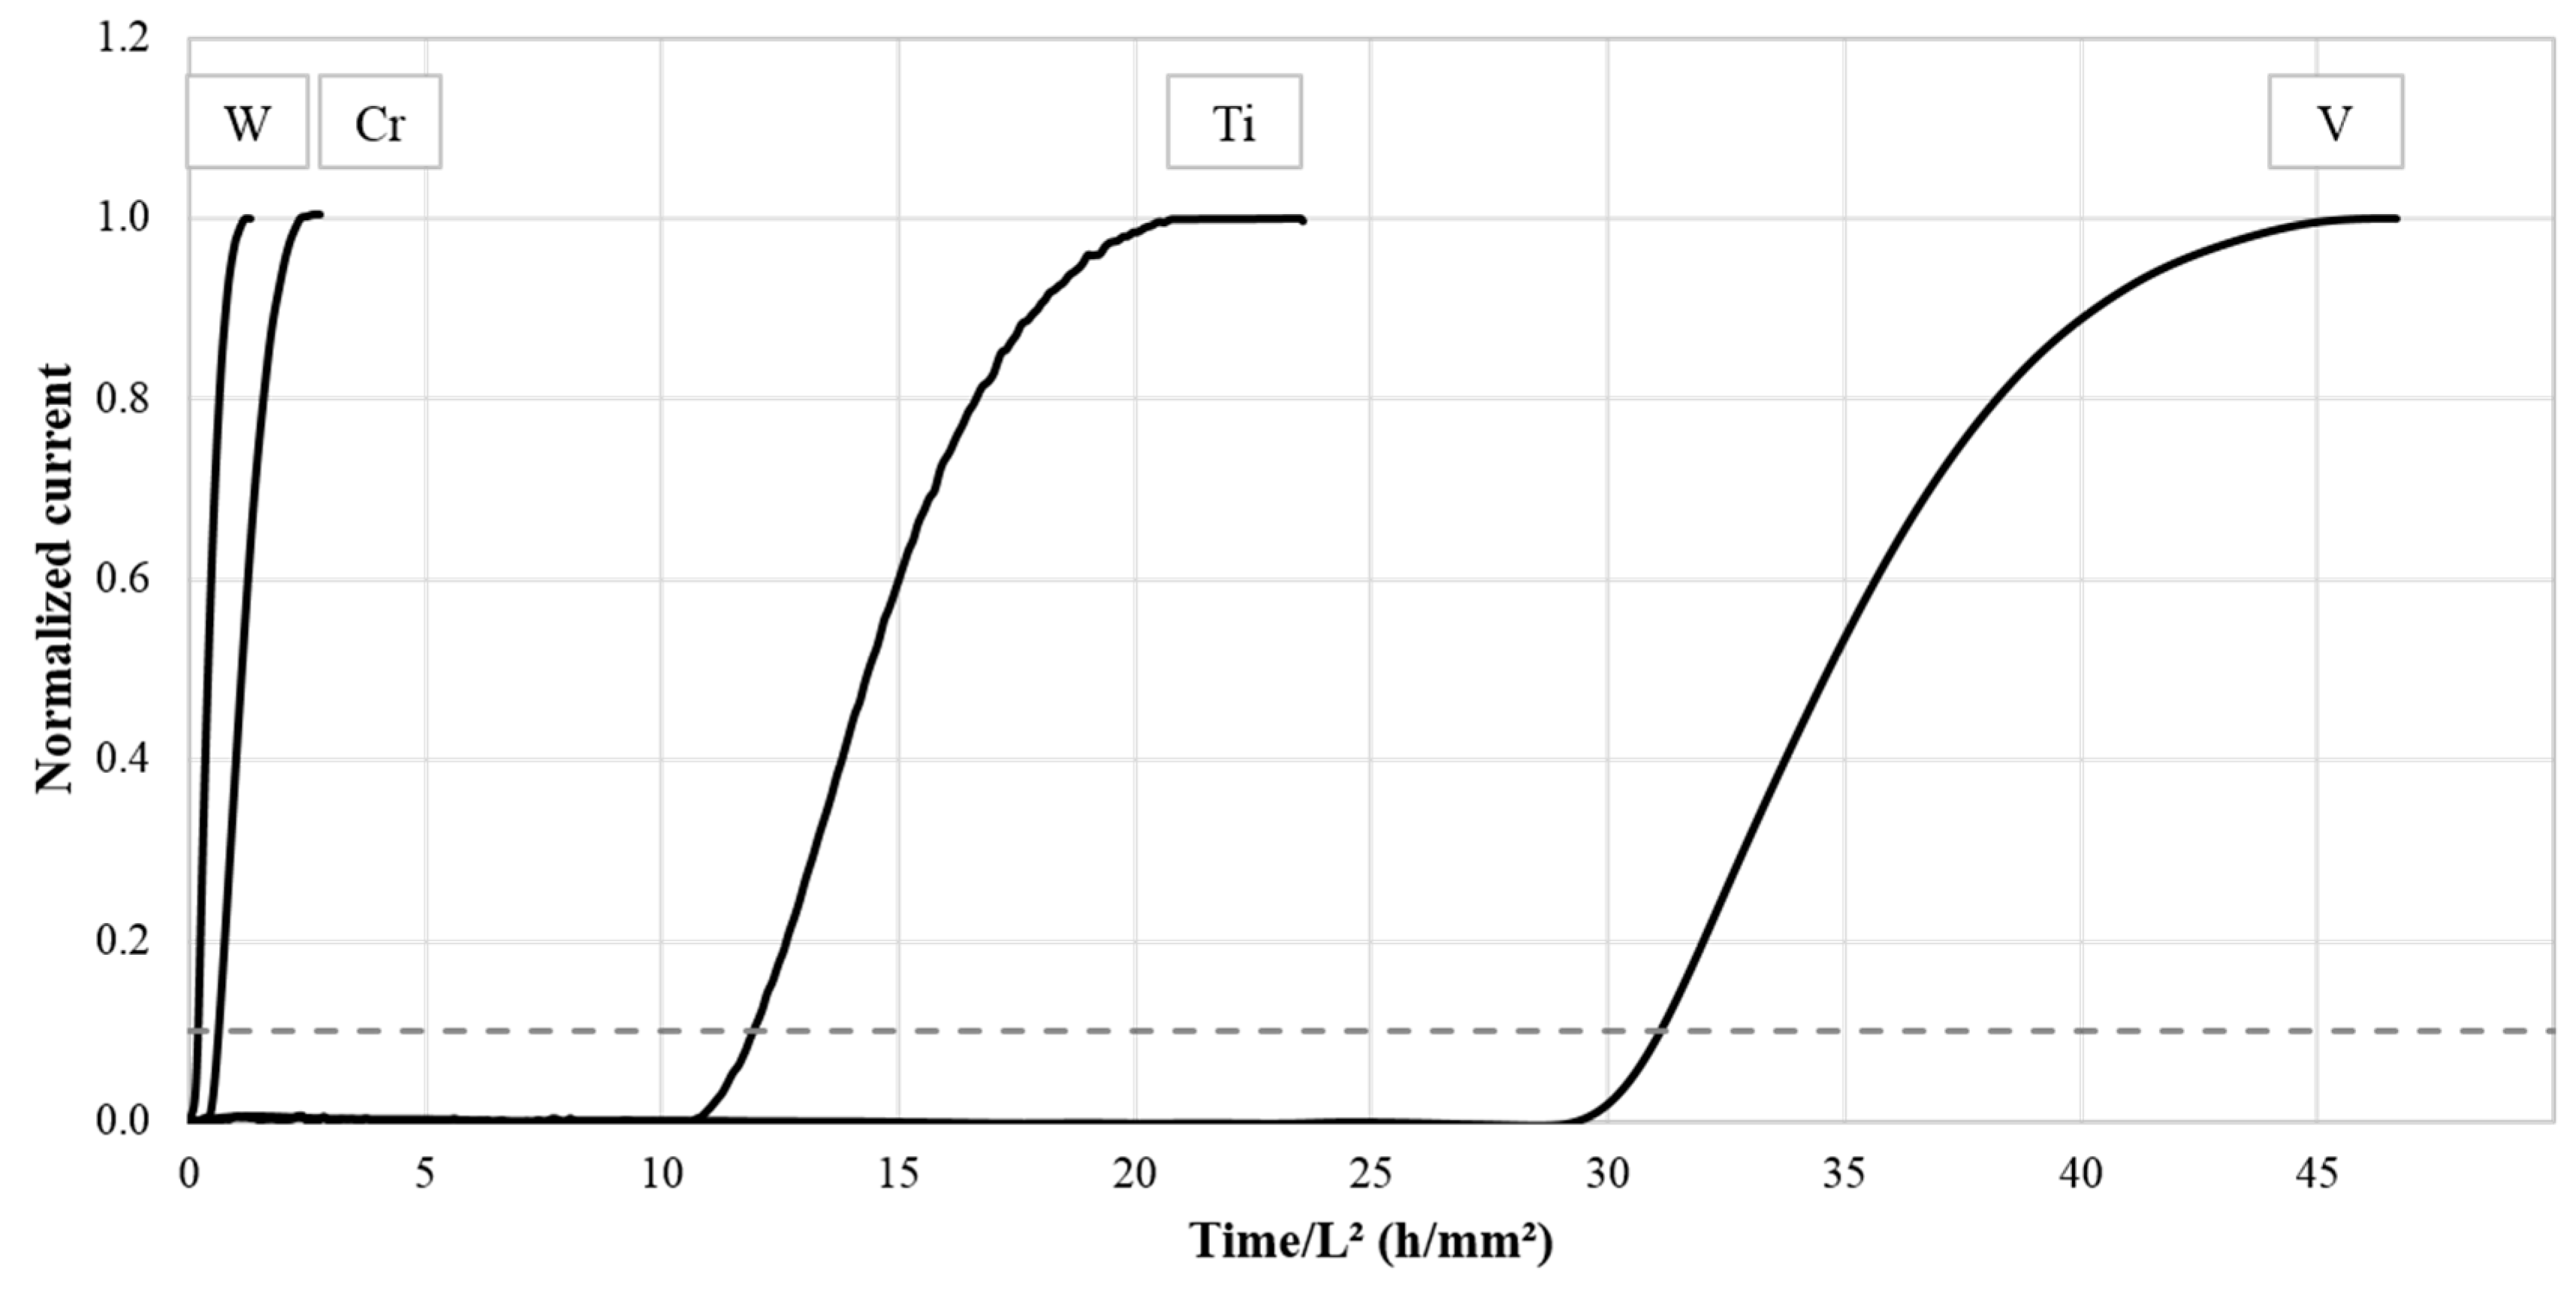
The permeation test results are represented in Figure 4. The normalized current is plotted vs. time/L² in order to eliminate the dependence of experimental data on the maximum current and minor variations in sample thickness. Apparent diffusion coefficients are given in Table 2. The hydrogen diffusion slowed down in following order: Fe–C–W, Fe–C–Cr, Fe–C–Ti, Fe–C–V. A delay in the permeation curve was caused by a higher trap density, which could be associated with a higher hydrogen break through time [35]. As such, Figure 4 indicates that the W containing alloy contained the lowest trap density, whereas the V containing alloy showed the highest. As mentioned in the introduction, two different kinds of trapping sites may be present in the material: reversible and/or irreversible ones. Microstructural defects such as dislocations, grain boundaries, and vacancies in the Fe-matrix are examples of reversible trapping sites. At those sites, the residence time of hydrogen at room temperature is relatively low. Reversible traps, also called weak traps, are characterized by their low activation energies (Ea) with hydrogen. In this research, the Ea boundary between reversible and irreversible sites was selected to be 60 kJ/mol, based on the work of Dadfarnia et al. [36] and Depover and Verbeken [30]. Strong trapping sites, with higher activation desorption energies, are quickly saturated when hydrogen enters the material as hydrogen is attracted to regions having a large chemical potential well. This was confirmed by Dadfarnia et al. [36], who showed that diffusible hydrogen is consumed from the matrix to saturate the strongest traps first before it is available to fill up the weak traps and before it continues to diffuse to other locations. Hence, it is believed that the overall trap density shifts the permeation curve by increasing the delay of the curve, i.e., the hydrogen breakthrough time. In addition, the presence of strong traps will have a higher impact on the decrease in hydrogen diffusivity compared to the reversible ones [37].
Alongside the delay of the permeation curve, the slope is influenced by the material’s trapping sites. It is clear from Figure 4 that the slope of Fe–C–W and Fe–C–Cr is much steeper compared to the other two alloys. In other words, from hydrogen breakthrough, it takes less time to reach the steady state value. Several authors claim this is due to a lower hydrogen trap density [35,36,38,39,40,41]. As mentioned in the previous paragraph, strong traps will be saturated quickly once hydrogen enters the material and in combination with a very low hydrogen release rate at room temperature, they will not necessarily affect the shape of the permeation transient [42]. Reversible trapping sites are thus considered to be the main features affecting the slope of the curve. The time, from hydrogen break through, needed to reach the normalized or experimental steady state value increases in the following order: Fe–C–W, Fe–C–Cr, Fe–C–Ti, Fe–C–V. Therefore, the Fe–C–V alloy is assumed to contain the highest reversible trap density. This statement will be evaluated in the next section on the interaction between hydrogen and the materials, as evaluated by hot extraction and TDS, to assess the influence of the tempered induced carbides on the obtained Dapp.
3.3. Evaluation of the Hydrogen Trapping Ability
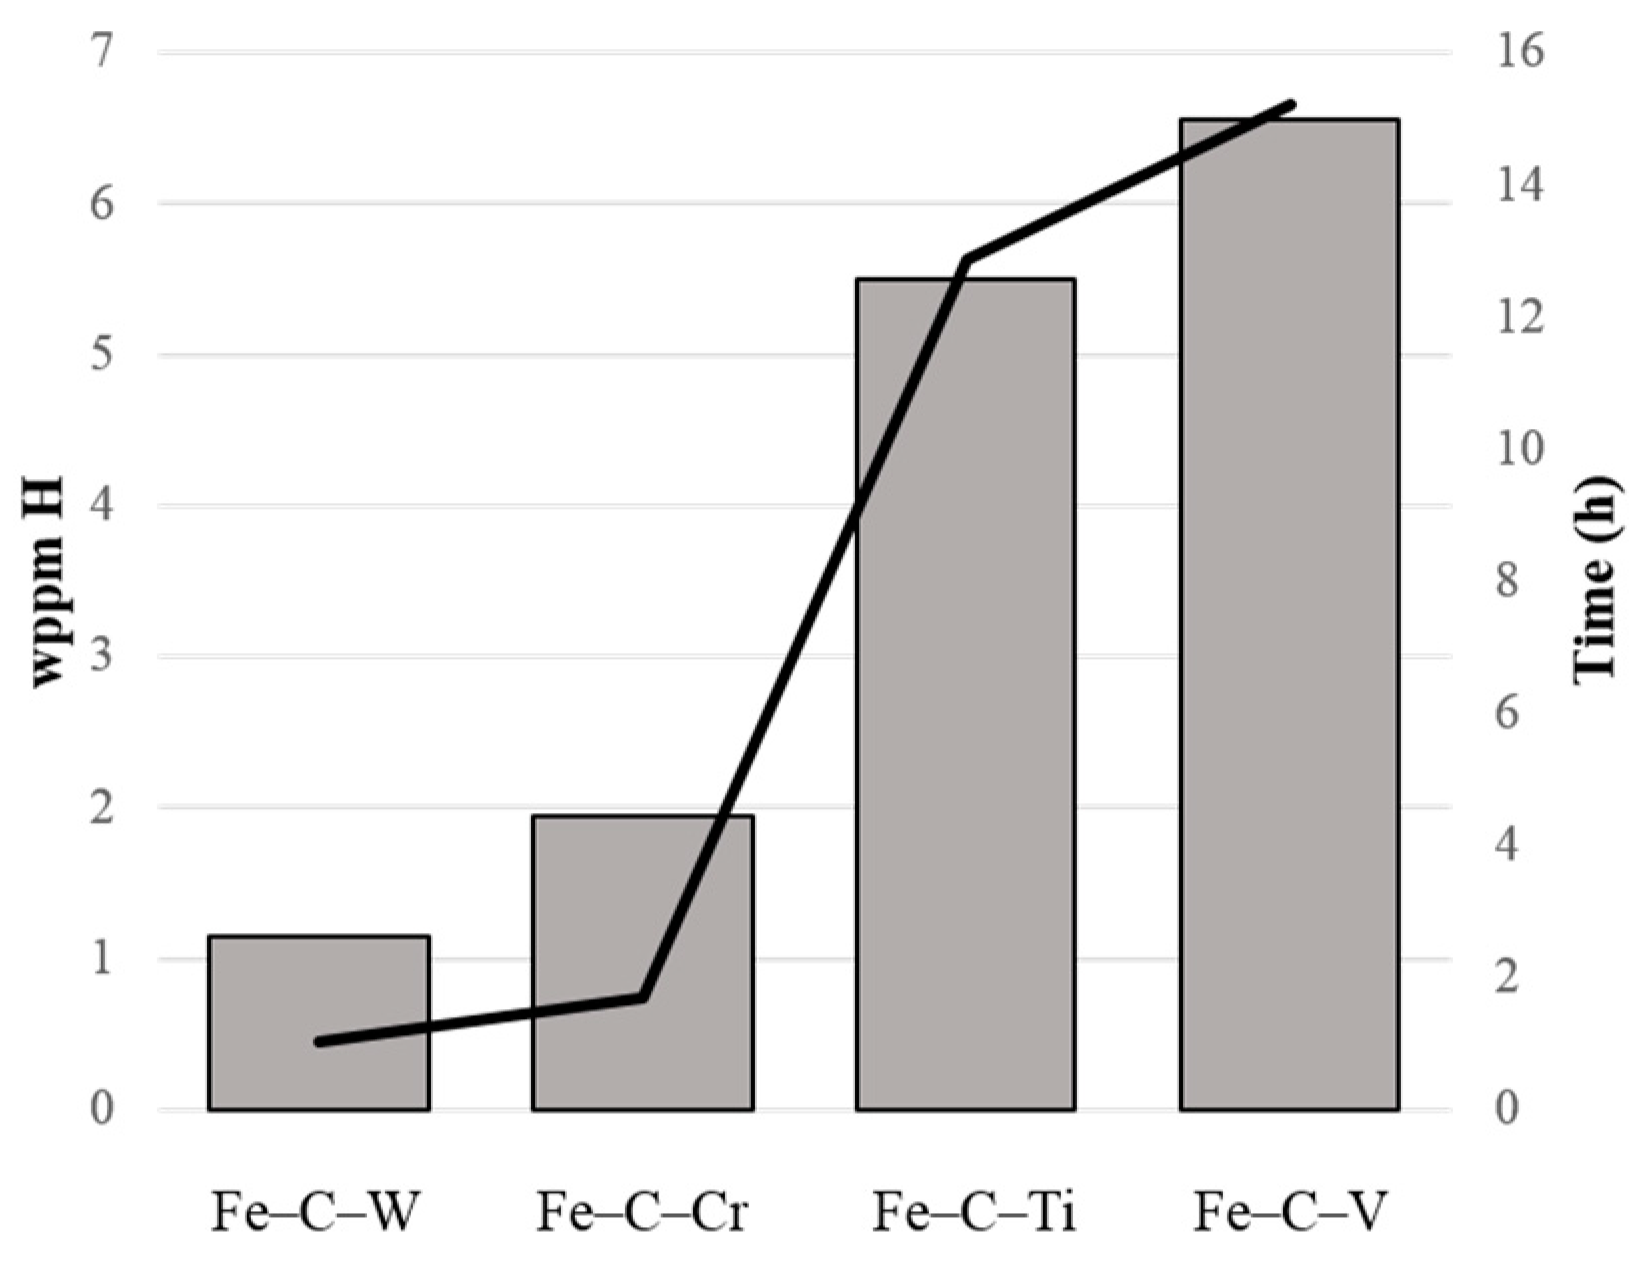
The diffusible hydrogen (Hdiff) amount measured by the hot extraction technique represents mainly reversibly trapped hydrogen. Figure 5 presents this amount of diffusible hydrogen plotted together with the time between the breakthrough time and the moment the steady state condition is reached. This time makes it possible to evaluate the slope of the permeation transient. The Hdiff amount increases in the alloys as follows: Fe–C–W, Fe–C–Cr, Fe–C–Ti, Fe–C–V and a good correlation was observed with the transient slope. This confirms the high influence of weak traps on the slope of the permeation transient.
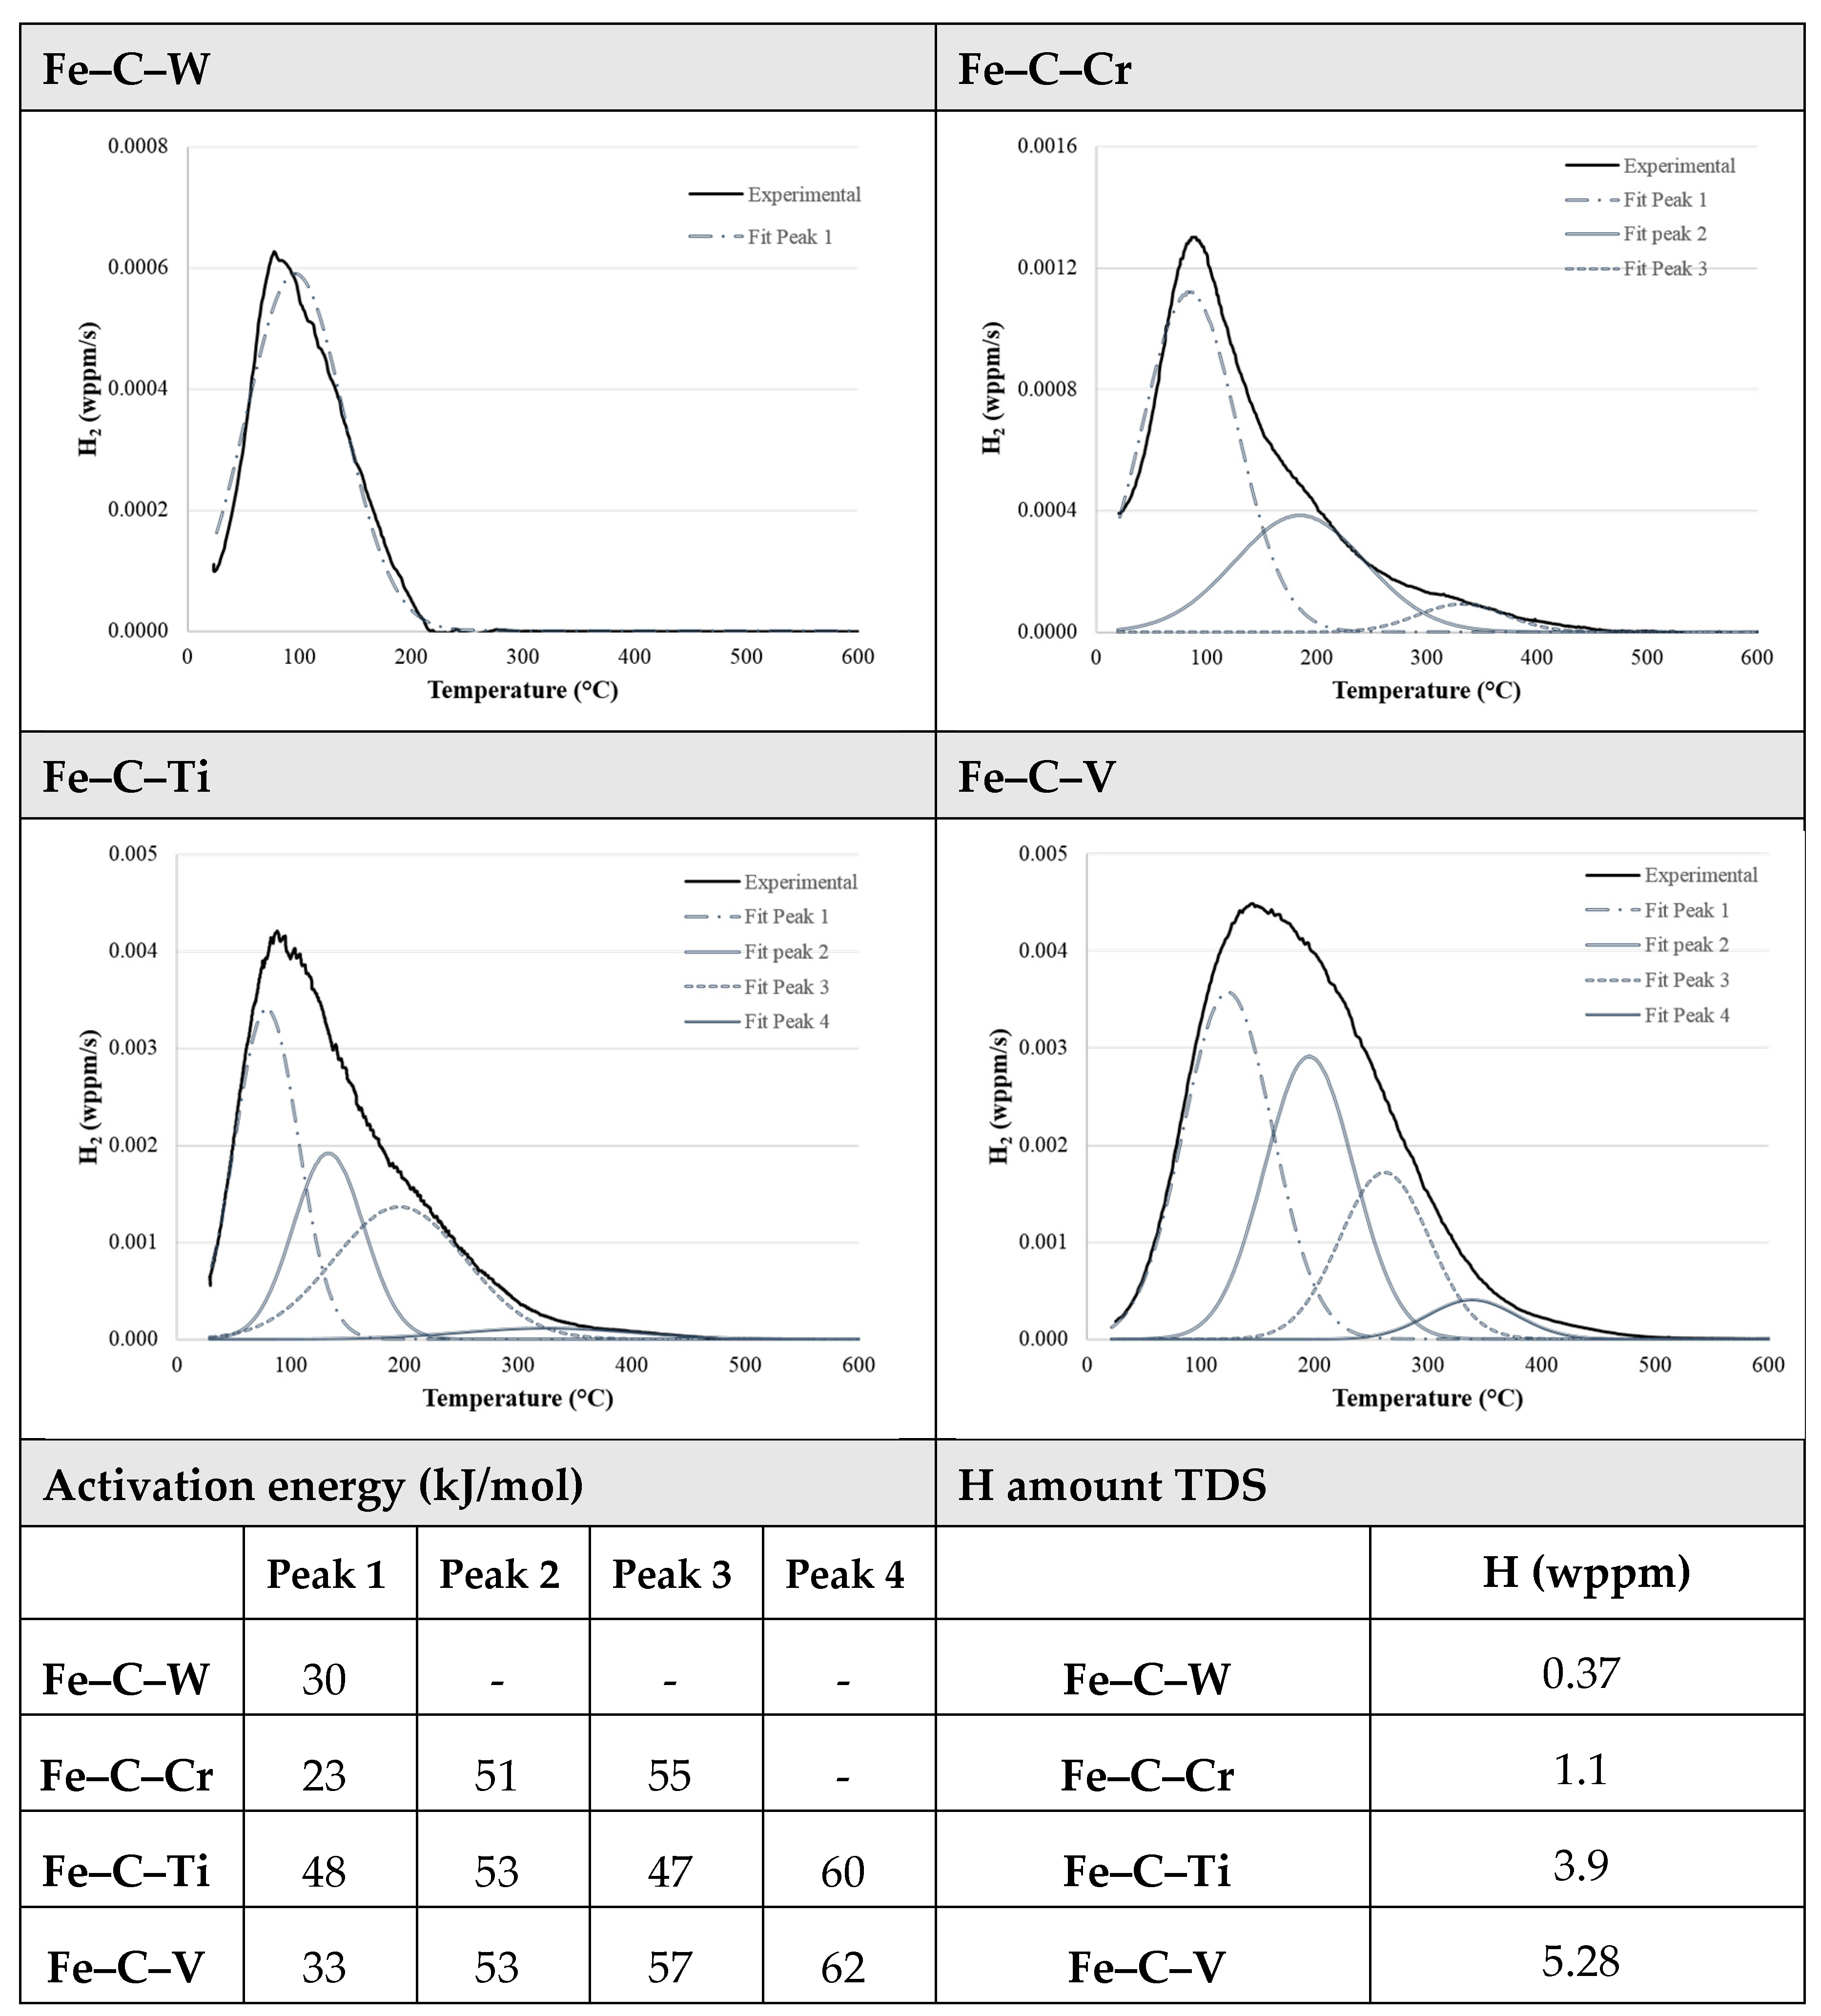
To determine the trapping characteristics of the tempered induced carbides, TDS analysis was performed for the different alloys. The TDS spectra together with their deconvoluted peaks are shown in Figure 6. Every peak corresponds with a specific activation energy and can be attributed to different trapping sites in the material matrix. These energies are also incorporated in Figure 6. The first peak of all spectra can be correlated to dislocations or martensitic lath boundaries, as both show similar value of Ea. Nevertheless, based on the work of Pérez Escobar et al. [43], the first peak may be attributed to hydrogen trapped solely at the martensitic lath boundaries. The author demonstrated that hydrogen trapped by dislocations in pure iron was released from the sample during the 1 h needed to obtain the required vacuum before the start of the TDS measurement. However, the diffusion of hydrogen in pure iron is much faster compared to the quenched and tempered structure investigated in this work. It may thus be possible that there is still some hydrogen remaining at the dislocation trapping sites. Therefore, Depover and Verbeken [44] further evaluated this hypothesis by increasing the dislocation density in alloys having a martensitic structure. The higher dislocation density could not be detected by the TDS equipment which needed 1 h to attain the required vacuum, while an increase of hydrogen was observed by hot/melt extraction, which was carried out only one minute after charging. Hence, the first peak of the TDS spectra was attributed to the martensitic lath boundaries, whereas the hydrogen trapped at dislocations was already released before the start of the TDS measurement.
The Fe–C–W alloy only showed one peak, attributed to the martensitic lath boundaries, as described in previous paragraph. The W2C precipitates, formed during the tempering process, were not able to trap hydrogen and permeation test results confirm the relatively higher diffusivity of this alloy compared to the other alloys. In addition to the first peak, two extra peaks were observed in the deconvoluted TDS spectrum of Fe–C–Cr. Both peaks were due to the present Cr-carbides [28]. The second peak of about 50 kJ/mol was attributed to hydrogen trapped at precipitates having a size between 50 and 100 nm, which were also present before the temper treatment. The third peak was attributed to the tempered induced particles smaller than 50 nm. This was confirmed by modifying the carbide size distribution by extra tempering treatments and evaluation of the corresponding TDS spectra [28]. All trapping sites related to the Cr-carbides were assumed to be reversible as the desorption activation energy was lower than 60 kJ/mol. Particles larger than 100 nm were no longer able to trap hydrogen and were therefore believed not to influence the hydrogen permeation results significantly. Compared to the Fe–C–W alloy, the tempered induced Cr23C6 particles were able to trap hydrogen, but only causing a small decrease in diffusivity (Figure 4). In addition, the hydrogen amount released during the TDS measurement is calculated from the experimental TDS curve and is given in Figure 6. This, together with hot extraction results (Figure 5), showed clearly that the Fe–C–Cr alloy had a higher trapping ability, but only hindering the hydrogen diffusion through the material to a minimal degree when compared with Fe–C–W.
Besides the effect of hydrogen trapping by the carbides, the matrix in which they were embedded may also affect hydrogen diffusion. As such, the rather small difference in diffusivity between the two alloys may be ascribed to differences related to the martensitic matrix. When comparing both alloys, the Cr-based one has a lower carbon and Cr content (Table 1) leading to a less distorted martensitic matrix. In addition, since Cr carbides dissolve fast, they could not pin the grain boundaries during austenitization [44]. Therefore, a larger prior austenite grain size and thus increased block and packet size in the martensitic matrix was obtained for Fe–C–Cr compared to Fe–C–W. This implied a lower density of high angle grain boundaries in Fe–C–Cr [45,46] which compensated for the retarding effect of the Cr carbides on the hydrogen diffusivity. As such, quite similar permeation transients for these two alloys were observed. Permeation experiments were also performed on both alloys in their as-quenched state [27,28]. The corresponding diffusion coefficients of 5.11 × 10⁻¹¹ m²/s and 1.71 × 10⁻¹⁰ m²/s for Fe–C–W and Fe–C–Cr, respectively, demonstrated a lower diffusion for Fe–C–W as a result of its more distorted martensitic structure. In conclusion, the different characteristics of the martensitic structure accounts for the small observed difference in diffusivity when comparing both materials in their Q&T state.
Alongside the small carbides, precipitates larger than 100 nm were also observed in the Fe–C–Cr alloy. However, these were demonstrated not to be able to trap hydrogen [28]. Nevertheless, they can be seen as diffusion obstacles surrounded by a very high potential barrier. When these obstacles would occupy a volume inaccessible to hydrogen, they are able to lower the hydrogen solubility and diffusivity of the material. Leblond and Dubois [47] proposed an equation where the lowering of diffusion due to the presence of obstacles is incorporated. They stated that the influence of these obstacles should be negligible, except in some special cases where there is a localized high obstacle concentration. However, in the present material, the concentration of these large particles is rather limited. Hence, it is believed that the low amount of large Cr-carbides will not affect the diffusion significantly.
The TDS spectrum of the Fe–C–Ti alloy showed three additional peaks next to the one attributed to the martensitic lath boundaries. As a result of the tempering treatment, a high amount of carbides with a maximum size of 30 nm was introduced, which was assumed to be responsible for those three additional peaks [30]. The second and third peak of the TDS spectrum represent reversible trapping sites having an Ea of about 45–55 kJ/mol. On the basis of the work of Depover and Verbeken [30], these trapping sites were related with hydrogen trapped at the interface between a coherent TiC and the matrix. This was also demonstrated earlier by Wei et al. [48].
The fourth peak with a corresponding Ea of 60 kJ/mol was first associated with semi-coherent carbides [48,49,50]. The irreversible nature of this trapping site was considered in the already published work of Depover and Verbeken [30]. A sample charged with hydrogen was put in vacuum for 72 h. In this time period, reversibly trapped hydrogen had the ability to effuse out of the sample before TDS measurements were performed. The obtained spectra designated that the first three peaks attributed to reversible trapping sites disappeared, while the fourth peak was still present, yet a small decrease was observed. This indicated that the trapping sites, corresponding to an Ea of 60 kJ/mol, were indeed more irreversible in nature compared to the trapping sites with lower energies. Recently, Drexler et al. [51] accomplished a model-based interpretation of the very same Fe–C–Ti TDS spectrum using finite element modeling. In their study, the fourth peak could be attributed to the carbon vacancies in the TiC precipitates. In addition, the authors confirmed the aforementioned conclusions: i.e., the first peak was associated to the martensitic lath boundaries, while the second and third peak were attributed to the matrix/carbide interface.
Compared to the Fe–C–Cr alloy, an important decrease in diffusivity was observed for the Fe–C–Ti alloy. This lower diffusivity is notable in Figure 4 by the pronounced delay in the permeation transient of the Ti containing alloy. On the one hand, the increased delay could be related to a higher amount of hydrogen traps. More small carbides were observed in the Fe–C–Ti alloy leading to an increased surface to volume ratio. This resulted in a higher amount of available traps for hydrogen at the matrix/carbide interface which is also reflected in a larger peak area for peak 2 and 3 in the Fe–C–Ti TDS spectrum as compared to the Fe–C–Cr spectrum (Figure 6). On the other hand, in the Fe–C–Ti alloy, traps with higher desorption activation energies were detected (Figure 6). As already stated, traps with higher activation energies have a larger impact on the decrease in hydrogen diffusivity compared to those with lower energies [37].
The TiC carbides larger than 100 nm, also present in the microstructure, were unable to trap hydrogen. These were not fully dissolved during the austenitizing treatment due to the slow dissolution process of Ti-based carbides. Hence, a large volume of carbides, which were not able to trap hydrogen, were present in the Fe–C–Ti alloy. As mentioned previously, when obstacles occupy a volume inaccessible to hydrogen, they will lower the hydrogen diffusivity of the material [47]. Whether, in the Fe–C–Ti alloy, these large carbides significantly affect the diffusion cannot be established conclusively. Their amount is larger than for the Fe–C–Cr case but not necessarily sufficient to hinder diffusion.
Additionally, the Fe–C–V alloy showed three extra peaks, which could be attributed to the tempered induced carbides. The small V4C3 particles were able to trap a significant amount of hydrogen. Both the matrix/carbide interface and vacancies available in the V4C3 could act as trapping site [52]. Those trapping sites were associated with the second and third peak of the TDS spectrum. The fourth peak (62 kJ/mol) can be linked with carbides smaller than 5 nm. Performing the TDS measurement after 72 h of hydrogen desorption time, hydrogen could still be detected in the second, third, and fourth peak indicating the more irreversible nature of the trapping sites. Carbides larger than 20 nm did not play a significant role in hydrogen trapping [24]. The lower diffusivity of the V-containing alloy compared to the Ti-based material is explained by the higher amount of V-based carbides due to the higher amount of C in solid solution after the quenching process. This higher C content results from the faster and complete dissolution of the V carbides compared to the Ti-based precipitates during the austenitization annealing treatment.
The difference in hydrogen diffusivity or trapping ability between all alloys can also be explained by the released hydrogen amount during the TDS measurement. The calculated hydrogen amounts are given in Figure 6. The Fe–C–V alloy contained the highest amount of trapped hydrogen, followed by the Fe–C–Ti, the Fe–C–Cr, and the Fe–C–W material. The measured hydrogen could be located at martensitic lath boundaries, at the interface between carbide and matrix, at stress fields surrounding the carbides, or in vacancies present in a carbide. All trapping sites, both reversible and irreversible, lowered the hydrogen diffusivity. Consequently, an increased hydrogen amount measured with the TDS equipment resulted in a higher hydrogen trapping ability of the material, as was reflected in the obtained permeation transients (Figure 4).
4. Conclusions
This work correlates the microstructural characteristics with the permeation curves and hydrogen diffusivity for four carbide containing quenched and tempered Fe–C–X alloys, with X = W, Cr, Ti, or V. The delay of the permeation transient was associated with the overall trap density, while the slope of the transient was related to the amount of reversible trapping sites. The highest trapping ability was observed for the V-based alloy followed in decreasing order by the Fe–C–Ti, Fe–C–Cr, and the Fe–C–W material. All carbides, except for the W-based ones, had the ability to lower the hydrogen diffusion in the material. Alongside the carbide amount and size, the martensitic matrix characteristics and Ea of the trapping sites played a crucial role in the hydrogen diffusivity of the material.
Author Contributions
E.V.d.E., T.D. and K.V. designed the experiments. E.V.d.E. performed the experiments and analyzed the data. K.V. contributed analysis tools and E.V.d.E. wrote the paper. All authors provided feedback on the manuscript.
Funding
The authors wish to thank the MaDuRos program (SIM), part of the DeMoPreCI-MDT project and UGent for the financial support. Further, the authors acknowledge the postdoctoral fellowship of T.D. via grant nr BOF01P03516 and the Special Research Fund (BOF), UGent (BOF15/BAS/06 and BOF/01J06917).
Acknowledgments
The authors also acknowledge the technicians and staff working at the Department of Materials Textiles and Chemical Engineering, UGent, for their help with the experiments.
Conflicts of Interest
The authors declare no conflict of interest.
References
- Johnson, W. On some remarkable change produced in iron and steel by the action of hydrogen and acids. Proc. R. Soc. Lond. 1875, 23, 168–179. [Google Scholar] [CrossRef]
- Hilditch, T.; Lee, S.; Speer, J.; Matlock, D. Response to Hydrogen Charging in High Strength Automotive Sheet Steel Products. SAE Tech. Pap. 2003, 1764, 47–56. [Google Scholar]
- Koyama, M.; Akiyama, E.; Lee, Y.-K.; Raabe, D.; Tsuzaki, K. Overview of hydrogen embrittlement in high-Mn steels. Int. J. Hydrogen Energy 2017, 42, 12706–12723. [Google Scholar] [CrossRef]
- Depover, T.; Escobar, D.P.; Wallaert, E.; Zermout, Z.; Verbeken, K. Effect of hydrogen charging on thermomechanical properties of advanced high strength steels. Int. J. Hydrogen Energy 2014, 39, 4647–4656. [Google Scholar] [CrossRef]
- Villalobos, J.C.; Serna, S.A.; Campillo, B.; López-Martínez, E. Evaluation of mechanical properties of an experimental microalloyed steel subjected to tempering heat treatment and its effect on hydrogen embrittlement. Int. J. Hydrogen Energy 2017, 42, 689–698. [Google Scholar] [CrossRef]
- Nagumo, M.; Nakamura, M.; Takai, K. Hydrogen thermal desorption relevant to delayed-fracture susceptibility of high-strength steels. Metall. Mater. Trans. A 2001, 32, 339–347. [Google Scholar] [CrossRef]
- Venezuela, J.; Liu, Q.; Zhang, M.; Zhou, Q.; Atrens, A. The influence of hydrogen on the mechanical and fracture properties of some martensitic advanced high strength steels studied using the linearly increasing stress test. Corros. Sci. 2015, 99, 98–117. [Google Scholar] [CrossRef] [Green Version]
- Yu, H.; Olsen, J.S.; Alvaro, A.; Olden, V.; He, J.; Zhang, Z. A uniform hydrogen degradation law for high strength steels. Eng. Fract. Mech. 2016, 157, 56–71. [Google Scholar] [CrossRef]
- Ramamurthy, S.; Lau, W.; Atrens, A. Influence of the applied stress rate on the stress corrosion cracking of 4340 and 3.5 NiCrMoV steels under conditions of cathodic hydrogen charging. Corros. Sci. 2011, 53, 2419–2429. [Google Scholar] [CrossRef]
- Lovicu, G.; Bottazzi, M.; D’Aiuto, F.; de Sanctis, M.; Dimatteo, A.; Santus, C.; Valentini, R. Hydrogen embrittlement of automotive advanced high-strength steels. Metall. Mater. Trans. A 2012, 43, 4075–4087. [Google Scholar] [CrossRef]
- Stopher, M.A.; Lang, P.; Kozeschnik, E.; Rivera-Diaz-del-Castillo, P.E. Modelling hydrogen migration and trapping in steels. Mater. Des. 2016, 106, 205–215. [Google Scholar] [CrossRef]
- Michler, T.; Naumann, J. Microstructural aspects upon hydrogen environment embrittlement of various bcc steels. Int. J. Hydrogen Energy 2010, 35, 821–832. [Google Scholar] [CrossRef]
- Nagao, A.; Martin, M.L.; Dadfarnia, M.; Sofronis, P.; Robertson, I.M. The effect of nanosized (Ti, Mo) C precipitates on hydrogen embrittlement of tempered lath martensitic steel. Acta Mater. 2014, 74, 244–254. [Google Scholar] [CrossRef]
- Turnbull, A. Perspectives on hydrogen uptake, diffusion and trapping. Int. J. Hydrogen Energy 2015, 40, 16961–16970. [Google Scholar] [CrossRef]
- Zhou, C.; Chen, X.; Wang, Z.; Zheng, S.; Li, X.; Zhang, L. Effects of environmental conditions on hydrogen permeation of X52 pipeline steel exposed to high H2S-containing solutions. Corros. Sci. 2014, 89, 30–37. [Google Scholar] [CrossRef]
- Wang, G.; Yan, Y.; Li, J.; Huang, J.; Su, Y.; Qiao, L. Hydrogen embrittlement assessment of ultra-high strength steel 30CrMnSiNi2. Corros. Sci. 2013, 77, 273–280. [Google Scholar] [CrossRef]
- Zhang, S.; Huang, Y.; Sun, B.; Liao, Q.; Lu, H.; Jian, B.; Mohrbacher, H.; Zhang, W.; Guo, A.; Zhang, Y. Effect of Nb on hydrogen-induced delayed fracture in high strength hot stamping steels. Mater. Sci. Eng. A 2015, 626, 136–143. [Google Scholar] [CrossRef]
- Wuyang, C. Hydrogen Embrittlement and Stress Corrosion Cracking; Qiao, L.J.L., Su, Y., Yu, Y., Yang, B., Xuechong, R., Haiyou, H., Eds.; Science Press: Beijing, China, 2013. [Google Scholar]
- Zhao, W.; Zhang, T.; Zhao, Y.; Sun, J.; Wang, Y. Hydrogen permeation and embrittlement susceptibility of X80 welded joint under high-pressure coal gas environment. Corros. Sci. 2016, 111, 84–97. [Google Scholar] [CrossRef]
- Valentini, R.; Solina, A.; Matera, S.; de Gregorio, P. Influence of titanium and carbon contents on the hydrogen trapping of microalloyed steels. Metall. Mater. Trans. A 1996, 27, 3773–3780. [Google Scholar] [CrossRef]
- Yuan, X. Precipitates and hydrogen permeation behavior in ultra-low carbon steel. Mater. Sci. Eng. A 2007, 452, 116–120. [Google Scholar] [CrossRef]
- Sakamoto, Y.; Hanada, U.I. Effect of heat treated structure on diffusion of hydrogen in martensitic type 403 stainless steel. Trans. Jpn. Inst. Metall. 1977, 18, 466–470. [Google Scholar] [CrossRef]
- Hadžipašić, A.B.; Malina, J.; Malina, M. The influence of microstructure on hydrogen diffusion and embrittlement of multiphase fine-grained steels with increased plasticity and strength. Chem. Biochem. Eng. Q. 2011, 25, 159–169. [Google Scholar]
- Depover, T.; Verbeken, K. Evaluation of the effect of V4C3 precipitates on the hydrogen induced mechanical degradation in Fe-CV alloys. Mater. Sci. Eng. A 2016, 675, 299–313. [Google Scholar] [CrossRef]
- Spencer, G.; Duquette, D. The Role of Vanadium Carbide Traps in Reducing the Hydrogen Embrittlement Susceptibility of High Strength Alloy Steels; Army Armament Research Development and Engineering Center Watervliet ny Benet Labs: Watervliet, NY, USA, 1998.
- Depover, T.; Verbeken, K. Evaluation of the role of Mo2C in hydrogen induced ductility loss in Q&T FeCMo alloys. Int. J. Hydrogen Energy 2016, 41, 14310–14329. [Google Scholar]
- Depover, T.; van den Eeckhout, E.; Verbeken, K. Hydrogen induced mechanical degradation in tungsten alloyed steels. Mater. Charact. 2018, 136, 84–93. [Google Scholar] [CrossRef]
- Depover, T.; Verbeken, K. Hydrogen trapping and hydrogen induced mechanical degradation in lab cast Fe-C-Cr alloys. Mater. Sci. Eng. A 2016, 669, 134–149. [Google Scholar] [CrossRef]
- Depover, T.; Verbeken, K. Thermal desorption spectroscopy study of the hydrogen trapping ability of W based precipitates in a Q&T matrix. Int. J. Hydrogen Energy 2018, 43, 5760–5769. [Google Scholar]
- Depover, T.; Verbeken, K. The effect of TiC on the hydrogen induced ductility loss and trapping behavior of Fe-C-Ti alloys. Corros. Sci. 2016, 112, 308–326. [Google Scholar] [CrossRef]
- Devanathan, M.; Stachurski, Z. The mechanism of hydrogen evolution on iron in acid solutions by determination of permeation rates. J. Electrochem. Soc. 1964, 111, 619–623. [Google Scholar] [CrossRef]
- Escobar, D.P.; Depover, T.; Wallaert, E.; Duprez, L.; Verhaege, M.; Verbeken, K. Thermal desorption spectroscopy study of the interaction between hydrogen and different microstructural constituents in lab cast Fe–C alloys. Corros. Sci. 2012, 65, 199–208. [Google Scholar] [CrossRef]
- Escobar, D.P.; Minambres, C.; Duprez, L.; Verbeken, K.; Verhaege, M. Internal and surface damage of multiphase steels and pure iron after electrochemical hydrogen charging. Corros. Sci. 2011, 53, 3166–3176. [Google Scholar] [CrossRef]
- Kissinger, H.E. Reaction kinetics in differential thermal analysis. Anal. Chem. 1957, 29, 1702–1706. [Google Scholar] [CrossRef]
- Lan, L.; Kong, X.; Hu, Z.; Qiu, C.; Zhao, D.; Du, L. Hydrogen permeation behavior in relation to microstructural evolution of low carbon bainitic steel weldments. Corros. Sci. 2016, 112, 180–193. [Google Scholar] [CrossRef]
- Dadfarnia, M.; Sofronis, P.; Neeraj, T. Hydrogen interaction with multiple traps: Can it be used to mitigate embrittlement? Int. J. Hydrogen Energy 2011, 36, 10141–10148. [Google Scholar] [CrossRef]
- Oriani, R.A. The diffusion and trapping of hydrogen in steel. Acta Metall. 1970, 18, 147–157. [Google Scholar] [CrossRef]
- Turnbull, A.; Carroll, M.; Ferriss, D. Analysis of hydrogen diffusion and trapping in a 13% chromium martensitic stainless steel. Acta Metall. 1989, 37, 2039–2046. [Google Scholar] [CrossRef]
- Yang, J.; Huang, F.; Guo, Z.; Rong, Y.; Chen, N. Effect of retained austenite on the hydrogen embrittlement of a medium carbon quenching and partitioning steel with refined microstructure. Mater. Sci. Eng. A 2016, 665, 76–85. [Google Scholar] [CrossRef]
- Van den Eeckhout, E.; Laureys, A.; van Ingelgem, Y.; Verbeken, K. Hydrogen permeation through deformed and heat-treated Armco pure iron. Mater. Sci. Technol. 2017, 33, 1515–1523. [Google Scholar] [CrossRef]
- Dietzel, W.; Pfuff, M.; Juilfs, G. Hydrogen permeation in plastically deformed steel membranes. Mater. Sci. 2006, 42, 78–84. [Google Scholar] [CrossRef] [Green Version]
- Iino, M. Trapping of hydrogen by sulfur-associated defects in steel. Metall. Trans. A 1985, 16, 401–409. [Google Scholar] [CrossRef]
- Escobar, D.P.; Depover, T.; Duprez, L.; Verbeken, K.; Verhaege, M. Combined thermal desorption spectroscopy, differential scanning calorimetry, scanning electron microscopy and X-ray diffraction study of hydrogen trapping in cold deformed TRIP steel. Acta Mater. 2012, 60, 2593–2605. [Google Scholar] [CrossRef]
- Depover, T.; Verbeken, K. The detrimental effect of hydrogen at dislocations on the hydrogen embrittlement susceptibility of Fe-CX alloys: An experimental proof of the HELP mechanism. Int. J. Hydrogen Energy 2018, 43, 3050–3061. [Google Scholar] [CrossRef]
- Prawoto, Y.; Jasmawati, N.; Sumeru, K. Effect of prior austenite grain size on the morphology and mechanical properties of martensite in medium carbon steel. J. Mater. Sci. Technol. 2012, 28, 461–466. [Google Scholar] [CrossRef]
- Hidalgo, J.; Santofimia, M.J. Effect of prior austenite grain size refinement by thermal cycling on the microstructural features of as-quenched lath martensite. Metall. Mater. Trans. A 2016, 47, 5288–5301. [Google Scholar] [CrossRef]
- Leblond, J.; Dubois, D. A general mathematical description of hydrogen diffusion in steels—II. Numerical study of permeation and determination of trapping parameters. Acta Metall. 1983, 31, 1471–1478. [Google Scholar] [CrossRef]
- Wei, F.; Hara, T.; Tsuzaki, K. Precise determination of the activation energy for desorption of hydrogen in two Ti-added steels by a single thermal-desorption spectrum. Metall. Mater. Trans. B 2004, 35, 587–597. [Google Scholar] [CrossRef]
- Pressouyre, G.; Bernstein, I. A quantitative analysis of hydrogen trapping. Metall. Trans. A 1978, 9, 1571–1580. [Google Scholar] [CrossRef]
- Lee, H.; Lee, J.-Y. Hydrogen trapping by TiC particles in iron. Acta Metall. 1984, 32, 131–136. [Google Scholar] [CrossRef]
- Drexler, A.; Depover, T.; Verbeken, K.; Ecker, W. Model-based interpretation of thermal desorption spectra of Fe-C-Ti alloys. Acta Mater. 2018. submitted. [Google Scholar]
- Pressouyre, G. A classification of hydrogen traps in steel. Metall. Mater. Trans. A 1979, 10, 1571–1573. [Google Scholar] [CrossRef]
Figure 1.
Schematic representation of the permeation set-up where hydrogen is produced at the cathodic side of the cell (left) and after diffusion through the working electrode (WE) is oxidized at the anodic side of the cell (right). Reference electrode and counter electrode are labeled as RE and CE, respectively.

Figure 2.
TEM images of the different alloys.

Figure 3.
Carbide size distributions for the different alloys.

Figure 4.
Normalized permeation transients for the different materials.

Figure 5.
Hdiff obtained by hot extraction in wppm (grey bars) and the time (h) from hydrogen breakthrough till the steady state condition is reached (black line).
Figure 5.
Hdiff obtained by hot extraction in wppm (grey bars) and the time (h) from hydrogen breakthrough till the steady state condition is reached (black line).

Figure 6.
Thermal desorption spectroscopy (TDS) spectra, activation energies (kJ/mol) corresponding to the deconvoluted peaks and the amount of hydrogen (wppm) determined from the TDS spectra.
Figure 6.
Thermal desorption spectroscopy (TDS) spectra, activation energies (kJ/mol) corresponding to the deconvoluted peaks and the amount of hydrogen (wppm) determined from the TDS spectra.


Table 1.
Chemical composition of the different alloys in wt%.
| Alloy Fe–C–X | C | X | Other |
|---|---|---|---|
| Fe–C–W | 0.277 | 8.700 | 200–300 ppm Al |
| Fe–C–Cr | 0.184 | 2.200 | |
| Fe–C–Ti | 0.313 | 1.340 | |
| Fe–C–V | 0.286 | 1.670 |
Table 2.
Hydrogen diffusion coefficients of the different materials.
| Alloy | Dapp [m²/s] |
|---|---|
| Fe–C–W | 7.21 × 10⁻¹¹ |
| Fe–C–Cr | 5.78 × 10⁻¹¹ |
| Fe–C–Ti | 3.02 × 10⁻¹² |
| Fe–C–V | 1.16 × 10⁻¹² |
© 2018 by the authors. Licensee MDPI, Basel, Switzerland. This article is an open access article distributed under the terms and conditions of the Creative Commons Attribution (CC BY) license (http://creativecommons.org/licenses/by/4.0/).
Share and Cite
MDPI and ACS Style
Van den Eeckhout, E.; Depover, T.; Verbeken, K. The Effect of Microstructural Characteristics on the Hydrogen Permeation Transient in Quenched and Tempered Martensitic Alloys. Metals 2018, 8, 779. https://doi.org/10.3390/met8100779
AMA Style
Van den Eeckhout E, Depover T, Verbeken K. The Effect of Microstructural Characteristics on the Hydrogen Permeation Transient in Quenched and Tempered Martensitic Alloys. Metals. 2018; 8(10):779. https://doi.org/10.3390/met8100779
Chicago/Turabian StyleVan den Eeckhout, E., T. Depover, and K. Verbeken. 2018. "The Effect of Microstructural Characteristics on the Hydrogen Permeation Transient in Quenched and Tempered Martensitic Alloys" Metals 8, no. 10: 779. https://doi.org/10.3390/met8100779
Note that from the first issue of 2016, this journal uses article numbers instead of page numbers. See further details here.