Monitoring Liquid Level of Blast Furnace Hearth and Torpedo Ladle by Electromotive Force Signal
by
Ying Li
1, 
Lei Zan
1,
Yao Ge
1,
Han Wei
1,
Zhenghao Zhang
2,
Chuanguang Bi
2,
Kaicheng Lu
2 and
Yaowei Yu
1,3,* 1
State Key Laboratory of Advanced Special Steel, Shanghai Key Laboratory of Advanced Ferrometallurgy, School of Materials Science and Engineering, Shanghai University, Shanghai 200444, China
2
Technology Center, Shanghai Meishan Iron & Steel Co., Ltd., Baosteel, Nanjing 210039, China
3
Thermal and Flow Engineering Laboratory, Department of Chemical Engineering, ÅboAkademi University, Biskopsgatan 8, FI-20500 Åbo, Finland
*
Author to whom correspondence should be addressed.
Metals 2018, 8(9), 665; https://doi.org/10.3390/met8090665
Submission received: 19 June 2018
/
Revised: 16 August 2018
/
Accepted: 18 August 2018
/
Published: 25 August 2018
(This article belongs to the Special Issue 5th UK-China Steel Research Forum)
Abstract
:The state of a blast furnace hearth, especially the liquid level of hot metal and slag during the tapping process, is of crucial importance with respect to a long campaign blast furnace. In practice, the state of the hearth is evaluated mainly by the experience of operators. In this paper, the electromotive force (EMF) is used to monitor the liquid level of a laboratory scale of blast furnace hearth and the effect of liquid level, EMF sensors position and the thickness of refractory on EMF signals are tested using a single layer of water and double layers of water and oil. After laboratory experiments, the electromotive force (EMF) is used to monitor the liquid level of torpedo ladle successfully. Laboratory experimental results show that the change in liquid level can be characterized by EMF signal. The state of liquid surface and local thermal state cause the EMF signal to vary in the circumferential direction of the vessel. Furthermore, the EMF signal magnitude decreases with the decrease of the thickness of the graphite crucible. Finally, the main conclusions of the laboratory experiment are supported by the torpedo ladle experiment.
1. Introduction
The blast furnace is still the main section in an integrated steel company and its production and efficiency determines the costs and profits of the company. However, a blast furnace is a typical black box in which many phenomena cannot be directly observed and measured, such as the liquid level of hot metal and slag in hearth, the extent of lining erosion and location of dead man in hearth [1,2,3,4]. These phenomena not only influence a smooth operation of hot metal tapping practice but also determine stabilities of blast furnace productivity and a long time campaign [5]. Proper monitoring of the liquid level is, therefore, an essential step towards a successful operation of a blast furnace.
A variety of charging programs, quality of raw material, blast conditions and casting all affect the state of hearth. There are two ordinary methods for monitoring the hearth: thermocoupling and cooling water/gas. The former method shows the temperature distribution around the refractory of the hearth and the latter only illustrates the total amount of heat conducted from the hearth. Both of them cannot monitor the level of hot metal and slag in the hearth. In practice, the level is evaluated mainly by the experiences of operators [6].
The electromotive force (EMF) has been used to measure the liquid level in the hearth for almost 100 years [7,8,9,10]. Comparing with other hearth state monitoring methods, the EMF technique maintains its own characteristics in the development process, for example the signal of the EMF sensor, which is believed to originate from the thermal and chemical reactions occurring in the hearth [5,6,7], while the signal of the thermocouple originates from the thermoelectric effect; the above is the electromotive force generative mechanism difference between the EMF technique and the thermocouple. Comparing with the other methods reported in References [4,11,12,13,14], the former concentrates on the generation of EMF noise and the solution of the noise, the latter are all mathematical models including CFD and (or) DEM to simulate the tapping procedure. Therefore, the EMF technique can obtain the liquid level information more quickly and actually. It also catches more accurate information on the real-time liquid level by combining with other online operation parameters such as blast pressure, the time of opening and closing of the tapholes, the amount of taphole mud, taphole length, hot metal temperature and so on.
However, the applications of the EMF technique are ambiguous due to the difficulties of decoding the odd signals to explain its reasons [1,15]; for example, how do different local measuring sensors influence the EMF signal and why do measuring points of EMF on the shell explain liquid level of the hearth? Furthermore, how the thickness of refractory influences the EMF signal has not yet been clarified. There is no study that has yet tried to solve these problems. Consequently, a system of static stress and strain test analysis is used to validate the consistency of EMF data and liquid level firstly. Then measuring sensors on the shell of blast furnace are used to explain the inside liquid level change, and how different local measuring points influence the EMF signal are investigated. After the laboratory experiments, the torpedo ladle experiment is carried out and the main conclusions of the laboratory experiment are validated. We have to point out that laboratory experiment apparatus could not model chemical reactions in the hearth but the evolution of the liquid level in the hearth could be observed clearly. This is the reason we could use water and oil to carry out the study.
The results of the present research should be useful for exploring the relationship of EMF signals and the hearth liquid level, as well as the relationship of EMF signals and thermal state.
2. EMF Measurement Principle
According to the thermoelectric theory, the signals of the EMF sensors are originated from the thermal and chemical reactions occurring in the hearth and the laboratory experiment and the torpedo ladle experiment with respect to the same principle.
EMF Measurement Principle of Laboratory Experiment and Torpedo Ladle Experiment
The thermoelectric effect [16,17,18] is the principle of EMF application on detection liquid level in a laboratory scale of blast furnace hearth, where the wall of graphite crucible and EMF sensors form a close loop. Therefore, the EMF signal can be detected when the evolution of liquid level contributes to the thermal state of the wall changes dramatically.
The schematic diagram of the experiment is shown in Figure 1 including the equivalent circuits which are illustrated in the intermediate figures of Figure 1, where a single layer of water simulates hot metal in Figure (I) and two layers of water and HFV-M200 (Huifeng Petroleum & Chemical Co., Ltd., Shang Hai, China) vacuum oil (henceforth called the oil) illustrate to calculate hot metal and slag in Figure (II). In Figure 1, it shows that the EMF signals across the two electrodes can be detected on the inner wall (cf. red circle in Figure 1) and on the outer wall (cf. blue circle in Figure 1) of graphite crucible and are expressed by Equations (1) and (2).
As shown in Figure 1, lower sensors for detecting EMF are located at a little higher position than the height of crucible exit. Since the boundary position between water and oil changes around the exit level and collect the EMF data in the whole liquid level changing field, it is reasonable to assume that sensors should be set about 4mm higher than the height of crucible exit.
The heat converts to EMF on the graphite crucible wall. The evolution of liquid level influences the change of its thermal state, which can be represented by electrical energy and be detected by EMF signals. EMF, therefore, can give some information of liquid level and thermal state, the EMF can be calculated by Equation (3) from the literature [19].
where: T0 and T define the temperature of graphite crucible wall before experiment and the temperature of graphite crucible wall in experiment, respectively. The term expressesThomson coefficient which is determined by the performance of temperature and material properties.
In experiment, the term coefficient of copper alloy cable at room temperature is around mv. The experiment temperature of water or oil is fixed at 48 °C, EMF data of the cable is 0.056 mv by Equation (3), whose magnitude is consistent with the experimental results in Section 4.1.
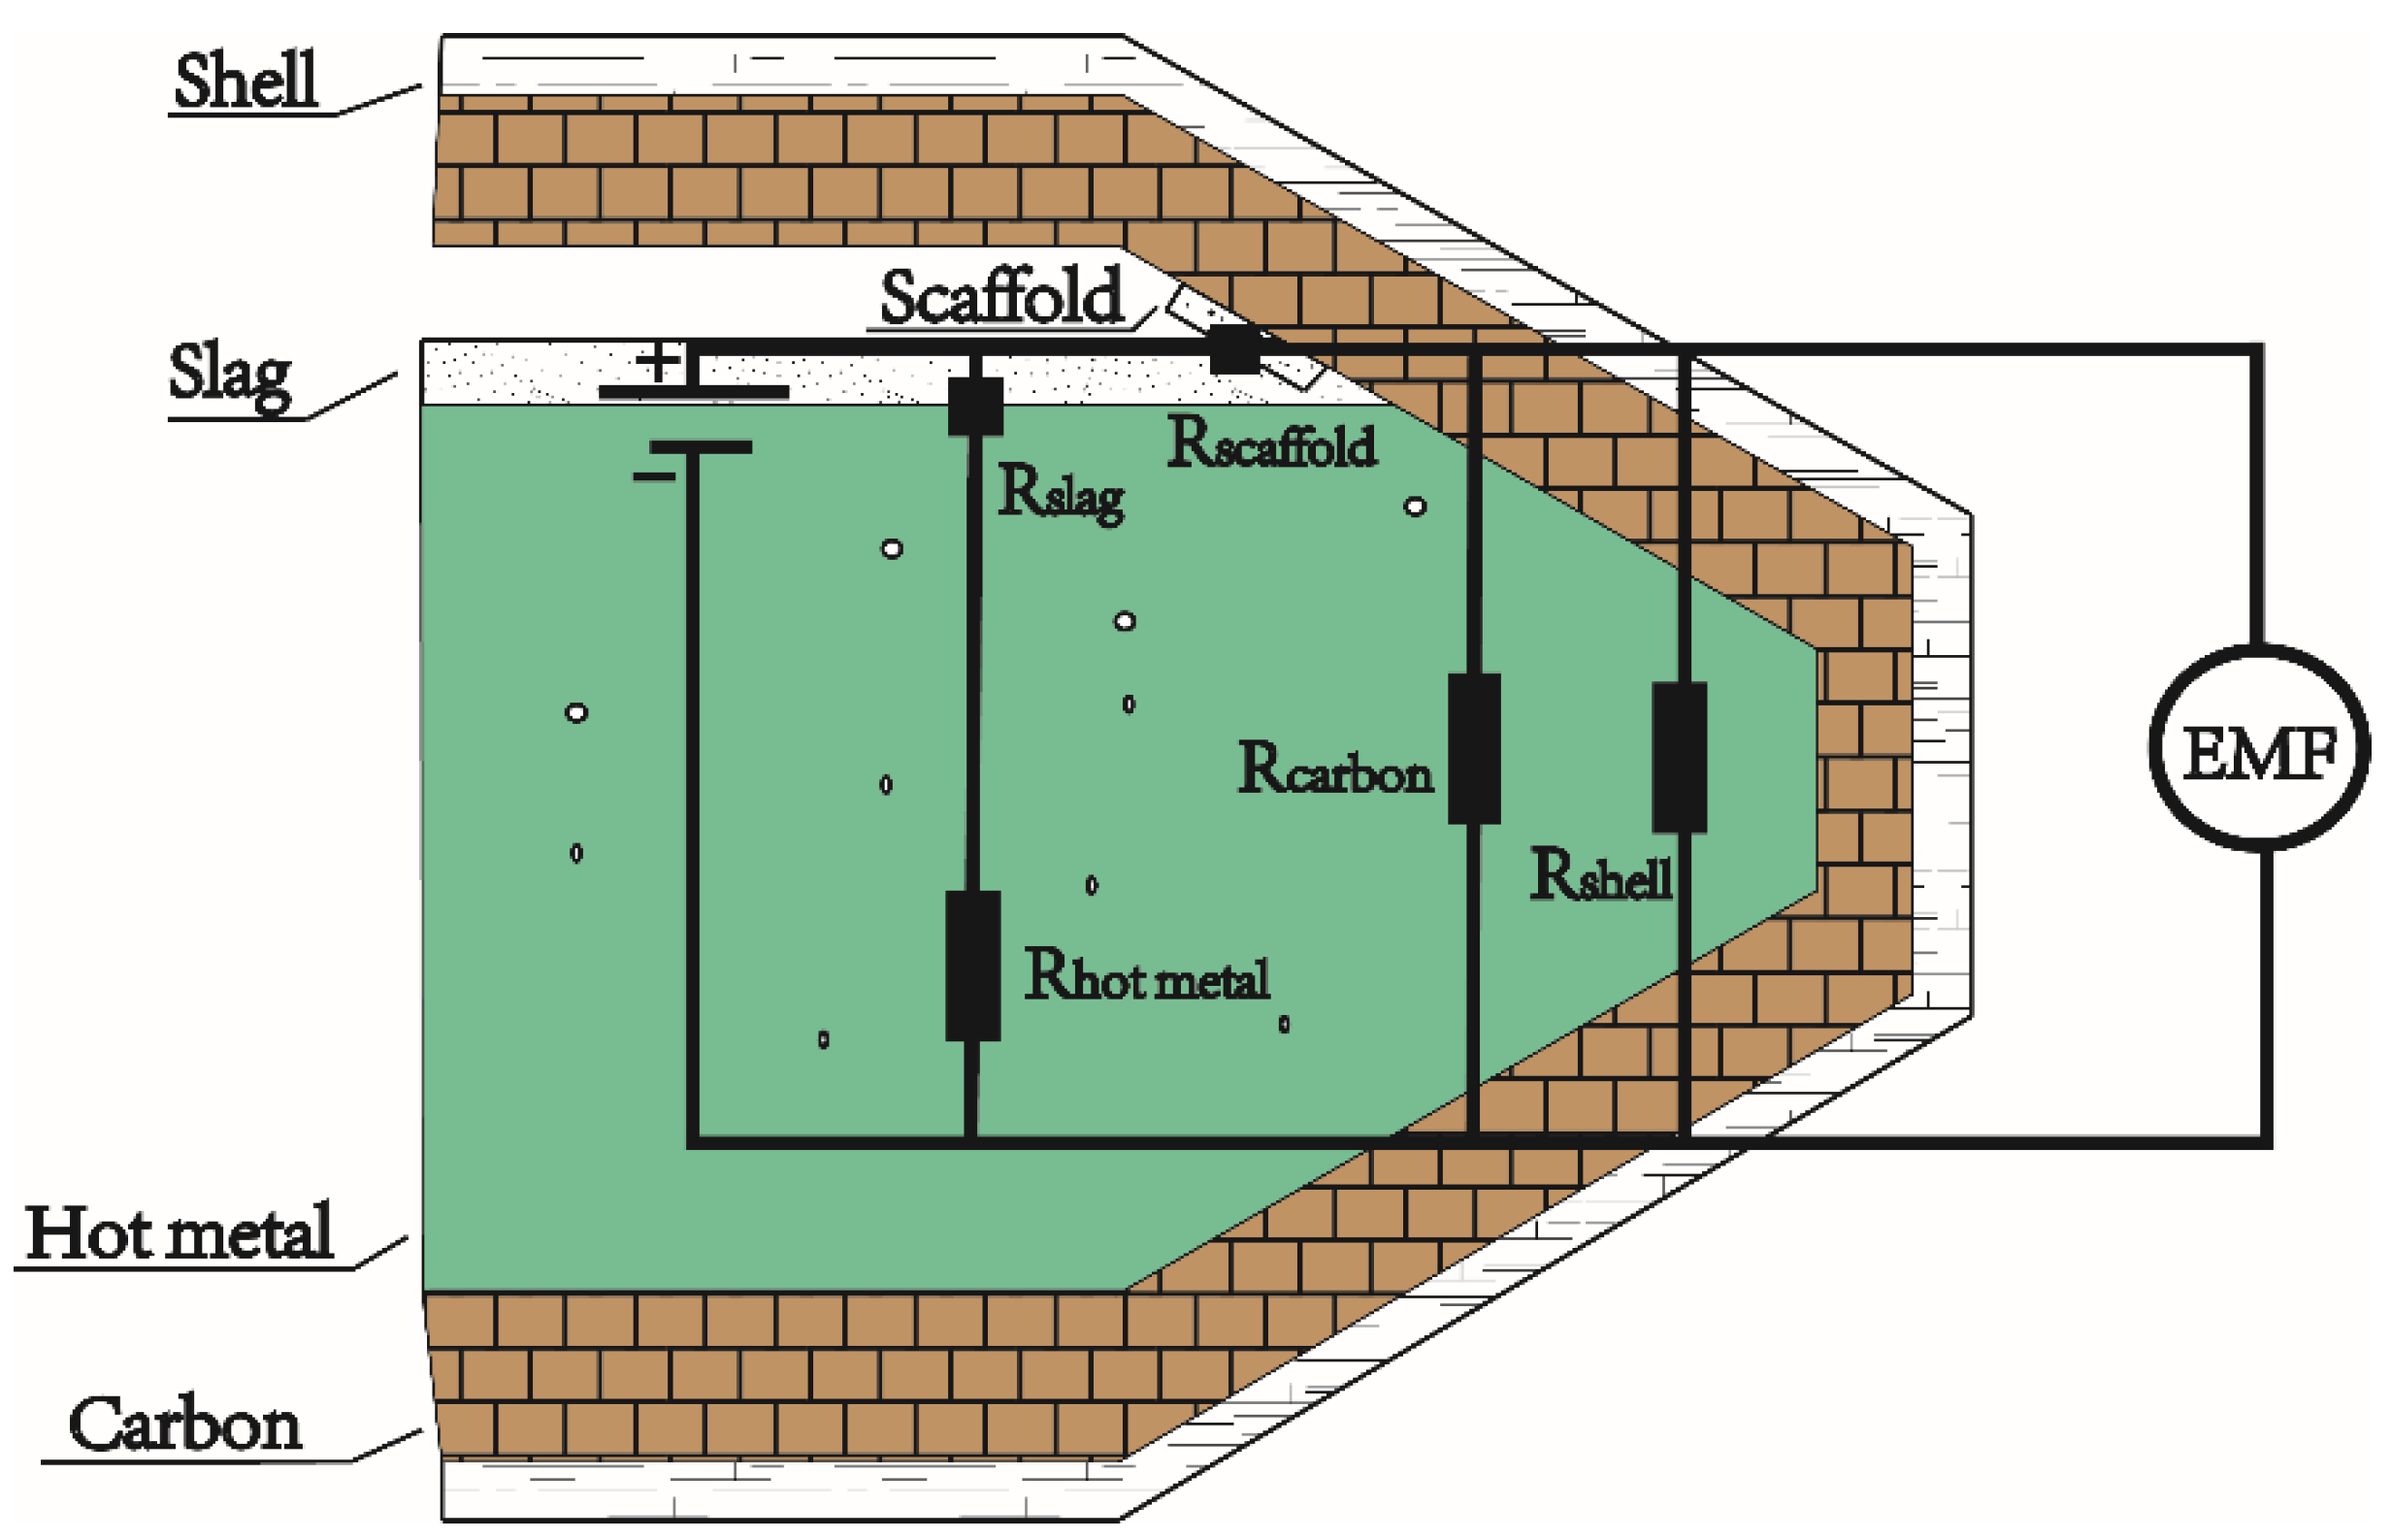
The structure of torpedo ladle is similar to the structure of blast furnace hearth, while they are composed of steel shell, ramming material, carbon bricks and so on. Consequently, the level of hot metal and slag in the torpedo ladle can be obtained by measuring the EMF. Torpedo ladle structure and possible electrical circuit are shown in Figure 2.
3. Experimental Apparatus and Procedure
The laboratory experiments are conducted on high pure graphite crucibles where could EMF sensors are installed in different locations and torpedo ladle experiment is performed on a real torpedo ladle where EMF sensors are installed in air exhausting holes.
3.1. Experimental Apparatus and Procedure of Laboratory Experiment
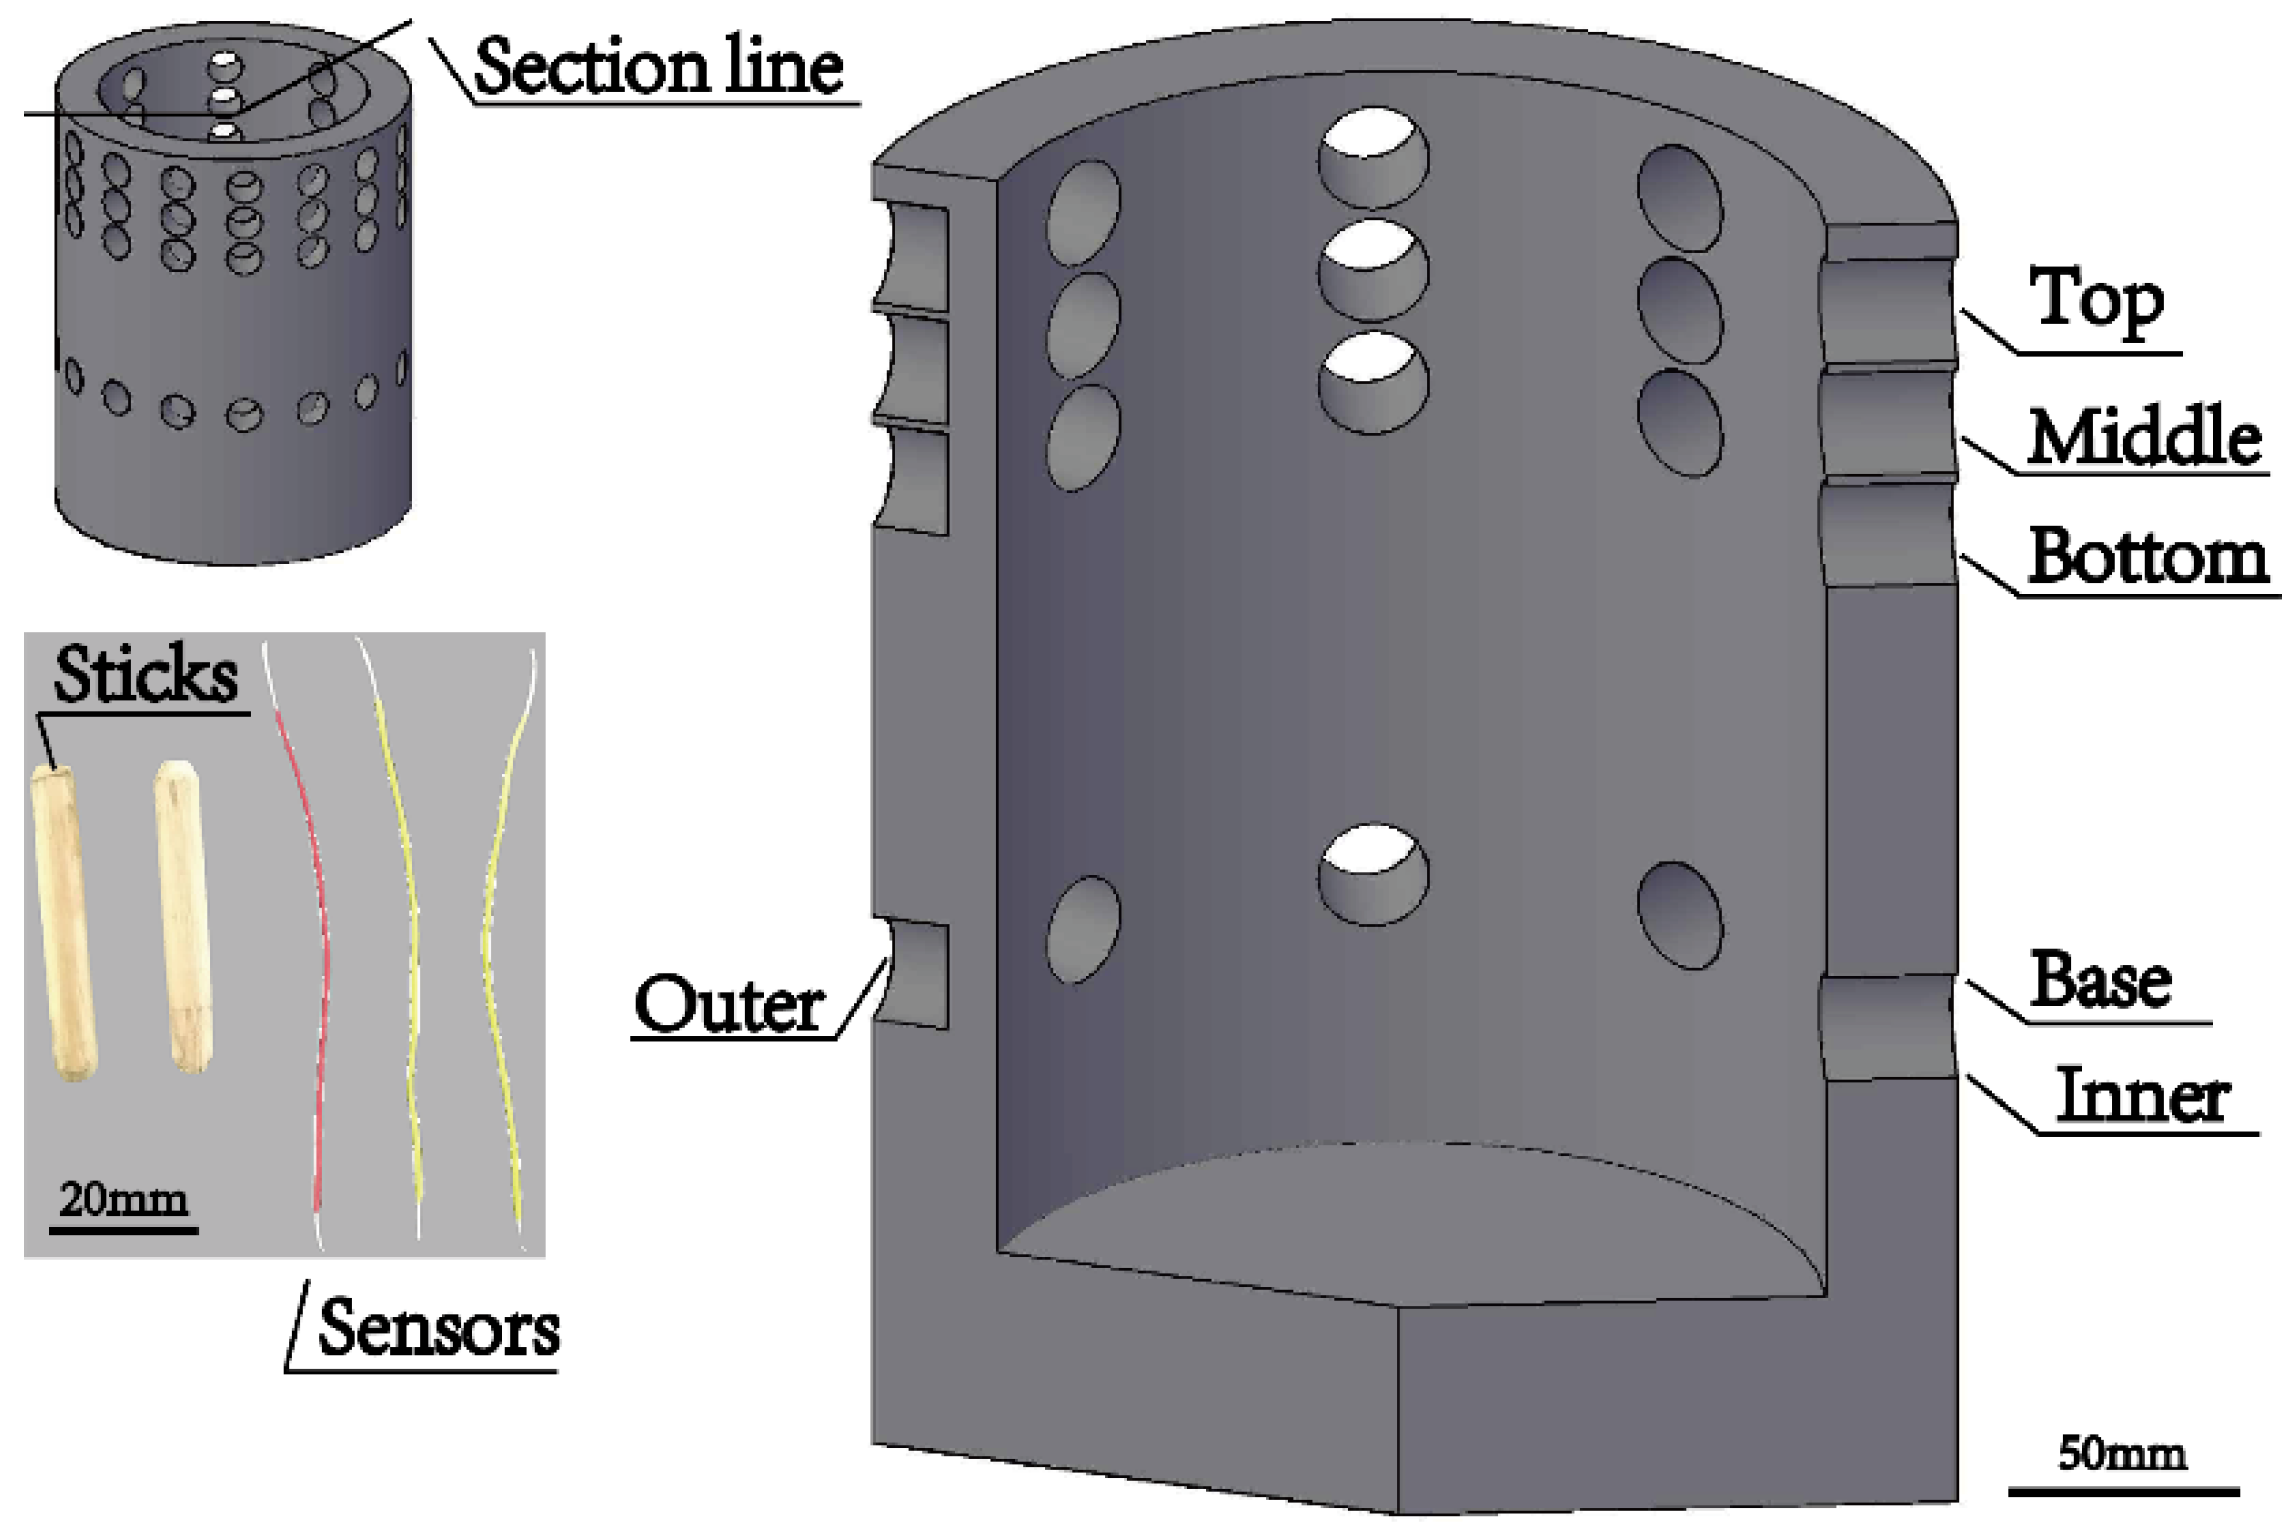
The experimental apparatus is a graphite crucible and a section of the crucible with sensor measurement holes is illustrated in Figure 3. The stick and sensor are shown in Figure 3 (lower left corner), stick is used to stabilize EMF sensors; The EMF sensors with diameter = 0.15 mm have the following characteristics: copper rod; a layer of silver covers the surface of the copper rod; external electrical insulation.
In order to study the effect of graphite crucible thickness on EMF signal and observe the differences of the EMF signal around the circumference, as shown in Figure 3, 8 sensors in inner holes and another 8 sensors in outer holes are designed on the same height of circumference, moreover, 16 sensors evenly distribute around the wall perimeter. The former directly contacts the liquid and the latter has a 9 mm distance from the outer surface of the crucible. The thickness of crucible wall is 14 mm. Furthermore, as indicated in Figure 3, three different heights of sensors (named top, middle and bottom) on the circumferences investigate relationships between liquid height and EMF signal while the distance between each height is 13 mm. Base sensors locate at the bottom of the crucibles.
Obtaining the four height live EMF signals’ problem is tackled by a homemade graphic visualization package, by which the EMF signals transfer to a digital signal twice per second. A relative EMF signals from the four heights is processed with Equation (4).
where: base, top, middle and bottom are shown in Figure 3.
Although the experimental apparatus is quite different from blast furnace hearth, the EMF signal varies with changing liquid level in the mimicking hearth as well as in the hearth. The vessel, thus, can study quantitatively and qualitatively the impact of EMF sensor positions that include the depth, height and the number of sensors, different liquid media on the EMF signal as well as the principle of EMF methodology.
In the beginning, an amount of liquid (water or the mixture of water and oil) dumps into the apparatus. Then the liquid flows out from the exit of crucible at the bottom. During the whole process, the detecting system records the EMF data.
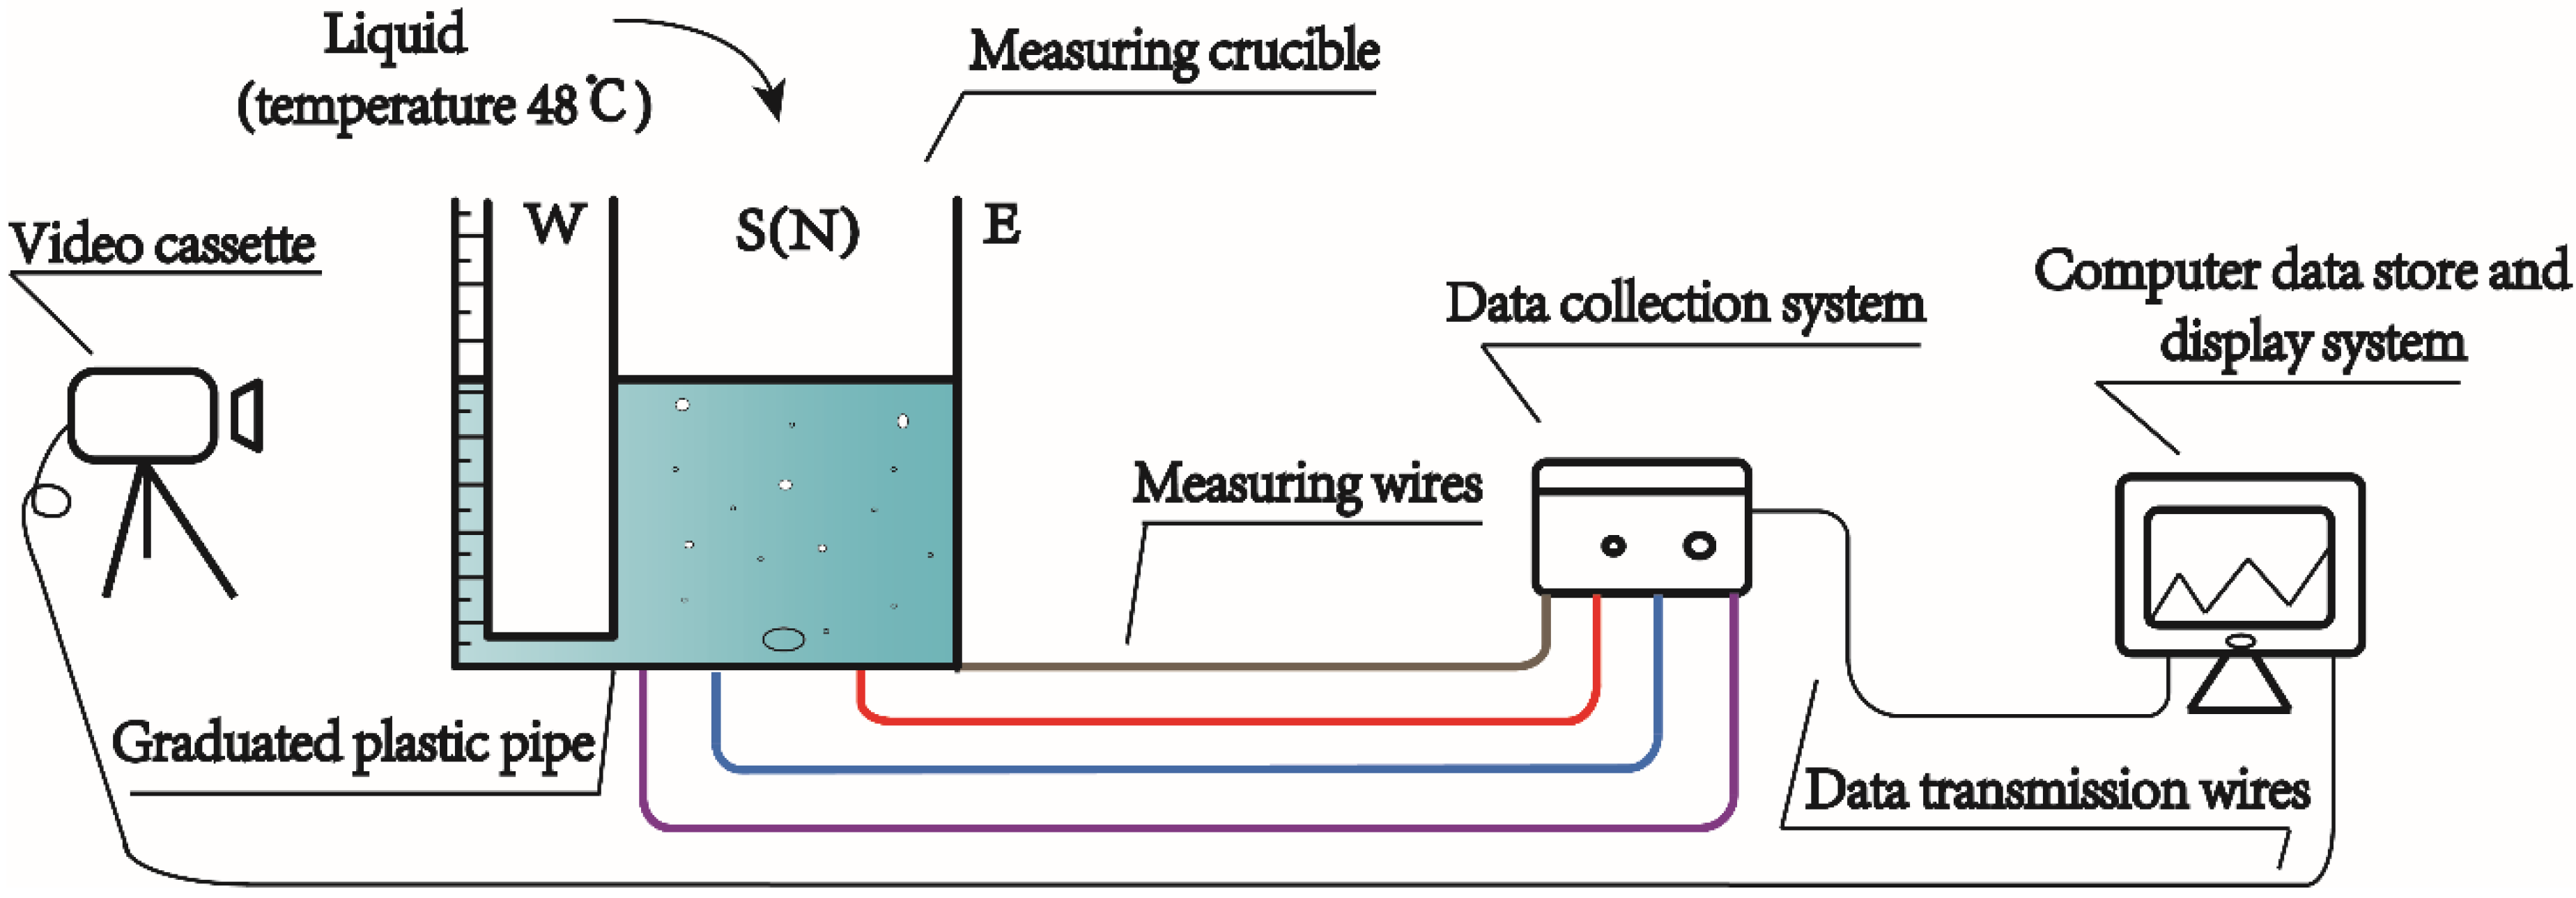
The graduated plastic pipe, as shown in Figure 4, is used to observe the height of liquid in the crucible and connects with graphite crucible at the bottom. A camera records the decrease of liquid level. Then the liquid level recorded by the video is used to validate the evolution of EMF signals during tapping.
3.2. Experimental Apparatus and Procedure of Torpedo Ladle Experiment
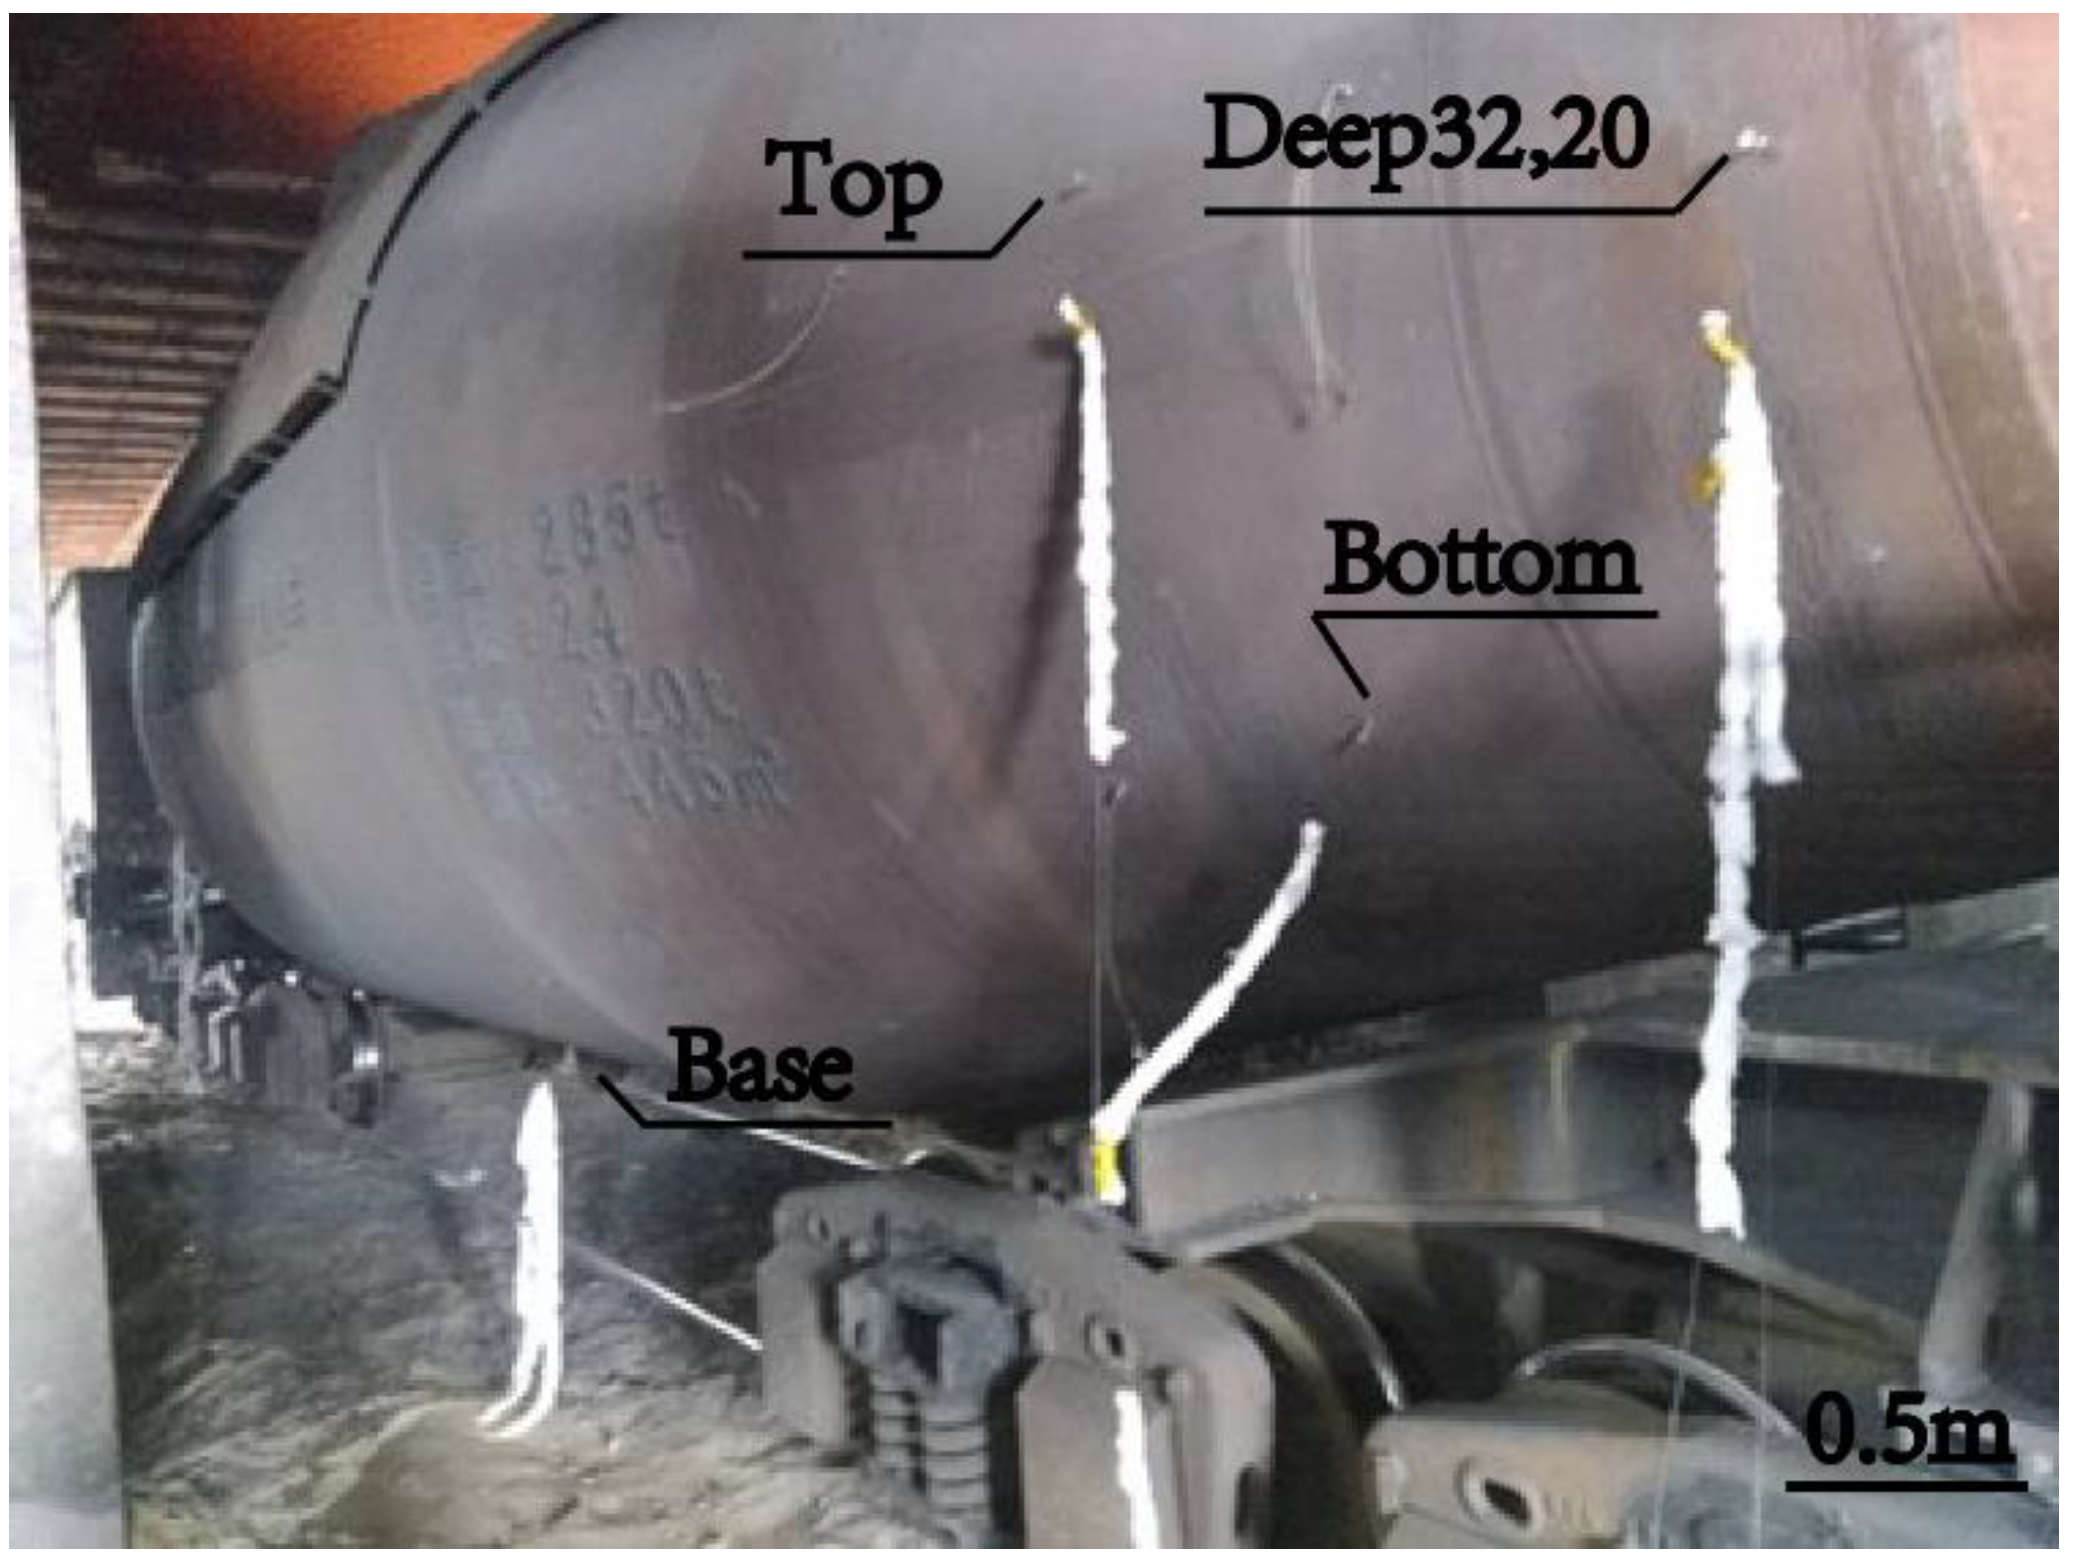
In order to verify the conclusions from the laboratory experiment and accumulate knowledge for industrial application, the torpedo ladle experiment is carried out. The volume of the torpedo ladle is 44.5 m3, as shown in Figure 5. Due to the high temperature of torpedo ladle’s shell, 0.3 mm molybdenum wire is used as the sensors and white asbestos is used to prevent the wire from being burned.
In Figure 5, there are five measurement locations, the top and bottom measurement locations are used to study the influence of sensors’ height to the EMF; In order to explore the influence of refractory thicknesses on EMF signals, the deep32 and deep20 sensors are designed, which are placed in the same hole and are inserted in 32 mm and 20 mm deep respectively. The shell distance between top and bottom measurement locations is 0.95 m, while the distance between top and the deep32 (See Figure 5) measurement location is 1.11 m. Base measurement location is used as reference potential of other measurement locations.
Similar to Equation (4), relative EMF signals from the 5 measurement locations are calculated with Equation (5)
where: base, top, bottom, deep32 and deep20 are shown in Figure 5.
Before experiment, the torpedo ladle is firstly arrived at the receiving hot metal position under the cast house. The EMF measurement system, sensors and measurement lines, then, are installed quickly. After testing the EMF measurement system works well and keeps working until the end of tapping. During the process of receiving the hot metal, the EMF measurement system collects signals automatically. Finally, the signals are visualized and analyzed.
4. Experimental Results and Discussions
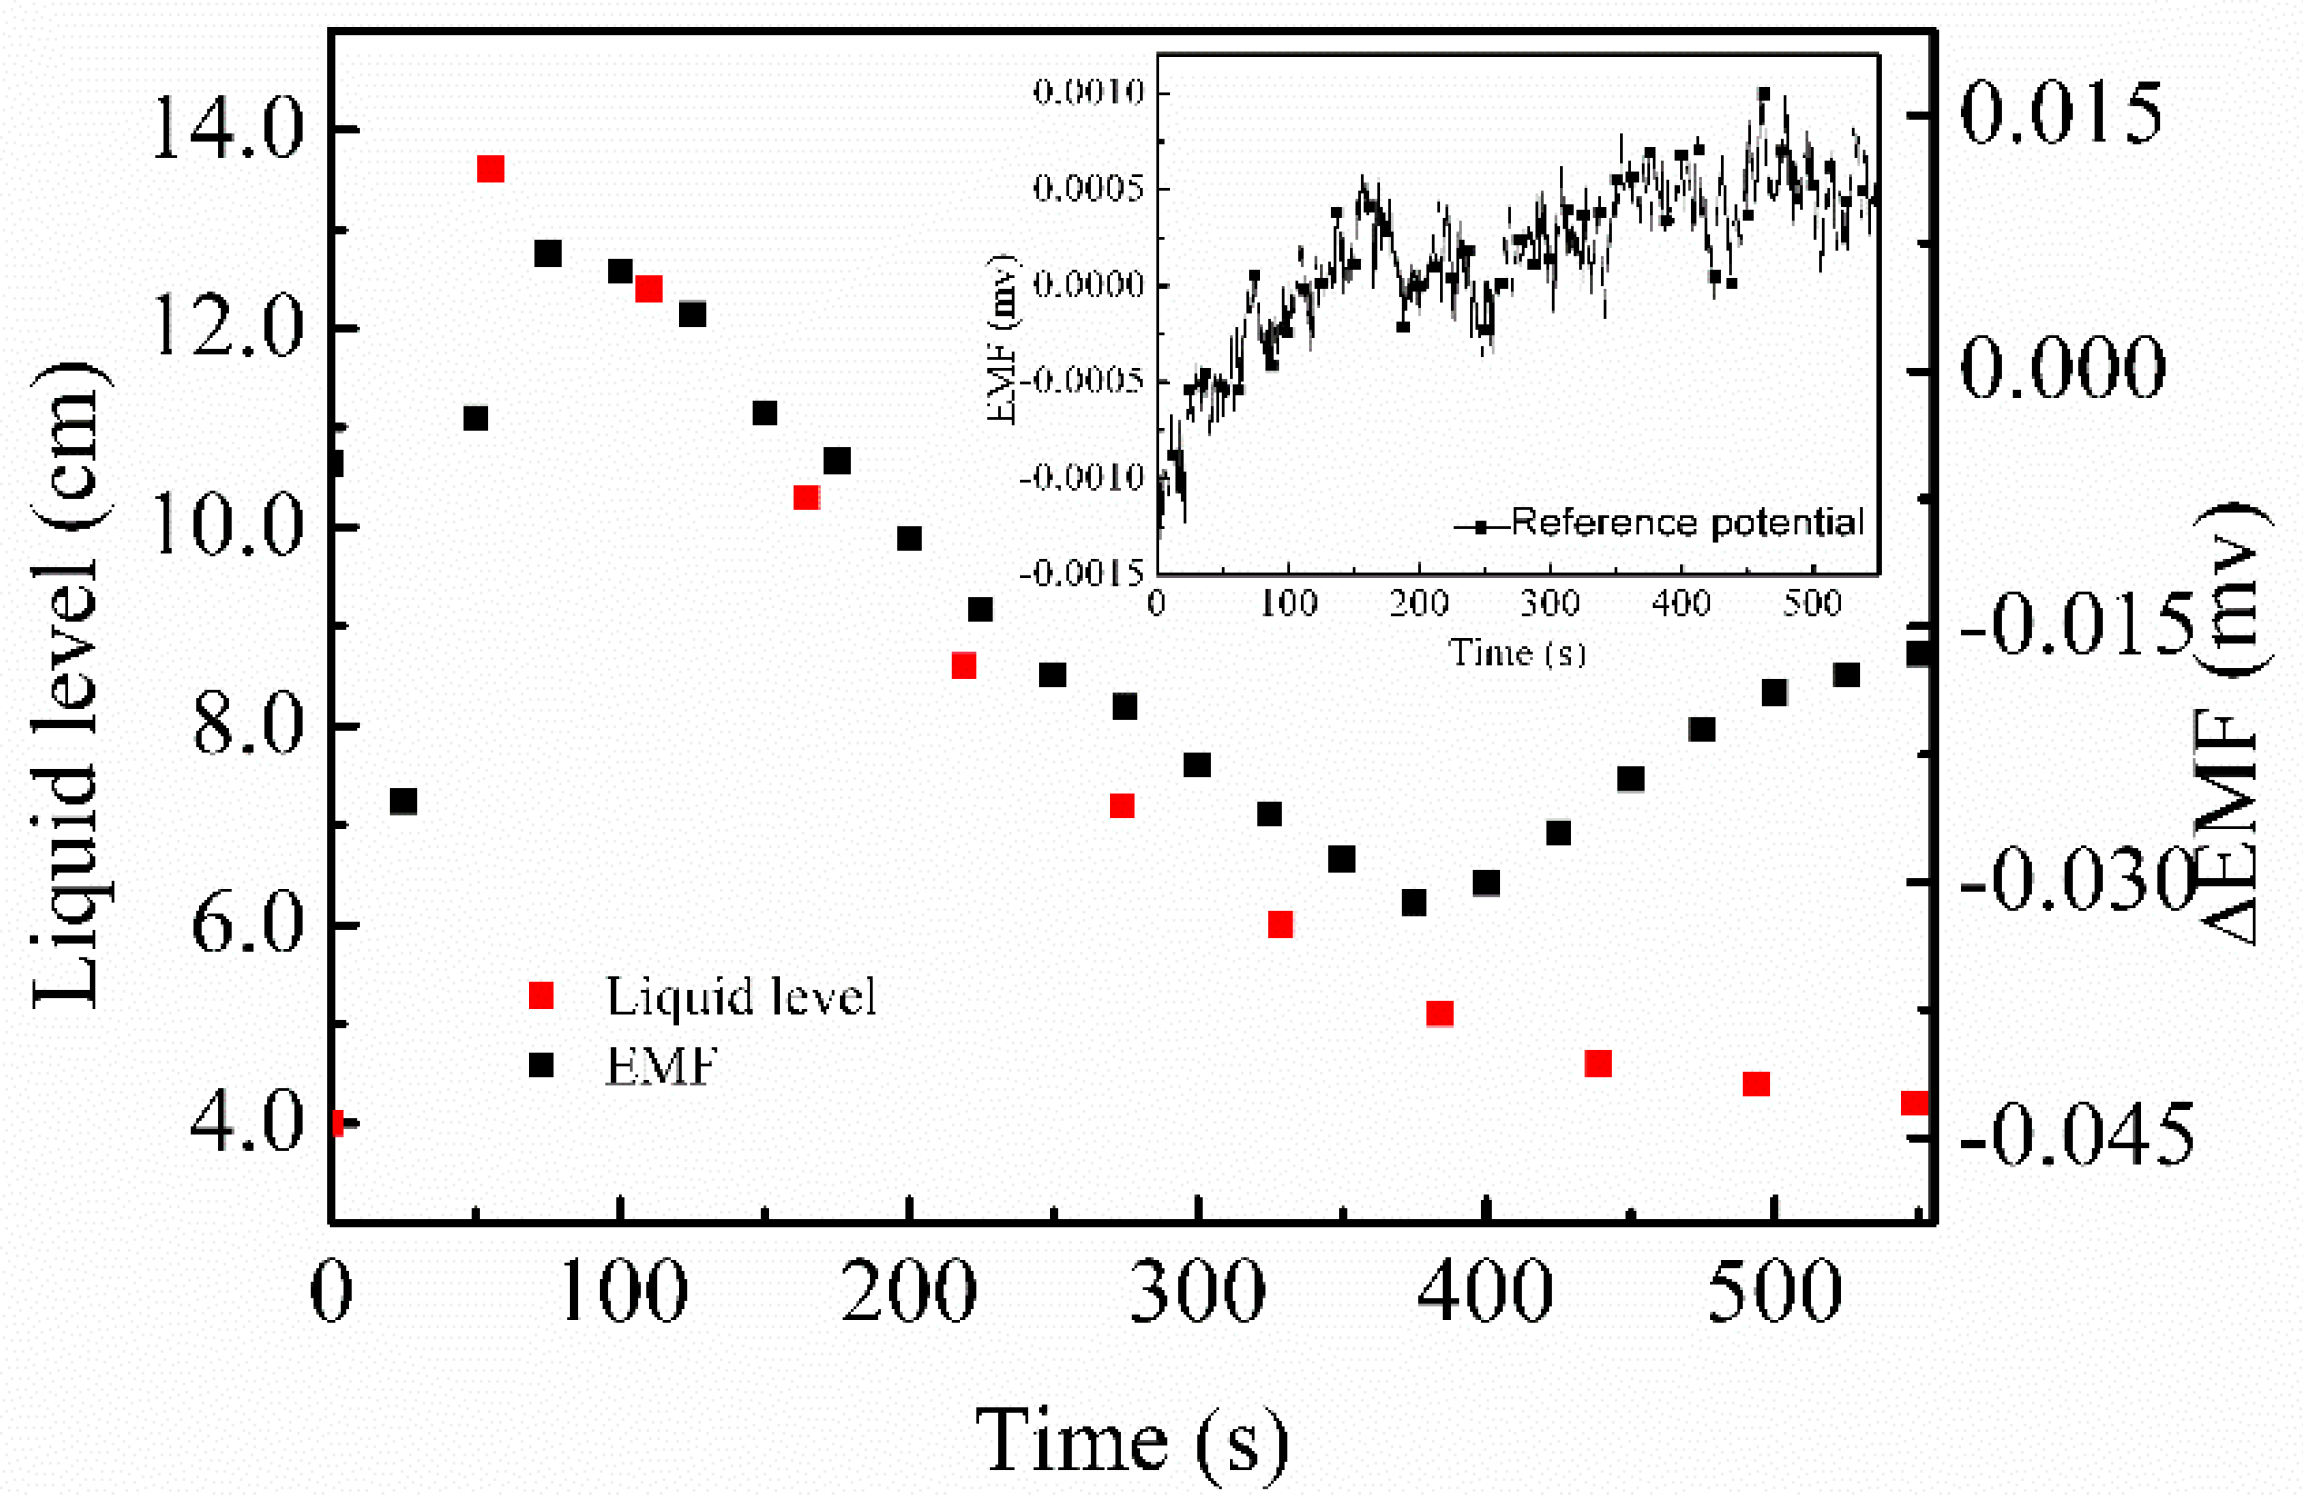
In order to investigate the relationship between the EMF signals and liquid level during the tapping process, laboratory experiment and torpedo ladle experiment were carried out respectively. In laboratory experiment, the EMF signals are measured in a variety of situations, such as the height of sensor, the number of EMF sensors, refractory thickness, different liquid medium and so on, in addition, it should highlight that the reference potential is similar for every measurement (cf. the inserted graph in Figure 6). In torpedo ladle experiment, the EMF signals are measured in two situations which include the height of sensor and refractory thickness, the sensors use the same reference potential (cf. the base measurement location in Figure 5).
4.1. Laboratory Experiment
4.1.1. Validation of EMF Signals by the Height of Liquid
Figure 6 shows the evolution of liquid level and EMF signals in the process of tapping. Liquid level and thermal state change drastically before 50 s, which indicates that the EMF signal has not reached to the stable state. Liquid level decreases with the increase of time after 50 s, which is consistent with the EMF signals from 50 s to 380 s. After 380 s, the absolute value of EMF decreases until the end, which attributes to the liquid level lower than the height of base sensors. The EMF signals, therefore, have good agreement with liquid level, which indicates that EMF signals can characterize the liquid level in the crucible.
4.1.2. Effect of the Height of Sensor Locations on EMF Signals
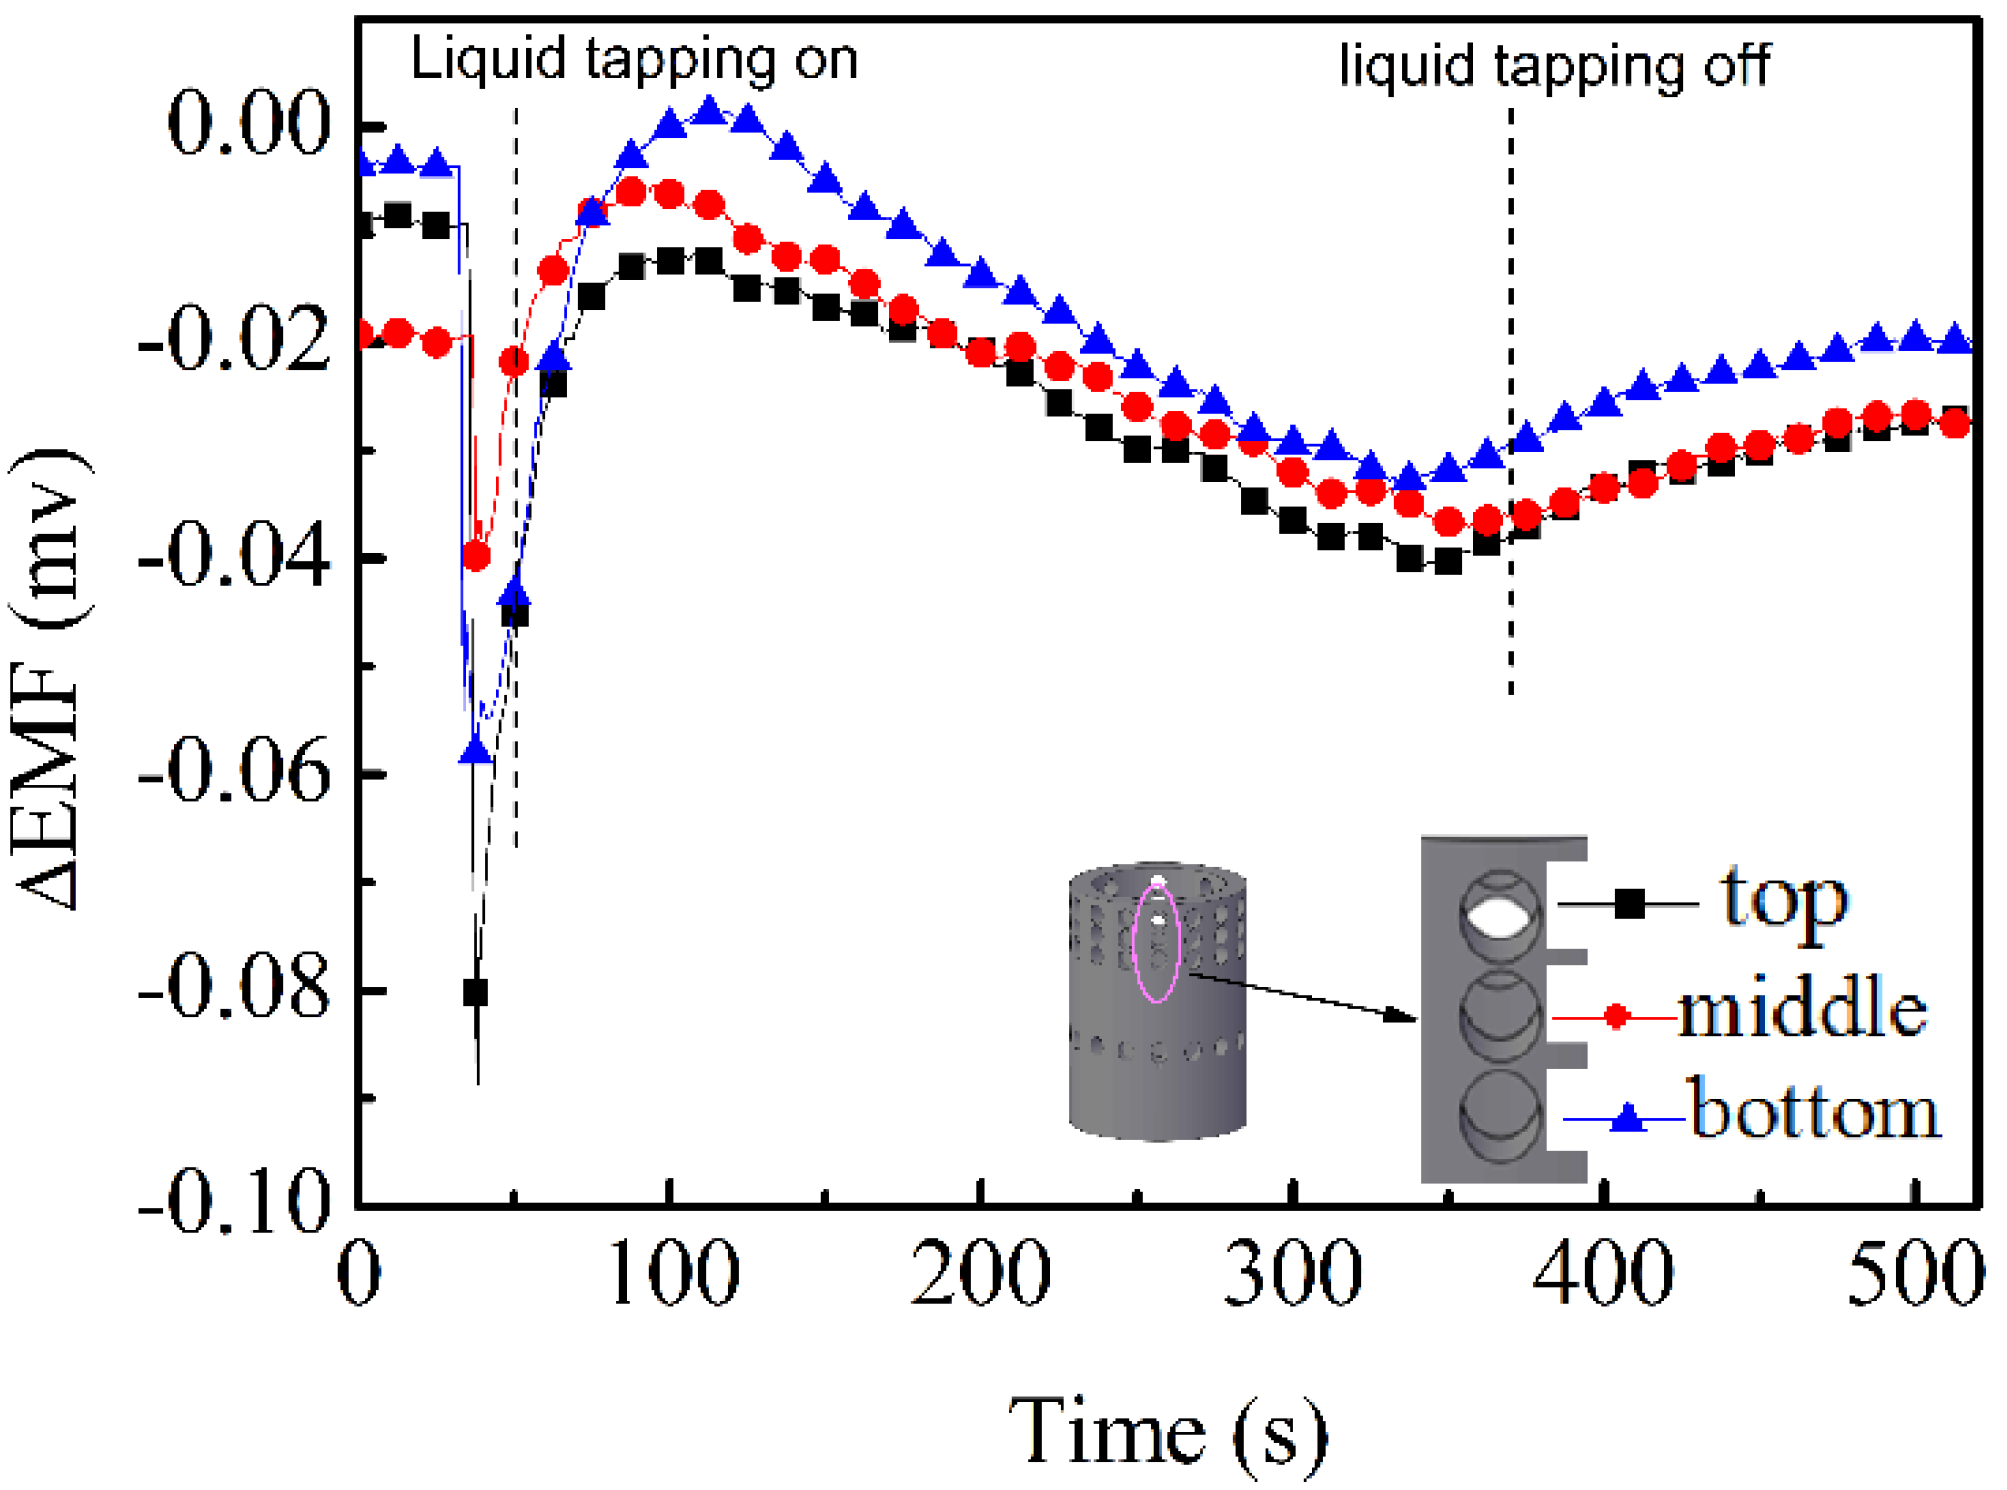
Relationship of time and the EMF signals during the tapping is shown in Figure 7 from top, middle and bottom location at the inner wall. In the beginning, the water at temperature = 48 °C is dumped into the crucible and the EMF signals are measured. Consequently, with the fluctuation of liquid level and the change of thermal state, the EMF signals increase drastically and reach to the maximum value at around 100 s. Furthermore, it decreases to the minimum value at 370 s, when the crucible runs out of water.
With the increase of the height of sensors, the EMF signals should increase theoretically on the magnitude. During the tapping, Figure 7 showsthe EMF curve at the top is bigger than at the middle and the bottom is minimum. More comparisons of EMF signals and the locations are listed in Table 1. Except the inner wall EMF signals are not similar to those in Figure 7 in three locations, all of the heights are similar to those in Figure 7.
4.1.3. Effect of Refractory Thickness on EMF Signals
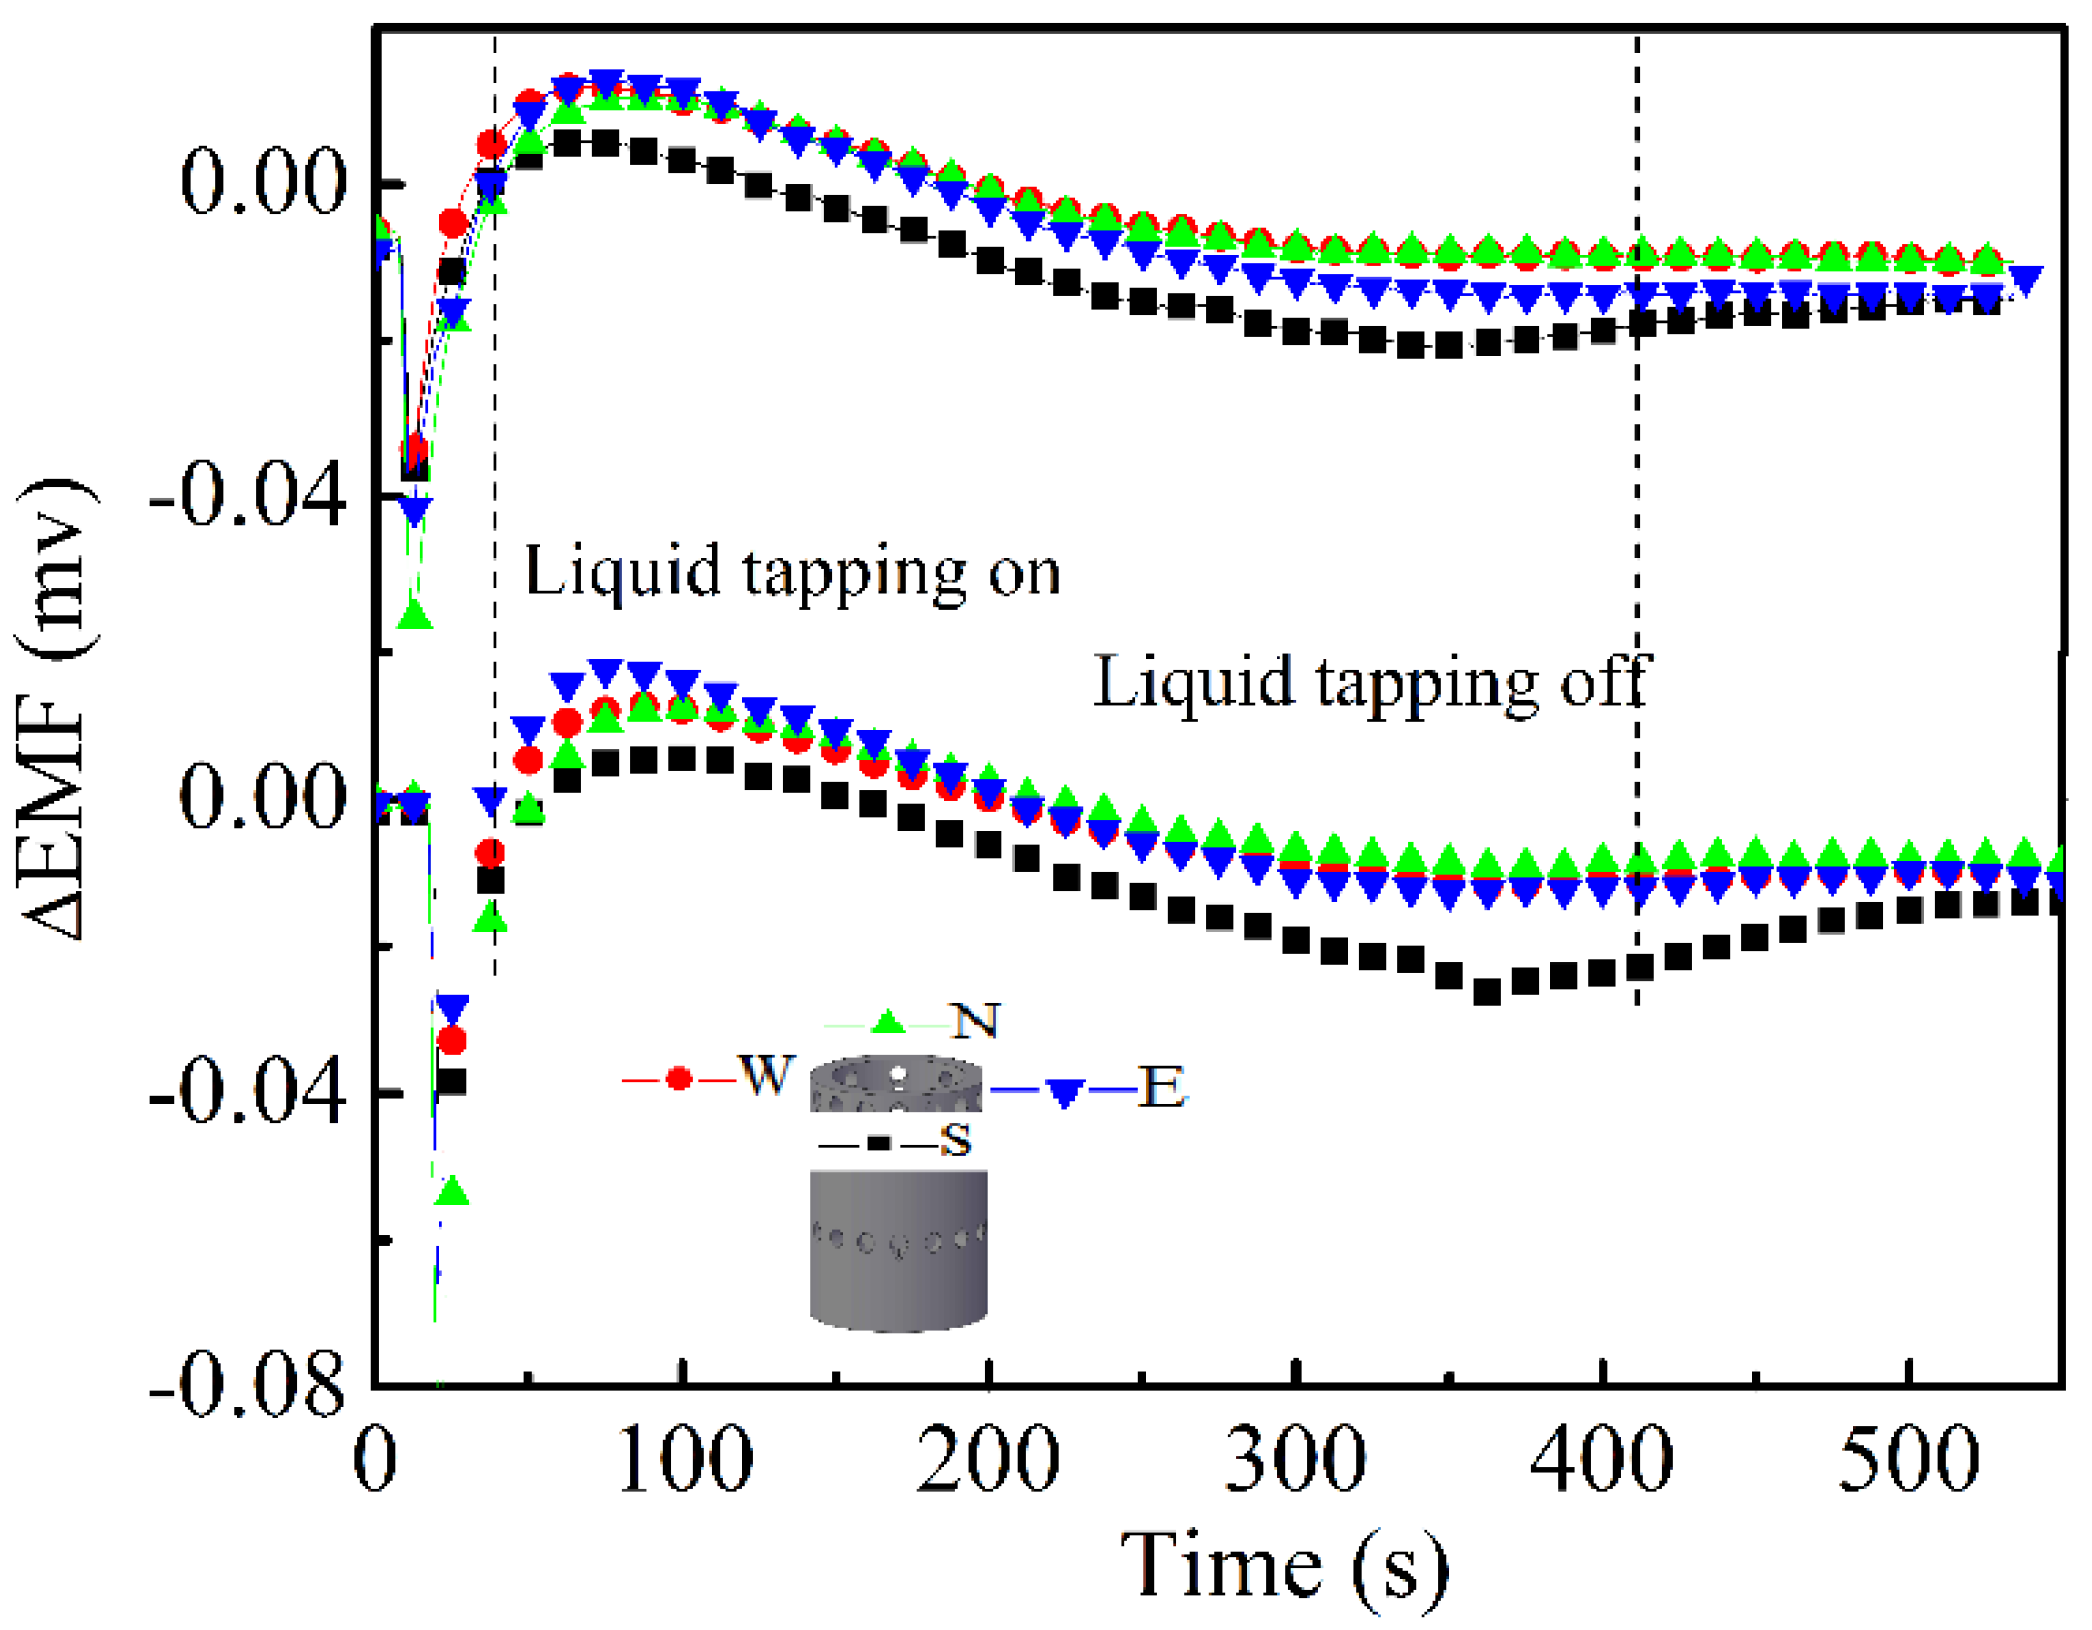
The effects of crucible thickness on EMF signals are shown in Figure 8. With the increase of time, the EMF signals increase then falls at 80 s and a rise again at 350 s. Although the value of the EMF at inner wall and outer wall are normally different, their behavior is generally consistent, that is, they all show the same type of trend with time, cf. Figure 8. Furthermore, the south EMF signals are bigger than other directions and the magnitude of EMF signals on outer wall are smaller than on inner wall, which indicates that the thickness of crucible has resistance on the transport of EMF signals. This phenomenon is also found by other researchers who designed two different kinds of probes: probes in the refractory and probes welded to the shell [15].
More comparisons between EMF signals and the thickness at other directions and locations are illustrated in Table 2. The magnitude of EMF value at inner wall is bigger than outer one and all EMF signals have the similar distributions, whatever the directions and locations of sensors.
4.1.4. Effect of the Sensor Positions along Circumference on EMF Signals
Figure 9 illustratesthe effect of the sensor positions on inner wall along the circumference on the EMF values. The EMF values magnitudes are relatively large from the south (S) and are relatively small from the W, N and E. This indicates that liquid surface is not a horizontal planein tapping process and there is some turbulence near the south. This contributes to the exit of liquid in the south and the flow field significantly changes the thermal state of the south. The similar phenomenon is also found by Lebed, et al. [20],who found the potential difference between diametrically-opposed notches is nearly constant while the level of the melt is descending uniformly. Table 3 is the summary of the EMF signals from other different sensors along the circumference of the graphite crucible. The EMF curves all have the similar distributions on inner and outer wall. Furthermore, the magnitude of EMF signal on the south is the largest and the north is the smallest.
4.1.5. Effect of Different Liquid Medium on EMF Signals
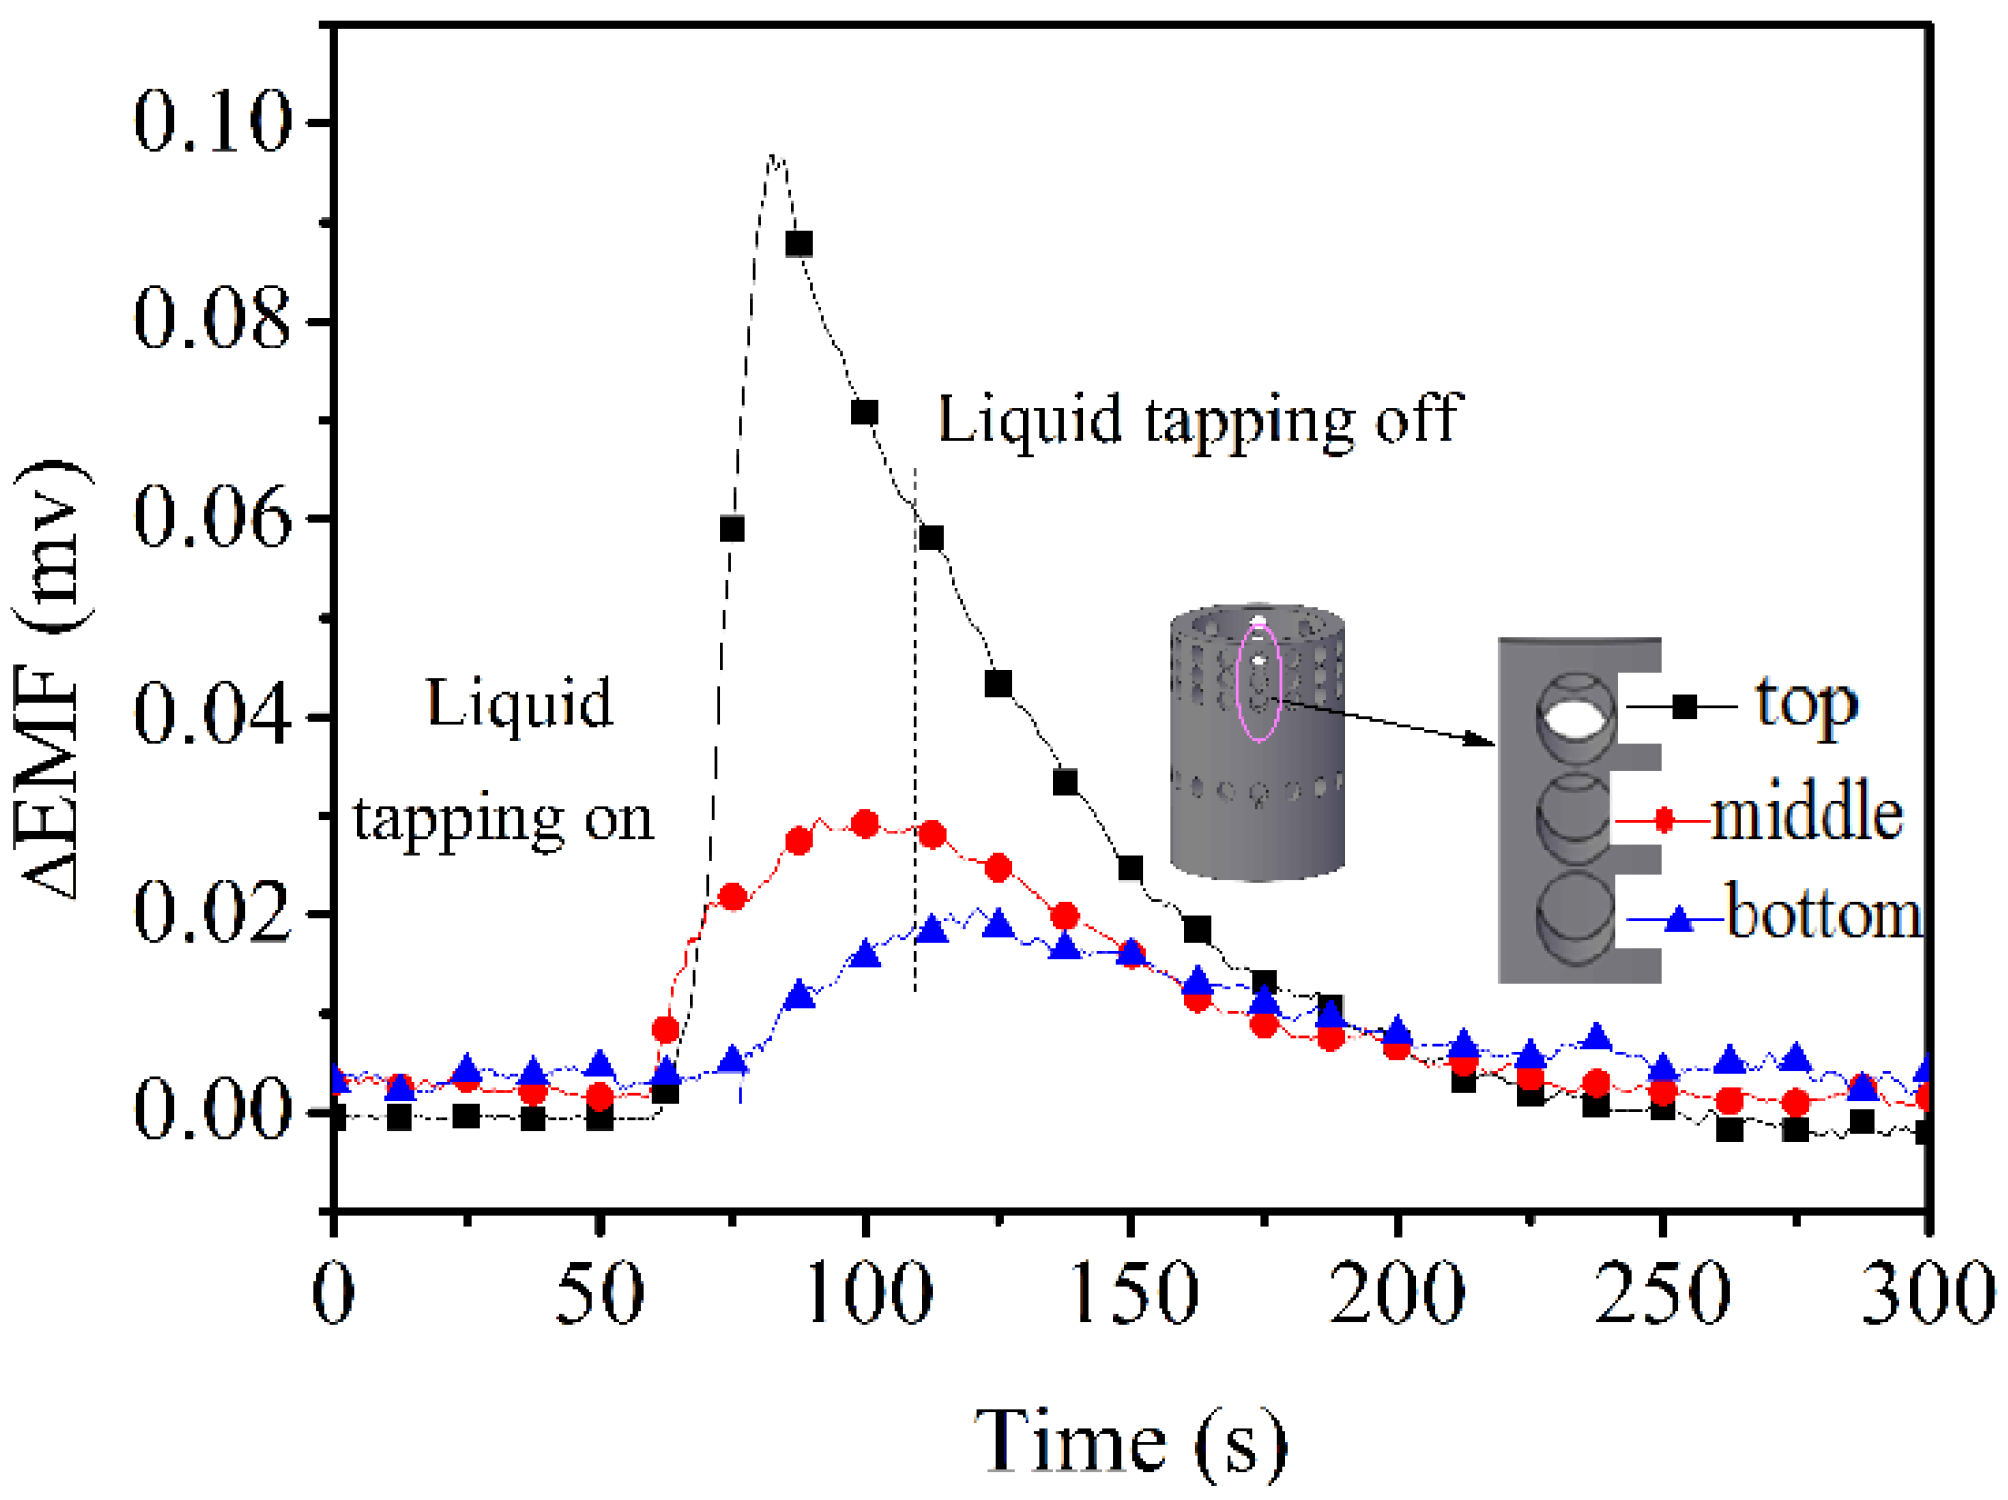
The double layers liquid investigates the effect of multi liquid on EMF signals, which simulates hot metal and molten slag in the hearth. Figure 10 illustrates the effect of two layers of water and oil from inner wall. In the beginning, tapping of water and oil starts at 75 s, the liquid surface decreases and thermal state changes drastically, the liquid level has been completely lower than the exit after 210 s.
By comparing Figure 7 and Figure 10, especially in the tapping process, the order of top, middle and bottom is same between different liquid medium. After dumping the liquids into the crucible, the absolute value of EMF sharply increases and reaches to the maximum since thermoelectric conversion dramatically. The absolute value of EMF in both figures, then, tends to increase to a constant level. Unfortunately, the trend of EMF signal is opposite to Figure 7 in the process of tapping, the result is caused by water and oil different thermoelectric conversion properties.
To further study the problem, the molten tin is selected to carry out the experiment. In Figure 11, during the tapping, the trend of EMF signal is counter-intuitive as compared to the other figures during the liquid tapping. Therefore, the results further prove the hypothesis that liquid thermoelectric conversion properties determine the EMF signal trend. In addition, the orders of top, middle and bottom are generally consistent with respect to different liquid mediums, while comparing with Figure 11, Figure 7 and Figure 10.
4.1.6. Reproducibility of EMF Signals
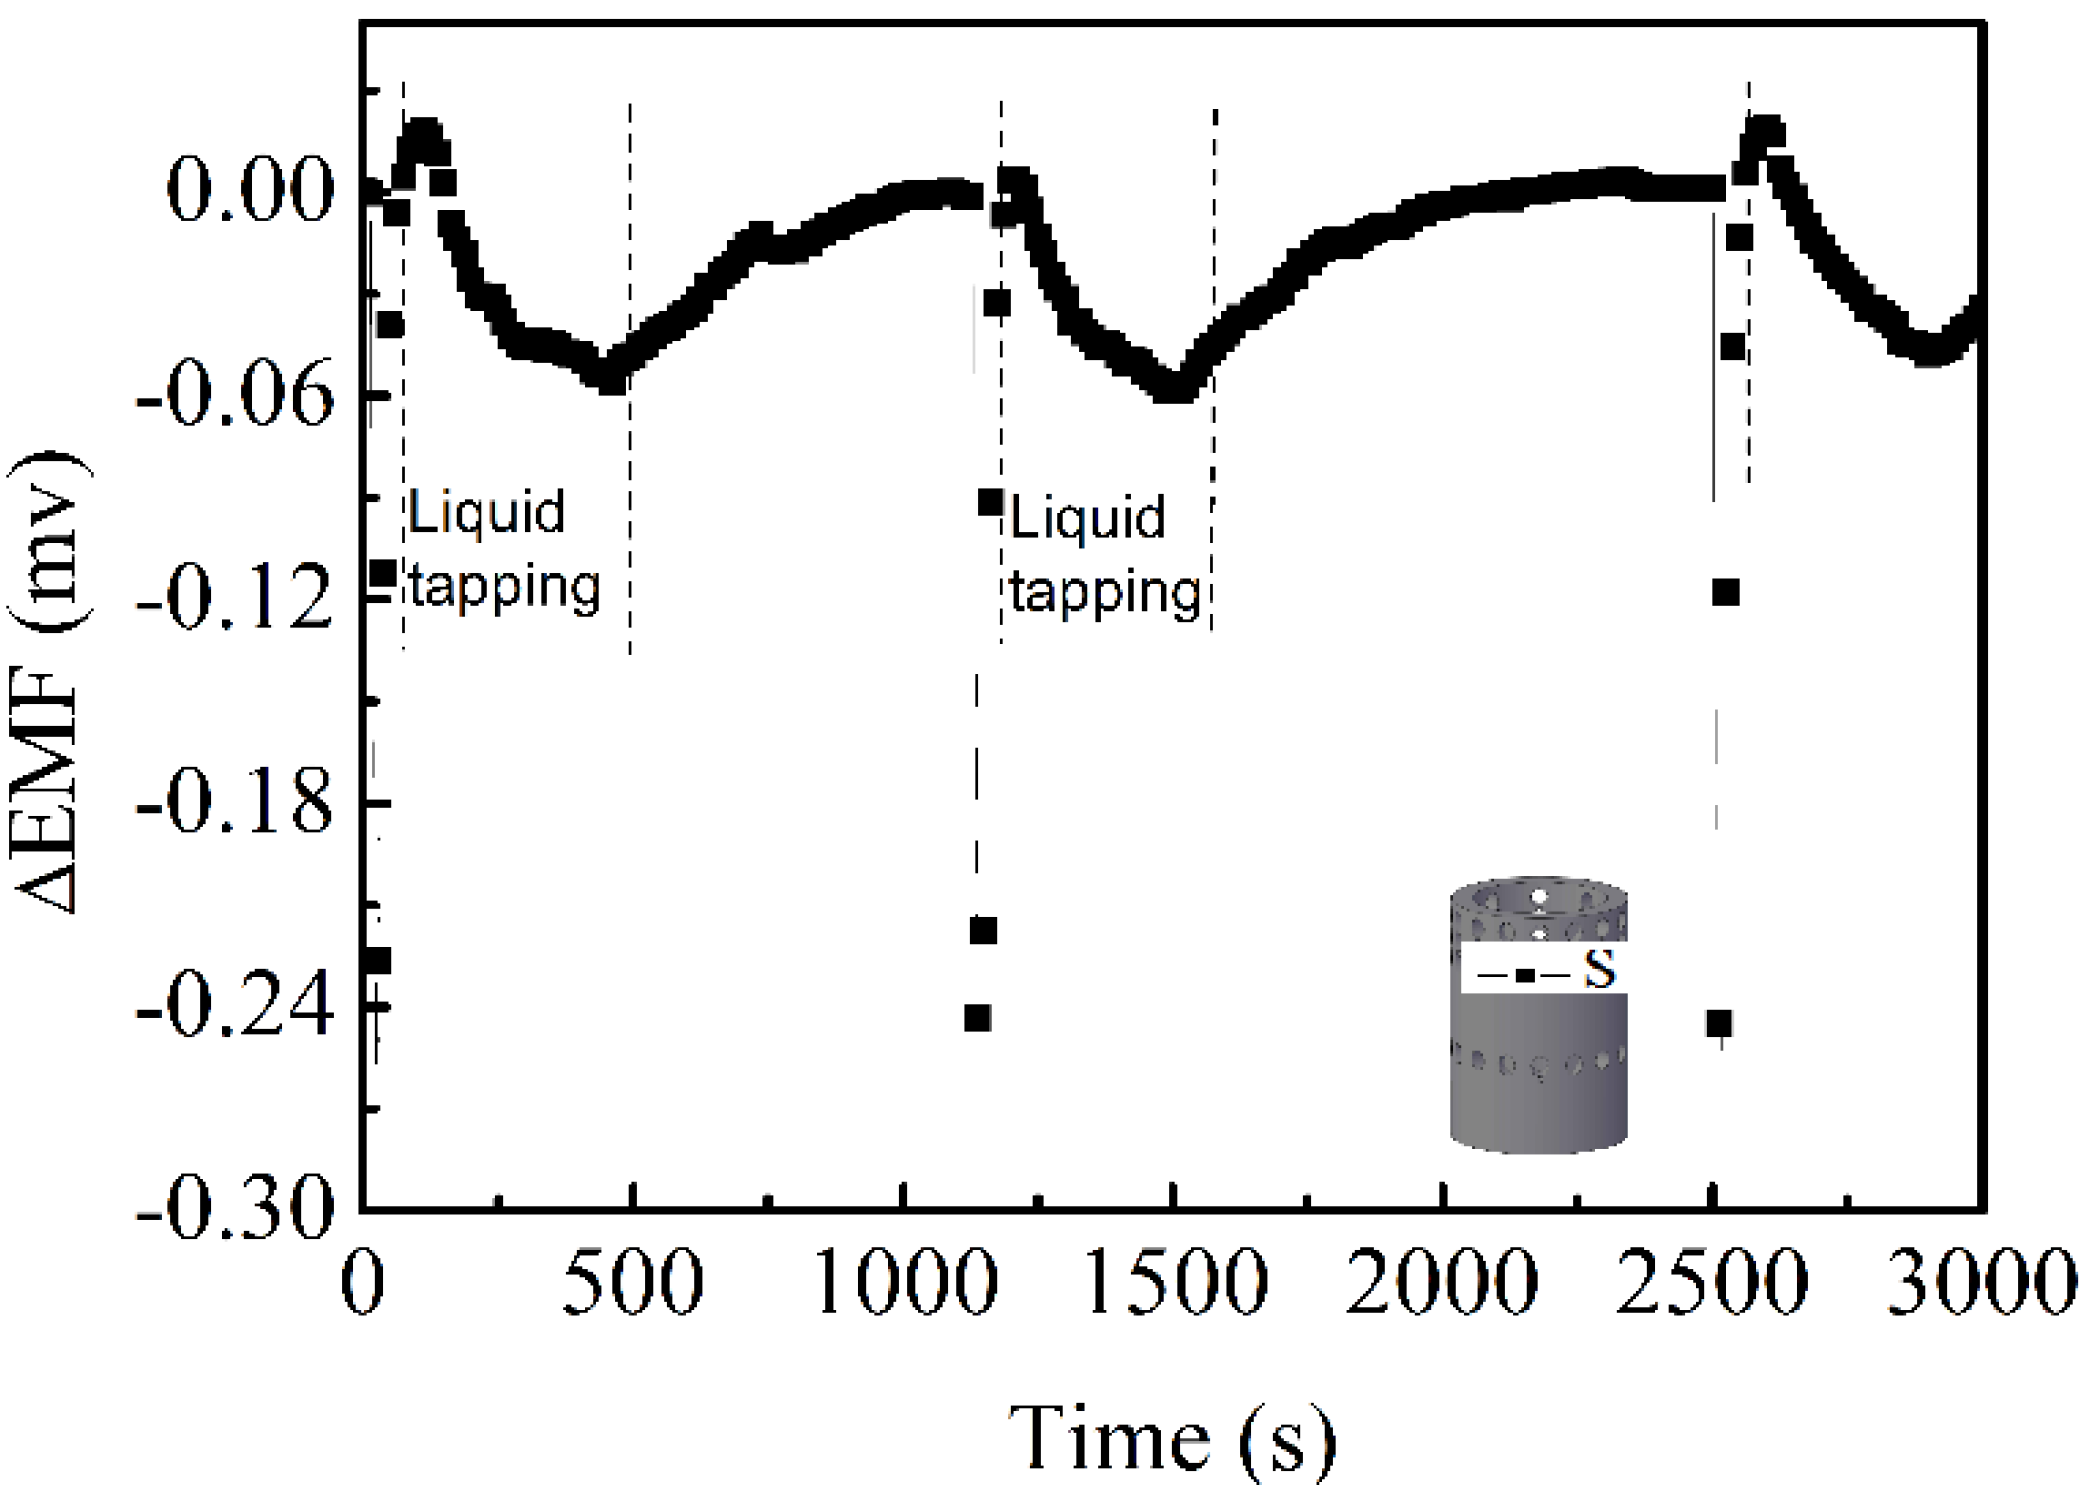
The EMF value from 3 times experiment is shown in Figure 12. The evolution of EMF value shows a high degree similarity in each tapping cycle, which indicates that EMF signal can reproduce the same data in the same tapping conditions.
Combining the results from Section 4.1.2 and Section 4.1.4, the EMF values are both different on the height and on the circumferential direction. The latter indicates the state of liquid surface during tapping, which relates with the state of dead man and the liquid level at the local taphole region. The effects of different thickness of graphite crucible on EMF signals prove that EMF sensors can install on the shell of blast furnace to get the hearth liquid level information as well as protect the EMF sensors.
4.2. Torpedo Ladle Experiment
4.2.1. Effect of the Height of Sensor Location on EMF Signals
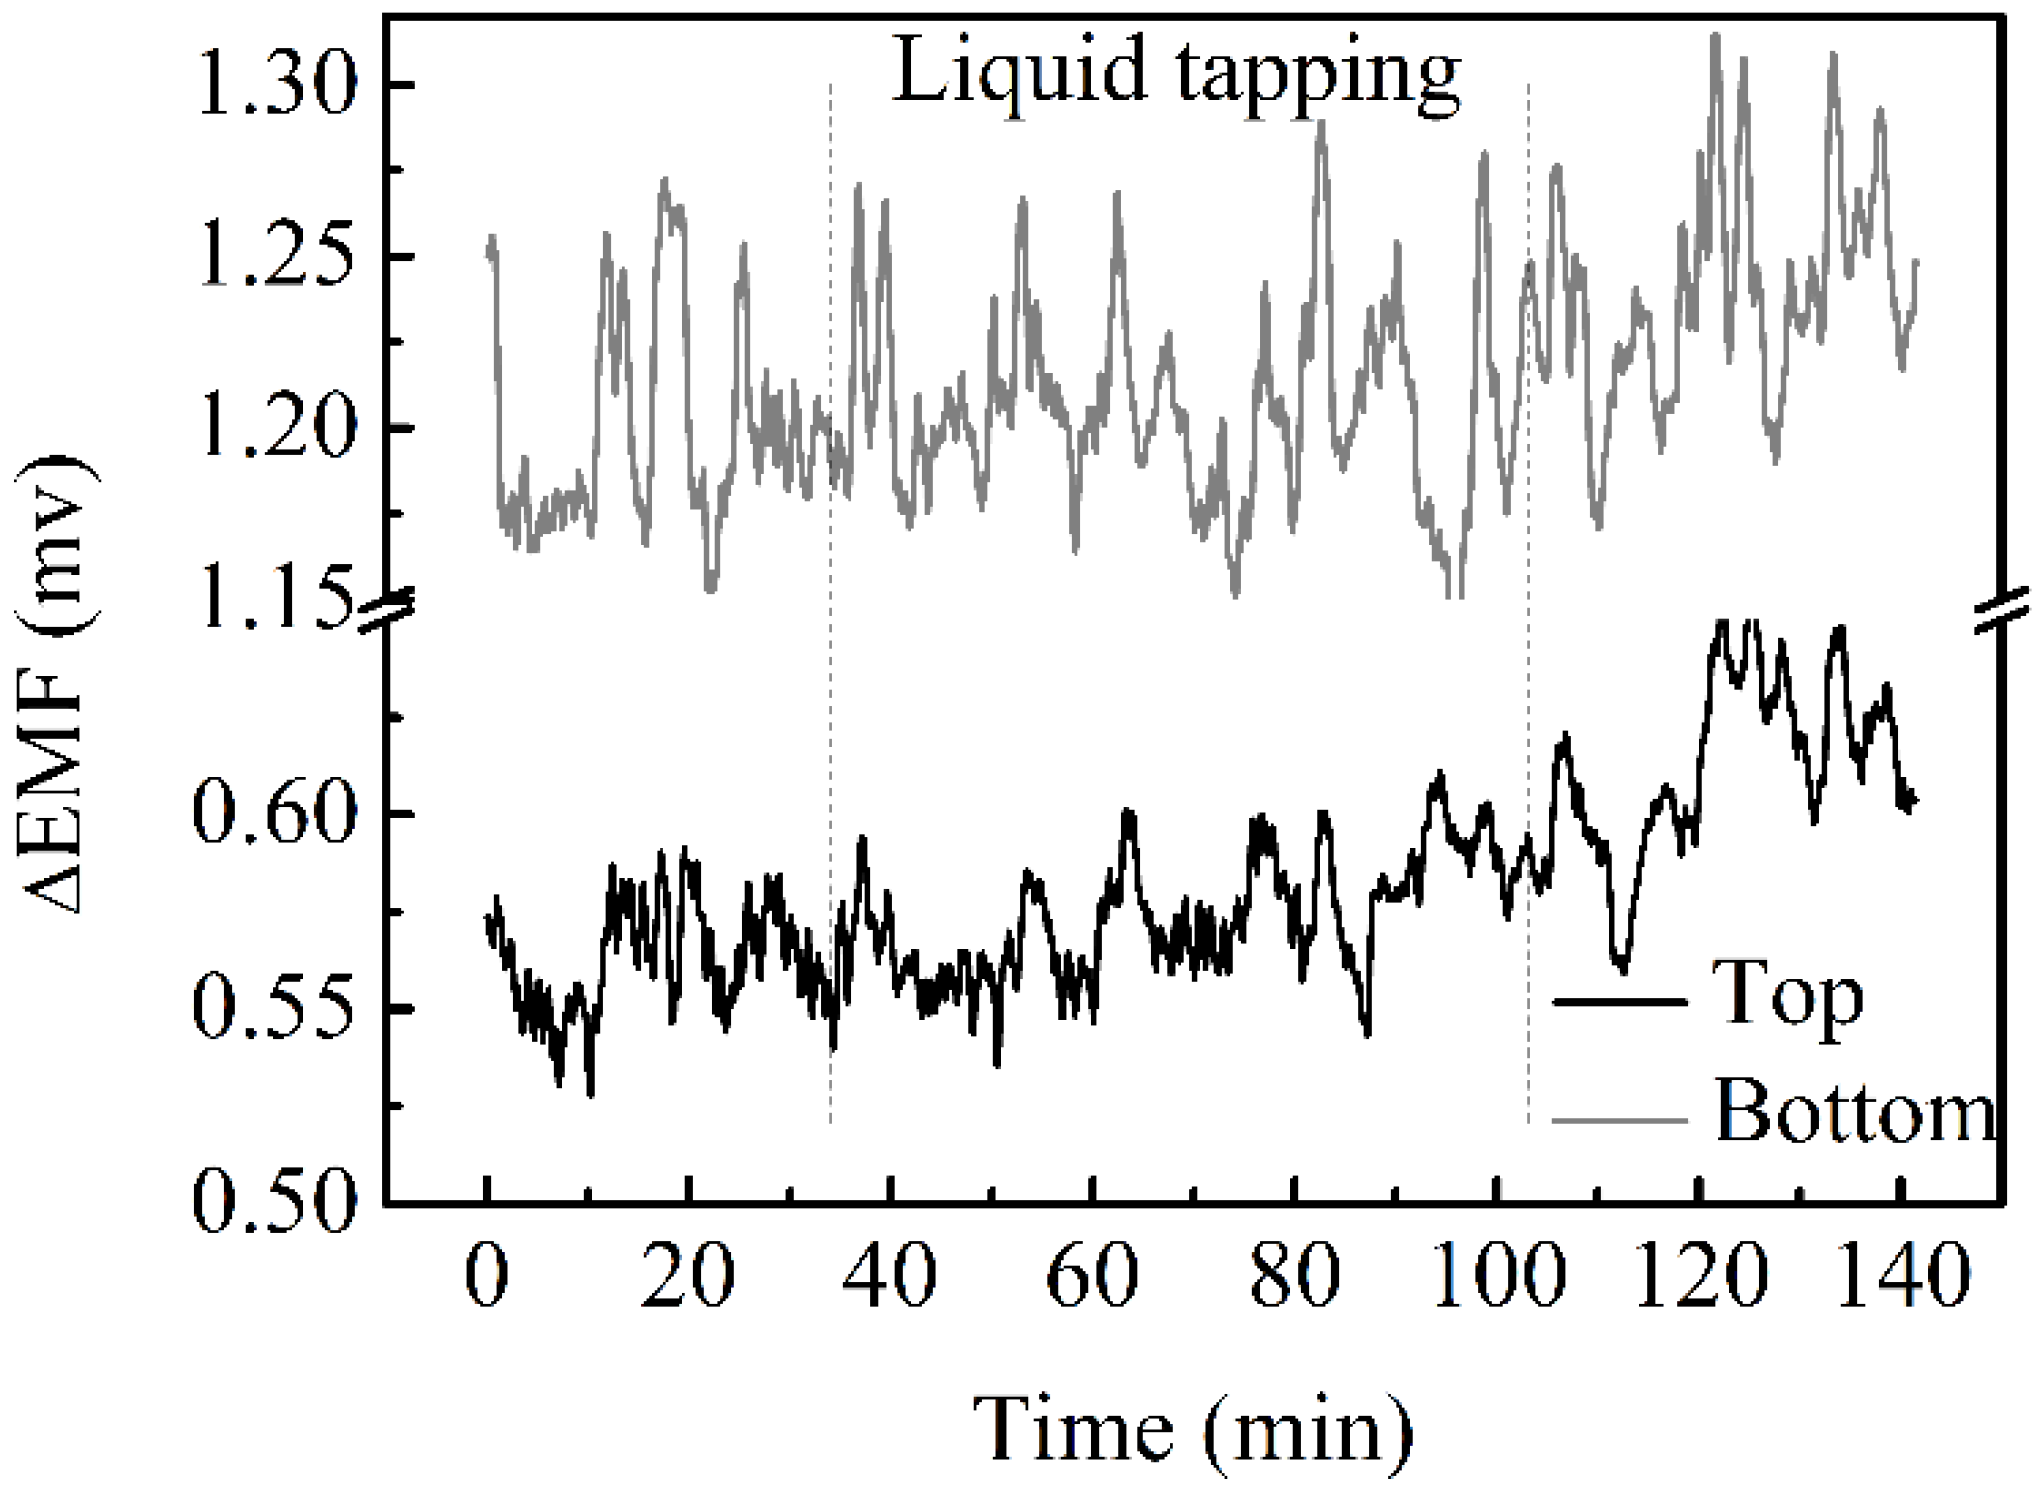
The EMF signal of torpedo ladle experiment includes the noises from the surroundings, therefore the practical EMF data fluctuates in a range. In Figure 13, the tapping time of hot metal is between 34.1 min to 103.2 min. The trend of the curves increases with increasing time, because the liquid level just rises when the torpedo ladle receives hot metal, due to no taphole on the torpedo. The EMF signal increases after the end of the tapping process, because the flowing hot metal improves the dynamic conditions of the reaction inside the torpedo ladle, therefore, the energy is released by the chemical reaction increases and it takes some time for heat to transfer to the wall. The EMF value of the bottom is greater than the top one, the reason may be that the bottom refractory material erodes seriously by the hot metal, the wall of bottom, thus, is thinner than the top.
4.2.2. Effect of Refractory Thickness on EMF Signals
In Figure 14, EMF signal at deep32 and deep20 locations increase both with the increase of liquid level. Moreover, the sensor’s EMF signal at deep32 larger than sensor’s EMF signal at deep20 which indicates the potential of the EMF technology can be used to measure lining thickness of torpedo ladle.
5. Conclusions
This article tries to apply the EMF on monitoring liquid level of a laboratory scale of blast furnace hearth using a single layer of water and double layer of water and oil, laboratory experiment results, then, are convinced by torpedo ladle experiment. Based on the results of laboratory experiment and torpedo ladle experiment, the following conclusions can be highlighted.
- (1)
- The liquid level has the same trend as the EMF signal in the tapping process and the EMF signal can characterize the liquid level, which indicates that the EMF signal can characterize the liquid level in the hearth of the blast furnace. The EMF signals are both different in height and in the circumferential direction of the inner and outer walls, where the circumferential difference explains the state of liquid surface.
- (2)
- The EMF signals on the shallow position are similar to those on the deep position, which means that the thickness of the refractory only influences the EMF signal magnitude in a limited way; it indicates that EMF sensors can be installed on the shell of blast furnace and this suggests the potential for EMF technology in measuring lining thickness.
- (3)
- The torpedo ladle experiment further shows that the position and depth of the EMF sensor will have a large impact on the signal but the different position sensors all can characterize the change of liquid level.
6. Future Work
The coming research will concentrate on the impact of various refractory materials on the EMF signal and the relationship of the thickness of refractory material and the magnitude of EMF signal. Scaling up to actual blast furnace, furthermore, is the next target. Before that, some issues are needed to be solved, for example, effect of the pressure of gas in blast furnace on EMF signal and design of EMF measurement sensor which can install stably on the shell or refractory of hearth and collect the signals in extreme conditions.
Author Contributions
Y.Y., Y.L. and L.Z. designed the experiments; Y.L. and L.Z. performed the experiments; Y.L., Y.Y., Y.G. and H.W. analyzed and discussed the data; Z.Z., C.B. and K.L. provided guidance for the experiment; Y.L. and Y.Y. wrote the paper.
Funding
This work was financially supported by The Program for Professor of Special Appointment (Eastern Scholar) at Shanghai Institutions of Higher Learning (No.TP2015039).
Conflicts of Interest
The authors declare no conflict of interest.
References
- Ruiz-Bustinza, I.; Antoranz, J.C.; Mochón, J.; Rodriguez, D.; Parra, R.; Verdeja, L.F.; Martin, R. New techniques to detect the suitable time to close the tap hole of a blast furnace. Steel Res. Int. 2012, 83, 783–790. [Google Scholar] [CrossRef]
- Brännbacka, J.; Saxén, H. Novel model for estimation of liquid levels in the blast furnace hearth. Chem. Eng. Sci. 2004, 59, 3423–3432. [Google Scholar] [CrossRef]
- Agrawal, A.; Kor, S.C.; Nandy, U.; Choudhary, A.R.; Tripathi, V.R. Real-time blast furnace hearth liquid level monitoring system. Ironmak. Steelmak. 2016, 43, 550–558. [Google Scholar] [CrossRef]
- Ito, T.; Yotsuji, J.; Nagamune, A. Development of pig iron and molten slag level measurement technique for blast furnace. Trans. Iron Steel Inst. Jpn. 2012, 54, 2618–2622. [Google Scholar] [CrossRef]
- Duarte, R.M.; Ruizbustinza, I.; Carrascal, D.; Verdeja, L.F.; Mochón, J.; Cores, A. Monitoring and control of hearth refractory wear to improve blast furnace operation. Ironmak. Steelmak. 2013, 40, 350–359. [Google Scholar] [CrossRef]
- Gomes, F.S.V.; Salles, J.L.F.; Wasem, L.A. A new prediction model for liquid level in blast furnaces based on time series analysis. In Proceedings of the IEEE International Conference on Control and Automation, Santiago, Chile, 19–21 December 2011; pp. 772–777. [Google Scholar]
- Alter, M.A.; Brunner, J.M.; Holmes, D.J. Continuous monitoring of liquid level and thermal state in the hearth based on measurement of emf on the blast furnace shell. Iron Steel Technol. 2013, 10, 43–50. [Google Scholar]
- Radilov, S. Electrical current in the blast furnace and its use for blast furnace monitoring. Stal 1985, 3, 9–11. [Google Scholar]
- Torrkulla, J.; Brännbacka, J.; Saxén, H.; Waller, M. Indicators of the internal state of the blast furnace hearth. ISIJ Int. 2002, 42, 504–511. [Google Scholar] [CrossRef]
- Hattink, M.; van der Stel, J.; Lecacheux, B. Determination of Factors Influencing the Deadman Position and Evaluation of Its Impacton Blast Furnace Lifetime; Publications Office of the European Union: Luxembourg, 2011; pp. 21–37. [Google Scholar]
- Brännbacka, J.; Torrkulla, J.; Saxén, H. Simple simulation model of blast furnace hearth. Ironmak. Steelmak. 2005, 32, 479–486. [Google Scholar] [CrossRef]
- Sau, D.C.; Sengupta, R.; Bandopadhyay, D. Development of Model for the Estimation of Coke Bed Voidage and the Liquid Levels in the Blast Furnace Hearth; CSIR: New Delhi, India, 2011. [Google Scholar]
- Shao, L.; Saxén, H. Model of blast furnace hearth drainage. Steel Res. Int. 2012, 83, 197–204. [Google Scholar] [CrossRef]
- Gomes, F.S.V.; Côco, K.F.; Salles, J.L.F. Multistep forecasting models of the liquid level in a blast furnace hearth. IEEE Trans. Autom. Sci. Eng. 2017, 14, 1286–1296. [Google Scholar] [CrossRef]
- Sancho, L.F.; Chust, R.P.; Carrascal, D. New technique for abnormal casting identification in a blast furnace. Rev. Met. Paris 2012, 104, 23–28. [Google Scholar] [CrossRef]
- Uchida, K.; Takahashi, S.; Harii, K.; Ieda, J.; Koshibae, W.; Ando, K.; Maekawa, S.; Saitoh, E. Observation of the spin seebeck effect. Nature 2008, 455, 778–781. [Google Scholar] [CrossRef] [PubMed]
- Maekawa, S.; Tohyama, T.; Barnes, S.E.; Ishihara, S.; Koshibae, W.; Khaliullin, G. Physics of Transition Metal Oxides; Springer Science & Business Media: New York, NY, USA, 2004; Volume 144. [Google Scholar]
- Goldsmid, H.J. The Thermoelectric and Related Effects; Springer: Berlin/Heidelberg, Germany, 2010; pp. 1–6. [Google Scholar]
- Zhao, K.Q.; Wu, H.X.; Ni, F.L. Sensors Technology and Engineering Application; China Electric Power Press: Beijing, China, 2012; Volume 2, p. 316. [Google Scholar]
- Lebed’, P.; Safina, L.; Demidenko, T.; Semenko, A.Y.; Pochekailo, I.; Grishchenko, V. Monitoring the distribution of molten smelting products around the hearth of a blast furnace. Metallurgist 1989, 33, 190–191. [Google Scholar] [CrossRef]
Figure 1.
Schematic diagram of water (I) and water oil (II) measuring system.

Figure 2.
Possible electrical circuit proposal of that which occurs in the torpedo ladle.

Figure 3.
Schematic diagram of EMF mimicking blast furnace hearth and EMF sensors.

Figure 4.
EMF signal and image acquisition system during tapping (N,S,W and E mean north, south, west and east respectively in this paper).
Figure 4.
EMF signal and image acquisition system during tapping (N,S,W and E mean north, south, west and east respectively in this paper).

Figure 5.
Torpedo ladle and measurement positions.

Figure 6.
Evolution of liquid level and EMF signals during water tapping.

Figure 7.
Effect of the height of sensor locations on EMF signals along south direction at inner wall.
Figure 7.
Effect of the height of sensor locations on EMF signals along south direction at inner wall.

Figure 8.
EMF signals around the circumference at outer wall (top) and inner wall (bottom) along south direction.
Figure 8.
EMF signals around the circumference at outer wall (top) and inner wall (bottom) along south direction.

Figure 9.
Effect of the sensor positions on inner wall along the circumference on EMF signals.

Figure 10.
EMF signals of two layers of water oil from inner wall.

Figure 11.
EMF signals of molten tin from inner wall.

Figure 12.
EMF signals on inner wall in three tapping cycles.

Figure 13.
Effect of the height of sensor location on EMF signals.

Figure 14.
EMF signals at different depth in the same location.


Table 1.
Summary of EMF signals at different locations at inner wall and outer wall.
| Position of Sensors | Inner Wall | Outer Wall | ||
|---|---|---|---|---|
| EMF Curve | EMF Value | EMF Curve | EMF Value | |
| S | √ | √ | √ | √ |
| W | √ | × | √ | √ |
| N | √ | × | √ | √ |
| E | √ | × | √ | √ |
Table 2.
Summary of EMF signals on the same vertical line at different wall thickness.
| Position of Sensors | Top | Middle | Bottom | |||
|---|---|---|---|---|---|---|
| Similarity of EMF Curve between Inner and Outer | EMF Value on inner Wall Bigger | Similarity of EMF Curve between Inner and Outer | EMF Value on Inner Wall Bigger | Similarity of EMF Curve between Inner and Outer | EMF Value on Inner Wall Bigger | |
| S | √ | √ | √ | √ | √ | √ |
| W | √ | √ | √ | √ | √ | √ |
| N | √ | √ | √ | √ | √ | √ |
| E | √ | √ | √ | √ | √ | √ |
Table 3.
Summary results of different local part sensors along the circumference of the graphite crucible.
Table 3.
Summary results of different local part sensors along the circumference of the graphite crucible.
| The Position of EMF Curve and EMF Value | Sensors on the Top | Sensors on the Middle | Sensors on the Bottom |
|---|---|---|---|
| EMF curve distribution on inner wall | √ | √ | √ |
| Order of EMF value on inner wall | S > E > W > N | S > E > W > N | S > E > W > N |
| EMF curve distribution on inner wall | √ | √ | √ |
| Order of EMF value on outer wall | S > E > W > N | S > E > W > N | S > E > W > N |
Table 4.
Summary of EMF signals from water and oil at different locations on inner wall and outer wall.
© 2018 by the authors. Licensee MDPI, Basel, Switzerland. This article is an open access article distributed under the terms and conditions of the Creative Commons Attribution (CC BY) license (http://creativecommons.org/licenses/by/4.0/).
Share and Cite
MDPI and ACS Style
Li, Y.; Zan, L.; Ge, Y.; Wei, H.; Zhang, Z.; Bi, C.; Lu, K.; Yu, Y. Monitoring Liquid Level of Blast Furnace Hearth and Torpedo Ladle by Electromotive Force Signal. Metals 2018, 8, 665. https://doi.org/10.3390/met8090665
AMA Style
Li Y, Zan L, Ge Y, Wei H, Zhang Z, Bi C, Lu K, Yu Y. Monitoring Liquid Level of Blast Furnace Hearth and Torpedo Ladle by Electromotive Force Signal. Metals. 2018; 8(9):665. https://doi.org/10.3390/met8090665
Chicago/Turabian StyleLi, Ying, Lei Zan, Yao Ge, Han Wei, Zhenghao Zhang, Chuanguang Bi, Kaicheng Lu, and Yaowei Yu. 2018. "Monitoring Liquid Level of Blast Furnace Hearth and Torpedo Ladle by Electromotive Force Signal" Metals 8, no. 9: 665. https://doi.org/10.3390/met8090665
Note that from the first issue of 2016, this journal uses article numbers instead of page numbers. See further details here.