
Performances of Green and Eco-Friendly Ramming Pastes in EGA Pots †

1
Carbone Savoie, Venissieux 69631 Cedex, France
2
Emirates Global Aluminium (EGA), Dubai 3627, United Arab Emirates
*
Author to whom correspondence should be addressed.
†
Contents of this paper also appear in the International Committee for Study of Bauxite, Alumina&Aluminium (ICSOBA) 2015, Dubai, United Arab Emirates, 29 November–1 December 2015.
Metals 2016, 6(5), 112; https://doi.org/10.3390/met6050112
Submission received: 18 March 2016
/
Revised: 22 April 2016
/
Accepted: 6 May 2016
/
Published: 13 May 2016
(This article belongs to the Special Issue Selected Papers from the International Committee for Study of Bauxite, Alumina&Aluminium 2015)
Abstract
:Consistent and high quality ramming paste products, installed according to optimized procedures, are required for improved operation and longer pot life. However, ramming paste used to be a hazardous product and needs special precautions for handling and application. A 100% eco-friendly cold ramming paste has been developed by Carbone Savoie and tested at Emirates Global Aluminium (EGA) sites. A test has also been developed by Carbone Savoie to follow-up, identify and quantify emissions during the baking of paste up to 1000 °C. Physico-chemical characteristics of various pastes are presented, together with their composition in polycyclic aromatic hydrocarbons (PAH) and volatile organic compounds (VOC), determined by an accredited laboratory and the results of emissions during paste baking. The results of pot operation at the EGA sites show no harmful impact on pot preheat, early operation, or regular operation performance. Pot performance data are given for comparison. The new paste offers a green and clean alternative to harsh chemicals typically associated with the industry.
1. Introduction
Ramming paste plays an important role in the pot, ensuring pot tightness regarding metal infiltration at the block/paste interface. The installation of ramming paste is a heavy operation that could lead to technical and quality issues, as well as health, safety, and environmental issues. In recent years, ramming paste producers have developed eco-friendly (EF) products to reduce polycyclic aromatic hydrocarbons (PAH) content and Carbone Savoie has been the first to introduce a 100% clean paste, which has been used at Emirates Global Aluminium (EGA) sites. A test has also been developed by Carbone Savoie to follow-up, identify and quantify emissions during the baking of paste up to 1000 °C.
Several pastes used at EGA’s sites (Dubal and Emal) were fully characterized to obtain their physico-chemical properties, as well as their composition in PAH and volatile organic compounds (VOC), and their emissions during baking. The results of pot operation at the EGA sites are also presented.
2. Ramming Pastes Presentation
Five types of ramming pastes have been studied in June and July 2015, labelled A, B, C, D, and E. They are either 100% anthracitic pastes or semi-graphitic, and are based on various types of binder, which affects the PAH content of the paste and the emissions during baking. The range of working temperature of the pastes is indicated in Table 1, together with their expiry date. Paste B is NeO2 and paste E is CleO2 of Carbone Savoie.
2.1. Chemical Composition
The five pastes were sent to an accredited external laboratory to evaluate their chemical composition in terms of PAH and VOC. A list of 50 VOCs could be analyzed. The PAH extracted were analyzed by gas chromatography associated with a mass-spectrometer. Table 2 gives the results for 17 PAH, the most commonly measured; together with benzene, toluene, ethylbenzene, xylene (BTEX) and VOC. For VOC, only the species detected in at least one of the pastes, are listed. All the others are below the detection limits.
For pastes B and E, neither PAH nor BTEX could be measured (below the detection limits). Only dichloromethane could be detected, as in all pastes. Dichloromethane is the usual solvent for chemical analyses and these values could correspond to some contamination in the analytical equipment.
Pastes A and C present a rather similar PAH and BTEX profile, with a high amount of acenaphtene, fluorine, and phenantrene (by descending order). Paste D presents the highest level of PAH and BTEX, and also by far the highest level of Benzo(a)pyrene (BaP). The level of BaP shows clearly that B and E are 100% clean pastes; A and C are EF ramming pastes; and paste D is a standard ramming paste based on standard coal tar pitch [1].
An equivalent toxicity factor (ETF) can be calculated based on the knowledge of the health impact of the different PAH molecules [2], by using a relative potency factor (RPF) that gives more weight to the most dangerous molecules. The RPF is given in Table 3, and the results of ETF calculations for pastes A, C, and D are given in Table 4, compared to the typical ETF already published for some pastes [1].
The values of ETF confirm that paste D is close to a standard cold paste based on coal tar pitch binder, whereas pastes A and C are close to EF pastes. The calculation of ETF is, thus, more discriminating than the simple mathematical sum of PAH species.
2.2. Paste Densification
To help in paste comparisons, all pastes were densified at the same temperature of 30 °C, which is intermediate and inside each temperature window (see Table 1). Densification was achieved either with Fischer Sand Rammer (FSR) equipment at 250 strokes, which gives samples of 50 mm diameter and about 50 mm high; or with a hand rammer, which gives samples of 90 mm diameter and about 150 mm high. With the FSR, the amount of paste involved is 180 g, whereas with the hand-rammer it is 1500 g for a standard sample and 1700 g for samples devoted to electrolysis testing.
On the small FSR samples, the green geometrical density and ability of the paste to be densified can be evaluated, together with the N2 index, according to the ISO standard 17544. Some samples were heat-treated at 950 °C to determine the linear expansion curve versus baking temperature. Other samples were used to follow-up the emissions of paste during baking up to 1000 °C.
The large samples densified with a hand-rammer were all baked at 1000 °C to determine physic-chemical properties after baking, some of them being measured at 1000 °C and possibly under electrolysis.
3. Paste Physico-Chemical Properties
3.1. Densification Properties
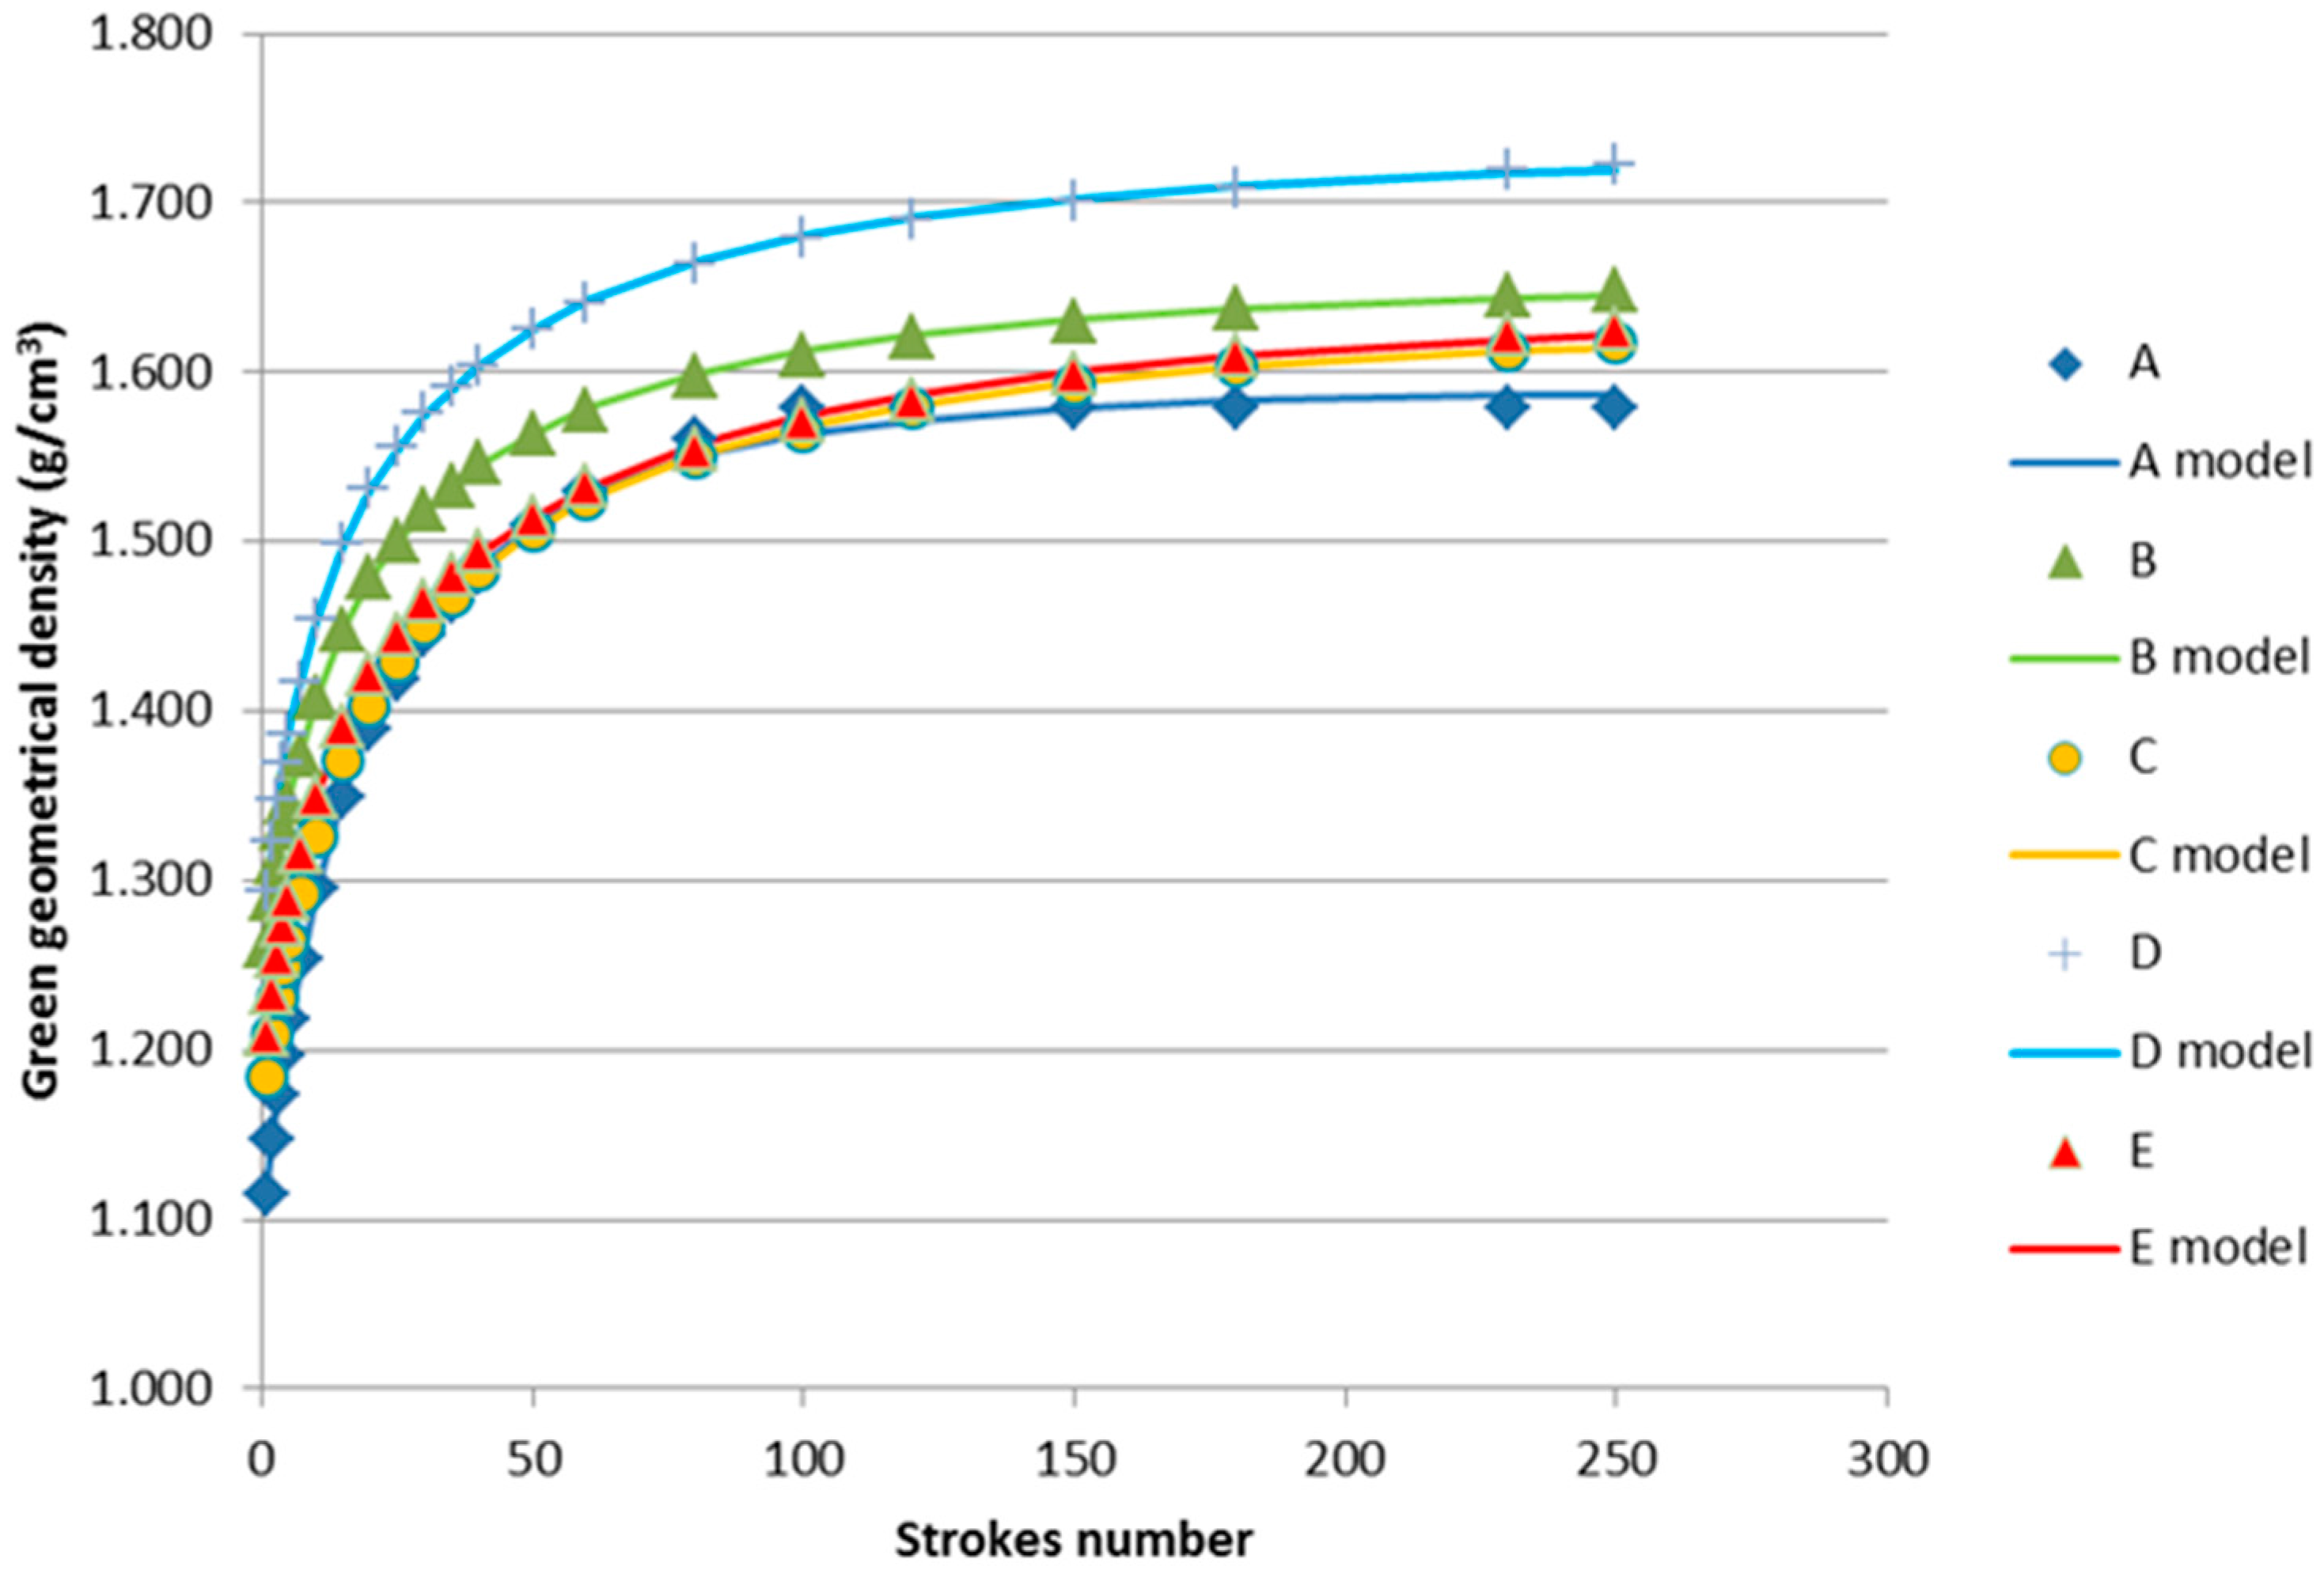
The evolution of green density versus the number of strokes by the FSR equipment is shown in Figure 1 for the five pastes. Two samples per paste were densified, but as the curves for both samples are almost identical, only one has been represented for clarity reason.
A higher density is achieved with paste D, but is similar for the other pastes above 1.600 g/cm3 except for paste A, which has the lowest density. The curve for paste B has a different pattern, with higher densities than the other pastes even for a low number of strokes. These curves can be modeled and from the model, the rammability index N2 and the maximum green density can be determined. The average values calculated from the two curves for each paste are given in Table 5.
Paste A has the lowest rammability index, and paste E, the highest. Paste E may require more energy to become fully densified.
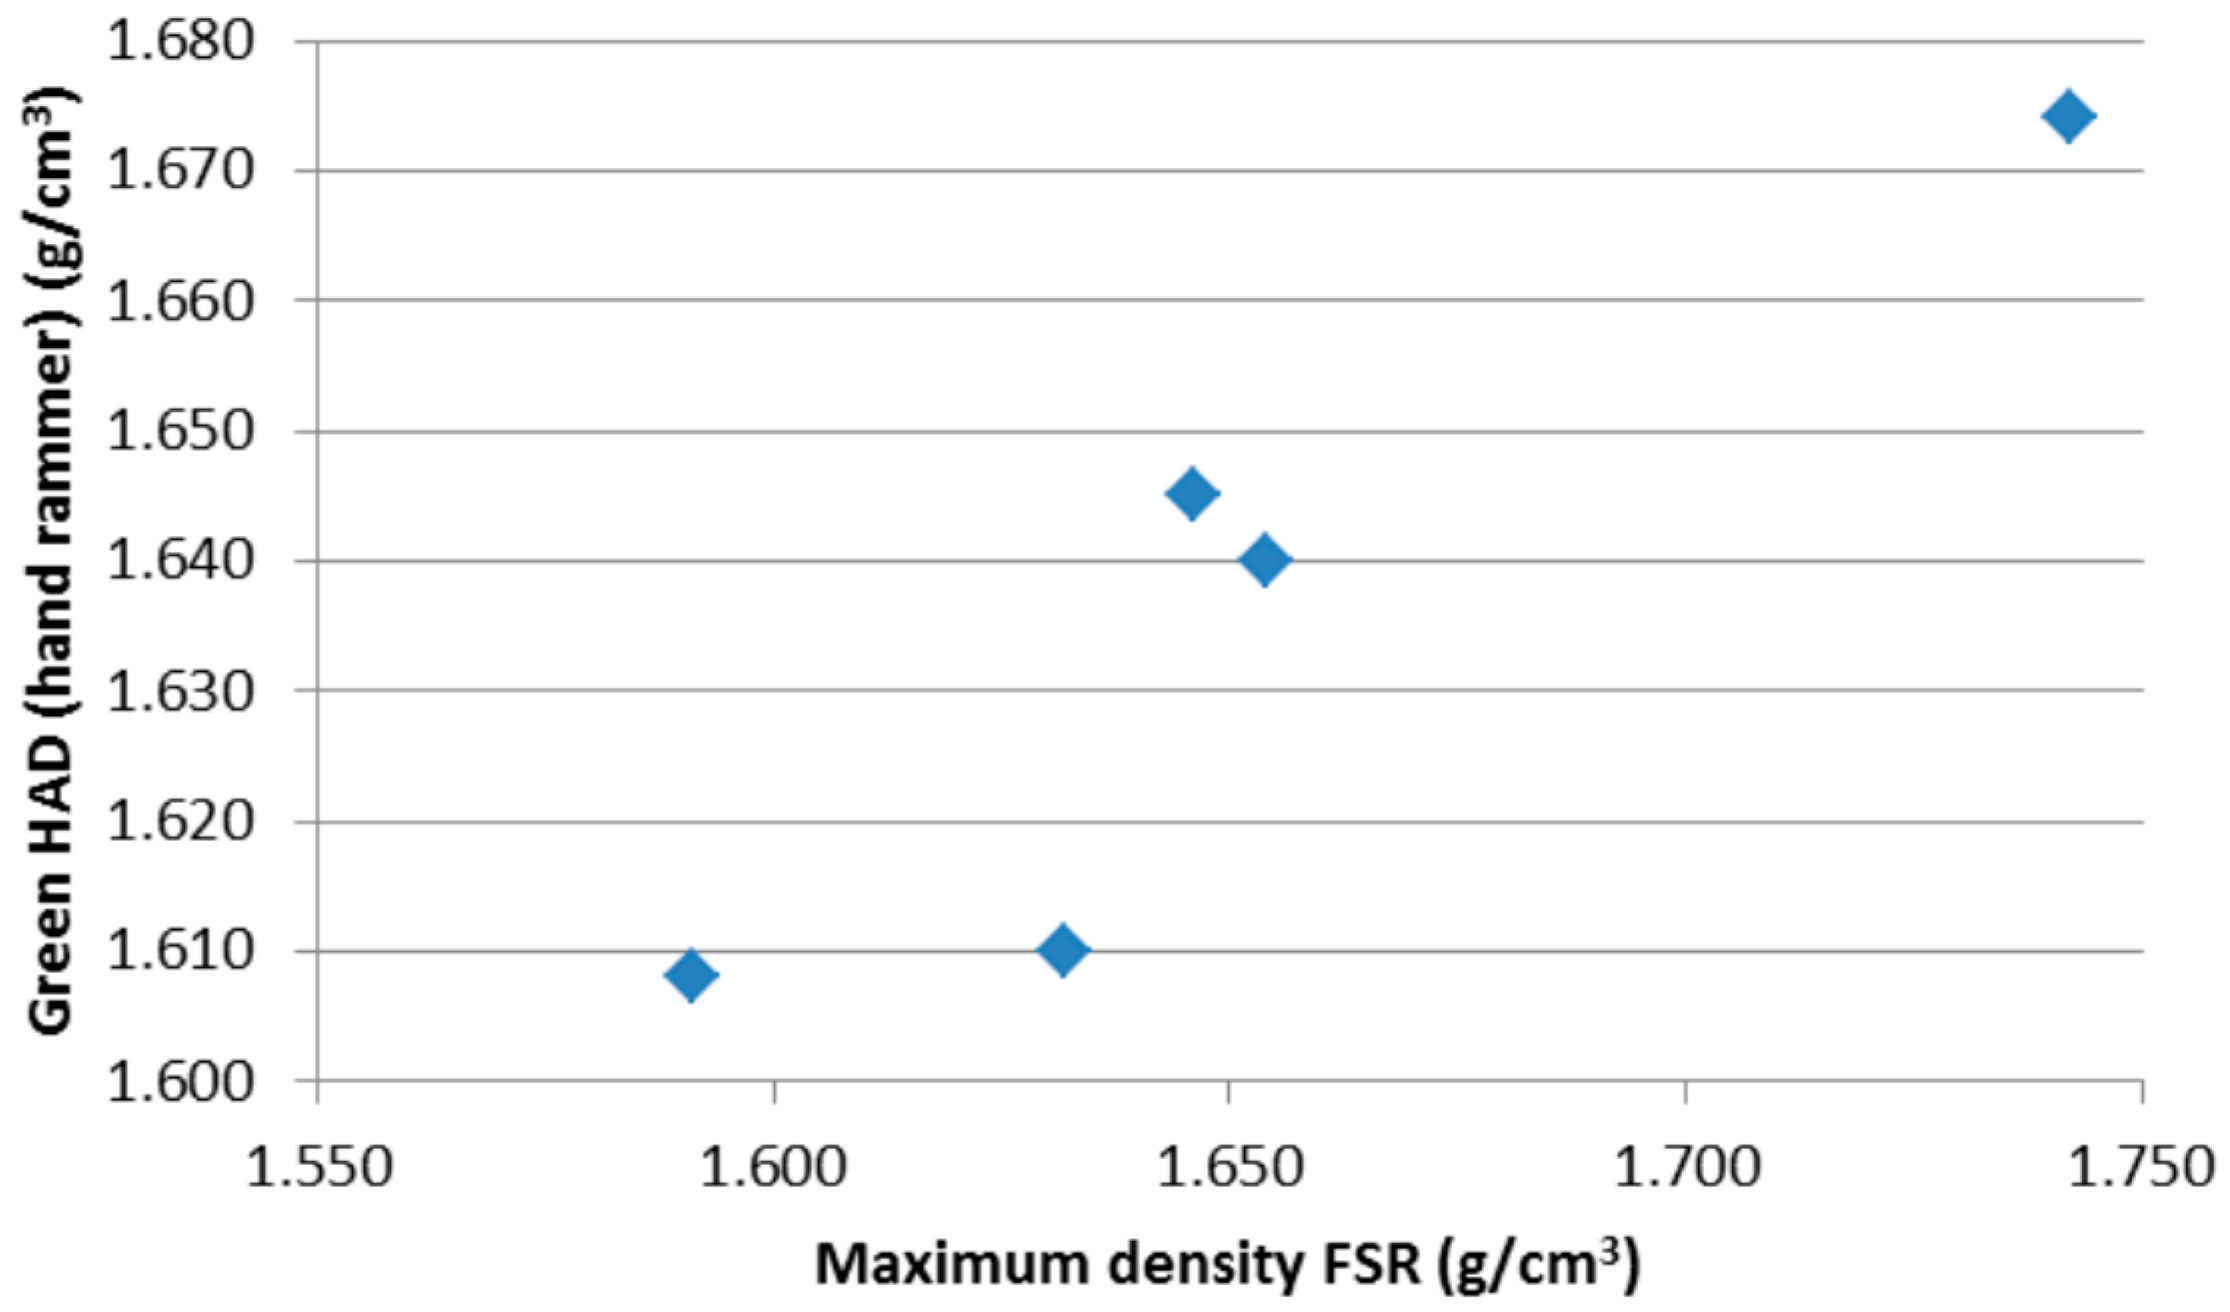
On the larger samples densified by a hand -rammer, the hydrostatic apparent density of pastes was measured at the green stage, again with a good reproducibility between two samples of the same paste. The average values of the two samples for each paste are given in Table 6 and show a good correlation with the maximum density determined with the FSR (Figure 2).
3.2. Properties after Baking
The characteristics of each paste after baking at 1000 °C are given in Table 7. As two samples were densified by hand rammer, the second one (identified by a letter ‘+’) contained a larger amount of paste to perform electrolysis tests, and some measurements of density and volumetric expansion were performed on each individual sample, and both values are given in Table 7. The other characteristics have been measured on cores taken from the samples.
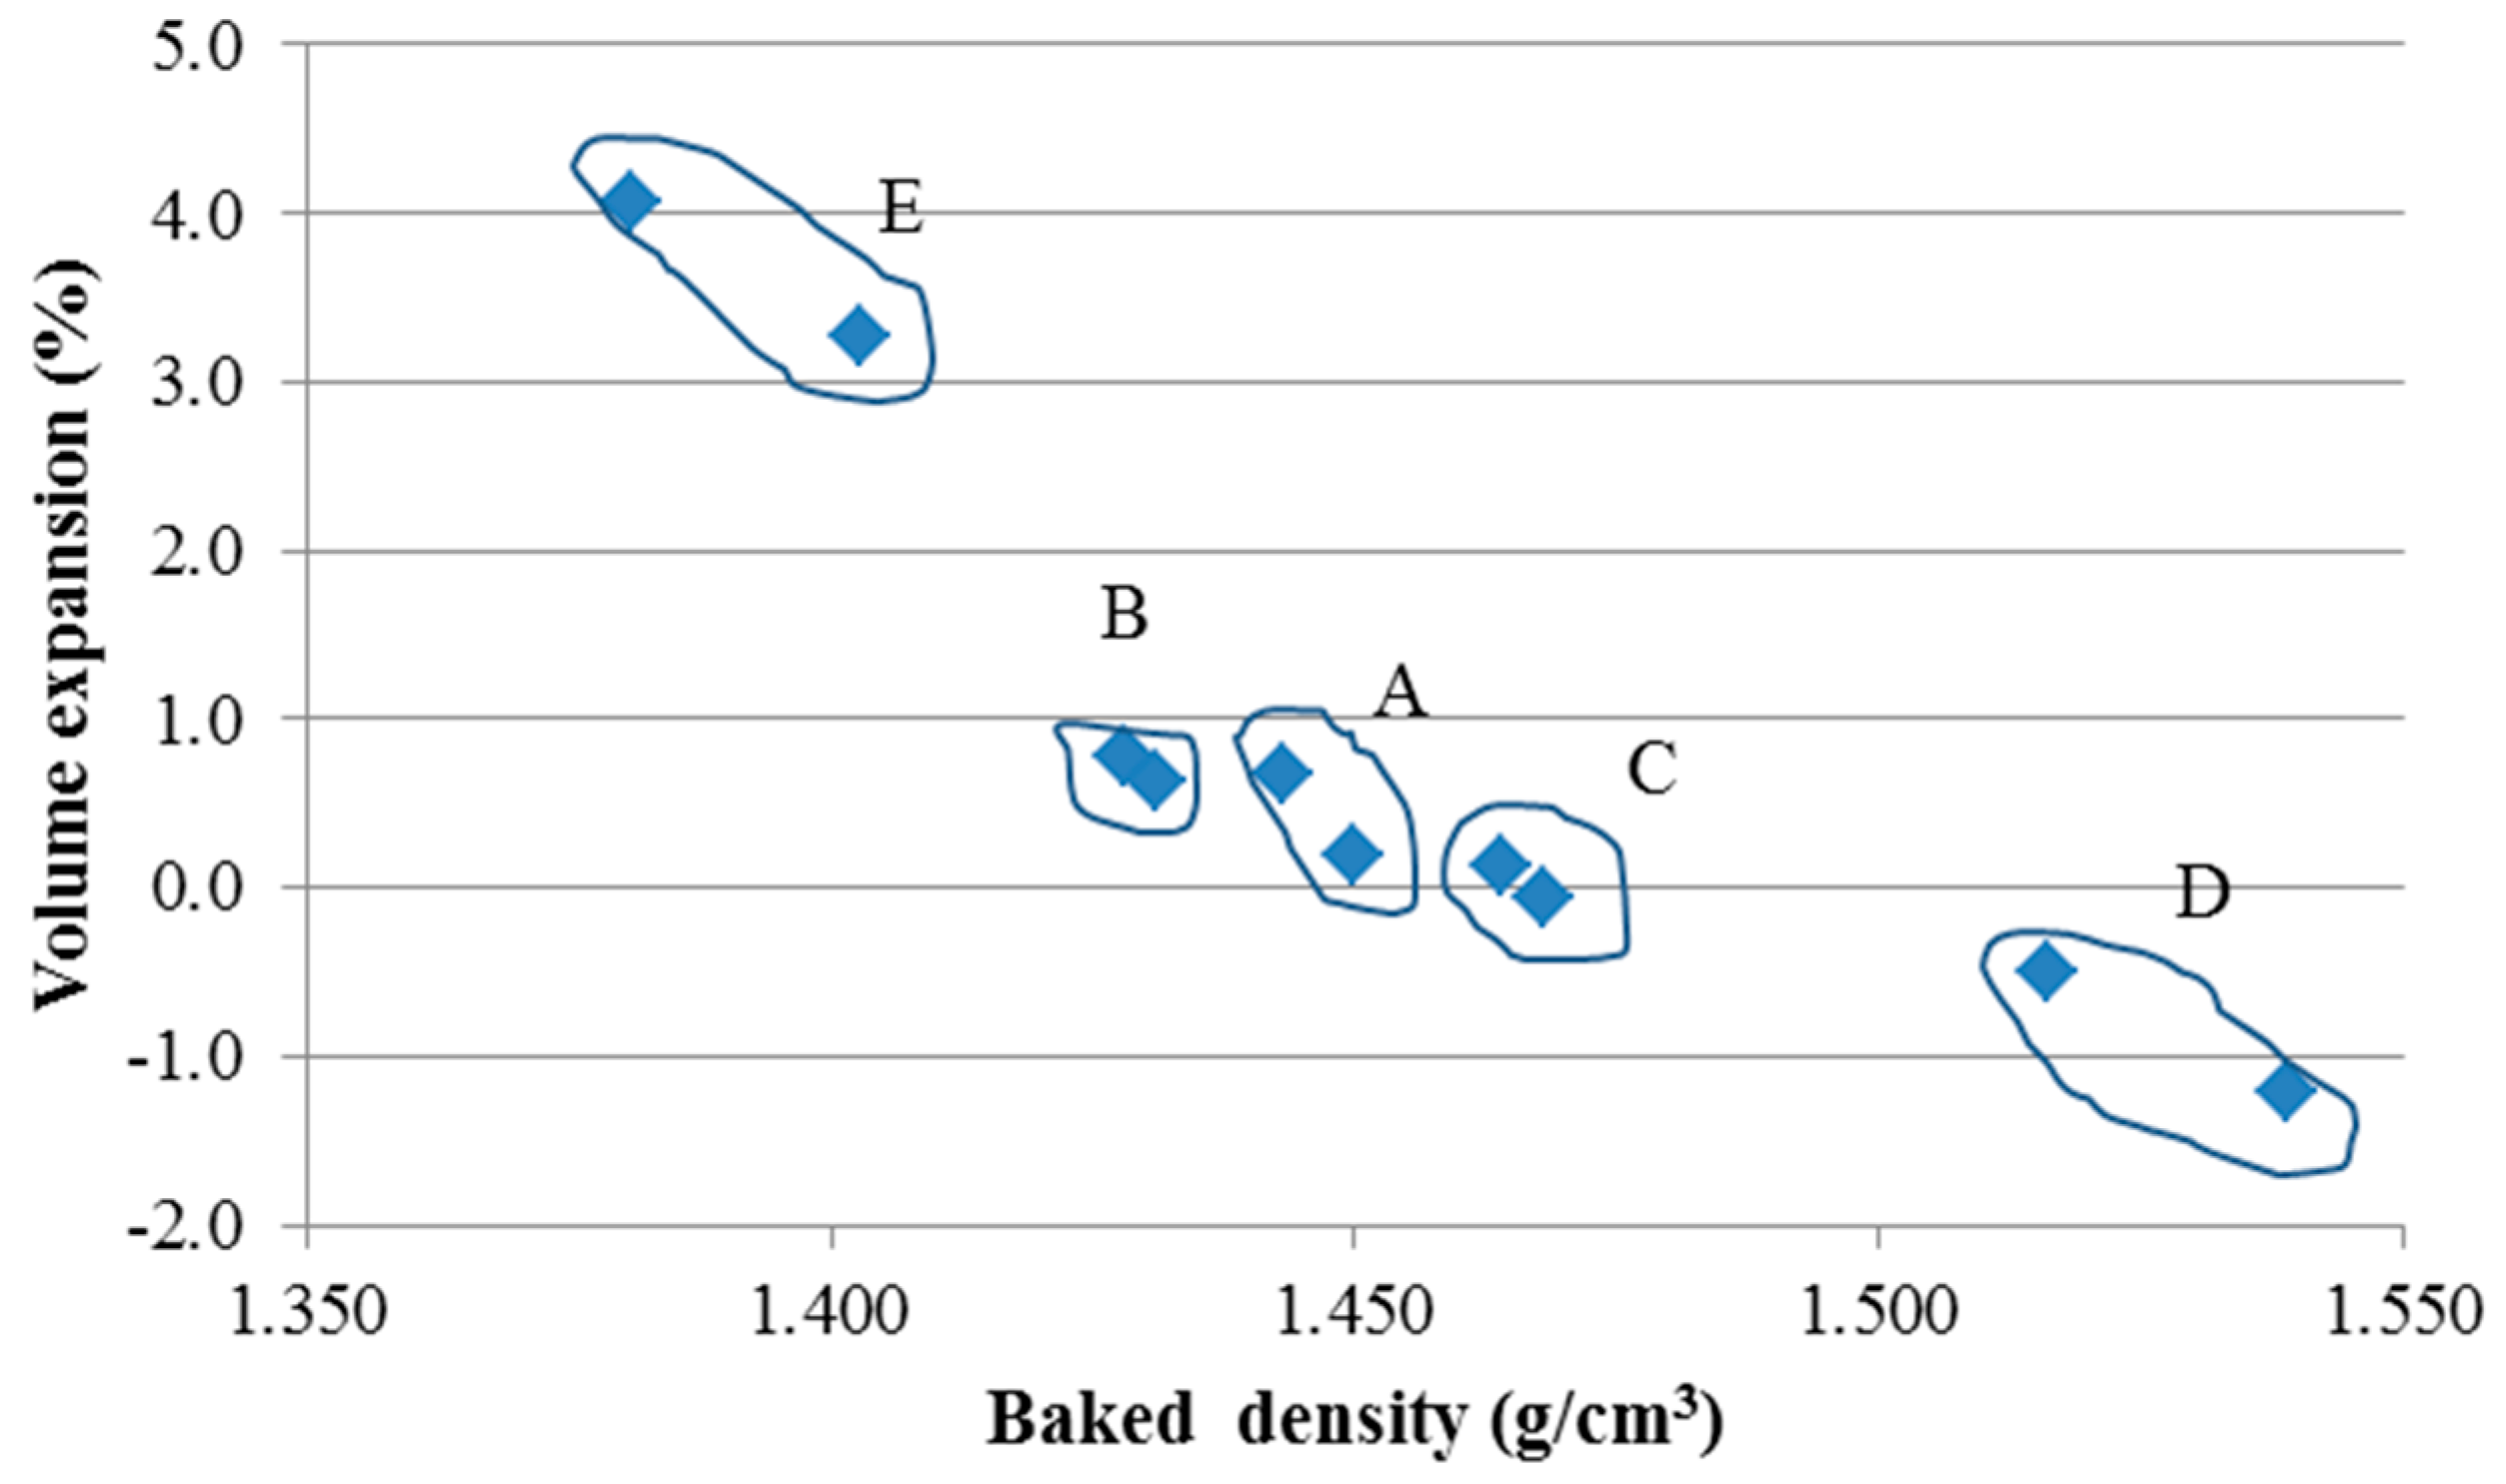
Density after baking shows values ranging from 1.38 to 1.40 g/cm3 (paste E) up to 1.52 to 1.54 (paste D). Generally speaking, the higher the baked density, the lower the volume expansion. Figure 3 illustrates this trend well. Paste D exhibits volume shrinkage during baking.
The level of baked density depends on the paste formulation, binder level, and binder nature. Pastes B and E, with a lower baked density that is also linked to a higher weight loss during baking, do not contain any PAH in their composition, and their binder nature affects the final baked density. Pastes A and C appear eco-friendly and probably have the same binder nature. Paste D seems to contain standard coal-tar pitch binder, and is on the high side in terms of baked density.
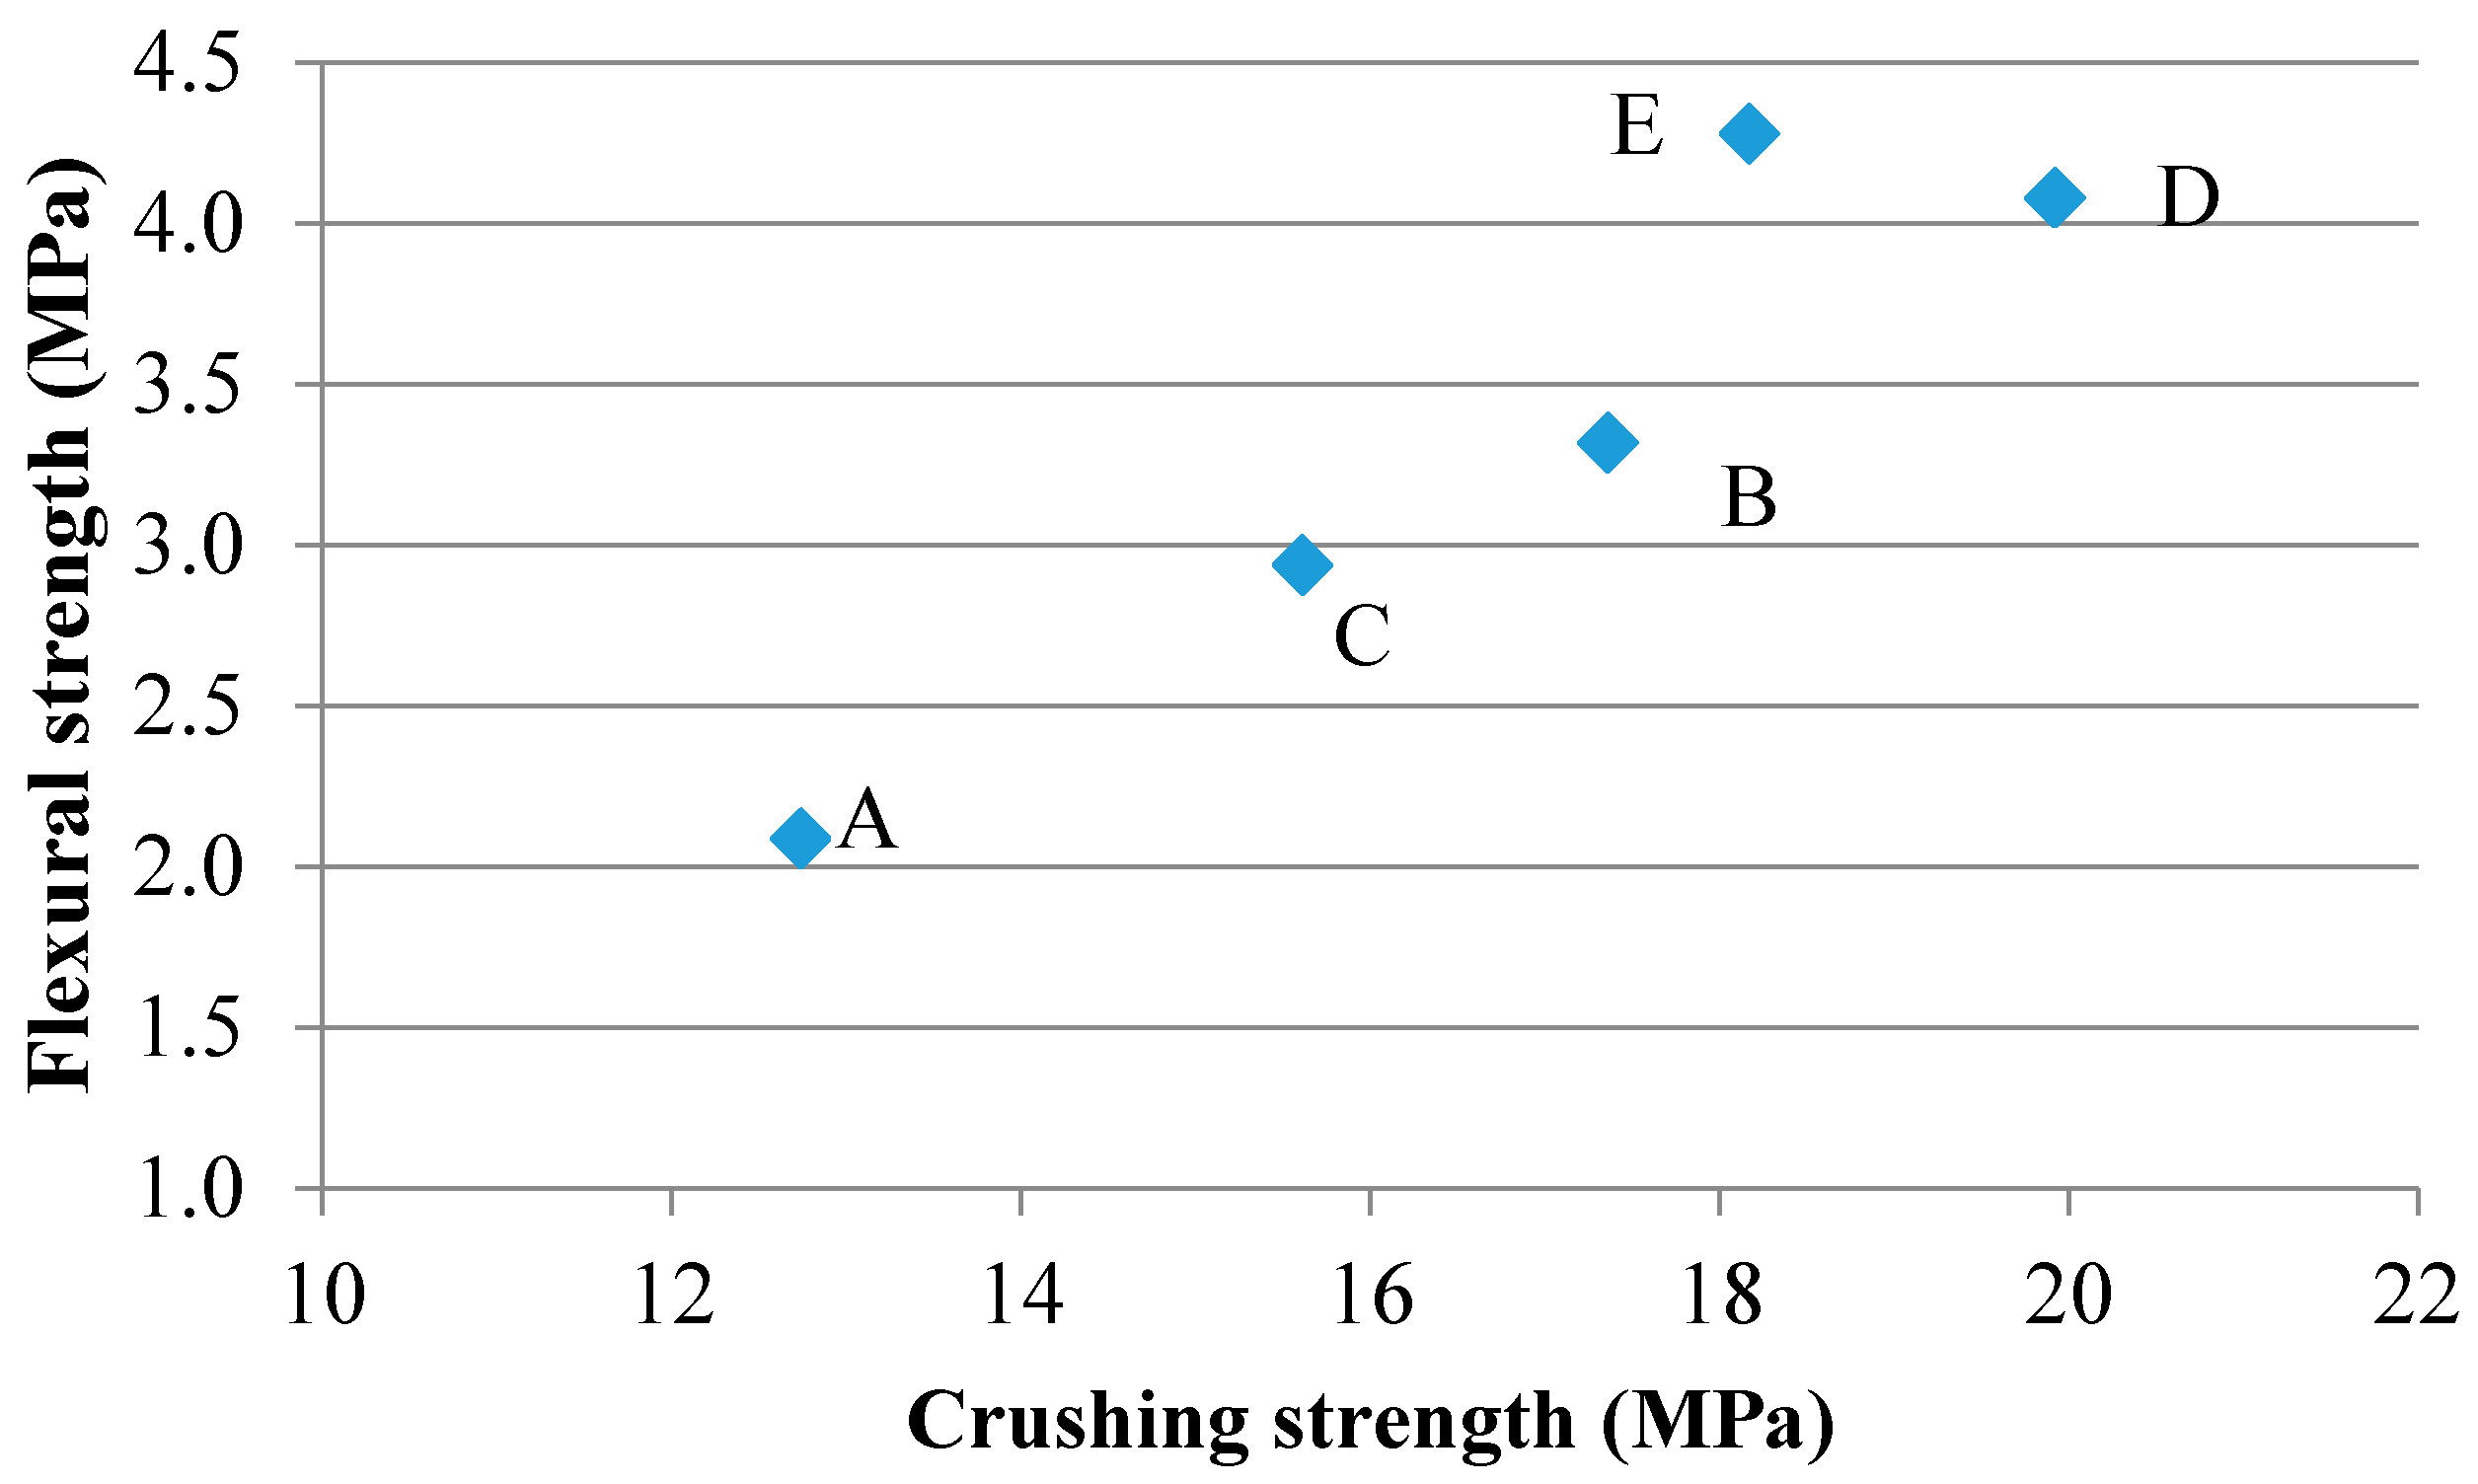
Regarding mechanical properties, the correlation between both crushing strength and flexural strength is also good (Figure 4). There is a good correlation with Young’s modulus as well. Paste A presents the lowest mechanical properties, whereas pastes D and E are on a higher range.
The electrical resistivity values show three families of paste: pastes D and E, with the lowest values, are probably semi-graphitic pastes (which explains the high mechanical properties); pastes B and C present values typical of 100% anthracitic paste; and paste A, with a very high electrical resistivity, combined with the highest value of ash content, probably contains another type of raw material.
The conclusions are not as clear for the thermal conductivity values. The dependence of thermal conductivity on temperature has been determined with the Kohlrausch method [3], in parallel with the dependence of electrical resistivity on temperature and the values at 1000 °C are given in Table 8. They confirm the lowest values of thermal conductivity for paste A. At 1000 °C, all pastes present a higher conductivity than at 30 °C, in a range between 12 and 16 W/m·K. The electrical resistivity values at 1000 °C are lower than the values at room temperature.
The oxidation resistance of the five pastes vary from a weight loss of 4.5% (pastes B, C, E) up to 9.9% (paste D).
4. Emissions during Baking
4.1. Follow-Up Test
Emission measurements in pots are very difficult and expensive. They require heavy pumps to be carried and changed regularly during the whole baking operation. Therefore, a laboratory test has been developed at Carbone Savoie with the help of an external company, Explorair, which has strong expertise in VOC follow-up. Explorair has developed mobile equipment that can analyze the VOC up to C8 on line and in situ, even on industrial sites. A method to follow-up not only VOC but also PAH, has been developed and was used to characterize the emissions during the baking of ramming pastes.
For VOC, the equipment consists of a µGC-MS (micro gas chromatography coupled to a mass spectrometer), with four columns of gas chromatography for VOC and permanent gases. A sample is taken every 4 min and treated in less than 1 min with the help of a library of more than 250,000 species. All species can be detected and identified versus time. Taking into account the flow rate, the amount of each species expressed in mg per kg of paste sample can be calculated.
For PAH measurement, particles and gases are collected and adsorbed (on filters and tubes, respectively). The tubes are injected after the test in a thermodesorber linked to gas chromatography and mass spectrometer (Fast TD-GCMS). The filters are chemically analyzed with a solvent.
For the test developed for ramming pastes during their baking up to 1000 °C, the tubes and filters are removed and replaced at each 100 °C interval, to follow the evolution of the amount of PAH or of heavy volatiles versus temperature. Light VOC and permanent gases are measured every 4 min. The baking rate chosen for the test is 180 °C/min, thus giving a total duration of 5.5 h.
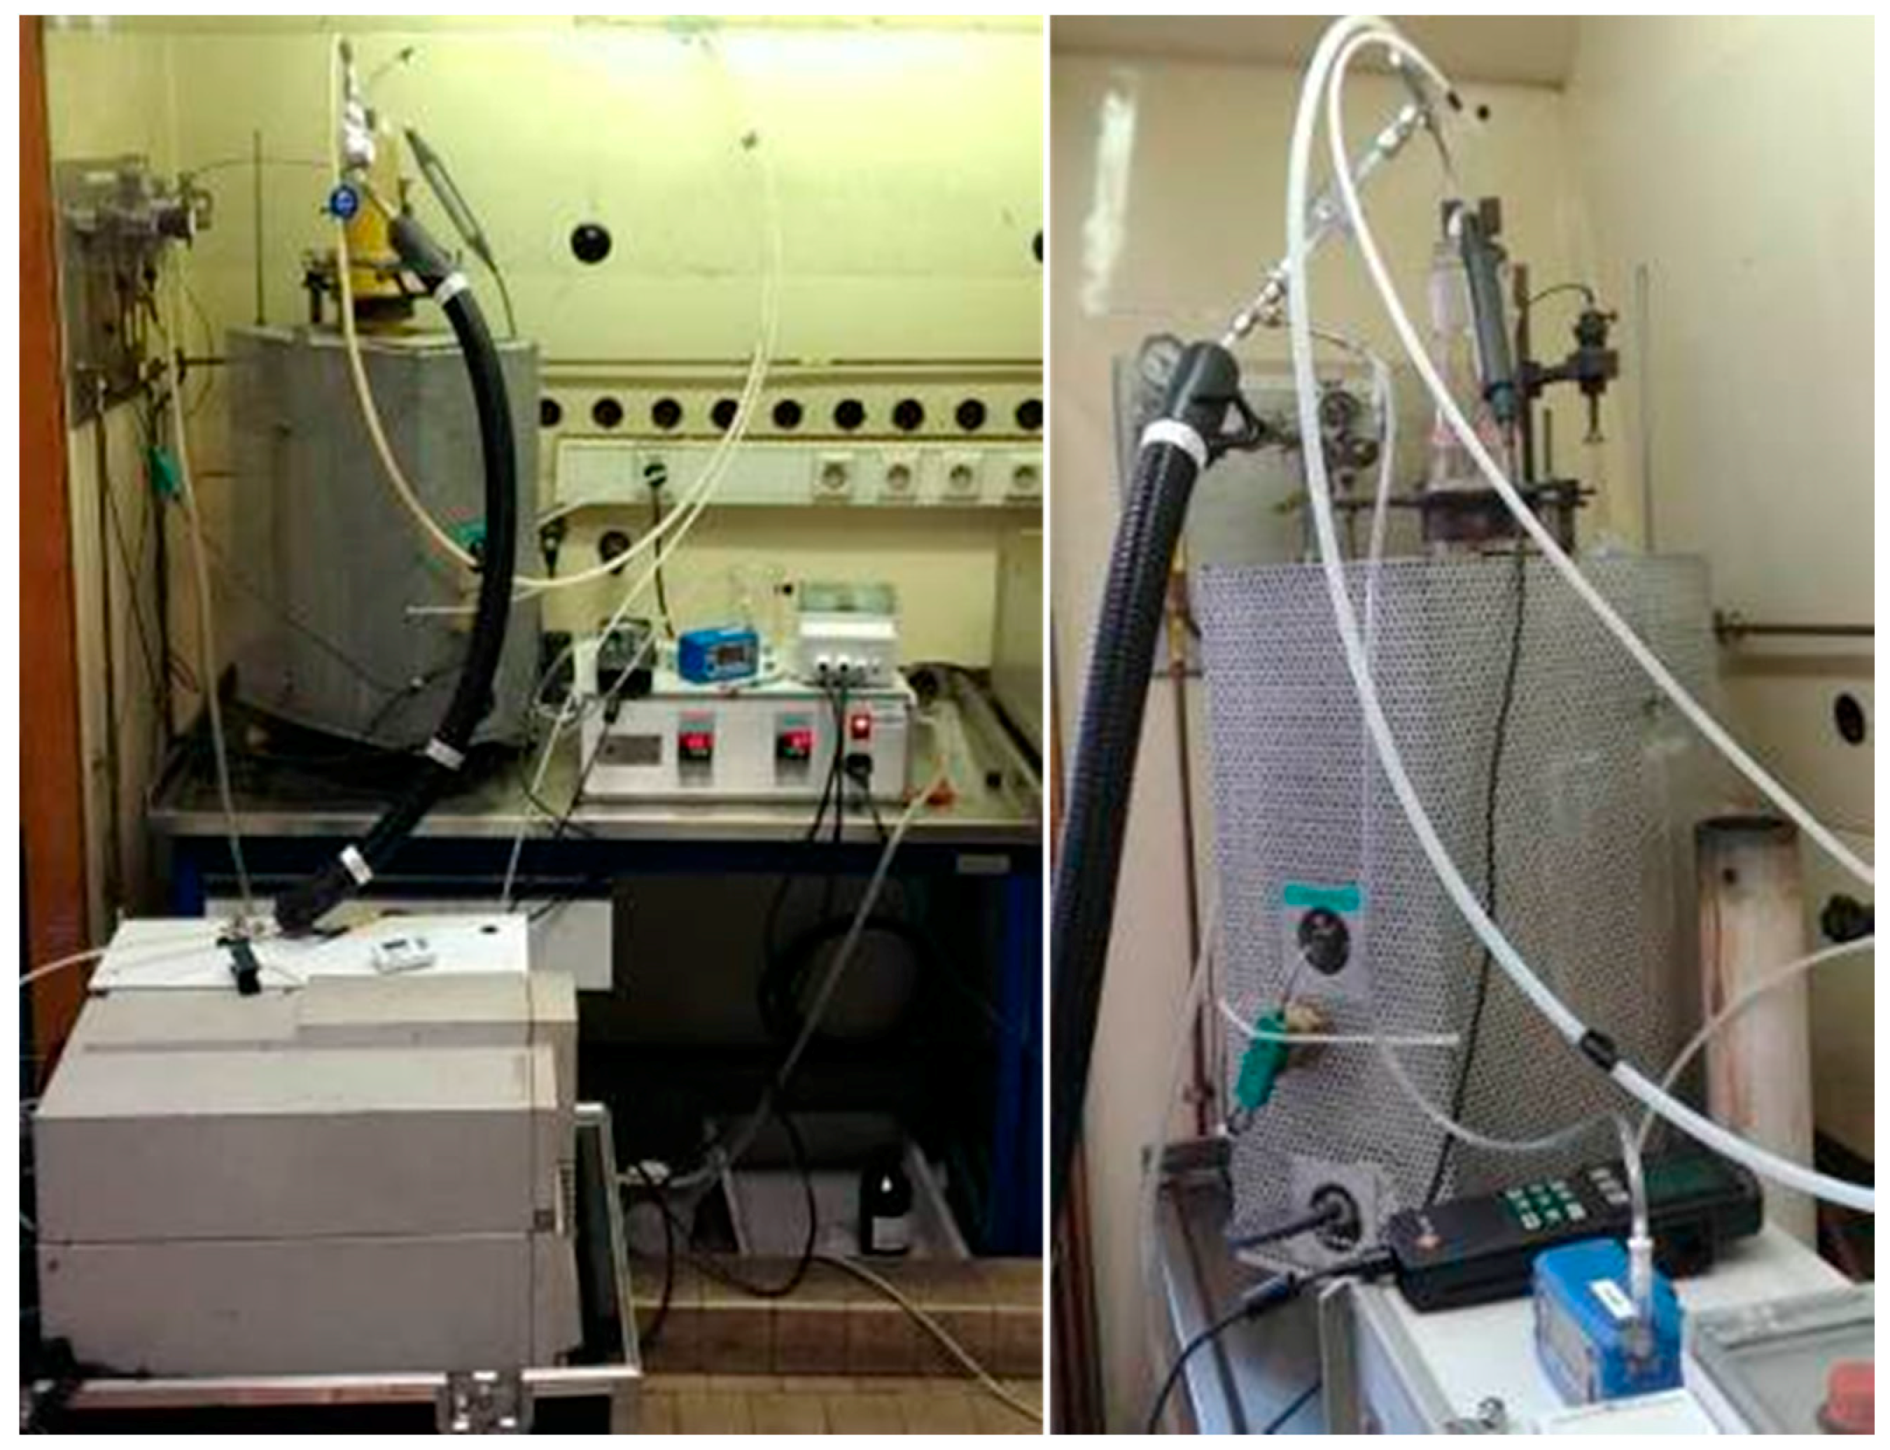
The ramming paste samples were those densified with the FSR equipment (which represents 180 g of paste). The samples are put in the dilatometer during baking inside a specific reactor. The top of the reactor has been specifically designed to avoid condensation of the volatiles under the top, with an input of nitrogen (2500 mL/mn) to push all gases emitted by the sample to the output of the reactor, where they are either condensed on the filter (for PAH particles), or collected by the tube (gaseous PAH or heavy VOC), or sent directly to the µGC-MS (light VOC + permanent gases). A picture of the equipment is given in Figure 5 and the detection limits are indicated in Table 9.
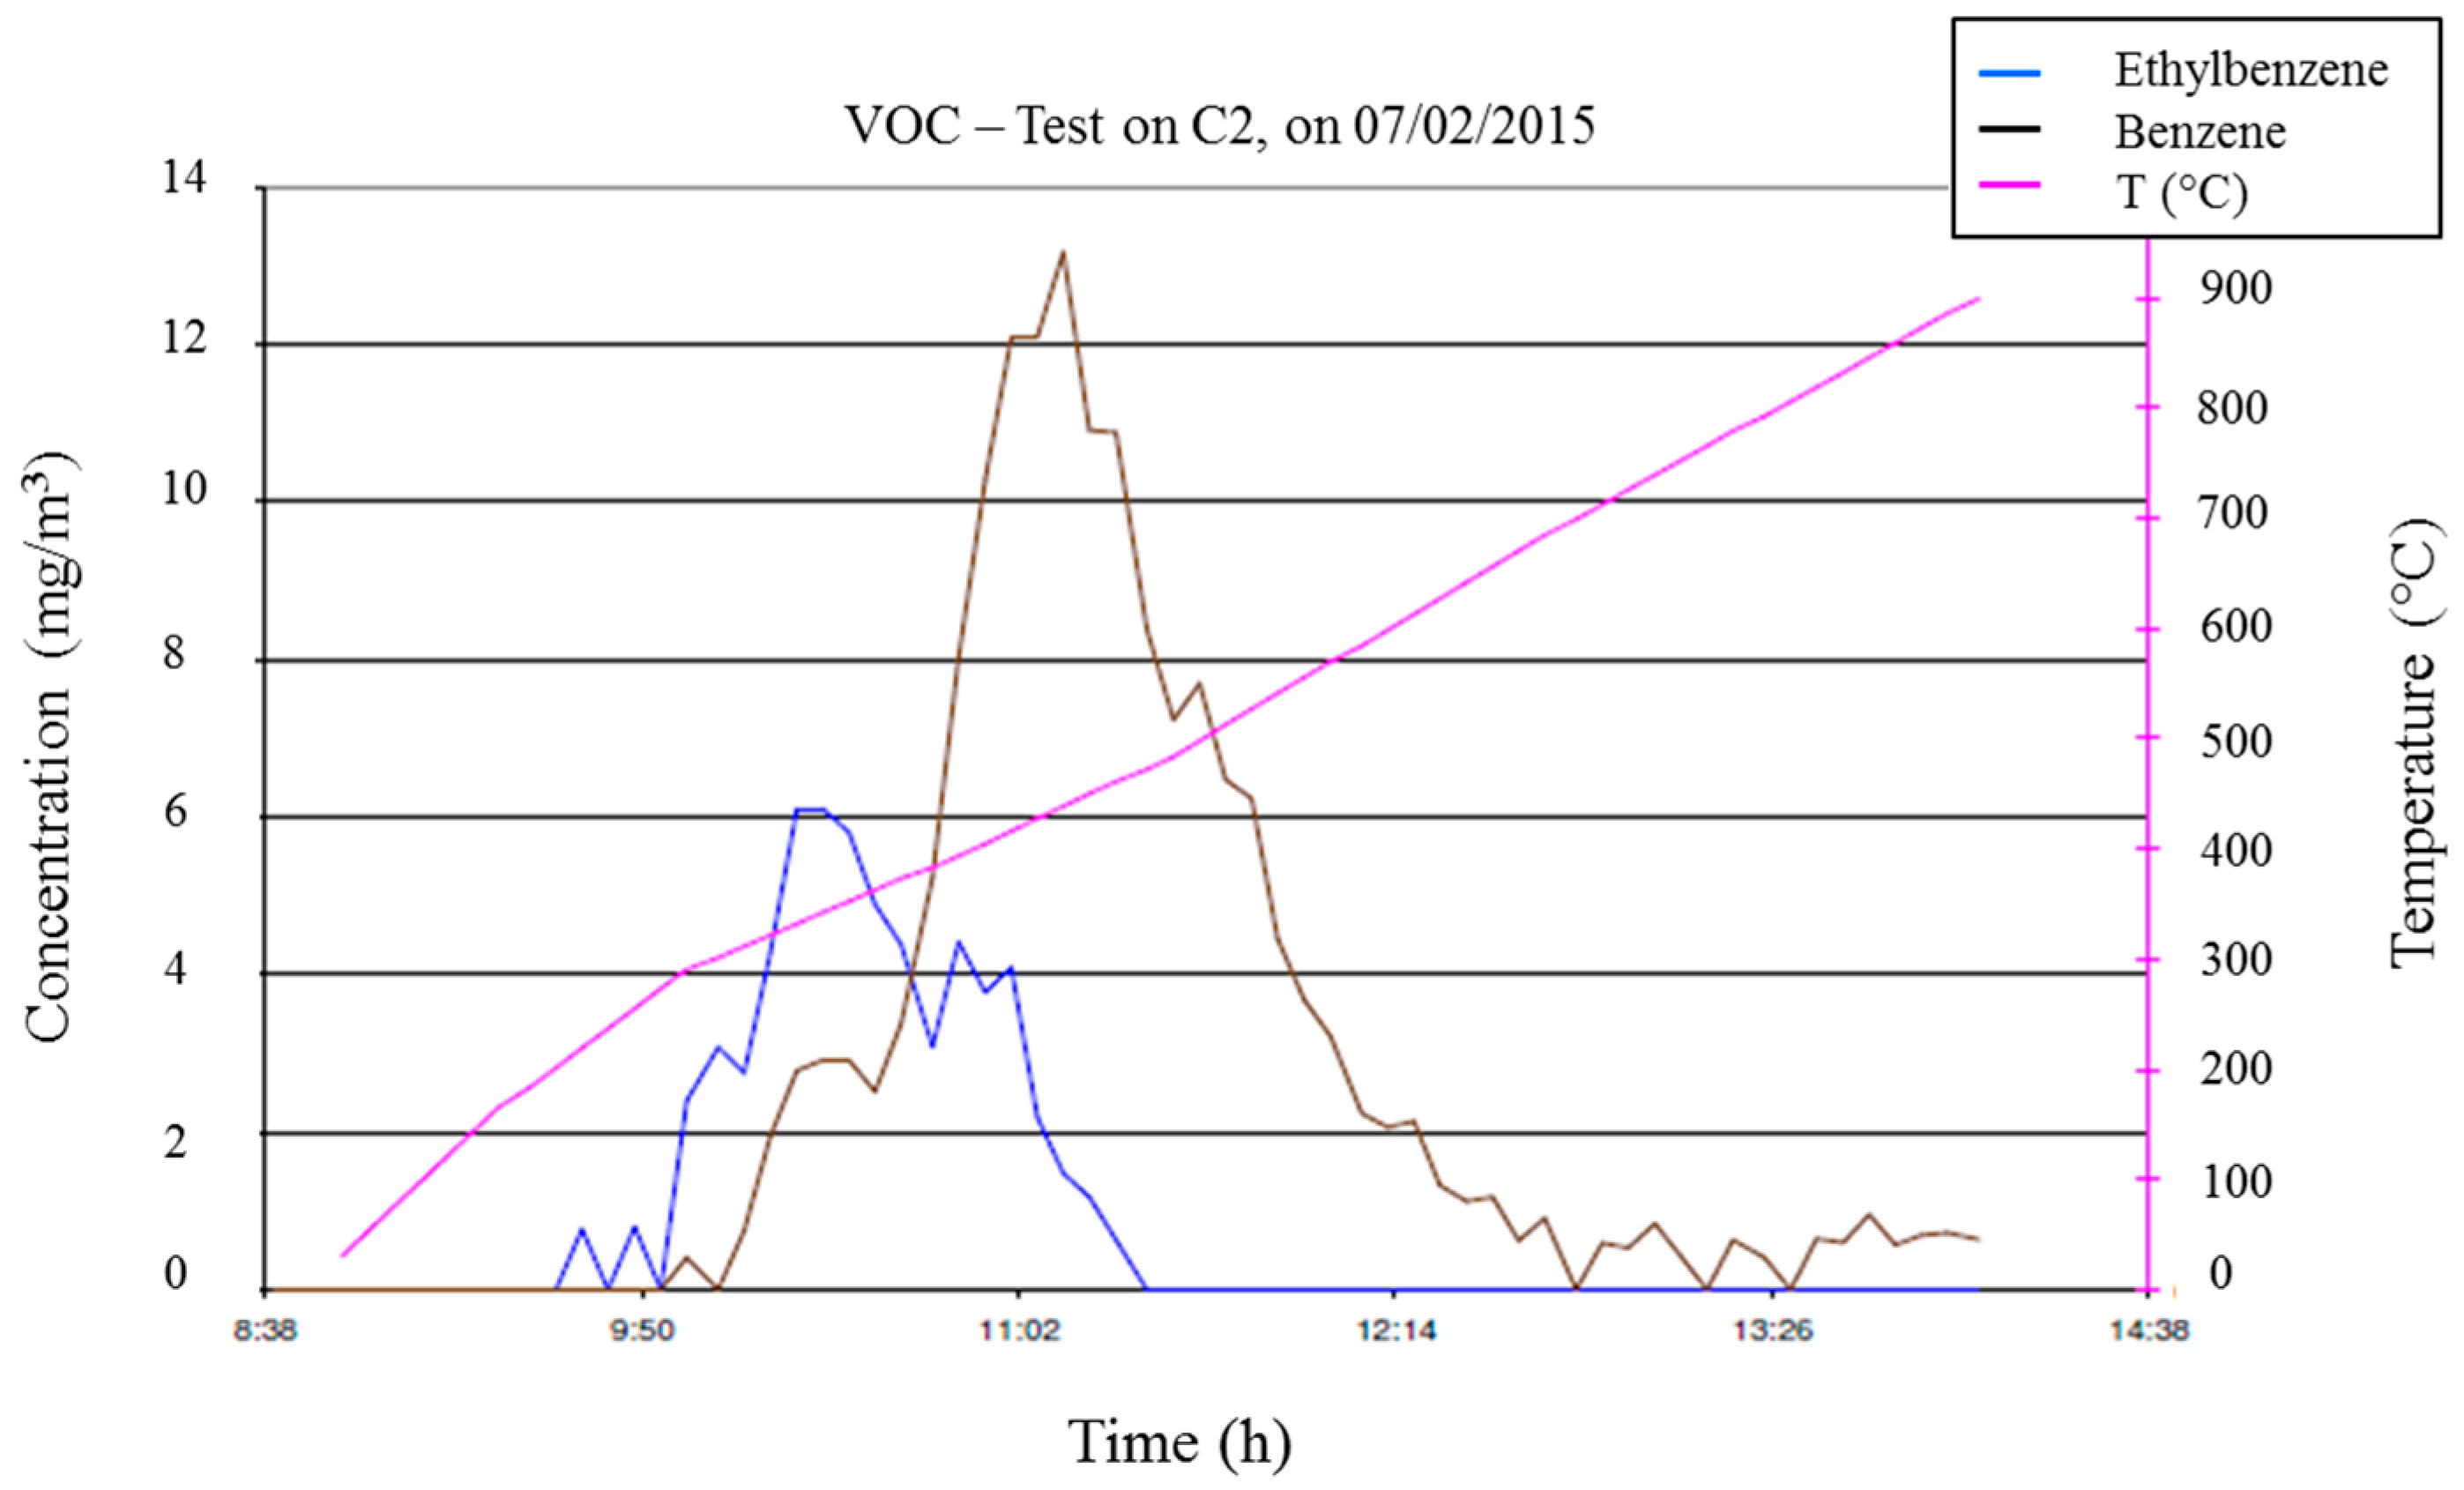
The concentration of each compound detected is calculated for each 4-min sample and the whole emissions curve can then be represented versus time. Figure 6 presents an example of the curve obtained for paste C for two chemicals detected: ethylbenzene and benzene. Temperature is plotted versus time on the pink curve.
It is not relevant to compare concentrations, but more important to calculate the weight released in mg and to divide it by the sample weight. This calculation takes into account the flowrate. The total amount of emissions could, thus, be compared in mg/kg between all pastes.
For paste A, which releases a high level of PAH during baking, a sample of 180 g is too large, and even when tubes and filters were changed each 100 °C, there were so many heavy compounds that the condensates blocked the pump that sent the gas to the analyzer. It was decided to decrease the amount of paste to 50 to 70 g of paste. This amount was used also for pastes C and D, which initially presented a high level of PAH in their composition.
4.2. Comparison of the Polycyclic Aromatic Hydrocarbons (PAH) Emissions during Paste Baking
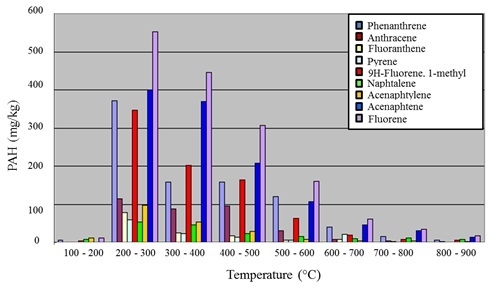
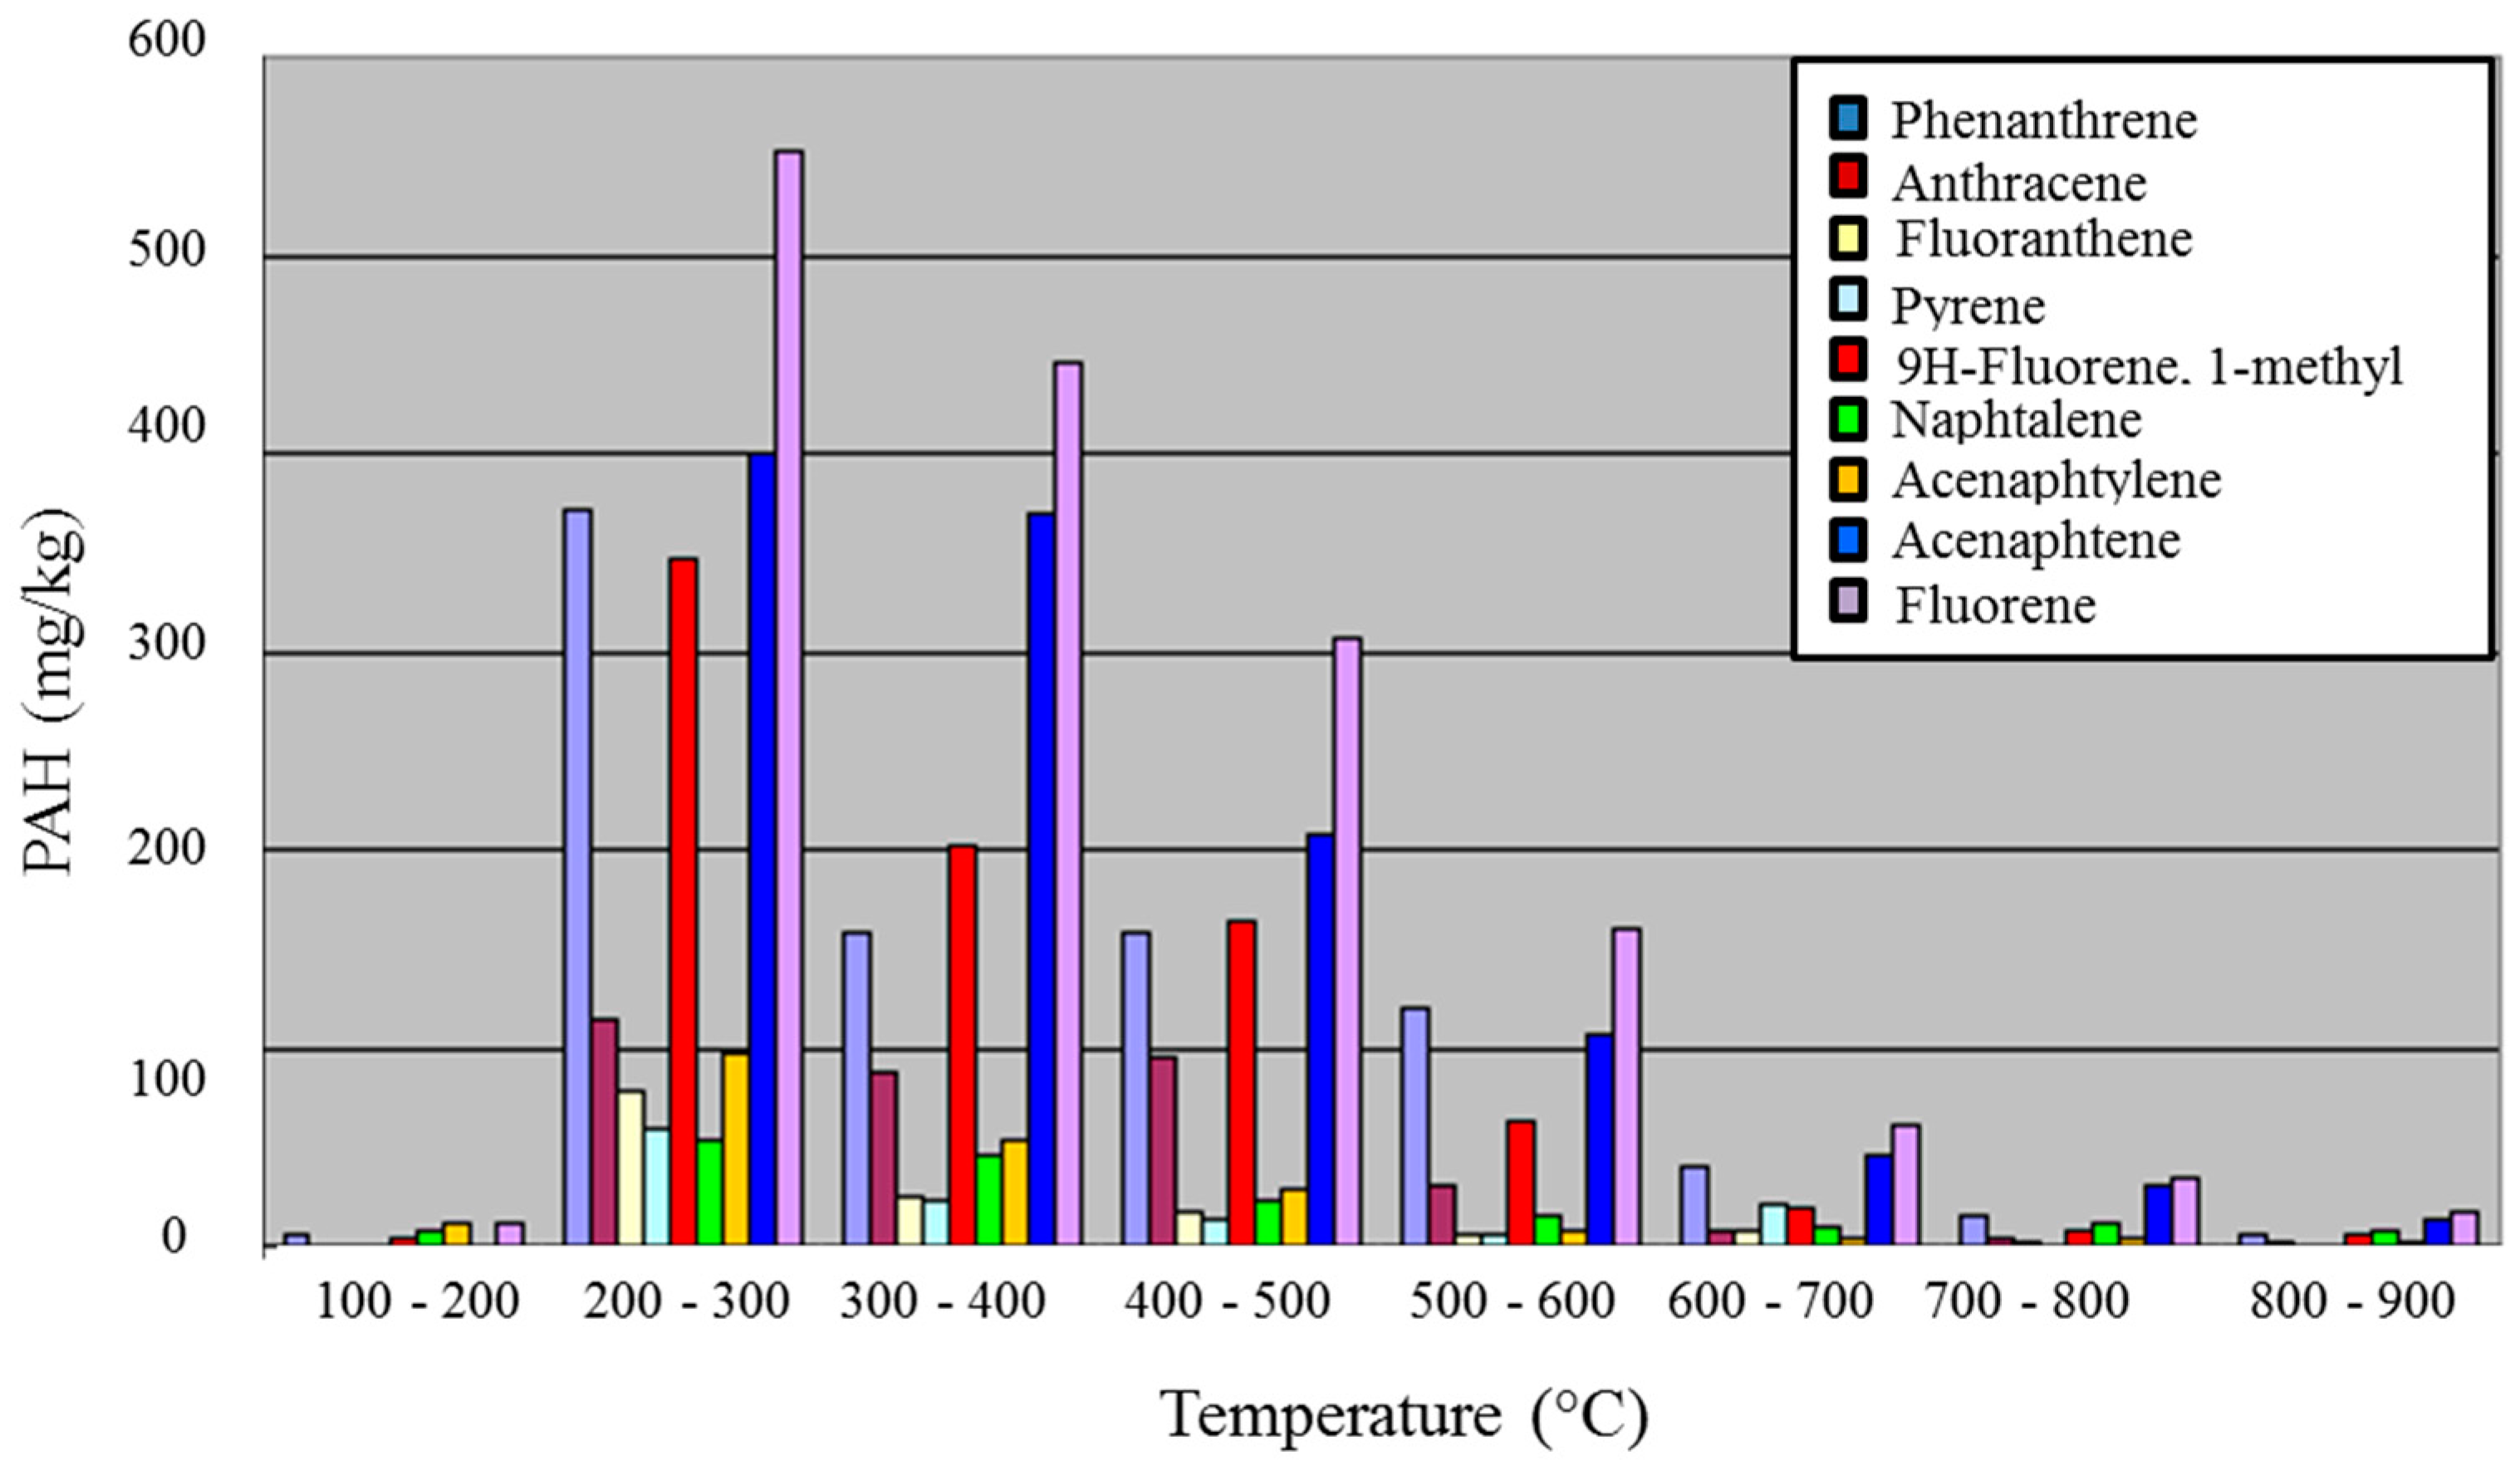
All tubes and filters taken every 100 °C were analyzed and the amount of volatiles and particulates calculated. Figure 7 shows as an example of the gaseous PAH emissions versus temperature for paste C. Most PAH are emitted between 200 and 600 °C.
For high PAH releases, the top of the reactor becomes yellow from about 300 °C, then red around 500 °C and, above this, between red and black. The results in Table 10 allow a comparison of the total PAH emitted, with a special focus on the 16 individual PAH (gas + particles). Individual PAH are designated by their shortened names (see Table 3). The ETF is calculated.
Even during baking, pastes B and E either do not release PAH, or only a small amount of light ones with no toxicological effect. Surprisingly, paste A, which is EF, releases the largest amount of PAH during baking, and the ETF is almost at the level of the standard paste D.
5. Performances in EGA DUBAL Pots
5.1. Pot Operating Parameters
Samples were selected from the same potline, the same technology and design, the same cathode block and the same collector bars, with pot age differing by a maximum of ±50 days.
- 4 samples from NeO2 ramming paste,
- 4 samples from supplier A,
- 1 sample from supplier B.
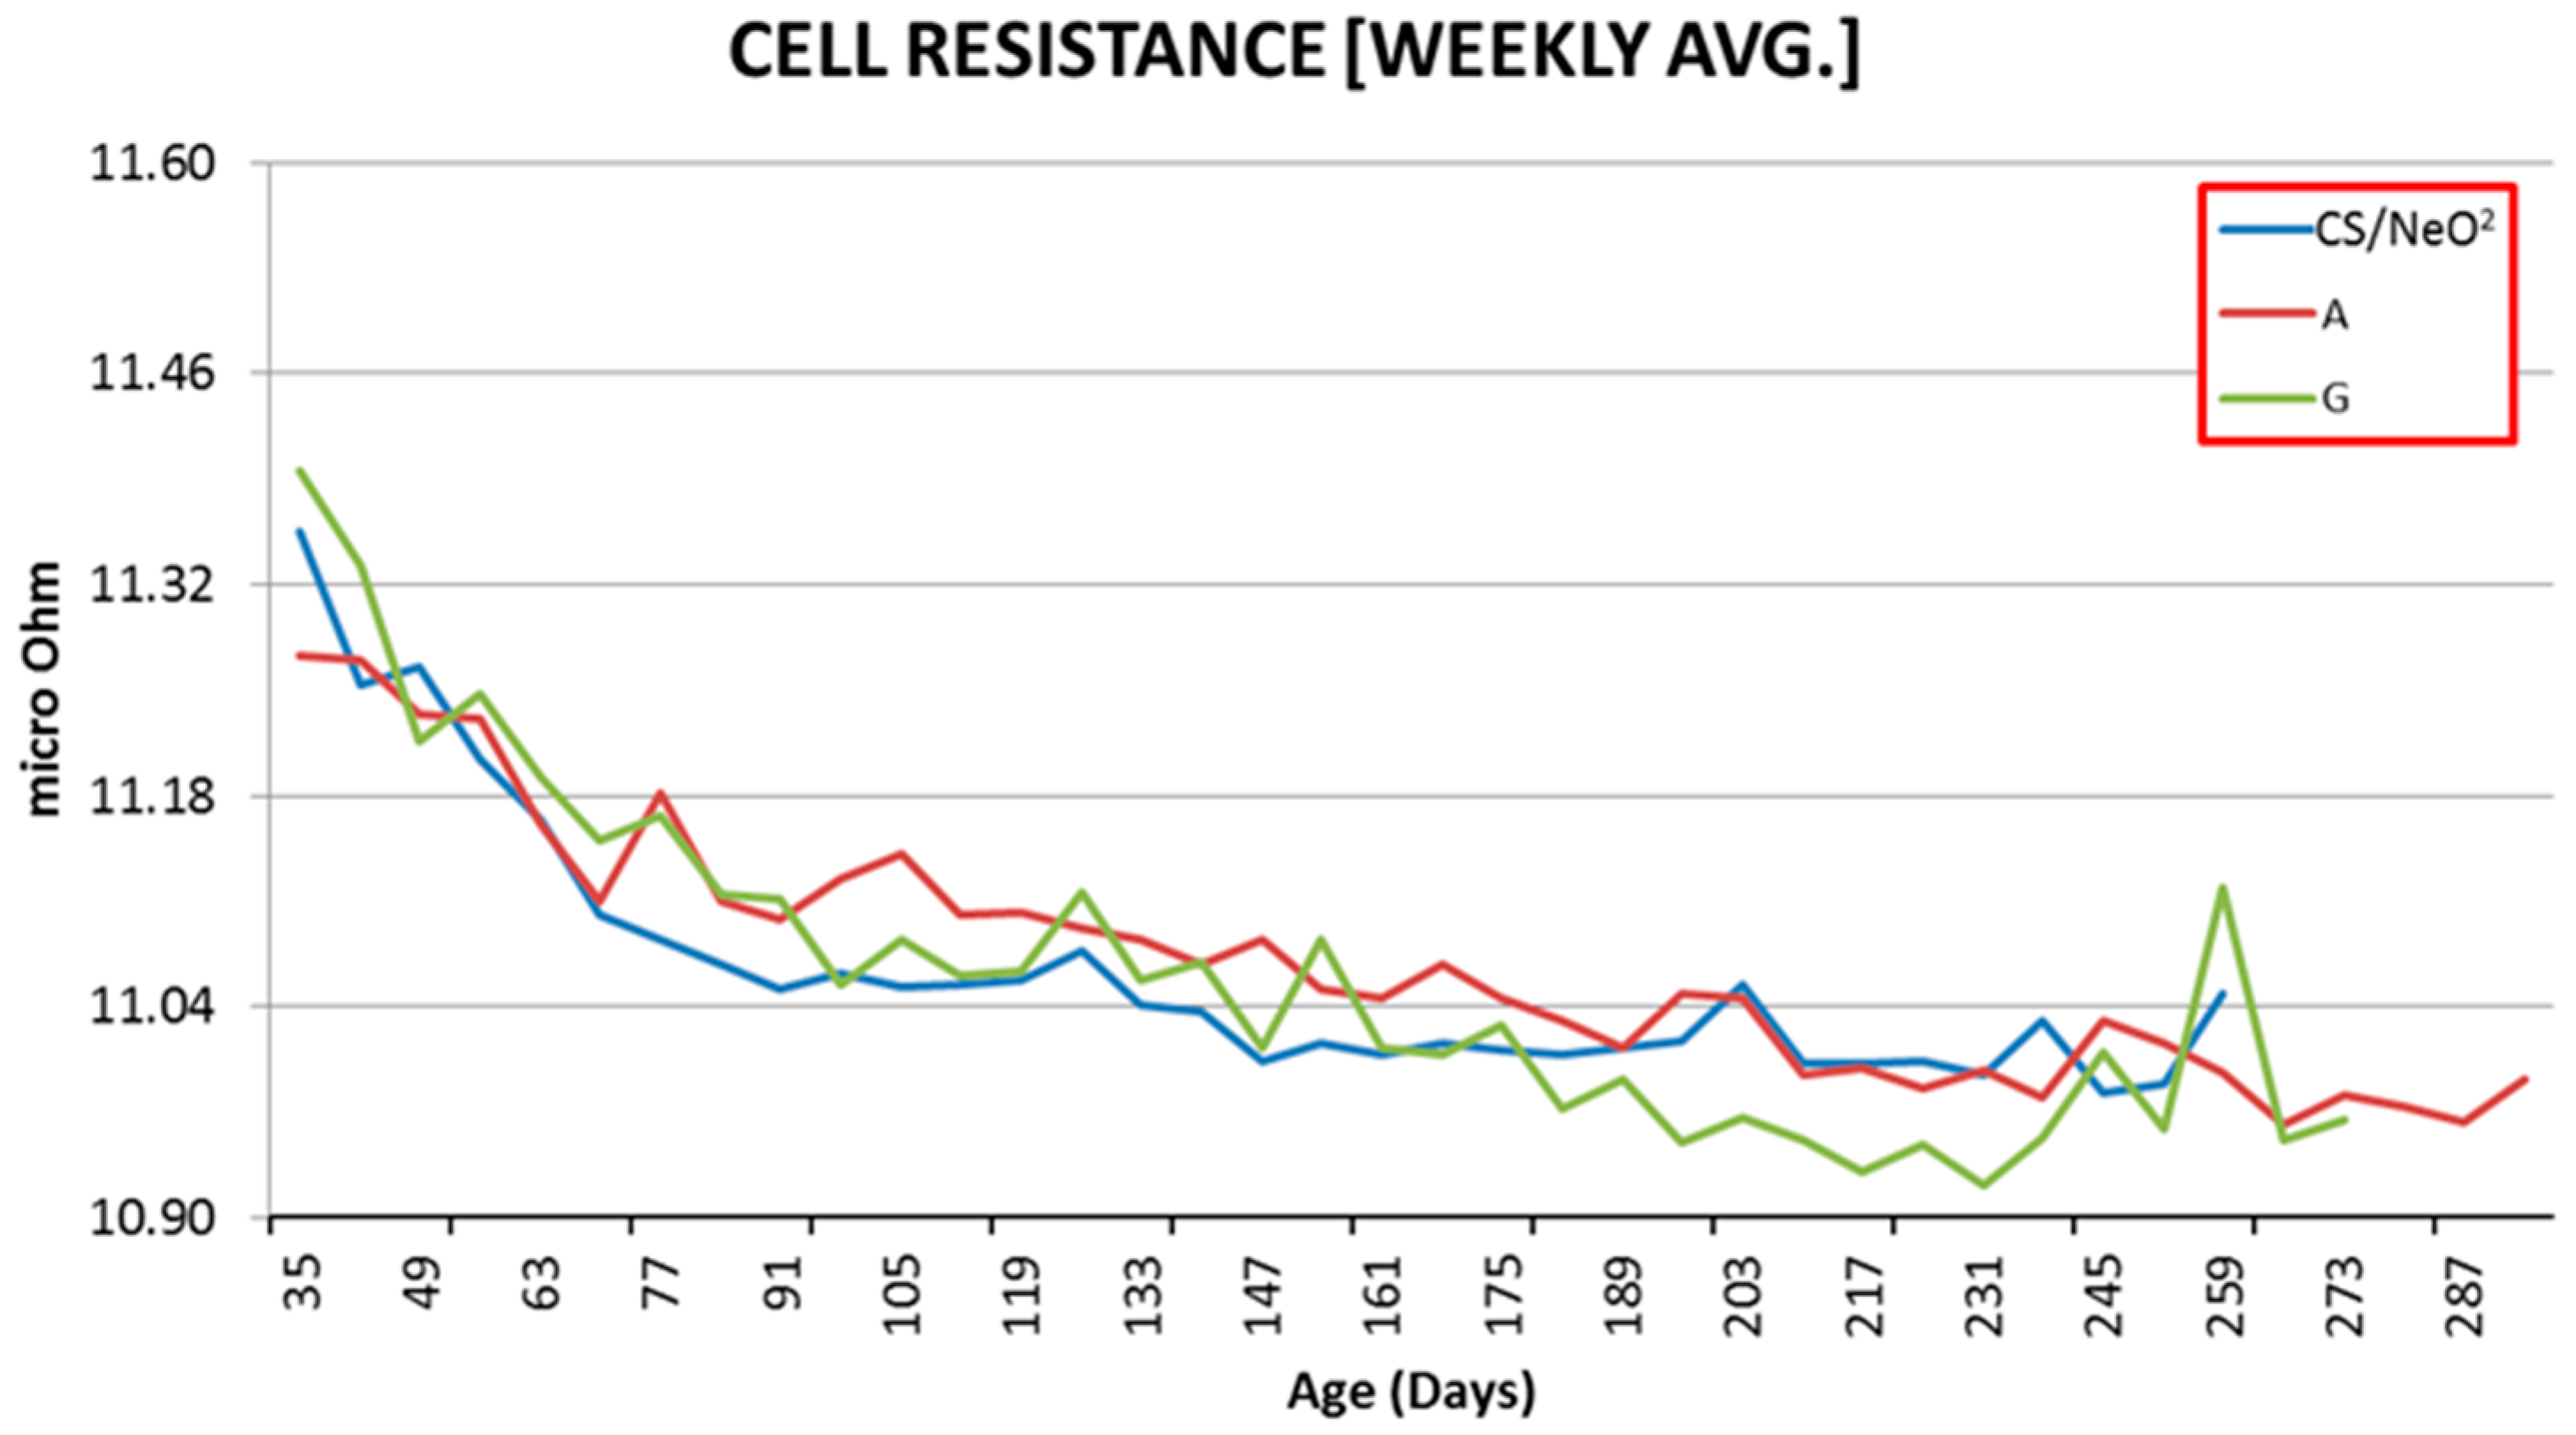
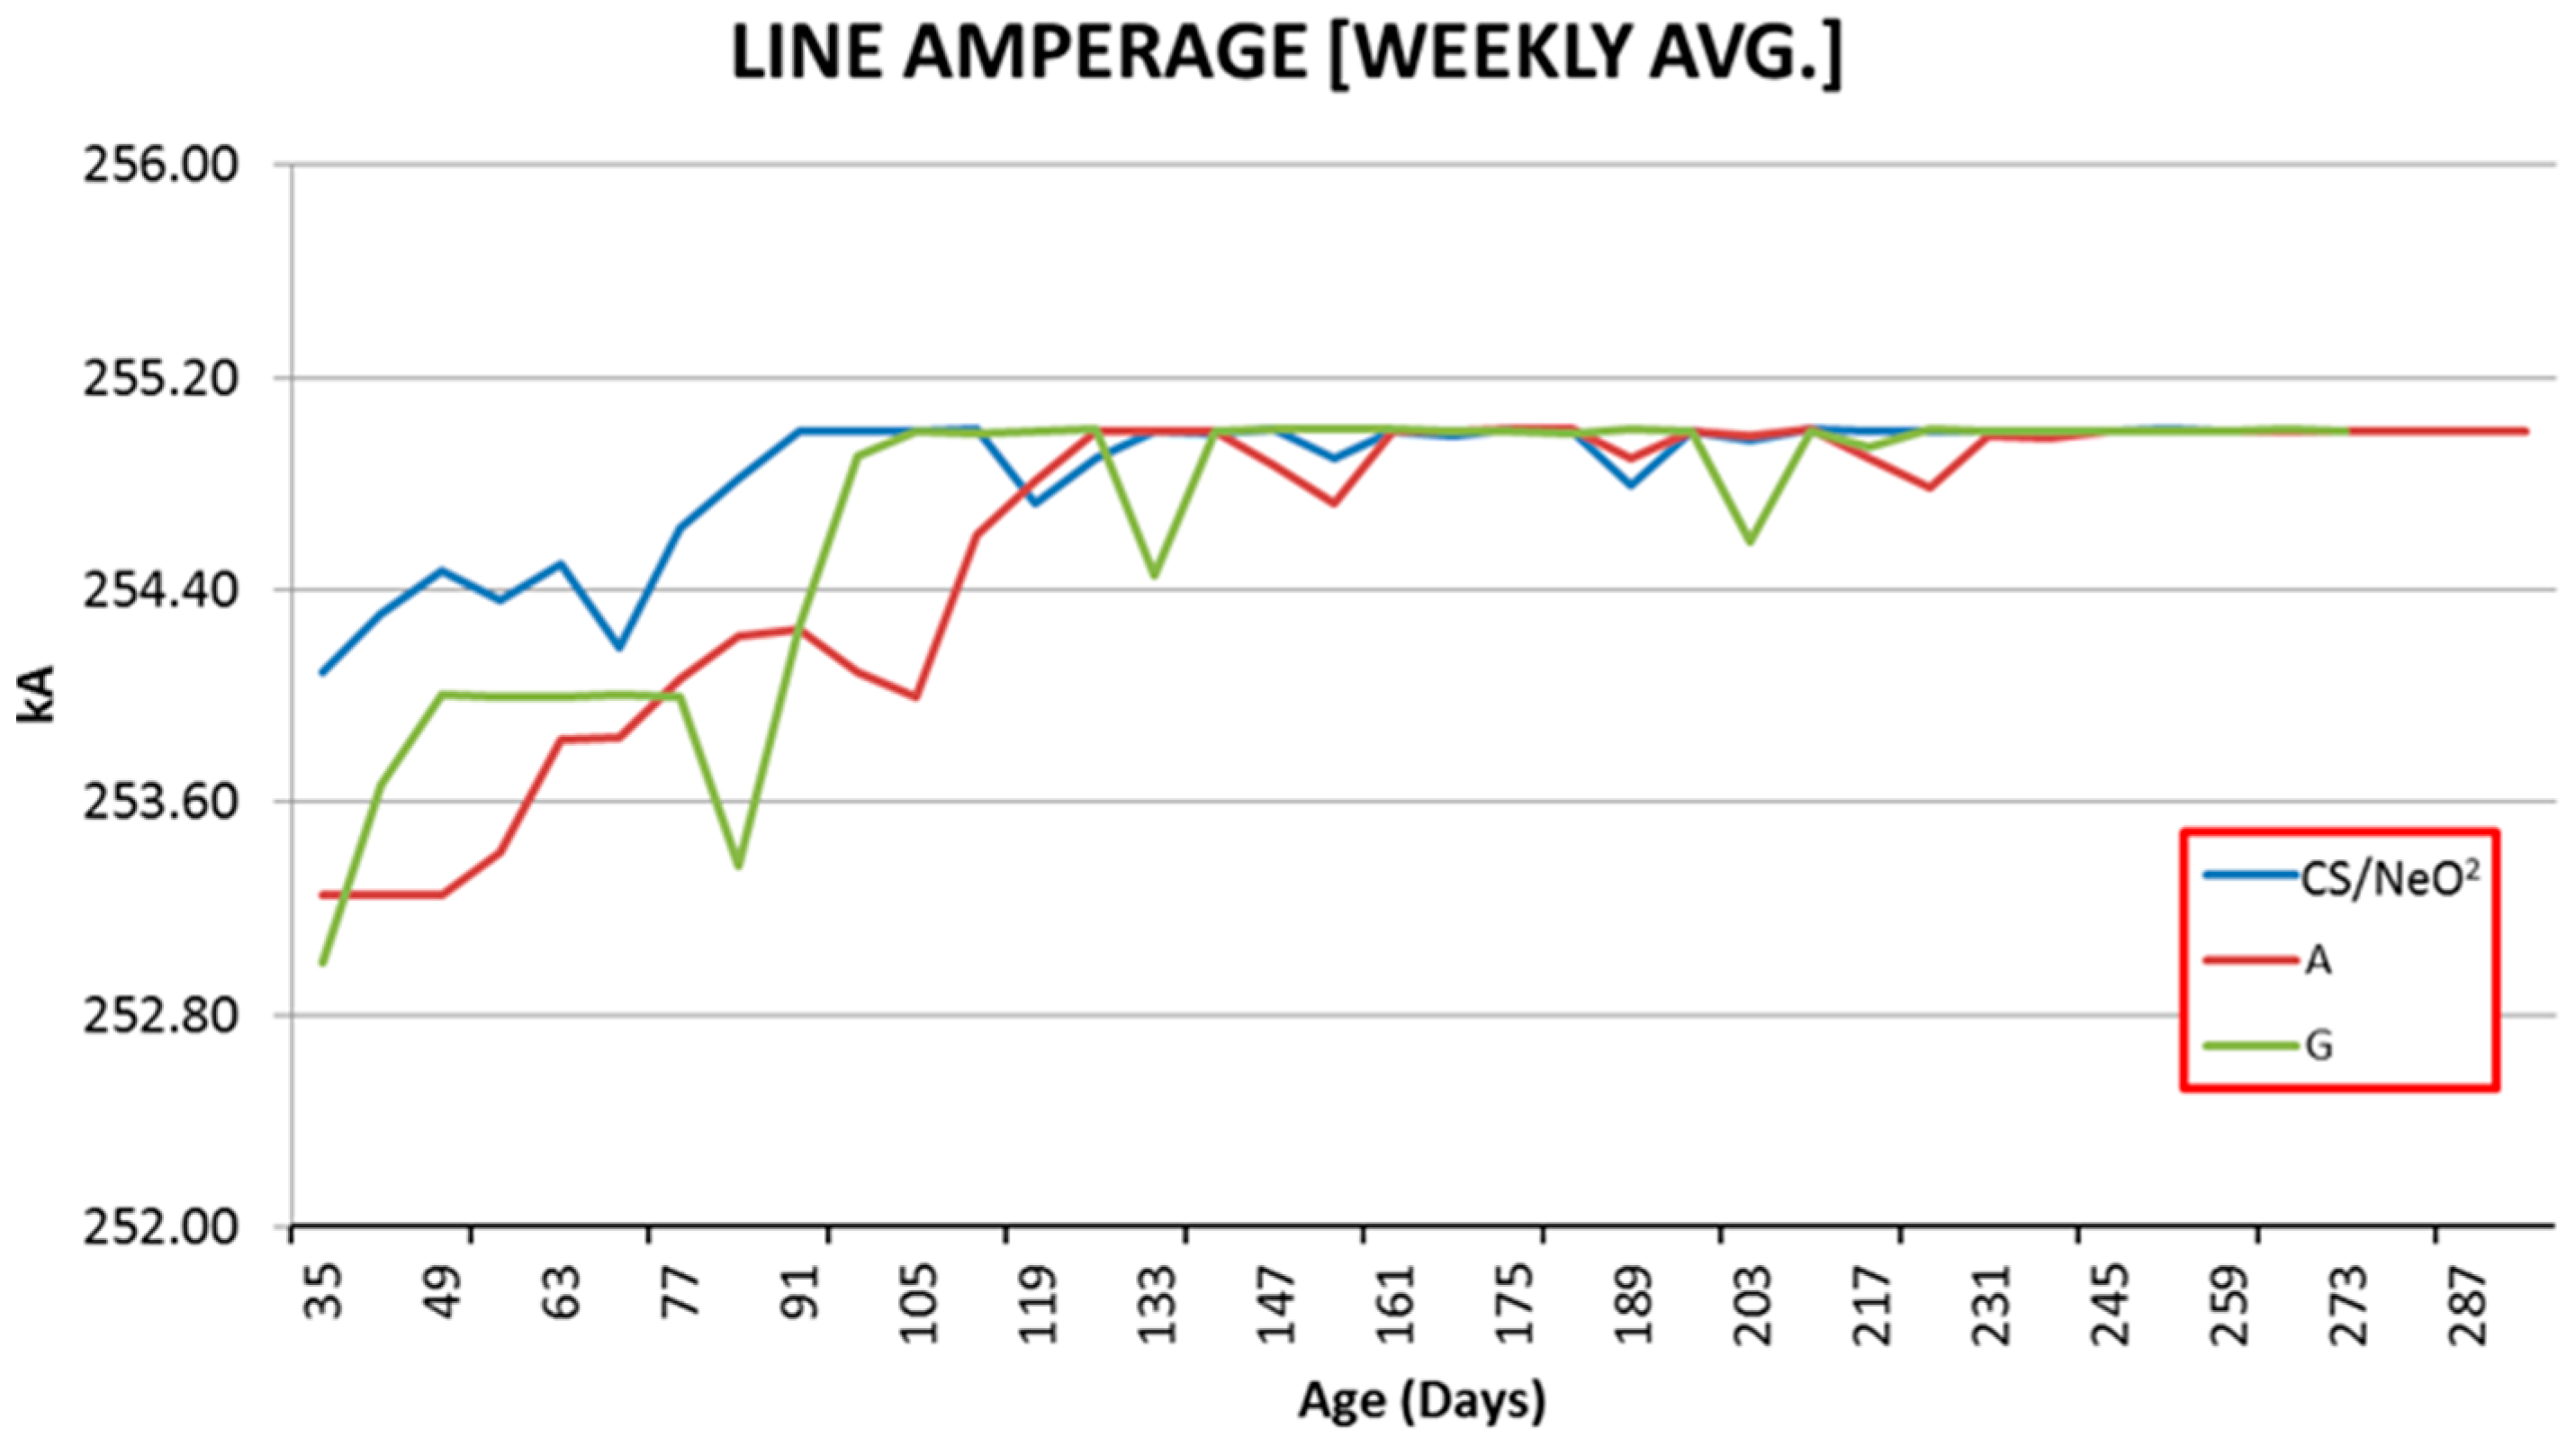
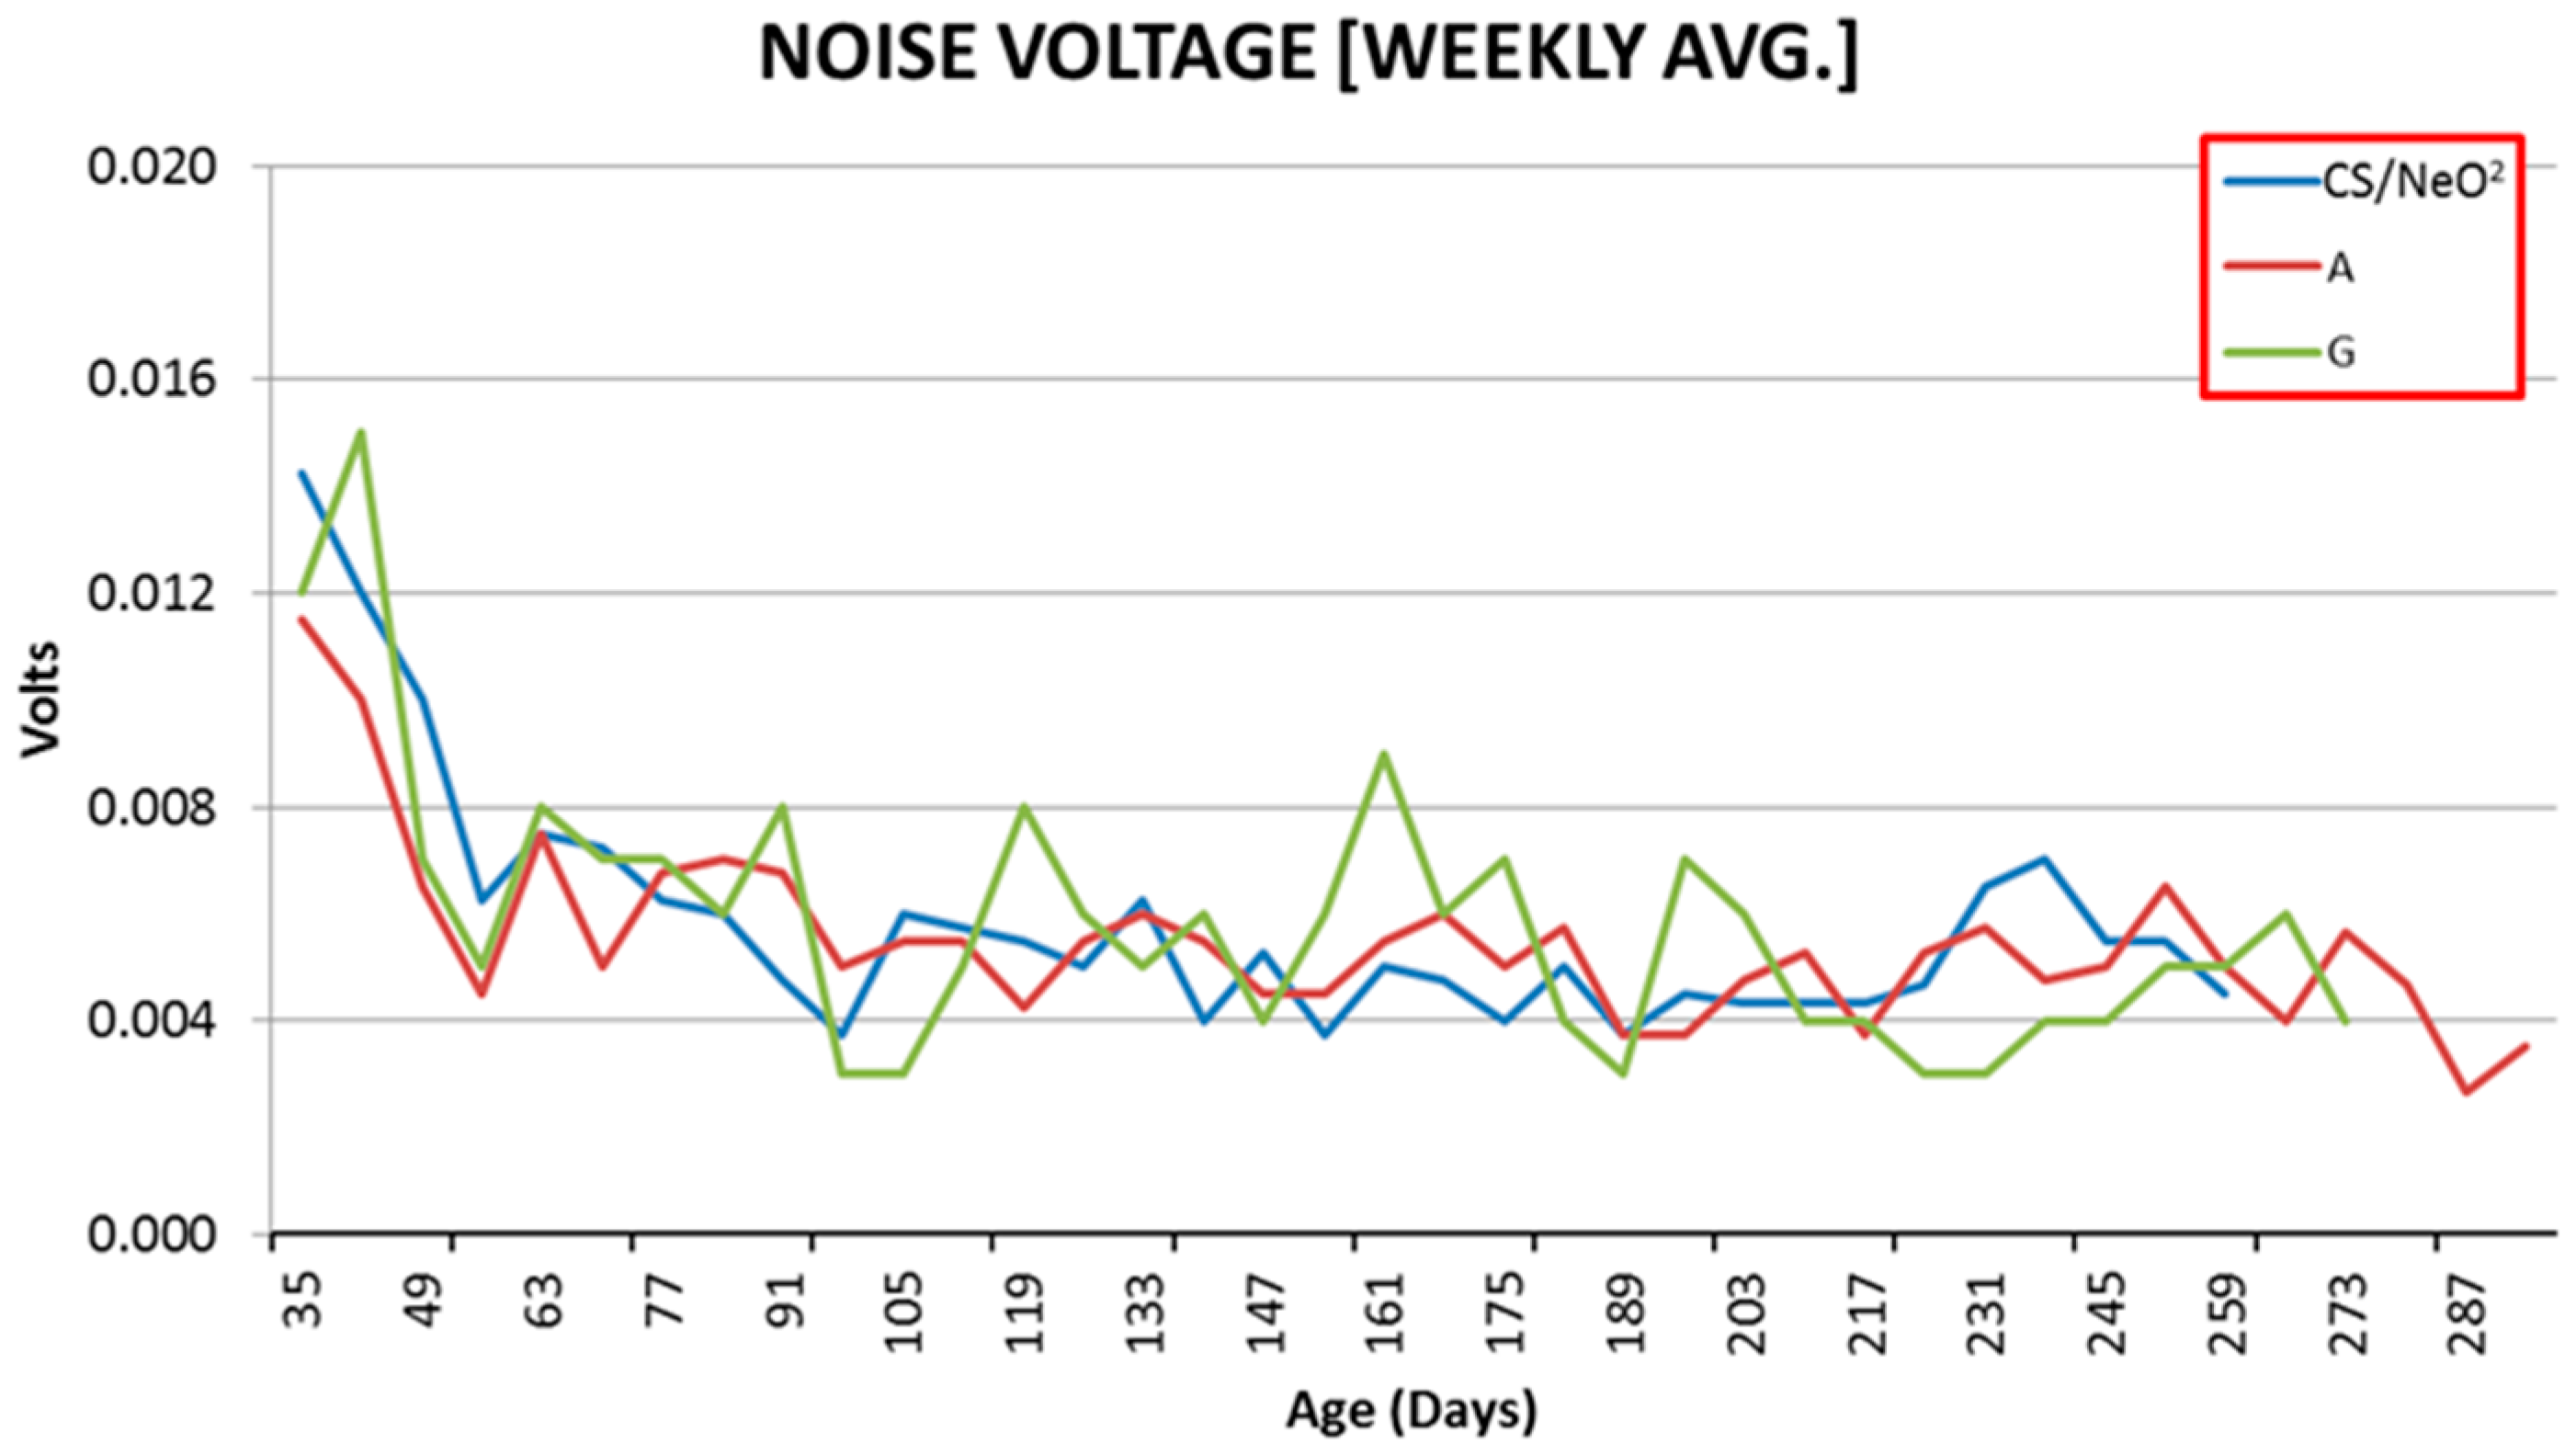
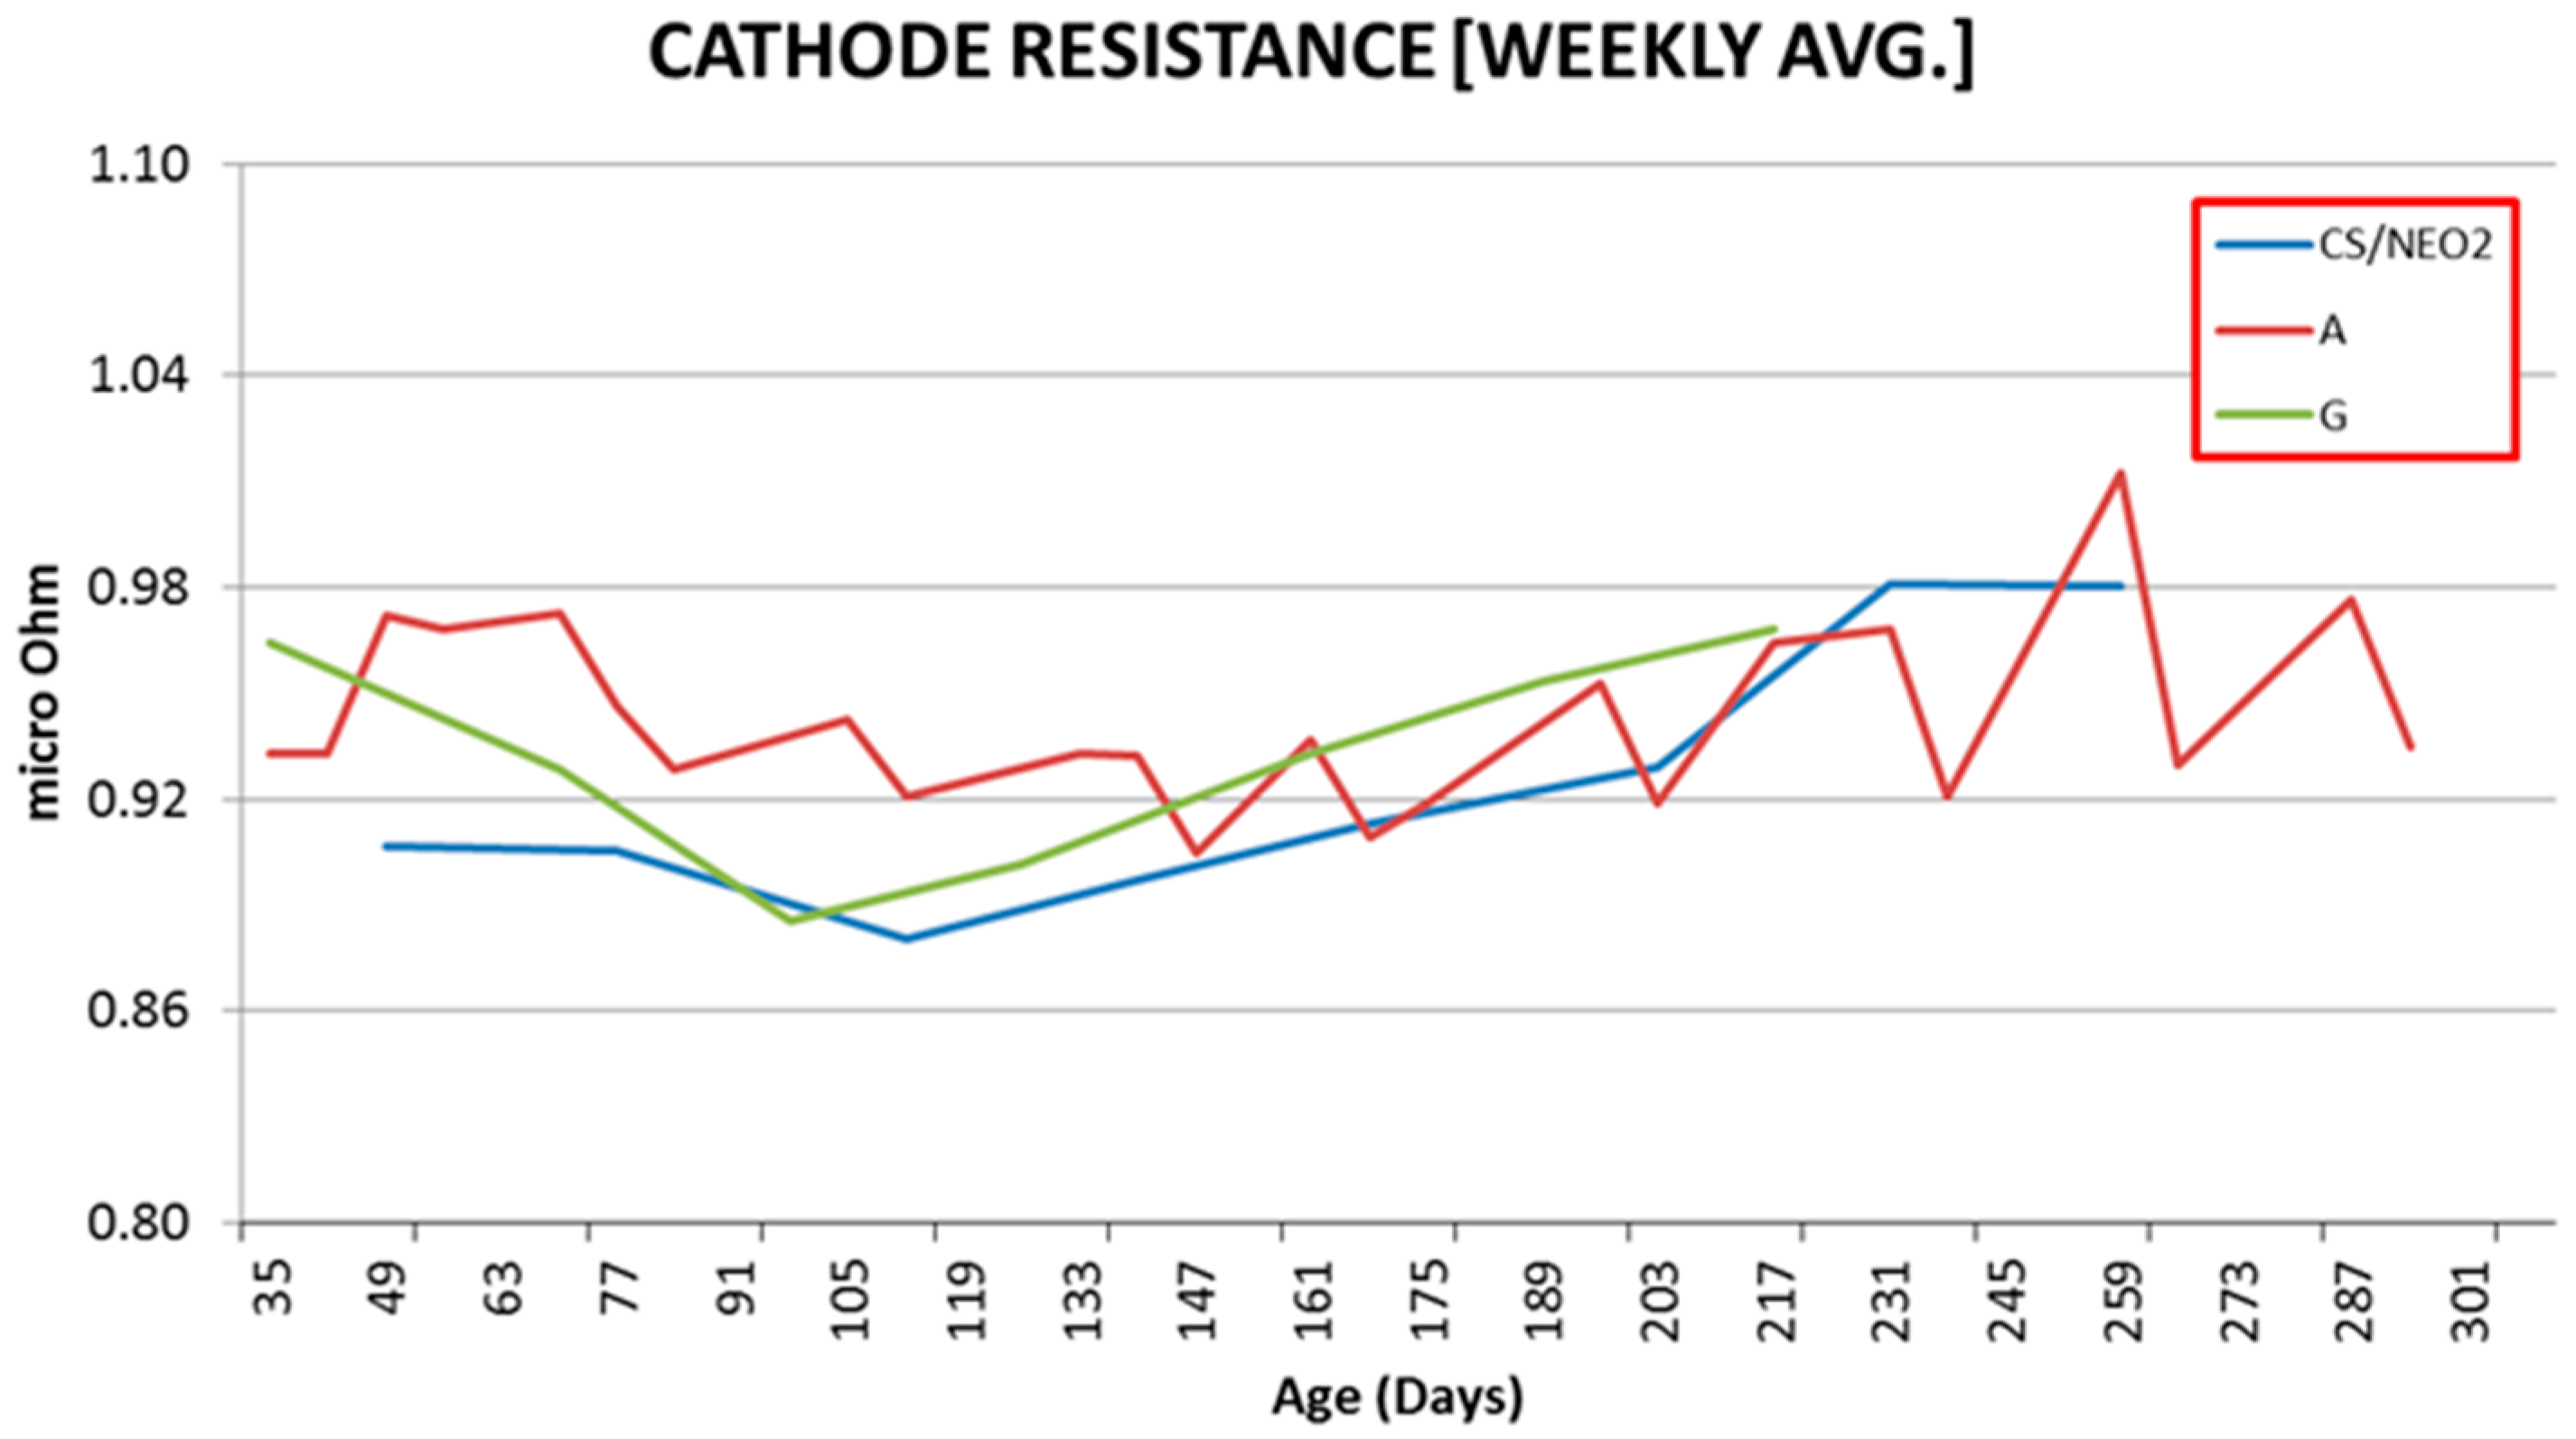
In the data shown against pot age in Figure 8, Figure 9, Figure 10 and Figure 11, there is a maximum time difference of 100 days since not all pots were started at the same time. This can be clearly seen in the amperage graph.
The data for the parameters in the figures show that there is no significant difference, besides the normal process variations, between pots with NeO2 paste (blue curves) and pots with other pastes (red and green curves).
5.2. Pot Age Distribution
Trials of NeO2 pastes started in DUBAL in 2011, involving two pots. The trial expanded in 2012 and 2013. After the material was approved in July 2013, larger quantities were procured. Figure 12 shows distribution of pot age of operating pots using NeO2 and CleO2 in DUBAL as of October 2015.
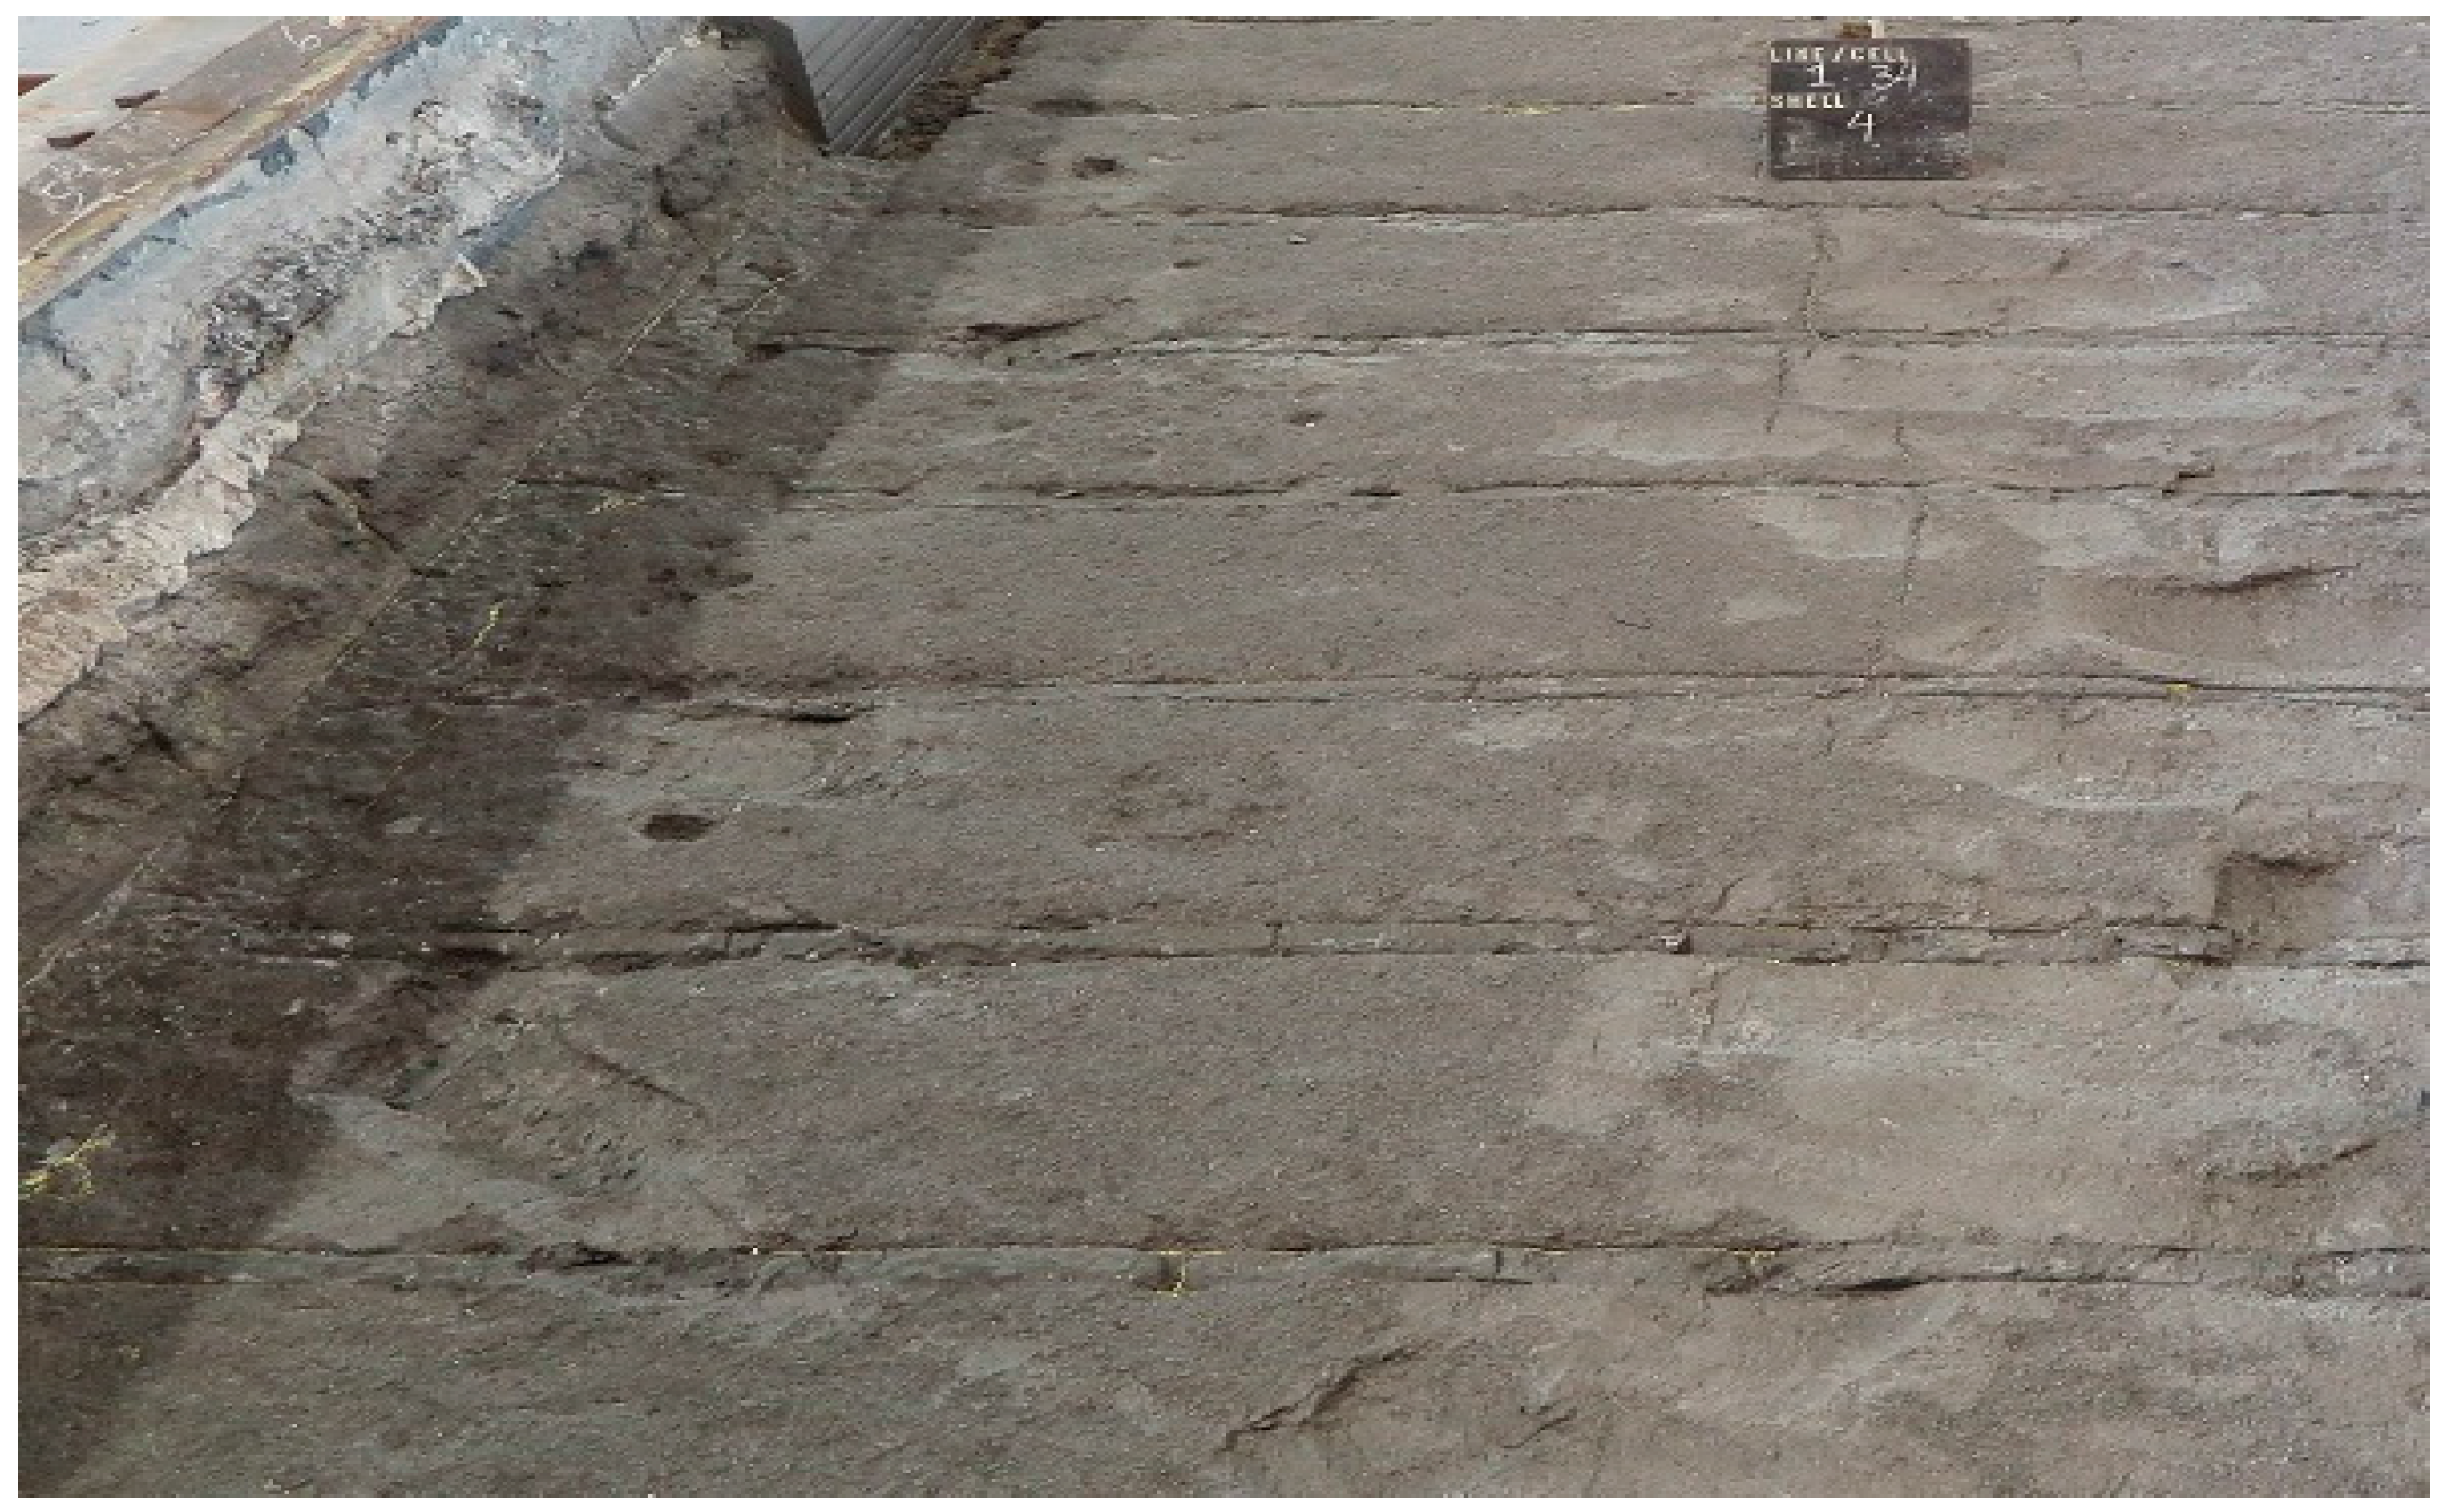
5.3. Cut-Out Pot Cavity Clean
Due to different expansion projects in D18 and DX Technology, there was an opportunity to inspect pots rammed with NeO2 and CleO2 pastes at ages 680 days and 369 days, respectively. As per Figure 13 and Figure 14, no evidence of negative behavior regarding paste performance was observed so far, either in D18 pots with graphitic cathode blocks or in DX pots with graphitized cathode blocks.
5.4. Preheat and Start-up
Pot preheat was normal, following standard practices. Figure 15 shows the preheat temperature evolution during preheat. All pastes show normal preheat temperatures. After the bath-up, there were no observations of peculiar behavior during pot start-up and no leakage of bath or metal in pots with the tested ramming pastes. All parameters were similar to pots with regular approved supplier material.
The different pastes were used in EGA in different potlines. All pastes behave the same and the pots’ performance is good.
6. Conclusions
Various ramming pastes, including eco-friendly (EF) and 100% clean pastes, have been analyzed. Their chemical and physical properties show some differences between pastes. A test to monitor the emissions during baking of the pastes has been developed and the results are presented. The pastes B and E that do not contain any PAH in their chemical composition do not release significant PAH during baking (ETF at zero). Paste D that contains a high level of the most hazardous PAH (high value of ETF), also releases a high amount of these PAH during baking. Pastes A and C, which present both the same intermediate ETF composition do not behave the same during baking, and surprisingly the ETF level of paste C reaches the one of paste D.
The performance of these new types of clean pastes in EGA pots is good and does not differ from other pastes.
Author Contributions
Mohamed Tawfik and Arvind Kumar supplied the samples and gathered the performance data on their pots; Bénédicte Allard analyzed the paste samples.
Conflicts of Interest
The authors declare no conflict of interest.
References
- Allard, B.; Paulus, R.; Billat, G. A new ramming paste with improved potlining working conditions. Light Met. 2011, 1091–1096. [Google Scholar] [CrossRef]
- Doornaert, B.; Pichard, A. Hydrocarbures Polycycliques Aromatiques (HAPs); Final report 18 December 2003; INERIS: France, 2003. [Google Scholar]
- Allard, B.; Dreyfus, J.M.; Lenclud, M. Evolution of thermal, electrical and mechanical properties of graphitized cathode blocks for aluminium electrolysis cells with temperature. Light Met. 2000, 515–521. [Google Scholar]
Figure 1.
Green density curves versus number of strokes for the five pastes.

Figure 2.
Relation between maximum density given by the Fischer Sand Rammer (FSR) and the apparent green density given by the hand rammer.
Figure 2.
Relation between maximum density given by the Fischer Sand Rammer (FSR) and the apparent green density given by the hand rammer.

Figure 3.
Relation between volume expansion and baked density.

Figure 4.
Relation between flexural strength and crushing strength.

Figure 5.
Equipment to follow-up PAH and VOC emissions during paste baking.

Figure 6.
Example of a kinetic curve of ethylbenzene and benzene emissions in paste C.

Figure 7.
Emission of gaseous PAH versus temperature for paste C.

Figure 8.
Cell resistance weekly average values ((in micro Ohm)) for pots with different pastes.

Figure 9.
Line amperage average weekly values (in kA) for pots with different pastes.

Figure 10.
Noise voltage average weekly values (in Volts) for pots with different pastes.

Figure 11.
Cathode resistance average weekly values (in micro Ohm) for pots with different pastes.

Figure 12.
Pot age distribution for DUBAL pots with NeO2/CleO2 pastes, October 2015.

Figure 13.
Cleaned D18 pot cavity with NeO2 paste at 680 days.

Figure 14.
Cleaned DX pot cavity with CleO2 paste at 369 days.

Figure 15.
Preheat temperature for DX pots with different pastes.


| Sample ID | A | B | C | D | E |
|---|---|---|---|---|---|
| T range (°C) | 20 to 40 | 10 to 50 | 17 to 42 | 20 to 40 | 10 to 50 |
| Expiry date | End of September 2015 | End of July 2015 | End of Jane 2016 | End of July 2015 | End of March 2016 |
Table 2.
Polycyclic aromatic hydrocarbons (PAH), benzene, toluene, ethylbenzene, xylene (BTEX), and volatile organic compounds (VOC) composition of the pastes in mg/kg.
| Component (mg/kg) | A | B | C | D | E |
|---|---|---|---|---|---|
| Fluoranthene | 1529 | <10 | 1817 | 1255 | <10 |
| Benzo(b + j)fluoranthene | 54.1 | <10 | 37.2 | 1745 | <10 |
| Benzo(k)fluoranthene | 16.7 | <10 | 11.2 | 392 | <10 |
| Benzo(a)pyrene | 59.1 | <10 | 38.4 | 1373 | <10 |
| Indeno(1,2,3)pyrene | 69.2 | <10 | 53.8 | 459 | <10 |
| Benzo(g,h,i)perylene | 143 | <10 | 88.5 | 1294 | <10 |
| Naphtalene | 663 | <10 | 492 | 14,137 | <10 |
| Acenaphtene | 13,394 | <10 | 16,481 | 13,196 | <10 |
| Fluorene | 7798 | <10 | 12,327 | 2863 | <10 |
| Phenantrene | 4683 | <10 | 5587 | 882 | <10 |
| Pyrene | 808 | <10 | 1087 | 1088 | <10 |
| Benzo(a)anthracene | 51.6 | <10 | 59.7 | 892 | <10 |
| Chrysene | 45.7 | <10 | 54.9 | 1088 | <10 |
| Acenaphtylene | <10 | <10 | 12.9 | 31.7 | <10 |
| Dibenzo(a,h)anthracene | 21.5 | <10 | 18.3 | 190 | <10 |
| Anthracene | 541 | <10 | 554 | 155 | <10 |
| Benzo(b)naphto(2,1-d)thiophene | <10 | <10 | 10.1 | 122 | <10 |
| PAH total | 29,877 | - | 38,730 | 41,163 | - |
| Benzene | <0.05 | <0.05 | <0.05 | <0.05 | <0.05 |
| Toluene | <0.05 | <0.05 | 0.23 | <0.05 | <0.05 |
| Ethylbenzene | 0.15 | <0.05 | 0.55 | 0.21 | <0.05 |
| Xylene | 0.19 | <0.10 | 0.54 | 0.61 | <0.10 |
| BTEX total | 0.34 | - | 0.78 | 0.82 | - |
| dichloromethane | 0.38 | 0.31 | 0.37 | 0.4 | 0.32 |
| trimethyl-1,2,4 benzene | 0.07 | <0.05 | 0.1 | 0.68 | <0.05 |
| trimethyl-1,3,5 benzene | 0.1 | <0.05 | 0.18 | 1.1 | <0.05 |
| n-butyl benzene | 0.14 | <0.05 | 0.2 | 0.26 | <0.05 |
| cumene | <0.05 | <0.05 | 0.1 | 0.08 | <0.05 |
| n-propyl benzene | <0.05 | <0.05 | 0.06 | <0.05 | <0.05 |
| styrene | <0.25 | <0.25 | <0.25 | 0.28 | <0.25 |
| cymene | <0.05 | <0.05 | <0.05 | 0.1 | <0.05 |
Table 3.
Relative potency factor [2].
| PAH | Relative Potency Factor (RPF) |
|---|---|
| Naphtalene (NA) | - |
| Fluorene (FL) | 0.001 |
| Phenantrene (PH) | 0.001 |
| Anthracene (ANT) | 0.01 |
| Fluoranthene (FA) | 0.001 |
| Pyrene (PY) | 0.001 |
| Benzo(a)anthracene (BaA) | 0.1 |
| Chrysene (CH) | 0.01 |
| Benzo(b)fluoranthene (BbFA) | 0.1 |
| Benzo(k)fluoranthene (BkFA) | 0.1 |
| Benzo(a)pyrene (BaP) | 1 |
| Benzo(g,h,i)perylene (BghiP) | 0.01 |
| Dibenzo(a,h)anthracene (DiahA) | 1 |
| Indeno(1,2,3)pyrene (IP) | 0.1 |
Table 4.
Equivalent toxicity factor according to [2] for pastes A, C, and D.
| Type of Paste | A | C | D | Tepid | Cold | Tepid Eco-Friendly (EF) |
|---|---|---|---|---|---|---|
| Equivalent toxicity factor (ETF) (ppm) | 121.9 | 100.7 | 1943 | 2500 | 2300 | 300 |
| Type of Paste | A | B | C | D | E |
|---|---|---|---|---|---|
| N2 | 63 | 97 | 123 | 104 | 138 |
| ρmax (g/cm3) | 1.591 | 1.654 | 1.632 | 1.742 | 1.646 |
| Type of Paste | A | B | C | D | E |
|---|---|---|---|---|---|
| HAD (g/cm3) | 1.608 | 1.640 | 1.610 | 1.674 | 1.645 |
| Paste | Baked Density | Weight Loss (%) | Volume Expansion (%) | Thermal Conductivity (W/m·K) | Real Density | Crushing Strength (MPa) | Flexural Strength (MPa) | Young’s Modulus (GPa) | Open Porosity (%) | Total Porosity (%) | Electrical Resistivity (µΩ·m) | Ash Content (%) | Oxidation (%) |
|---|---|---|---|---|---|---|---|---|---|---|---|---|---|
| A | 1.450 | 9.7 | 0.2 | 5.0 | 1.857 | 12.7 | 2.1 | 3.6 | 19.1 | 20.8 | 92.0 | 6.6 | 6.6 |
| A’ | 1.443 | 9.6 | 0.7 | - | - | - | - | - | - | - | - | - | - |
| B | 1.431 | 12.2 | 0.6 | 5.0 | 1.825 | 17.4 | 3.3 | 7.3 | 18.8 | 20.6 | 70.4 | 3.3 | 4.5 |
| B’ | 1.428 | 12.2 | 0.8 | - | - | - | - | - | - | - | - | - | - |
| C | 1.468 | 8.8 | −0.1 | 7.5 | 1.862 | 15.6 | 2.9 | 4.2 | 18.3 | 20.6 | 70.0 | 2.9 | 4.5 |
| C’ | 1.464 | 9.0 | 0.1 | - | - | - | - | - | - | - | - | - | - |
| D | 1.539 | 9.3 | −1.2 | 12.1 | 1.976 | 19.9 | 4.1 | 4.9 | 19.0 | 21.6 | 47.7 | 4.6 | 9.9 |
| D’ | 1.516 | 9.8 | −0.5 | - | - | - | - | - | - | - | - | - | - |
| E | 1.403 | 11.9 | 3.3 | 7.5 | 1.938 | 18.2 | 4.3 | 7.3 | 22.6 | 25.8 | 48.6 | 2.3 | 5.2 |
| E’ | 1.381 | 12.6 | 4.1 | - | - | - | - | - | - | - | - | - | - |
| Type of Paste | A | B | C | D | E |
|---|---|---|---|---|---|
| Thermal conductivity at 1000 °C (W/m·K) | 11.9 | 13.1 | 13.9 | 16.2 | 13.9 |
| Electrical resistivity at 1000 °C (µΩ·m) | 67 | 52 | 48 | 36 | 37 |
Table 9.
Detection limits for VOC. µGC: micro gas chromatography; TCD: thermal conductivity detector; MS: mass spectrometer.
| Molecules | Methods of Measurement | Detection Limit per Molecule (ppm) |
|---|---|---|
| O2, N2 | μGC/TCD | 100 |
| Methane, CO | μGC/TCD | 40 |
| H2, CO2, light VOC C2 to C3 | μGC/TCD | 5 |
| Light VOC C3 to C9 | μGC/TCD/MS | 1 |
| Component (mg/kg) | A | B | C | D | E |
|---|---|---|---|---|---|
| FA | 507 | - | 284 | 553 | - |
| BbjFA | - | - | - | - | - |
| BkFA | 200 | - | 39 | 665 | - |
| BaP | 158 | - | 50 | 302 | - |
| IP | 37 | - | - | - | - |
| BghiP | 136 | - | 11 | - | - |
| NA | 680 | 50 | 174 | 1548 | 59 |
| AC | 4138 | 11 | 2104 | 1744 | 20 |
| FL | 2114 | 15 | 2546 | 338 | 33 |
| PH | 1439 | 12 | 1379 | 351 | 26 |
| PY | 452 | - | 233 | 501 | - |
| BaA | 3 | - | - | 97 | - |
| CH | 3 | - | - | 20 | - |
| ACY | 297 | - | 306 | 404 | - |
| DiahA | 84 | - | 20 | 17 | - |
| ANT | 326 | - | 403 | 199 | 7 |
| BbNT | - | - | - | - | - |
| PAH sum | 10573 | 88 | 7549 | 6738 | 146 |
| ETF | 251 | 0 | 82 | 323 | 0 |
| CO2 | <LD | 12391 | 224 | 1315 | 13182 |
| CH4 | 1383 | 1287 | 673 | 805 | 1306 |
| CO | 679 | 5823 | 818 | 1609 | 5868 |
| H2 | 181 | 813 | - | 2106 | 742 |
| Permanent gas | 2244 | 20314 | 1715 | 5834 | 21098 |
| Total VOC | 84 | 5166 | 133 | 101 | 6009 |
| BTEX | 50 | 169 | 133 | 71 | 130 |
© 2016 by the authors; licensee MDPI, Basel, Switzerland. This article is an open access article distributed under the terms and conditions of the Creative Commons Attribution (CC-BY) license (http://creativecommons.org/licenses/by/4.0/).
Share and Cite
MDPI and ACS Style
Allard, B.; Tawfik, M.; Kumar, A. Performances of Green and Eco-Friendly Ramming Pastes in EGA Pots. Metals 2016, 6, 112. https://doi.org/10.3390/met6050112
AMA Style
Allard B, Tawfik M, Kumar A. Performances of Green and Eco-Friendly Ramming Pastes in EGA Pots. Metals. 2016; 6(5):112. https://doi.org/10.3390/met6050112
Chicago/Turabian StyleAllard, Bénédicte, Mohamed Tawfik, and Arvind Kumar. 2016. "Performances of Green and Eco-Friendly Ramming Pastes in EGA Pots" Metals 6, no. 5: 112. https://doi.org/10.3390/met6050112
Note that from the first issue of 2016, this journal uses article numbers instead of page numbers. See further details here.