Article

Microstructural Evolution and Mechanical Properties of Al-Si-Mg-Cu Cast Alloys with Different Cu Contents

1
School of Iron and Steel, Soochow University, Suzhou 215021, China
2
High-Performance Metal Structural Materials Research Institute, Soochow University, Suzhou 215021, China
3
School of Automotive and Transportation, Yancheng Polytechnic College, Yancheng 215400, China
4
Key Laboratory of Electromagnetic Processing of Materials, Ministry of Education, Northeastern University, Shenyang 110819, China
5
Shandong Weiqiao Aluminum & Electricity Co., Ltd., Binzhou 256200, China
*
Authors to whom correspondence should be addressed.
Metals 2023, 13(1), 98; https://doi.org/10.3390/met13010098
Submission received: 5 December 2022 / Revised: 27 December 2022 / Accepted: 28 December 2022 / Published: 2 January 2023
(This article belongs to the Special Issue Aluminum Alloys and Aluminum-Based Matrix Composites)

Abstract

:
The mechanical properties of Al-Si-Mg-Cu cast alloys are heavily determined by Cu content due to the precipitation of relating strengthening precipitates during the aging treatment. In this study, the microstructures and mechanical properties of Al-9Si-0.5Mg-xCu (x = 0, 0.9, 1.5, and 2.1 wt.%) alloys were investigated to elucidate the effect of Cu content on the evolution of their mechanical properties. After T6 (480 °C + 6 h − 530 °C + 4 h, 175 °C + 10 h) treatment, Mg-rich and Cu-rich phases were dissolved in the matrix; the main aging-precipitates of the alloys change from the needle-like β″ phases in the base alloy to the granular Q′ phases in the 0.9Cu alloy, the granular Q′ phase in the 1.5Cu alloy, the granular Q′ phase, and θ′ platelets in the 2.1Cu alloy. The increase of Cu level results in difference of the type, number density, and morphology of the nanoscale precipitated phase. Because of precipitation strength, the yield strength was increased by 103–130 MPa depending on the Cu contents. The precipitation strengthening effect of the precipitates was quantitatively evaluated by the Orowan mechanism. The aging-treated Al-9Si-0.5Mg-2Cu alloy shows the good strength and ductility: yield strength 351 MPa, ultimate tensile strength 442 MPa, and elongation 8.4%. The morphologies of fracture surfaces of the alloys also were observed.

1. Introduction

Al-Si cast aluminum alloys are extensively used in the automobile field due to their superior castability, satisfactory mechanical and physical properties, and low coefficient of thermal expansion [1,2,3,4]. Adding Mg to Al-Si alloys plays a role in solid solution strengthening and precipitation hardening of aging treatment [5,6,7]. Cu can significantly increase the mechanical properties of Al-Si-Mg alloys with the formation of nanoscale θ′ and Q′ precipitates during aging [7,8,9,10]. Unlike that of Al-Si-Mg and Al-Si-Cu cast alloys, the precipitation strengthening of the Al-Si-Mg-Cu alloy is mainly related to the β″, θ′, and/or Q′ phases; meanwhile, the type and volume fraction of Mg and/or Cu-rich precipitates are closely related to heat-treatment conditions and Cu level [7,9,10]. However, the enhanced strength of the Al-Si-Mg alloys with Cu addition is usually at the expense of their ductility. In addition, the addition of Cu can decrease the melting point and eutectic temperature of Al-Si-Mg alloys, leading to an increase in the solidification range of the alloys and facilitating porosity formation. Simultaneously, with the increase in Cu content, the precipitates in Al-Si-Mg alloys constantly change in type, morphology, quantity, and size [7,9,10,11,12,13]. Some useful understandings have been reported in the properties and precipitation behavior change with Cu addition in these quaternary alloys [4,7,8]. Shang [12] systematically analyzed the phase component of these alloys with a wide Cu level (0.01–4.5 wt.%) and discussed the effect of precipitates on mechanical properties. The previous works mainly focus on the strengthen effect of θ′ precipitates in high-Cu/low-Mg Al-Si-Mg-Cu alloy. When Mg content increases and ratio of Cu/Mg decreases, the Q′ nano-phase may show a high fraction after aging treatment, which may change the aging-strengthen effect. However, the work on systematic observation and characterization needs to be conducted in greater detail in low-ratio of Cu/Mg alloy, including the effects of precipitates on the hardening behavior of these alloys.
Therefore, the current study mainly evaluates the effect of Cu content on the microstructural evolution and mechanical properties of Al-9Si-0.5Mg-xCu alloys (Cu/Mg: 0–4) and discusses the contribution of precipitates to the hardening behavior of Al-Si-Mg-xCu alloys.

2. Materials and Methods

2.1. Material Preparation

Commercial-purity Al (99.9%), pure Mg (99.95%), pure Cu (99.9%), Al-20%Si master alloys (all compositions quoted in this article are in weight percentage unless otherwise mentioned), and Al-10%Sr alloy as metamorphic eutectic Si were used to prepare Al-Si-Mg-Cu alloys in a 50 kW resistance furnace. Commercial-purity Al and Al-20%Si were first melted in the resistance furnace. The melt was heated to 740 °C and held at that temperature for 30 min to ensure all components were sufficiently mixed. Then, pure Cu and Mg were added into the melt at 750 °C and held for 20 min, followed by slag removal. The Al-10%Sr alloy was added into alloy melts at 730 °C. The alloy melt was ultimately poured into a water-cooled copper mold (25 × 100 × 200 mm3, Figure 1) to form an as-cast ingot [14,15,16].

2.2. Material Characterization

The measured compositions of the designed Al-Si-Mg-xCu alloys, which were noted as A1, A2, A3, and A4 were measured using an SPECTROLAB stationary metal analyzer (SPECTROLAB M12, Kleve, Germany). The results are listed in Table 1.
Compositional analysis and microstructural evaluation were conducted on samples near the center of the Φ10 mm tensile rods (the red area in Figure 1). The phase compositions of the as-cast alloys were analyzed using a X-ray diffraction (XRD) to identify the phase composition of the alloys with CuKα1 radiation by using PW3040/60X diffractometers. The samples were etched for 2–10 s by using 0.5% hydrofluoric acid for scanning electron microscopy (SEM) characterization using a Phenom X1 scanning electron microscopy (SEM) equipped with X-ray energy dispersive spectroscopy (EDS). The secondary dendrite arm spacing (SDAS) was measured by the intercept method. Quantitative measurements of the SDAS were conducted by optical microscopy using image analysis software (MEDIA CYBERNETICS, Rockville, MD, USA), at least 50 dendrites were measured and their average value is considered as the representation of SDAS [17].
Transmission electron microscope (TEM) samples of the region near the fracture were prepared by sectioning the tensile specimens in the transverse direction. The section near the center of the specimen was polished by hand to approximately 50 µm before a standard 3 mm disc was punched out. Then, the samples were placed on a Gatan 695 PIPS ion beam thinner (Gatan, Inc., Pleasanton, CA, USA). A FEI Tolos F200x (TEM, Tolos F200x, FEI Ltd., Pleasanton, CA, USA) transmission electron microscope equipped with the energy dispersive X-ray spectrometer was operated at an accelerating voltage of 200 kV. All images were taken along the <001>Al zone axis in order to characterize the cross-sections and side views of the precipitates. The average length (l) was calculated using 500 precipitates growing along [100] Al and [010] Al in total. The average area of cross-section of the precipitates (Acs) were calculated in 60 HRTEM images.

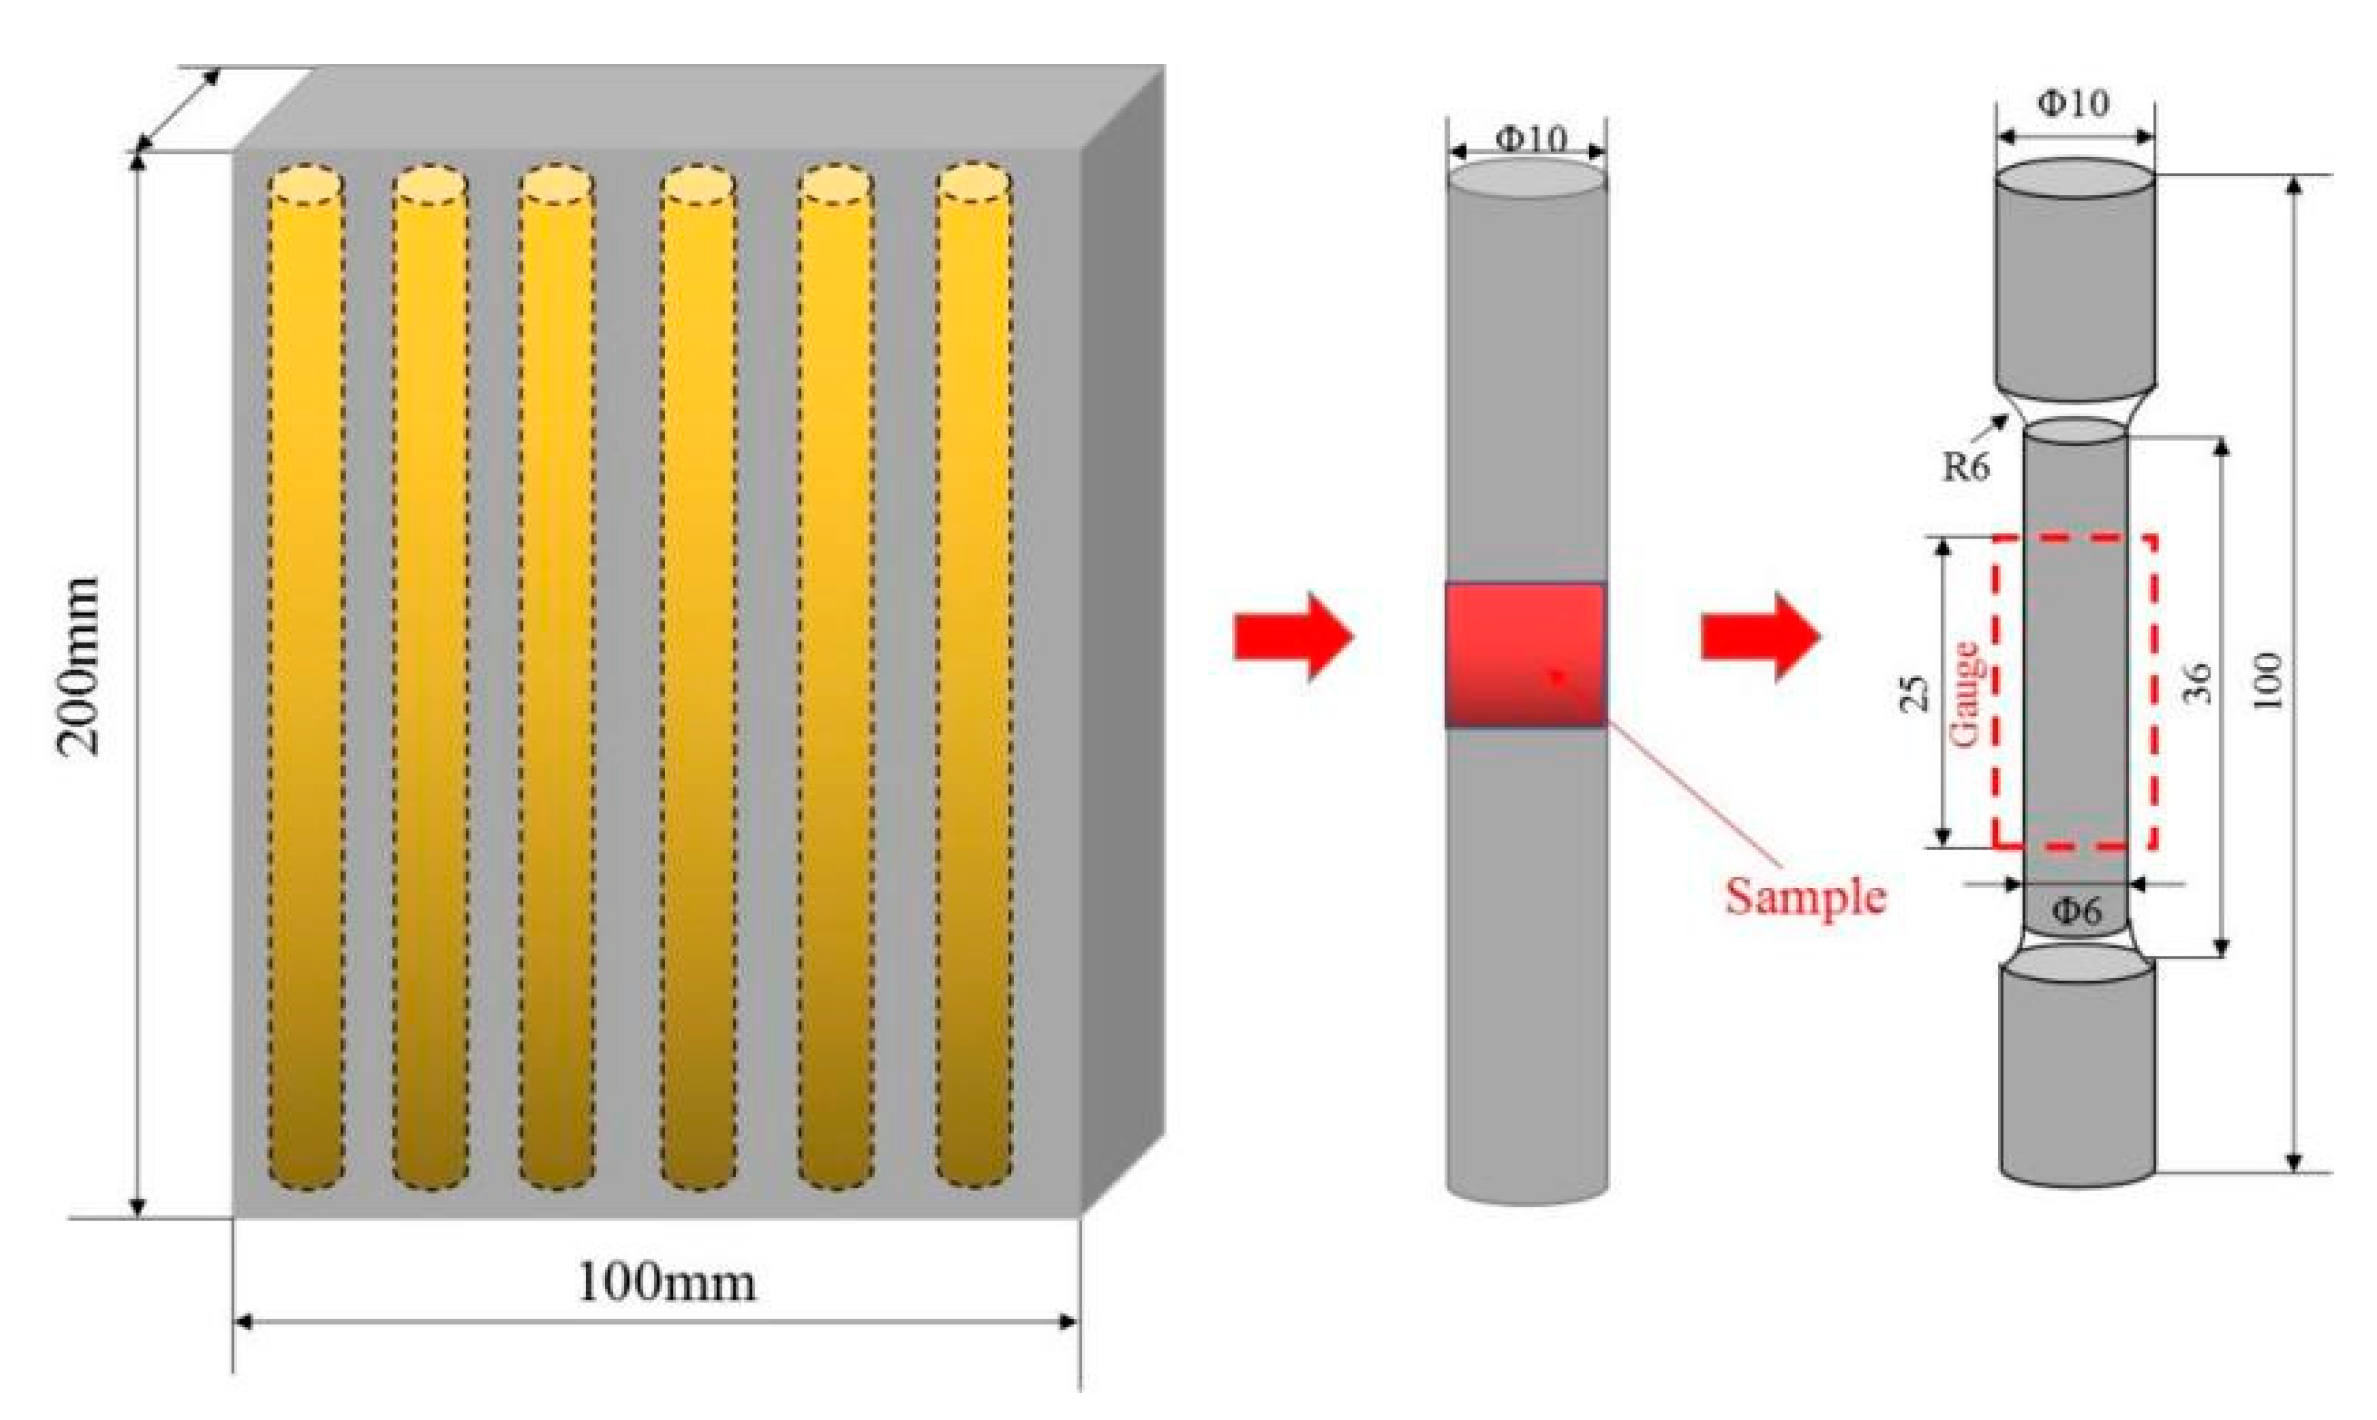
2.3. Mechanical Testing

All samples were treated with the solution at 480 °C − 6 h + 530 °C − 4 h, followed by cold water quenching (about 20 °C). Aging treatments were then performed at 175 °C for 10 h. The tensile property of the samples was tested on a DNS-300 universal experimental machine produced by Changchun Machinery Research Institute at a tensile rate of 1 mm/min. The extensometer with a gauge length of 25 mm was used. At least five tensile test specimens were tested for each alloy.

3. Results and Discussions

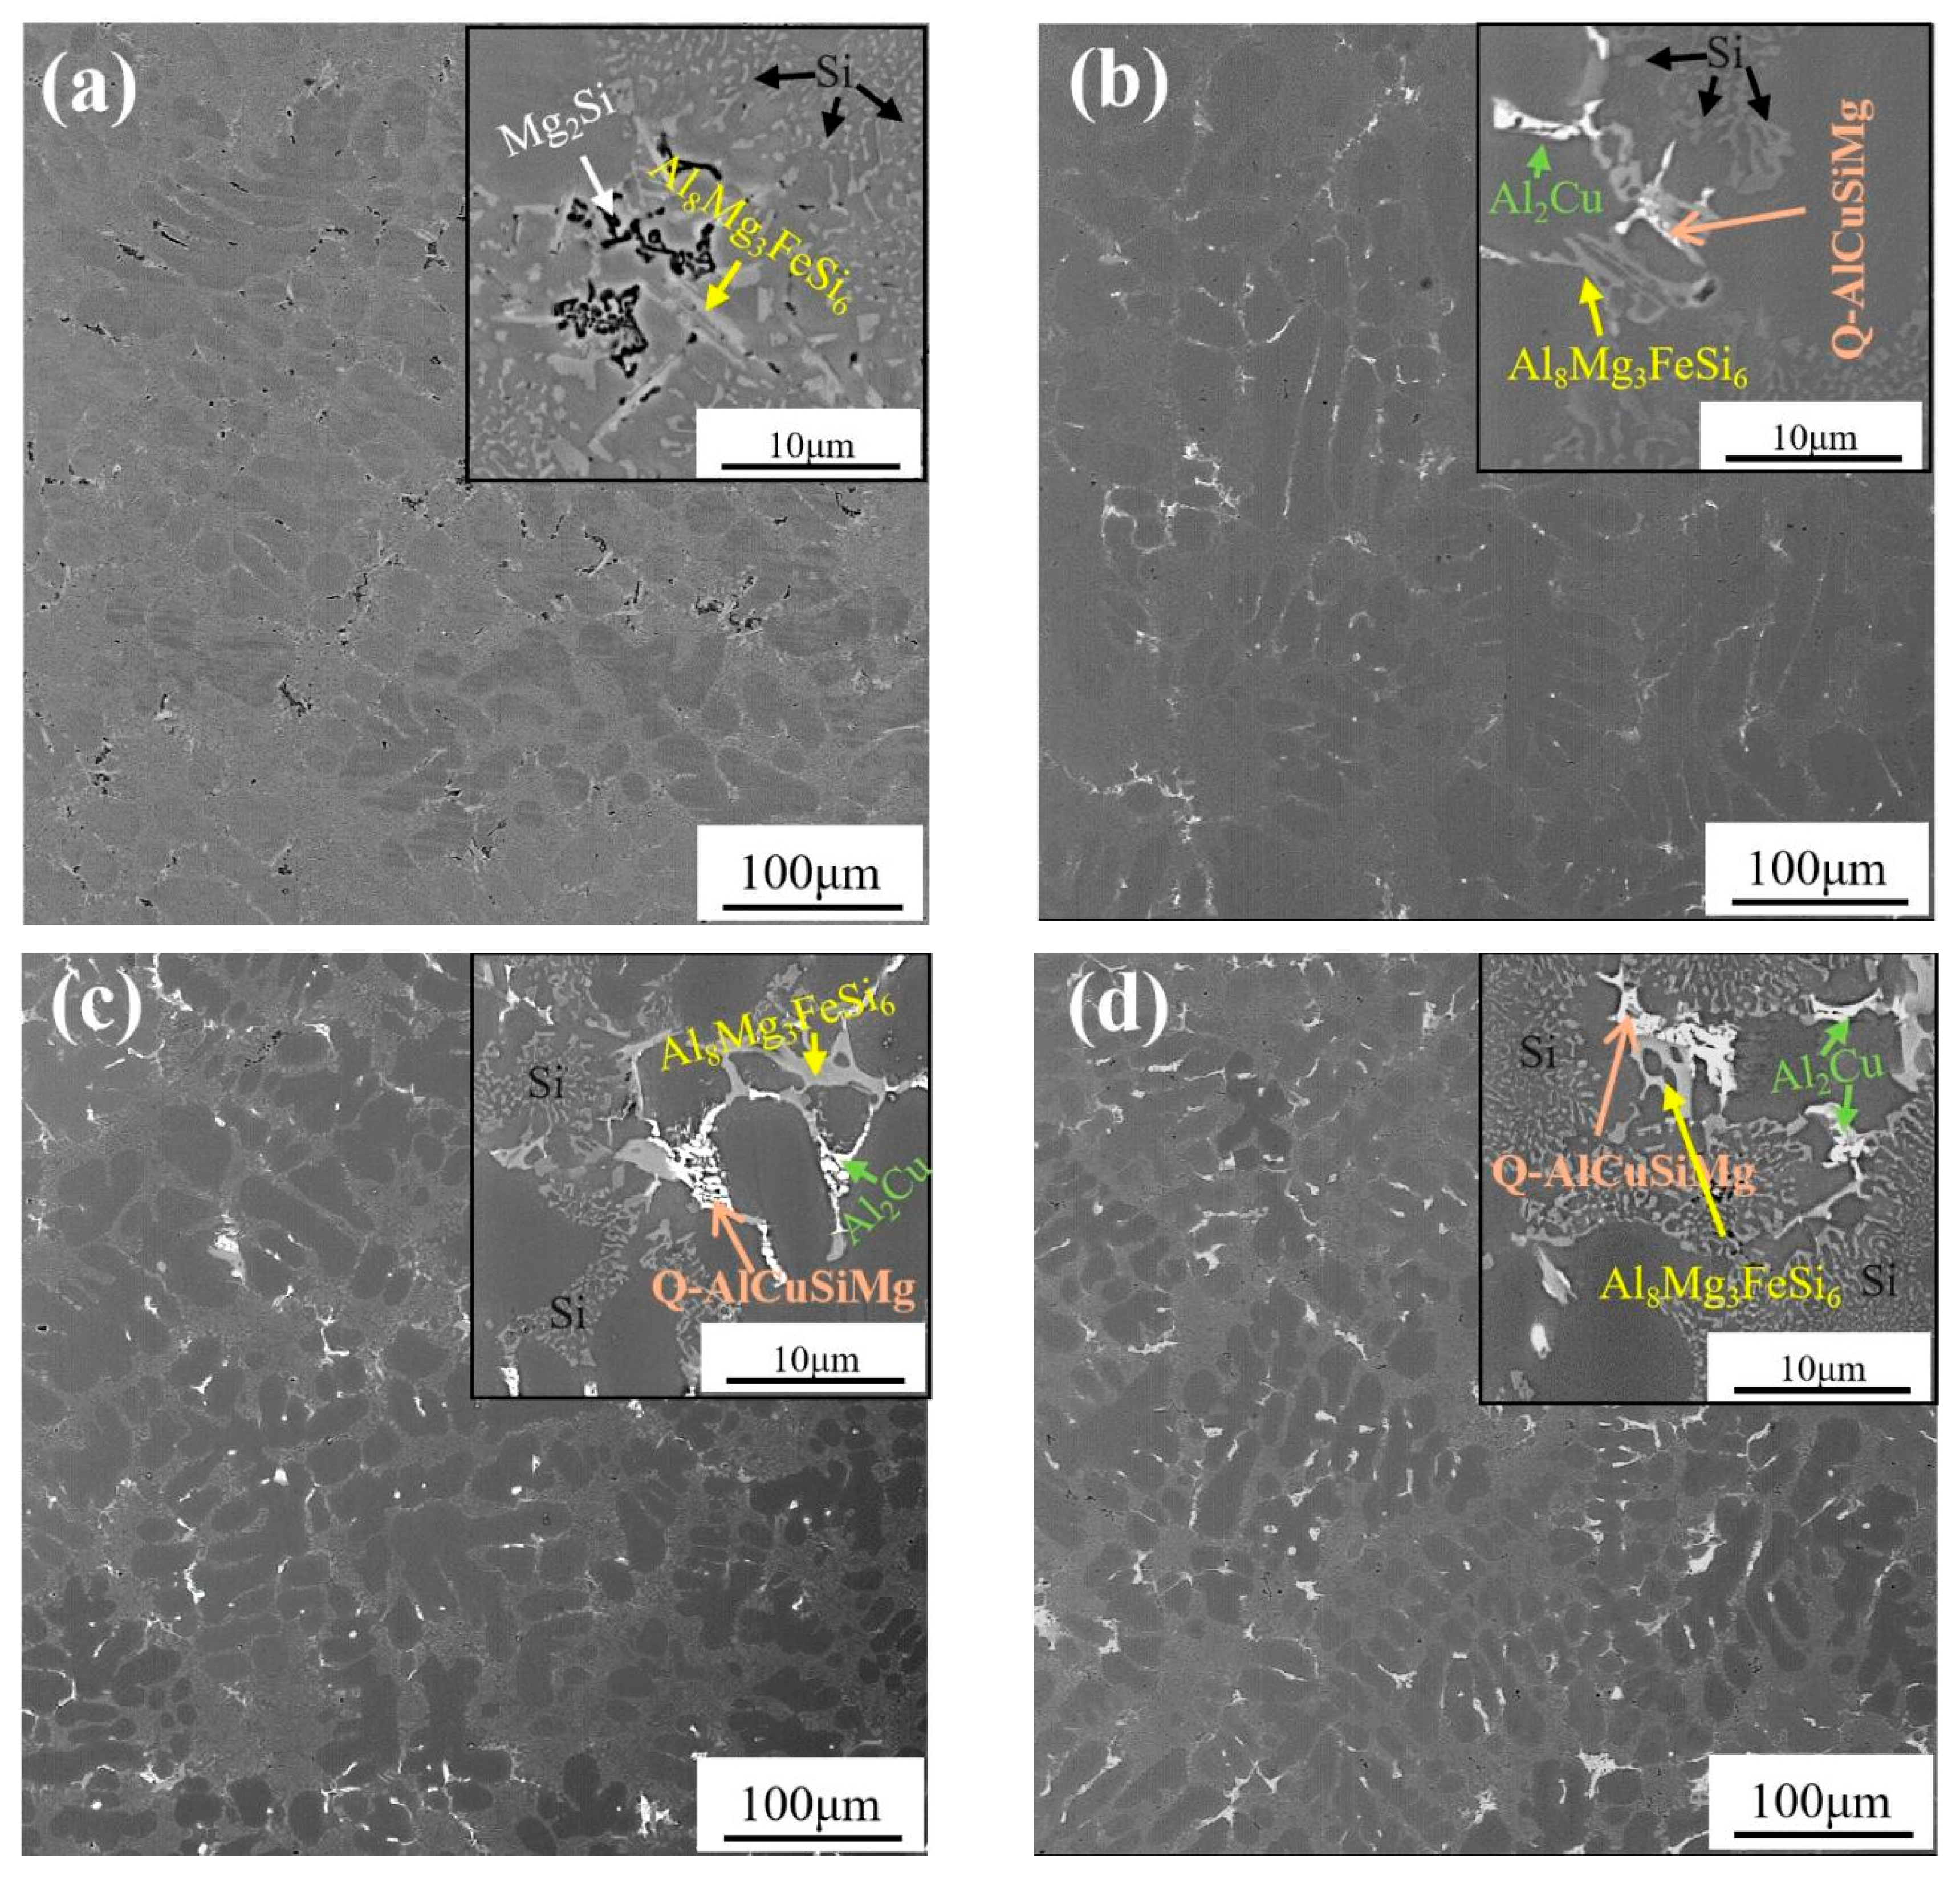
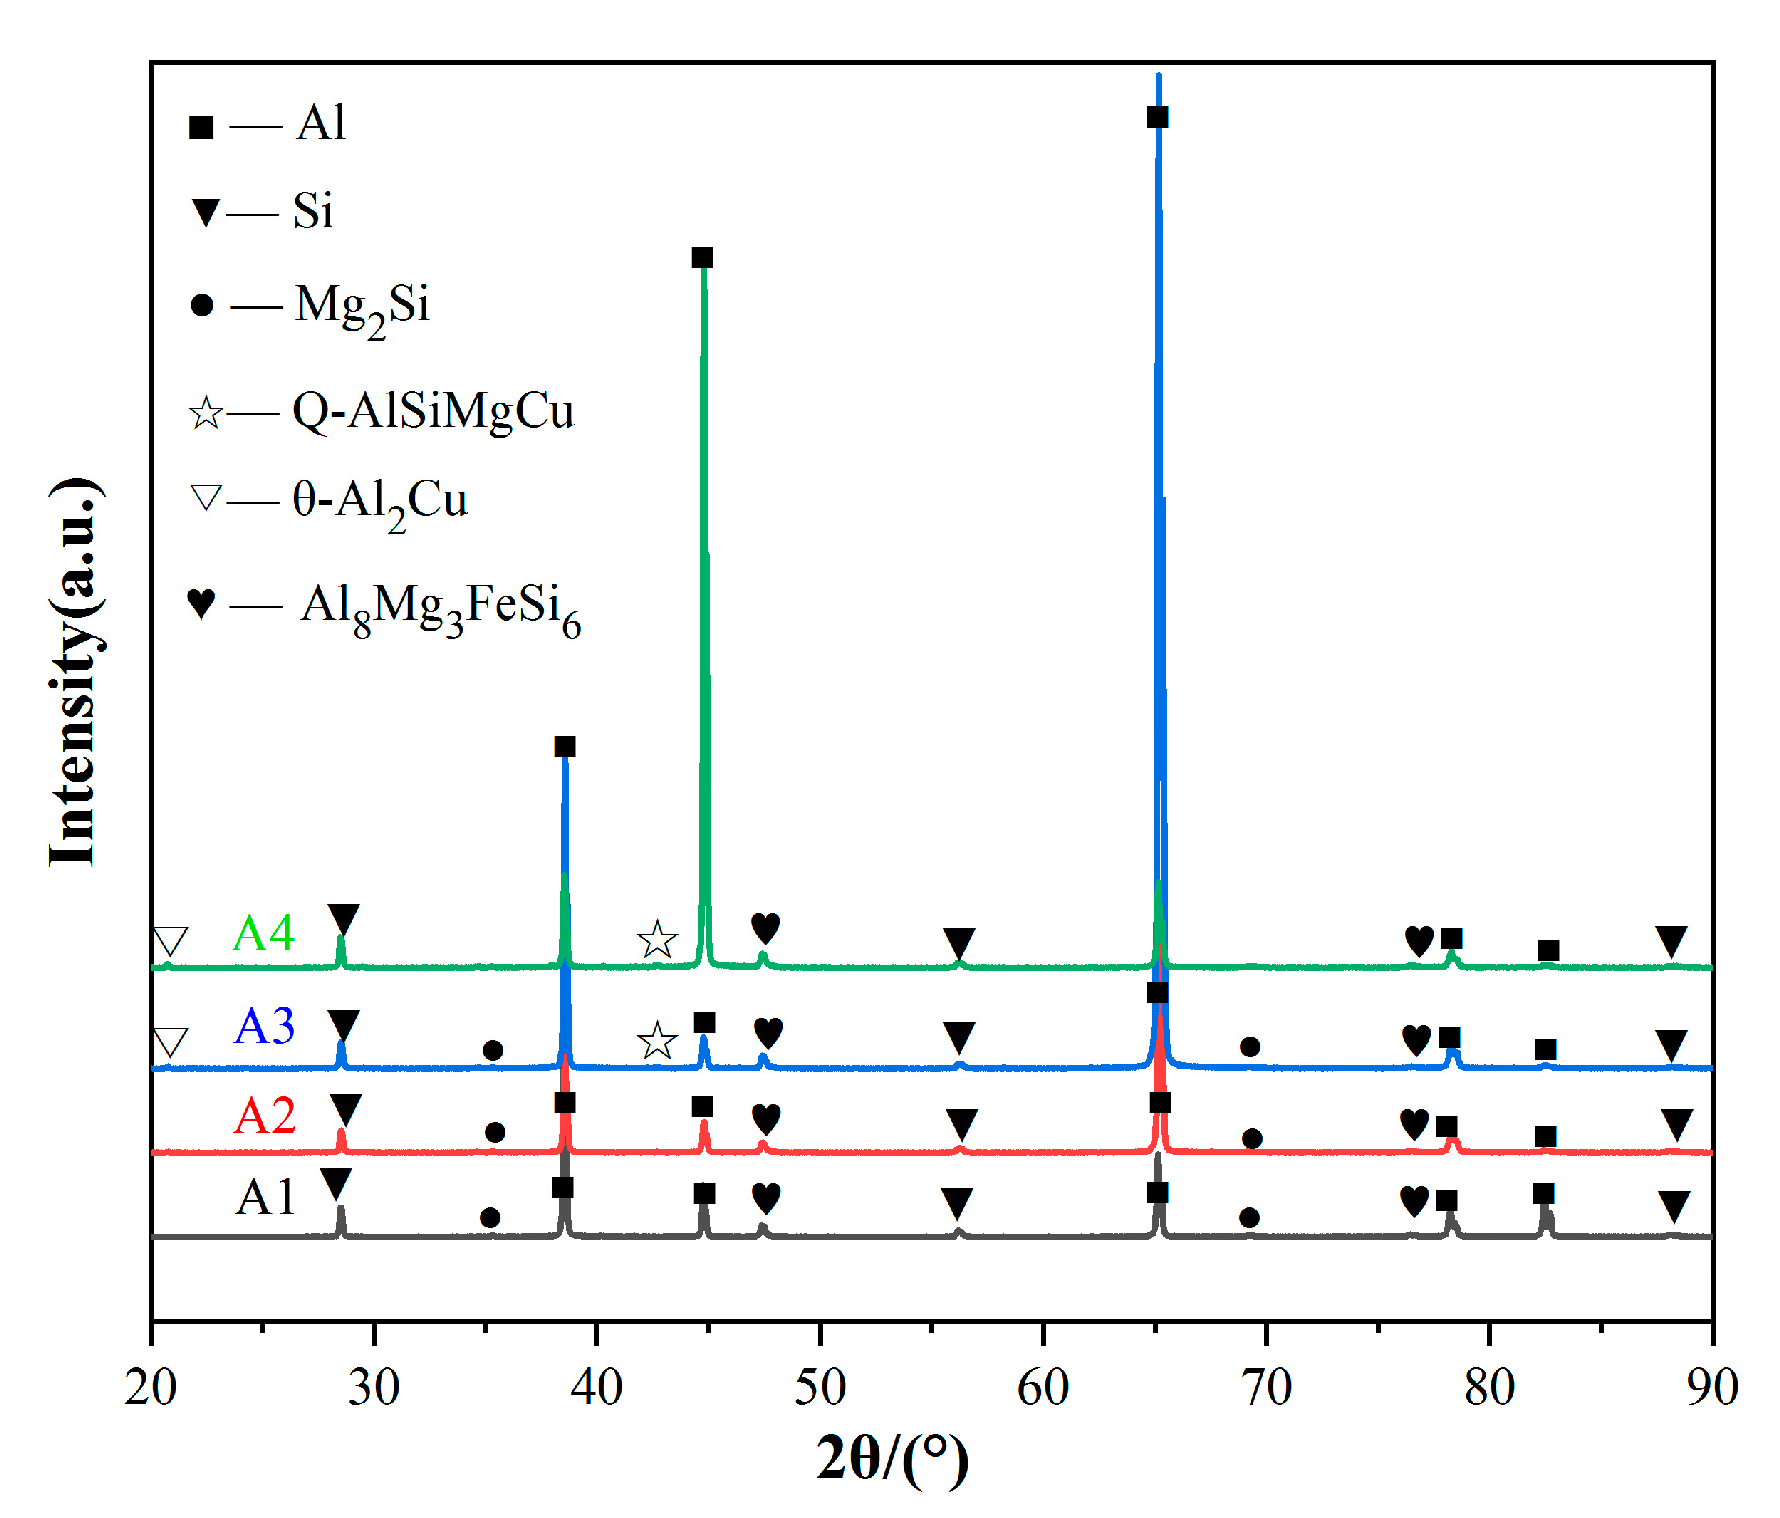
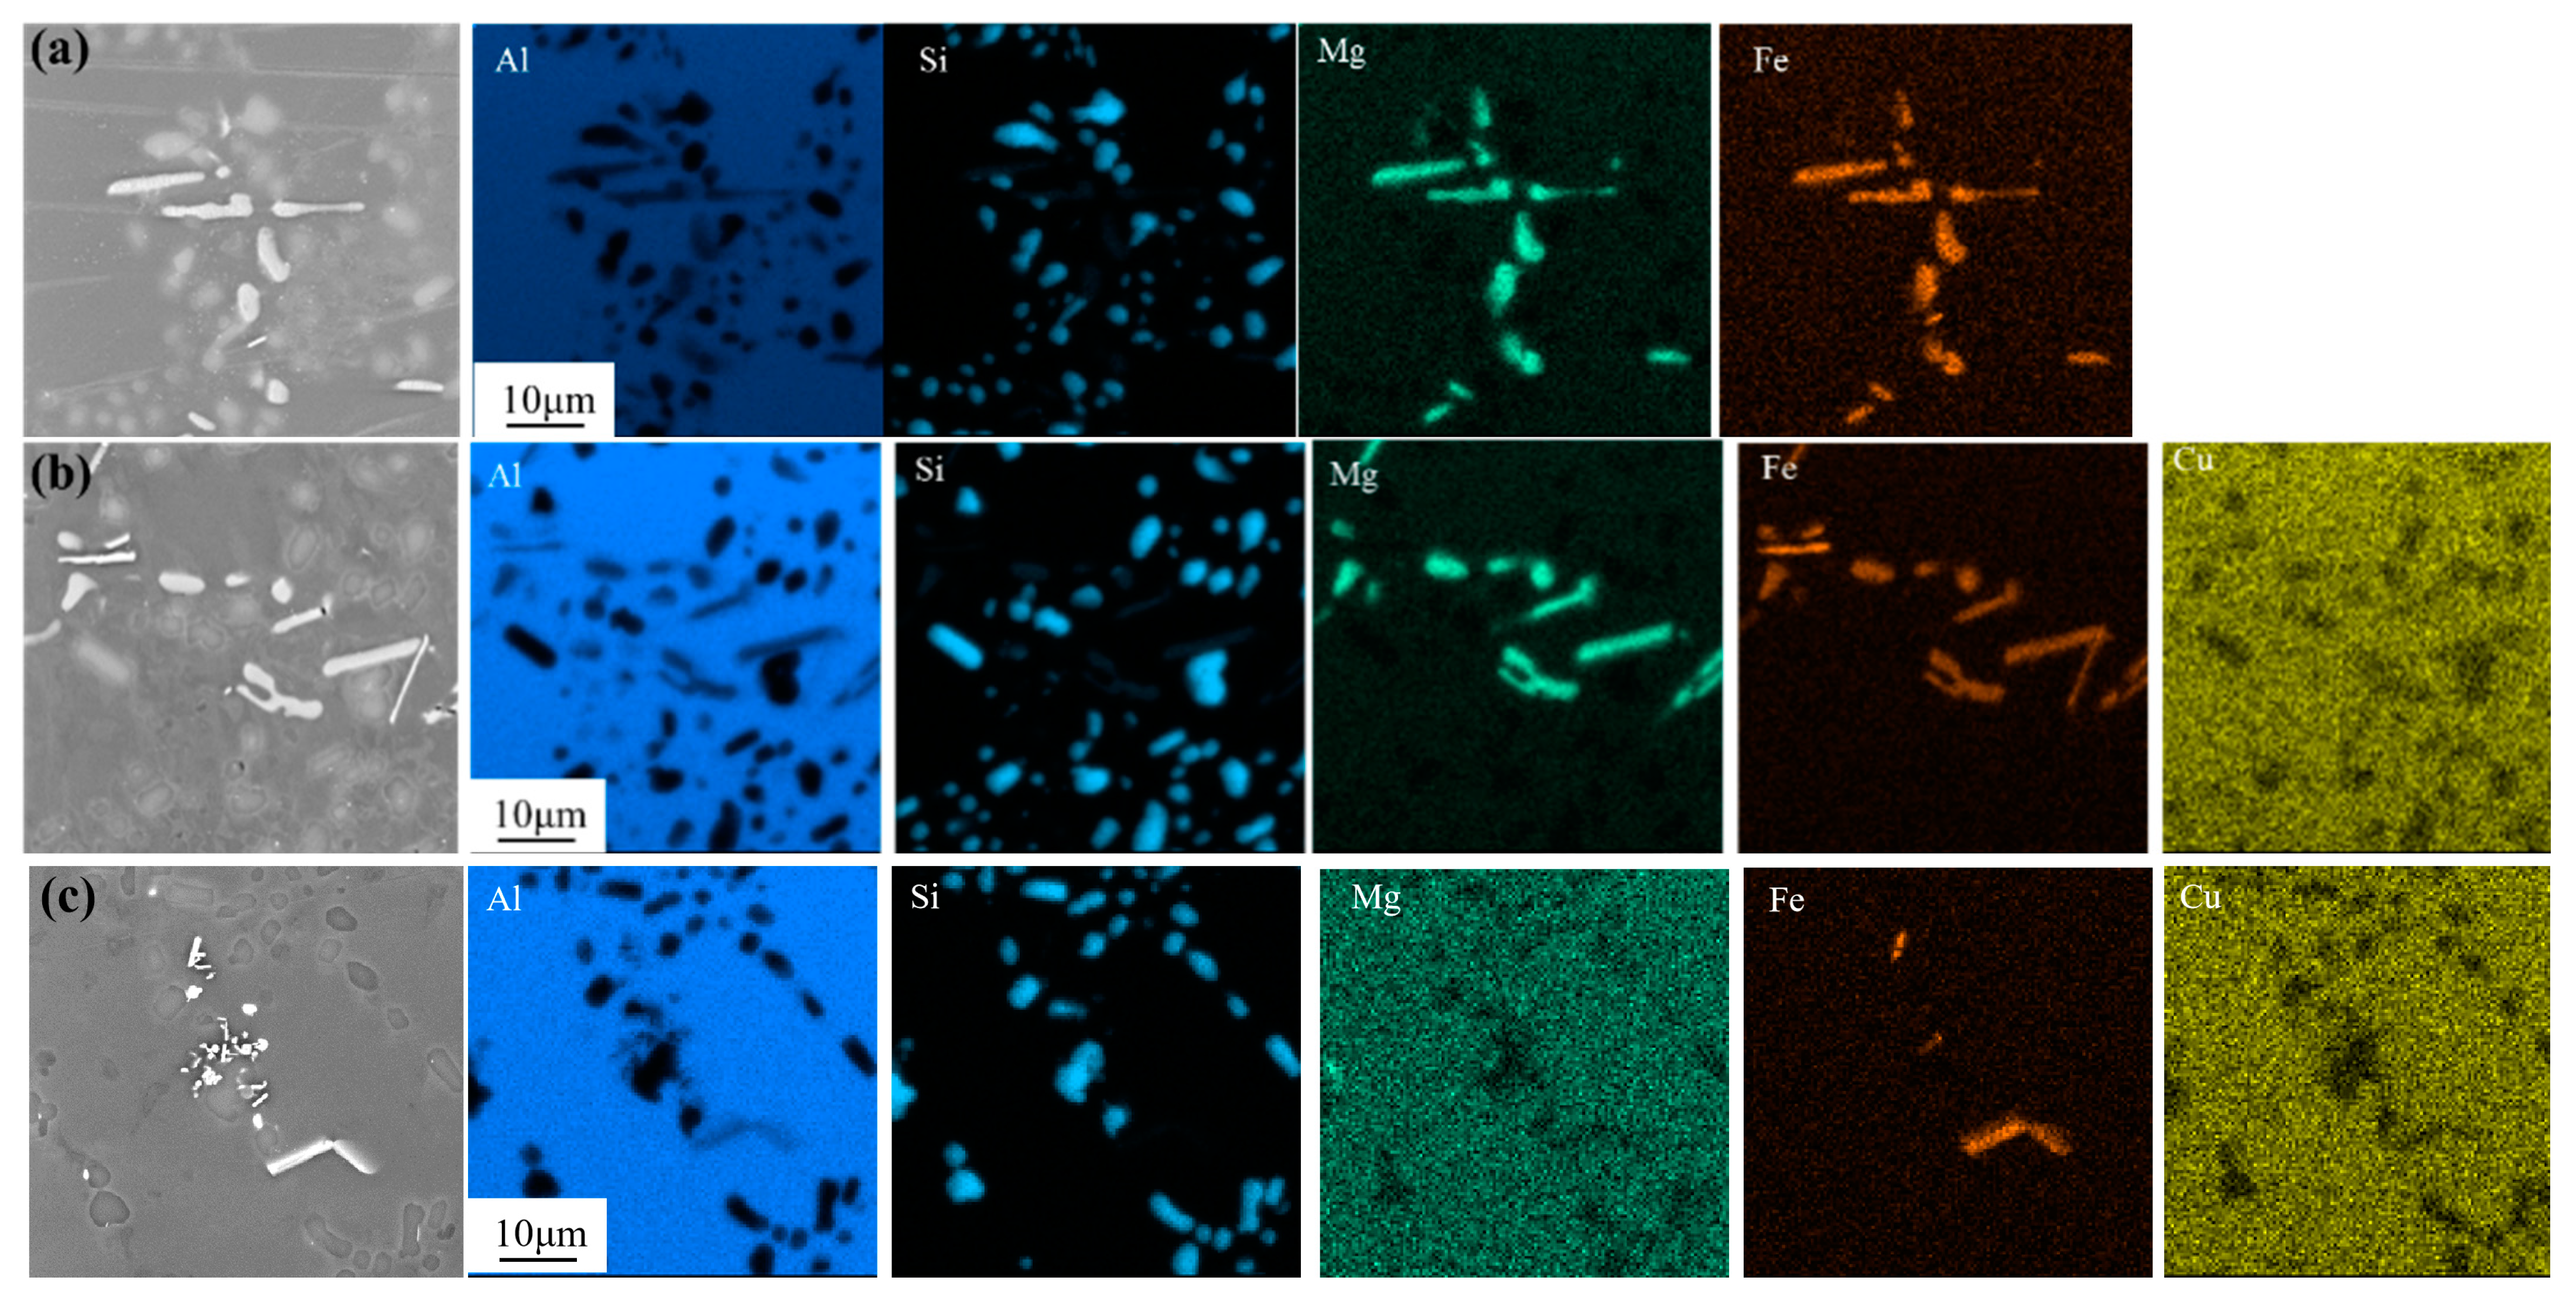
3.1. As-Cast Microstructures

Figure 2 presents the backscattered SEM images of the as-cast alloys. All alloys have α-Al dendritic microstructure, eutectic Si, and eutectic Mg/Cu-containing phases. Secondary dendrite arm spacing was calculated by Image-Pro Plus (6.0, Media Cybernetics, Inc, Rockville, MD, USA), and the values of the A1–A4 alloys were 22.76 mm, 18.66 mm, 18.02 mm, and 18.25 mm, respectively. As shown in Figure 2a, in the absence of Cu, several black Chinese character-shaped phases are present in the as-cast A1 alloy, and the Energy Dispersive Spectrometer (EDS) result indicates that the composition of the back phase is Al-1.79 at.%Mg-6.06 at.%Si, indicating the Mg2Si phase [4,5]. With Cu content increasing to 0.9 wt.%, the quantity of Mg2Si phase decreases. The bright phases are observed in the A2 alloy. The bright phases are dispersed in the eutectic silicon region (Figure 2b). The EDS analysis indicates that the bright phase is Al-15.69 at.%Cu-12.46 at.%Mg-12.05 at.%Si. In A3 alloy, the bright phases increase and the Al2Cu phases are observed, the composition is Al-29.01 at.%Cu. With the Cu content further increasing from 1.5 to 2.1 wt.%, the bright Al2Cu phase increases (Figure 2d). Moreover, the Fe-containing phases were observed in the four alloys (Figure 2), the composition of the Fe-rich phase are: Al-26.38 at.%Si-12.13 at.%Mg-3.78 at.%Fe in A1 alloy, Al-26.22 at.%Si-14.76 at.%Mg-4.29 at.%Fe in A2 alloy, Al-25.45 at.%Si-17.19 at.%Mg-5.59 at.%Fe in A3 alloy, and Al-27.56 at.%Si-11.35 at.%Mg-3.42 at.%Fe in A4 alloy.
XRD patterns of the as-cast alloys are presented in Figure 3. The A1 alloy consisted of α-Al, Si, and Mg2Si phases, which is consistent with the microstructural observation in Figure 2a. Compared with that of the A1 alloy, in A3 and A4 alloys, the diffraction peaks of Q-AlCuMgSi and θ-Al2Cu phases were observed, indicating that the Cu addition results in the formation of Q and θ phases. These results are consistent with Figure 2c,d. Therefore, the phase composition of the Al-Si-Mg-Cu alloy system was closely related to the Cu content; meanwhile, the content of each phase was also determined by the Cu and Mg contents [6,7,8,9,10]. In A2 alloys, the XRD results do not show the diffraction peaks of Q and θ phases, but the microstructure in Figure 2b indicates the presence of Q and θ phases. The low fractions of Q and θ phases in low-Cu A2 alloy may result that they hardly be detected by XRD. Moreover, the XRD results indicate the presence of Al8Mg3FeSi6 phase in A1–A4 alloys.

3.2. Microstructures after T6 Treatment

Heat treatment can affect the microstructural features of Al-Si-Cu-Mg alloys [4,11]. Figure 4 presents the SEM-mapping images of the alloys after T6 treatment. Compared with the as-cast state (Figure 2), the Cu-containing phases were mostly dissolved into the α-Al matrix after solid solution treatment. The residual bright phases after solution treatment are mainly Fe-containing phases, which show the same distribution of Mg and Fe in Figure 4a,b and can be identified as the AlFeMgSi phase. In Figure 4c,d, it indicates that the other Fe-containing phase of small quantity show in A3 and A4 alloys. Moreover, the slight Cu/Mg-containing phases is residual in high-Cu level A4 alloy. Except the dissolution of Mg and Cu into the matrix, the eutectic Si happens evident spheroidization and dispersion, as shown in Si mapping images of Figure 4.
The TEM micrographs of the alloys after aging treatment are shown in Figure 5. The comparison of the TEM images of the A1–A4 alloys indicates that the nano-precipitates precipitated during aging process show a higher number density with increasing Cu level. By contrast, the lamellar precipitates were observed in A4 alloy. Here, the lamellar precipitates are mainly Cu-containing phases, may be the sheet θ′ platelets specifically [7,8]. The number density of precipitates is listed in Table 2. The number density of the precipitates was estimated by η = 3 N, where N is the precipitate cross-section in the image. The factor 3 comprises the three growth directions of the precipitates [13]. In Table 2, the increase in Cu content improves the number density of the precipitates in the aging-treated alloys.
Figure 6 presents the TEM results for the precipitates in A1 alloy after aging treatment. This precipitate shows the monoclinic structure with lattice parameters of a = 1.51 and c = 0.67 nm (Figure 6b), in addition to the orientation relationships of (200)precipitate//(301)Al (Figure 6b) and [010]precipitate//[010]Al (Figure 6c,d). These results indicate that these precipitates are β″ phases [13,18], and no other precipitates are observed. This precipitate is regarded as the most common one in the aged Al alloy. HRTEM images (Figure 6b–d) show that the precipitate is coherent with the Al matrix.
Figure 7 shows the TEM image and the corresponding FFT pattern of the precipitate in A2 alloy. The HRTEM image and FFT pattern indicate that β″ precipitates are in the aged A2 alloy. A closer check of A2 alloy reveals that the precipitation of another nanophase (Figure 8) in addition to the extensive β″ phase (Figure 7). This precipitate shows an angle of 120° between its a and b axes, and exhibits a typical dense stacked hexagonal lattice (HCP) crystal structure. The lattice parameter of this precipitate is a = 1.032 nm, which is obtained using an internal standard method. The precipitate interface was largely parallel to the three crystal faces of the Al matrix—(501)Al, (103)Al, and (506)Al—but was mostly distributed along <510>Al with an orientation relationship of (2110)precipitate//(501)Al, [0001]precipitate//[010]Al. On the basis of previously reported literature data [19], this precipitate in A2 alloy is identified as granular Q′ phases. In general, the main precipitates in A2 alloy are the needle-like β″ phase and the granular Q′ phase. It can be seen from Figure 7 and Figure 8 that the precipitates are coherent with the Al matrix.
Figure 9 shows the TEM images and the corresponding FFT pattern of the granular precipitate in the aged A3 alloy. The Q′ nano-phase also can be observed, but no precipitate of other type was observed. Combined with the results in Figure 8, this result indicates that large quantity of Q′ phases can be identified in A3 alloy. The size of the Q′ phase is approximately the same as in A2 alloy, and the predominant precipitates in the aged A3 alloy are the granular Q′ phases, and it is coherent with the Al matrix. As can be seen in Figure 10, the precipitates in A4 alloy have a crystal structure, lattice parameter, and orientation relationship similar to those of the Q′ phase.
Figure 11 shows the TEM images of the lamellar precipitates in A4 alloy, which indicates that these precipitates are distributed along {200} Al. A closer examination shows that the precipitates exhibit the crystal structure and lattice parameters: a = 0.404 nm, c = 0.58 nm, and an orientation relationship of (200)precipitate//(200)Al, [010]precipitate//[010]Al. Therefore, this nano-phase is identified as θ′ [7,20], and the predominant precipitates in the aged A4 alloy are Q′ and θ′. Additionally, normally, the reduction of interfacial energy causes the precipitates to be compact, while reduction of elastic energy leads to the formation of the plate shape. The ratio between the bulk elastic driving force and the interfacial energy is size dependent, and thus, the tendency towards plate formation depends on the precipitate size. The shape formation of smaller precipitates is mostly driven by interface reduction and therefore the precipitates tend to be more spherical when the interfacial energy is assumed to be isotropic. Combined with Figure 5, the precipitated phase was gradually changed from short rod to granulate to lamellar with increasing Cu content.
In summary, the types of aging-precipitate changes with the change of Cu level in alloys, which transforms from needle-like β″ in A1 alloy to granular Q′ and needle-like β″ in A2 alloy. A3 alloy mostly consists of granular Q′ phase. When Cu level increases to 2.08%, the Q′ and θ′ are the main precipitates in aged A4 alloy.

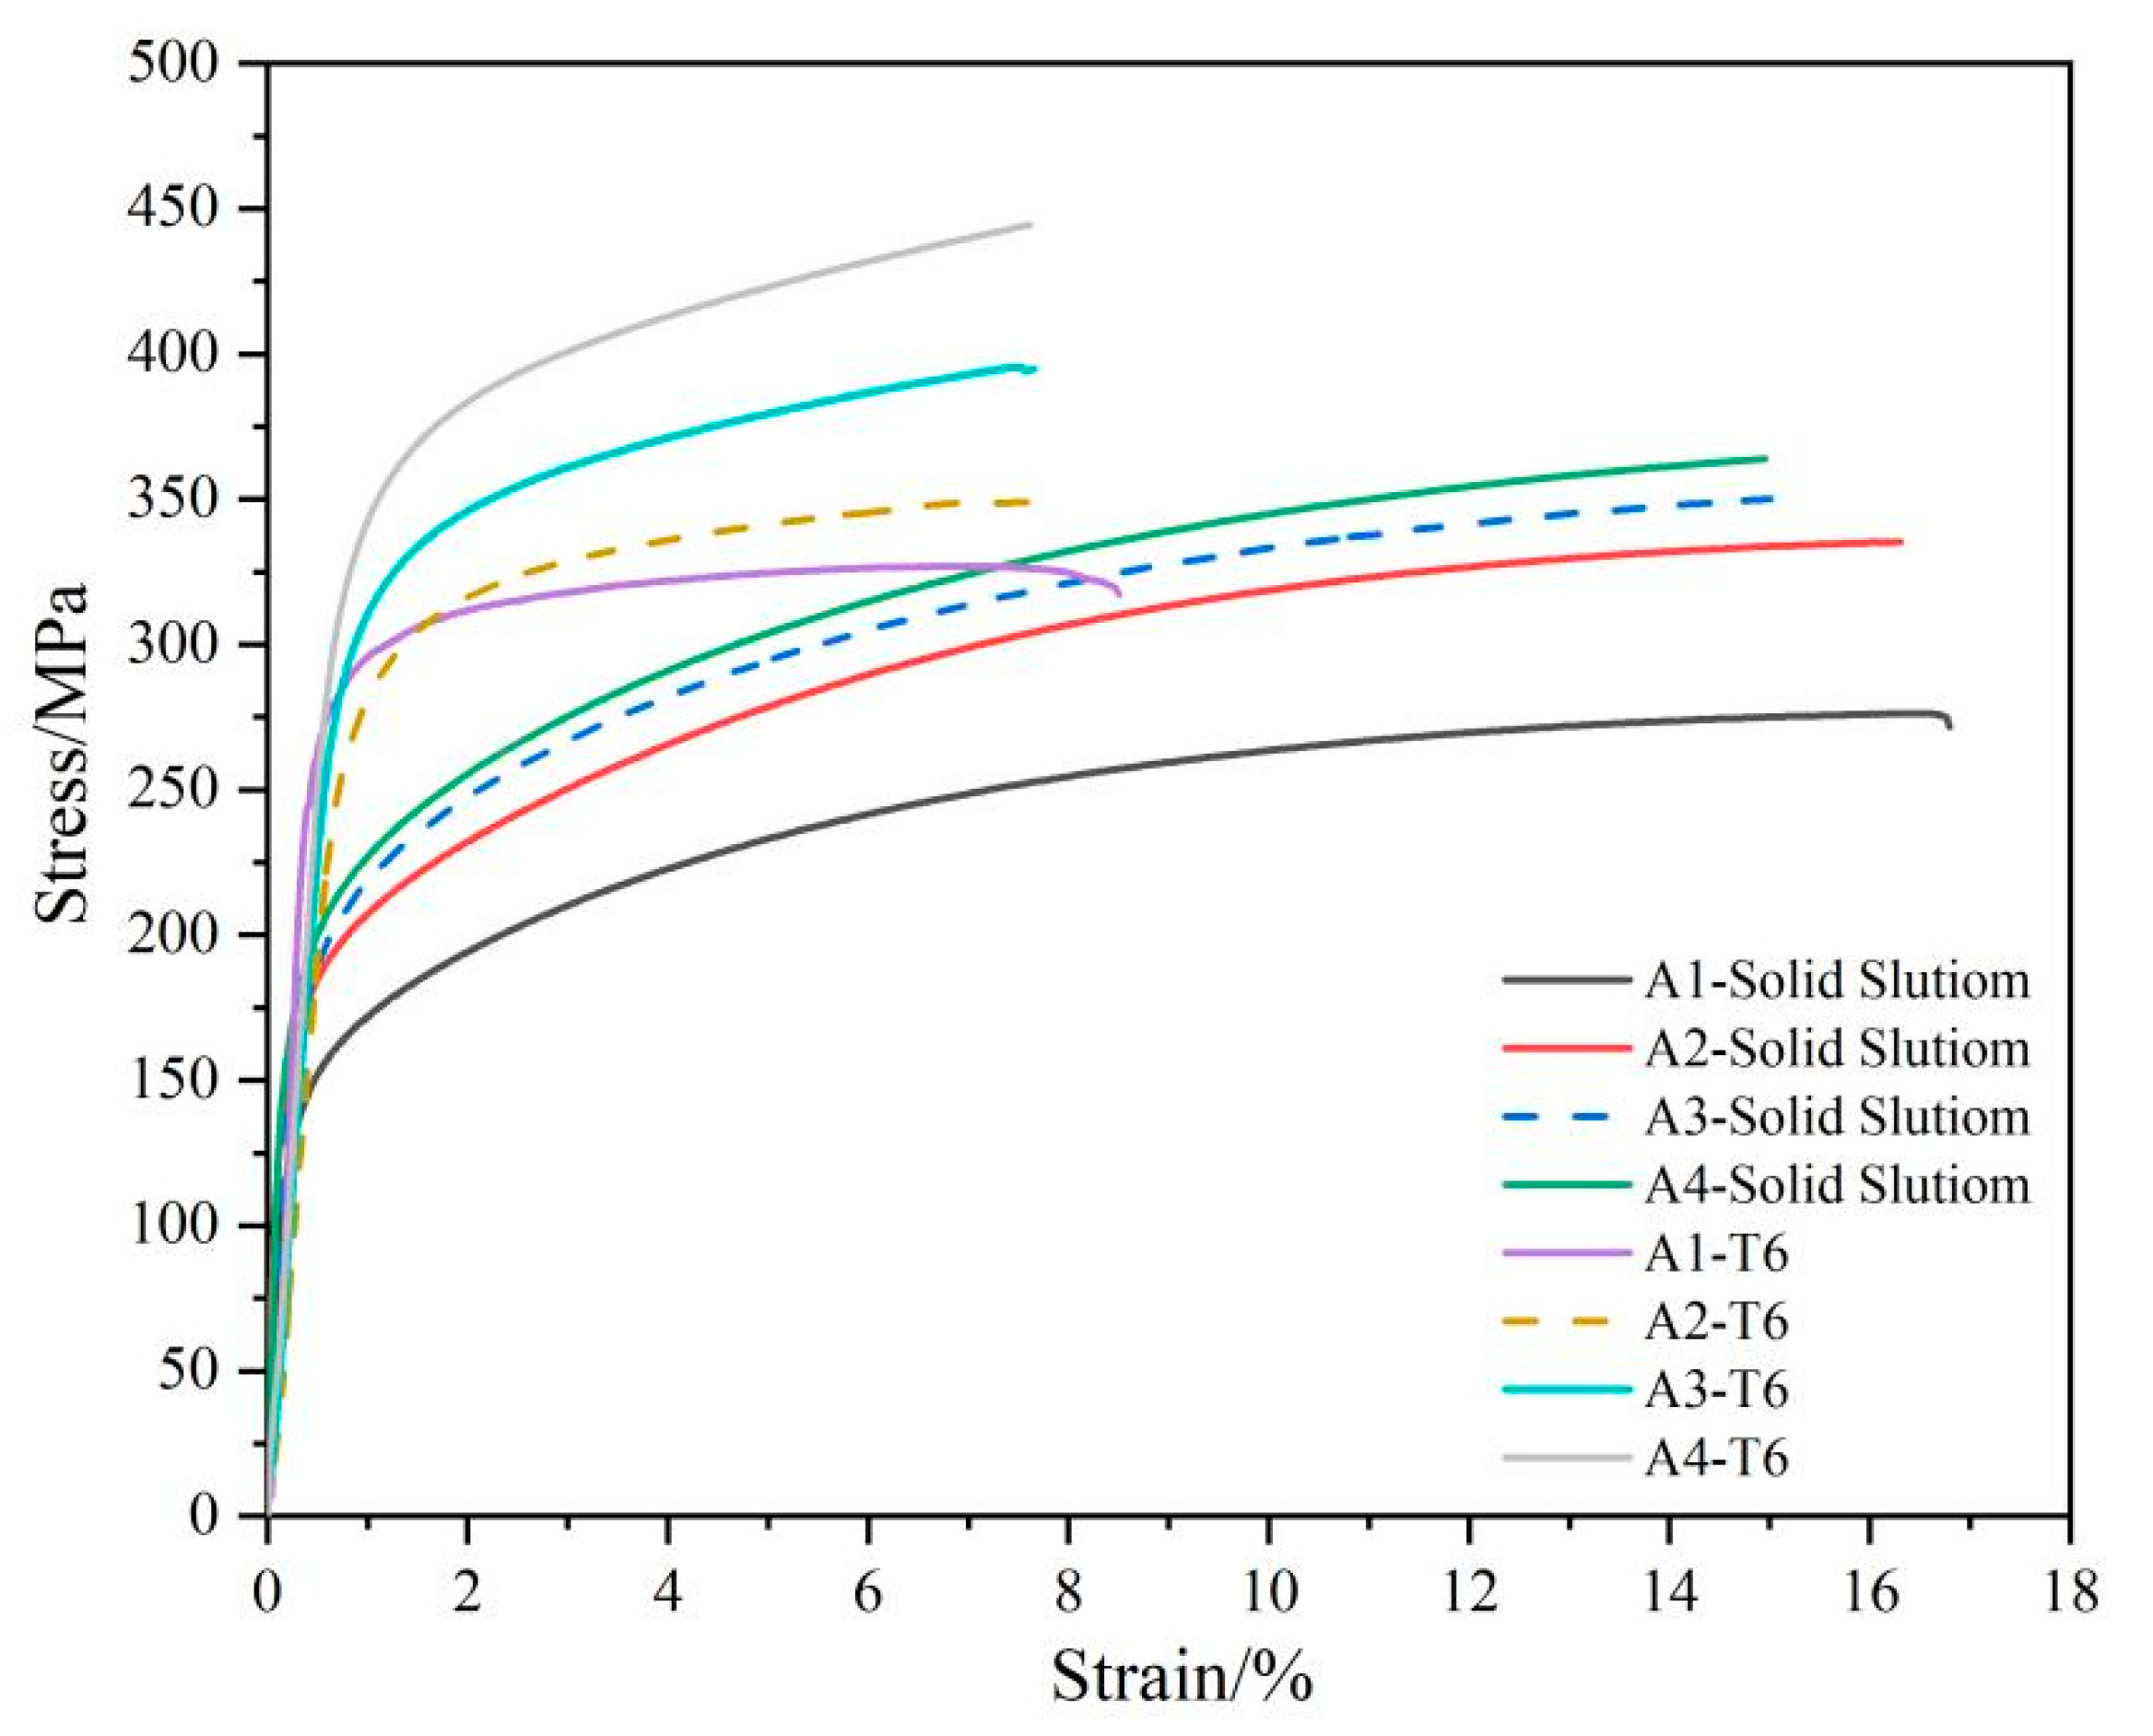
3.3. Tensile Properties

The ultimate tensile strength (UTS), 0.2% yield strength (YS), and the elongation to fracture of the solution- and aging-treated alloys are listed in Table 3. The strength of the studied alloys increases, and the elongation slightly decreases with increasing of Cu level. Figure 12 presents the engineering stress–strain curves of the alloys under quenching and aging conditions. Under solution-treated state, the YS increases from 161 to 221 MPa and the UTS increases from 275 to 363 MPa when Cu content increases from 0–2%. Meanwhile, the solution-treated alloys of A1–A4 show the high elongations of 16–18%. After aging treatment, the YS and UTS markedly improve in A1–A4 alloys. With increasing Cu content, the YS increases from 264 to 351 MPa, UTS increases from 322 to 442 MPa, and the elongation decreases from 10 to 8.4%.
Comparing the tensile properties of the alloys treated under different conditions, the change in strength of the alloys with different Cu contents can attribute to solid-solution and aging strengthening. In solution-treated samples, the increase of Cu content results in a higher solution content, which shows a higher solution strengthen effect. The YS and UTS of solution-treated samples gradually increase when Cu content increases. After aging treatment, the mechanical properties of the alloys markedly increase; the aging-treatment is more effective than solution treatment on influence of strength in the Al-Si-Mg-xCu cast alloy. Moreover, it indicates that the elongations of aging-treatment samples decrease due to the inverted relationship between strength and ductility.
Notably, the yield strengths of the Al-Si-Mg-xCu alloys markedly improve after aging treatment. The improvement in yield strength can be attributed to the nano-precipitates of the β″, Q′, and θ′ phases. The contribution of the precipitates to yield strength can be calculated by the Ashby–Orowan equation [13]:
σ D = 0.84 M G b 2 π 1 υ 1 / 2 λ I n r b ,
where M is the Taylor factor, M = 3.1, G and b were the shear modulus (2.65 × 10¹⁰ N/m2) and the Burgers vector of dislocations in the Al matrix (2.84 × 10⁻¹⁰ m), and v is the Poisson’s ratio for Al (0.33). The interspacing of the precipitates λ depends on the radius r and volume fraction Vf of the precipitates, as follows:
λ = r 2 π 3 v f 1 2 ,
Volume fraction (Vf) of precipitates:
V f = n l A c s ,
where n is the number density of precipitates, l is the average length of dispersoids, and Acs is the average area of the cross-section of precipitates. According to Equations (2)–(4), the increase of yield strength caused by precipitates is calculated, which is listed in Table 4.
As can be seen from Table 4, the calculated data agree well with the improved experimental data of yield strength after aging process. However, the measured increase is a little bit lower than the calculated increase in yield strength contributed by the precipitates. This difference can be explained by the decrease of solute strengthening, since the solute concentration in solid solution decreases during aging process [13,21,22].
According to the Orowan bypass mechanism, the yield strength increment ( Δ σ s ) shows the relationship with the f and r (Equation (4)), where α is a constant for the material, f is the second-phase particle (aging precipitates) volume percentage, and r is the average radius of the second phase particle (aging precipitates) [13,22]:
Δ σ s α · f 1 / 2 · r 1
This relationship was used to analyze variation tendency of yield strength increment with the precipitate size, as shown in Figure 13. It indicates that the increasing effect of the aging precipitates on the yield strength is proportional to f 1 / 2 · r 1 . Therefore, the increment of the yield strength is increased with the increase of f 1 / 2 · r 1 in Figure 13, which is consistent with the Orowan mechanism.
Figure 14 shows the fracture surfaces of the alloys after T6 treatment. The casting defect does not be observed in the fracture surfaces. The fracture surfaces of the four alloys are occupied by dimples formed by spheroidizing and dispersive Si particles. These dispersive Si particles can result in the fine and homogeneous dimples during one-axis loading process, which is important for high ductility of Al-Si-Mg-Cu cast alloy. In the loading-bearing process, most granular Si particles were pulled out in dimples, and dimples formed in the Al matrix, represented by the yellow arrows in Figure 14. Moreover, the fracture surfaces in T6-treated samples do not show the residual Cu- and Fe-containing phases, avoiding adverse effect on the ductility by coarse intermetallic. Therefore, the elongations of aging-treated samples are higher than 8%, which can meet the engineering application requirements of Al-Si-Cu-Mg casting alloy.

4. Conclusions

The microstructures and mechanical properties of Al-9Si-0.5Mg alloys with Cu addition were investigated. The following conclusions are drawn from this study.
(1)
With the Cu level increasing and Cu/Mg ratio changing, the mechanical properties including yield and ultimate tensile strengths improve after solution and aging treatments in A1–A4 alloys, the increase of Cu content results in higher solution and aging strengthen effects and affects the aging precipitates. The aging-treated Al-9Si-0.5Mg-2Cu alloy shows a better strength and ductility: yield strength 351 MPa, ultimate tensile strength 442 Mpa, and elongation 8.4%.
(2)
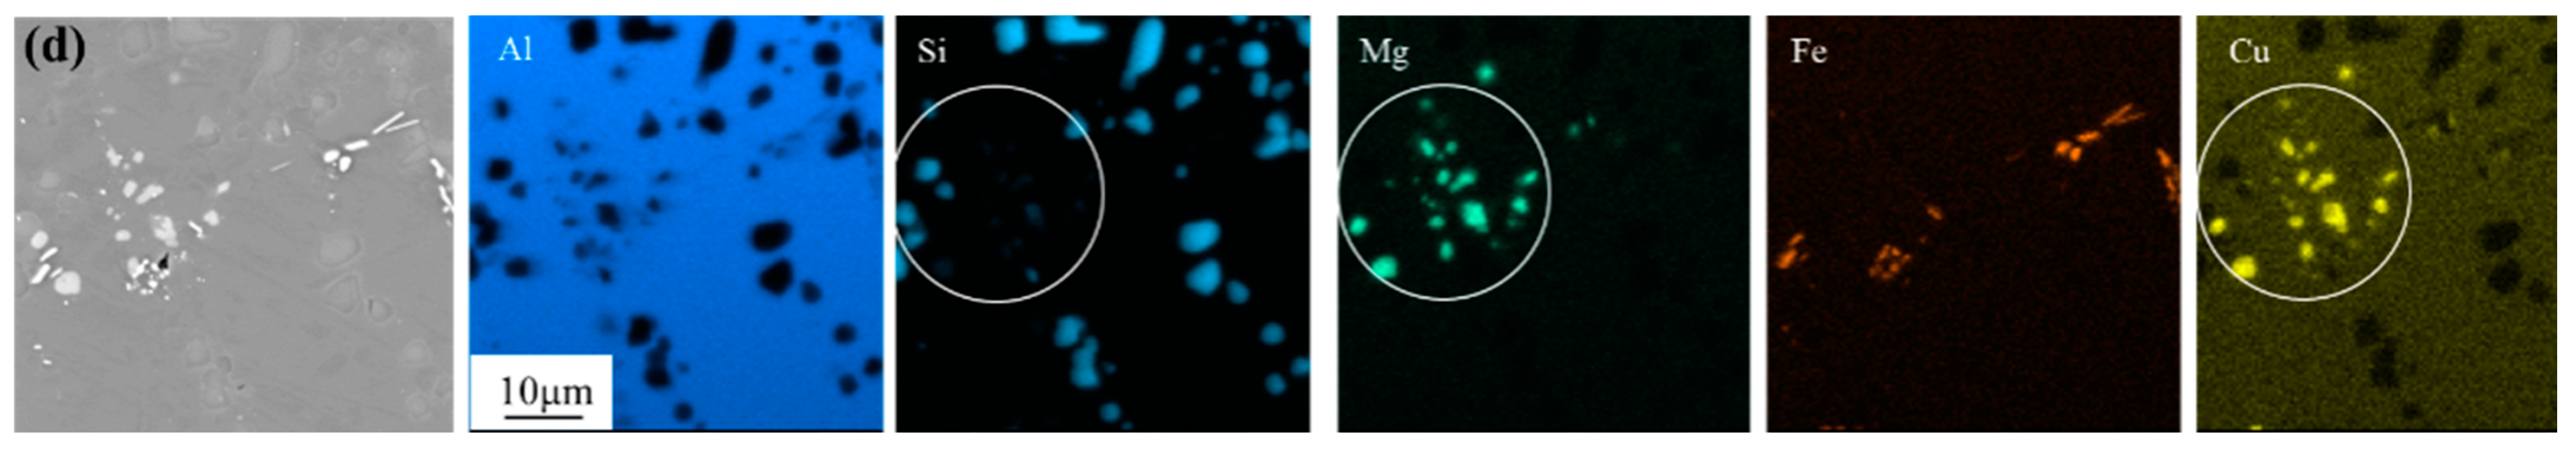
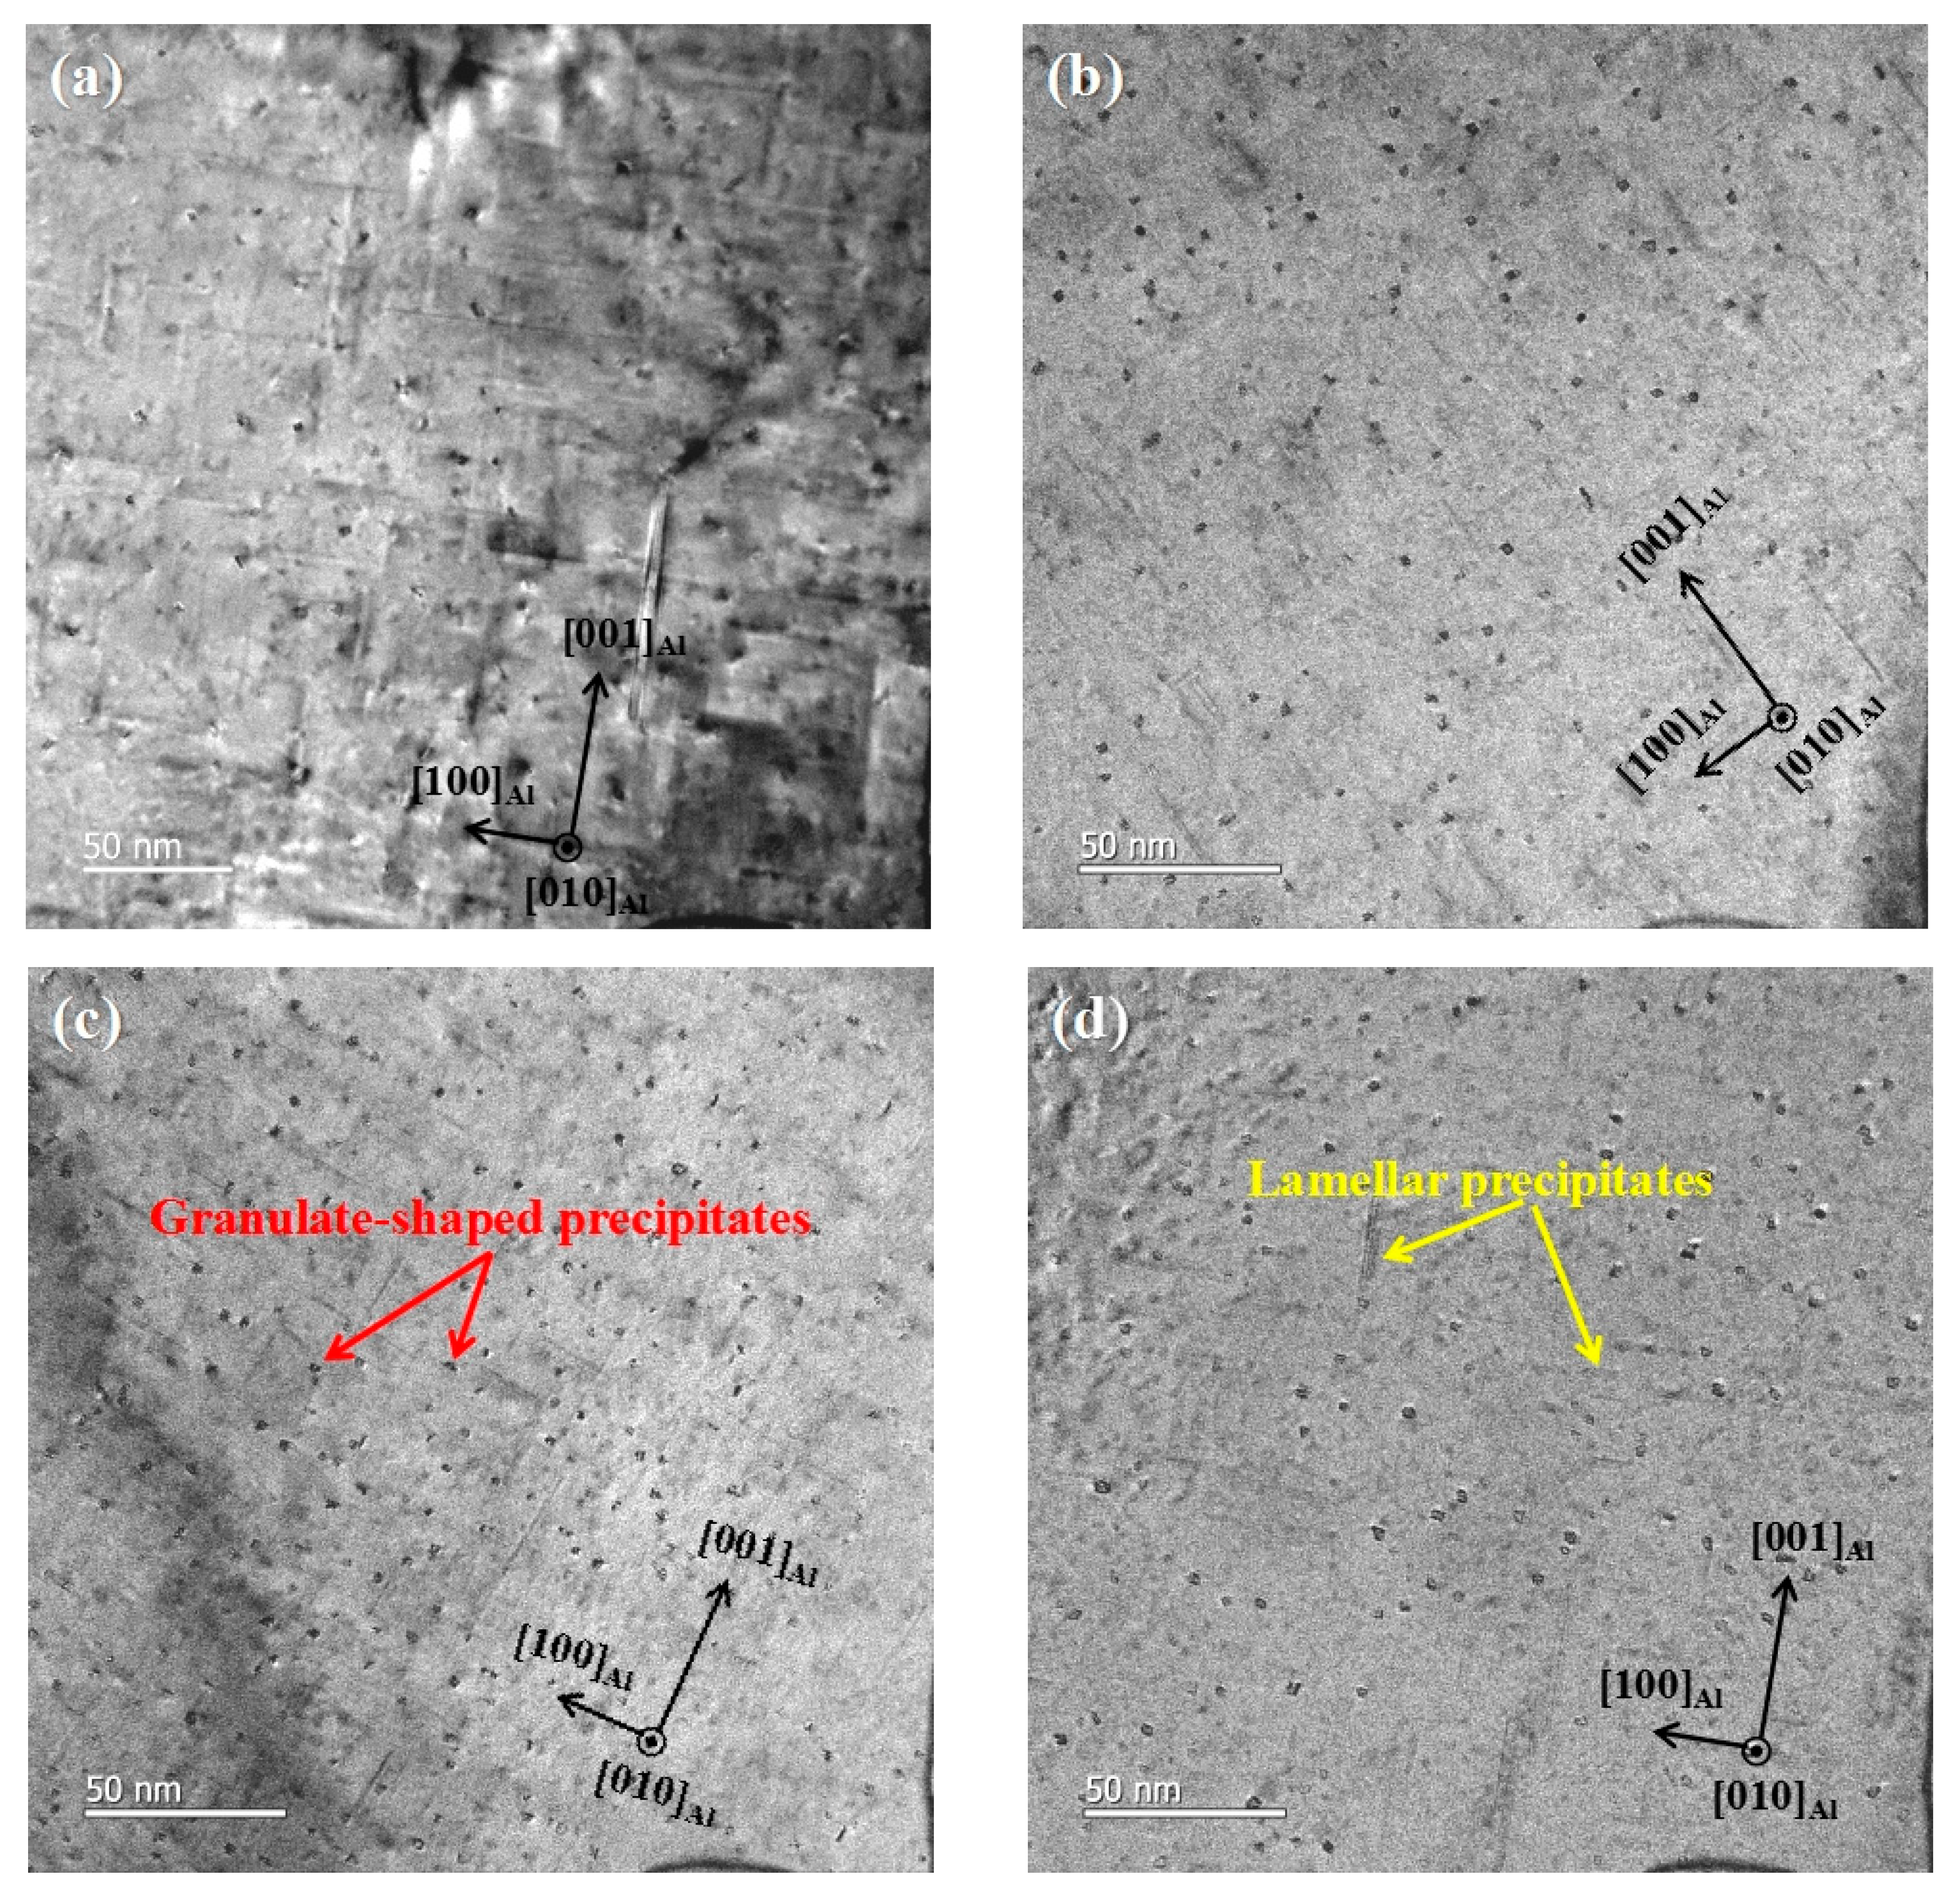
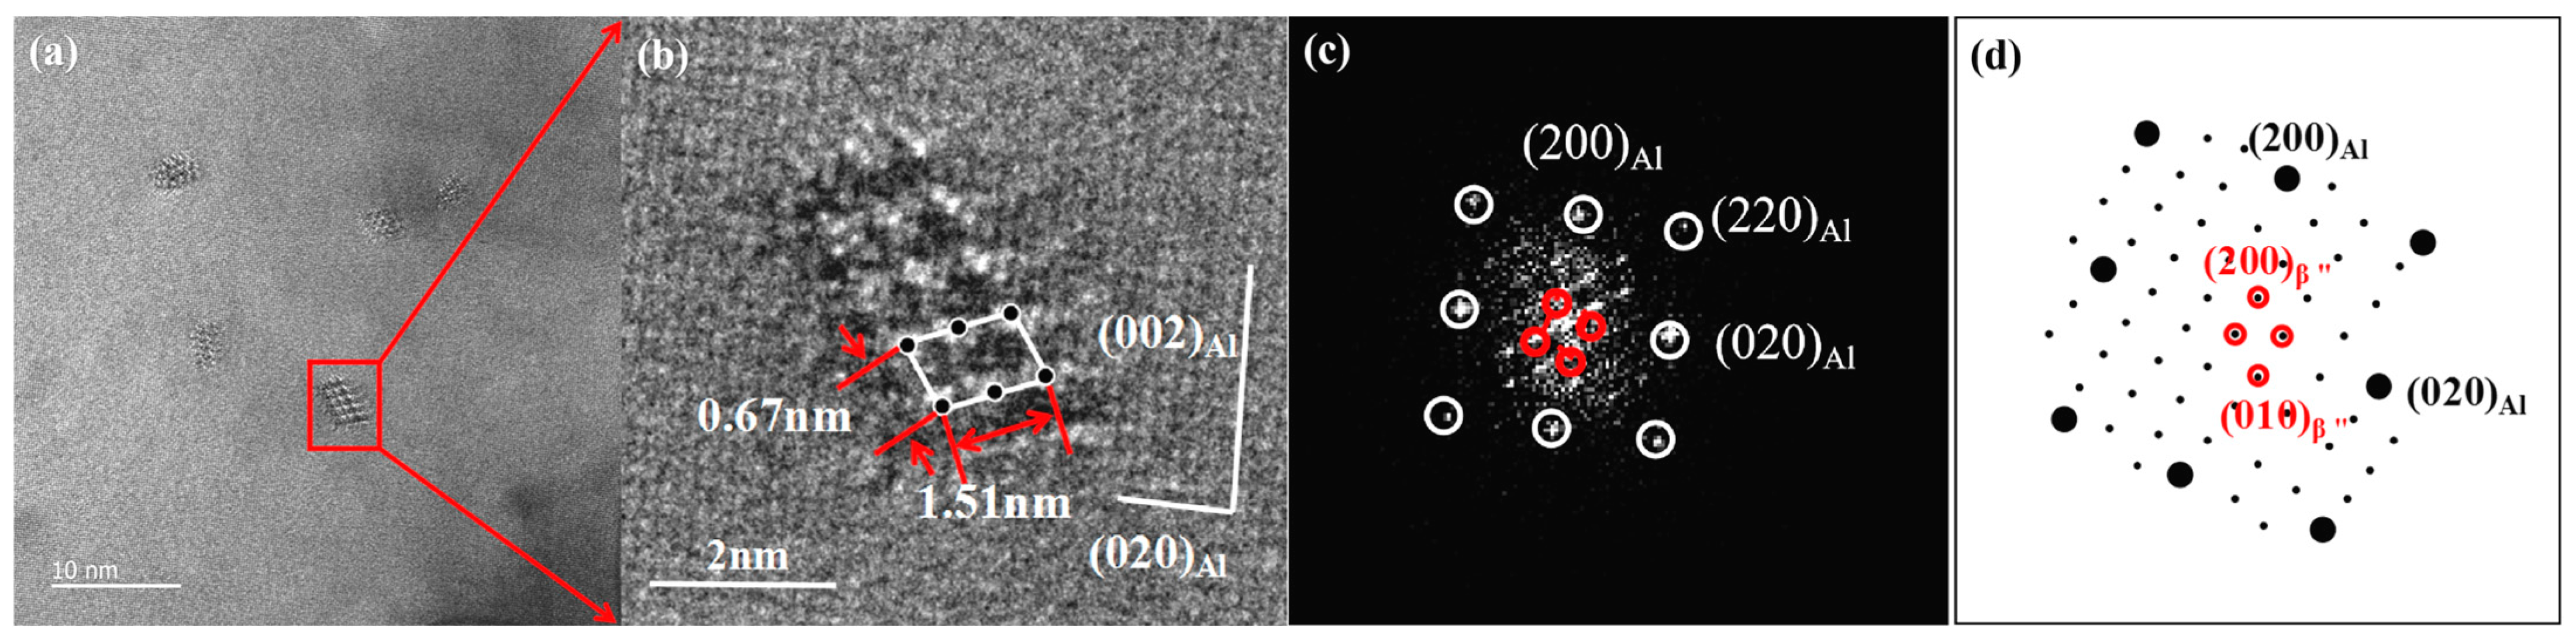
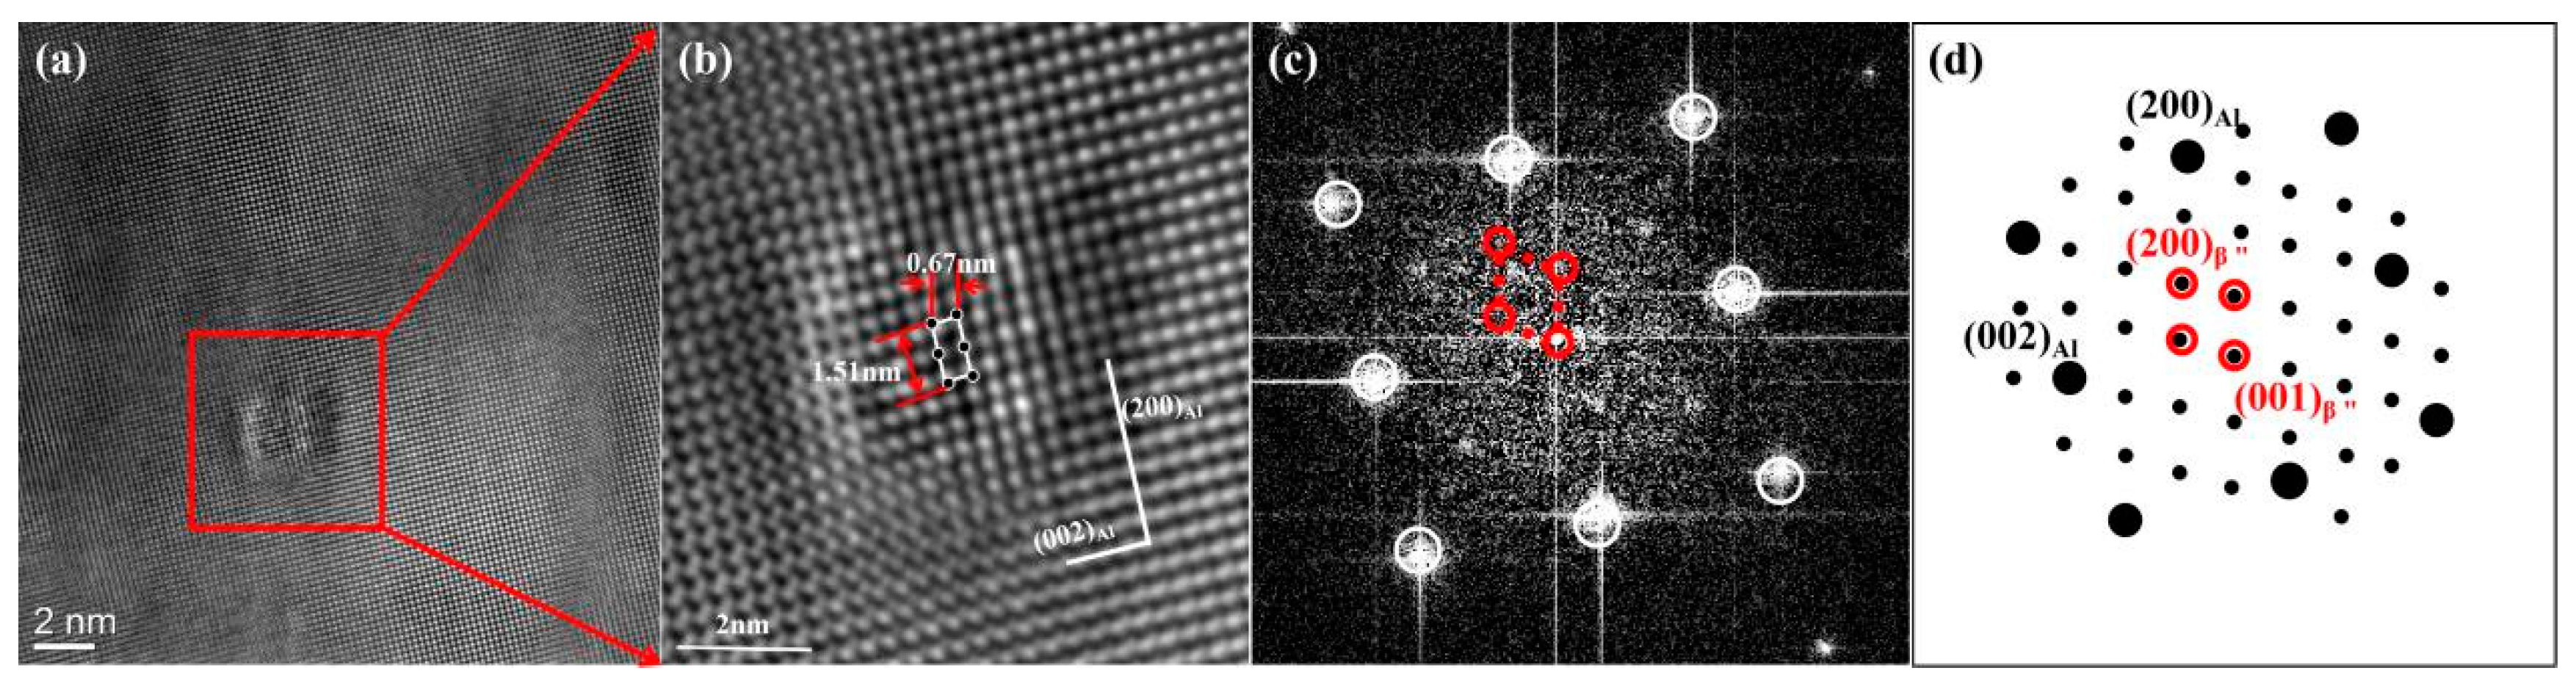
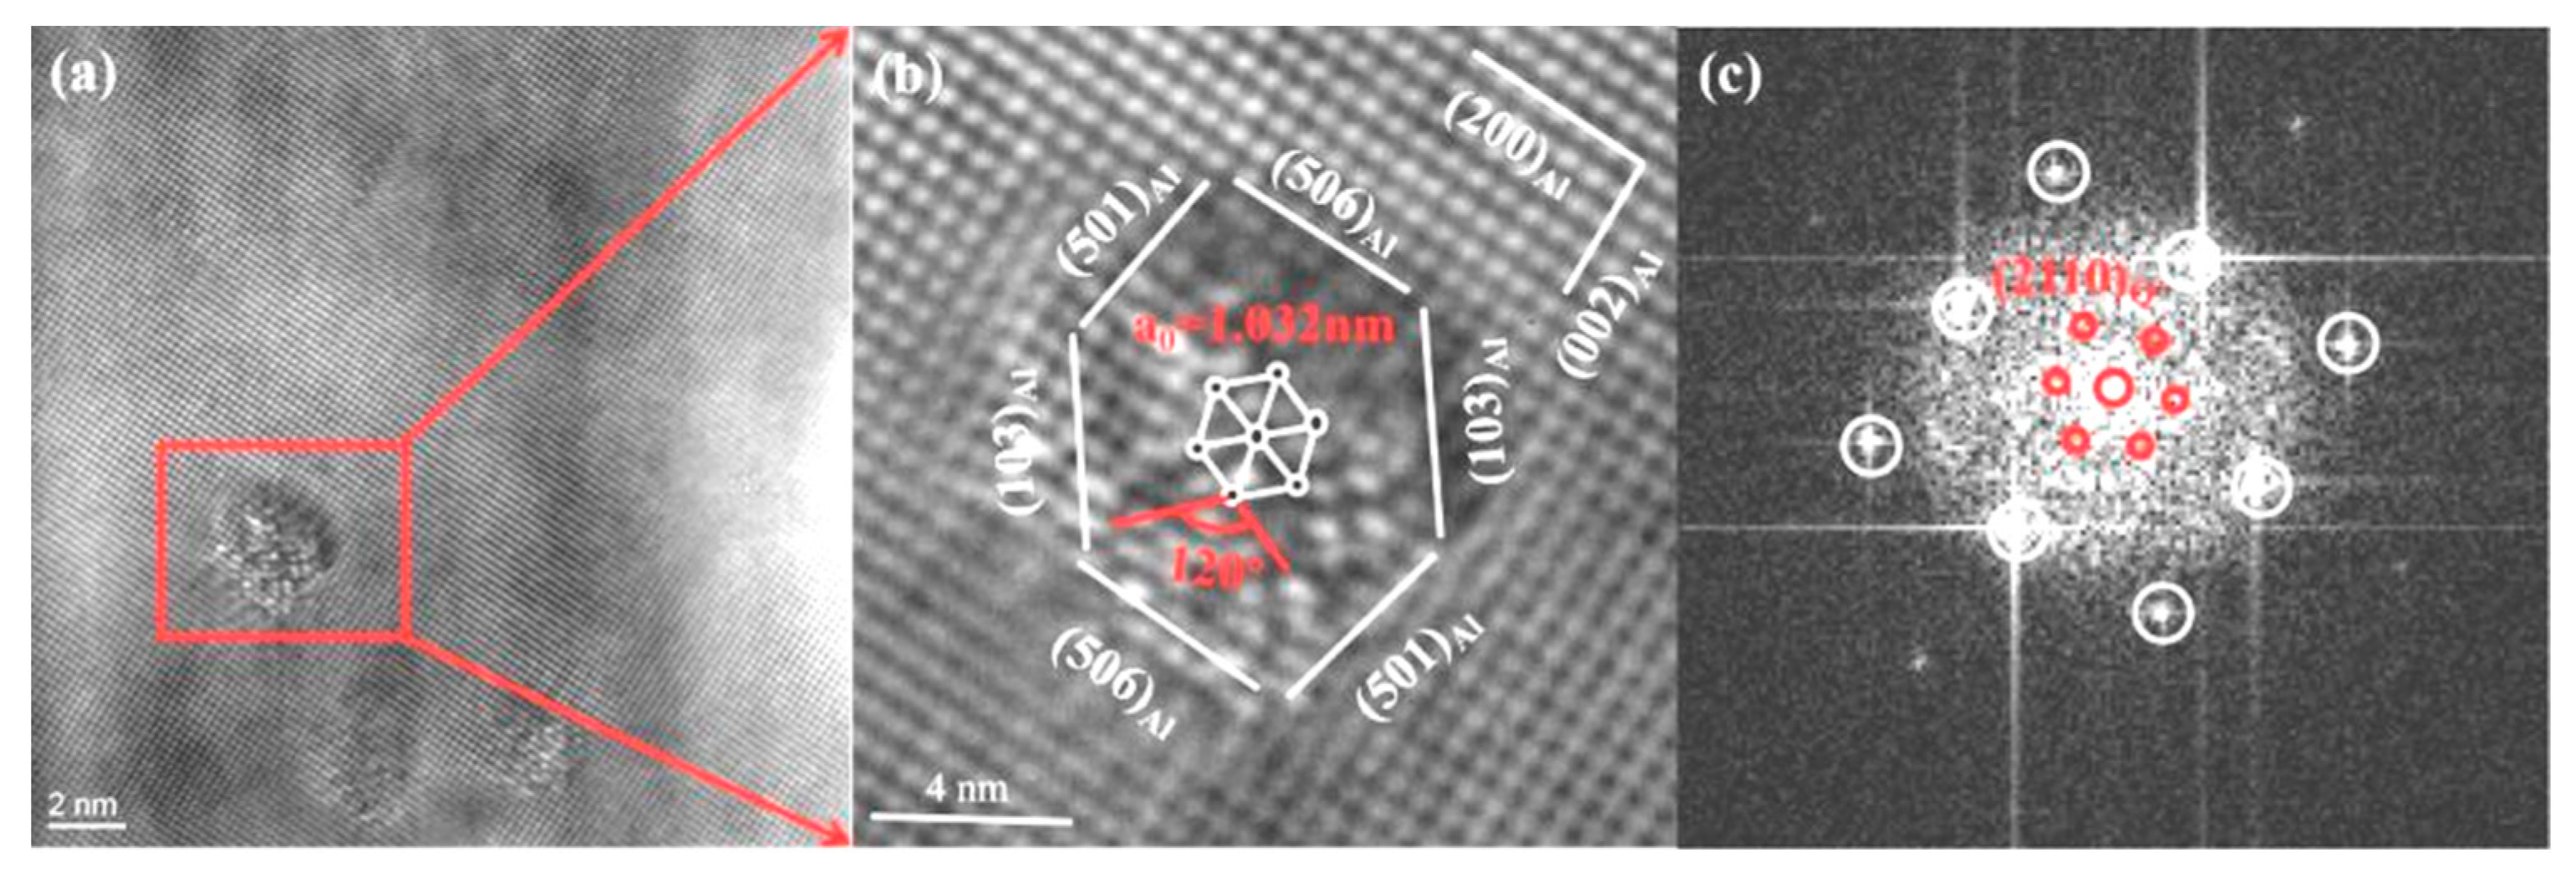
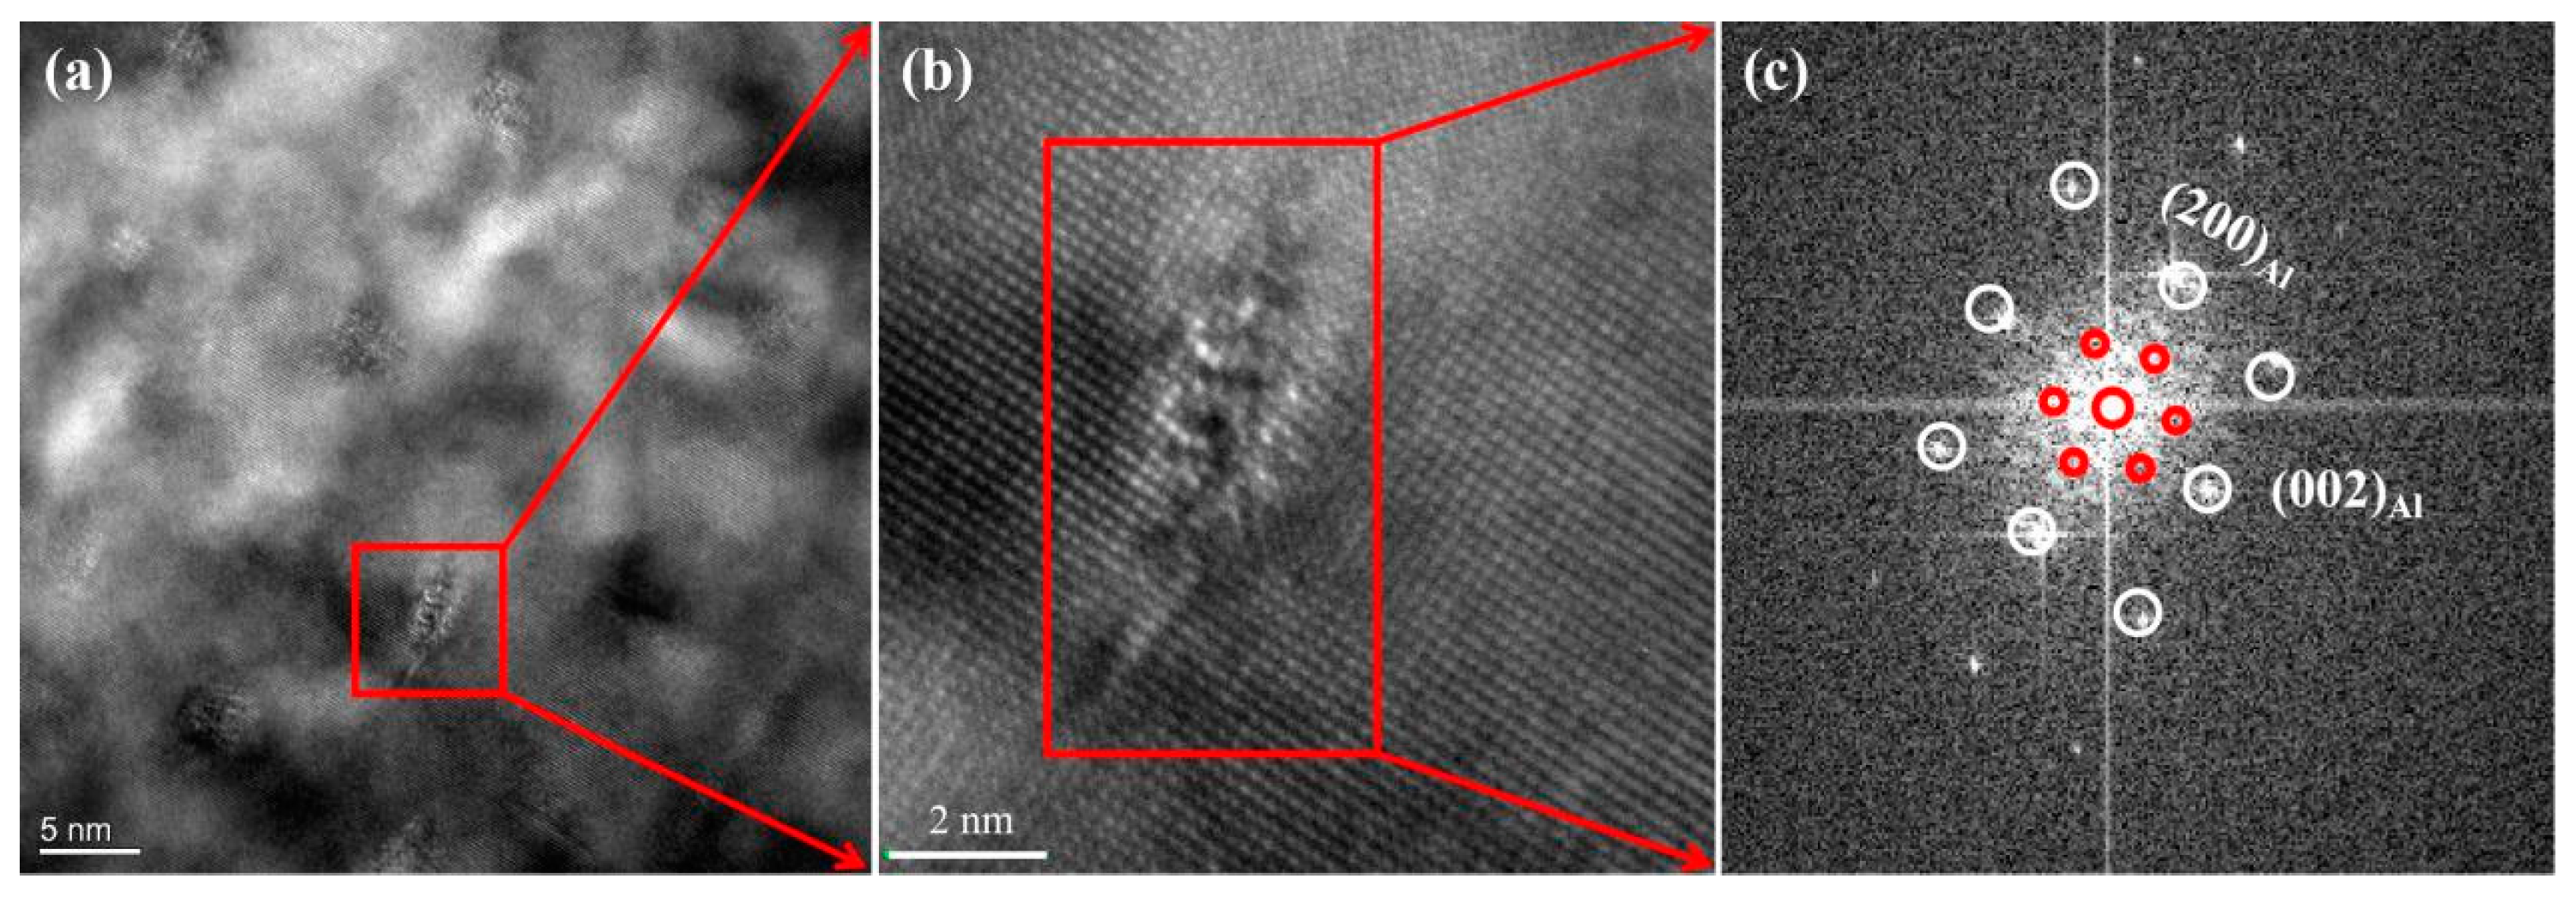
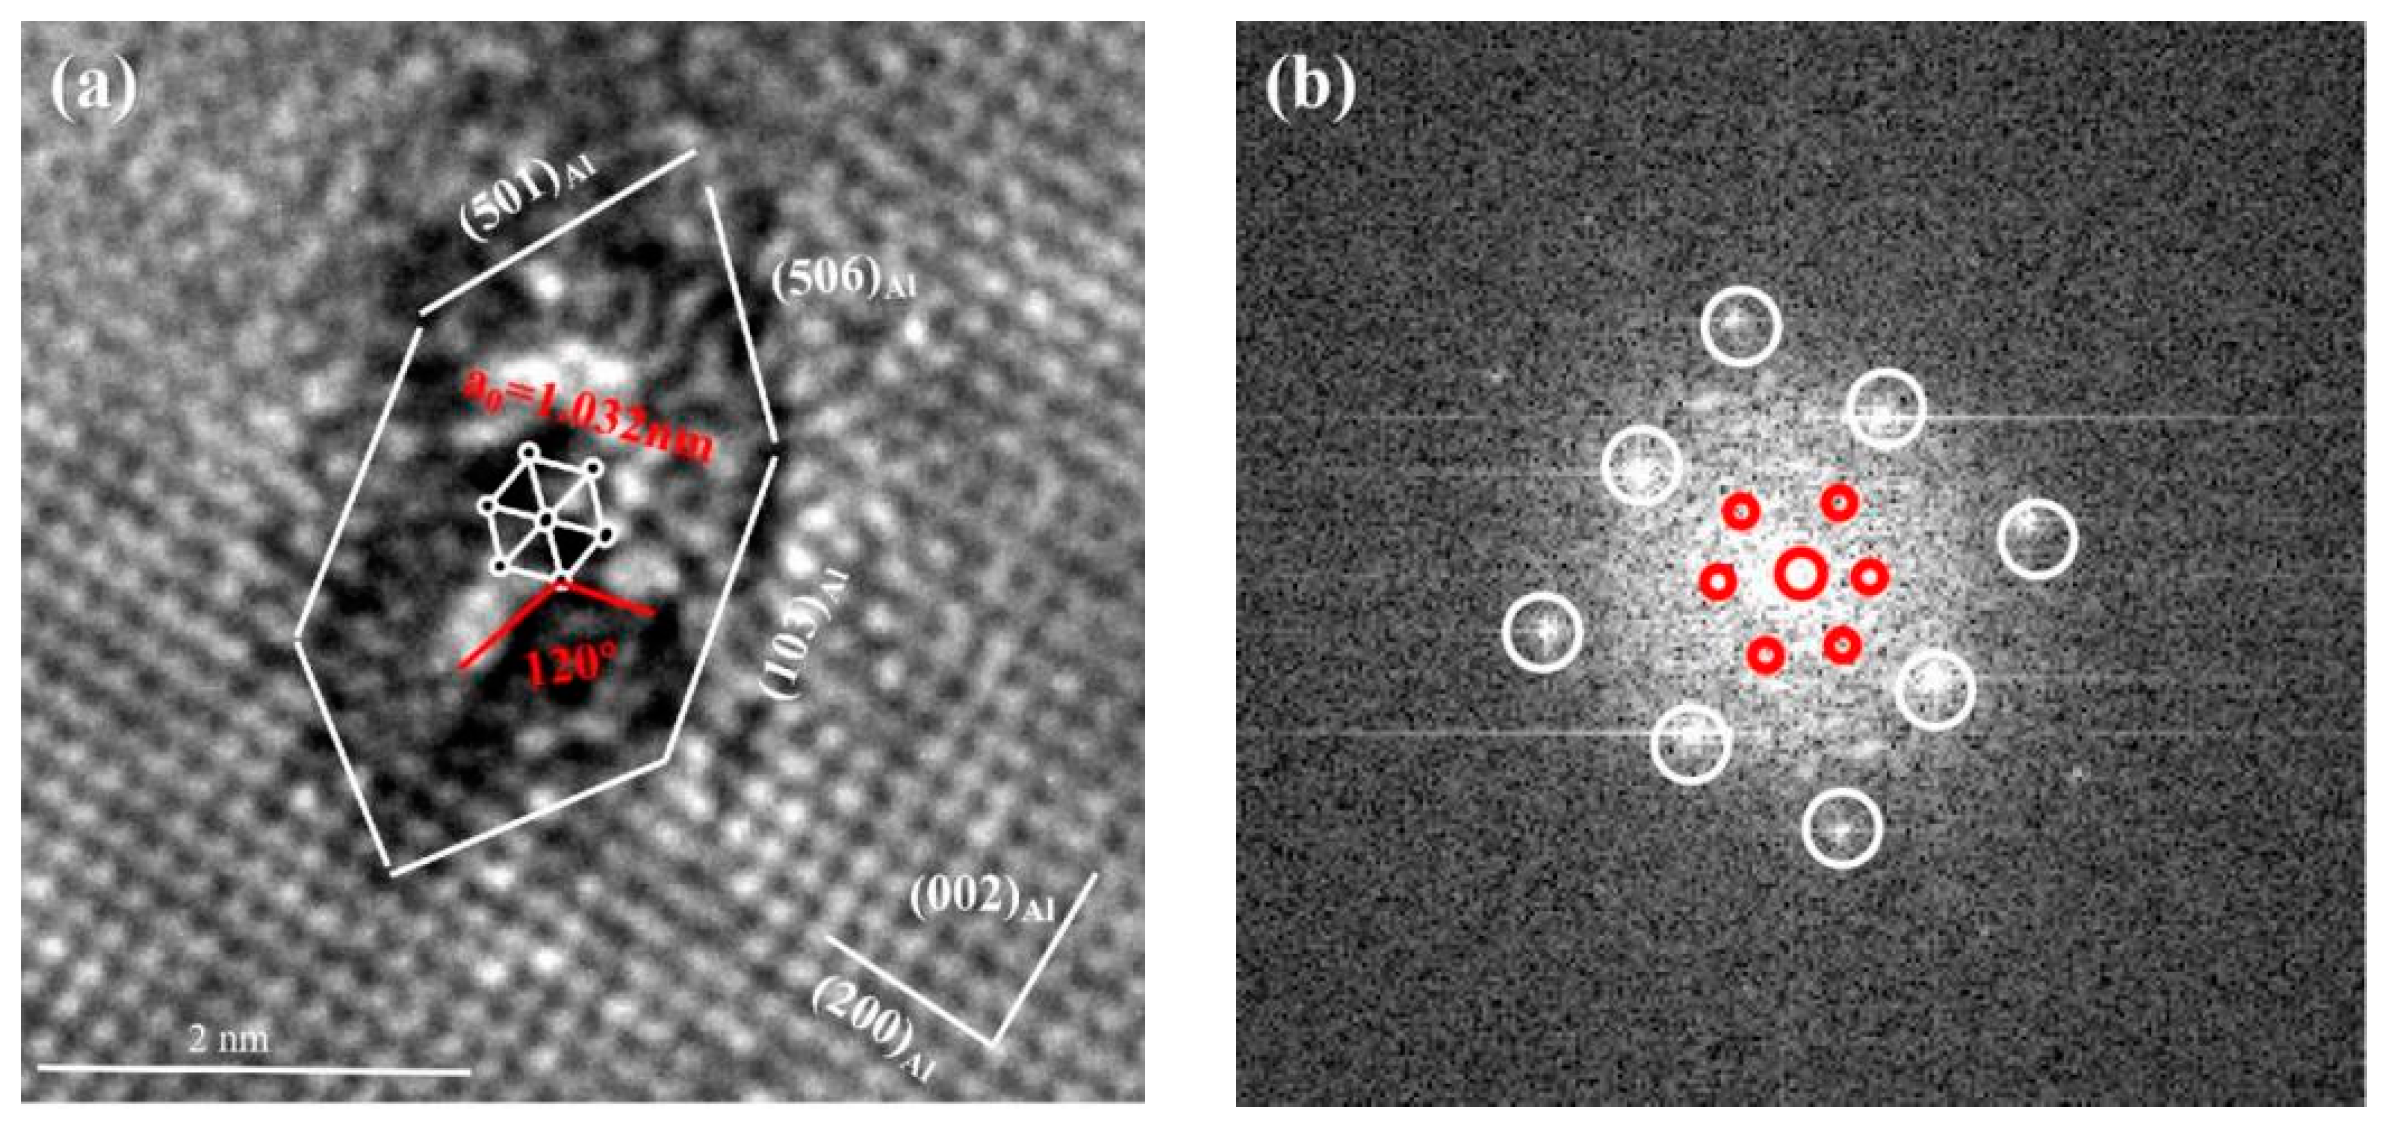
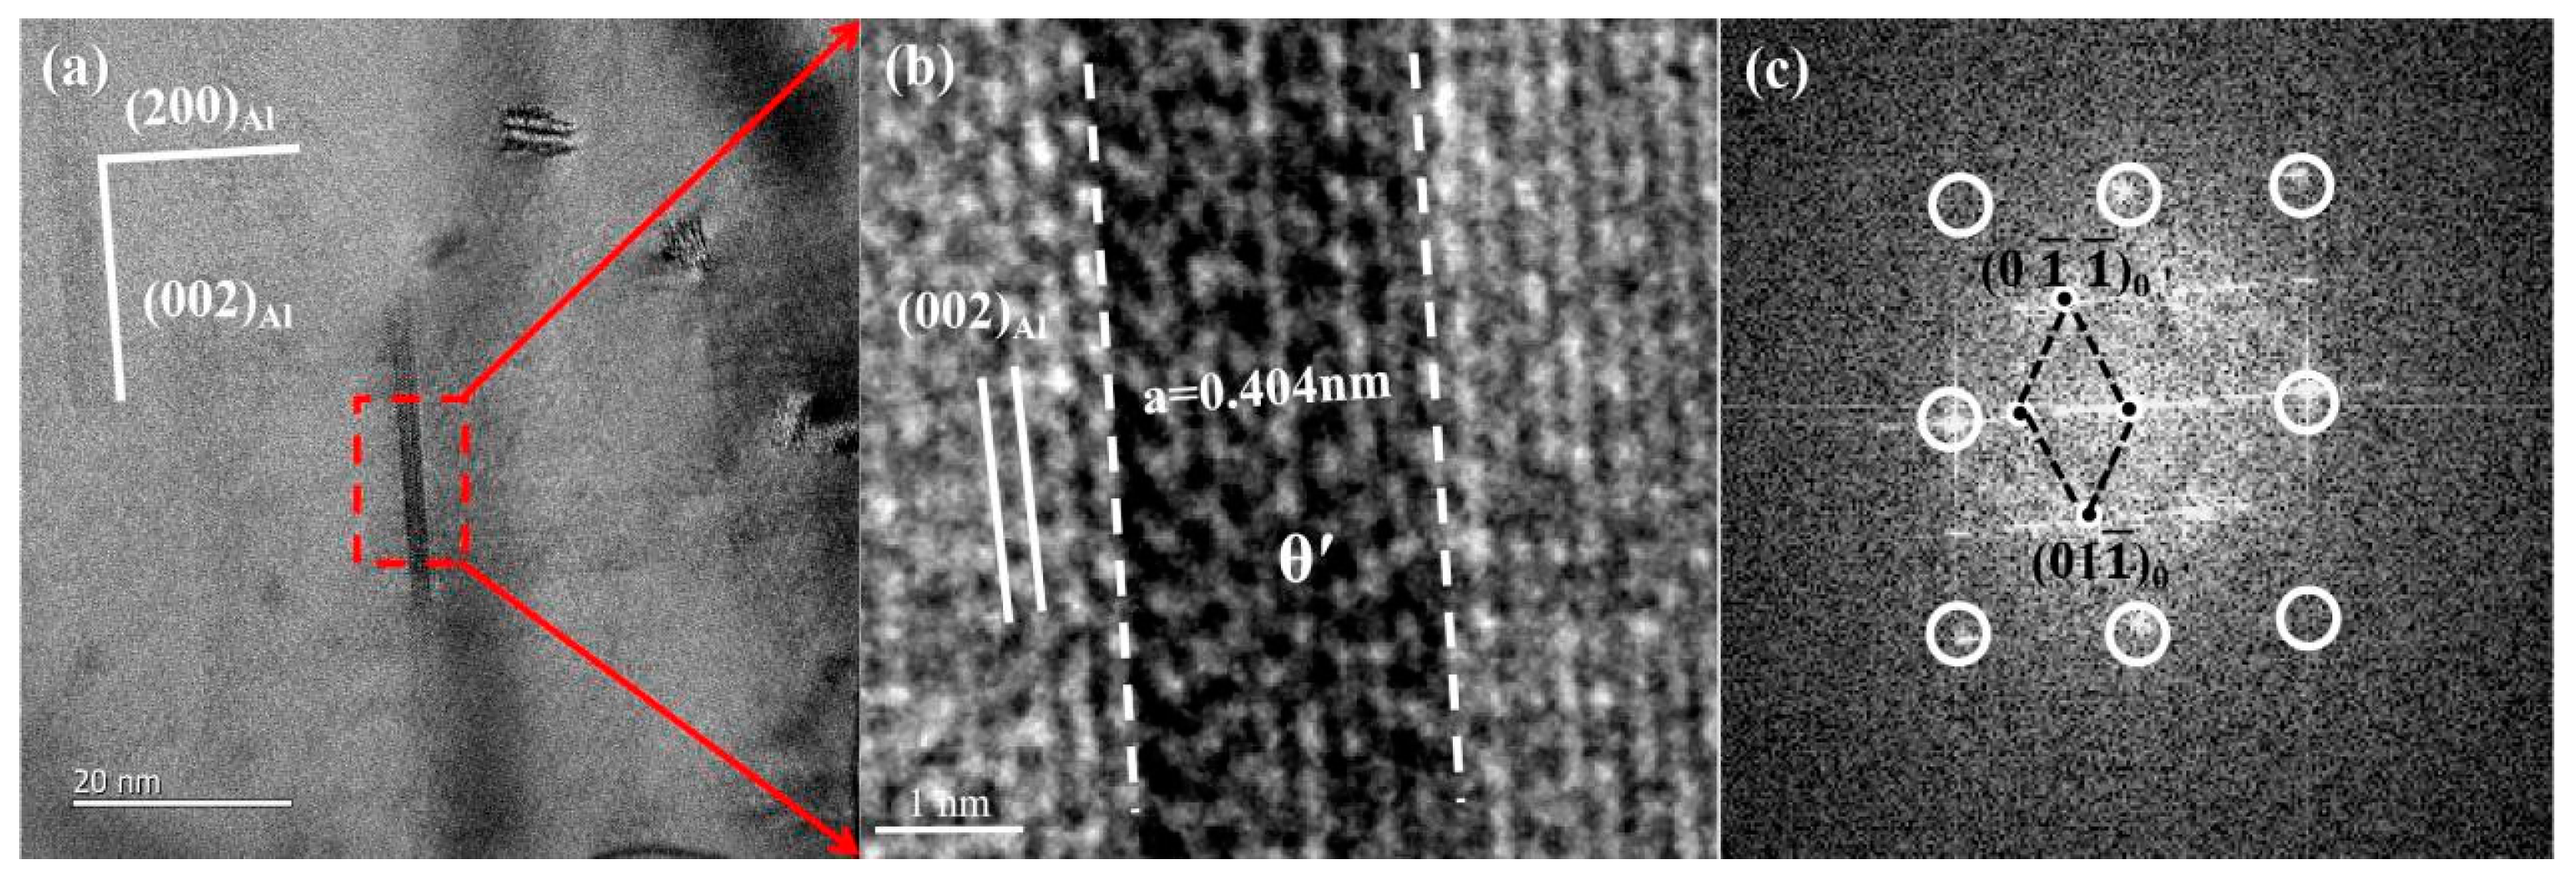
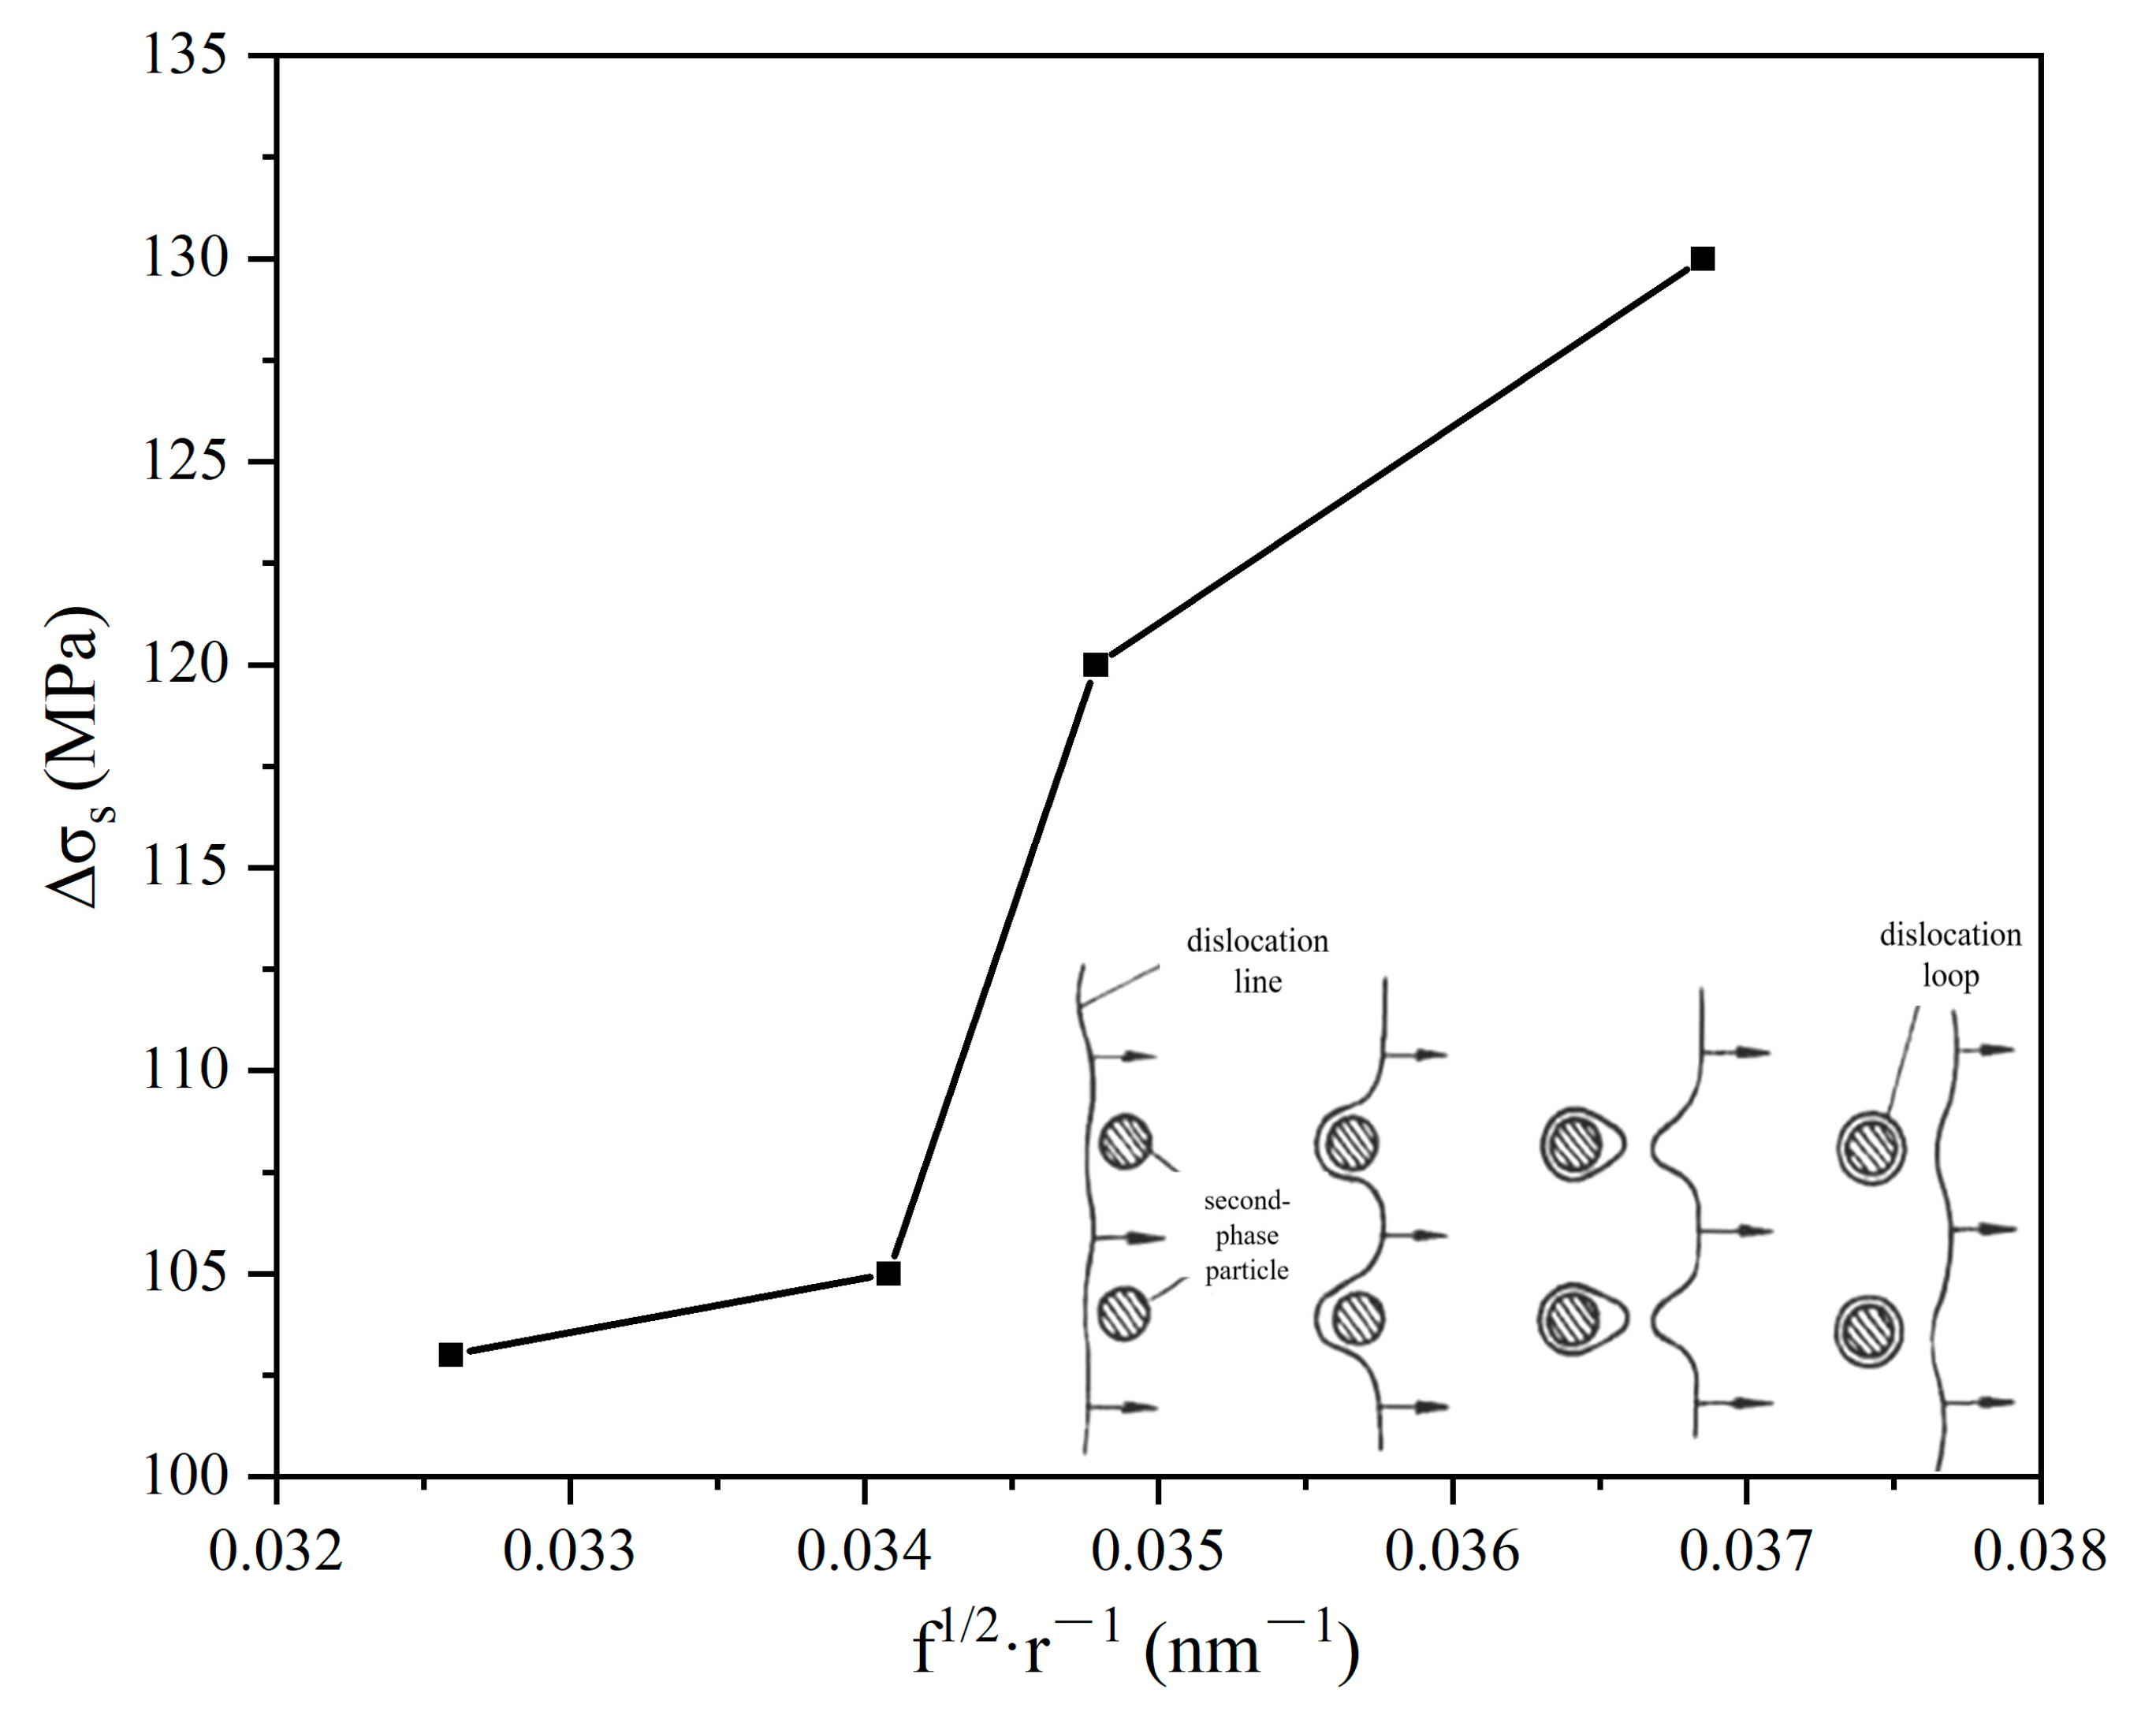
With the Cu level increasing, the types of main precipitates in the aging-treated samples changes from the needle-like β″ phase in base alloy to the β″ and granular Q′ phase in the 0.9%Cu alloy. When Cu content further increases to 1.5% and 2.1%, the types of main precipitates show the Q′ phase in the 1.5%Cu alloy, and the Q′ and θ′ phases in the 2.1%Cu alloy. After aging, the increase in Cu level leads to the increase in the volume fraction, number density, and average cross-sectional area of the precipitates.

Author Contributions

Conceptualization, D.W. and H.N.; Methodology, P.Z., D.W. and X.Z.; Validation, X.Z., X.L. and B.Z.; Formal Analysis, R.W. and B.Z.; Investigation, H.N., H.Z. and R.W.; Resources, D.W., B.Z. and R.W.; Data curation, P.Z., B.Z. and X.Z.; Writing—Original draft preparation, P.Z. and D.W.; Writing—Review & Editing, P.Z., D.W., X.Z. and R.W.; Visualization, X.L., H.Z. and B.Z.; Supervision, D.W., H.N. and H.Z.; Project administration, X.L., H.N. and H.Z.; Funding acquisition, X.L., D.W. and H.N. All authors have read and agreed to the published version of the manuscript.

Funding

This research was funded by the National Natural Science Foundation of China (Grants no. 52004168), The Research Fund for International Senior Scientists (Grants no. 52150710544), the National Natural Science Foundation of China (Grants nos. U1864209 and 51771066), the Aluminum-based Transportation Lightweighting Technology Demonstration Project (Grants no. 2021SFGC1001), and the National Foreign Expert Project 2022 (Grants no. G2022014146L). And The APC was funded by The Research Fund for International Senior Scientists (Grants no. 52150710544).

Institutional Review Board Statement

Not applicable.

Informed Consent Statement

Not applicable.

Data Availability Statement

The raw/processed data required to reproduce these findings cannot be shared at this time as the data also forms part of an ongoing study.

Conflicts of Interest

The authors declare no conflict of interest.

References

  1. Liu, T.; Pei, Z.-R. Characterization of nanostructures in a high pressure die cast Al-Si-Cu alloy. Acta Mater. 2022, 224, 117500. [Google Scholar] [CrossRef]
  2. Ma, S.; Wang, Y.; Wang, X. The in-situ formation of Al3Ti reinforcing particulates in an Al-7wt%Si alloy and their effects on mechanical properties. J. Alloys Compd. 2019, 792, 365–374. [Google Scholar] [CrossRef]
  3. Dong, X.; Zhu, X.; Ji, S. Effect of super vacuum assisted high pressure die casting on the repeatability of mechanical properties of Al-Si-Mg-Mn die-cast alloys. J. Mater. Process. Technol. 2019, 266, 105–113. [Google Scholar] [CrossRef]
  4. Dong, X.; Amirkhanlou, S.; Ji, S. Formation of strength platform in cast Al-Si-Mg-Cu alloys. Sci. Rep. 2019, 9, 1–11. [Google Scholar] [CrossRef] [Green Version]
  5. Zhang, G.-W.; Wang, Z.-J. Age hardening of Al-7Si-0.5Mg alloy: Role of Si size and distribution. J. Alloys Compd. 2023, 933, 167797. [Google Scholar] [CrossRef]
  6. Mohamed, A.M.A.; Samuel, E.; Samuel, A.M. Effect of Intermetallics and Tramp Elements on Porosity Formation and Hardness of Al-Si-Mg and Al-Si-Cu-Mg Alloys. Int. J. Met. Cast. 2022, 1–18. [Google Scholar] [CrossRef]
  7. Chen, B.; Dong, L. The Effect of Cu Addition on the Precipitation Sequence in the Al-Si-Mg-Cr Alloy. Materials 2022, 22, 8221. [Google Scholar] [CrossRef]
  8. Li, H.; Guo, S.L.; Du, P.; Liu, S. Effect of Cu Content on Microstructure and Properties of Al-Mg-Si Alloy. Phys. Eng. Met. Mater. 2019, 217, 143–151. [Google Scholar]
  9. Zhu, X.Z.; Ji, S. Improvement in as-cast strength of high pressure die-cast Al-Si-Cu-Mg alloys by synergistic effect of Q-Al5Cu2Mg8Si6 and θ-Al2Cu phases. Mater. Sci. Eng. A 2021, 802, 140612. [Google Scholar] [CrossRef]
  10. Zuo, L.; Ye, B. Effect of Q-Al5Cu2Mg8Si6 phase on mechanical properties of Al-Si-Cu-Mg alloy at elevated temperature. Mater. Sci. Eng. A 2017, 693, 26–32. [Google Scholar] [CrossRef]
  11. Jonas, K.S.; Calin, D.M.; Randi, H. The effect of low Cu additions on precipitate crystal structures in overaged Al-Mg-Si(-Cu) alloys. Mater. Charact. 2020, 160, 110087. [Google Scholar]
  12. Shang, X.J.; Liu, Q.; Xu, P. Effects of copper and rare Earth elements on properties of aluminum electrical round bars. Trans. Nonferrous Met. Soc. China 2018, 8, 16–19. [Google Scholar]
  13. Wang, Y.-F.; Lu, Y.-L. Characterization and strengthening effects of different precipitates in Al-7Si-Mg alloy. J. Alloys Compd. 2021, 885, 161028. [Google Scholar] [CrossRef]
  14. Zhou, P.; Wang, D.; Liu, S.; Wang, R.; Zhang, H.; Li, X.; Nagaumi, H. New Strategy to Improve the Mechanical Properties in Cast Al–Mg–Fe Alloys by the Formation of Al–AlFe Eutectic. Adv. Eng. Mater. 2021, 23, 2001460. [Google Scholar] [CrossRef]
  15. Yan, P.; Mao, W. Microstructural evolution, segregation and fracture behavior of A390 alloy prepared by combined Rheo-HPDC processing and Sr-modifier. J. Alloys Compd. 2020, 835, 155297. [Google Scholar] [CrossRef]
  16. Pramod, S.; Ravikirana, A.; Prasadarao, B.; Murty, S. Effect of Sc addition and T6 aging treatment on the microstructure modification and mechanical properties of A356 alloy. Mater. Sci. Eng. A 2016, 674, 438–450. [Google Scholar] [CrossRef]
  17. Shabani, M.; Mazahery, A. Prediction of mechanical properties of cast A356 alloy as a function of microstructure and cooling rate. Arch. Metall. Mater. 2011, 56, 671–675. [Google Scholar] [CrossRef]
  18. Shishido, H.; Aruga, Y.; Murata, Y.; Marioara, C.; Engler, O. Evaluation of precipitates and clusters during artificial aging of two model Al–Mg–Si alloys with different Mg/Si ratios. J. Alloys Compd. 2022, 927, 166978. [Google Scholar] [CrossRef]
  19. Farkoosh, A.; Pekguleryuz, M. Enhanced mechanical properties of an Al–Si–Cu–Mg alloy at 300 C: Effects of Mg and the Q-precipitate phase. Mater. Sci. Eng. A 2015, 621, 277–286. [Google Scholar] [CrossRef]
  20. Li, Y.; Brusethaug, S.; Olsen, A. Influence of Cu on the mechanical properties and precipitation behavior of AlSi7Mg0.5 alloy during aging treatment. Scr. Mater. 2006, 54, 99–103. [Google Scholar] [CrossRef]
  21. Zhang, X.; Liu, F. Microstructural evolution and strengthening mechanism of an Al-Si-Mg alloy processed by high-pressure torsion with different heat treatments. Mater. Sci. Eng. A 2020, 794, 139932. [Google Scholar] [CrossRef]
  22. Lei, W. Mechanical Properties of Materials, 3rd ed.; China Machine Press: Beijing, China, 2014; p. 76. [Google Scholar]
Figure 1. Schematic of the sample position for microstructural and tensile tests.
Metals 13 00098 g001
Figure 2. SEM-BSE images of as-cast alloy (a) A1, (b) A2, (c) A3, (d) A4.
Metals 13 00098 g002
Figure 3. XRD image of as-cast alloys.
Metals 13 00098 g003
Figure 4. SEM-mapping images of the alloys after aging treatment (a) A1, (b) A2, (c) A3, (d) A4.
Metals 13 00098 g004aMetals 13 00098 g004b
Figure 5. Bright-field TEM images of the alloys after aging treatment (a) A1, (b) A2, (c) A3, (d) A4.
Metals 13 00098 g005
Figure 6. β″ phase in A1 alloy in the <010>Al axis after aging treatment: (a) TEM image, (b) HRTEM image, (c) corresponding FFT, (d) schematic pattern.
Metals 13 00098 g006
Figure 7. β″ phase in A2 alloy in the <010>Al axis after aging treatment: (a) TEM image, (b) HRTEM image, (c) corresponding FFT, (d) schematic pattern.
Metals 13 00098 g007
Figure 8. Q′ phase in A2 alloy in the <010>Al axis after aging treatment: (a) TEM image, (b) HRTEM image, (c) corresponding FFT.
Metals 13 00098 g008
Figure 9. Q′ phase in A3 alloy in the <010>Al axis after aging treatment: (a) TEM image, (b) HRTEM image, (c) corresponding FFT.
Metals 13 00098 g009
Figure 10. Q′ phase in A4 alloy after aging treatment along the <010>Al axis: (a) HRTEM image, (b) corresponding FFT.
Metals 13 00098 g010
Figure 11. θ′ phase in A4 alloy after aging treatment, observed along the <010>Al axis: (a) TEM image, (b) HRTEM image, (c) corresponding FFT.
Metals 13 00098 g011
Figure 12. Engineering stress–strain curves of the alloys after solid solution and aging treatment.
Metals 13 00098 g012
Figure 13. The variation tendency of yield strength increments with the f1/2·r−1.
Metals 13 00098 g013
Figure 14. Fracture surfaces of the alloys after T6 treatment: (a) A1, (b) A2, (c) A3, (d) A4.
Metals 13 00098 g014
Table 1. Composition of the Al-Si-Mg-Cu alloys [wt.%].
AlloySiMgCuFeSrOtherAl
A18.530.430.010.1160.0195<0.01Bal.
A28.520.420.890.1160.0196<0.01Bal.
A38.510.441.430.1170.0219<0.01Bal.
A48.540.432.080.1170.0211<0.01Bal.
Table 2. Number density of precipitate in aging-treated samples.
Alloyn (Number Density/ × 1022 m−3)l (Average Length/nm)Acs (Average Area of the
Cross-Section/nm2)
A16.5622.4116.6501
A26.9822.8517.8293
A38.0124.5219.6582
A48.2127.5922.3276
Table 3. Tensile properties of the designed alloys under different conditions.
AlloyQuenching StateAging Treatment
UTS (MPa)YS (MPa)A25 (%)UTS (MPa)YS (MPa)A25 (%)
A1275 ± 5.2161 ± 4.218.5 ± 1.2322 ± 4.2264 ± 4.610 ± 1.1
A2335 ± 5.3194 ± 4.417.1 ± 1.3343 ± 5.7299 ± 3.58.7 ± 0.8
A3347 ± 4.5201 ± 3.316.4 ± 0.9394 ± 6.1321 ± 4.18.6 ± 0.7
A4363 ± 4.2221 ± 4.516.1 ± 1.6442 ± 5.3351 ± 4.98.4 ± 0.6
Table 4. Differences in the yield strength of the samples between quenching and aging and the contribution to yield strength from precipitates calculated by the Orowan mechanism.
AlloyYield Strength
after Quenching (MPa)
Yield Strength after Aging (MPa)Improvement in Yield
Strength (MPa) (by
Experiment)
Precipitates
Contribution to Yield Strength (MPa) (by Orowan Mechanism)
A1161 ± 4.2264 ± 4.6103119.5
A2194 ± 4.4299 ± 3.5105125.0
A3201 ± 3.3321 ± 4.1120128.1
A4221 ± 4.5351 ± 4.9130135.8
Disclaimer/Publisher’s Note: The statements, opinions and data contained in all publications are solely those of the individual author(s) and contributor(s) and not of MDPI and/or the editor(s). MDPI and/or the editor(s) disclaim responsibility for any injury to people or property resulting from any ideas, methods, instructions or products referred to in the content.

