
Transitory Ultrasonic Absorption in “Domain Engineered” Structures of 10 M Ni-Mn-Ga Martensite
by
 , ,
, ,
Sergey Kustov
1,*, 
Andrey Saren
2,
Bruno D’Agosto
1,
Konstantin Sapozhnikov
3,
Vladimir Nikolaev
3 and
Kari Ullakko
2 1
Departament de Física, Universitat de les Illes Balears, cra Valldemossa, km. 7.5, 07122 Palma de Mallorca, Spain
2
Material Physics Laboratory, School of Engineering Science, LUT University, Yliopistonkatu 34, 53850 Lappeenranta, Finland
3
Shaped Crystals Physics Laboratory, Solid State Physics Division, Ioffe Institute, Polytechnicheskaya, 26, 194021 St. Petersburg, Russia
*
Author to whom correspondence should be addressed.
Metals 2021, 11(10), 1505; https://doi.org/10.3390/met11101505
Submission received: 31 August 2021
/
Revised: 18 September 2021
/
Accepted: 19 September 2021
/
Published: 23 September 2021
(This article belongs to the Special Issue Recent Development in Magnetic Shape Memory Alloys)
Abstract
:In this work we create in 10 M Ni-Mn-Ga martensitic samples special martensitic variant structures consisting of only three twins separated by two a/c twin boundaries: Type I and Type II, with relatively low and very high mobility, respectively. The “domain engineered” structure thus created allows us to investigate the dynamics of a single highly mobile a/c twin boundary (TB). We show that temperature variations between 290 and 173 K in our samples induce an intense transitory internal friction at ultrasonic frequencies ca. 100 kHz, peaking around 215 K. A comparison is made of the data for the “domain engineered” sample with the behaviour of reference samples without a/c TB. Reference samples have two different orientations of a/b twins providing zero and maximum shear stresses in a/b twinning planes. We argue, first, that the transitory internal friction, registered at rather high ultrasonic frequencies, has magnetic origin. It is related with the rearrangement of magnetic domain structure due to the motion of a/c twin boundary induced by thermal stresses. This internal friction term can be coined “magnetic transitory internal friction”. Magnetic transitory internal friction is a new category, linking the classes of transitory and magnetomechanical internal friction. Second, the structure of a/b twins is strongly non-equilibrium over a broad temperature range. As a consequence, the Young’s modulus values of the samples with maximum shear stress in a/b twinning planes can take any value between ca. 15 and 35 GPa, depending on the prehistory of the sample.
1. Introduction
10 M Ni-Mn-Ga martensites are examples of a multiferroic material in which strong coupling between ferroic subsystems—elastic and magnetic—is responsible for such useful property as magnetic actuation. Here we observe and describe a new phenomenon, associated with local magnetic flux change provoked by the motion of an elastic domain wall—a/c twin boundary (TB). This new phenomenon is the ultrasonic transitory internal friction (IF) of magnetic origin which is a new category of damping, linking the classes of transitory and magnetomechanical IF. In our experiments we use the “domain engineered” 10 M Ni-Mn-Ga samples with controlled structure of a/c and a/b twins. Such experiments reveal new striking features of apparent elastic properties of a/b twin laminate.
1.1. Transitory Internal Friction
The notion “Transitory internal friction” refers to the component of absorption of mechanical energy of periodic vibrations that emerges when oscillatory stress is coupled with a certain external field. The superimposed coupling field results in an extra irreversible strain produced by periodic stress and, hence, additional damping of oscillations. The irreversibility of strain marks the transitory IF, IFtr, since in conventional structural internal friction experiments anelastic strain is usually reversible. Physical origins of the additional periodic irreversible strain and, hence, of coupling fields can be different:
- -
- first order structural phase transition in a solid [1]; this transition can be induced by temperature, mechanical stress or any other relevant parameter such as magnetic field;
- -
- plastic or even microplastic deformation of crystals during active deformation, creep or temperature variation in non-cubic polycrystals [2]; external quasistatic stress is coupled then with the oscillatory stress.
The general formal description of the IFtr remains essentially the same despite apparent difference in potential specific physical mechanisms. The transitory internal friction is a strong function of strain-coupled external field and parameters of the measuring procedure, such as heating–cooling (stress, magnetic field, etc.) rate, frequency of measurements and oscillatory strain amplitude. During plastic or microplastic deformation, in a first approximation, IFtr is expressed as [2]:
where K is a constant, is the strain rate, f and are the frequency and elastic strain amplitude of mechanical oscillations, respectively.
The first order structural transition is accompanied by lattice strain. In the case of first order structural transition induced, for example, by temperature variation, the strain rate in Equation (1) is substituted for temperature variation rate or T-dot, :
with K’—numerical factor.
Equations (1) and (2) are easily interpreted qualitatively: IFtr is proportional to transformation or deformation rate, since the amount of additional strain per period of oscillations is proportional to these rates. The same reason explains the inverse frequency dependence: the higher the frequency, the lower the additional strain accumulated during one period of oscillations under constant strain rate or T-dot. The inverse dependence on strain amplitude stems from the definition of the internal friction as proportional to the ratio between the energy dissipated in a cycle of oscillations and maximum elastic stored energy W:
Since the denominator in the ratio, Equation (3), , a simple assumption that is proportional to the elastic strain amplitude yields the inverse proportionality of IFtr to . Many specific refinements of this simple interpretation have been suggested, see, e.g., reviews [1,2]. An important property of IFtr is the inverse (or nearly inverse in more refined theories [1]) frequency dependence, Equations (1) and (2). Therefore, it is generally accepted that the IFtr can be observed only at low frequencies, f < 103 Hz, and that it takes negligible values at higher, ultrasonic frequencies [1,2,3].
One of the conditions under which the IFtr emerges is a variation in temperature of polycrystalline materials with non-cubic lattice that possess anisotropy of thermal expansion coefficients, see, e.g., Ref. [2] and references therein. The anisotropy of thermal expansion is responsible for thermal stresses generated in differently oriented grains when the temperature of the polycrystalline aggregate changes. These thermal stresses induce microplastic or even plastic deformation of grains and, hence, the transitory IF emerges [2]. Under these circumstances, the IFtr is proportional to the cooling–heating rate, T-dot. For the same reason, thermal stresses are induced in multiphase materials, for example, precipitation hardened [3] and composite materials [4]. Another group of materials showing transitory IF during thermal cycling are shape memory alloys in the martensitic phase. The martensite is usually formed by self-accommodating twin-related elastic domains (“martensitic variants”) with low lattice symmetry and high anisotropy of thermal expansion [5]. Therefore, similar to polycrystalline aggregates, martensitic phases show the transitory IF, even if the material is single crystalline in the high-temperature phase. IFtr was observed and studied in the martensitic phase of classic Cu-Al-Ni [6] and NiTi [7] shape memory alloys. IFtr in martensites provides information on generation of thermal stresses, dynamics of twin boundaries, their pinning, etc.
1.2. Magnetomechanical Internal Friction
The magnetomechanical IF or magnetomechanical damping (MMD) is defined as any damping suppressed by a magnetic field [8]. The classic description of MMD considers three additive components, associated with magnetic domain walls and net magnetization of the sample. Two MMD components are linear in strain (with the IF value independent of strain amplitude ) and one—non-linear—whose value is strain amplitude-dependent [8,9,10]. Expressed as logarithmic decrement of oscillations, , these components are: a linear microeddy current damping, , usually found for low strain amplitudes; a non-linear hysteretic damping, , emerging at higher strain amplitudes, and a macroeddy current damping component, , which is also linear in strain amplitude or strain amplitude independent. and are ascribed to a short-range reversible and long-range hysteretic motion of magnetic domain walls, respectively. Macroeddy MMD originates from macroscopic net magnetization of the sample. Although by definition all three MMD terms vanish at saturation, they differ in their dependence on field. and attain maximum values for the demagnetized state of a sample (magnetization M = 0) then decline monotonously with applied field H, see e.g., Refs. [8,9,10,11], whereas = 0 when M = 0. Therefore, (H) has a maximum for H somewhat above half saturating field. Thus, only microeddy damping is relevant at low oscillation amplitudes in the demagnetized samples, without external field. A crucial property of microeddy MMD is the linear frequency dependence up to a frequency somewhat lower than the frequency of magnetic domain wall relaxation with typical values between 100 kHz and 10 MHz [10,12]. This frequency dependence is a consequence of Faraday’s law controlling the intensity of the energy dissipation by eddy currents.
Recently, T-dot dependent IF was reported in polycrystalline Dy below the Néel temperature, in the ordered antiferromagnetic state [13] at an ultrasonic frequency close to 90 kHz. Since the T-dot effect was observed only in the magnetically ordered state, it had been attributed to the magnetic domain structure; more specifically, to the magnetic domain walls perpendicular to the c-axis (axis of the sixth order in the hexagonal structure), which carry magnetic moments. The possibility to observe T-dot effect at an ultrasonic frequency was associated in [13] with the presumably magnetic origin of losses, which are proportional to the frequency in the low-amplitude range. This proportionality compensates the inverse frequency dependence of the transitory IF, Equation (2), and makes the IFtr essentially frequency-independent up to a frequency approaching the frequency of domain wall relaxation. Taking the relaxation frequency ca. 100 kHz–10 MHz, one gets the range of nearly frequency-independent transitory MMD up to 10 kHz–1 MHz [14].
In this work we intended to test whether the IF during thermal cycling of ferromagnetic martensites shows the magnetic ultrasonic transient internal friction. The idea behind this test is quite simple:
- -
- -
- in ferromagnetic martensites magnetic domain structure and structure of martensitic variants are strongly coupled [15,16,17] due to a high magnetocrystalline anisotropy; hence, variations of martensitic variant structure due to thermal stresses will inevitably produce rearrangement of the magnetic domain structure and, probably, magnetic transitory IF term.
It has to be emphasized that the transitory IF related to a change in magnetic domain structure can be classified as a new category of both transitory and magnetomechanical IF.
2. Materials and Methods
2.1. Material
For several reasons Ni-Mn-Ga ferromagnetic martensitic alloy with layered structure, (so-called 5 layered or 10 M martensite) with slightly monoclinically distorted tetragonal lattice was chosen. First, this type of the martensite is known to possess rather low twinning stress: 0.5–1.5 MPa for polyvariant samples and below 0.1 MPa for a single Type II twin boundary [18,19,20]. Therefore, it was expected to suffer, during temperature variations, microplastic strains sufficient to produce transitory effects. Second, the structure of this martensite is well documented due to its potential in practical applications. Recent studies show that 10 M martensite possesses an hierarchical 4-level twin structure [21,22]. a/c twins, observable at a macroscopic level, can have dimensions comparable with the sample size. a/c twins are responsible for the so-called magnetostrain: large strains that can be induced in 10 M martensite by an external magnetic field [23,24]. Internal twins inside a/c twins are mesoscopic level modulation twins with (100) and (010) type twinning planes. The small difference between a and b lattice parameters of the order of 0.002 nm [25] is nevertheless sufficient to create, at a microscopic level, a/b twins with (110) type twinning planes. Their thickness ranges from hundreds of nanometres to tens of microns [26,27,28]. The finest structural level is associated with so-called adaptive nanotwins of 2, 3 or 5 atomic layers thick. The difference between a, b and c axes results in a substantial anisotropy of thermal expansion of the variants joint by a/c twin boundaries [5]. Since c-axis is the direction of easy magnetization, any displacement of an a/c twin boundary (TB) provokes local variations of the magnetic flux. Two types of a/c TBs were found in 10 M Ni-Mn-Ga martensite: Type I with (1 0 1) twinning planes and Type II with irrational indices close to (10 1 10). Type I TBs have much lower mobility (twinning stress around 0.5–1 MPa) as compared to Type II ones (twinning stress below 0.1 MPa) [20].
2.2. Experimental Method and Protocol
The piezoelectric ultrasonic composite oscillator technique (PUCOT) [29,30], was used to measure elastic and anelastic (internal friction) properties of the samples at a frequency close to 90 kHz. The PUCOT employs longitudinal resonant oscillations of the oscillator, consisting of two quartz transducers and a sample attached to them. A fully automated experimental setup (see ref. [30] for a more detailed description) allowed us to measure and control the strain amplitude of the oscillations, register the values of the internal friction, expressed as logarithmic decrement, , and resonant frequency of the longitudinal oscillations of the sample, . Strong variations of the Young’s modulus (YM), and, hence, of the resonant frequency of the samples, were found for certain configurations of a/b twins. Therefore, instead of the approximate solution for the resonant frequency of samples [30], a precise one [31] was used:
where mq and ms are the masses of the quartz transducer and of the sample, fq and fc are the resonant frequencies of the quartz transducer alone and with the sample attached, respectively.
The YM of the sample E is determined from the resonant frequency , length of the sample and its density :
where n = 1, 2, 3… is the harmonic number.
Three experimental protocols employed consisted in (i) measurements of δ and f as a function of strain amplitude in order to determine the ranges of amplitude-independent and amplitude-dependent damping; these ranges correspond to predominantly linear and non-linear dynamics of twins under periodic stress in acoustic experiments; (ii) temperature cycling the sample between 290 and 173 K under a constant T-dot; (iii) interruptions of cooling/heating scans in several points of the thermal cycles and registration of the kinetics of relaxation of the IF and frequency under isothermal conditions during 2400 s. Measurements of temperature spectra were performed at low strain amplitudes, , in order to avoid non-linearity of the IF provoked by a large scale motion of elastic and magnetic domain walls. Cooling/heating rate during temperature spectra measurements was 1 or 2 K/min.
2.3. Samples
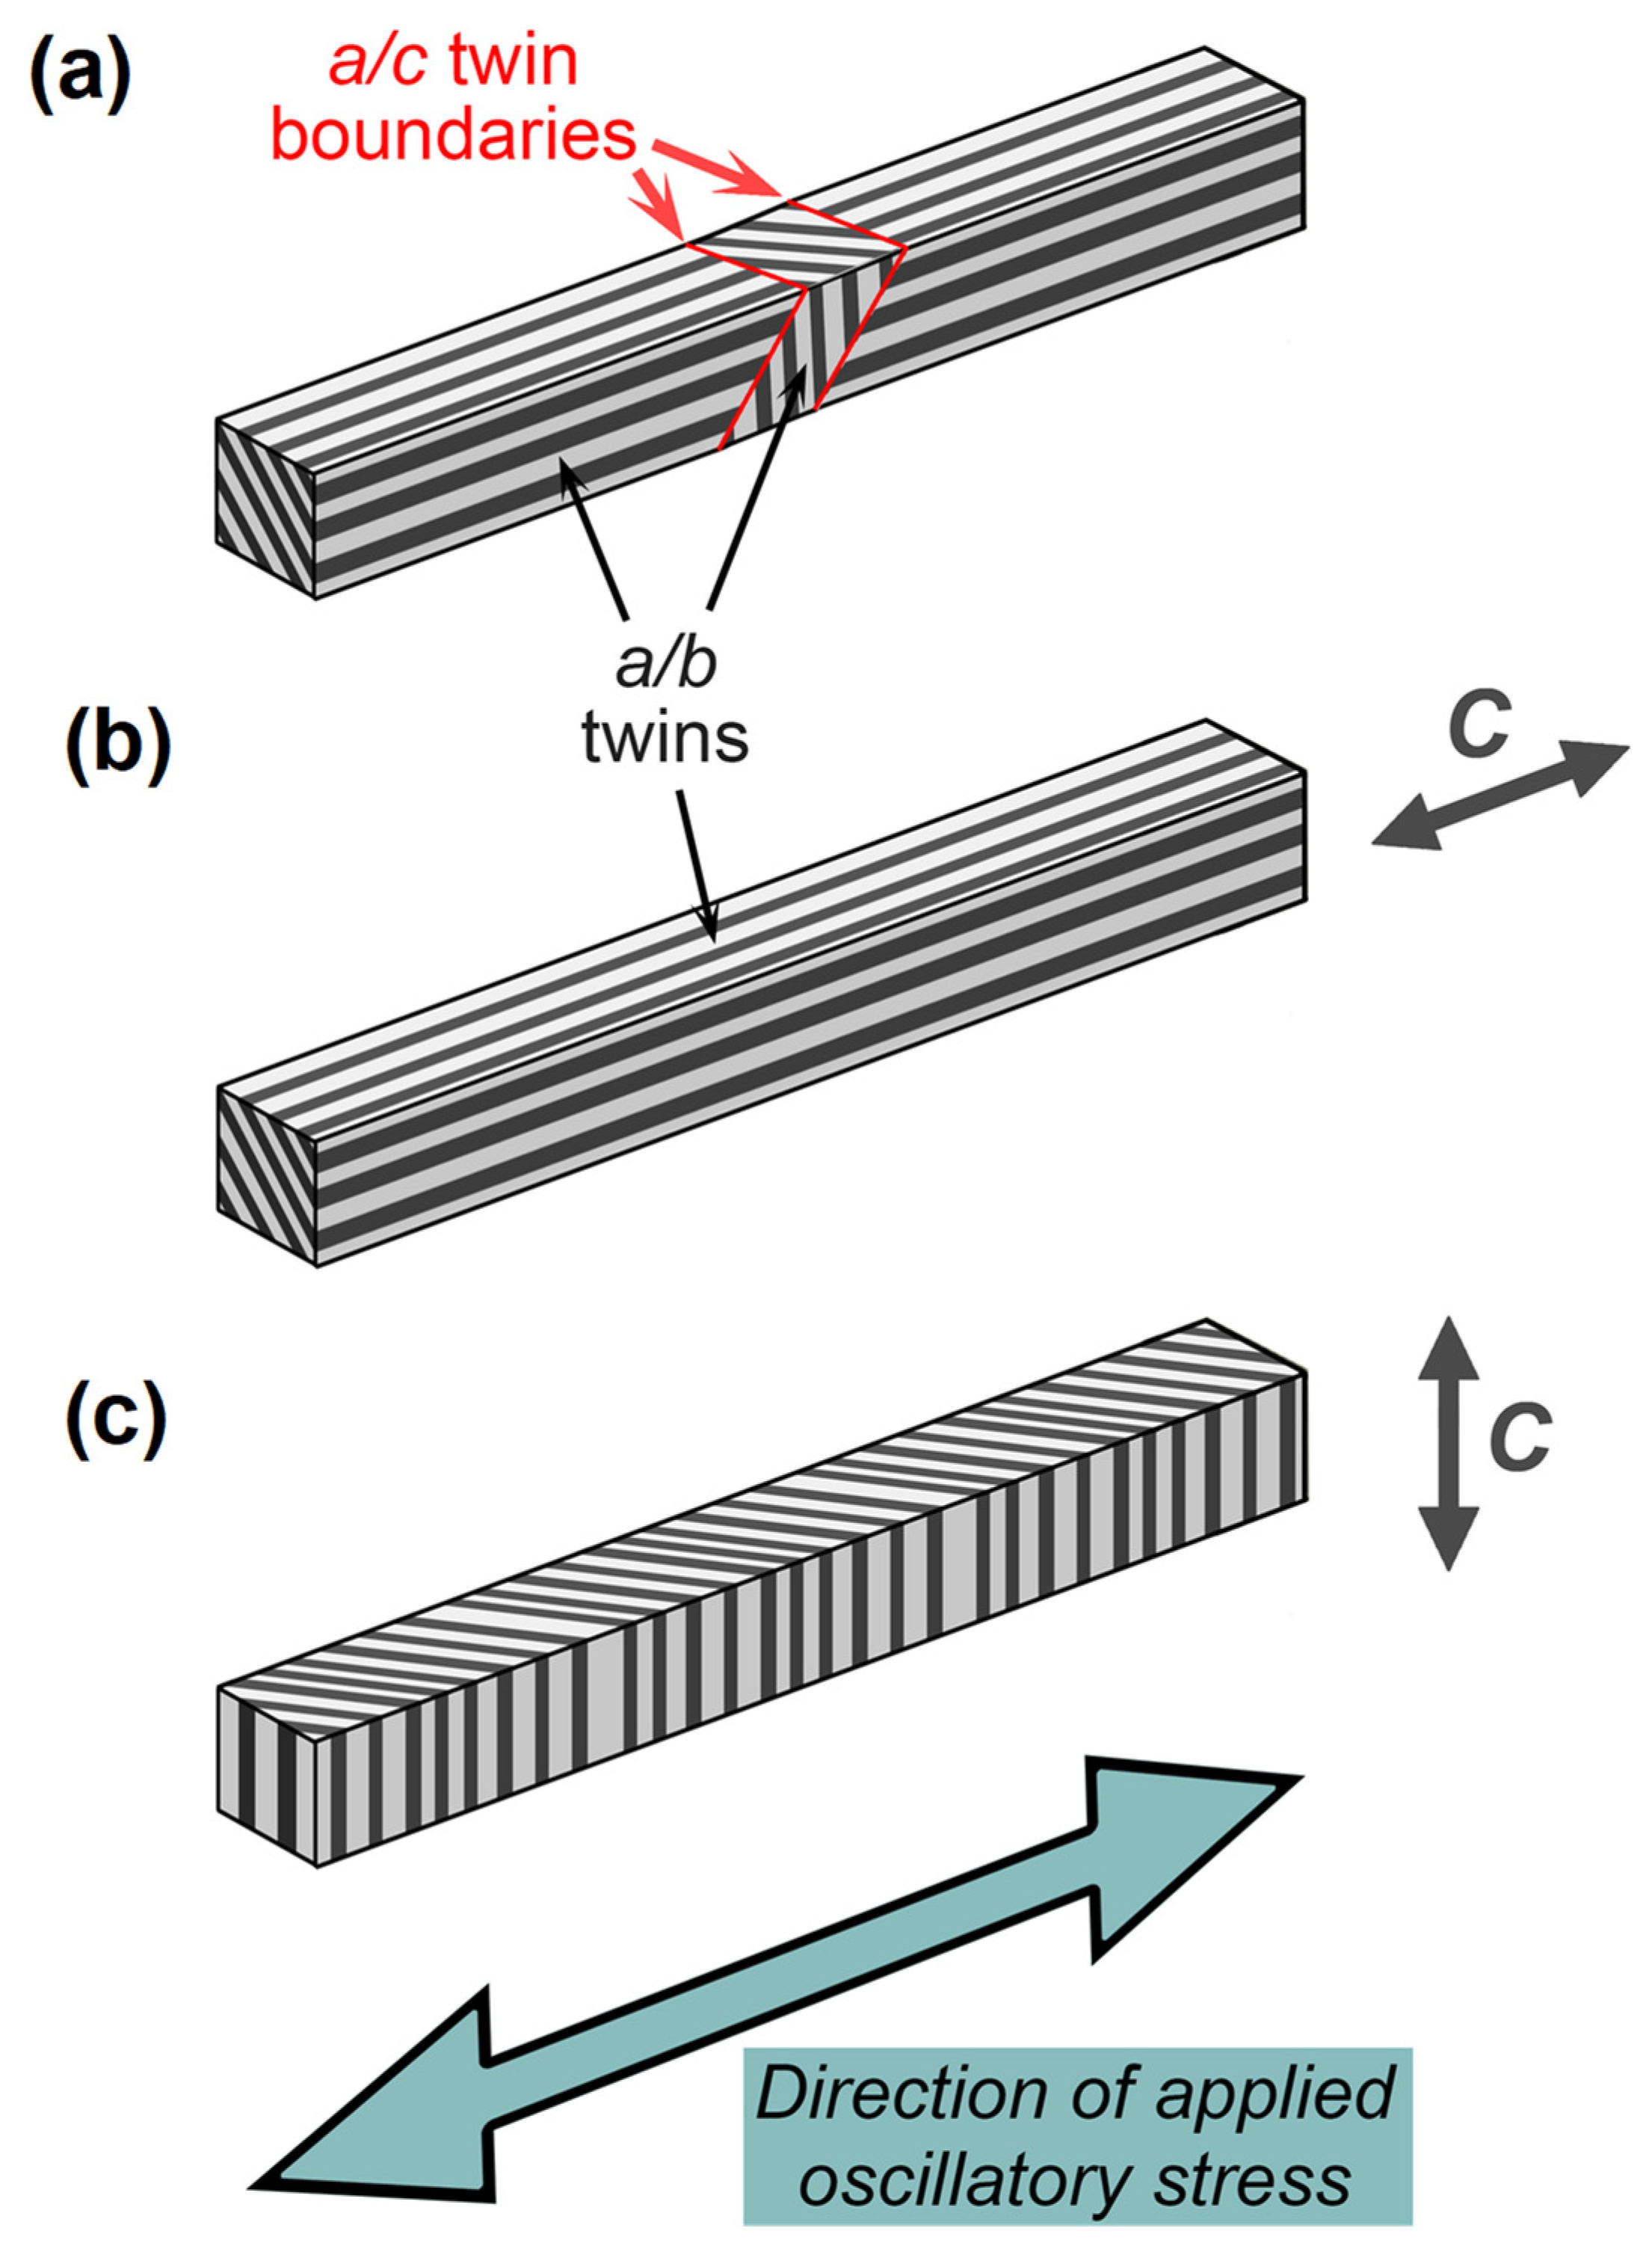
The samples produced by AdaptaMat Ltd., Finland, had the composition Ni50.0Mn28.4Ga21.6 (±0.3 at. %) and martensitic transformation temperatures slightly above 300 K [21]. The samples were bar-shaped, approximately 1.0 × 1.0 × (11–12) mm3, with surfaces parallel to {100} planes of the high-temperature cubic phase. The length of the sample was chosen to fit best the resonant frequency of the quartz transducer at room temperature. The surface of the samples was mechanically and chemically polished. Three different configurations of a/c and a/b twins were created in the samples, which are shown schematically in Figure 1. The major part of the experiments was performed for the so-called “domain engineered” [32] Structure 1 sample that contained three martensitic variants with differently oriented c-axes, separated by two a/c TBs of different types—see Figure 1a.
Two additional configurations of twins were checked (Structure 2, Figure 1b, and Structure 3, Figure 1c), similar to those studied in Ref. [33]. Both of these configurations did not contain a/c TBs and had easy magnetization c-axis parallel (Structure 2, Figure 1b) or perpendicular (Structure 3, Figure 1c) to the sample long side. Therefore, the shear stresses in the a/b twinning planes were absent or maximum, respectively, for these two configurations of a/b twins. Details of the preparation of samples with Structure 2 and Structure 3 of twins are reported in [33].
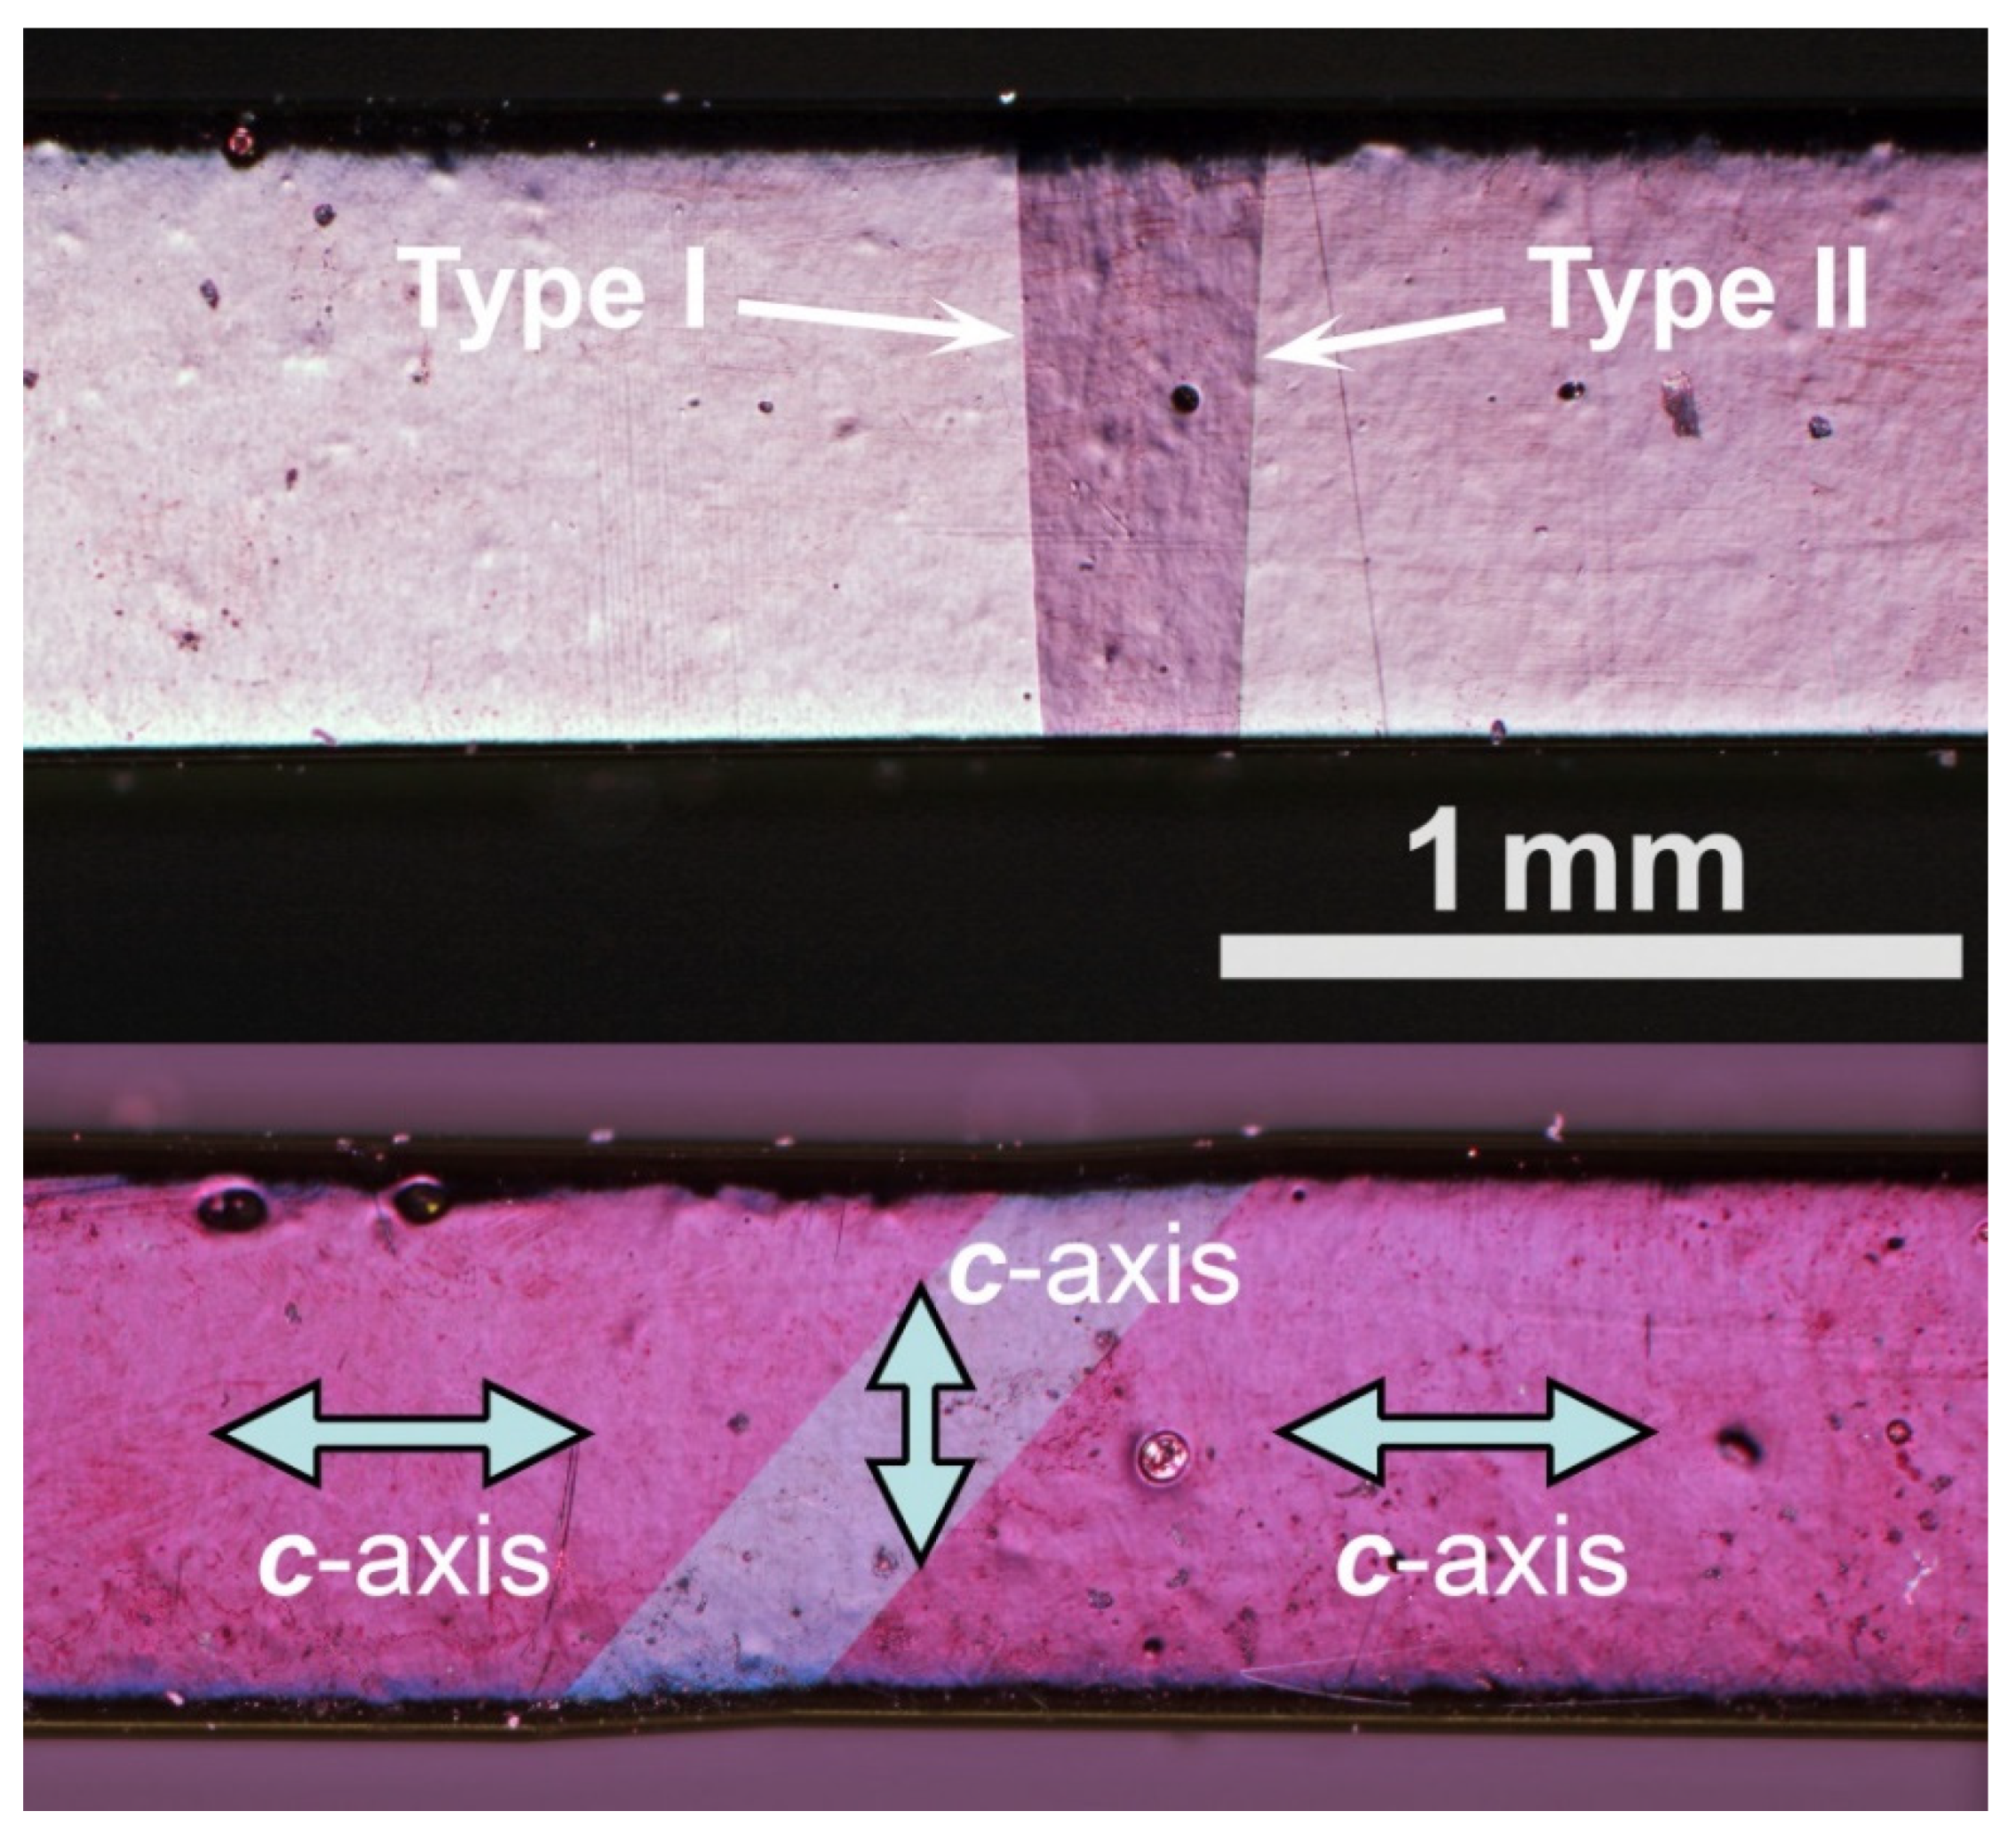
An optical image in Figure 2 taken in polarized light shows the central part of the sample with Structure 1, clarifying the a/c twin configuration schematically depicted in Figure 1a. The narrow variant with the c-axis perpendicular to the sample long side is always situated in the middle part of the sample. Two big variants with c-axis parallel to the sample length occupy both sides of the sample. The three variants are separated by two a/c twin boundaries: one with low mobility, Type I, and another one of high mobility, Type II. The central section of the sample is close to the stress antinode and the shear stress in the plane inclined 45° with respect to the sample axis reaches maximum values in the narrow central variant. It is important to mention that a/b twinning planes are parallel to the sample long axis in the two big variants at the ends of the sample and do not experience shear stress, whereas a/b twins in the central narrow variant are under maximum shear stress and might contribute, apart from the a/c twins, to the measured elastic and anelastic effects. Traces of micron-scale a/b twins are not seen in Figure 2, since their observation in an optical microscope requires higher magnifications and is difficult in general because of their low optical contrast [28].
The additional twin configurations with Structure 2 and Structure 3, Figure 1b,c, served to clarify the role of a/c and a/b twins in the elastic and anelastic effects found during thermal cycling of the samples. For the orientation of samples used, modulation twins with twinning planes (100) and (010) type, if they exist, do not experience shear stress. Therefore, their contribution to elastic and anelastic effects can be discarded.
The effect of a/c and a/b twin configurations on the IF damping and YM spectra was checked for three different samples which showed similar results.
3. Results
3.1. Strain Amplitude Dependence
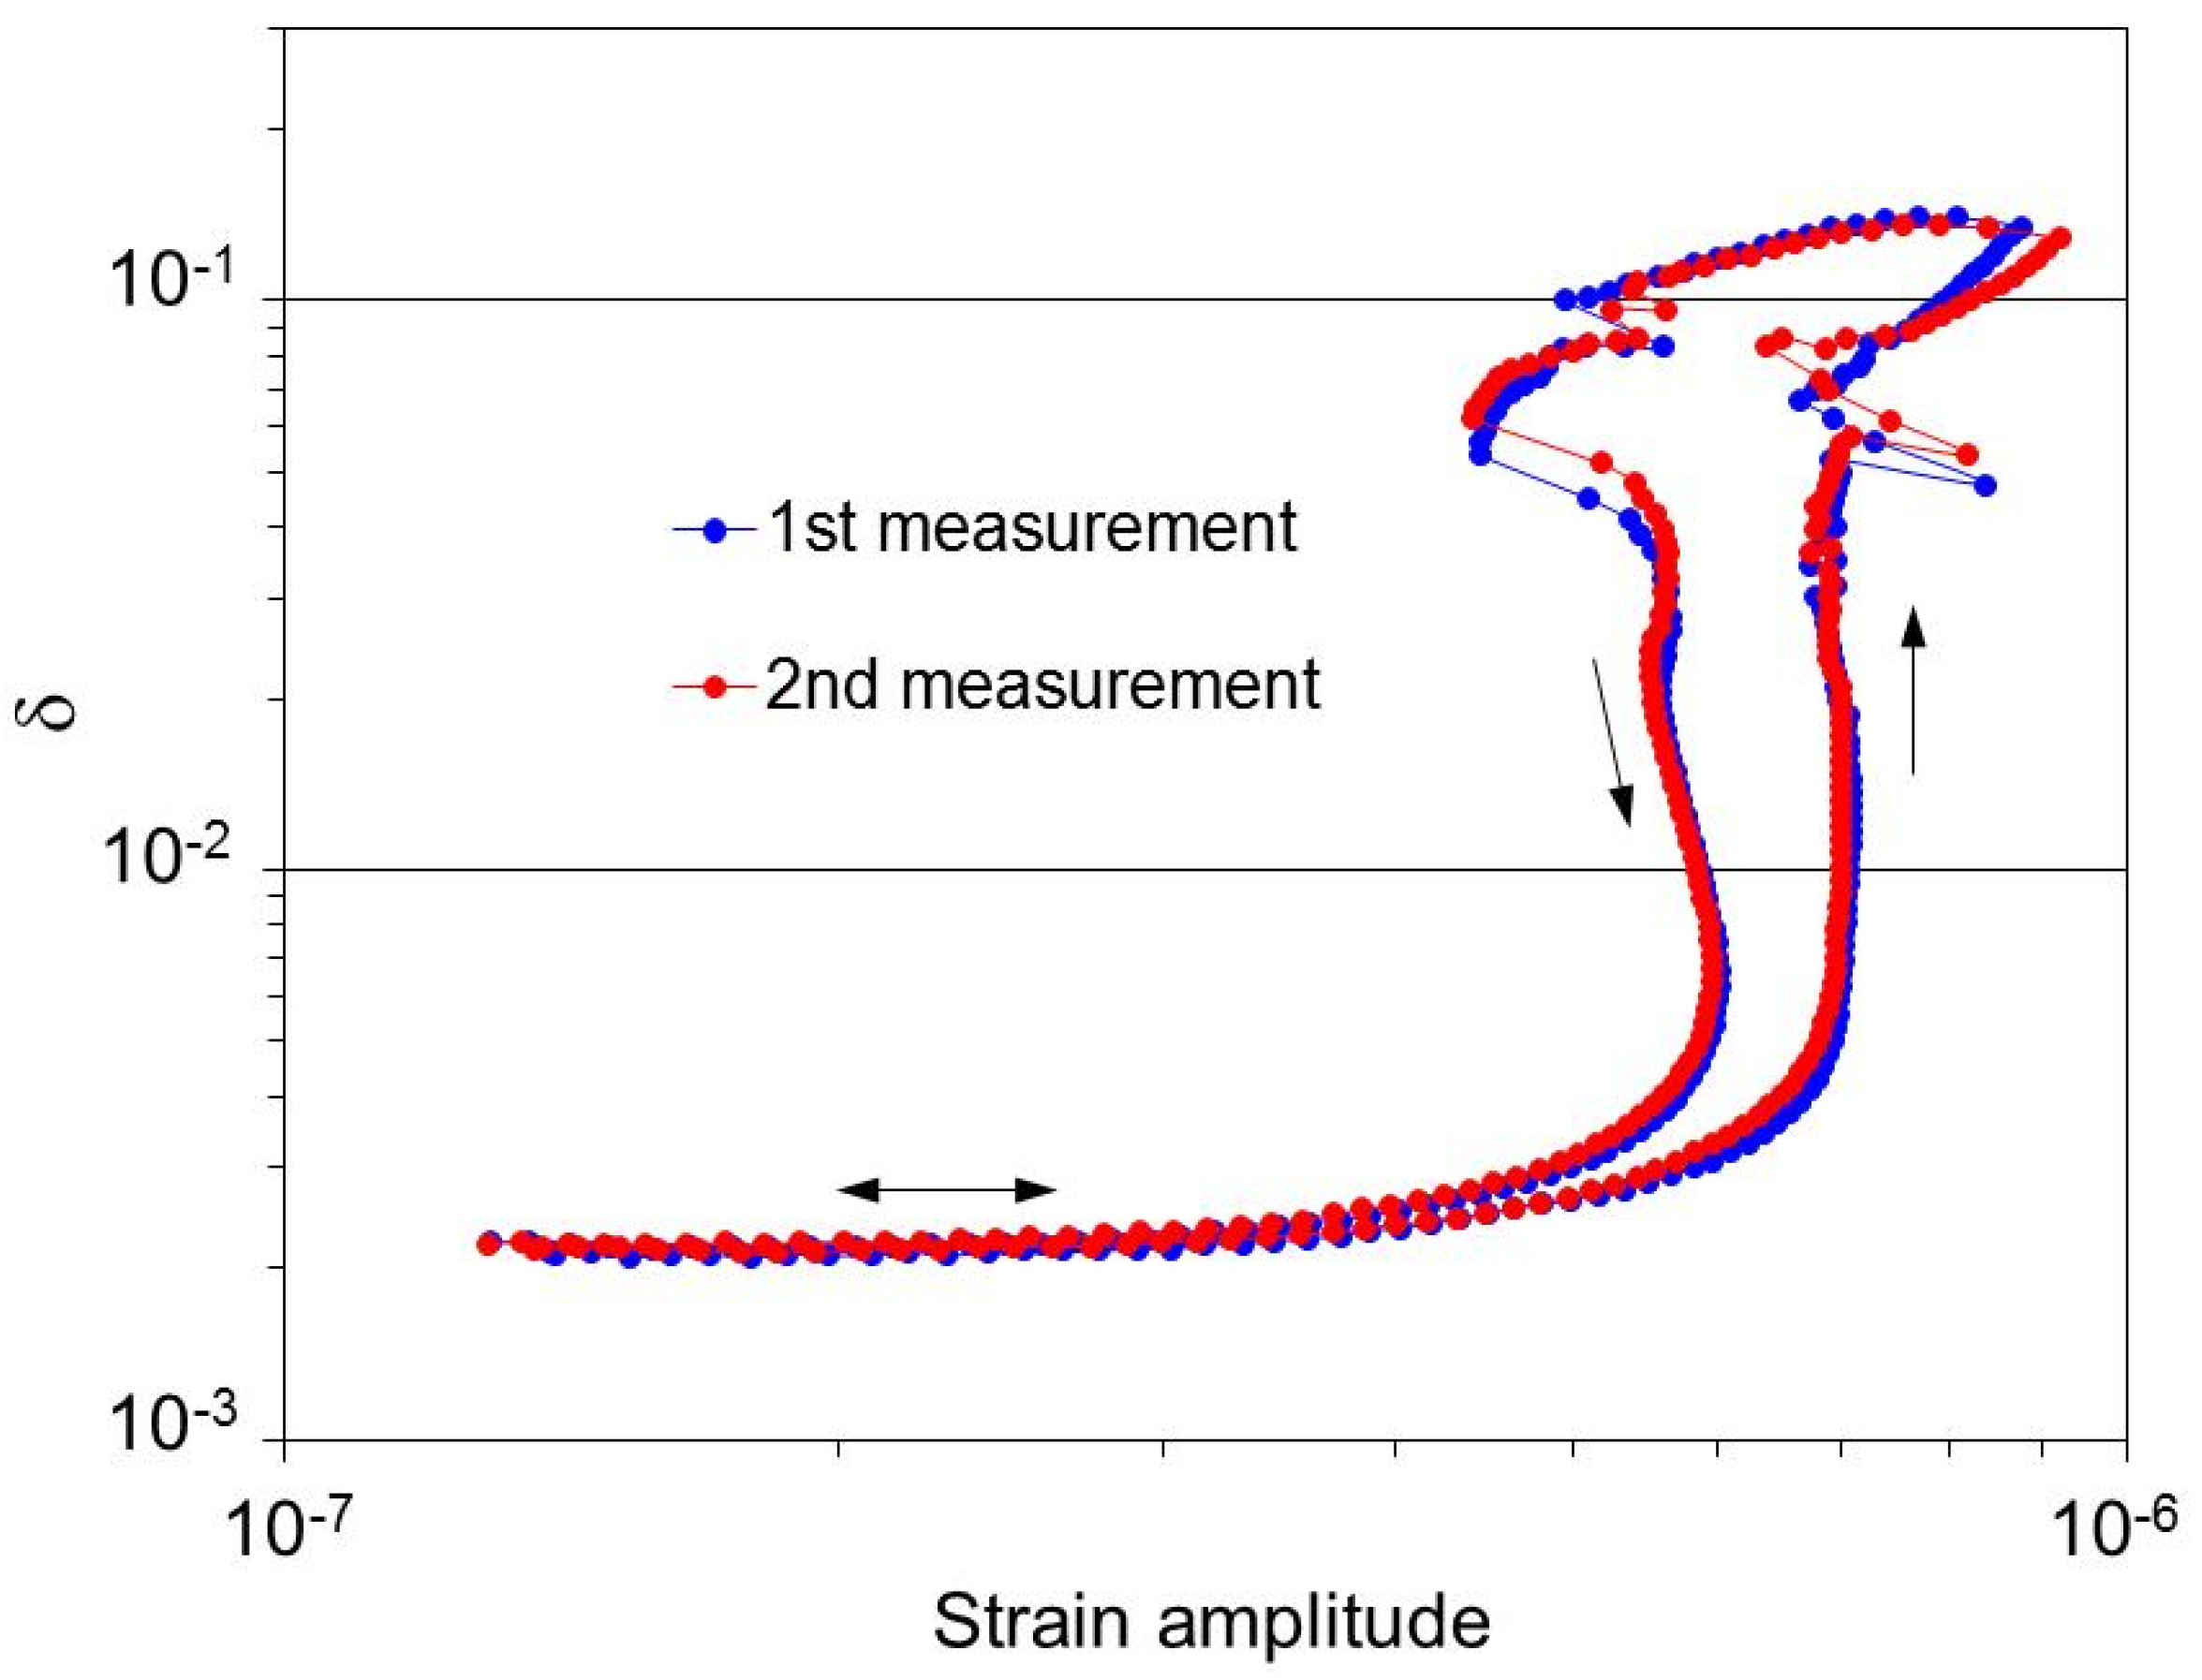
Figure 3 shows the effect of oscillatory strain amplitude on the IF at room temperature. The strain amplitude dependences were registered in two consecutive scans as increasing and decreasing the oscillatory strain amplitude. The IF shows a non-linear pattern typical for different ferroelastics, including shape memory alloys [34,35,36,37]:
- -
- a very weak non-linearity at low strain amplitudes, below ca. 6 × 10⁻⁷ for the increasing strain amplitudes, which transforms into a very steep increase in the IF;
- -
- the high-amplitude part of the dependence is jerky; it shows abrupt changes of the IF and of the strain amplitude;
- -
- a strong difference between direct run (increasing strain amplitudes) and reverse run (decreasing strain amplitude); we will refer to this effect as strain amplitude hysteresis;
- -
- the strain amplitude hysteresis is well reproducible in two consecutive strain amplitude scans: it fully recovers in the second scan.
All these features are well established marks of the IF due to the TBs pinned by agglomerations of partially mobile pinning points (Cottrell-like clouds) [34,35,36,37]. The low amplitude stage of the strain amplitude dependence corresponds to the motion of TBs within pinning clouds. The sharp increase in the IF at the high-amplitude stage reflects the depinning of TBs from the clouds and the transition to the motion of TBs in the homogeneous spatial distribution of obstacles outside the Cottrell-like clouds. The amplitude hysteresis implies, within this model, the redistribution of pinning clouds by TBs moving in acoustic experiments. The reproducibility of the strain amplitude hysteresis indicates that the relaxation time of perturbed Cottrell-like clouds is less than the time to register a strain amplitude dependence (ca. 100 s).
Based on the strain amplitude scans, the low strain amplitude of 2 × 10⁻⁷ was selected for temperature spectra measurements in order to avoid the depinning of TBs by oscillatory stresses.
Figure 3 yields the critical strain amplitude for depinning of TBs and their jerky motion as . Taking the Young’s modulus E of the sample Structure 1 as ca. 40 GPa (the Young’s modulus of Structures 1–3 will be introduced later on), one obtains an estimation of the critical depinning stress, corresponding to the start of the jerky motion of TB as . This value agrees well with the critical stress for the motion of a single Type II TBs [19,20], whereas movement of Type I TBs require more than order of magnitude higher stresses [20]. The non-linear IF in the same material due to a/b TB motion is a smooth power-law function of strain amplitude and does not show strain amplitude hysteresis [33]. Hence, the intense strain amplitude hysteresis and jerky non-linear anelastic behaviour point to the predominant role, at least in non-linear anelastic effects, of the highly mobile Type II a/c TB. An important conclusion relevant to dynamics of a/c TBs in 10 M Ni-Mn-Ga martensite is, thus, their interaction and pinning by Cottrell-like clouds of obstacles, which has not been detected for a/b TBs.
3.2. Temperature Dependence
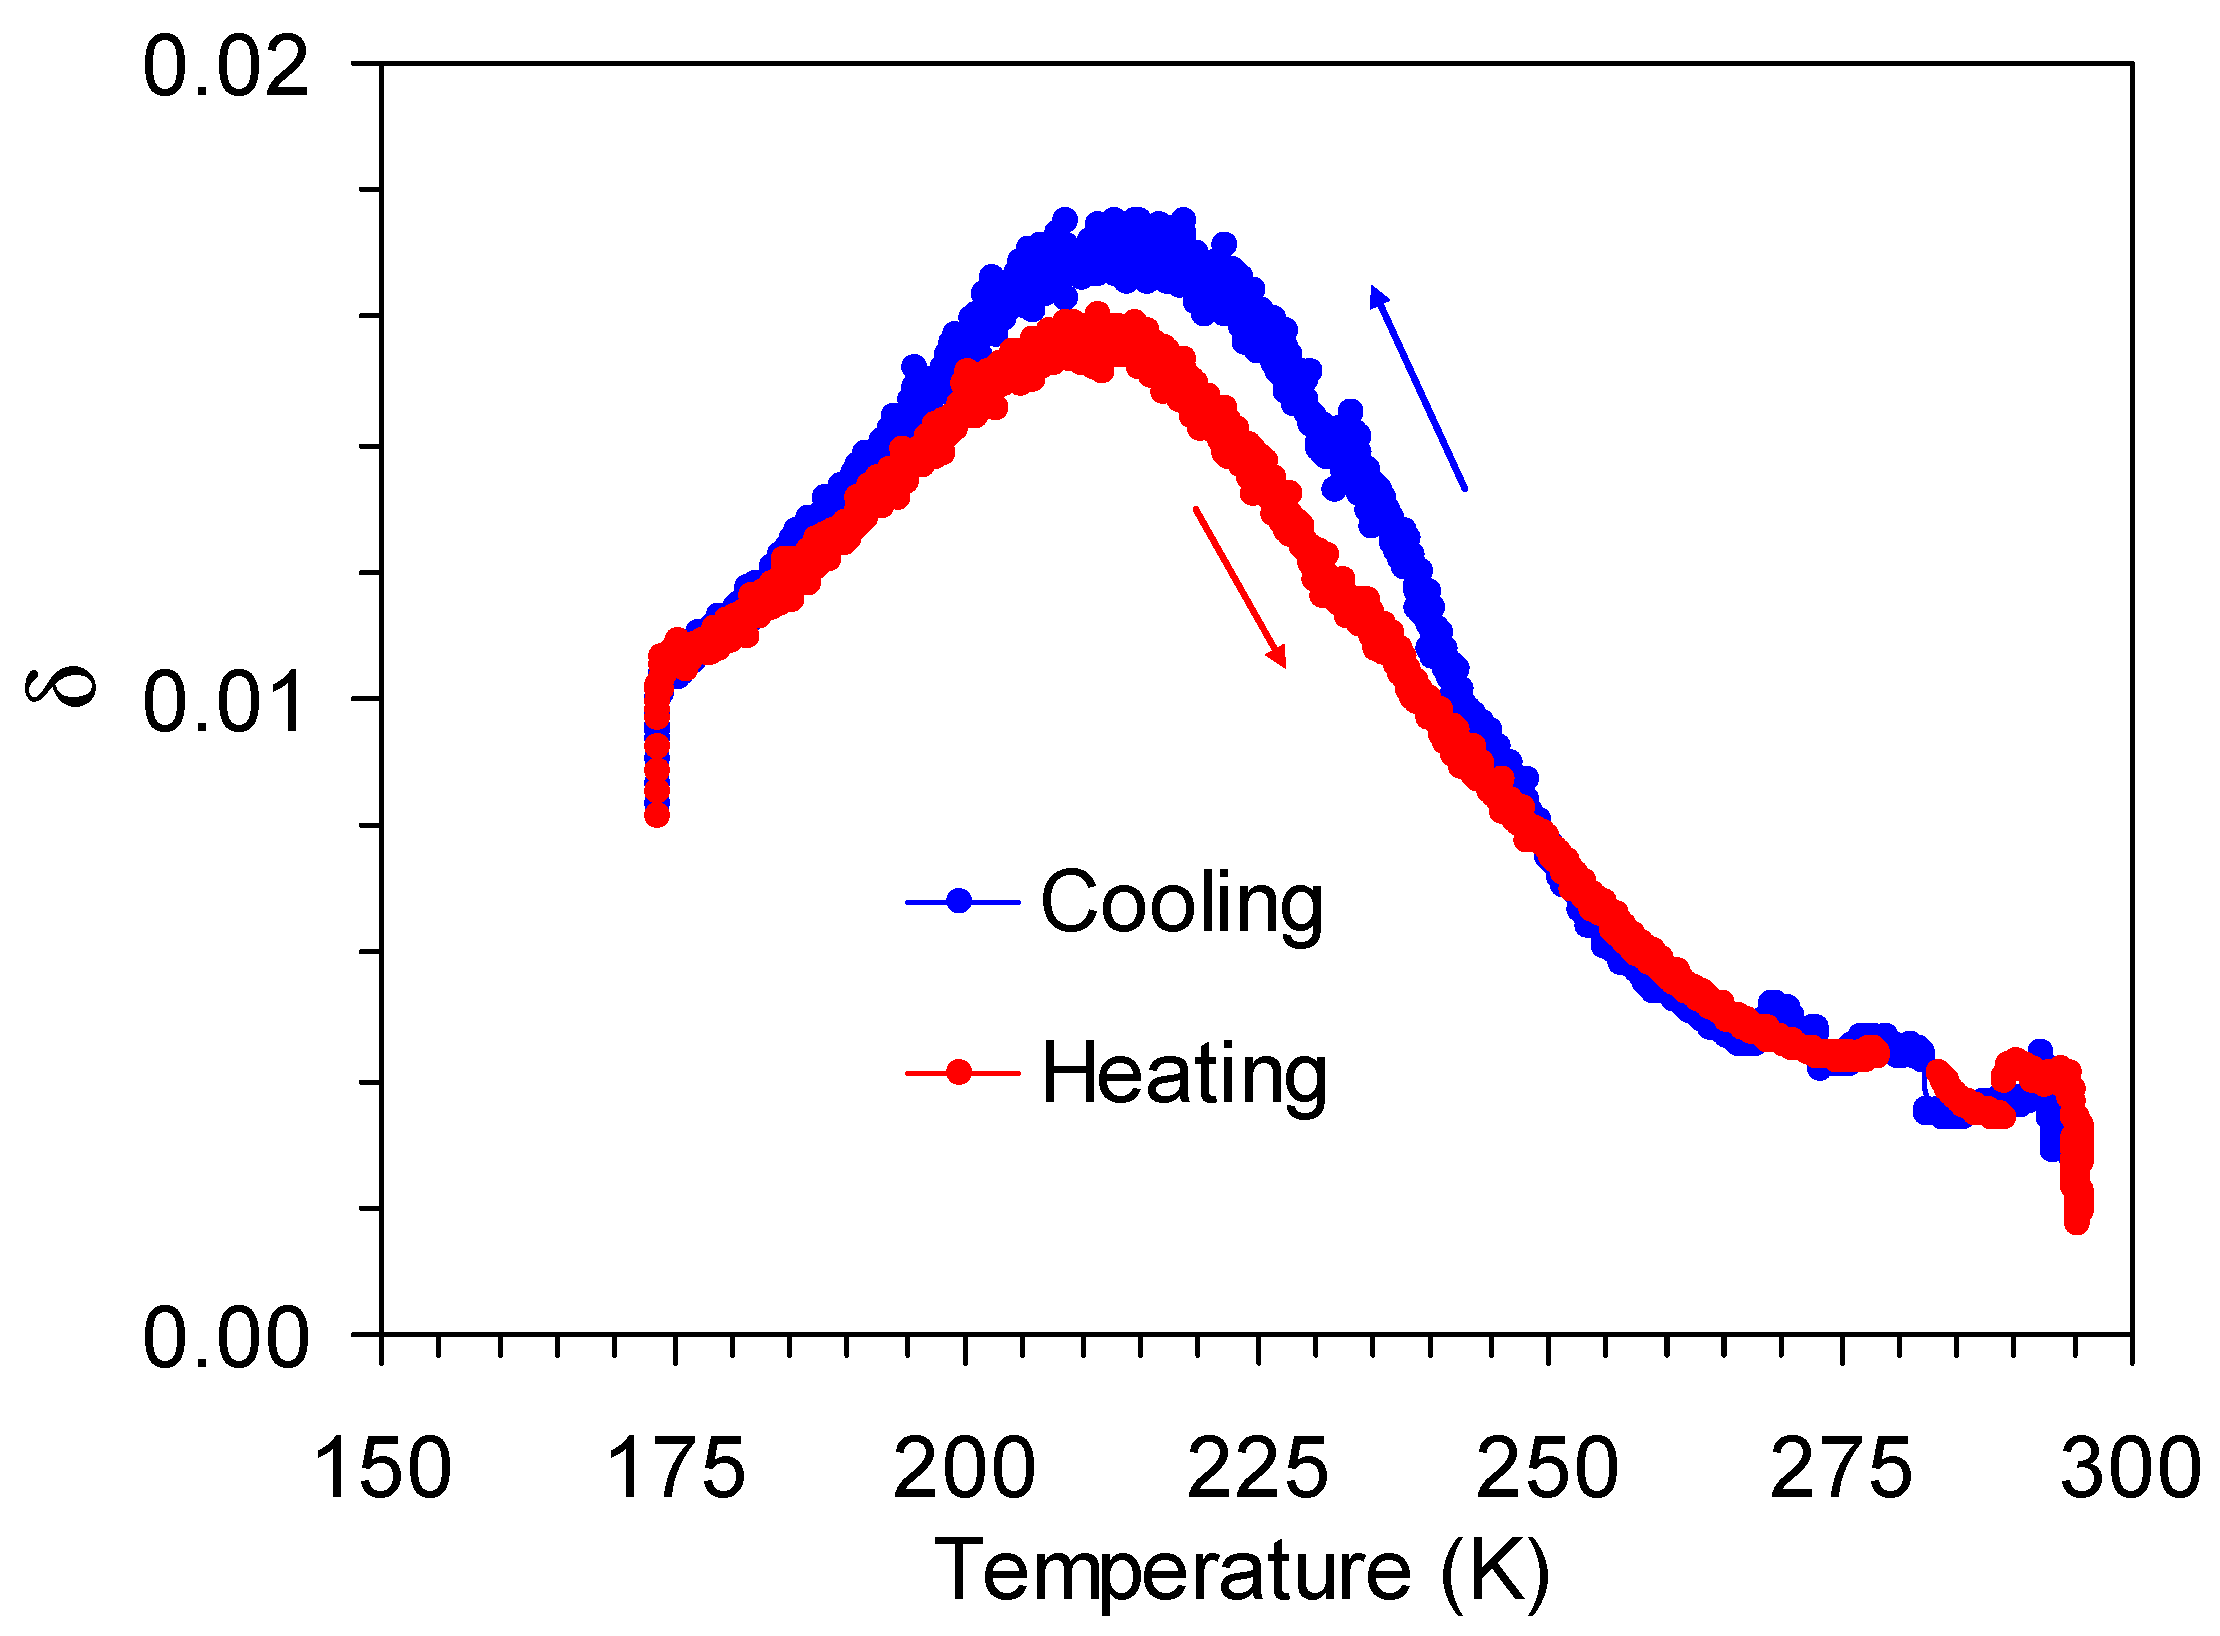
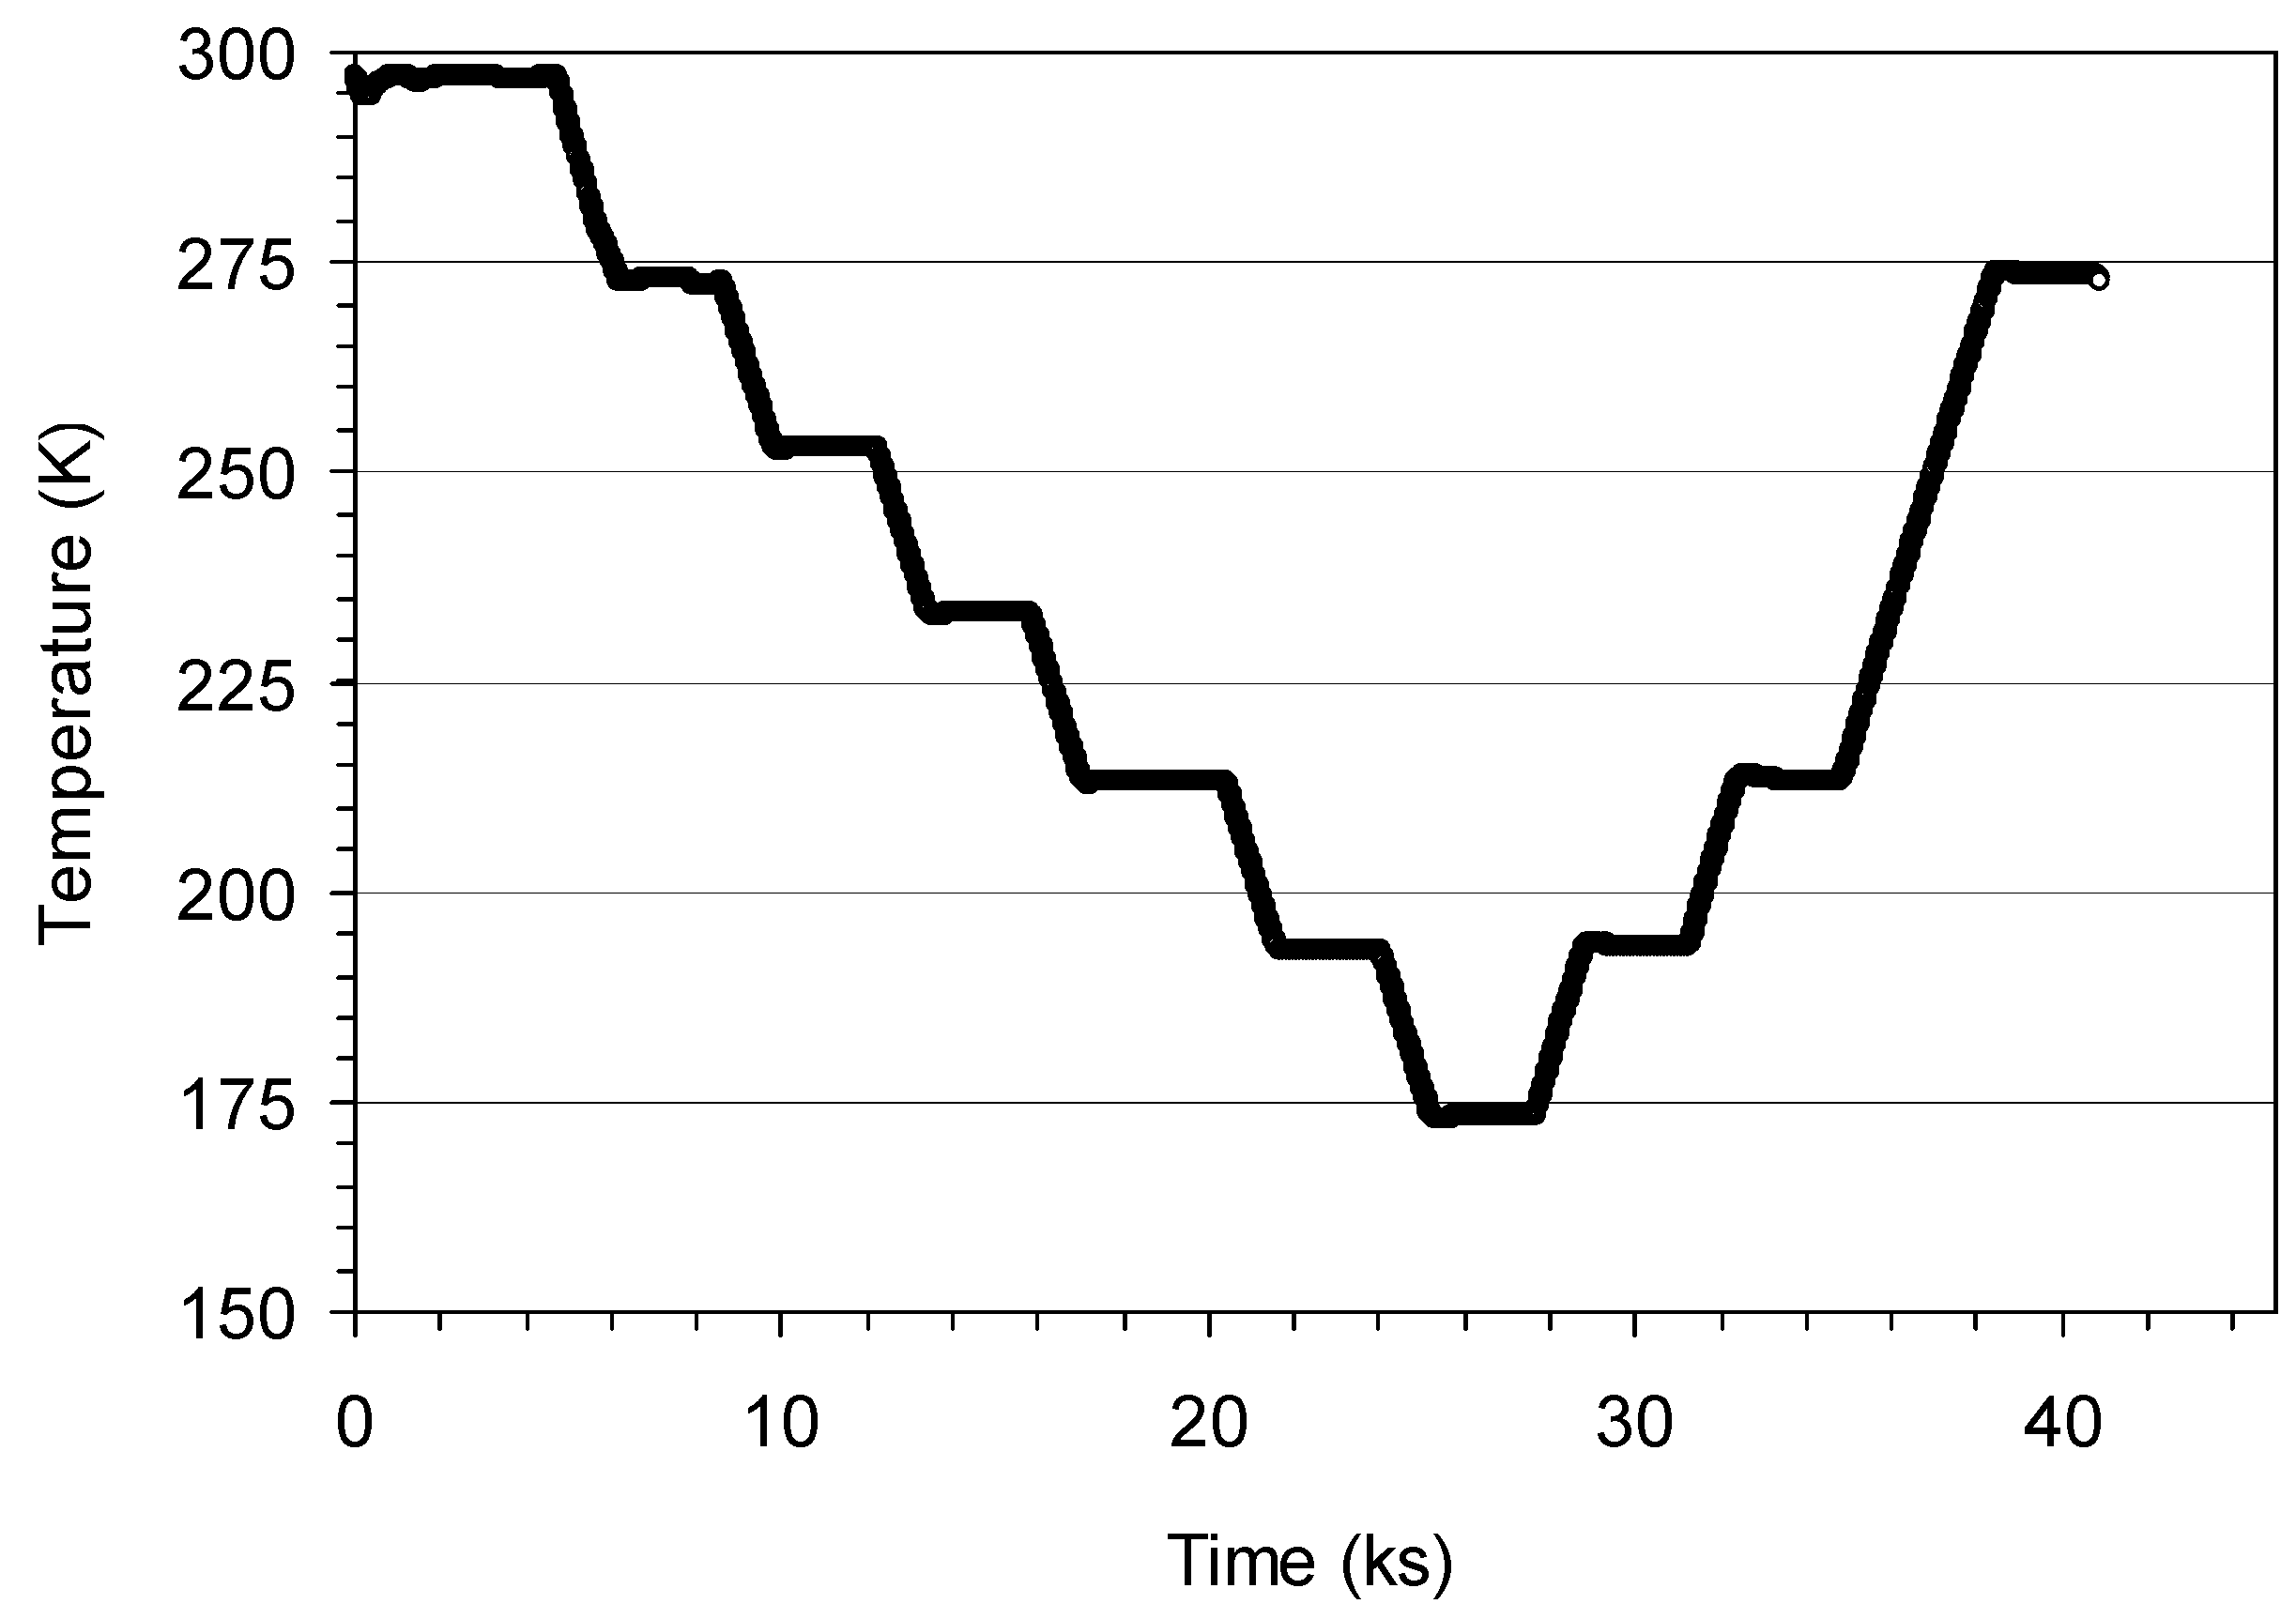
Figure 4 shows temperature spectra of the IF registered for a Structure 1 sample during cooling and heating between 175 and 290 K. The crucial feature of the spectra is a broad maximum around 215 K. The peak shows a small temperature shift and also a minor difference in peak height between cooling and heating scans. Another effect is a strong abrupt increase in the IF during initiation of cooling from 290 K and a sharp drop at the lowest temperature of the thermocycle during the change from cooling to heating. These sharp variations in the IF level are indicative of the transitory, T-dot effect. To confirm this conclusion, several thermal cycles were performed with programmed interruptions of cooling/heating scans at several temperatures and isothermal exposures of the sample during 40 min during each interruption. An example of time dependence of temperature in one of the scans with interrupted cooling/heating is shown in Figure 5.
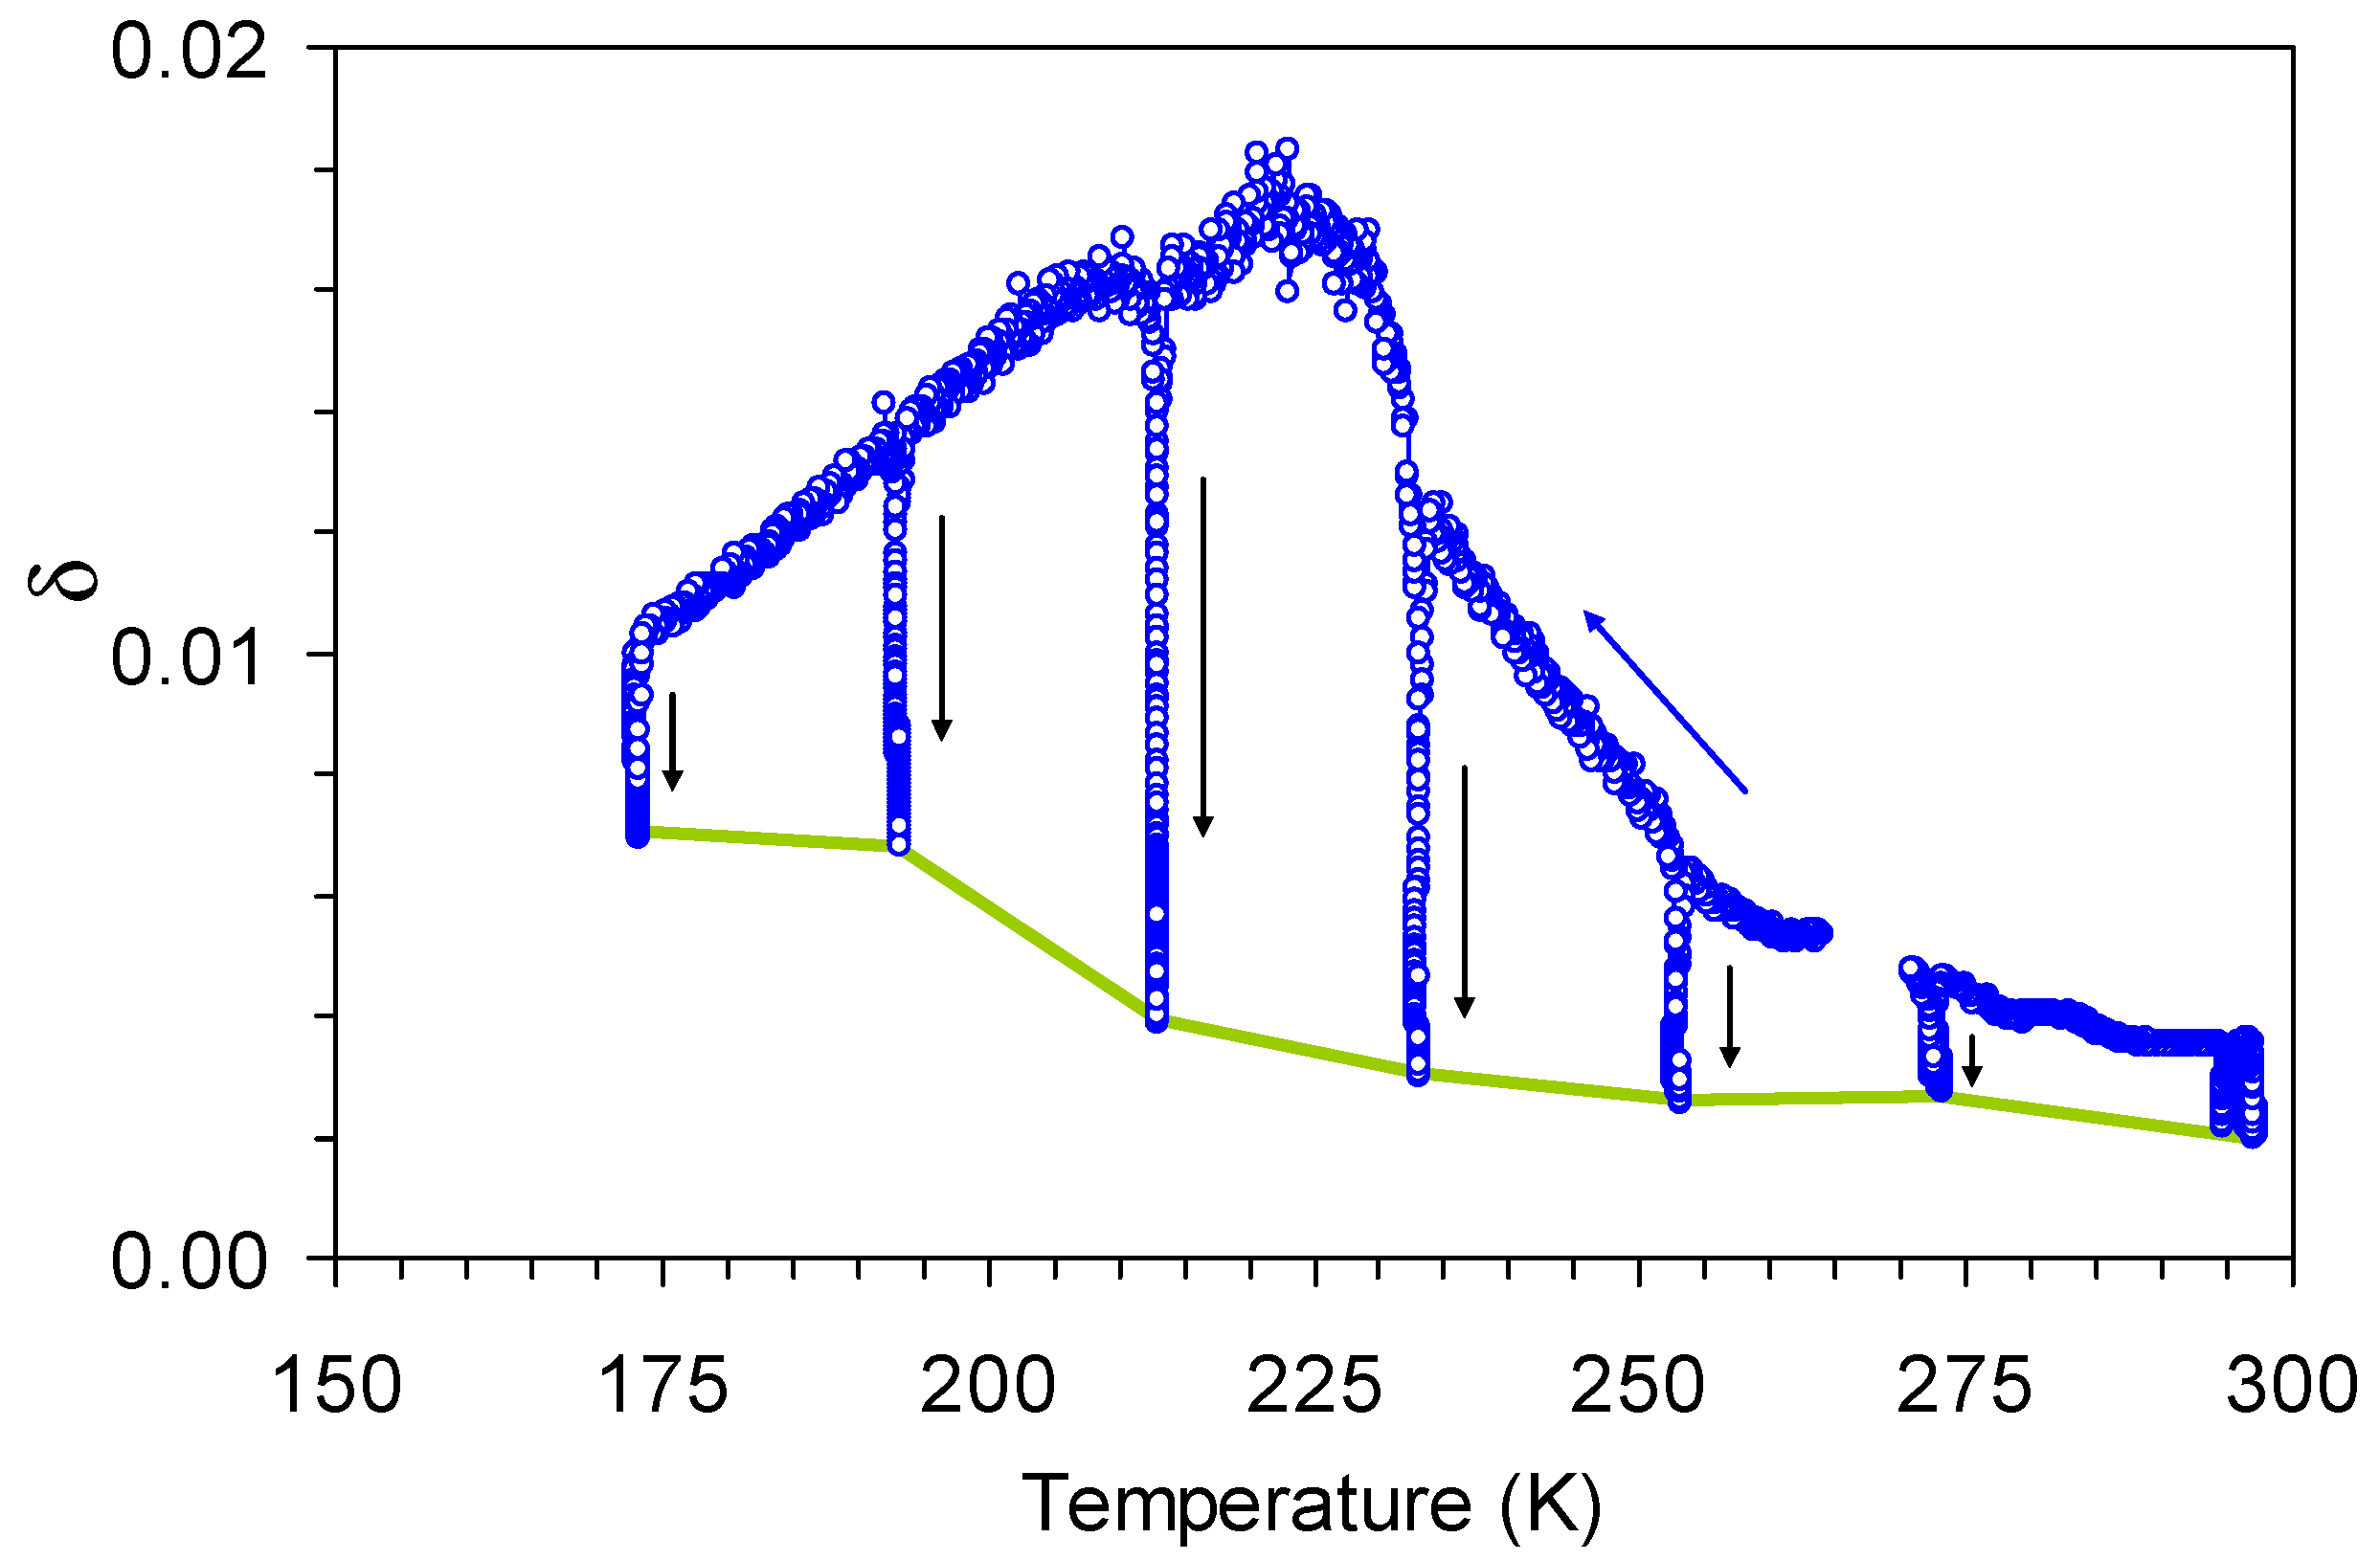
Figure 6 exemplifies the results of one of the cooling scans interrupted at several temperatures for 2400 s. Experiments show an intense drop in the IF during each interruption of cooling/heating. The drop is especially intense, nearly tenfold, in the vicinity of the IF maximum. The green line connecting the values of the IF at the end of each isothermal holding represents the isothermal temperature spectrum which does not show any peak. It is also worth mentioning that the temperature spectra become noisy and the IF shows instabilities close the temperature of the maximum.
Kinetics of the IF during interruptions of cooling/heating allows one to identify the origin of the strong IF decline upon interruption of cooling. Several possible scenarios can be foreseen:
- -
- the decline is time dependent;
- -
- the decline is T-dot dependent;
- -
- the decline is a combination of the two abovementioned processes, both time and T-dot dependent.
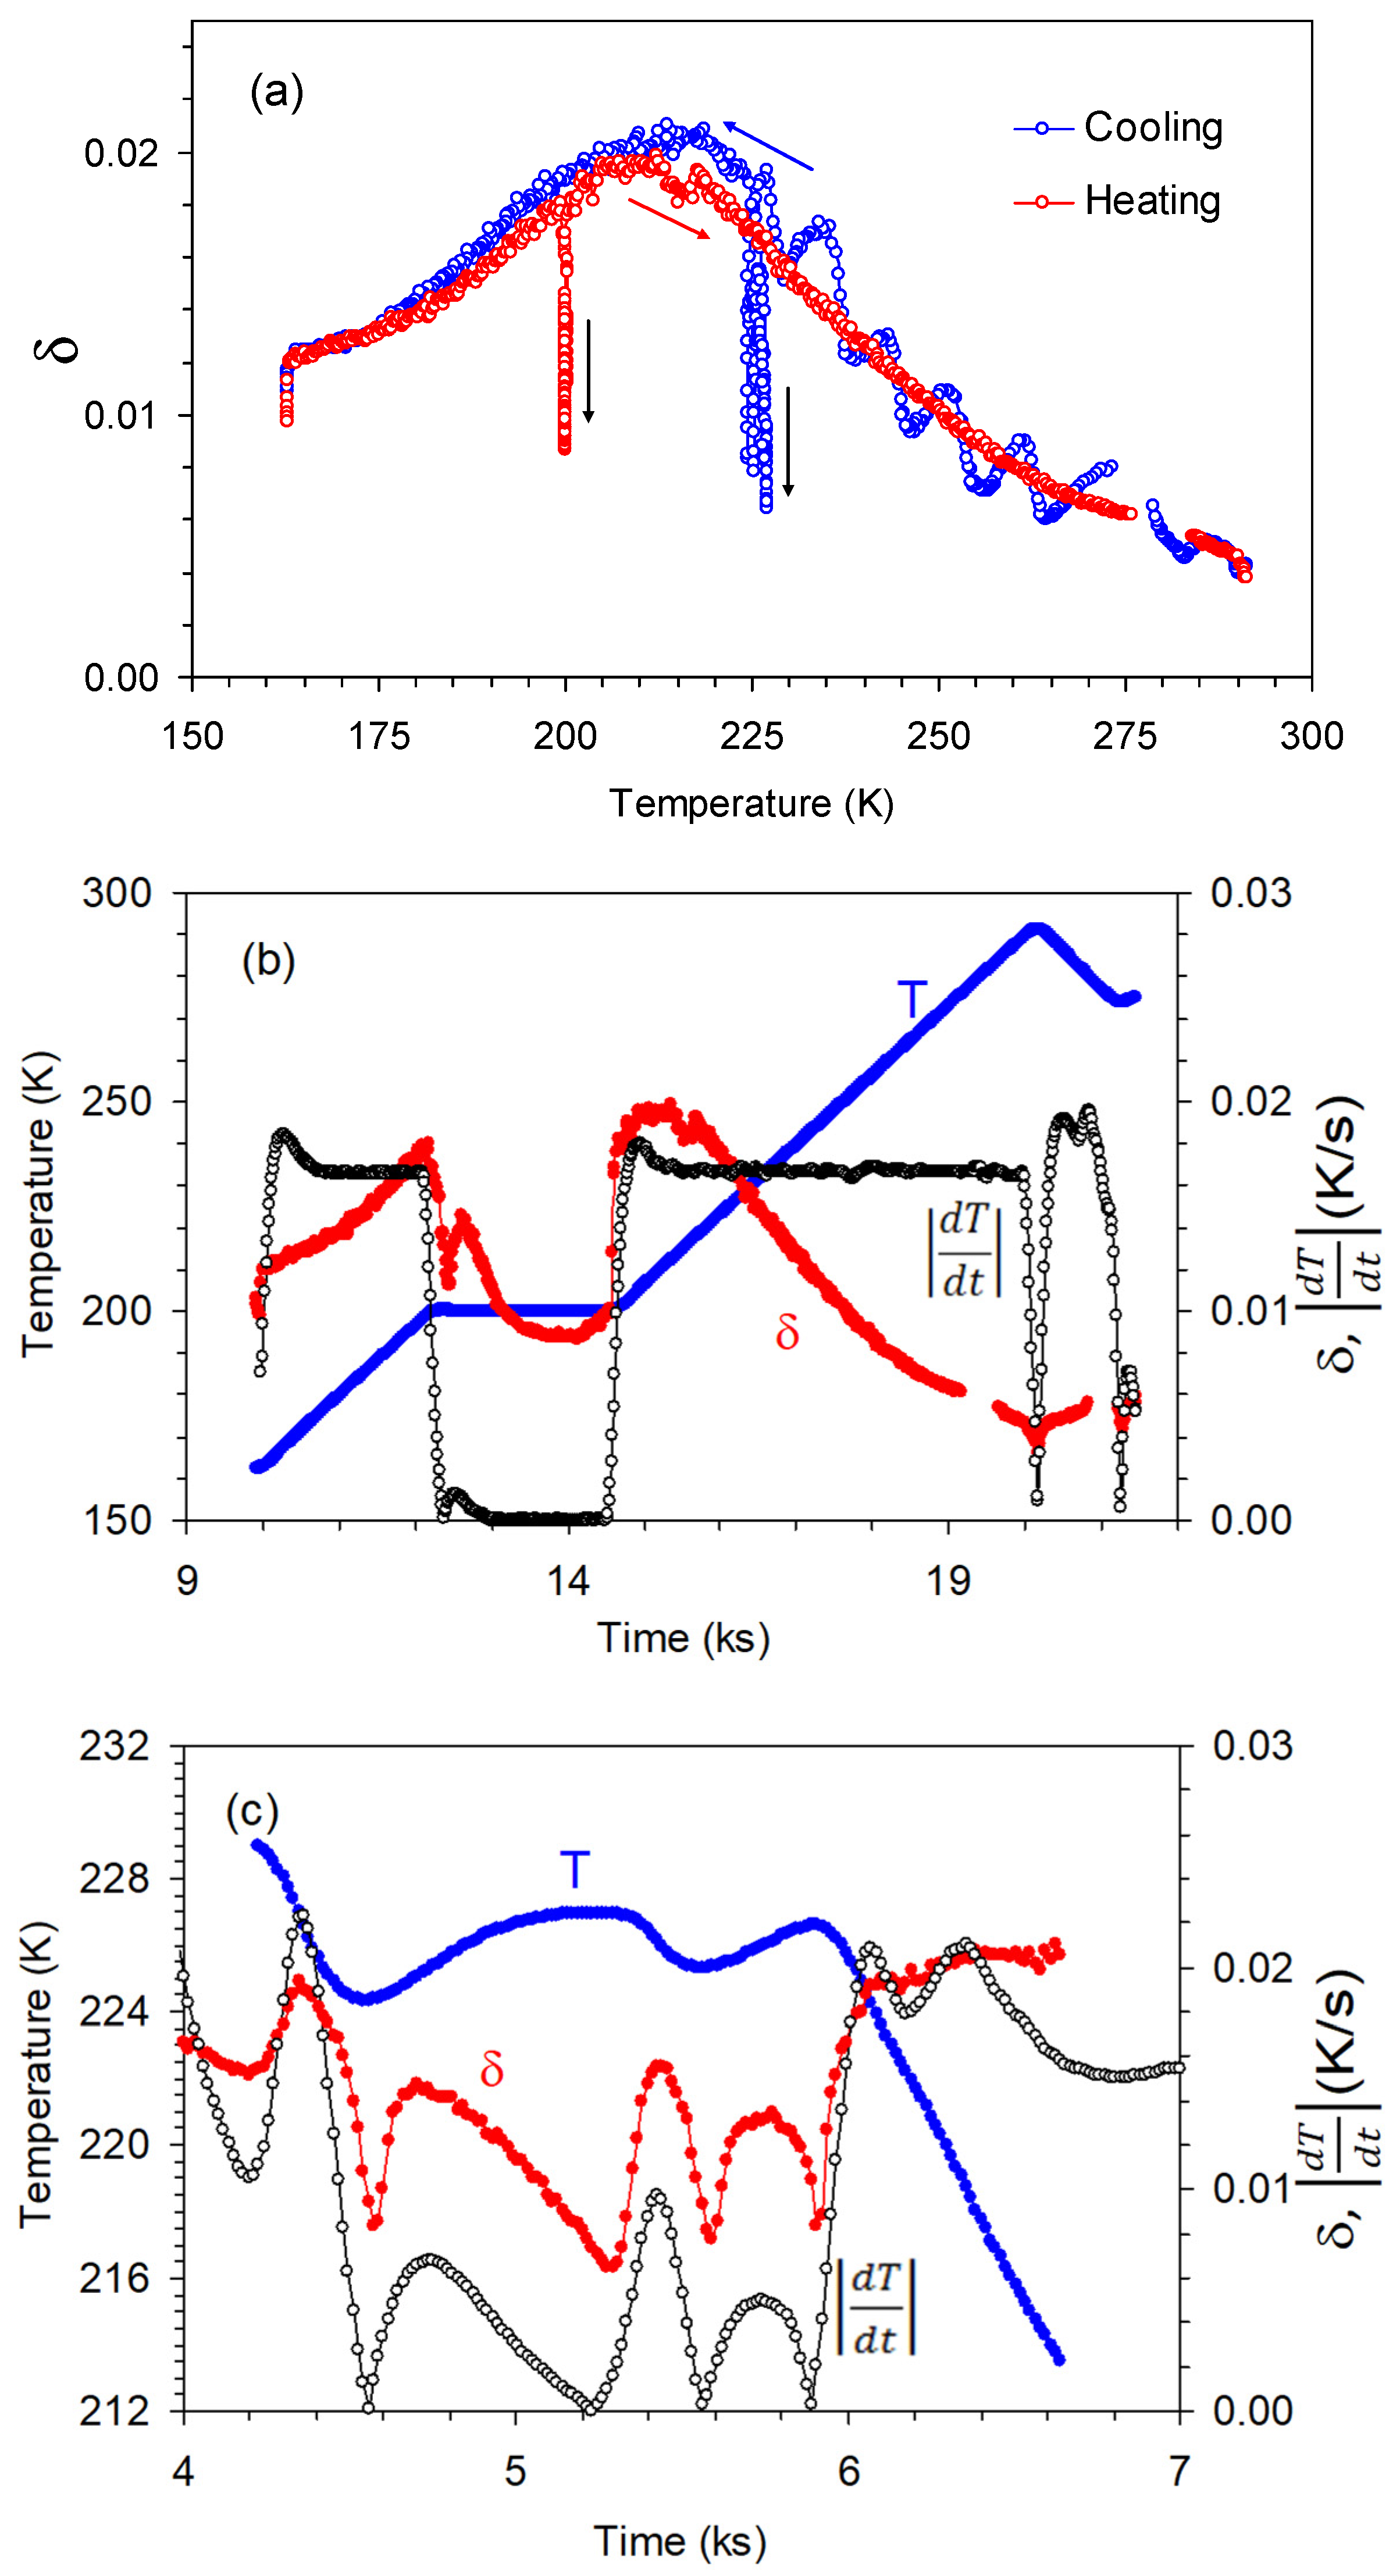
These scenarios can and will be distinguished based on the IF kinetics during interruptions of cooling/heating. However, even instabilities of temperature control provide a spectacular evidence of the intense T-dot dependence of the IF during thermal cycling of the sample with a/c TBs. Figure 7 shows the IF in a cooling/heating cycle between 290 and 163 K at 2 K/min. The temperature control was not established down to 220 K during initial filling of the cryostat with liquid nitrogen. The temperature scan interruptions were programmed for 226 K on cooling and for 200 K on heating. Figure 7a indicates the instabilities of the IF during the initial period of the scan followed by a conventional IF peak centred around 215 K. Figure 7b shows the temperature, the absolute value of its time derivative dT/dt and the IF during heating scan. A gradual IF decrease with time is clearly seen during isothermal holding at 200 K. This overall trend is combined with a fast IF decline at the moment of the scan interruption. The most indicative is the existence of a sharp minimum that coincides with the zero of dT/dt which is provoked by overshoot during temperature stabilization. This fact proves the existence of the transitory IF term, proportional to T-dot. Figure 7c shows similar time dependences registered during interruption of cooling at 226 K under poor temperature control. The overall temperature variation during this interruption was ca. 4 K, between 224 and 228 K. No correlation between temperature variation during interruption of cooling and the IF behaviour is seen. On the other hand, excellent correlation is found between the IF and the absolute value of T-dot, Figure 7c. Thus, the time dependence under isothermal conditions, clearly seen in Figure 7b, and T-dot dependence point to the coexistence of time- and T-dot dependent IF terms in the temperature spectra of the sample with three martensitic variants.
3.3. T-Dot Dependence
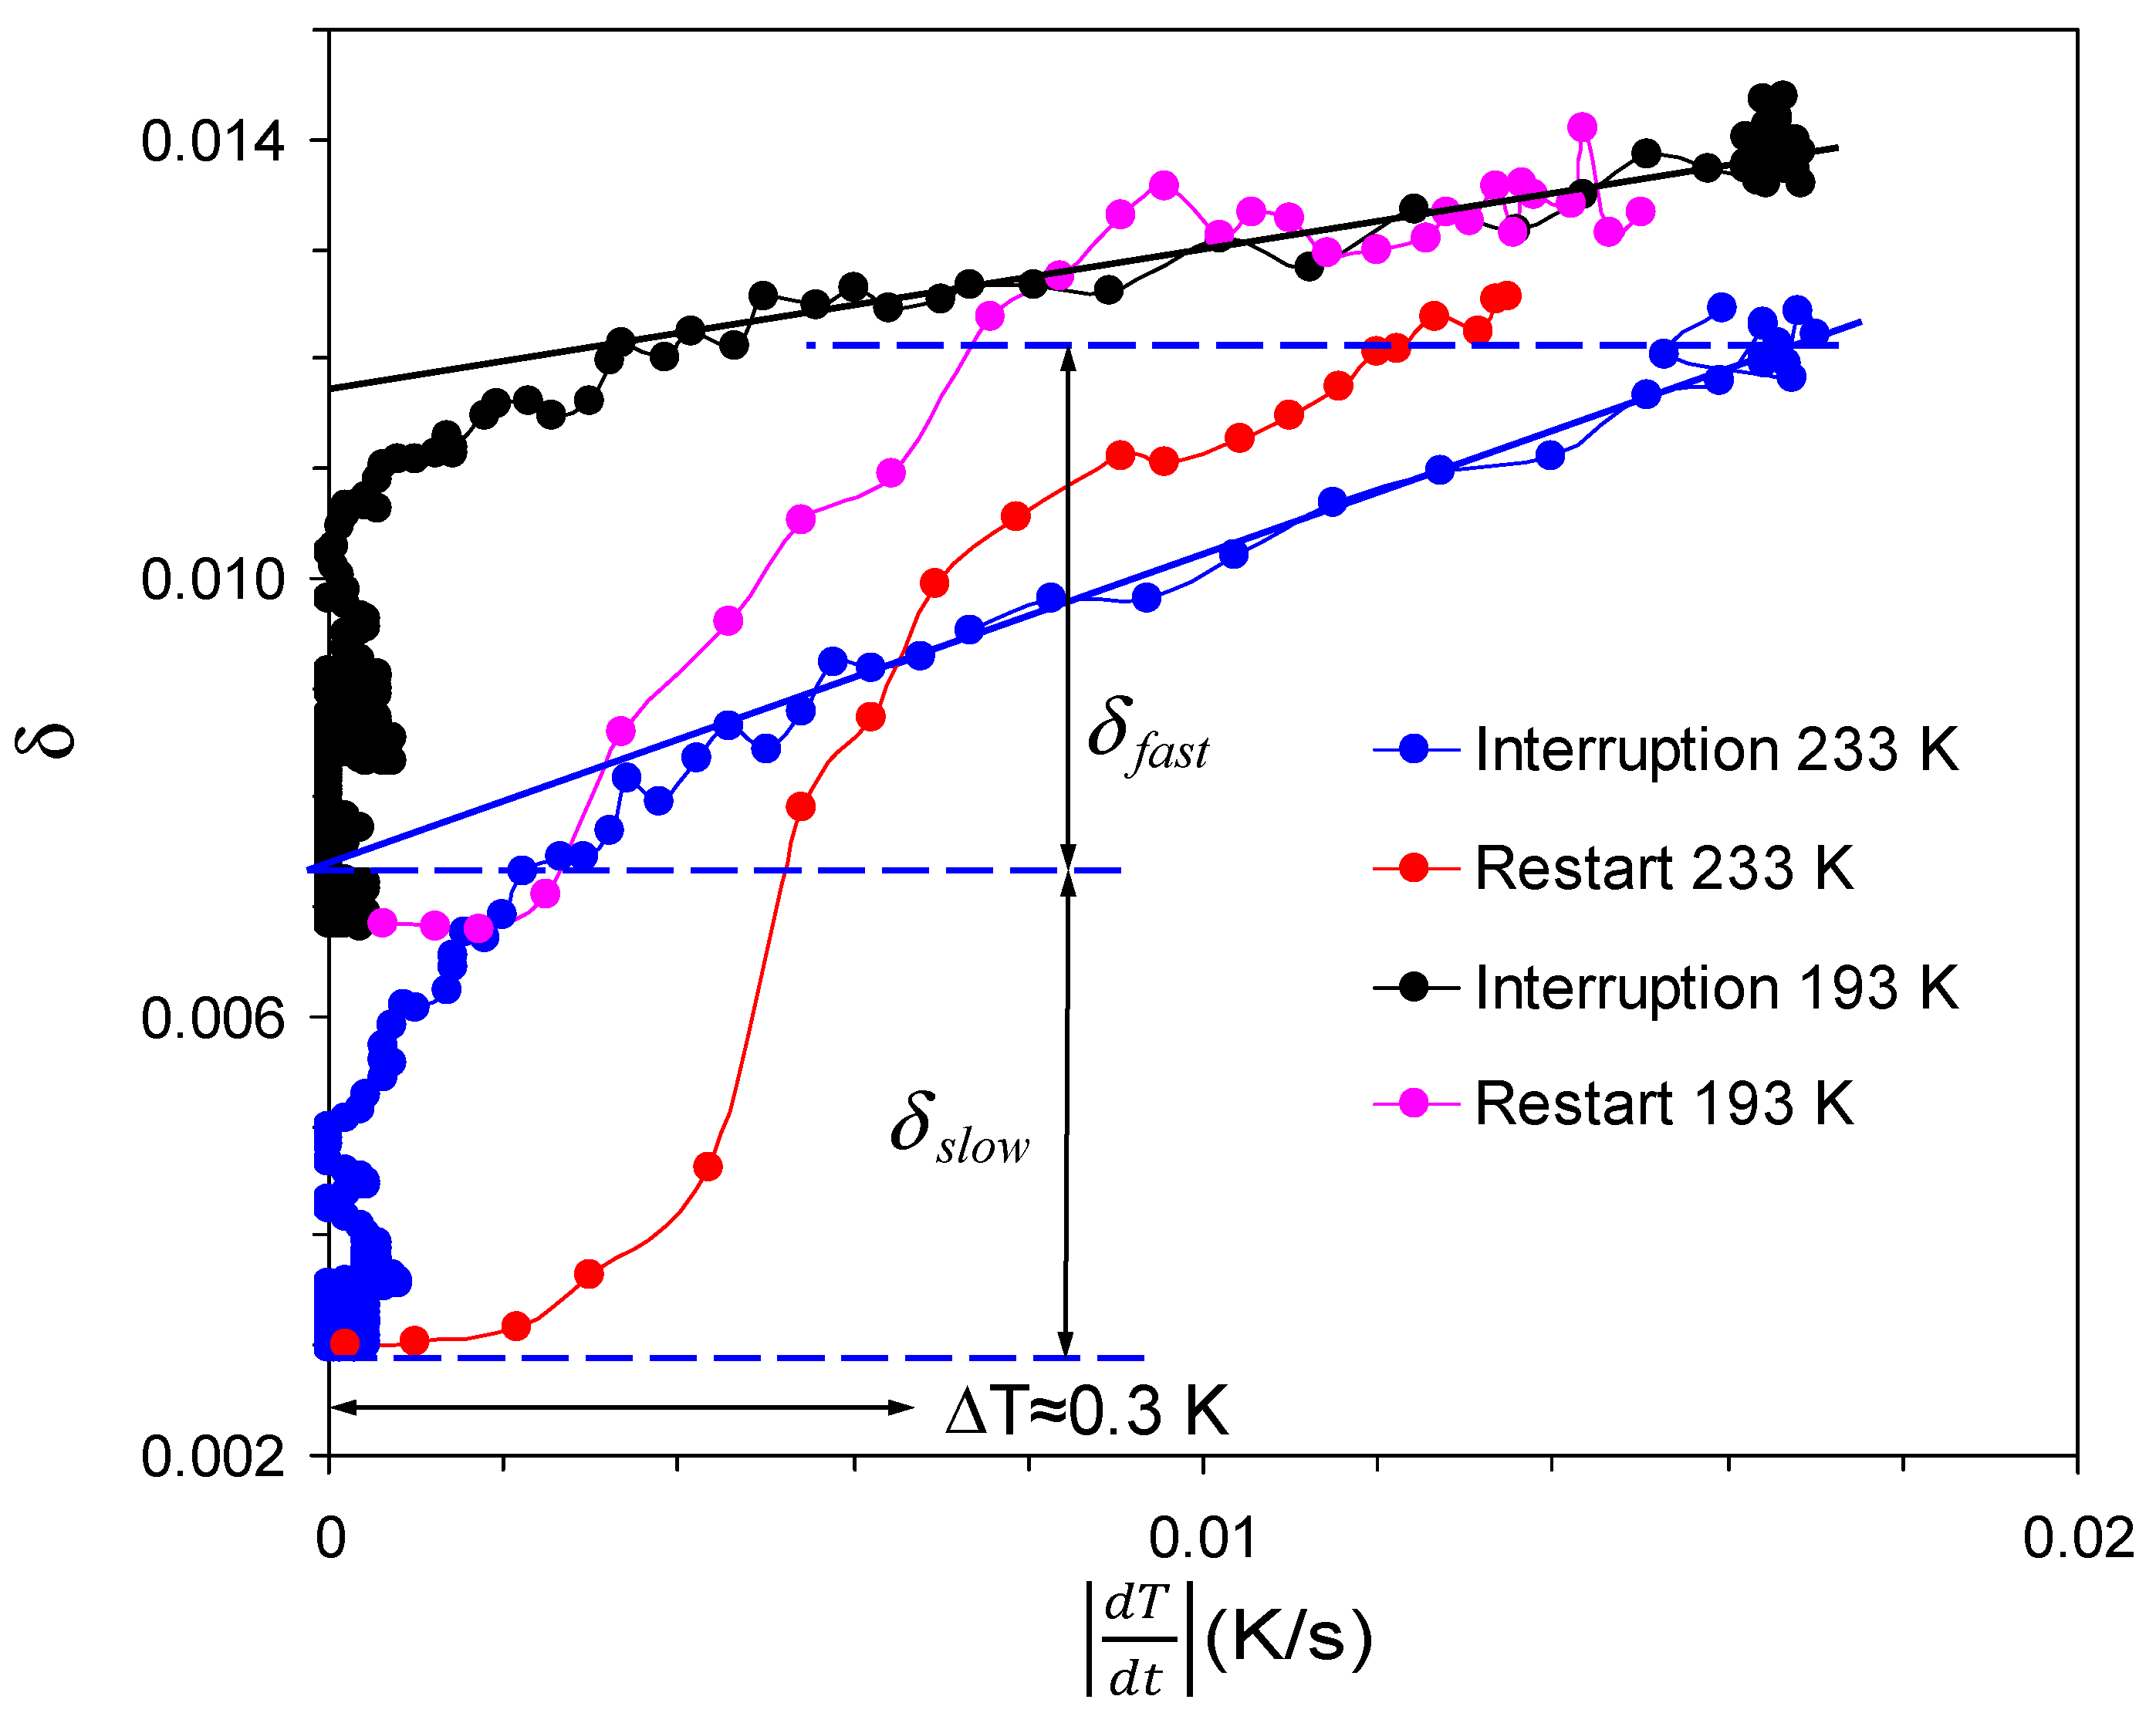
Dependences of the IF versus T-dot during interruptions of temperature scans provide more detailed information on the relative role of time- and T-dot-dependent terms in the IF spectrum [13]. Such dependences are depicted in Figure 8 for a Structure 1 sample with a/c TBs for interruptions of cooling at 233 and 193 K. The experimental results follow the same trend as has been reported in polycrystalline Dy [13] and interpreted as due to a superposition of several IF terms. It is convenient to separately analyse the dependences of the IF during the decrease in T-dot and isothermal holding and during re-initiation of cooling. During decrease in T-dot upon interruption of cooling the IF shows a linear decline, proportional to T-dot, reflecting the transitory IF term. The linear slope registered at 233 K is higher than at 193 K, in agreement with the temperature dependence of the transitory IF, Figure 6. The deviation from this linear trend appears at low T-dot values and transforms into the time-dependent isothermal drop of the IF under . After re-initiation of cooling, the IF first remains nearly constant and recovers the proportionality to T-dot after certain overcooling (by ca. 0.3 K). Thus, the IF kinetics during interruptions of cooling/heating proves the existence of a “fast”, T-dot dependent, and “slow”, time-dependent components. Figure 7b and Figure 8 reproduce in detail the pattern reported for polycrystalline Dy [13]. Therefore, we will follow the same phenomenological qualitative interpretation elaborated for antiferromagnetic domain walls in Dy. Assuming additivity (linear independence) of different IF terms, the overall registered IF can be written in the following form [13]:
where is the isothermal temperature spectra, similar to the one shown by green line in Figure 6, and are the “slow” time-dependent and “fast” T-dot dependent terms. Figure 8 shows the separation of the “fast” and “slow” IF components in the total IF. These results indicate, in agreement with the data in Figure 6, that the isothermal structural term represents only minor part of the overall IF.
4. Discussion
4.1. Comparison with Previous Results
To begin with, we compare our observations of the IF peak around 215 K with existing reports on Ni-Mn-Ga martensites we are aware of [38,39,40,41,42]. Previous experiments were mostly performed at low frequencies using Dynamic Mechanical Analysers (DMA). Unfortunately, the data available are scarce and certain parameters, such as oscillatory strain amplitude are not or poorly defined. Normally, the strain amplitudes employed in DMA tests are close to 10−4. This strain amplitude falls within the range of strongly non-linear IF in martensitic Ni-Mn-Ga [33,43]. Due to the unknown contribution of non-linear effects in the low-frequency DMA data, the direct comparison of the absolute values of the IF registered at low frequencies and in our experiments is not feasible. Still, one concludes that the overall IF levels, and especially the transitory terms, are comparable at low and ultrasonic frequencies. Even though the strain amplitude used in the present investigation was ca. 103 times lower than in the DMA, the frequency employed was 105 times higher. Equation (2) shows that under these conditions, the conventional transitory IF term should be totally negligible in our ultrasonic experiments.
Certain previous observations and conclusions can be confronted qualitatively with the present results. We mention first that the IF peak observed is not related to intermartensitic transitions, since it does not show expected wide temperature hysteresis and, therefore, is different from the maxima reported by Chernenko et al. [38]. Nevertheless, the maximum found in the martensite of Ni51.2Mn31.1Ga17.7 around 280–300 K [38] might have the same origin as the one found in the present study. Liu et al. [39] observed an IF peak close to 220 K in a Ni51.5Mn23.5Ga25 alloy with the same sequence of phase transitions as in our single crystal. They classified this peak as a “twin boundary motion peak”, which showed a strong decrease with a frequency between 0.1 and 1.0 Hz. The IF peak was hardly detectable at 1 Hz and, if existent, much less sensitive to the frequency between 1 and 5 Hz. Chang and Wu [40] reported an IF maximum around 215 K in a Ni52.0Mn23.5Ga21.5 alloy belonging to the same family as present single crystals. Similar to the present observations, the peak apparently disappeared in the isothermal spectrum, although this property has not been commented upon. The authors described this peak as relaxation associated with twin boundaries. However, this interpretation contradicts frequency independence of the peak position and its disappearance in the isothermal spectrum. The kinetics of the IF relaxation were studied by Chang and Wu only over the ranges of phase transitions. They did not register temperature variations in parallel with damping and attributed the time dependence exclusively to the transitory IF term, despite very long-term kinetics, especially in Ni53.8Mn26.8Ga19.4 from the Group III of Ni-Mn-Ga alloys. The results reported in [38,39,40] are, thus, compatible with our observations.
Data by Wang et al. [41] did not show an IF peak over this temperature range in a similar Ni52Mn24Ga24 alloy in the demagnetized state. However, the peak emerged under applied field of 0.4 T and showed very weak decline with frequency. It is worth mentioning that Wang et al. [42] reported an additional nearly frequency-independent broad peak in the 14M martensite centred around 230 K for a quaternary Ni52Mn16Fe8Ga24 alloy. The authors could not suggest any interpretation of the maximum uncovered. We note that a crucial property of the peak was its temperature shift with strain amplitude. The maximum also marked a notable change in the effect of strain amplitude on damping temperature spectra. This property agrees with the important role of pinning process in the twin boundary mobility revealed in the present experiments. The change of the type of the strain amplitude dependence upon crossing the peak temperature in low-frequency experiments of Ref. [42] is easily explained by a change from dragging (high temperatures) to depinning (low temperatures) of twin boundaries during immobilization of obstacles in a cooling scan [35,37]. To summarize this brief review, we can conclude that our results agree with a number of previous reports [38,39,40]. Still, observations and interpretations of the IF and elastic properties of Ni-Mn-Ga modulated structures remain controversial. The use of samples with unknown/uncontrolled twin configuration is a serious drawback of previous works. The novelty of the present investigation consists in detailed study of both time and T-dot dependences of the IF and, most importantly, of well controlled “engineered” structures of both a/c and a/b twins.
4.2. Role of a/c and a/b Twins in the Internal Friction and Young’s Modulus Temperature Spectra
The data for samples with three different types of a/b and a/c twin structure clarify the contribution of these two types of twins to the IF and YM temperature spectra of 10 M Ni-Mn-Ga. The sample with twin structure shown in Figure 1b does not have a/c TBs and the shear stress acting in a/b twinning planes essentially does not exist (c-axis is aligned along the sample). The sample of Figure 1c does not have a/c TBs either, but the shear stress in the a/b twinning planes is maximum (c-axis is perpendicular to the long side of the sample). Therefore, a comparison of the results for the structures in Figure 1a,b is expected to yield the contribution of the a/c TB and of a/b twins in the narrow central part of the “domain engineered” sample. The sample with maximum a/b shear stress should clarify the potential contribution of a/b TBs of the thin central variant of the sample in Figure 1a.
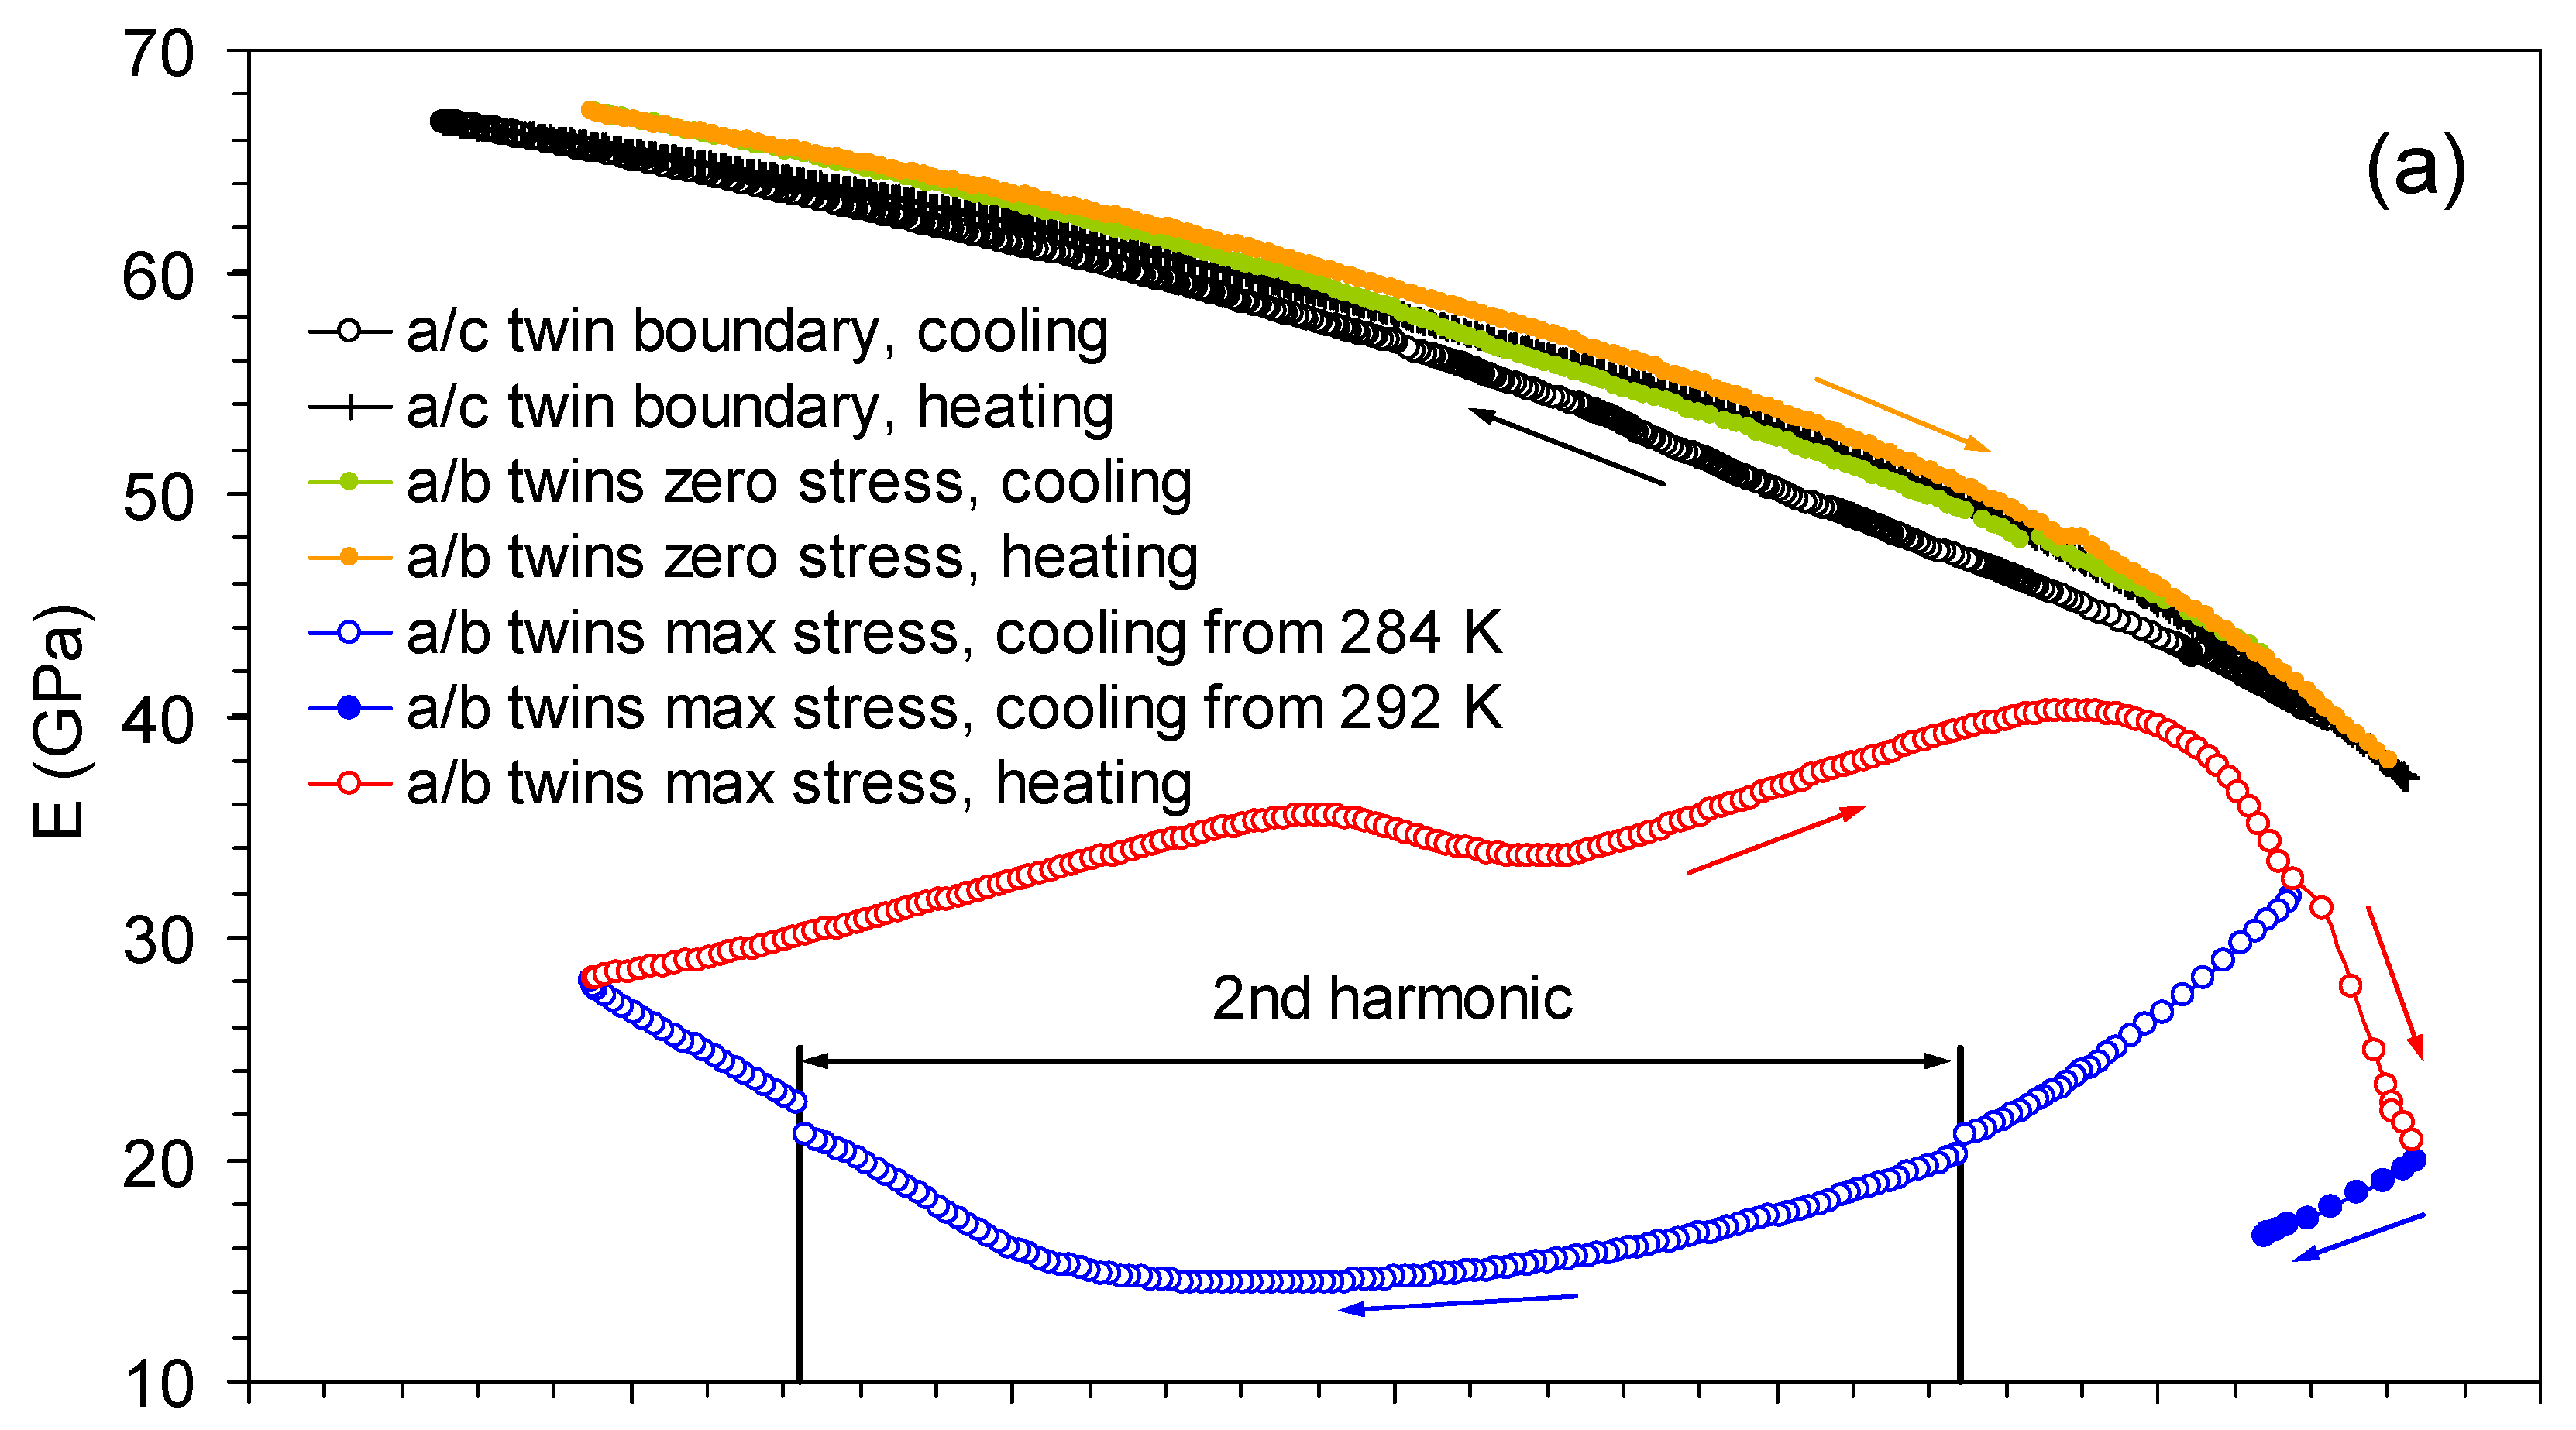
The temperature spectra of the YM and IF for the samples with three types of twin structure are shown in Figure 9. The Structure 2 sample (Figure 1b) shows the highest value of the YM with hardly detectable thermal hysteresis, Figure 9a, and extremely low IF values, comparable with background damping of the quartz transducers, Figure 9b. No transitory IF peak is found in absence of a/c TBs.
The effect of temperature on the IF and YM of the Structure 3 sample is totally different and perfectly agrees with the results of Ref. [33]. The YM behaviour is highly anomalous, Figure 9a: (i) it shows an unusually high hysteresis between cooling and heating scans; (ii) the YM temperature spectra show several intermittent stages of normal and anomalous temperature dependence; (iii) the Young’s modulus behaviour is strongly history-dependent, especially for temperatures exceeding 260–270 K, where the modulus drops rapidly with temperature. Interestingly enough, the modulus declines strongly on heating above 275 K, but this decline is not reversed and continues on subsequent cooling, Figure 9a. The YM can take, over a wide temperature range, the values between ca. 35 and 10 GPa, depending on the previous history of the sample. As an indicative number, the change of the highest temperature of the cycle from 284 and 292 K results in a twofold difference of the YM values on further cooling, Figure 9a. It is remarkable that, despite high variability of the YM values, the complicated pattern of the IF and YM temperature spectra is perfectly reproducible provided the highest and the lowest temperatures of the cycles are the same.
These anomalies and difficulty in defining the YM have previously been attributed to the extremely high a/b TB-related contribution of the anelastic strain to the apparent YM of the a/b laminate [33]. All abovementioned features of the YM behaviour point to a highly non-equilibrium state of the a/b twin structure over a broad temperature range. Probably, the a/b twin-related dramatic variations of the YM reflect recently reported reversible transitions to the nanotwin structure upon cooling of 10 M martensite [22].
Figure 9a shows that the YM temperature spectrum for the sample with the central a/c twin (Structure 1) has certain (minor) features of the behaviour of the Structure 3 sample with dominating role of a/b twins. Namely, the modulus for the Structure 1 sample is slightly lower than for the Structure 2 sample without the central narrow variant. Second, a slight thermal hysteresis can be discerned in the YM spectrum for the Structure 1 sample. These minor details should be attributed to the contribution of a/b twins in the narrow central variant with c-axis across the sample axis.
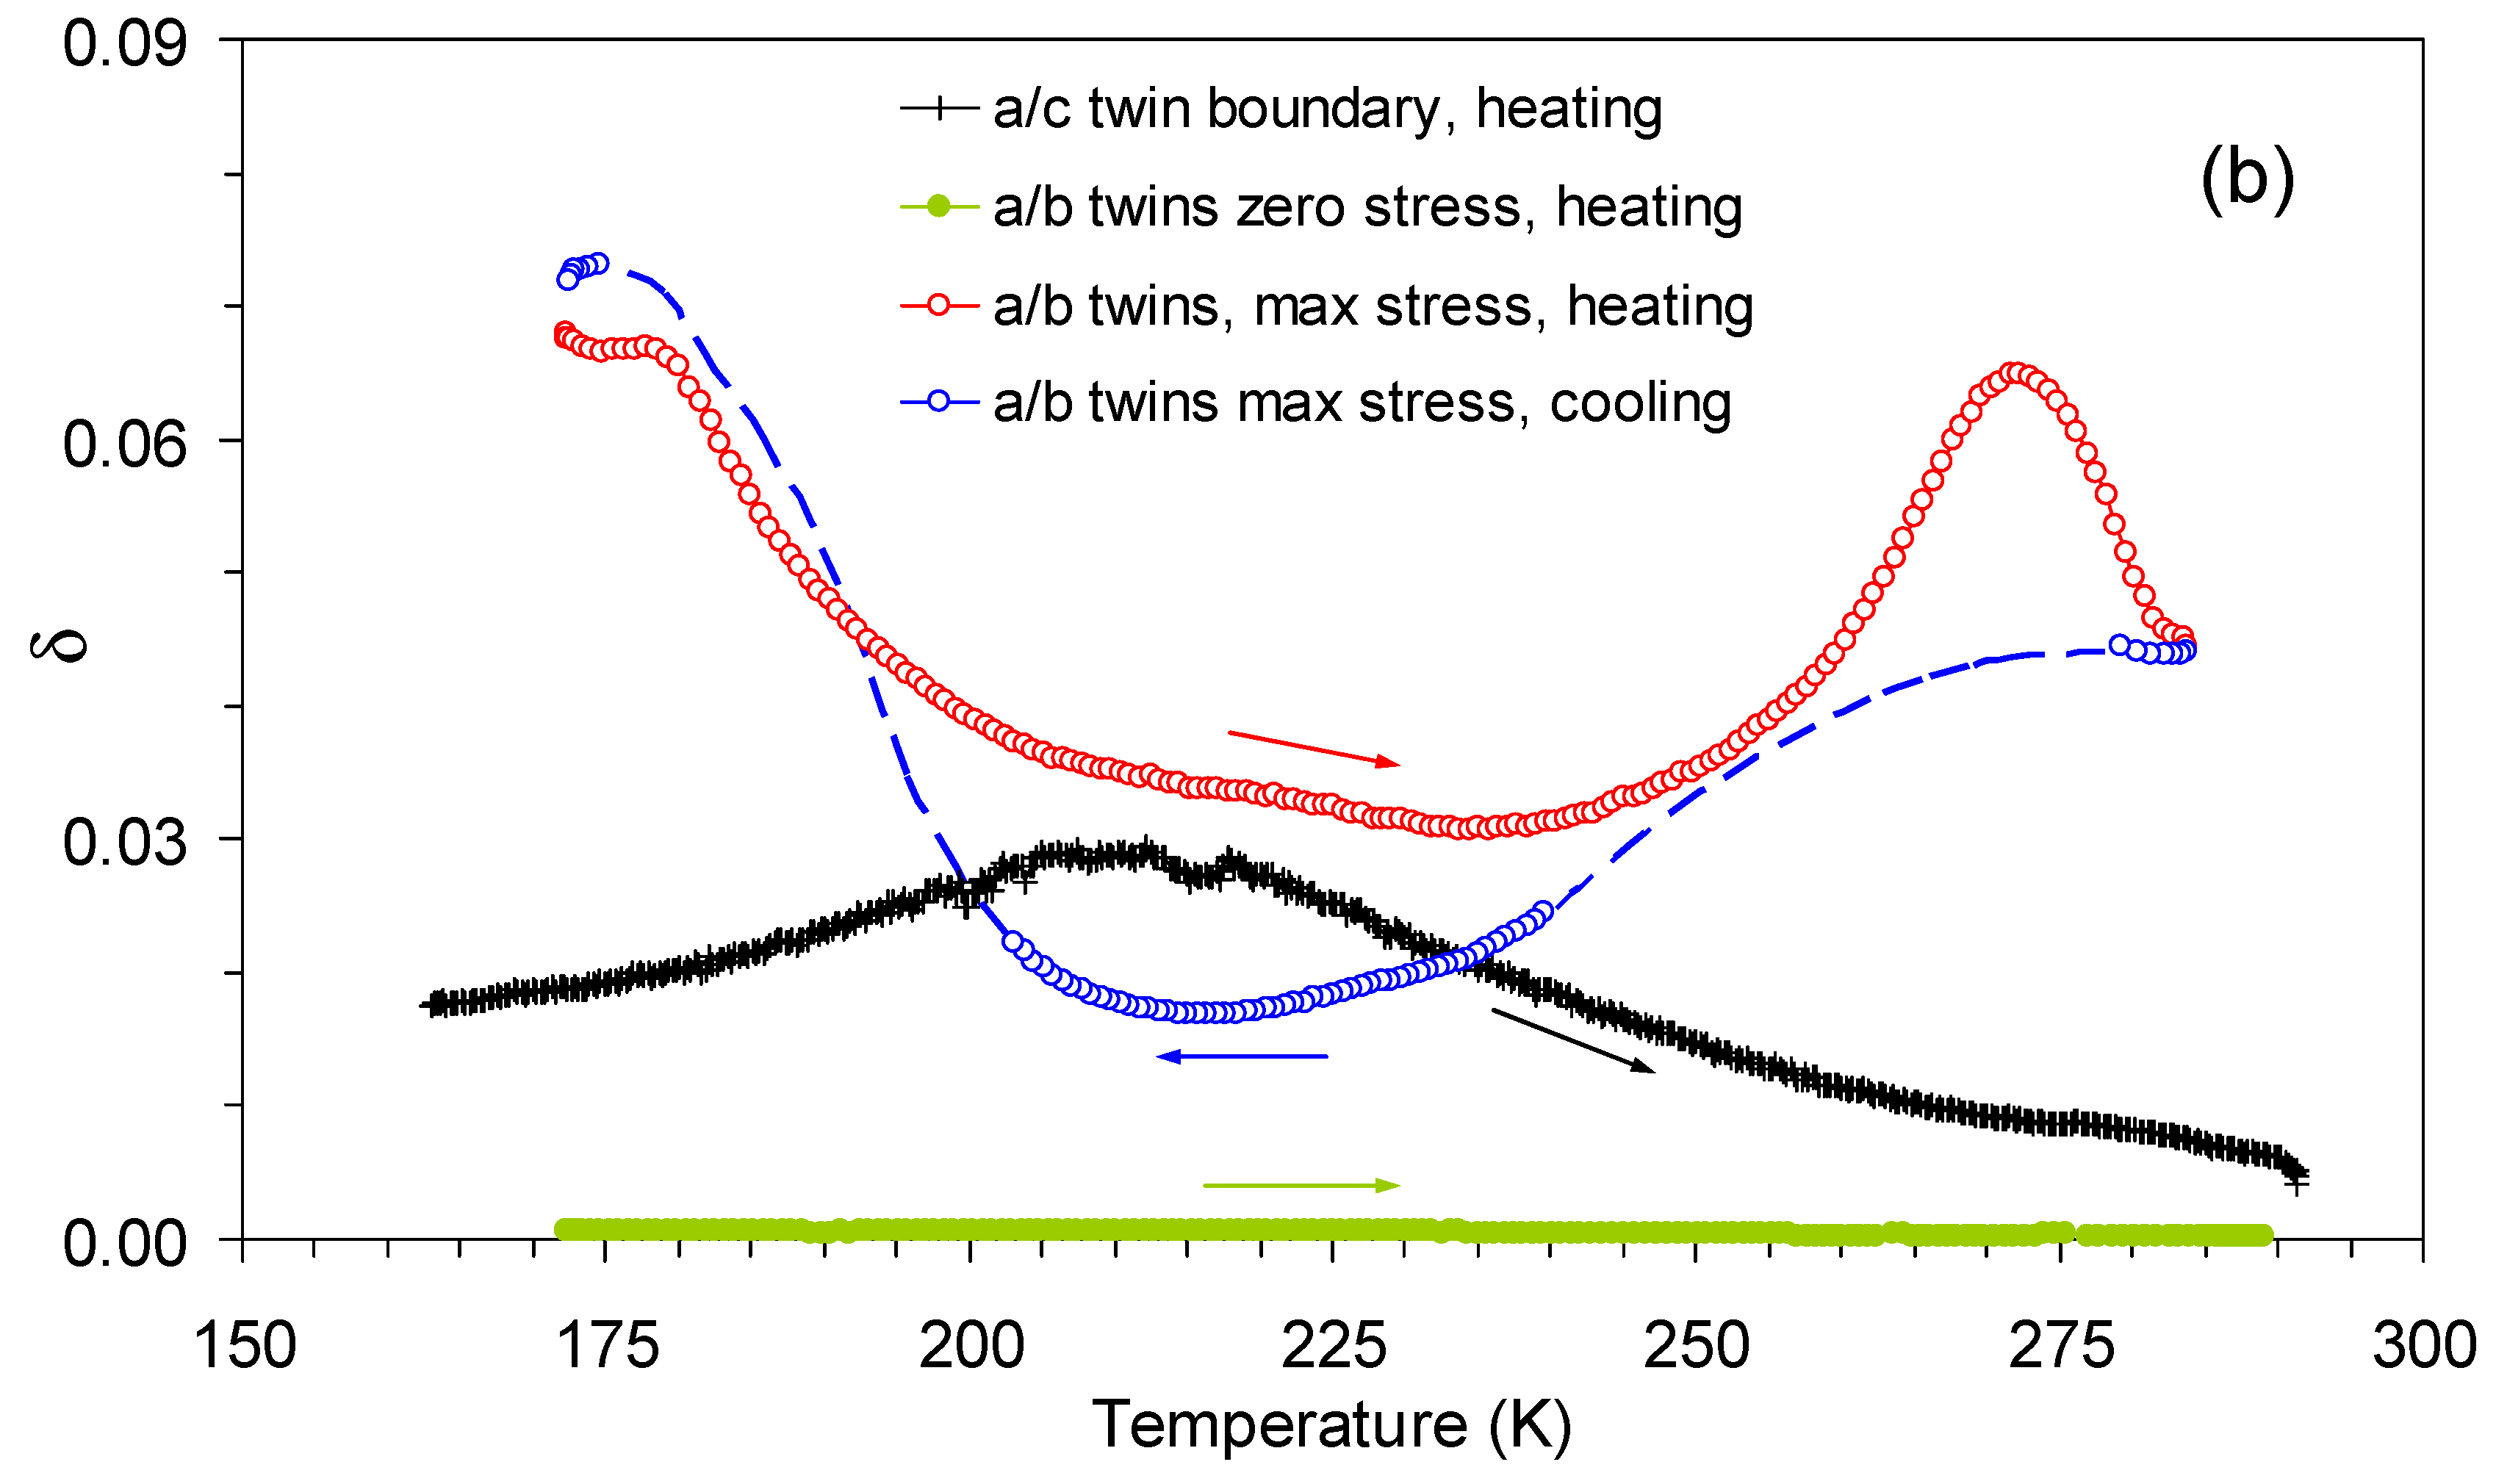
The data on damping for the Structure 3 sample, Figure 9b, deserve a brief comment. The data on heating scans are perfectly reliable. However, during cooling, due to the strong variations of the YM, the oscillation mode of the sample switches from the fundamental to the second harmonic. The second harmonic is maintained over a broad temperature range marked in Figure 9a. Switching between the fundamental and second harmonic has only a minor effect on the derived YM value, seen as small steps during the change of the oscillation mode, Figure 9a. In contrast to this minor effect in YM, the change of the harmonics very strongly affects the IF spectra on cooling. More specifically, it provokes intense IF peaks due to the strong displacement of the stress node from the junction between the sample and quartz transducers. Therefore, the IF of the material cannot be registered reliably over the ranges of the harmonics change. Orientative behaviour of the IF over these ranges is indicated in Figure 9b by a discontinuous line. Nevertheless, the temperature of the transitory IF peak, 215 K, is well away from the harmonics switching points and Figure 9b shows that the in the Structure 3 sample transient IF peak at around 215 K does not exist on cooling and heating.
It is important to emphasize that in the Structure 3 sample with a/b twins under maximum stress, in addition to the absence of the transitory damping peak, T-dot transient effects are not detected either over the entire temperature range studied, despite the intense modification of the a/b twin structure during thermal cycling evidenced by very intense apparent modulus variations. Thus, the transitory IF is inherent only in the sample containing a/c TBs. This is a strong argument in favour of the magnetic nature of the IF transitory peak and T-dot effect: motion of a/b TBs produces additional strain affecting YM, but does not produce magnetic flux variations since the orientation of the easy axis remains unchanged. On the contrary, any displacement of the a/c TB results in the local magnetic flux variation and, hence, eddy current-related IF of magnetic origin.
In summary, the study of samples with different twin structures indicates:
- -
- thermal hysteresis of the IF and YM in 10 M martensite is exclusively related to the a/b twins and reflects their non-equilibrium state; the hysteresis is practically absent in the sample with a/c TBs and when shear stress in a/b twinning planes does not exist;
- -
- a/c TB is responsible for the transitory IF peak; the peak is absent in samples without a/c TBs for both orientations of a/b twins.
4.3. Origin of T-Dot and Time Dependence of the Internal Friction
A simultaneous occurrence of both time and T-dot dependence of the IF during interruption of temperature scan has been found and analysed in the case of antiferromagnetic Dy [13]. In the present results, the former should be associated with pinning of TBs by mobile obstacles detected in strain amplitude scans, Figure 3, the latter—with the motion of the a/c TBs under thermal stresses during temperature variations.
As for the T-dot dependence, we mention first that a temperature-induced displacement of even relatively low-mobility Type I TB can be detected in the results presented by Straka et al. [22]. In the optical images of Figure 5 [22], the position of the Type I TB changes with temperature. This displacement is seen for temperatures 298 and 223 K, Figure 5a,d and becomes obvious if the position of the twin boundary at 223 K is compared with the trace of this boundary as seen in the austenite at 333 K, cf. Figure 5d,f. The TB displacement can be evaluated in Figure 5 of Ref. [22] as around only 0.1 µm. However, the TB motion must be much more intense in our “domain engineered” sample for the following two reasons:
- -
- the overall twin structure of the sample has not been identified in Ref. [22], which was supposedly polyvariant; so TB interaction is expected to substantially inhibit their mutual displacement; in other words, a single TB must be much more mobile than TBs of the polyvariant structure;
- -
- twin boundary shown in Figure 5 of Ref. [22] is of Type I type, much less mobile than Type II TB studied in the present work.
Observations of the T-dot effect in the Structure 1 sample with a/c TB and its absence in the Structure 3 sample, despite intense rearrangement of the a/b twin structure evidenced by the YM spectra, confirms our conclusion on the magnetic origin of the uncovered ultrasonic T-dot effect. Indeed, the displacement of the a/c TB provokes local magnetic flux change due to the reorientation of the easy axis of magnetization over the volume swept by moving TB, whereas the displacement of a/b TBs produces only strain, without c-axis reorientation and magnetic flux change. The rearrangement of magnetization of parts of magnetic domains adjacent to a/c TB during the motion of the boundary has been directly observed in a Ni53.8Mn23.7Ga22.5 alloy [44] by means of high-resolution Interference–Contrast–Colloid method.
A number of effects observed in the present study is perfectly consistent with the concept of TBs moving quasistatically under thermal stresses in the presence of mobile obstacles. For a detailed analysis and examples of similar cases in Cu-Al-Ni, Cu-Al-Be and Ni-Fe-Ga shape memory alloys we refer to a review [37]. Strain amplitude hysteresis and jerky IF dependences on strain amplitude, Figure 3, point to the intense pinning of a/c TBs by mobile obstacles at room temperature. The quasistatic motion of TBs at elevated temperatures (e.g., room temperature) is accompanied by the so-called “dragging” [45] of pinning clouds. Upon lowering the temperature, the mode of this motion changes from the viscous-like (which is actually a sequence of small macroscopically undistinguishable jerks) to the intermittent and macroscopically jerky one due to a competition between dragging and depinning mechanisms. Eventually, at low enough temperatures, even the TB-assisted diffusion of point-like defects freezes out. The TBs leave behind the Cottrell-like clouds and move in a random potential of homogeneously distributed immobile obstacles. The density of Cottrell-like clouds during motion of TBs is lower than under isothermal conditions and the IF decrease upon interruptions of temperature scans corresponds to the increase in the density of clouds or time-dependent pinning of TBs. Figure 7b shows that the recuperation of TB motion upon resuming the temperature scan requires overcooling/overheating and occurs as a fast depinning or jerk.
5. Conclusions
In general terms of anelasticity of solids, present experiments evidence the existence of the ultrasonic transitory internal friction of magnetic origin. This type of internal friction can be classified as a new category that links the classes of transitory and magnetomechanical damping.
In terms of the structure and properties of 10 M Ni-Mn-Ga martensite, the use of “domain engineered” samples with different controlled twin configurations shed light on the a/c and a/b twin boundary dynamics. More specifically, we conclude that:
- -
- a/c twin boundaries are pinned at and somewhat below room temperature by Cottrell-like clouds of mobile obstacles, whereas a/b twin boundaries are free from pinning clouds;
- -
- the anisotropy of thermal expansion results in the motion of a/c twin boundaries during temperature variations; this displacement provokes, on one hand, local changes of the magnetic flux and T-dot ultrasonic transitory internal friction of magnetic origin; on the other hand, the quasistatic motion of a/c twin boundaries under thermal stresses occurs under conditions similar to dynamic strain ageing, manifested in the time dependence of the internal friction due to the interaction of twin boundaries with Cottrell-like clouds of more or less mobile (depending on the temperature) pinners;
- -
- over a broad temperature range the system of a/b twins is in a highly non-equilibrium state, resulting in a strong history dependence and dramatic variations of the apparent Young’s modulus with temperature.
Author Contributions
Conceptualization, S.K., A.S. and K.U.; methodology, S.K. and A.S.; investigation, S.K., A.S., B.D. and K.S.; writing—original draft preparation, S.K.; writing—review and editing, A.S., B.D., K.S. and V.N.; supervision, K.U. All authors have read and agreed to the published version of the manuscript.
Funding
This work was supported by the Spanish AEI and FEDER, UE (project RTI 2018-094683-BC51), Strategic Research Council of Finland (grant number 313349) and the Academy of Finland (grant number 325910).
Acknowledgments
The authors are grateful to A. Sozinov (LUT) for supplying the material and to R. Sánchez Torres (SCT-UIB) for the help in preparation of experiments.
Conflicts of Interest
The authors declare no conflict of interest.
References
- San Juan, J.; Pérez-Saez, R.B. 5.4 Transitory Effects. Mater. Sci. Forum 2001, 366–368, 416–436. [Google Scholar] [CrossRef]
- Lebedev, A.B. Internal Friction in Quasi-Static Crystal Deformation (Review). Sov. Phys. Solid State 1993, 35, 2305–2341. [Google Scholar]
- Kustov, S.; Golyandin, S.; Sapozhnikov, K.; Vincent, A.; Maire, E.; Lormand, G. Structural and Transient Internal Friction Due to Thermal Expansion Mismatch between Matrix and Reinforcement in Al–SiC Particulate Composite. Mater. Sci. Eng. A 2001, 313, 218–226. [Google Scholar] [CrossRef]
- Sapozhnikov, K.; Golyandin, S.; Kustov, S. Elastic and Anelastic Properties of C/Mg-2wt.%Si Composite during Thermal Cycling. Compos. Part A 2009, 40, 105–113. [Google Scholar] [CrossRef]
- L’vov, V.A.; Glavatska, N.; Aaltio, I.; Söderberg, O.; Glavatskyy, I.; Hannula, S.P. The Role of Anisotropic Thermal Expansion of Shape Memory Alloys in Their Functional Properties. Acta Mater. 2009, 57, 5605–5612. [Google Scholar] [CrossRef]
- Sapozhnikov, K.; Golyandin, S.; Kustov, S.; Van Humbeeck, J.; Schaller, R.; De Batist, R. Transient Internal Friction during Thermal Cycling of Cu-Al-Ni Single Crystals in β1′ Martensitic Phase. Scr. Mater. 2002, 47, 459–465. [Google Scholar] [CrossRef]
- Sapozhnikov, K.; Golyandin, S.; Kustov, S.; Schaller, R.; Van Humbeeck, J. Anelasticity of B19′ Martensitic Phase in Ni-Ti and Ni-Ti-Cu Alloys. Mater. Sci. Eng. A 2006, 442, 398–403. [Google Scholar] [CrossRef]
- Coronel, V.F.; Beshers, D.N. Magnetomechanical Damping in Iron. J. Appl. Phys. 1988, 64, 2006–2015. [Google Scholar] [CrossRef]
- Degauque, J. Magnetic Domains. In Mechanical Spectroscopy Q-1 2001 with Applications to Materials Science; Schaller, R., Fantozzi, G., Gremaud, G., Eds.; Trans Tech Publications: Uetikon, Zuerich, 2001; pp. 453–482. [Google Scholar]
- Kustov, S.; Corró, M.L.; Kaminskii, V.; Saren, A.; Sozinov, A.; Ullakko, K. Elastic and Anelastic Phenomena Related to Eddy Currents in Cubic Ni2MnGa. Scr. Mater. 2018, 147, 69–73. [Google Scholar] [CrossRef]
- Birchak, J.R.; Smith, G.W. Magnetomechanical Damping and Magnetic Properties of Iron Alloys. J. Appl. Phys. 1972, 43, 1238–1246. [Google Scholar] [CrossRef]
- Mason, W.P. Domain Wall Relaxation in Nickel. Phys. Rev. 1951, 83, 683–684. [Google Scholar] [CrossRef]
- Kustov, S.; Liubimova, I.; Corró, M.; Torrens-Serra, J.; Wang, X.; Haines, C.R.S.; Salje, E.K.H. Temperature Chaos, Memory Effect, and Domain Fluctuations in the Spiral Antiferromagnet Dy. Sci. Rep. 2019, 9, 5076. [Google Scholar] [CrossRef]
- Transitory damping stems from the superposition of oscillatory and translatory motion of magnetic domain walls. A theoretical solution for the magnetic transitory damping yields a superposition of two terms: Frequency-independent and the one that shows conventional inverse frequency dependence, to be published.
- Likhachev, A.A.; Sozinov, A.; Ullakko, K. Different Modeling Concepts of Magnetic Shape Memory and Their Comparison with Some Experimental Results Obtained in Ni-Mn-Ga. Mater. Sci. Eng. A 2004, 378, 513–518. [Google Scholar] [CrossRef]
- Fukuda, T.; Sakamoto, T.; Kakeshita, T.; Takeuchi, T.; Kishio, K. Rearrangement of Martensite Variants in Iron-Based Ferromagnetic Shape Memory Alloys under Magnetic Field. Mater. Trans. 2004, 45, 188–192. [Google Scholar] [CrossRef] [Green Version]
- Chernenko, V.A.; L’vov, V.A. Magnetoelastic Nature of Ferromagnetic Shape Memory Effect. Mater. Sci. Forum 2008, 583, 1–20. [Google Scholar] [CrossRef] [Green Version]
- Rolfs, K.; Mecklenburg, A.; Guldbakke, J.M.; Wimpory, R.C.; Raatz, A.; Hesselbach, J.; Schneider, R. Crystal Quality Boosts Responsiveness of Magnetic Shape Memory Single Crystals. J. Mag. Mag. Mater. 2009, 321, 1063–1067. [Google Scholar] [CrossRef]
- Straka, L.; Lanska, N.; Ullakko, K.; Sozinov, A. Twin Microstructure Dependent Mechanical Response in Ni-Mn-Ga Single Crystals. Appl. Phys. Lett. 2010, 96, 131903. [Google Scholar] [CrossRef]
- Sozinov, A.; Lanska, N.; Soroka, A.; Straka, L. Highly Mobile Type II Twin Boundary in Ni-Mn-Ga Five-Layered Martensite. Appl. Phys. Lett. 2011, 99, 124103. [Google Scholar] [CrossRef]
- Seiner, H.; Straka, L.; Heczko, O. A microstructural model of motion of macro-twin interfaces in Ni–Mn–Ga 10M martensite. J. Mech. Phys. Sol. 2014, 64, 198–211. [Google Scholar] [CrossRef]
- Straka, L.; Drahokoupil, J.; Veřtát, P.; Zelený, M.; Kopeček, J.; Sozinov, A.; Heczko, O. Low Temperature a/b Nanotwins in Ni50Mn25+xGa25−x Heusler Alloys. Sci. Rep. 2018, 8, 11943. [Google Scholar] [CrossRef]
- Ullakko, K.; Huang, J.K.; Kantner, C.; O’Handley, R.C.; Kokorin, V.V. Large Magnetic-field-induced Strains in Ni2MnGa Single Crystals. Appl. Phys. Lett. 1996, 69, 1966–1968. [Google Scholar] [CrossRef]
- Aaltio, I.; Sozinov, A.; Ge, Y.; Ullakko, K.; Lindroos, V.K.; Hannula, S.-P. Reference Module in Materials Science and Materials Engineering; Hashmi, S., Ed.; Elsevier: Oxford, UK, 2016; pp. 1–14. [Google Scholar]
- Lanska, N.; Söderberg, O.; Sozinov, A.; Ge, Y.; Ullakko, K.; Lindroos, V.K. Composition and Temperature Dependence of the Crystal Structure of Ni-Mn-Ga Alloys. J. Appl. Phys. 2004, 95, 8074–8078. [Google Scholar] [CrossRef] [Green Version]
- Chulist, R.; Straka, L.; Lanska, N.; Soroka, A.; Sozinov, A.; Skrotzki, W. Characterization of Mobile Type i and Type II Twin Boundaries in 10M Modulated Ni-Mn-Ga Martensite by Electron Backscatter Diffraction. Acta Mater. 2013, 61, 1913–1920. [Google Scholar] [CrossRef]
- Heczko, O.; Klimša, L.; Kopeček, J. Direct Observation of A-b Twin Laminate in Monoclinic Five-Layered Martensite of Ni-Mn-Ga Magnetic Shape Memory Single Crystal. Scr. Mater. 2017, 131, 76–79. [Google Scholar] [CrossRef]
- Saren, A.; Sozinov, A.; Kustov, S.; Ullakko, K. Stress-Induced a/b Compound Twins Redistribution in 10M Ni-Mn-Ga Martensite. Scr. Mater. 2020, 175, 11–15. [Google Scholar] [CrossRef]
- Robinson, W.H.; Edgar, A. The Piezoelectric Method of Determining Mechanical Damping at Frequencies of 30 to 200 KHz. IEEE Trans. Sonics Ultrason. 1974, 21, 98–105. [Google Scholar] [CrossRef]
- Kustov, S.; Golyandin, S.; Ichino, A.; Gremaud, G. A New Design of Automated Piezoelectric Composite Oscillator Technique. Mater. Sci. Eng. A 2006, 442, 532–537. [Google Scholar] [CrossRef]
- Read, T.A. The Internal Friction of Single Metal Crystals. Phys. Rev. 1940, 58, 371–380. [Google Scholar] [CrossRef]
- Salje, E.K.H. Multiferroic Domain Boundaries as Active Memory Devices: Trajectories towards Domain Boundary Engineering. Chem. Phys. Chem. 2010, 11, 940–950. [Google Scholar] [CrossRef]
- Kustov, S.; Saren, A.; Sozinov, A.; Kaminskii, V.; Ullakko, K. Ultrahigh Damping and Young’s Modulus Softening Due to a/b Twins in 10M Ni-Mn-Ga Martensite. Scr. Mater. 2020, 178, 483–488. [Google Scholar] [CrossRef]
- Kustov, S.; Liubimova, I.; Salje, E.K.H. LaAlO3: A Substrate Material with Unusual Ferroelastic Properties. Appl. Phys. Lett. 2018, 112, 042902. [Google Scholar] [CrossRef]
- Kustov, S.; Golyandin, S.; Sapozhnikov, K.; Van Humbeeck, J.; de Batist, R. Low-Temperature Anomalies in Young’s Modulus and Internal Friction of Cu–Al–Ni Single Crystals. Acta Mater. 1998, 46, 5117–5126. [Google Scholar] [CrossRef]
- Sapozhnikov, K.; Golyandin, S.; Kustov, S.; Van Humbeeck, J.; de Batist, R. Motion of Dislocations and Interfaces during Deformation of Martensitic Cu–Al–Ni Crystals. Acta Mater. 2000, 48, 1141–1151. [Google Scholar] [CrossRef]
- Kustov, S.; Sapozhnikov, K.; Wang, X. Phenomena Associated with Diffusion, Assisted by Moving Interfaces in Shape Memory Alloys. A review of our Previous Works. Funct. Mater. Lett. 2017, 10, 1740010. [Google Scholar] [CrossRef]
- Chernenko, V.A.; Seguí, C.; Cesari, E.; Pons, J.; Kokorin, V.V. Sequence of Martensitic Transformations in Ni-Mn-Ga Alloys. Phys. Rev. B 1998, 57, 2659–2662. [Google Scholar] [CrossRef] [Green Version]
- Liu, J.; Wang, J.; Jiang, C.; Xu, H. Internal Friction Associated with the Premartensitic Transformation and Twin Boundary Motion of Ni50+xMn25−xGa25 (x=0–2) Alloys. J. Appl. Phys. 2013, 113, 103502. [Google Scholar] [CrossRef]
- Chang, S.H.; Wu, S.K. Low-Frequency Damping Properties of near-Stoichiometric Ni2MnGa Shape Memory Alloys under Isothermal Conditions. Scr. Mater. 2008, 59, 1039–1042. [Google Scholar] [CrossRef]
- Wang, W.H.; Liu, G.D.; Wu, G.H. Magnetically Controlled High Damping in Ferromagnetic Ni52Mn24Ga24 Single Crystal. Appl. Phys. Lett. 2006, 89, 101911. [Google Scholar] [CrossRef]
- Wang, W.H.; Ren, X.; Wu, G.H. Martensitic Microstructure and Its Damping Behavior in Ni52Mn16Fe8Ga24 Single Crystals. Phys. Rev. B 2006, 73, 092101. [Google Scholar] [CrossRef] [Green Version]
- Gavriljuk, V.G.; Söderberg, O.; Bliznuk, V.V.; Glavatska, N.I.; Lindroos, V.K. Martensitic transformations and mobility of twin boundaries in Ni2MnGa alloys studied by using internal friction. Scr. Mater. 2003, 49, 803–809. [Google Scholar] [CrossRef]
- Chopra, H.D.; Ji, C.; Kokorin, V.V. Magnetic-Field-Induced Twin Boundary Motion in Magnetic Shape-Memory Alloys. Phys. Rev. B 2000, 61, R14913–R14915. [Google Scholar] [CrossRef]
- Gremaud, G. Dislocation-point defect interactions. In Mechanical Spectroscopy Q-1 2001 with Applications to Materials Science; Schaller, R., Fantozzi, G., Gremaud, G., Eds.; Trans Tech Publications: Ueticon, Zuerich, 2001; pp. 178–246. [Google Scholar]
Figure 1.
Schematic images of the a/c and a/b twin configurations in three types of the samples studied: (a) Structure 1 with two a/c twin boundaries, Type I and Type II, separating three martensitic variants; a/b twinning planes are parallel to the sample long axis in the two lateral variants and inclined 45° in the narrow central variant; (b) Structure 2 without a/c twin boundaries; c-axis and a/b twinning planes are parallel to the sample axis; (c) Structure 3 without a/c twin boundaries; c-axis is perpendicular to the sample axis and a/b twinning planes are inclined 45° with respect to the sample axis.

Figure 2.
Two polarized light optical images of adjacent lateral surfaces of one of the studied samples with Structure 1 (Figure 1a). The sample consists of three martensitic variants separated by two a/c twin boundaries, Type I and Type II. The orientations of the c-axes, perpendicular in the two adjacent variants, are indicated by arrows.

Figure 3.
Strain amplitude dependence of the internal friction for a Structure 1 sample with one highly mobile (Type II) and one low mobility (Type I) a/c twin boundaries. Two consecutive measurements at room temperature (290 K), arrows indicate the scans with increasing and decreasing strain amplitude.

Figure 4.
Continuous temperature spectra of the internal friction registered in a cooling–heating scan between 290 and 173 K for a Structure 1 sample with two a/c twin boundaries. Cooling–heating rate 1 K/min, oscillatory strain amplitude 2 × 10⁻⁷.
Figure 4.
Continuous temperature spectra of the internal friction registered in a cooling–heating scan between 290 and 173 K for a Structure 1 sample with two a/c twin boundaries. Cooling–heating rate 1 K/min, oscillatory strain amplitude 2 × 10⁻⁷.

Figure 5.
Example of the time dependence of temperature in one of the cooling–heating scans that was interrupted for 2400 s at 273, 253, 233, 213 and 193 K on cooling and at 193, 213 and 273 K on heating.
Figure 5.
Example of the time dependence of temperature in one of the cooling–heating scans that was interrupted for 2400 s at 273, 253, 233, 213 and 193 K on cooling and at 193, 213 and 273 K on heating.

Figure 6.
Temperature dependence of the internal friction for a Structure 1 sample with two a/c twin boundaries in a cooling scan between 290 and 173 K interrupted for 2400 s at 273, 253, 233, 213, 193 and 173 K, as shown in Figure 4. Cooling rate 1 K/min, strain amplitude 2 × 10⁻⁷. Green line demonstrates the temperature spectrum under isothermal conditions. Vertical arrows mark isothermal decrease in the internal friction with time during interruptions of cooling.

Figure 7.
Temperature dependence of the internal friction for a Structure 1 sample with two a/c twin boundaries in a thermal cycle between 290 and 163 K, interrupted for 2400 s during cooling at 226 K and during heating at 200 K (a) and corresponding time dependences of temperature T, absolute value of cooling/heating rate dT/dt and the internal friction δ during the entire heating scan (b) and during interruption of cooling (c).

Figure 8.
Internal friction versus absolute value of T-dot during interruption of cooling at 233 and 193 K of Structure 1 sample with two a/c twin boundaries. Vertical arrows mark the “fast” and “slow” internal friction components and in the data taken at 233 K.
Figure 8.
Internal friction versus absolute value of T-dot during interruption of cooling at 233 and 193 K of Structure 1 sample with two a/c twin boundaries. Vertical arrows mark the “fast” and “slow” internal friction components and in the data taken at 233 K.

Figure 9.
Temperature spectra of the Young’s modulus (a) and internal friction (b) for the samples with three types of a/c and a/b twin structures shown in Figure 1. Cooling and heating scans at 2K/min are shown in (a) and in (b) for the Structure 3 sample with maximum shear stress in the a/b twinning planes. For clarity, only heating scans are shown in (b) for the Structure 1 sample with a/c twin boundaries and Structure 2 sample (zero a/b shear stress), for which the thermal hysteresis is not significant. Note that the data for the Structures 2 and 3 (with zero and maximum a/b shear stress) correspond to the same sample with a/b twin structure reoriented by magnetic field, see [33] for the details of a/b twin structure modification. Broken parts of the temperature spectrum on cooling for the sample Structure 3 (maximum shear stress for a/b twins) mark the ranges where the damping values cannot be determined correctly due to the change of the oscillation harmonic (see text for details).


Publisher’s Note: MDPI stays neutral with regard to jurisdictional claims in published maps and institutional affiliations. |
© 2021 by the authors. Licensee MDPI, Basel, Switzerland. This article is an open access article distributed under the terms and conditions of the Creative Commons Attribution (CC BY) license (https://creativecommons.org/licenses/by/4.0/).
Share and Cite
MDPI and ACS Style
Kustov, S.; Saren, A.; D’Agosto, B.; Sapozhnikov, K.; Nikolaev, V.; Ullakko, K. Transitory Ultrasonic Absorption in “Domain Engineered” Structures of 10 M Ni-Mn-Ga Martensite. Metals 2021, 11, 1505. https://doi.org/10.3390/met11101505
AMA Style
Kustov S, Saren A, D’Agosto B, Sapozhnikov K, Nikolaev V, Ullakko K. Transitory Ultrasonic Absorption in “Domain Engineered” Structures of 10 M Ni-Mn-Ga Martensite. Metals. 2021; 11(10):1505. https://doi.org/10.3390/met11101505
Chicago/Turabian StyleKustov, Sergey, Andrey Saren, Bruno D’Agosto, Konstantin Sapozhnikov, Vladimir Nikolaev, and Kari Ullakko. 2021. "Transitory Ultrasonic Absorption in “Domain Engineered” Structures of 10 M Ni-Mn-Ga Martensite" Metals 11, no. 10: 1505. https://doi.org/10.3390/met11101505
Note that from the first issue of 2016, this journal uses article numbers instead of page numbers. See further details here.