
Corrosion Behavior of Copper Bearing Steels and the Derived In-Situ Coating
by
 ,
,
Na Li
1,2,* ,
,
Ling Yan
2,*,
Shaodong Wang
1,
Changshun Wang
2,
Hongmei Zhang
1,
Fangfang Ai
2 and
Zhengyi Jiang
1,3,* 1
School of Materials and Metallurgy, University of Science and Technology Liaoning, Anshan 114051, China
2
State Key Laboratory of Metal Material for Marine Equipment and Application, Anshan 114009, China
3
School of Mechanical, Materials and Mechatronic Engineering, University of Wollongong, Wollongong, NSW 2522, Australia
*
Authors to whom correspondence should be addressed.
Metals 2021, 11(9), 1462; https://doi.org/10.3390/met11091462
Submission received: 1 August 2021
/
Revised: 10 September 2021
/
Accepted: 13 September 2021
/
Published: 15 September 2021
(This article belongs to the Special Issue Advances in Corrosion and Protection of Materials)
Abstract
:Using a period immersion wet/dry cyclic corrosion test, in-situ copper-coated steels prepared by corroding copper-bearing steels were investigated in this study. The steel with a higher copper content (>3%) has a higher initial corrosion rate due to its obvious two-phase microstructure. The corrosion rates of all copper bearing steels tend to be stable after a certain time of corrosion. A copper-rich layer is formed between the matrix and the rust layer, which is due to the diffusion of copper from the rust layer to the metal surface. The copper’s stability under this corrosion condition led to the formation of a thin copper-rich film, which was uncovered after removing the rust by choosing appropriate descaling reagents. The copper coating was generated from the matrix itself during the corrosion process at 25 °C, which provided a new approach for producing in-situ composite materials without any bonding defect. It is found that the corrosion rate, corrosion time, and copper content in steel all affect the formation of copper-rich layer. In addition to the noble copper surface, the electrochemical corrosion test results show that the corrosion resistance of copper-coated steel has been significantly improved.
1. Introduction
Copper accumulates in steel when steel scrap is reused, because it is difficult to remove copper in steelmaking processes [1]. Therefore, with the increase in the amount of scrap steel being used, it is imperative to study the application of copper in copper-bearing steels. Meanwhile, much research has been done to produce copper cladding on a steel surface using various methods. Copper, with its unique physical, chemical, mechanical, and physiological properties, has an important role in the lives of humans, and it also has an important application in many industrial and technical fields. Copper has been used both as an intermediate or undercoating, and as a top coat material [2].
Steel/copper clad metals are widely studied because they have applications ranging from functional coatings in the electrical and electronics industries, to adhesion promoting coatings, intermediate coatings for improving brightness and leveling effects in decorative/corrosion-protective coating systems, and purely decorative uses as a top coating [3,4]. Electroplating and electroless plating [2,5], cladding [6,7], cold sprayed coating [8,9,10], and casting [11] approaches have been widely used to produce copper-clad steel. Composite materials are more difficult to produce than single materials because of the diversity of their material properties. According to the characteristics that copper in copper-bearing steels, such as weathering steels, are easy to segregate on the surface of steels, accelerated corrosion tests of copper-bearing steels at 25 °C (room temperature) were carried out in this study in order to make copper-clad steel composites. A nearly perfect in-situ copper coating was observed after the rusts was removed from the corroded copper-bearing steels. As one of the basic properties of cladding material, the corrosion resistance of the copper-coated steels was tested by electrochemical corrosion test.
2. Materials and Methods
2.1. Sample Preparation
In order to eliminate the influence of other alloying elements, ultra-low carbon steel was used as a raw material in this study. Copper-bearing steels were prepared in a high-frequency vacuum induction furnace.
Samples with a side length of about 50 mm and a thickness of around 10 mm were cut from each ingot. The surface of the samples were polished smooth, and multipoint (≥3) composition tests were carried out by direct reading spectrometer (ARL 3460, Thermo Fisher, New York, America), and the average value of the test values was taken as the alloy composition. The chemical compositions (in wt%) of the test samples are listed in Table 1, where sample No.0 is a raw steel. At present, the high content of copper in commercial copper steel is about 3%. In this experiment, two samples with higher content of copper were specially added for comparative study.
Rectangular specimens with the approximate dimensions of 25 mm × 25 mm × 3 mm (with a small hole to hang the sample during the corrosion test) were cut from the ingots, and then mechanically ground using SiC papers in succession up to 800 grit. Afterwards, they were treated by descaling, cleaning, and rinsing in acetone, and then drying.
2.2. Wet-Dry Cyclic Accelerated Test
Dry-wet cycle accelerated test is a conventional method to test the corrosion resistance of steels at 25 °C [12]. This method is used to test the corrosion resistance of test steels with different copper content, and to corrode iron on the surfaces of steels to obtain enriched copper.
Before and after each corrosion test, the specimens were weighed using an analysis balance with an accuracy of 1 mg. The samples were subjected to a periodic immersion wet/dry cyclic corrosion test, which was an accelerated corrosion test under an artificially simulated atmospheric environment. Each cycle of this wet/dry cyclic corrosion test lasted 24 h and included three stages: (1) Put the dried samples one by one on the filter paper in the high-precision balance, and handle the samples gently to prevent the rust layer from falling off, (2) immersing the specimens into a 5% sodium chloride solution with a pH value of 6.5–7.2 (as measured using a digital pH tester) at 25 °C for 3 s, and (3) drying the specimens immediately by hanging them in a test chamber with a constant humidity of RH60% (±5%) for 24 h. The total corrosion test lasted 288 h. No direct connection between the different metals occurred during the entire testing process.
2.3. Descaling and Observation
For all the corroded samples, the rust was removed with citric acid (30 g) and sodium dihydrogen phosphate anhydrous (50 g), which were dissolved in 1 L of deionized water [13]. The pH value of the descaling solution was approximately 1.6–1.7, and the descaling process lasted 24 h at 25 °C.
The samples were mounted with a slope, because pure copper is softer than steel and is easy to wear off. The microstructures of the mounted samples were observed using an optical microscope (OM, Axioskop 2 MAT, Carl Zeiss AG, Jena, Germany). A scanning electron microscope (SEM, JSM-6500, JEOL, Tokyo, Japan) equipped with an energy dispersive X-ray spectroscopy (EDS) feature (Quanta FEG250 FEI, Hillsboro, OR, USA) was used to obtain the elemental distribution at different areas of the coating microstructure. X-ray diffraction (XRD D/max-2500) was used to determine the surface phase compositions of the descaled samples. The working voltage is 40 KV, the working current is 40 mA, the radiation target is CuKa, and the scanning speed is 6°/min. Scanning ranges from 10° to 90° (2θ). JCPDS (Joint Committee on Powder Diffraction Standards) cards are used as reference to identify crystal phases in XRD patterns. The JCPDS card numbers used in this paper are: Iron 01-089-7194, Copper 01-070-3038, Fe3O4 00-003-0863, Fe2O3 00-004-0755, and FeOOH 01-081-0463.
2.4. Electrochemical Corrosion Test
The steel samples (with and without Cu coating) were rectangular in shape (10 × 8 × 3 mm3). All samples were suitably embedded in epoxy resin, and the exposed surface was 0.8 cm2. In this study, polarization curves were measured by Autolab electrochemical station (ECO CHEMIE BV BST7276). The samples with an electric contact were used as working electrodes in a standard three-electrode cell, i.e., platinum counter electrode, silver/silver chloride (Ag/AgCl/sat. KCl) reference electrode, and a working electrode. The latter was placed in a capillary in such a way that it remained outside the cell at 25 °C, while the capillary tip was immersed in the testing solution close to the working electrode surface.
Before experiment, the working electrode surface was degreased with acetone followed by rinsing with deionized water, and a 3.5% sodium chloride solution with pH value of 6.5–7.0 was used at 25 °C. Potentiodynamic polarization were conducted from a potential of −1.0 V to −0.1 V versus Ag/AgCl with a scan rate of 0.05 V/min after achieving a stationary value for the open circuit potential (potential variation not higher than 0.1 mV/s).
3. Results
3.1. Microstructure
Figure 1 shows the optical microstructures of the as-cast Cu-bearing steels. According to Fe-Cu phase diagram, at room temperature, the solid solubility of copper in iron is about 0.6%, while that of iron in copper is almost zero. Therefore, the copper-bearing steel is mainly composed of solid solution ferrite phase and copper-rich phase close to pure copper. Therefore, the main phases in Figure 1 should be α ferrite and a small amount of copper-rich phase.
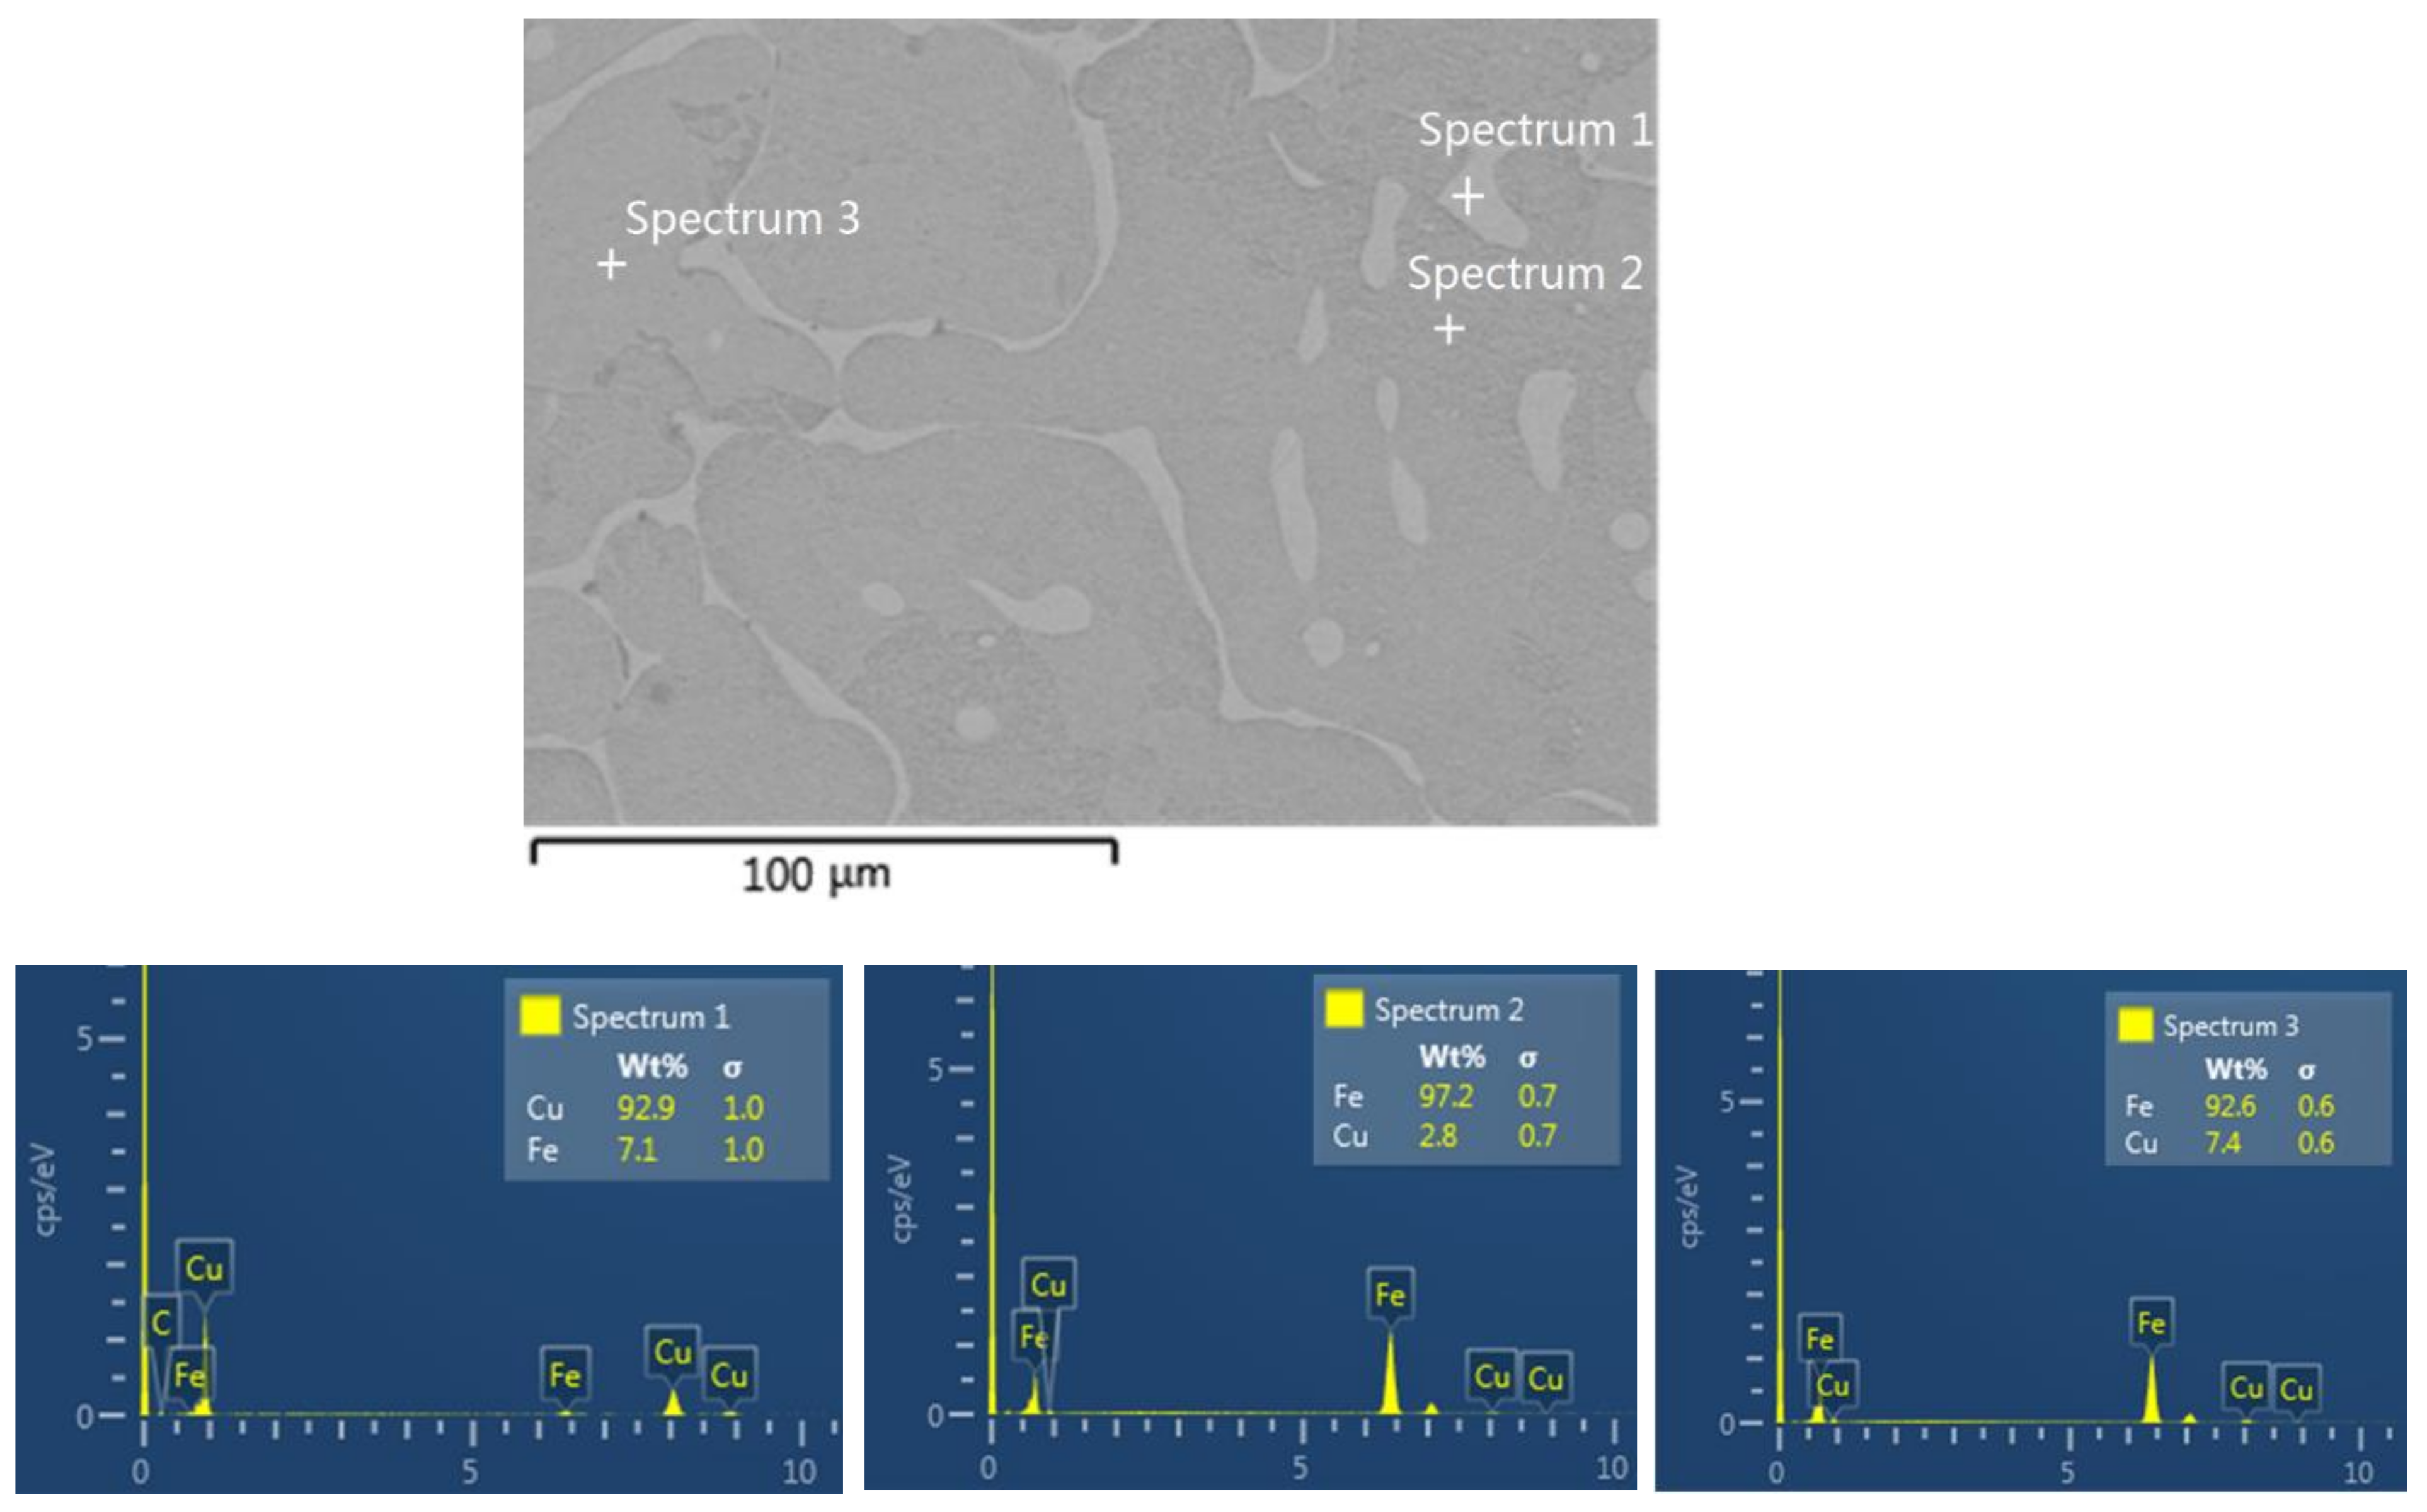
For steels 3 and 4, there are obvious bright particle precipitates distributed along the grain boundaries and in the grains, and the grains are remarkably refined as a result of the precipitation of these phases. No bright precipitate can be observed in steels 1 and 2, which confirm that the bright phase is Cu-rich phase. The EDS analysis of steel 4 shown in Figure 2 shows that the bright precipitates are copper-rich phases with a small amount of iron in solid solution. Meanwhile, about 2.8–7.4 mass% of copper is distributed in α ferrite matrix. According to these results, there should be little of the copper-rich phase precipitated in steels 1 and 2, which agrees well with the optical observations shown in Figure 1. All the relatively larger white, gray, and black phases are α ferrite, which are shown in different colors because of their different crystal orientations.
The actual solid solubility of metals may be slightly higher than that shown in the phase diagram. Therefore, copper beyond the solid solubility content exists as copper atoms or as near pure copper phase in steel. With an increase of the copper content, the grain sizes of the steel became fine and uniform, as shown in Figure 1c,d, indicating that copper precipitated in excess of the solid solubility is more likely to accumulate at grain boundaries and hinder their migration.
3.2. Corrosion Kinetics
Copper is widely employed as an outdoor building material for fabricating statues, sculptures, and monuments because of its aesthetic qualities, and good mechanical and antibacterial properties [14,15]. It is noted for its excellent corrosion resistance. Therefore, the corrosion behavior of copper-bearing steel is an important performance factor. The corrosion properties of Cu-bearing steels are shown in Figure 3, where steel 0 is copper free as a benchmark.
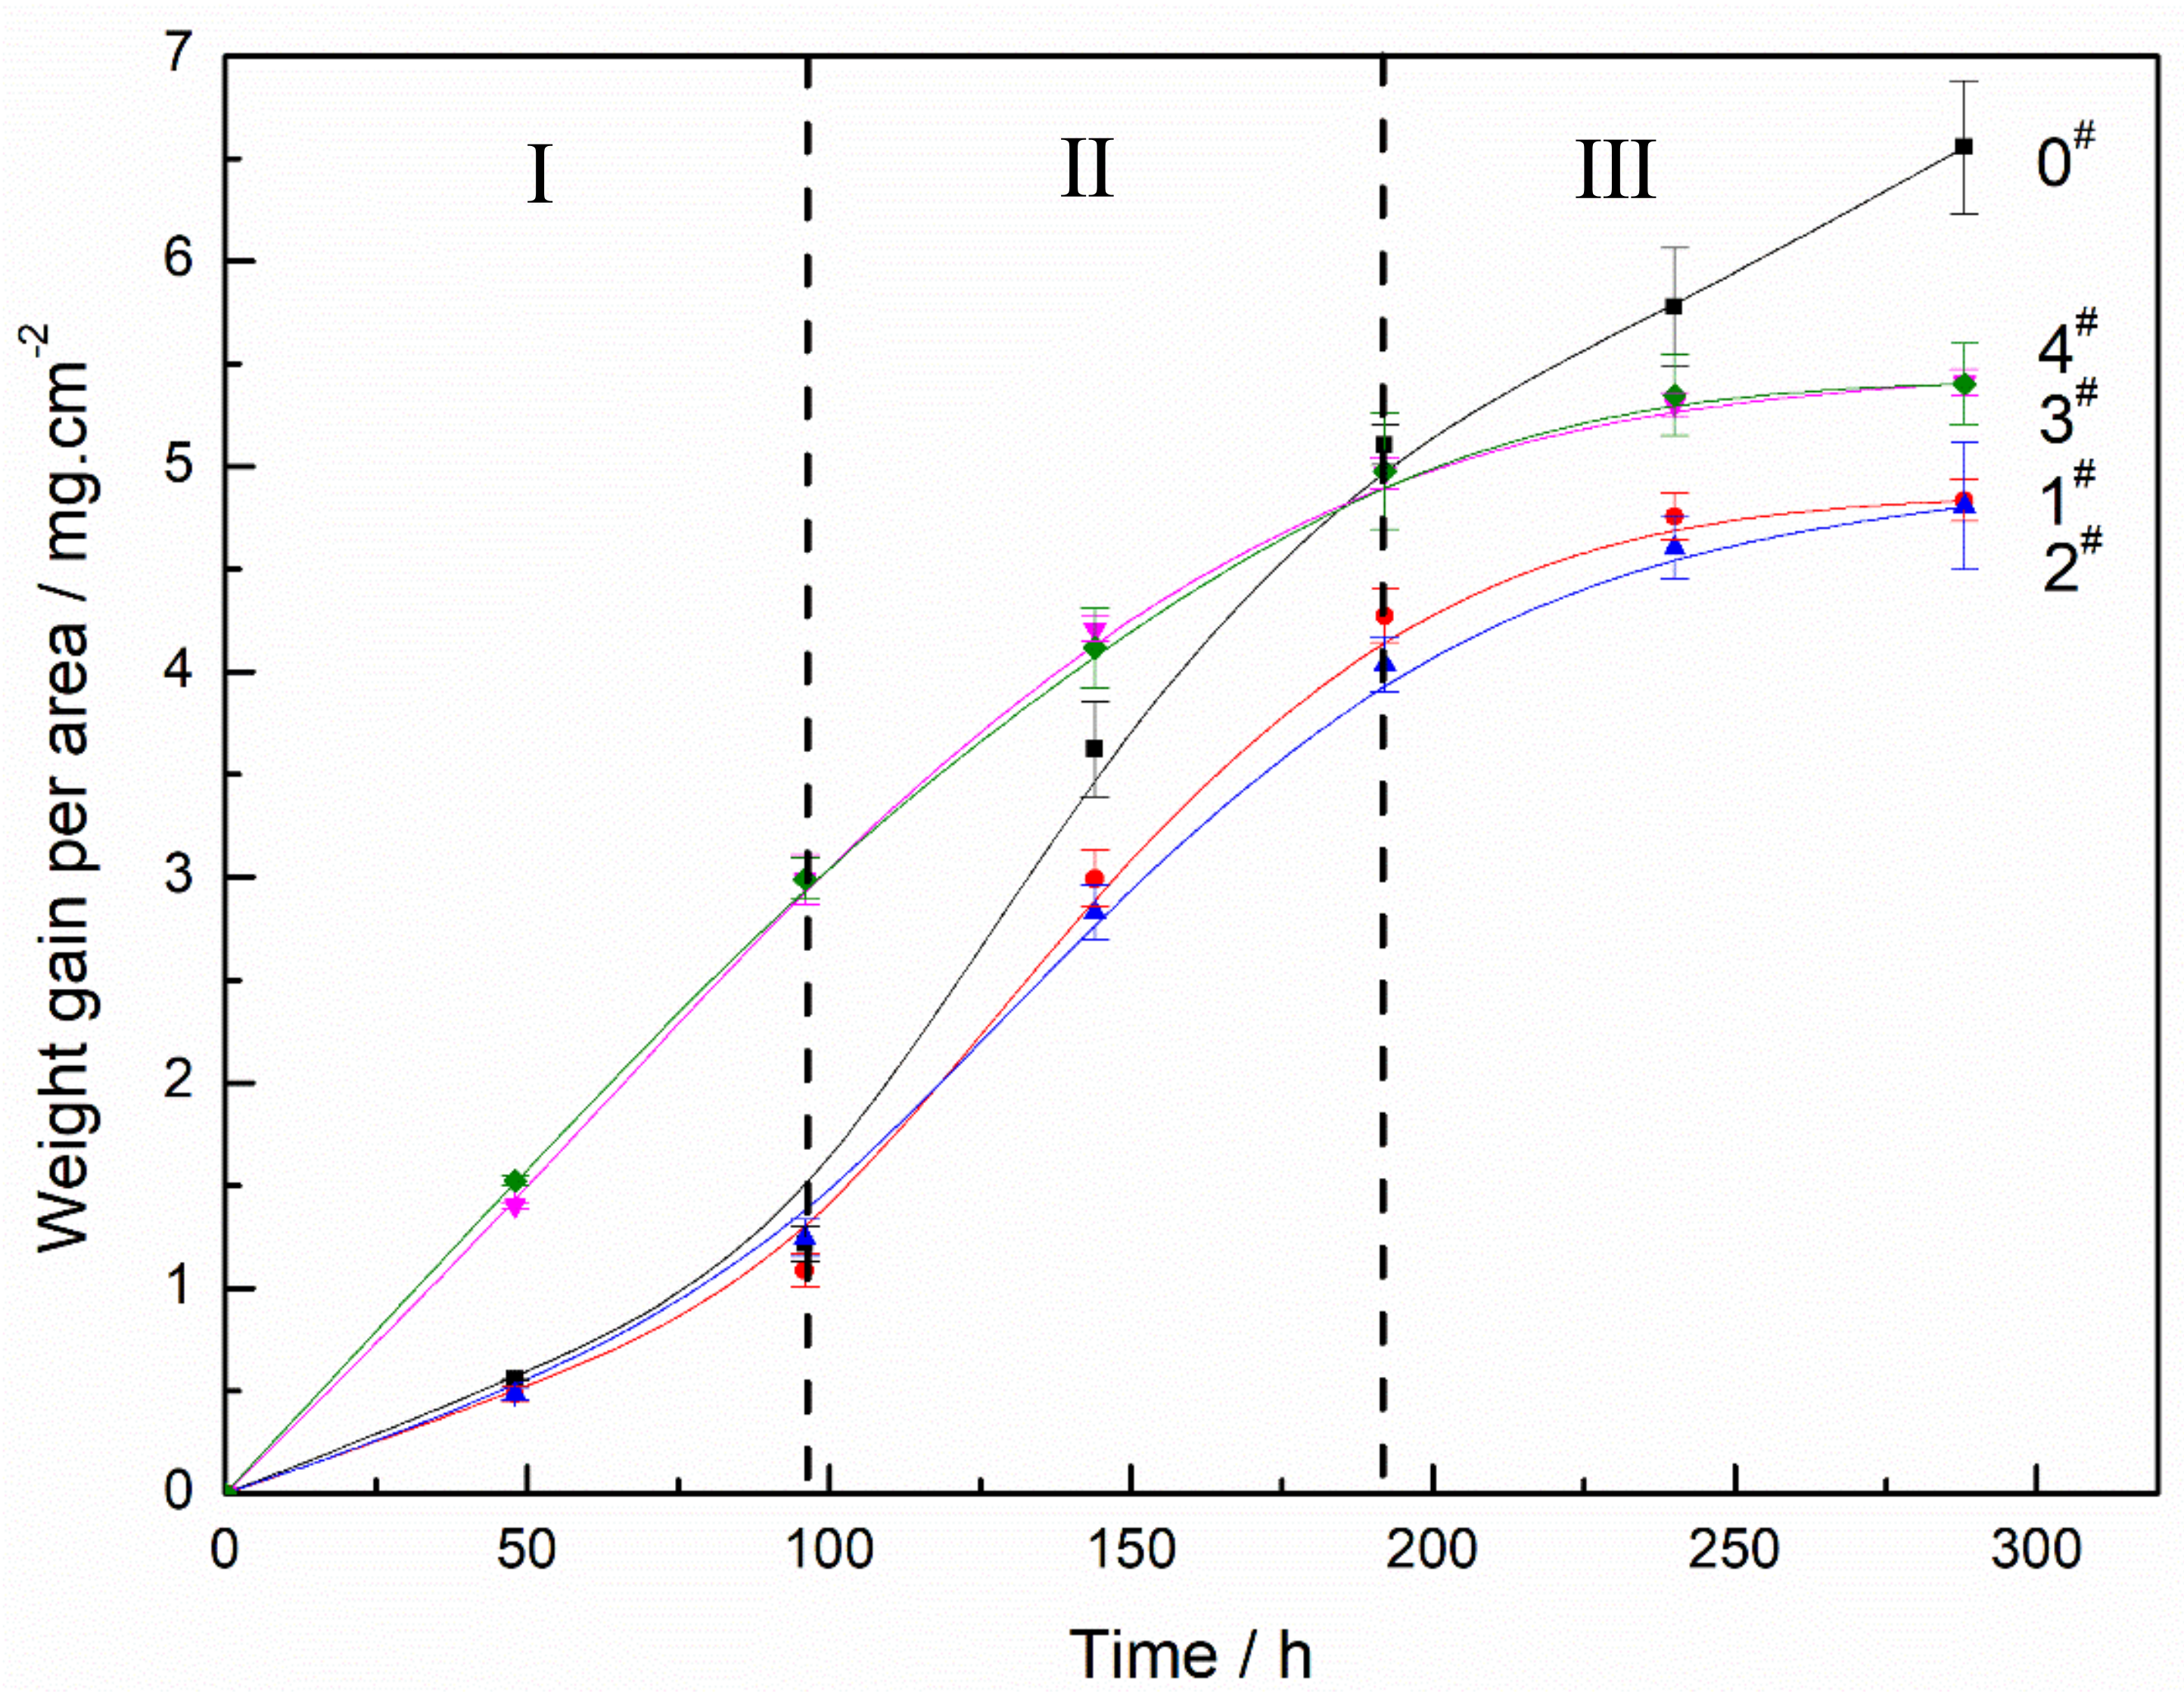
The entire corrosion process (up to 288 h) for all the test steels can be clearly divided into three stages, as shown in Figure 3. Each stage shows distinctive slope behavior for all the samples.
In stage I, both steels 3 and 4 show higher corrosion rates. The corrosion is much more aggressive as the copper and iron begin the process of galvanic coupling at the very beginning of the corrosion process. In contrast, steels 0, 1, and 2 all show lower corrosion rates in stage I, which correspond to no obvious Cu-rich phases in the steels, and these relatively lower corrosion rates may be attributed to the formation of oxides in the beginning [16]. Therefore, in the initial stage of corrosion, steels 0, 1, and 2 exhibit surface corrosion of ferrite samples with relatively low corrosion rate, while steels 3 and 4 exhibit two-phase galvanic corrosion with relatively high corrosion rate.
The subsequent gain in weight in stage II becomes gradual for steels 0, 1, and 2. The growth rate of the corrosion rate of steel 0 is much greater than those of steels 1 and 2, which are even greater than those of steels 3 and 4, as shown in Figure 3. This phenomenon indicates that the surface corrosion products in the first stage are not dense, and the oxygen penetrate through the open holes of the oxide layer to enter the metal matrix from the surface in stage II, and the matrix is directly corroded rapidly. Therefore, in the corrosion stages up to about 192 h, although the corrosion mechanism of steel changes when the copper content of steel reaches or exceeds 6.8%, a certain amount of copper in steel has the effect of reducing and stabilizing the corrosion rate. This phenomenon should be related to the corrosion products of copper-bearing steels.
When the corrosion time exceeds 192 h, the corrosion process enters the third stage. Although the copper-free steel (steel 0) was still corroded at a higher rate, the corrosion rate of all the experimental steels was reduced compared with that of the second stage. The decrease of corrosion rate of steel 0 should be related to the increase of thickness of corrosion products on steel surface. The corrosion rate of copper-bearing steel is obviously lower than that of the previous stage, especially the steel with higher copper content, which indicates that a protective layer is formed on the corrosion surface, which is related to copper in the steel.
3.3. Corrosion Products
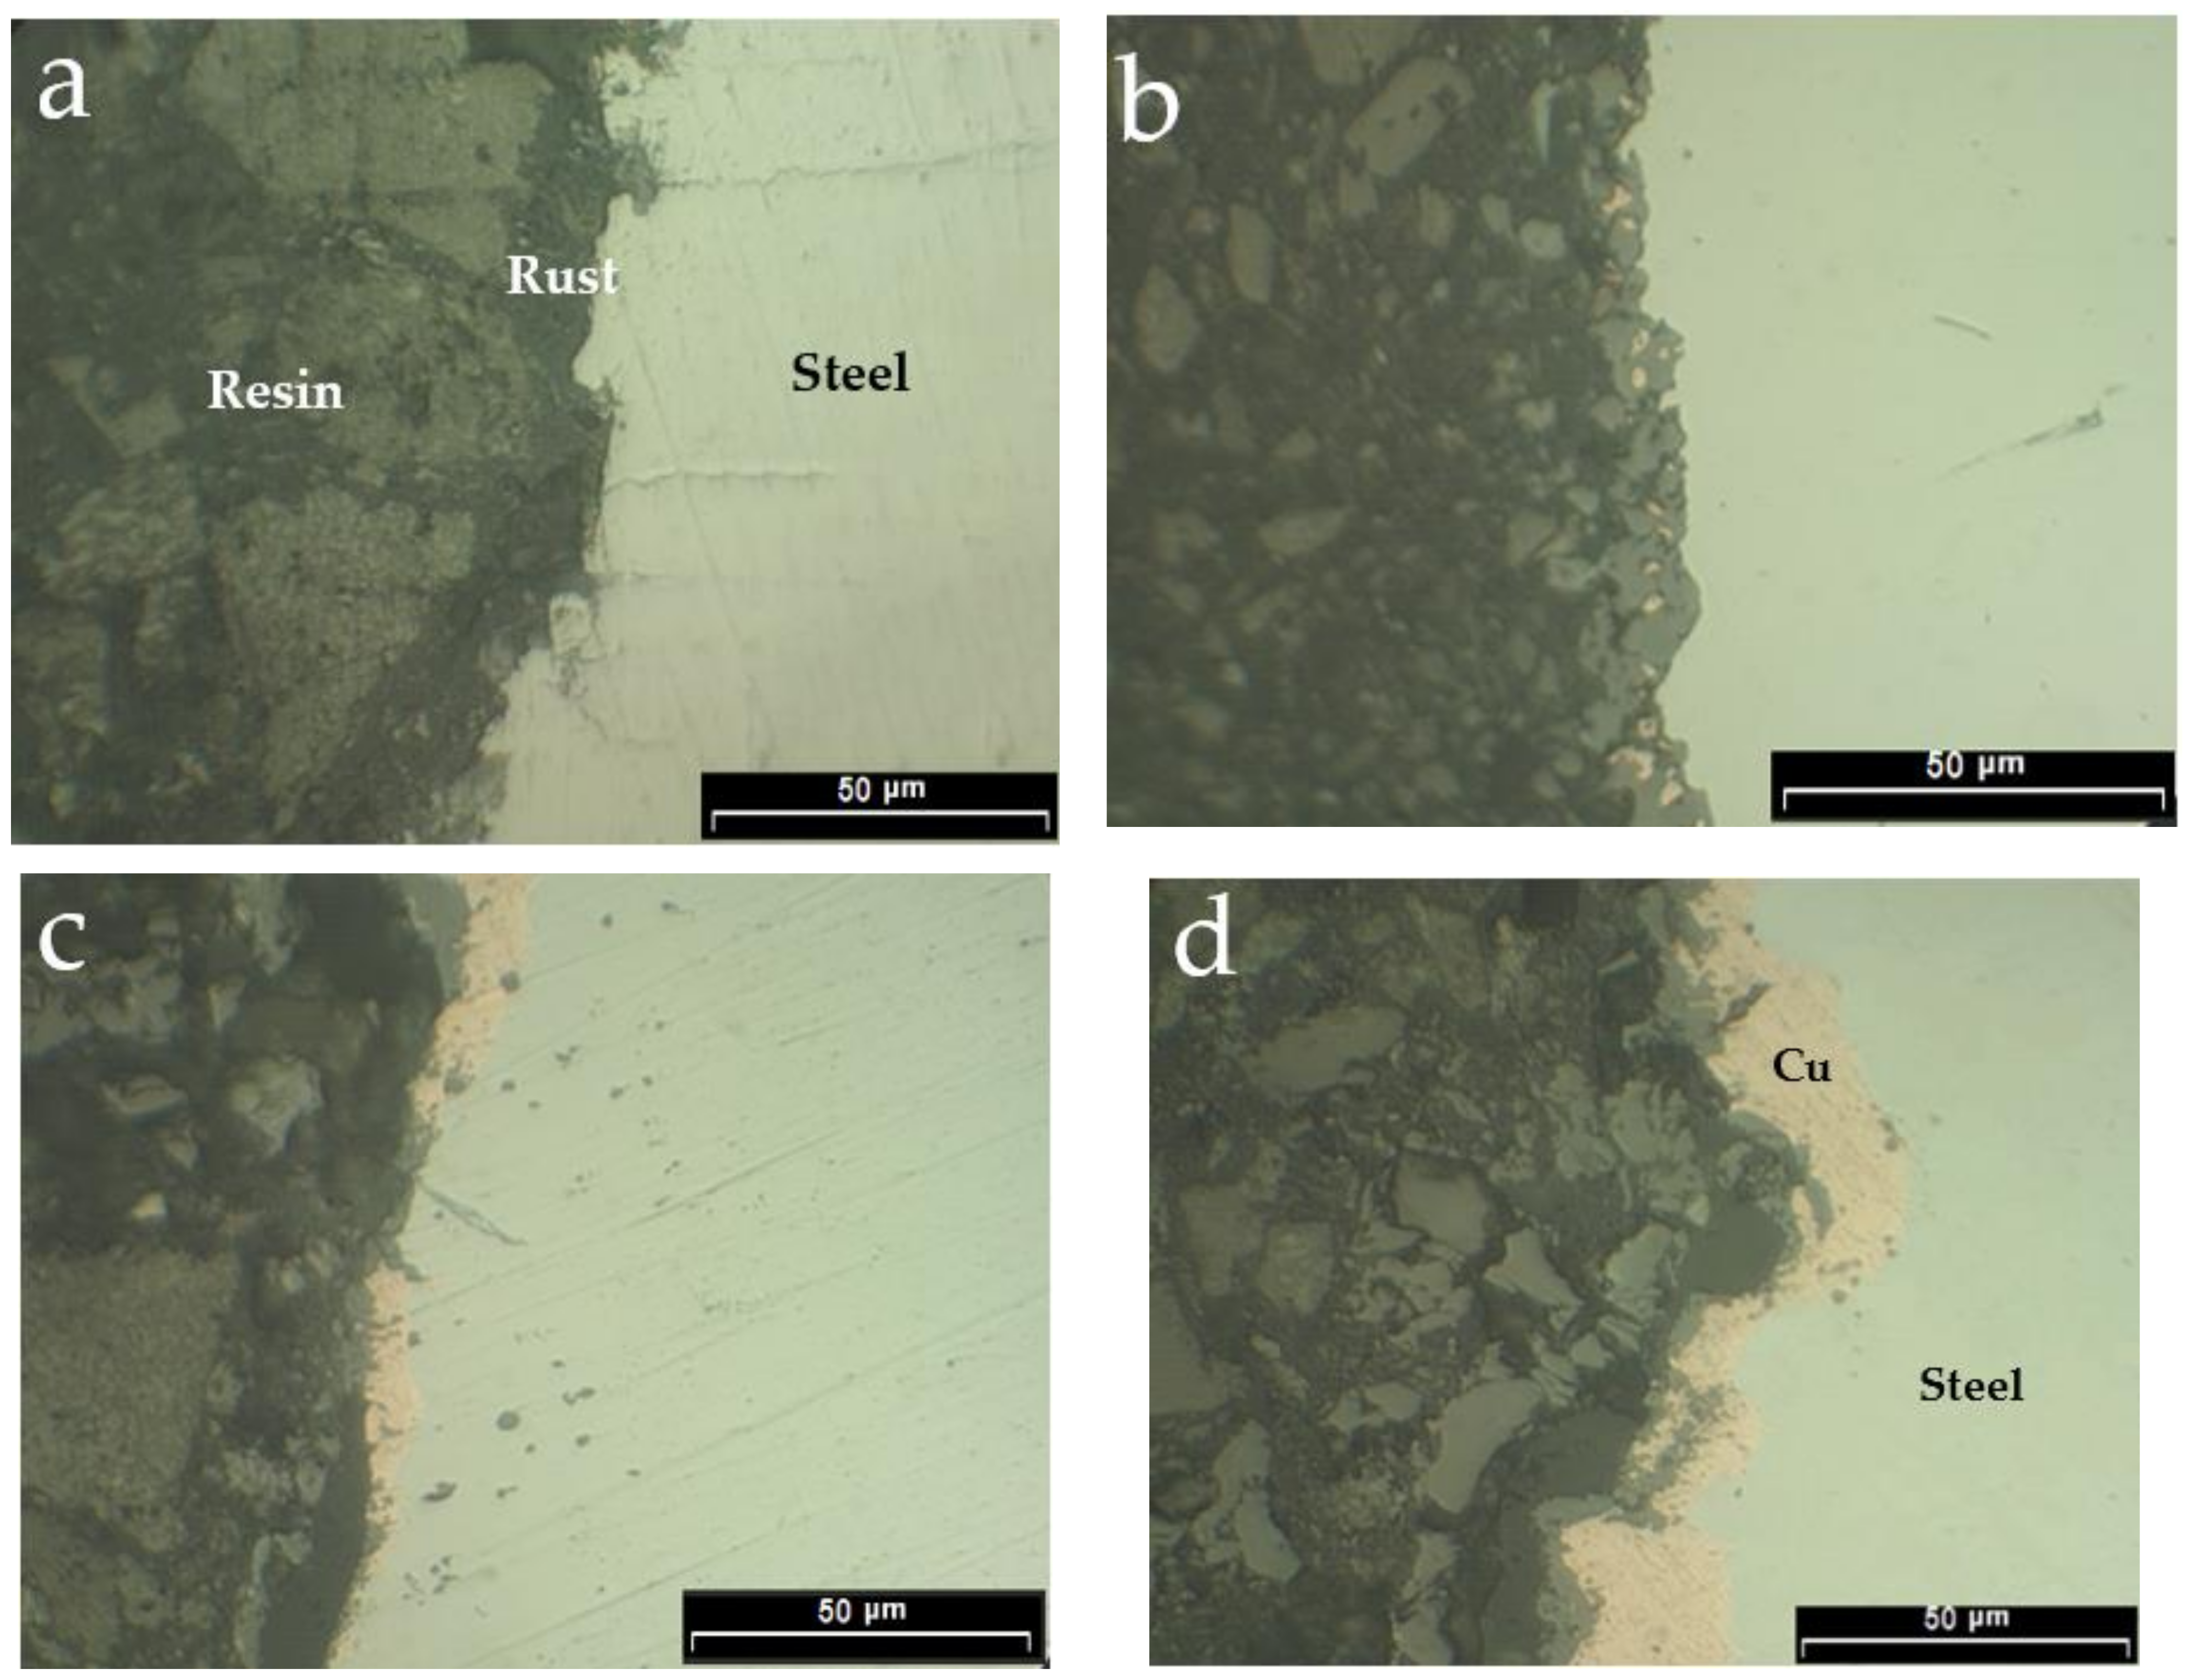
It is well known that copper can accumulate at the surface of steel after a certain period of corrosion for copper-bearing weathering steels. Figure 4 show optical microscope pictures of the inclined cross section of test steels after an accelerated corrosion test at 25 °C for 288 h.
All samples were heat mounted to keep the rust layer from falling off. There is no evidence of copper segregation on the surface of steel 1 with less copper content (Figure 4a). With the increase of copper content in steel, sporadic copper segregation can be observed in the rust layer on the surface of steel 2 (Figure 4b), and the copper segregated on the surface of steel 3 begin to connect with each other locally (Figure 4d). The copper layer between the matrix and rust was obvious as shown in Figure 4d. The similar parts, which are much brighter in the back-scattered electron image are mainly pure copper of greater than 95% according to the EDS results. The copper layer is integrated in steel 4. However, this copper layer is easily ground away because pure copper is much softer than steel. It can be calculated that the thickness of the copper layer varies from a few microns to a dozen microns according to the tilt angle of the sample.
The oxides appear in black in Figure 4. These should primarily consist of iron oxide because copper is more stable than iron. After forming the copper layer between the rust and the matrix, the oxidation speed greatly slowed down before halting, and then the copper on the surface would oxidize slowly if the corrosion tests continued.
The bright gray part shown in Figure 4 is the matrix, which is an iron solid solution in which copper is the main constituent.
3.4. Rust Removal from Corroded Steel
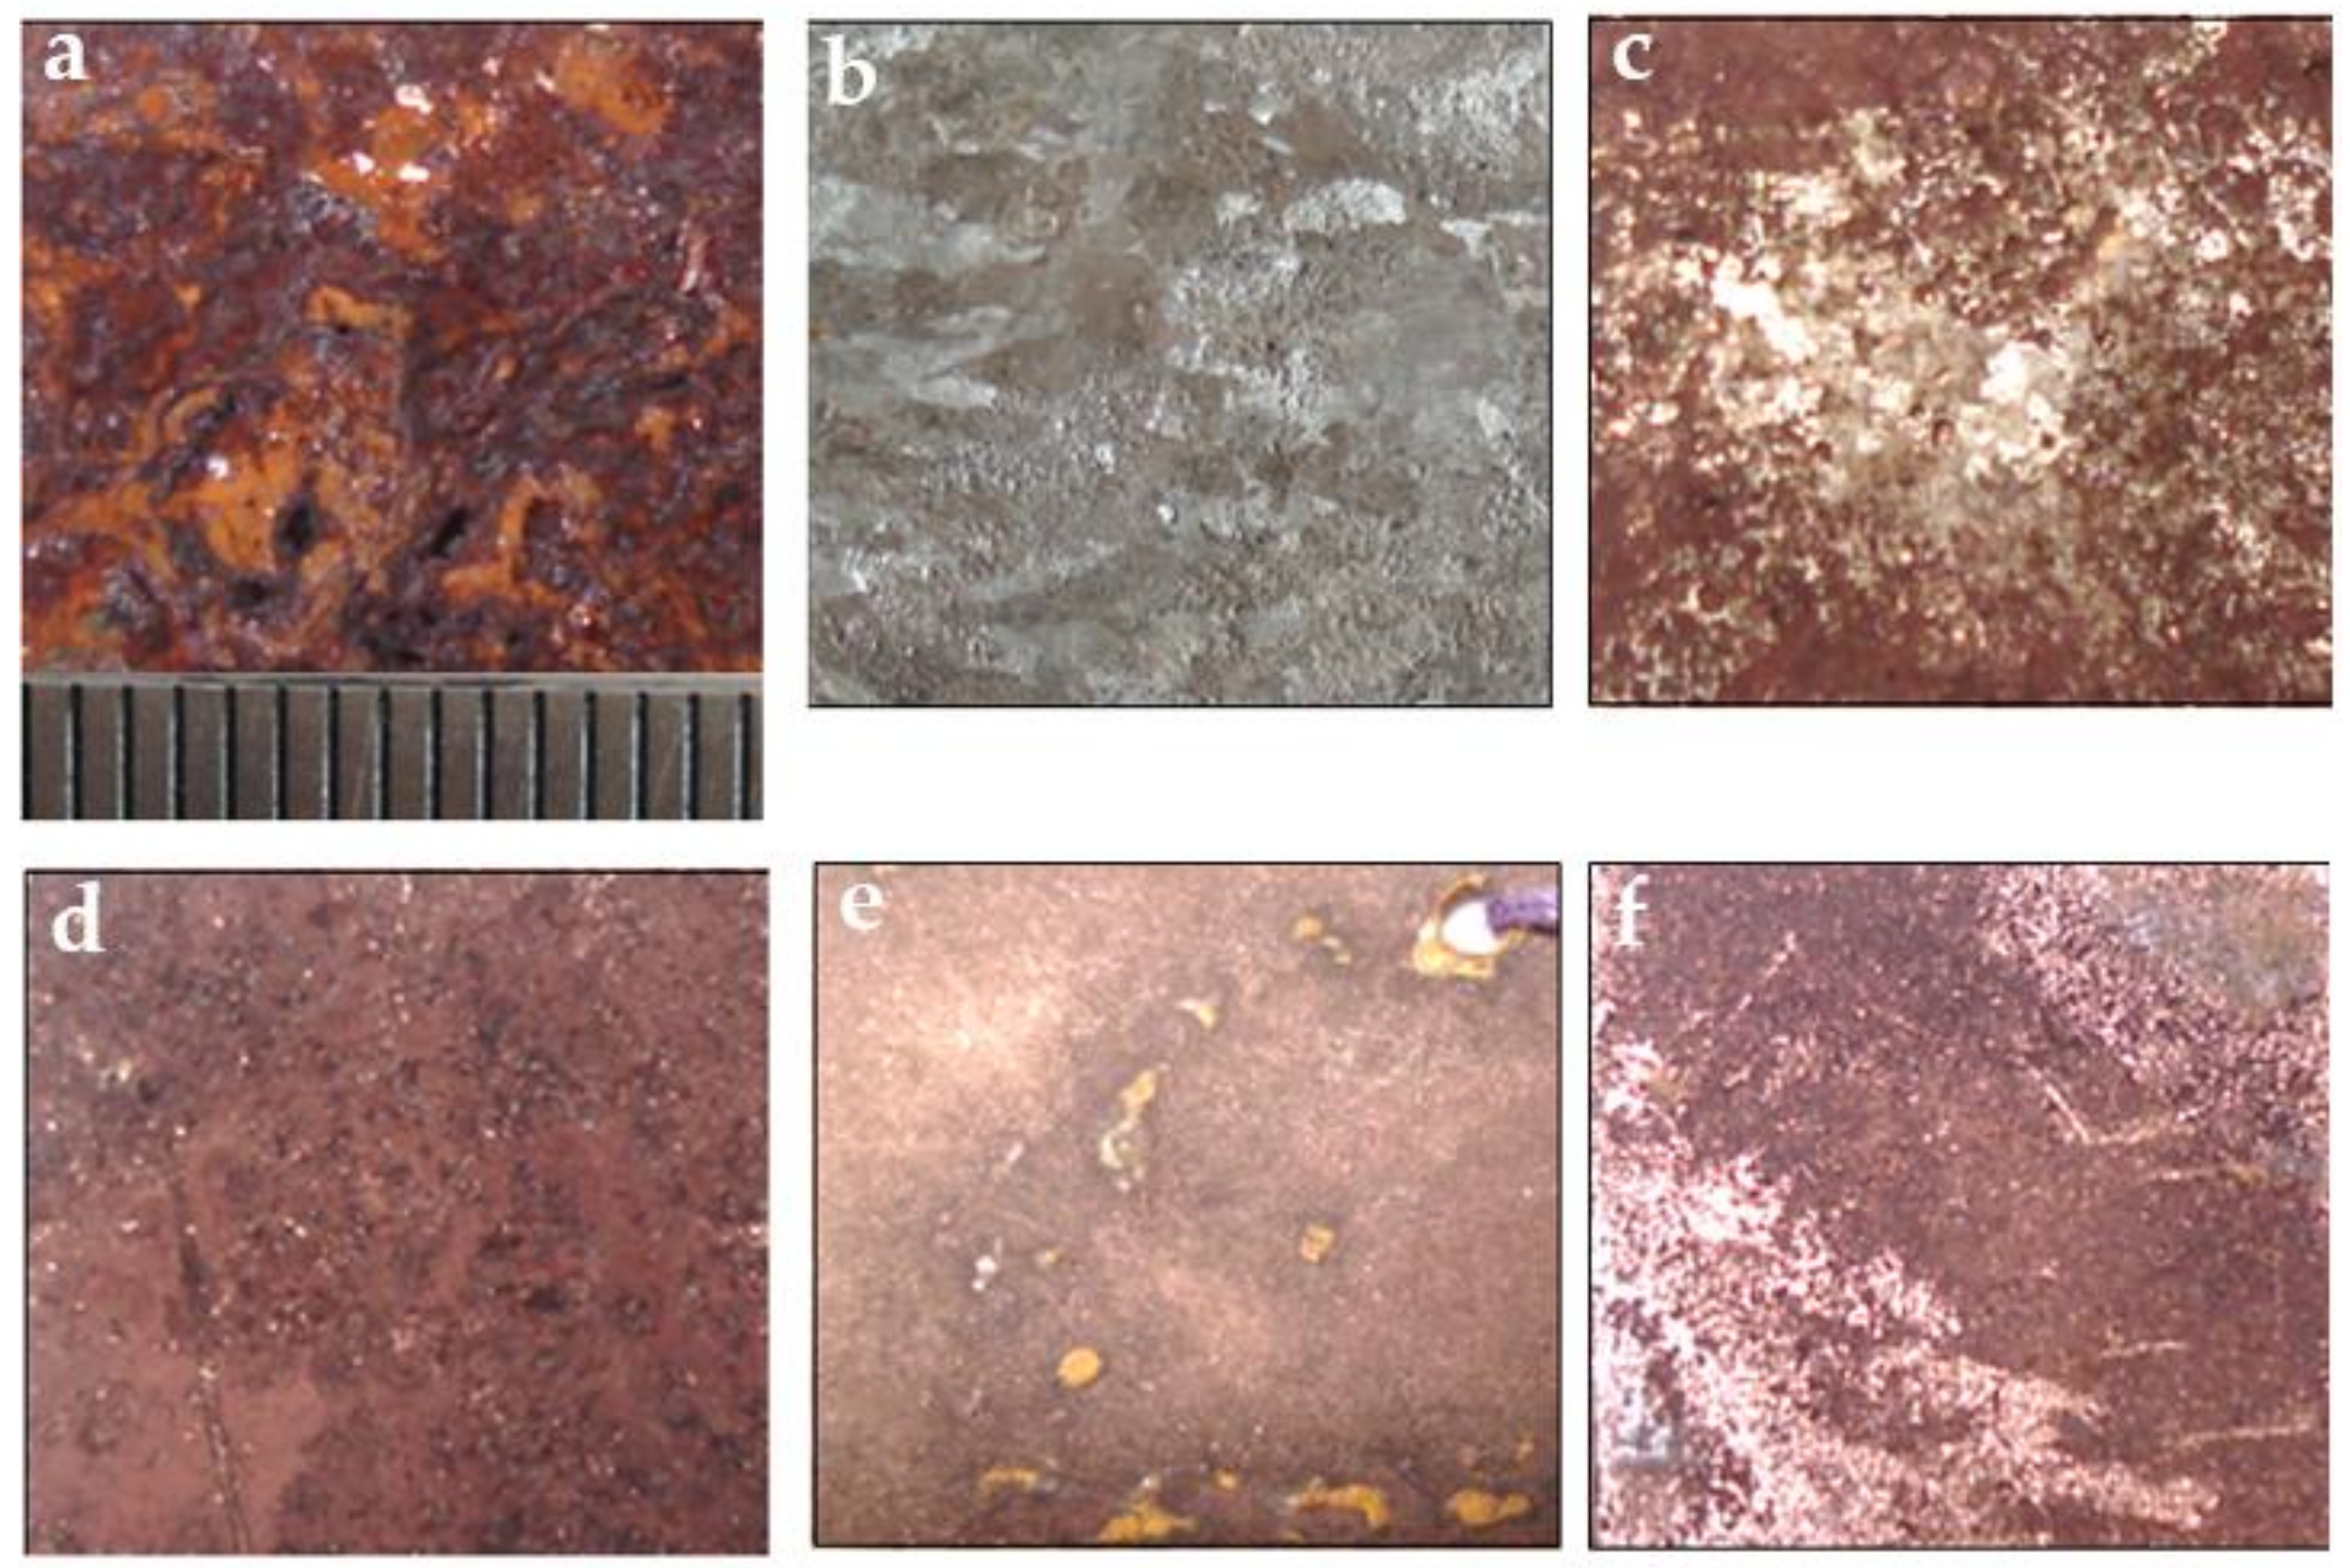
By choosing an appropriate descaling reagent and descaling condition, the rust could be removed while keeping the copper layers, which could be determined by the naked eye because of copper’s distinctive color. Macrographs of the test steels before and after descaling are shown in Figure 5.
Before descaling, there is a thick rust layer on the steel surface, and a typical macro-photograph is shown in Figure 5a. After descaling, the rusts had obviously been removed, as shown in Figure 5b–f. With the increasing of copper content in steel, the copper on the steel surface becomes more and more obvious after rust removal. In order to show the copper layer on the surface of steel 4, the corners of rust removal surface were partially ground with sandpaper as shown in Figure 5f, which shows that the copper layer on the steel surface is dense and closely combined with the matrix.
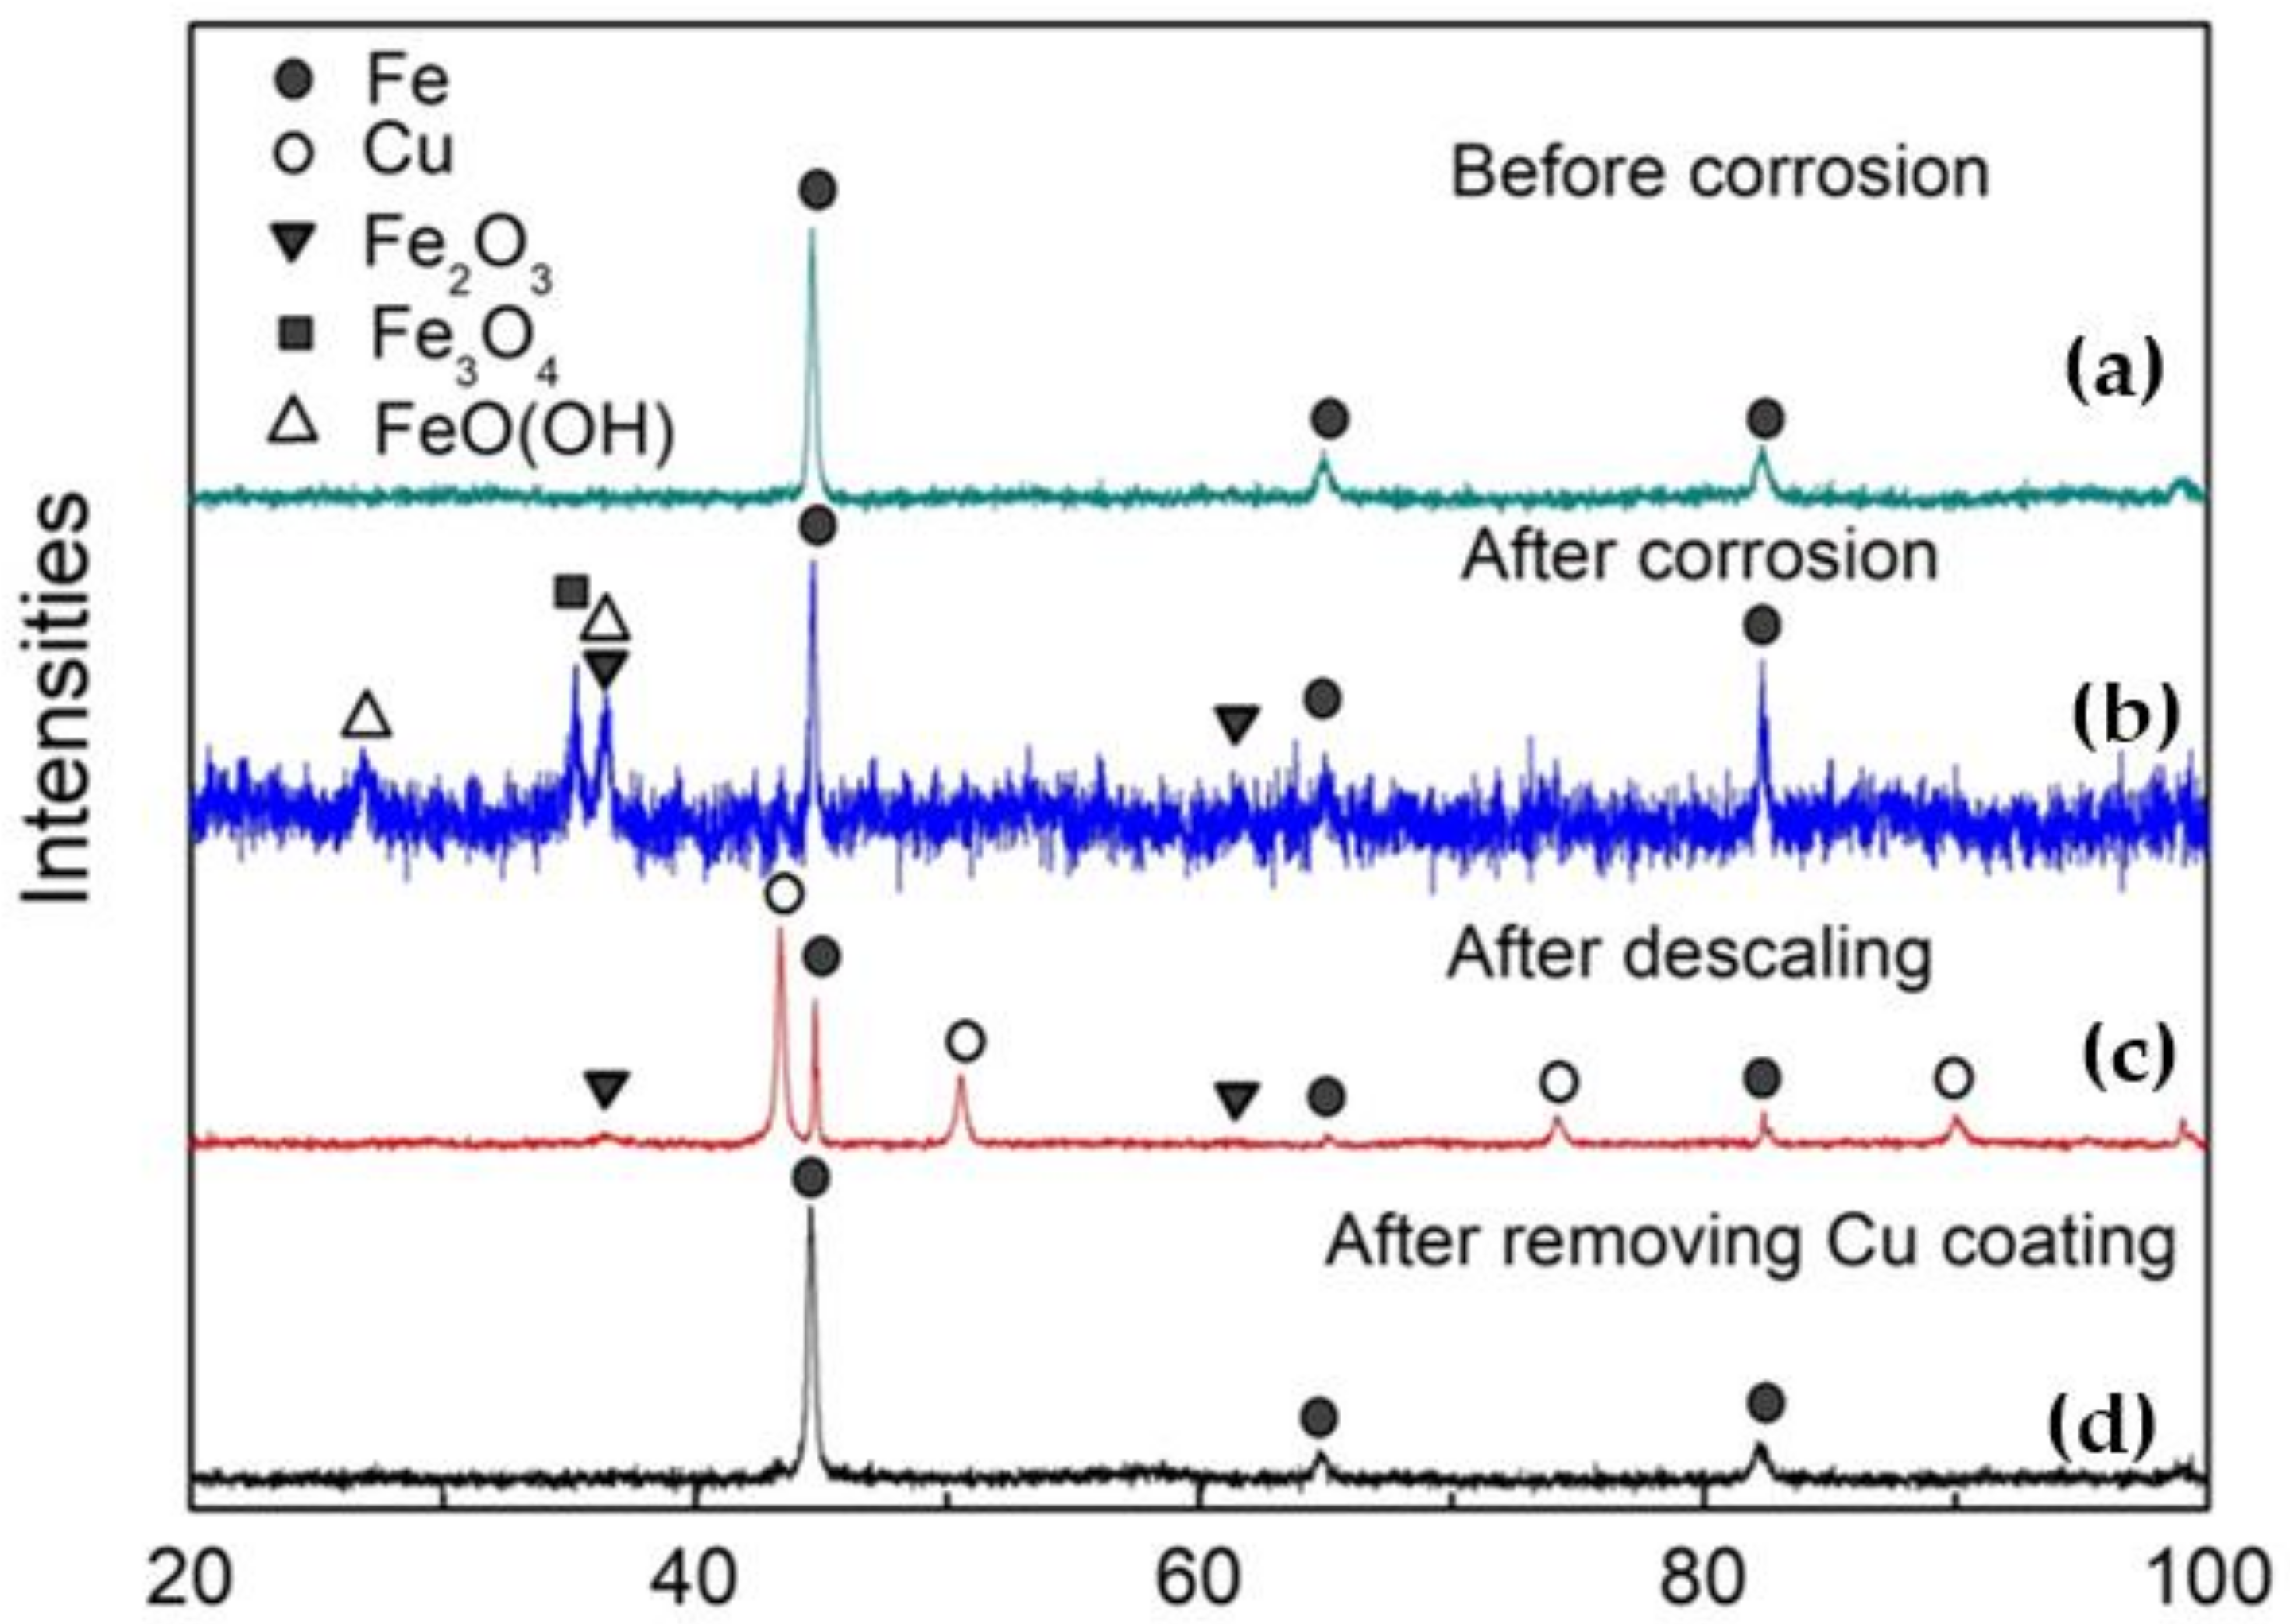
In order to confirm the presence of a pure metallic Cu coating, the XRD analysis results for steel 2 at different stages are shown in Figure 6. Before corrosion, the original material is iron (Figure 6a), where copper should act as solid solution atoms. After corrosion, the surface of steel 2 is covered with a thick rust layer consisting of Fe2O3, Fe3O4, Fe, and FeO(OH), which may include α-FeOOH, γ-FeOOH, and amorphous ferric oxyhydroxide (FeOx(OH)3-2x, x = 0–1) [17,18]. There is little copper or copper oxide present, because these cannot be detected by XRD, as shown in Figure 6b. After descaling, there is approximately 80% Cu and 20% Fe with a small amount of Fe2O3 left on the surface of steel 2, as shown in Figure 6c. These results agree well with that shown in Figure 4.
According to XRD results of all the descaled steel samples, the main contents of the descaled surfaces are pure copper and pure iron, with a small amount of Fe2O3 left. For steel 2, the copper content in the bulk steel is much smaller than that in steel 4, while the composition of the surface after descaling is similar. The higher iron content in the XRD pattern of steel 2 shown in Figure 6c may correspond to a relatively thinner copper coating.
The microstructures of the steel surfaces after descaling were observed using SEM, as shown in Figure 7. Except for steel 1, almost all other steel surfaces were covered with more than 95% copper according to EDS results of steels 2, 3, and 4, which is nearly pure copper, as shown in the XRD results, and the greater amount of iron recognized by the XRD should come from the matrix, as previously mentioned. However, there were some oxides left on the descaled surface according to the XRD results shown in Figure 6. Nevertheless, they were only found in small quantities. The carbon detected by EDS may have come from the microscope chamber, as did some of the oxygen in the spectra, because the EDS tends to over-measure the levels of light elements.
It can also be seen that the copper coating is not very dense for steel 2, as shown in Figure 7b. Thus, further oxidation of the matrix might occur when the corrosion test continues. For steel 4, the copper coating is denser than that of other steels, as shown in Figure 7. The “grain boundary” morphology shown in Figure 7d should come from the copper-rich phase precipitated in the matrix, as shown in Figure 1d. Therefore, the copper content of the “grain boundary” may be a little higher than that of the “grain”.
3.5. Copper Enrichment Mechanisms
3.5.1. Movement of Copper Atoms
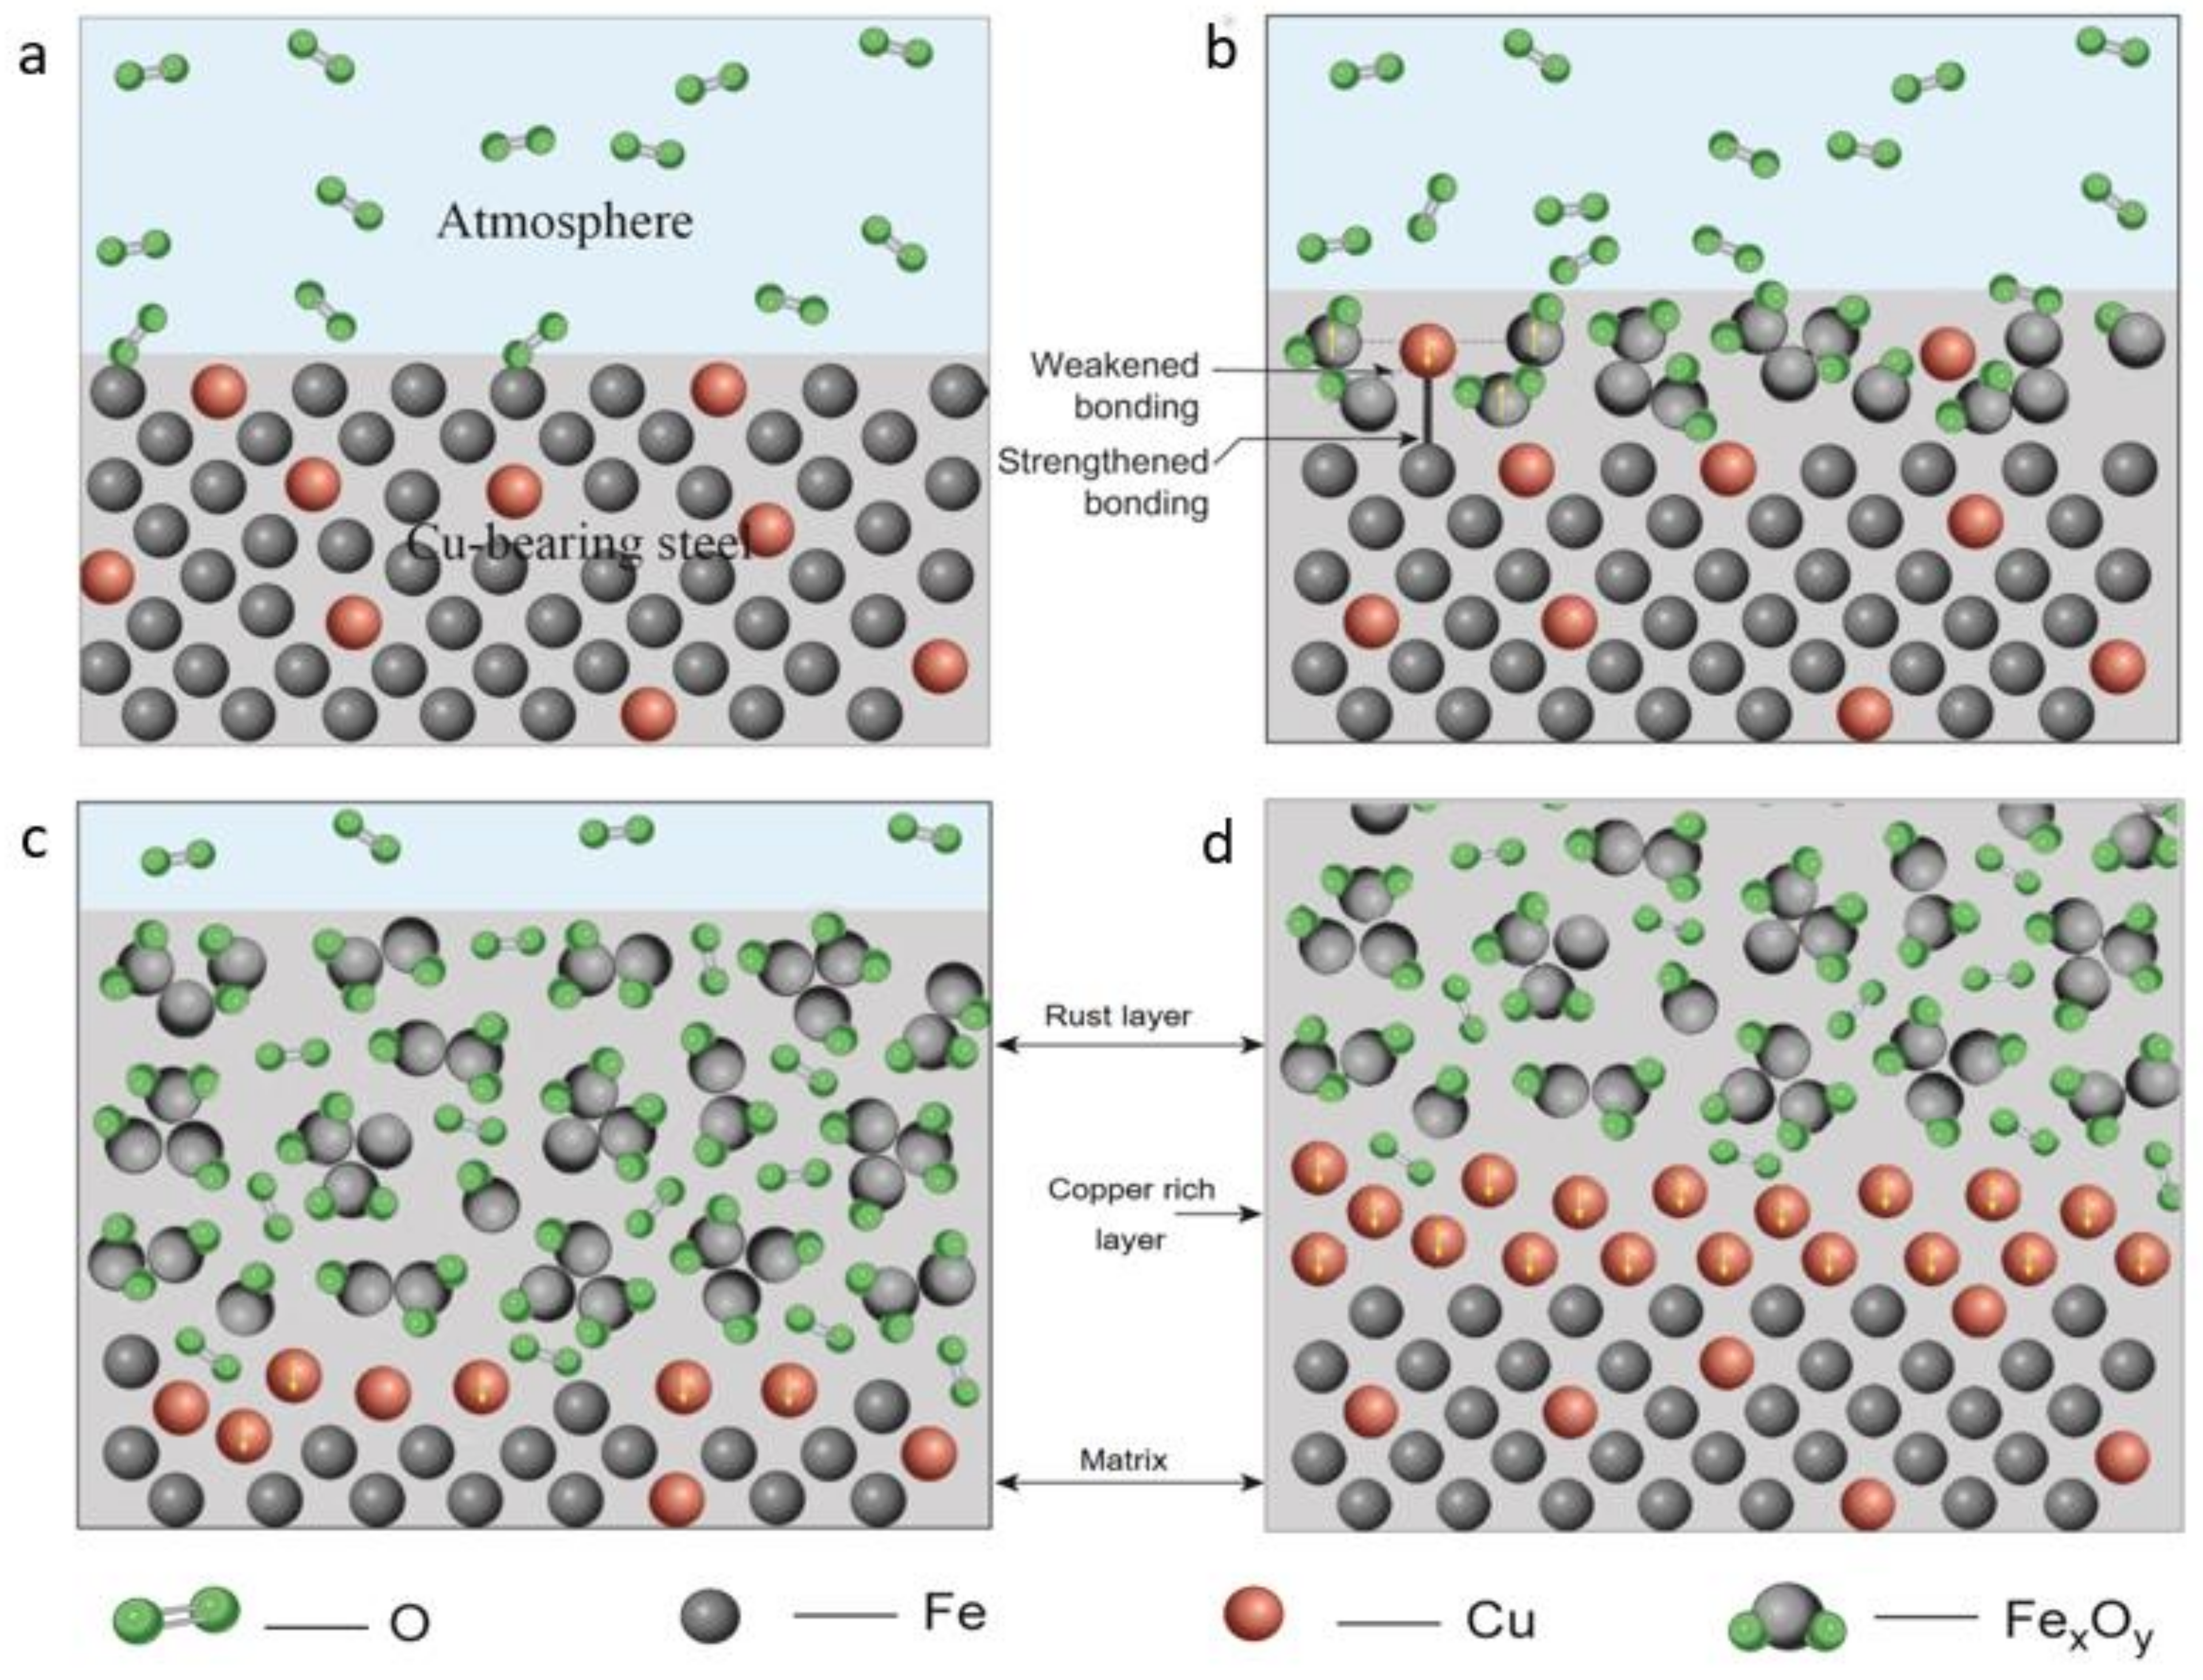
It is well known that the oxidation and corrosion rate of copper is relatively low compared to that of iron. Kondo [19] examined the distribution of copper in the scale of oxidized steel containing copper. The schematic diagram of corrosion and oxidation process of copper-bearing steel is shown in Figure 8. In the corrosion process, oxygen and other atoms tend to combine with iron atoms to form Fe2O3, Fe3O4 and other non-metallic corrosion products, while the combination of oxygen and copper requires higher energy and longer time. The combination of oxygen and iron atoms results in the increase of sample weight [20]. Meanwhile, the volume of the oxide layer expands with the increase of material weight, which indicates that the distance between the compound molecules in the oxide layer and the metal atoms in the matrix increases as shown in Figure 8b. As a result, the binding forces between iron atoms in the oxide molecule and those in the matrix are weakened, sometimes accompanied by some defects [21]. The appearance of defects is more conducive to the oxidation and movement of metal atoms.
Because of different bonds, the bonding force between metallic atoms is stronger than that between metal and oxide. With the formation of oxides on the surface of steel, the binding force between the copper atoms and the surrounding iron oxide molecules is weakened, whereas the bonding force between the copper atoms in the oxide layer and the iron (and/or copper) atoms in the matrix becomes stronger. The metallic atoms would move closer to each other. In Figure 8b, FexOy is used to represent corrosion products. As a result, the copper atoms move continuously from the inner oxide layer to the interface between the oxide and the metal matrix under the action of the resultant force, as shown in Figure 8c. After a period of corrosion, the continuous oxidation of iron atoms and the continuous movement of copper atoms lead to the formation of a certain number of copper atoms on the steel surface, which is macroscopically shown as a copper rich layer (Figure 8d).
In the oxidation process, the iron atoms in the lattice positions of the matrix crystal deviate from their original positions because they combine with oxygen to form ferric oxide. The migration of surrounding iron atoms and the increase of the microcosmic distance due to the weakening of the bonding force between the metal atoms and non-metal molecules is favorable for the directional movement of copper atoms. The oxidation of the matrix surface and diffusion of un-oxidized copper atoms occur at the same time, which form the quasi-layered microstructures of the matrix, copper enrichment layer, and upper rust layer after a period. Therefore, it can be deduced that the copper enrichment layer in the structure originates from the movement of copper atoms in the oxidized surface layer.
When steel is corroded, both iron atoms and solid solution copper atoms in the oxide layer deviate from their atomic lattice position. Under the experimental conditions, most copper atoms have time to move towards the matrix and combine to form a copper-rich phase. From the macroscopic point of view, a layer of “copper coating” has been formed, and the coating is generated by the matrix itself.
The force between the copper atoms moving from the oxide layer to the interface and the iron atoms in the matrix is a metal bond. Thus, there is no bonding problem.
It should be noticed that in the process of corrosion, some defects on the surface of the substrate, such as vacancies, will affect the concentration of copper, and some copper atoms will be immersed in the scale.
3.5.2. Influence Factors
The formation of the quasi-layered structure may be affected by the following factors: the corrosion rate, corrosion time, and copper content in the steel.
The corrosion rate should correspond to the movement speed of the copper atoms in the oxide layer, although the values of these two are difficult to measure at present. If the corrosion rate is very high, the copper atoms are not able to move to the interface, because all the iron atoms around them are quickly oxidized and the copper atoms lose the driving force. Thus, no copper enrichment layer will be formed. However, if the corrosion rate is rather low, the moving velocity of the copper atoms toward the metal matrix may also be very low. In this process, the copper atoms themselves may be oxidized before they form the copper enrichment layer, and the copper atoms inside the metal matrix have no reason to move to the surface at 25 °C. Thus, no copper enrichment layer will be formed in this case either.
The effect of the oxidation time is related to the copper content in the steel. As previously mentioned, the formation of a copper enrichment layer is a process in which copper atoms in the oxide layer keep moving and accumulate on the surface of the matrix. Therefore, the continuous copper enrichment layer on the matrix surface can be formed in a relatively short time if the copper content is high. In contrast, if the copper content is low, the corrosion time will be longer, and the thickness of the oxide layer will be greater, allowing sufficient copper atoms to form a continuous layer of copper, which can explain the early corrosion deceleration stage of steels 3 and 4 in the corrosion weight gain curve shown in Figure 3.
3.6. Electrochemical Corrosion Test
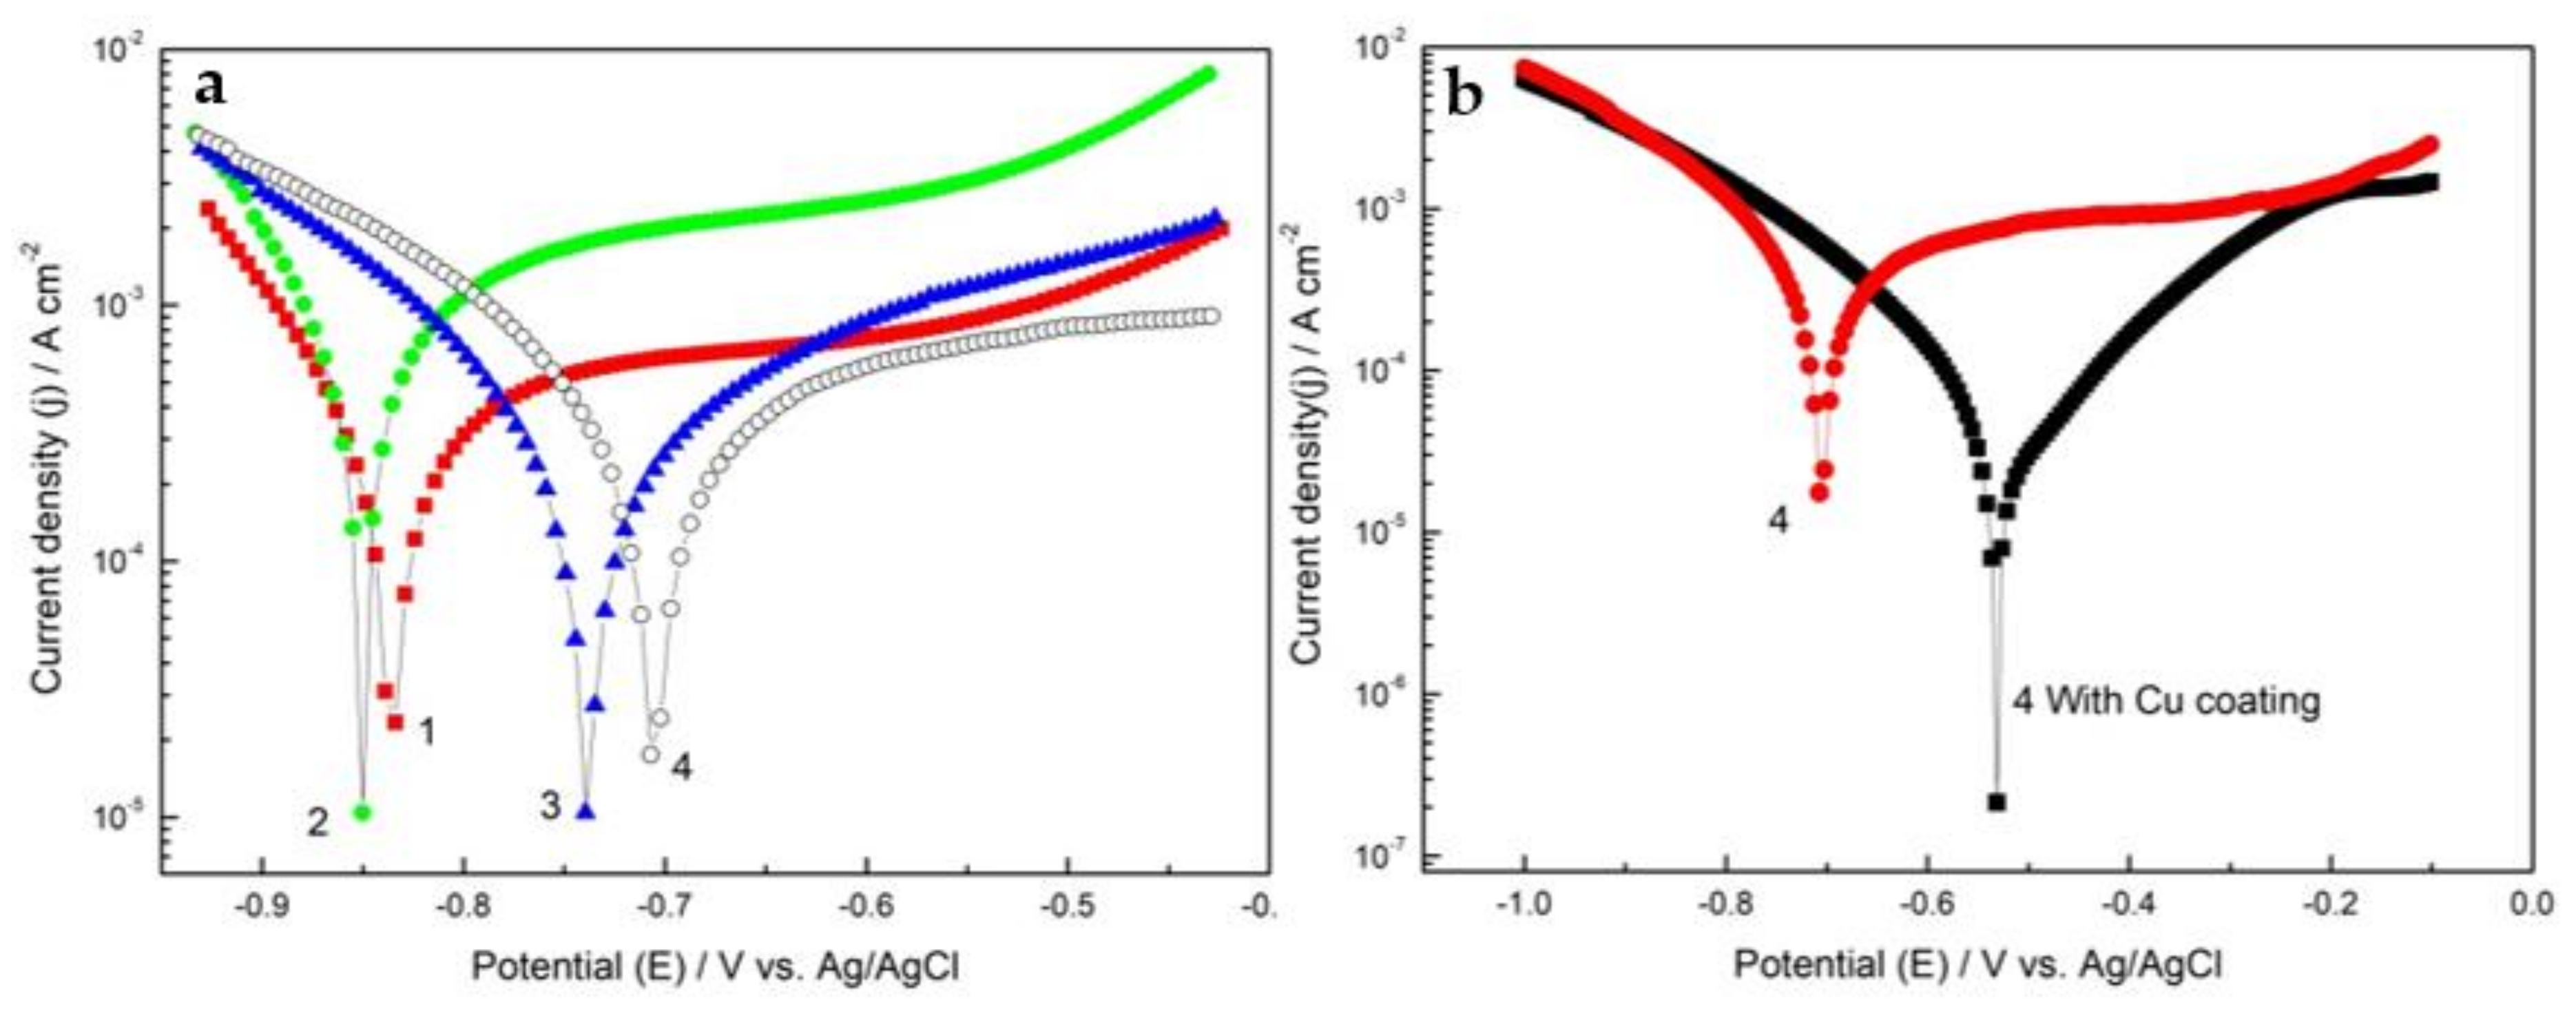
Figure 9 shows the polarization curves of all test steels (a) and steel 4 (b) before corrosion, without Cu coating, and after corrosion and descaling, with Cu coating (under the experimental conditions, only steel 4 shows a complete copper coating), in 3.5% NaCl solution.
The electrochemical parameters Ecorr, Icorr, jcorr, and v were obtained by fitting the curve are listed in Table 2. With the increase of copper content in steel, Ecorr tends to move positively, which implies a better corrosion resistance property. At the same time, when the copper content is high enough, the corrosion current density and corrosion rate of the experimental steel are reduced, and the passivation interval has been extended, which also shows that the corrosion resistance of the steel is improved. Relevant research results also reported that high-copper-bearing steel has excellent corrosion resistance [22].
Ecorr of steel 4 with Cu coating is more positive than that of steel 4 without Cu coating. The OCP of steel 4 with Cu coating shifted significantly to a positive (anodic) direction, suggesting the formation of an efficient barrier for the aggressive medium [23,24].
The polarization potential of the steel treated by corrosion and descaling shifts positively and the corrosion current per unit area is reduced by nearly one order of magnitude, which is similar to the result of polyaniline coating on mild steel [25]. Therefore, the corrosion resistance of Cu-bearing steel can be significantly improved by the copper coating after corrosion and descaling treatment at 25 °C.
4. Conclusions
The corrosion behaviors of copper bearing steels were studied, and the accumulation of copper on the surface of corroded steels after the removal of rust was observed and analyzed. The following conclusions can be made:
(1) Steel with a high copper content (>3%) had a high initial corrosion rate due to its obvious two-phase microstructure. The corrosion rates of all copper bearing steels tended to be smooth after a certain period of corrosion.
(2) A complete copper coating was obtained on the surfaces of the steels after a periodic immersion wet/dry cyclic corrosion test. The oxidation of the matrix and the diffusion of copper atoms at the interface formed a quasi-layered structure consisting of the matrix, copper coating, and upper rust layer.
(3) The copper coating was generated from the matrix itself during the corrosion process at 25 °C. A lower corrosion rate, longer corrosion time, and higher copper content were favorable for the formation of a copper enriched layer.
(4) Copper-bearing steel with copper coating shows better corrosion resistance property.
Author Contributions
Conceptualization, N.L.; methodology, N.L.; validation, L.Y., S.W. and H.Z.; formal analysis, N.L., Z.J.; investigation, H.Z.; resources, L.Y., C.W., H.Z. and F.A.; data curation, L.Y. and C.W.; writing—original draft preparation, N.L.; writing—review and editing, N.L. and Z.J.; supervision, H.Z. and Z.J.; project administration, H.Z.; funding acquisition, N.L., L.Y., C.W. and H.Z. All authors have read and agreed to the published version of the manuscript.
Funding
This research was funded by the State Key Laboratory of Metal Material for Marine Equipment and Application-School of Material and Metallurgy, University of Science and Technology Liaoning co-project, grant number No. SKLMEA-USTL 2017010 and HGSKL-USTLN 201905.
Institutional Review Board Statement
Not applicable.
Informed Consent Statement
Not applicable.
Data Availability Statement
Data is contained within the article.
Acknowledgments
The authors thank Wei Sha from Queen’s University Belfast, UK, for some helpful discussions.
Conflicts of Interest
The authors declare no conflict of interest.
References
- Ramadan, A.; Shash, A.Y.; El-Mahallawi, I.S.; Senk, D.; Mattar, T. Identification of copper precipitates in scrap based recycled low carbon rebar steel. Mater. Des. 2017, 120, 157–169. [Google Scholar] [CrossRef]
- Zhang, X.; Wang, J.; Tang, J.; Tian, Z. Unraveling the multilayer structure formation mechanism of copper coating for the metallization of poly para-phenylene terephthalamide fibers. Colloids Surf. A 2021, 618, 126450. [Google Scholar] [CrossRef]
- Kumar, R.R.; Rajalakshmy, P.; Saranya, M.D.; Kirubakaran, S.; Elwin, J.G.R.; Marichamy, S. Process automation through internet of things on copper coating process of stainless steel. Mater. Today Proc. 2021, 45, 2354–2356. [Google Scholar] [CrossRef]
- Baiocco, G.; Rubino, G.; Ucciardello, N. Pretreatments effects on mechanical and morphological features of copper coatings. Surf. Interfaces 2020, 20, 100625. [Google Scholar] [CrossRef]
- Lv, J.; Wang, Q.; Zhao, J.; Liu, W.; Chen, P.; Liu, H. The difference in the improvement of electrochemical hydrogen storage performance between two methods of coating copper on the surface of Co2B alloy. Chem. Phys. Lett. 2020, 754, 137697. [Google Scholar] [CrossRef]
- Arai, S.; Iwashita, R.; Shimizu, M.; Inoue, J.; Horita, M.; Nagaoka, T.; Itabashi, M. Fabrication of roughened electrodeposited copper coating on steel for dissimilar joining of steel and thermoplastic resin. Metals 2021, 11, 591. [Google Scholar] [CrossRef]
- Paul, H.; Chulist, R.; Mania, I. Structural properties of interfacial layers in tantalum to stainless steel clad with copper interlayer produced by explosive welding. Metals 2020, 10, 969. [Google Scholar] [CrossRef]
- Tam, J.; Li, W.; Yu, B.; Poirier, D.; Legoux, J.G.; Lin, P.; Palumbo, G.; Giallonardo, J.D.; Erb, U. Reducing complex microstructural heterogeneity in electrodeposited and cold sprayed copper coating junctions. Surf. Coat. Technol. 2020, 404, 126479. [Google Scholar] [CrossRef]
- Silva, F.S.; Cinca, N.; Dosta, S.; Cano, I.G.; Guilemany, J.M.; Caires, C.S.A.; Lima, A.R.; Silva, C.M.; Oliveira, S.L.; Caires, A.R.L.; et al. Corrosion resistance and antibacterial properties of copper coating deposited by cold gas spray. Surf. Coat. Technol. 2019, 361, 292–301. [Google Scholar] [CrossRef]
- Singh, S.; Singh, H.; Chaudhary, S.; Buddu, R.K. Effect of substrate surface roughness on properties of cold-sprayed copper coatings on SS316L steel. Surf. Coat. Technol. 2020, 389, 125619. [Google Scholar] [CrossRef]
- Dong, T.; Liu, M.; Feng, Y.; Li, G.; Li, X. Microstructure and properties of a wear resistant Al–25Si–4Cu–1Mg coating prepared by supersonic plasma spraying. Int. J. Min. Met. Mater. 2020, 27, 1287–1294. [Google Scholar] [CrossRef]
- Chen, Y.Y.; Tzeng, H.J.; Wei, L.I.; Wang, L.H.; Oung, J.C.; Shih, H.C. Corrosion resistance and mechanical properties of low-alloy steels under atmospheric conditions. Corros. Sci. 2005, 47, 1001–1021. [Google Scholar] [CrossRef]
- Zeng, L.; Xu, Y.; Zou, Z. Study on normal temperature neutral rust remover for iron and steel. Electroplat. Pollut. Control 1996, 16, 18–20. (In Chinese) [Google Scholar]
- Pan, C.; Lv, W.; Wang, Z.; Su, W.; Wang, C.; Liu, S. Atmospheric corrosion of copper exposed in a simulated coastal-industrial atmosphere. J. Mater. Sci. Technol. 2017, 33, 587–595. [Google Scholar] [CrossRef]
- Li, P.; Zhao, Y.; Liu, Y.; Zhao, Y.; Xu, D.; Yang, C.; Zhang, T.; Gu, T.; Yang, K. Effect of Cu addition to 2205 duplex stainless steel on the resistance against pitting corrosion by the pseudomonas aeruginosa biofilm. J. Mater. Sci. Technol. 2017, 33, 723–727. [Google Scholar] [CrossRef]
- Pilling, N.B.; Bedworth, R.E. The oxidation of metals at high temperatures. J. Inst. Met. 1923, 29, 529–591. [Google Scholar]
- Kim, K.T.; Tsuchiya, H.; Hanaki, K.; Yamashita, M.; Fujimoto, S. Effect of cations on protective properties of rust layer formed on carbon steel during wet/dry cyclic corrosion. Mater. Trans. 2020, 61, 506–514. [Google Scholar] [CrossRef]
- Zhang, Q.C.; Wu, J.S.; Wang, J.J.; Zheng, W.L.; Chen, J.G.; Li, A.B. Corrosion behavior of weathering steel in marine atmosphere. Mater. Chem. Phys. 2002, 77, 603–608. [Google Scholar] [CrossRef]
- Yasumitsu, K. Behaviour of copper during high temperature oxidation of steel containing copper. ISIJ Int. 2004, 44, 1576–1580. [Google Scholar]
- Li, N.; Jia, R.; Zhang, H.; Sha, W.; Li, Y.; Jiang, Z. In-situ Cu coating on steel surface after oxidizing at high temperature. Materials 2019, 12, 3536. [Google Scholar] [CrossRef] [Green Version]
- Yang, F.; Choi, Y.M.; Liu, P.; Stacchiola, D.; Hrbek, J.; Rodriguez, J.A. Identification of 5-7 defects in a copper oxide surface. J. Am. Chem. Soc. 2011, 133, 11474–11477. [Google Scholar] [CrossRef]
- Liu, H.; Teng, Y.; Guo, J.; Li, N.; Wang, J.; Zhou, Z.; Li, S. Corrosion resistance and corrosion behavior of high-copper-bearing steel in marine environments. Mater. Corros. 2021, 72, 816–828. [Google Scholar] [CrossRef]
- Shabani-Nooshabadi, M.; Allahyary, E.; Jafari, Y. Electrosynthesis of poly(ortho-phenetidine) coatings on steel and investigation of their corrosion protection properties. Prot. Met. Phys. Chem. Surf. 2018, 54, 104–112. [Google Scholar] [CrossRef]
- Aigbodion, V.S. Morphological and electrochemical behavior of epoxy –activated orange juice functionalized rice husk nanoparticles composite coating on mild steel. Chem. Data Collect. 2020, 29, 100526. [Google Scholar] [CrossRef]
- Gupta, D.; Neupane, S.; Singh, S.; Karki, N.; Yadav, A. The effect of electrolytes on the coating of polyaniline on mild steel by electrochemical methods and its corrosion behavior. Prog. Org. Coat. 2021, 152, 106127. [Google Scholar] [CrossRef]
Figure 1.
Optical micrographs of Cu-bearing steel 1 (a), steel 2 (b), steel 3 (c), and steel 4 (d). The etchant was 4% nital.
Figure 1.
Optical micrographs of Cu-bearing steel 1 (a), steel 2 (b), steel 3 (c), and steel 4 (d). The etchant was 4% nital.

Figure 2.
SEM (scanning electron microscope) image and EDS (energy dispersive X-ray spectroscopy) results of steel 4.
Figure 2.
SEM (scanning electron microscope) image and EDS (energy dispersive X-ray spectroscopy) results of steel 4.

Figure 3.
Corrosion behavior (weight gain per unit area in early (Ⅰ), middle (Ⅱ), and late (Ⅲ) corrosion stage) of Cu-bearing steels.
Figure 3.
Corrosion behavior (weight gain per unit area in early (Ⅰ), middle (Ⅱ), and late (Ⅲ) corrosion stage) of Cu-bearing steels.

Figure 4.
Optical microscope picture of inclined cross section of steel 1 (a), 2 (b), 3 (c), and 4 (d) after corrosion.
Figure 4.
Optical microscope picture of inclined cross section of steel 1 (a), 2 (b), 3 (c), and 4 (d) after corrosion.

Figure 5.
Macro-photograph of corrosion samples before (a) and after descaling (b) for steel 0, (c) for steel 1, (d) for steel 2, (e) for steel 3, and (f) for steel 4.
Figure 5.
Macro-photograph of corrosion samples before (a) and after descaling (b) for steel 0, (c) for steel 1, (d) for steel 2, (e) for steel 3, and (f) for steel 4.

Figure 6.
XRD patterns on the surface of steel 2 under different conditions (before corrosion (a), after corrosion (b), after descaling (c) and after removing Cu coating (d)).
Figure 6.
XRD patterns on the surface of steel 2 under different conditions (before corrosion (a), after corrosion (b), after descaling (c) and after removing Cu coating (d)).

Figure 7.
SEM (a) for steel 1, (b) for steel 2, (c) for steel 3, and (d) for steel 4 micrographs on steel surface after descaling.
Figure 7.
SEM (a) for steel 1, (b) for steel 2, (c) for steel 3, and (d) for steel 4 micrographs on steel surface after descaling.

Figure 8.
Schematic diagram of copper enrichment mechanism. (a) Before corrosion, (b) initial stage of corrosion, (c) after a short period of corrosion, and (d) after a long period of corrosion.
Figure 8.
Schematic diagram of copper enrichment mechanism. (a) Before corrosion, (b) initial stage of corrosion, (c) after a short period of corrosion, and (d) after a long period of corrosion.

Figure 9.
Potentiodynamic polarization curves of all test steels (a) and steel No.4 with Cu coating (b) in 3.5% NaCl solution.
Figure 9.
Potentiodynamic polarization curves of all test steels (a) and steel No.4 with Cu coating (b) in 3.5% NaCl solution.


Table 1.
Chemical composition of test steel (in wt%).
| Steel No. | C | Cu | Si | Mn | P | S | Fe |
|---|---|---|---|---|---|---|---|
| 0 | 0.005 | 0 | 0.030 | 0.046 | 0.010 | 0.007 | Bal |
| 1 | 0.006 | 1.900 | 0.020 | 0.045 | 0.010 | 0.006 | Bal |
| 2 | 0.001 | 2.380 | 0.018 | 0.035 | 0.010 | 0.007 | Bal |
| 3 | 0.004 | 6.800 | 0.030 | 0.037 | 0.008 | 0.007 | Bal |
| 4 | 0.001 | 12.640 | 0.056 | 0.064 | 0.009 | 0.007 | Bal |
Table 2.
Electrochemical parameters of test steels.
| Steel No. | Corrosion Rate v/(g·m2·h−1) | |||
|---|---|---|---|---|
| 1 | 2.13 × 10⁻⁴ | 2.66 × 10⁻⁴ | −0.83 | 1.8534 |
| 2 | 3.26 × 10⁻⁴ | 4.08 × 10⁻⁴ | −0.85 | 2.8376 |
| 3 | 1.16 × 10⁻⁴ | 1.44 × 10⁻⁴ | −0.66 | 1.0056 |
| 4 | 1.67 × 10⁻⁴ | 2.09 × 10⁻⁴ | −0.70 | 1.4542 |
| 4 with Cu coating | 1.90 × 10⁻⁵ | 2.38 × 10⁻⁵ | −0.53 | 0.1324 |
Publisher’s Note: MDPI stays neutral with regard to jurisdictional claims in published maps and institutional affiliations. |
© 2021 by the authors. Licensee MDPI, Basel, Switzerland. This article is an open access article distributed under the terms and conditions of the Creative Commons Attribution (CC BY) license (https://creativecommons.org/licenses/by/4.0/).
Share and Cite
MDPI and ACS Style
Li, N.; Yan, L.; Wang, S.; Wang, C.; Zhang, H.; Ai, F.; Jiang, Z. Corrosion Behavior of Copper Bearing Steels and the Derived In-Situ Coating. Metals 2021, 11, 1462. https://doi.org/10.3390/met11091462
AMA Style
Li N, Yan L, Wang S, Wang C, Zhang H, Ai F, Jiang Z. Corrosion Behavior of Copper Bearing Steels and the Derived In-Situ Coating. Metals. 2021; 11(9):1462. https://doi.org/10.3390/met11091462
Chicago/Turabian StyleLi, Na, Ling Yan, Shaodong Wang, Changshun Wang, Hongmei Zhang, Fangfang Ai, and Zhengyi Jiang. 2021. "Corrosion Behavior of Copper Bearing Steels and the Derived In-Situ Coating" Metals 11, no. 9: 1462. https://doi.org/10.3390/met11091462
Note that from the first issue of 2016, this journal uses article numbers instead of page numbers. See further details here.