
Predicting Susceptibility to Solidification Cracking and Liquation Cracking by CALPHAD

Department of Materials Science and Engineering, University of Wisconsin, Madison, WI 53706, USA
Metals 2021, 11(9), 1442; https://doi.org/10.3390/met11091442
Submission received: 10 August 2021
/
Revised: 3 September 2021
/
Accepted: 9 September 2021
/
Published: 11 September 2021
(This article belongs to the Special Issue Calphad Tools for the Metallurgy of Solidification)
Abstract
:In welding, liquation cracking can occur in the partially melted zone, leaving open cracks along the edge of the weld bead. Likewise, solidification cracking can occur in the mushy zone, leaving open cracks inside the weld bead (which is called the weld metal or fusion zone). The present study aims at demonstrating that CALPHAD-based modeling can help predict the susceptibility of alloys to both types of cracking. The basic relationship between temperature T and the fraction of solid fS of an alloy can be calculated using thermodynamic software and a database based on the alloy composition. For liquation cracking the T-fS curve of the weld metal can be compared with that of the workpiece to assess the susceptibility. For solidification cracking, on the other hand, the T-(fS)1/2 curve of the weld metal can be used to calculate the susceptibility. The composition of the weld metal depends on the compositions of the workpiece and the filler metal, and the percentage of the workpiece in the weld metal (called dilution). The susceptibility predictions based on these curves and comparison with welding experiments will be demonstrated using Al alloys, Mg alloys, and carbon steels as examples.
1. Introduction
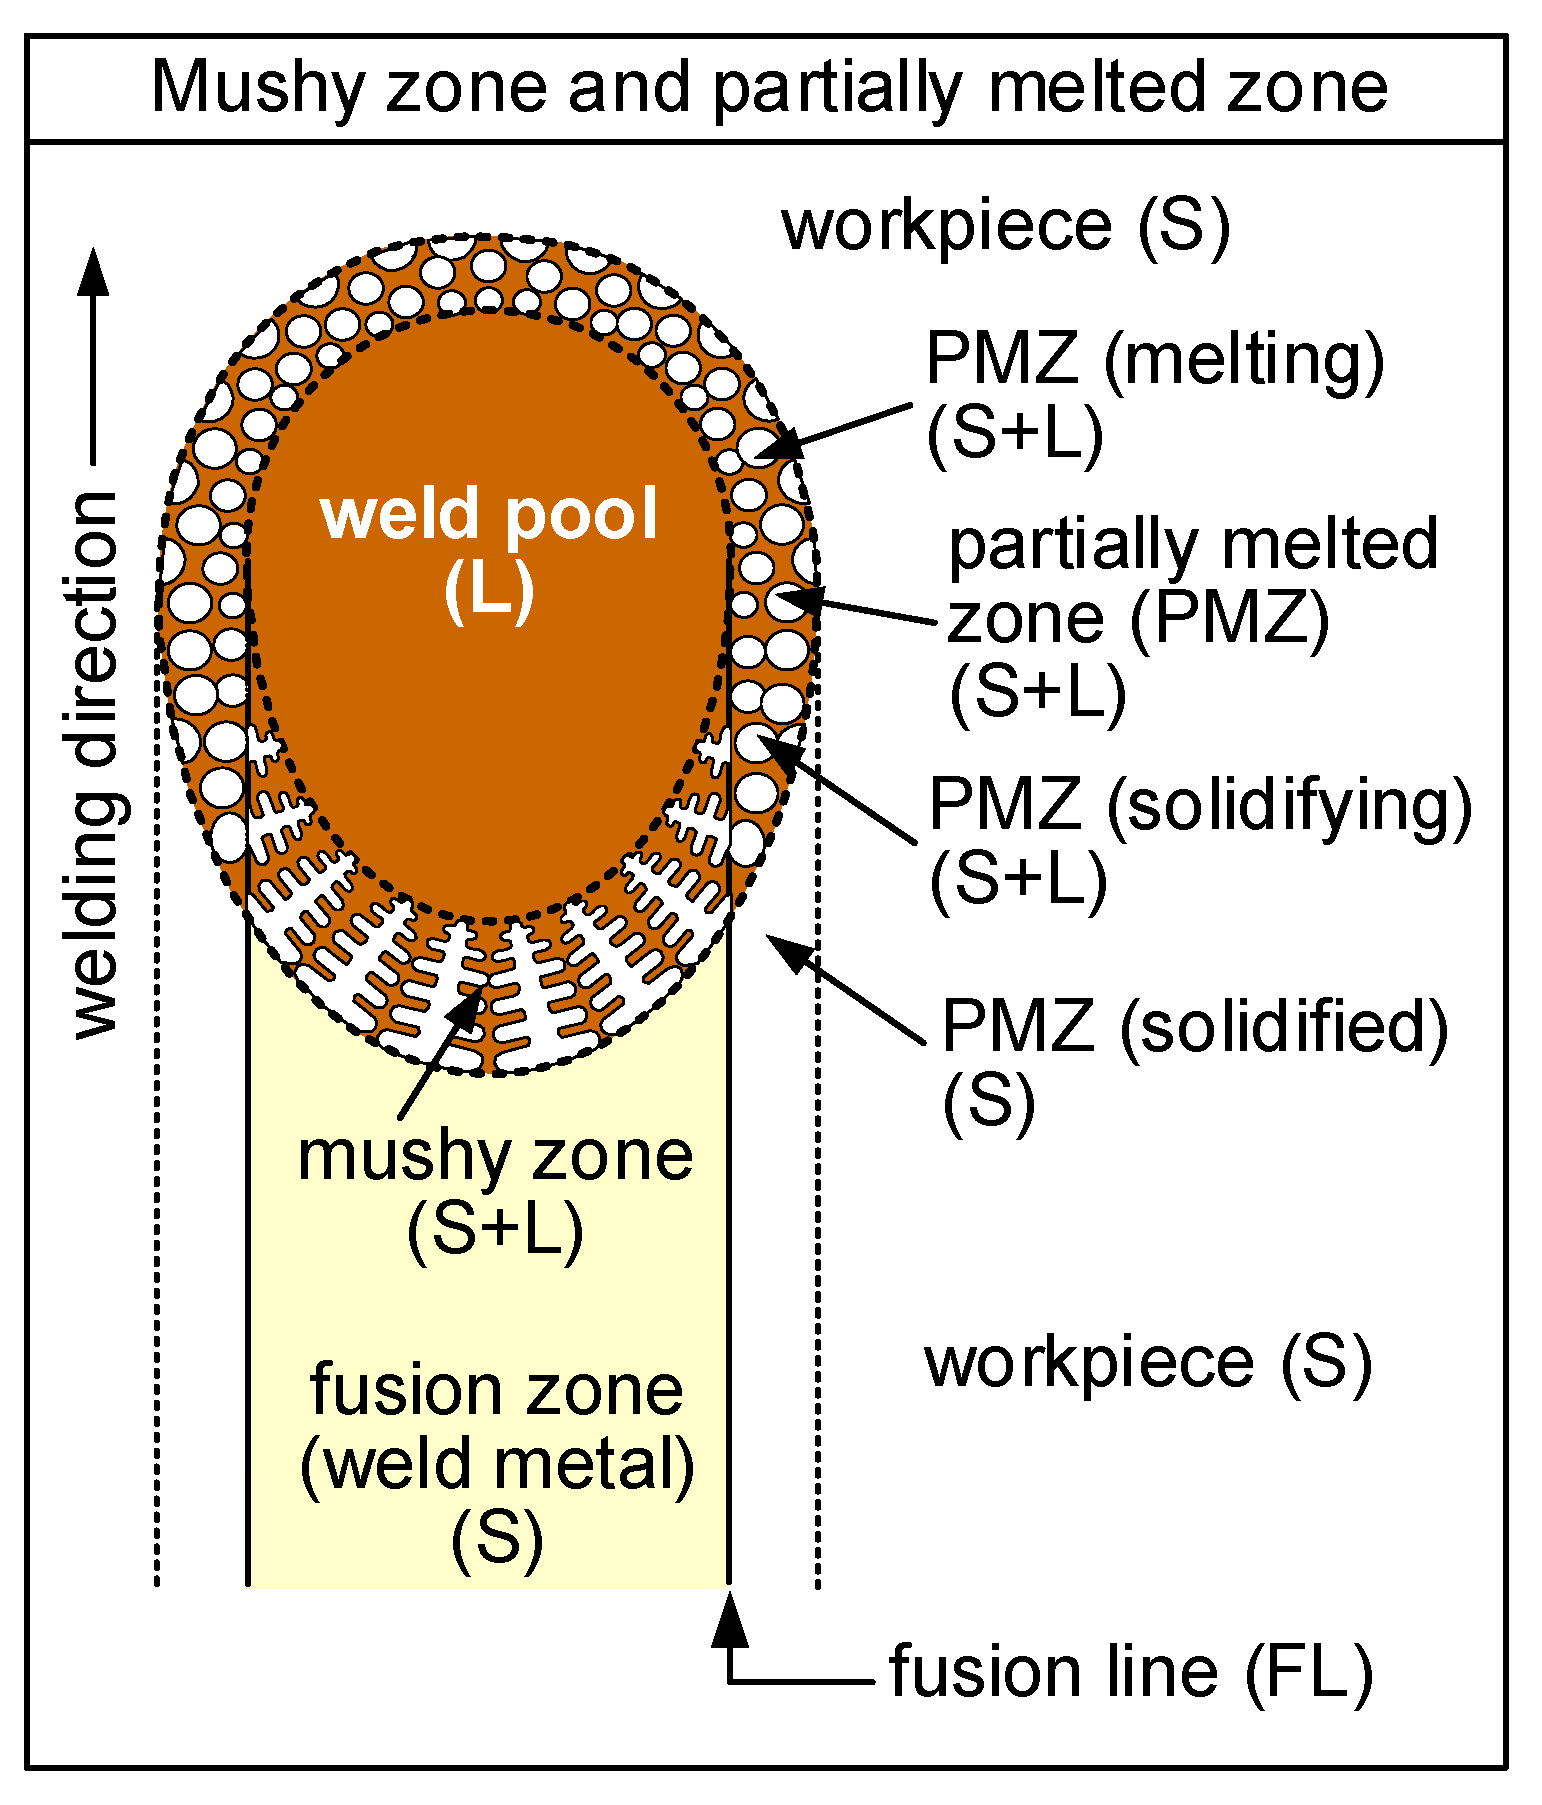
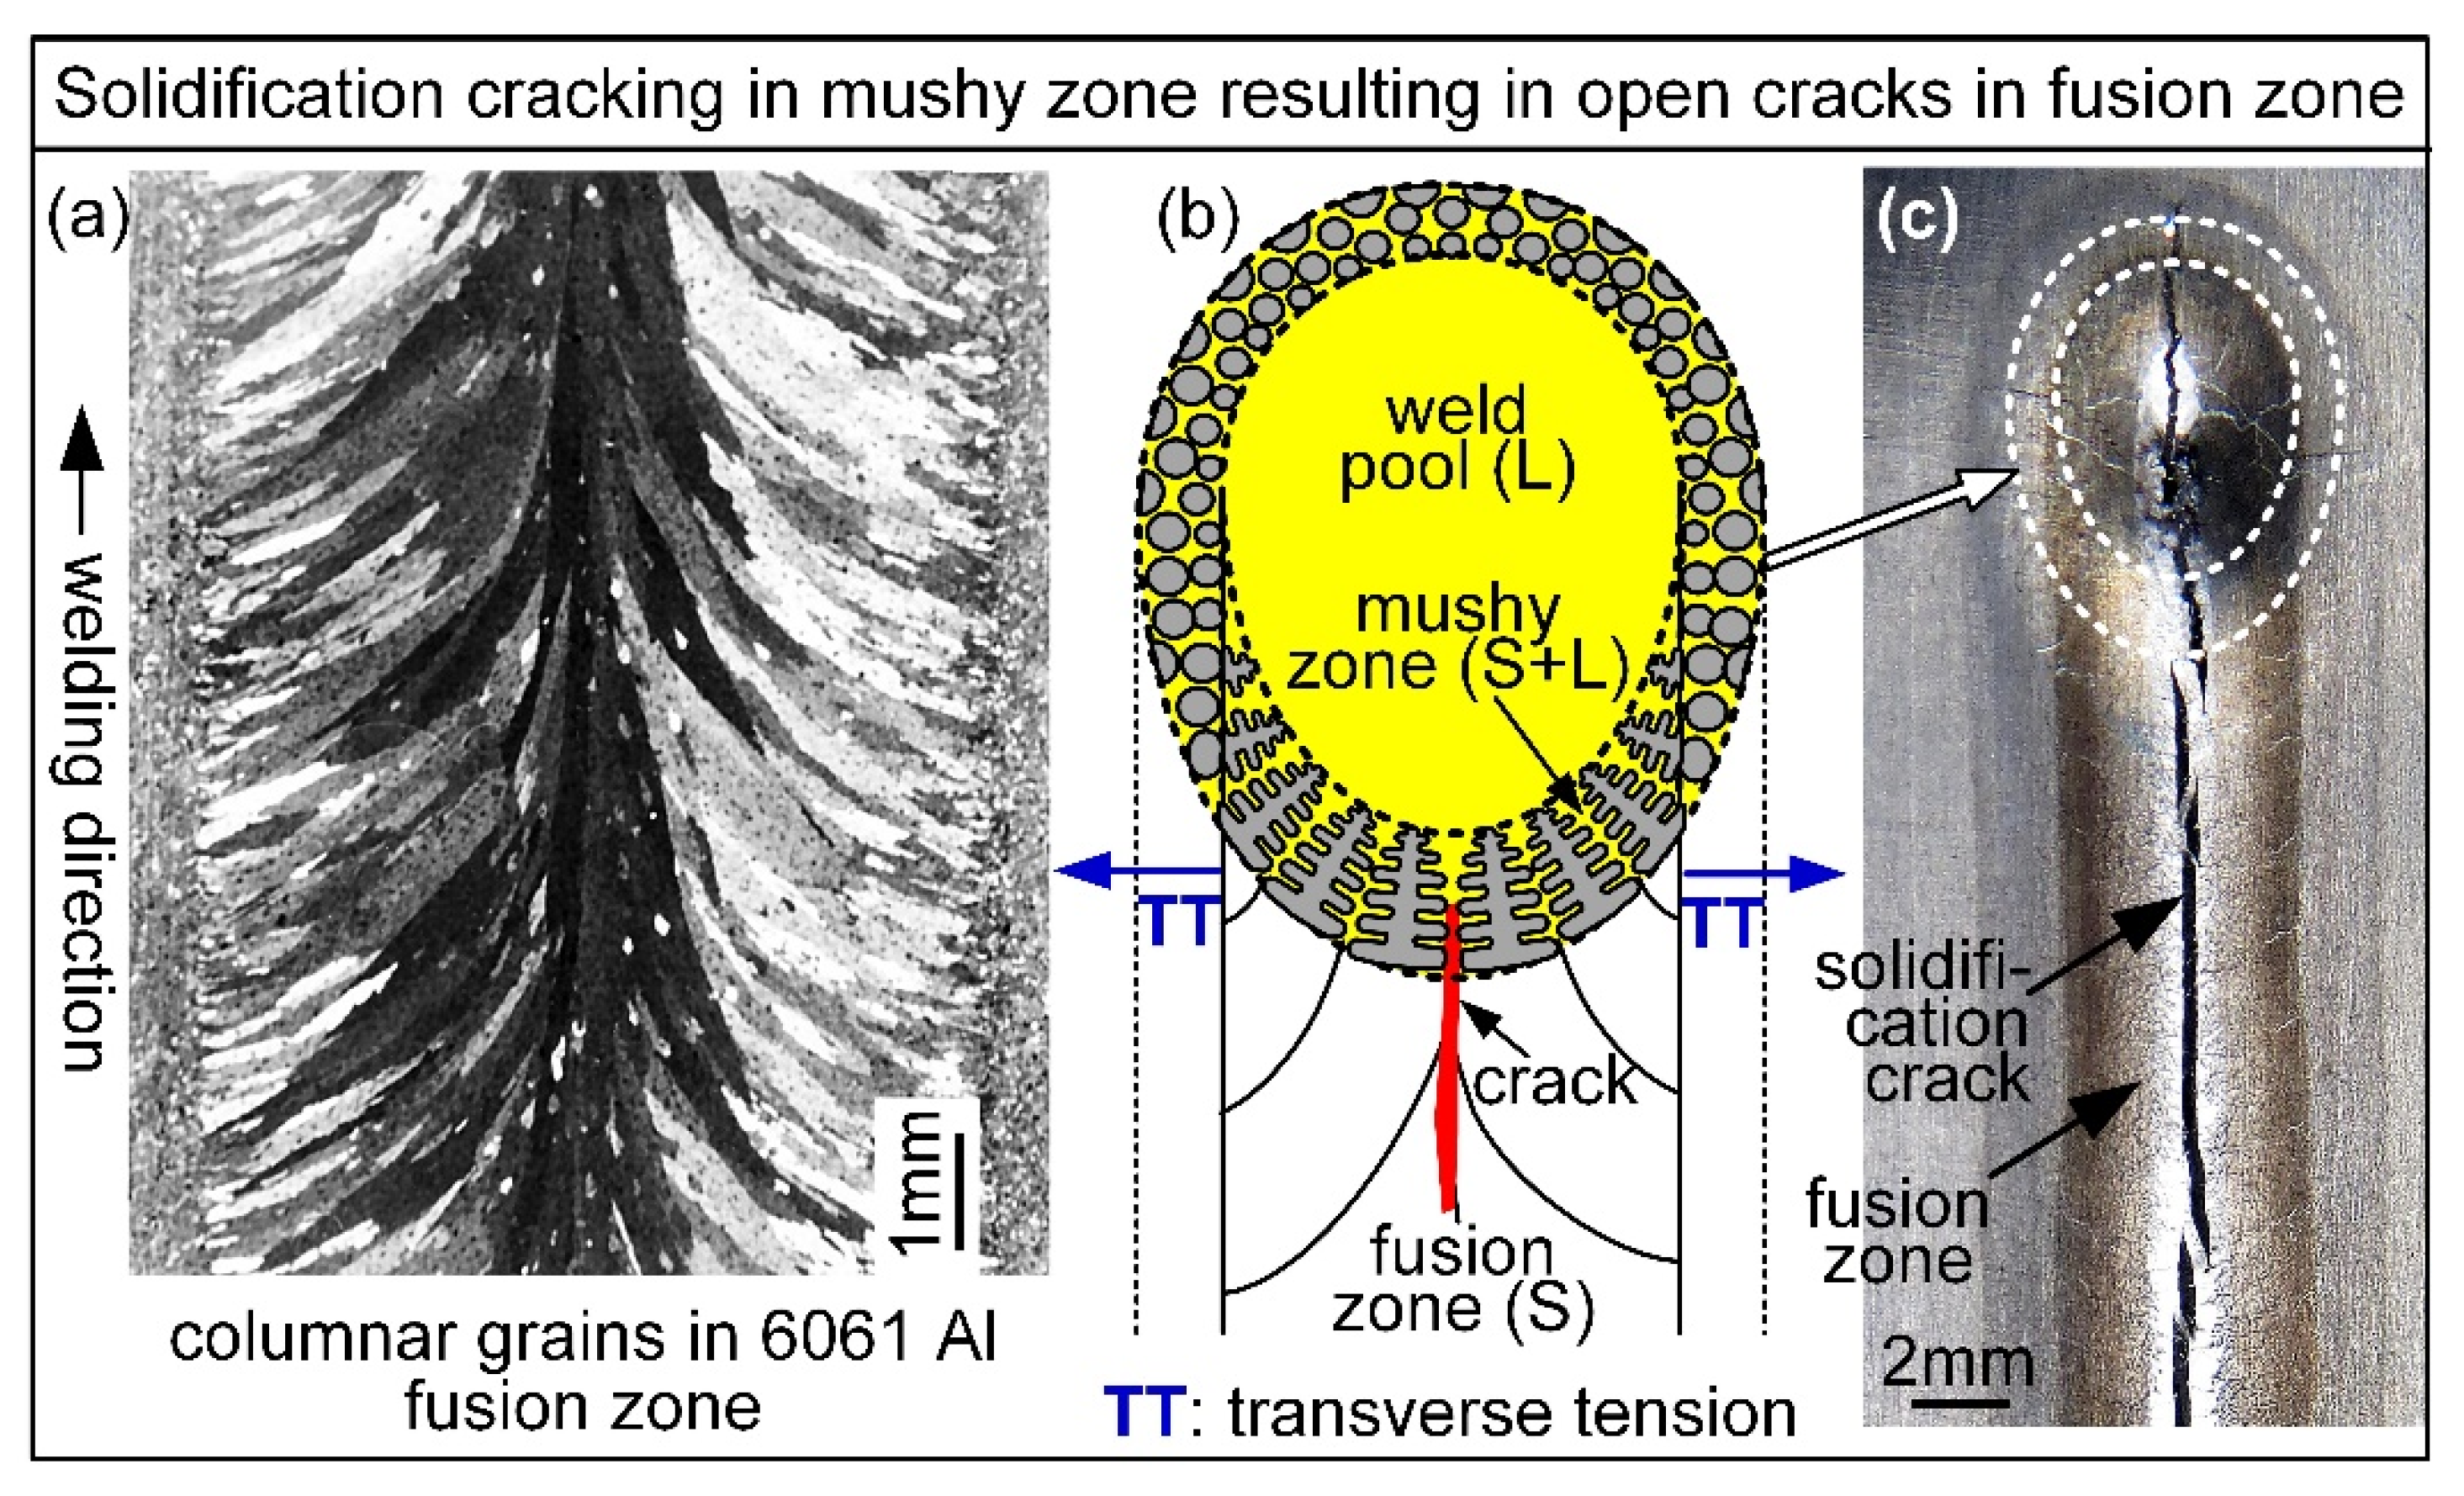
An alloy melts and solidifies over a temperature range, in which it exists in a weak semisolid state. As illustrated in Figure 1, during welding of an alloy there exists a semisolid region (S + L) between the weld pool (L) and the surrounding solid (S) [1]. The mushy zone is the semisolid region behind the weld pool, in which dendrites (usually columnar) grow essentially normal to the trailing portion of the pool boundary. The mushy zone is cooling, solidifying, and contracting. Solidification shrinkage (solid density > liquid density) and thermal contraction (thermal expansion coefficient) cause the mushy zone to contract during cooling, but its free contraction is obstructed by the much larger, stronger and cooler workpiece it is connected to. Consequently, transverse tension is induced in the mushy zone. Intergranular cracking can occur in the mushy zone along the grain-boundary liquid, that is, solidification cracking. Solidification cracking often occurs near the mushy-zone centerline, where columnar grains grow essentially in the welding direction, normal to the transverse tension.
The partially melted zone (PMZ) is the portion of the semisolid that is around but not behind the weld pool [1]. Melting occurs in the leading portion of the PMZ, that is, grains (usually equiaxed) in the workpiece are melted upon heating. Solidification, on the other hand, occurs in the trailing portion of the PMZ, that is, the partially melted grains grow upon cooling. The inside of the trailing portion of the PMZ is connected to the mushy zone at the fusion line, and the outside to the solidified PMZ and the workpiece. Thus, the cooling/contracting mushy zone can induce tension in the PMZ, which is connected to the solidified PMZ and the workpiece and thus cannot shrink freely. Consequently, intergranular cracking can occur in the PMZ along the grain-boundary liquid. This is called liquation cracking because it is associated with liquation (liquid formation) along grain boundaries in the workpiece. Liquation cracking often occurs near the fusion line, i.e., the weld edge, where most grain-boundary liquid exists to separate and thus weaken the grains in the PMZ.
Regarding liquation cracking in the PMZ, Gittos and Scott [2] welded 6082 Al (Al-0.7 Mg-0.9 Si) with filler metals NG61 (Al-5.2 Mg, close to 5356 Al) and NG21 (Al-5Si, close to 4043 Al) using the circular-patch test. It was suggested that liquation cracking occurs if the weld-metal solidus temperature is higher than the base-metal solidus temperature. Katoh et al. [3], Kerr et al. [4], and Miyazaki et al. [5] investigated the effect of weld-metal composition on liquation cracking in welds of 6000-series Al alloys including 6061 Al. Contrary to Gittos and Scott [2], however, Miyazaki et al. [5] found that the weld-metal solidus temperature was lower than the base-metal solidus temperature when liquation cracking occurred regardless the filler metal was 5356 Al or 4043 Al.
Instead of using the solidus temperatures like Gittos and Scott [2], Huang and Kou [6] used the fraction solid to assess the susceptibility to liquation cracking in 2219 Al (Al6.3-Cu). This is because non-equilibrium solidification exists in welding alloys containing substitutional solutes and the solidus temperature is not relevant. Huang and Kou [6] showed that the susceptibility to liquation cracking can be predicted by comparing the curve of temperature T vs. the fraction of solid fS for the weld metal and the curve for the PMZ [6,7]. They demonstrated that liquation cracking can occur when the weld-metal T-fS curve crosses over the PMZ T-fS curve.
As for solidification cracking, many theories were developed for cracking during solidification. Lippold [8] reviewed the following five theories of hot tearing or solidification cracking: the shrinkage-brittleness theory of Pumphrey and Jennings [9], the strain theory of Apblett and Pellini [10], the generalized theory of Borland [11], the modified generalized theory of Matsuda et al. [12], the technological strength theory of Prokhorov [13], and the vulnerable-range theory of Clyne and Davies [14].
The theory of Rappaz, Drezet, and Gremaud (the RDG model) [15] was the most widely cited theory for cracking during solidification since it was developed in 1999, though not reviewed by Lippold [8]. The RDG model considers tension in the transverse direction of the mushy zone and liquid feeding through the mushy zone, from the tips of the columnar dendrites to the roots. However, the grain boundary, where solidification cracking occurs, is not considered. Instead, the entire mushy zone is considered as one piece of semisolid structure through which the interdendritic liquid flows toward the dendrite roots.
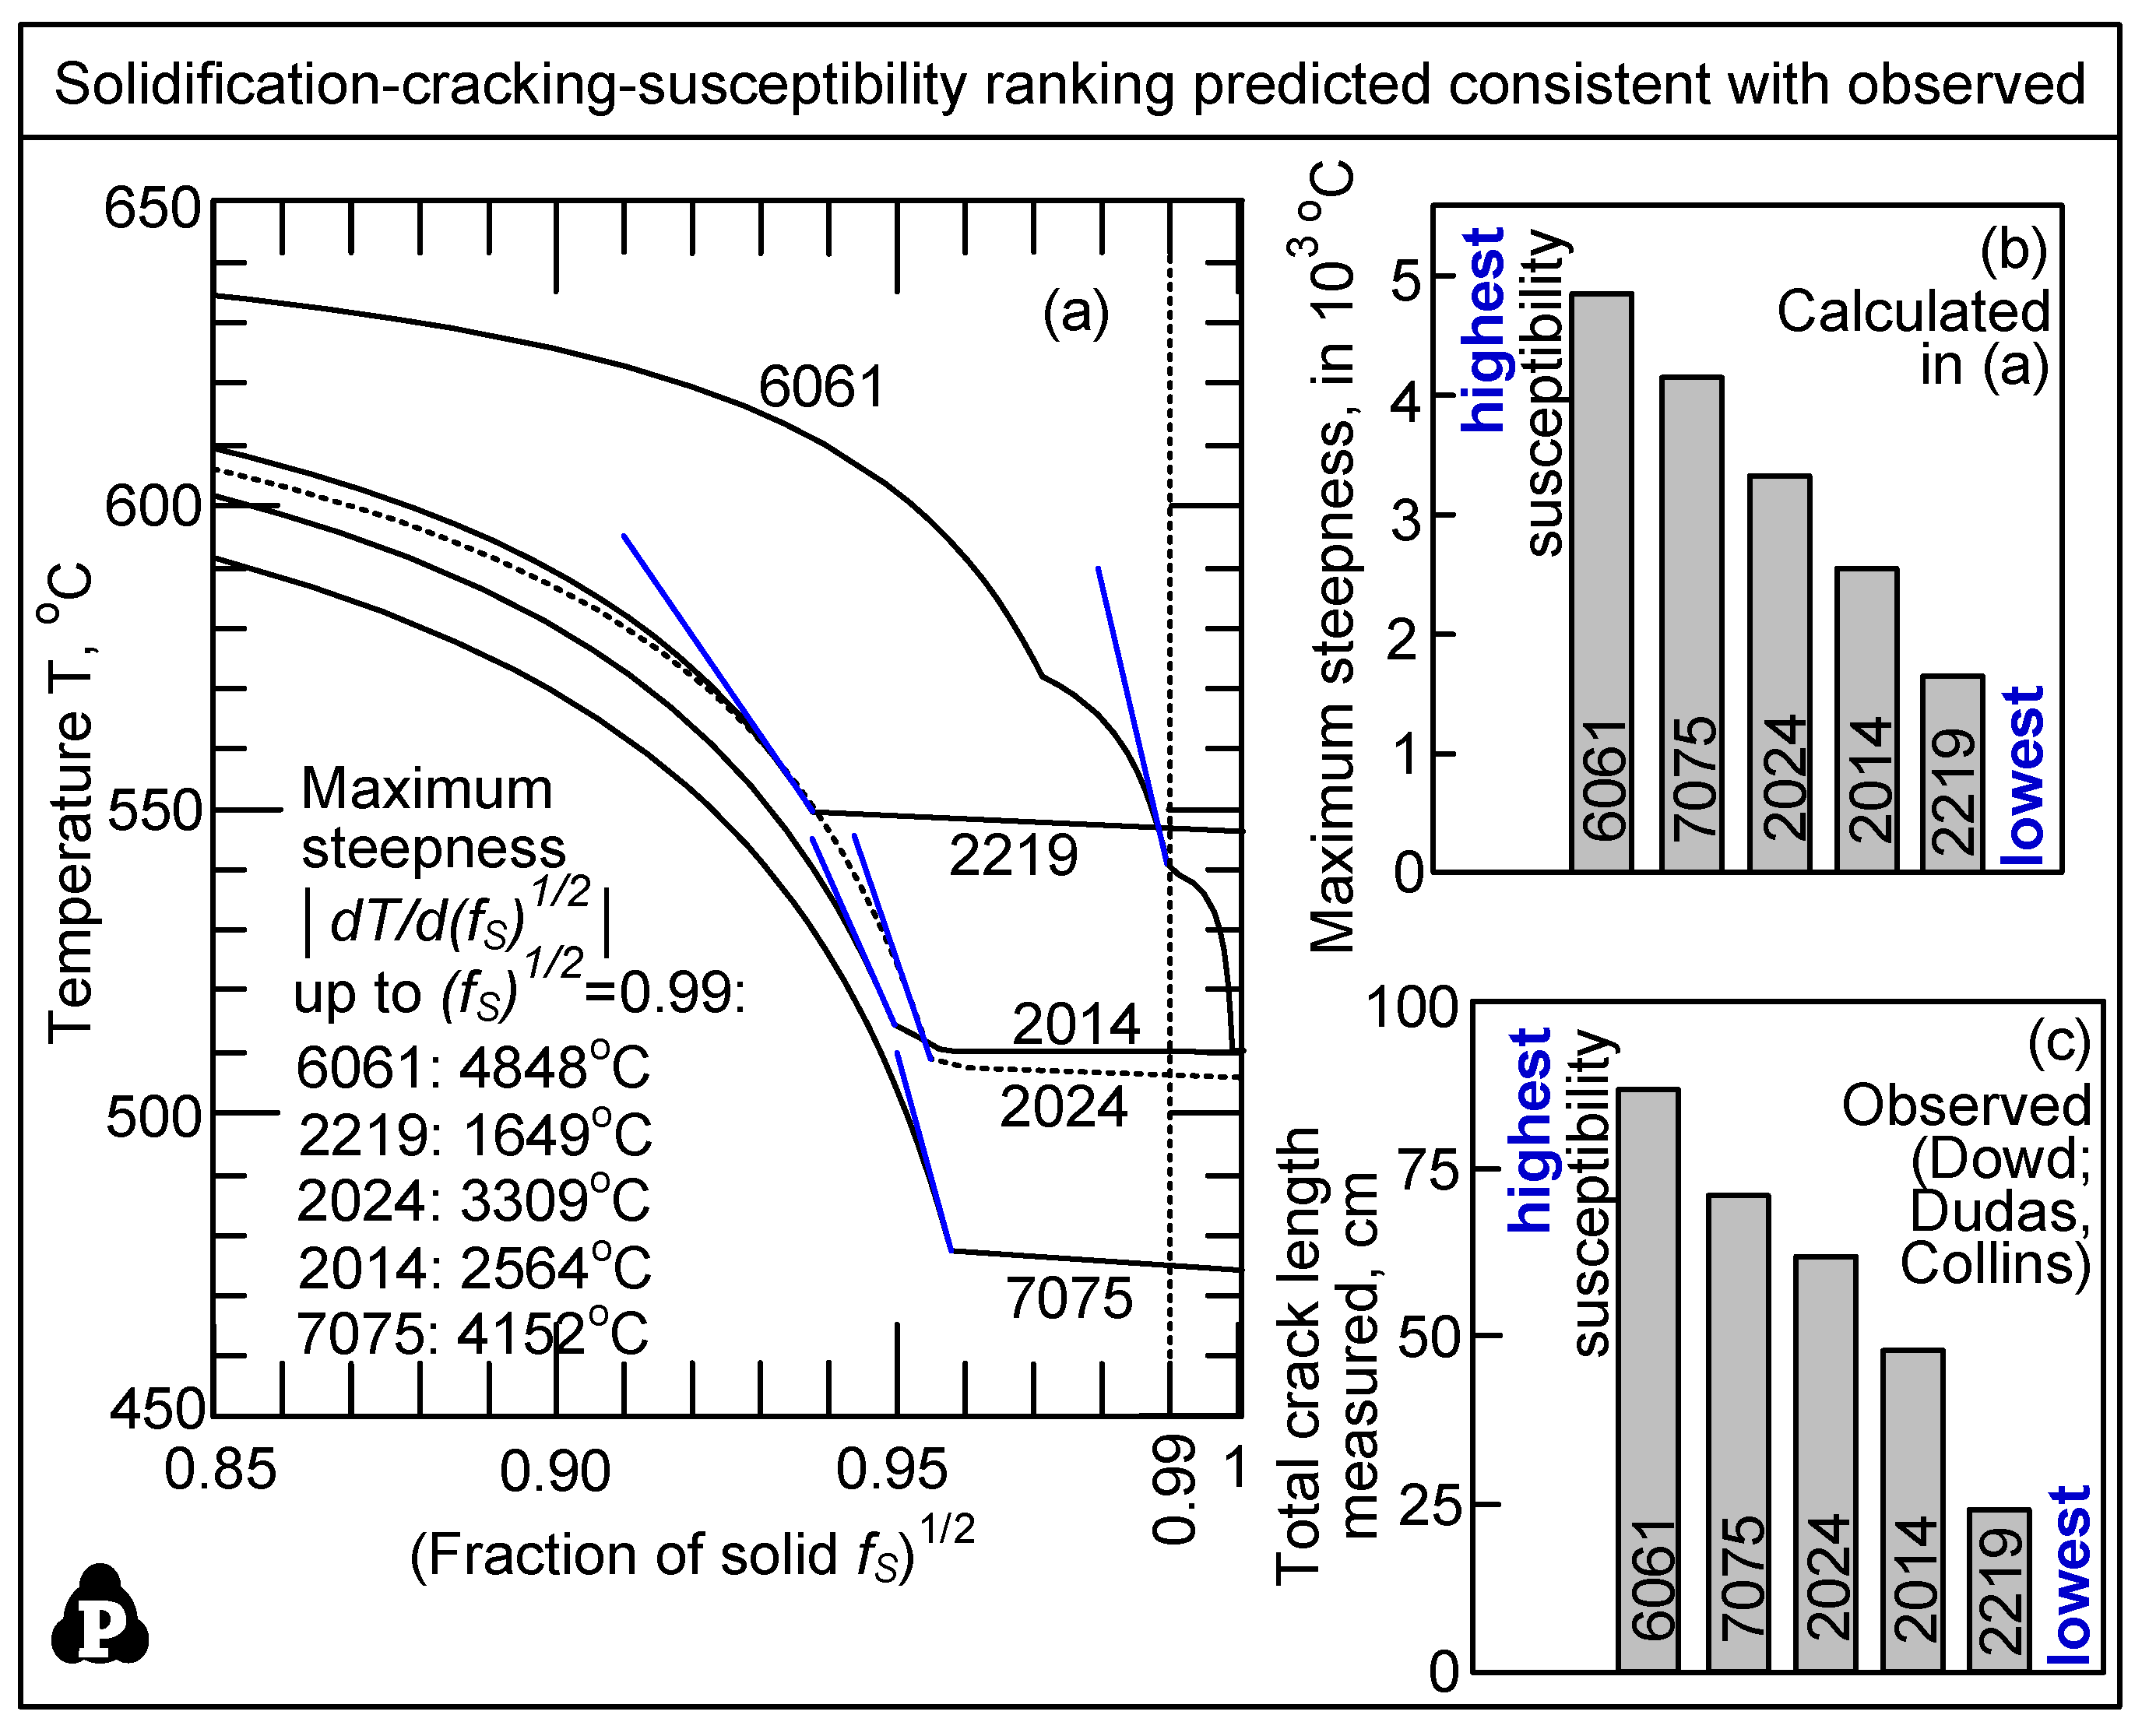
More recently, Kou [16] proposed a criterion for cracking during solidification. Unlike the RDG model [15], Kou [16] considered three factors along the grain boundary between columnar dendrites growing side by side in the mushy zone: 1. the transverse tensile strain rate separating dendrites to cause cracking; 2. the lateral growth rate of dendrites toward each other to bond together to resist cracking; and 3. the liquid feeding rate to keep voids (cracks) from forming. He proposed, on the basis of volumetric rates, the following criterion for solidification cracking: cracking can occur if Factor 1 exceeds the sum of Factors 2 and 3. Based on the criterion, Kou [16,17] further proposed |dT/d(fS)1/2| near fS = 1 as a simple index for the susceptibility to solidification cracking. He showed the characteristic dendrite radius r of columnar dendrites is proportional to (fS)1/2 and thus the lateral growth rate dr/dt is proportional to d(fS)1/2/dt. At a given dT/dt, |dT/d(fS)1/2| or (dT/dt)/[d(fS)1/2)/dt] is higher if dr/dt is slower for grains to grow toward and bond to each other to resist cracking. A slower dr/dt also allows the channels between columnar dendrites to keep growing longer to slow down the liquid feeding that is needed to avoid cracking. Since the maximum |dT/d(fS)1/2| usually occurs near fS = 1, a convenient option of the index is the maximum |dT/d(fS)1/2| up to (fS)1/2 = 0.99 [17], beyond which cracking is unlikely because of extensive bonding between grains. The RDG model [15] also assumed no cracking beyond fS = 0.98, i.e., (fS)1/2 = 0.99. The index was found to work for Al alloys [18,19], Mg alloys [20], carbon steels [21], and Ni-base alloys [22].
In the present study, the curves of T vs. fS were calculated to predict the susceptibility to liquation cracking and the curves of T vs. (fS)1/2 were calculated to predict the susceptibility to solidification cracking. They were calculated by using commercial thermodynamic software and databases. This is part of the approach often called CALPHAD (calculation of phase diagram).
2. Materials and Methods
In arc welding, the cooling rate is mild and undercooling before solidification is negligible. Thus, equilibrium can be assumed to exist between the solid (S) and liquid (L). With equilibrium at the S/L interface, three solidification models can be used to calculate the basic relationship between temperature T and the fraction of solid fS of an alloy during its solidification [1]. In the first model, complete solid diffusion and complete liquid diffusion are assumed during solidification. This model is called equilibrium solidification or the lever rule. This model was used for carbon steels (approximated as binary Fe-C alloys) [21]. In the second model, complete liquid diffusion and no solid diffusion are assumed. This model is called Gulliver–Scheil or Scheil solidification [18,19,20,22]. In the third model, complete liquid diffusion and partial solid diffusion are assumed. This model can be called solidification with back diffusion, meaning solutes in the interdendritic liquid can back diffuse into the dendrites during solidification. This model was used for carbon steels (approximated as binary Al alloys and stainless steels [23,24,25,26].
For a binary alloy, the curve of T vs. fS can be calculated based on the alloy composition and the binary phase diagram, assuming the equilibrium partition coefficient k and the slope of the liquidus lime mL are both constant. Analytical equations are available to calculate the T-fS curve for each of the three solidification models [1]. However, most commercial alloys are multicomponent and both k and mL are temperature dependent. Thus, the phase diagram is also calculated while solidification is being simulated. For this matter, the CALPHAD approach is indispensable. Multicomponent phase equilibria and any of the three solidification models can be integrated to calculate k, mL and the T-fS curve.
The thermodynamic software and databases of CompuTherm, LLC of Middleton, WI were used. The thermodynamic software was Pandat 2004 [27], which allow the choice between the equilibrium solidification model and the Scheil solidification model. The thermodynamic databases included PanAluminum 2004 [28], PanMagnesium 2015 [29], PanIron 2020 [30], and PanNickel 2020 [31].
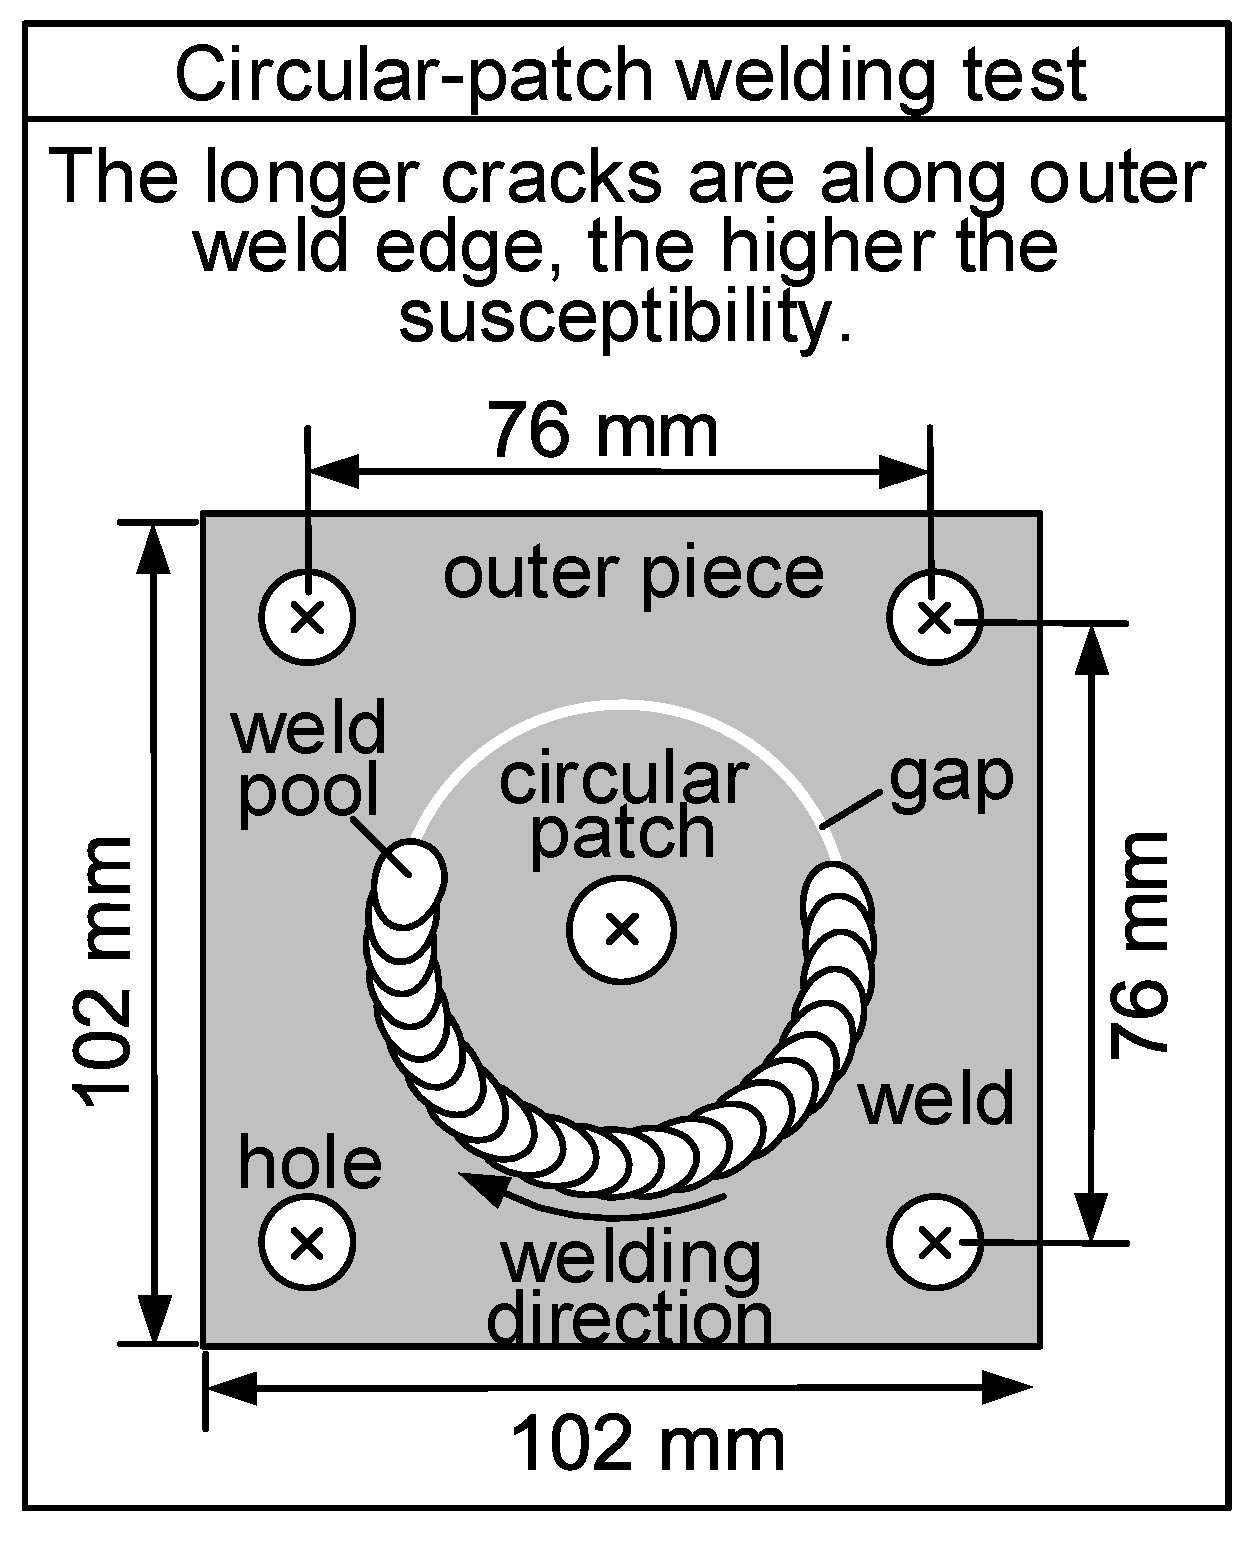
The circular-patch test [32], illustrated in Figure 2, was used in the present study to evaluate the susceptibility to liquation cracking [33]. This test has also been used for evaluating the susceptibility to solidification cracking [32], though not in the present study. Essentially, a circular weld was made between an outer piece that had a round hole at the center and a circular patch that fitted in the hole. The outer piece was bolted down tightly against a heavy base plate (not shown) to keep it from contracting during welding. This obstructed contraction of the weld induced transverse tension (normal to the weld) and hence liquation cracking along the outer edge of the weld. The longer the total length of cracks along the outer edge was, the higher the susceptibility to liquation cracking. The inner edge was under compression and no liquation cracking could occur. The test was also conducted without a circular hole or patch, called circular weld test [34].
The circular weld was cut to show its transverse cross section. The area of the weld above the top surface of the workpiece and that below the bottom surface were contributed by the filler metal. The remaining area of the weld was contributed by the workpiece. The extent the filler metal was diluted by the workpiece, called dilution, and was defined as the area contributed by the workpiece divided by the total area of the weld. So, assuming complete mixing of the workpiece and the filler metal in the weld pool, the composition of the weld metal was calculated as follows [1]. The content of solute A in the weld metal (wt% A)weld = (wt% A)workpiece × (dilution) + (wt% A)filler × (1 − dilution). The composition of the PMZ is identical to that of the workpiece because no mixing with filler metal occurred in the PMZ. CALPHAD solidification modeling was then used to calculate the T-fS relationships for the weld metal and the PMZ based on their compositions.
3. Results and Discussion
3.1. Liquation Cracking
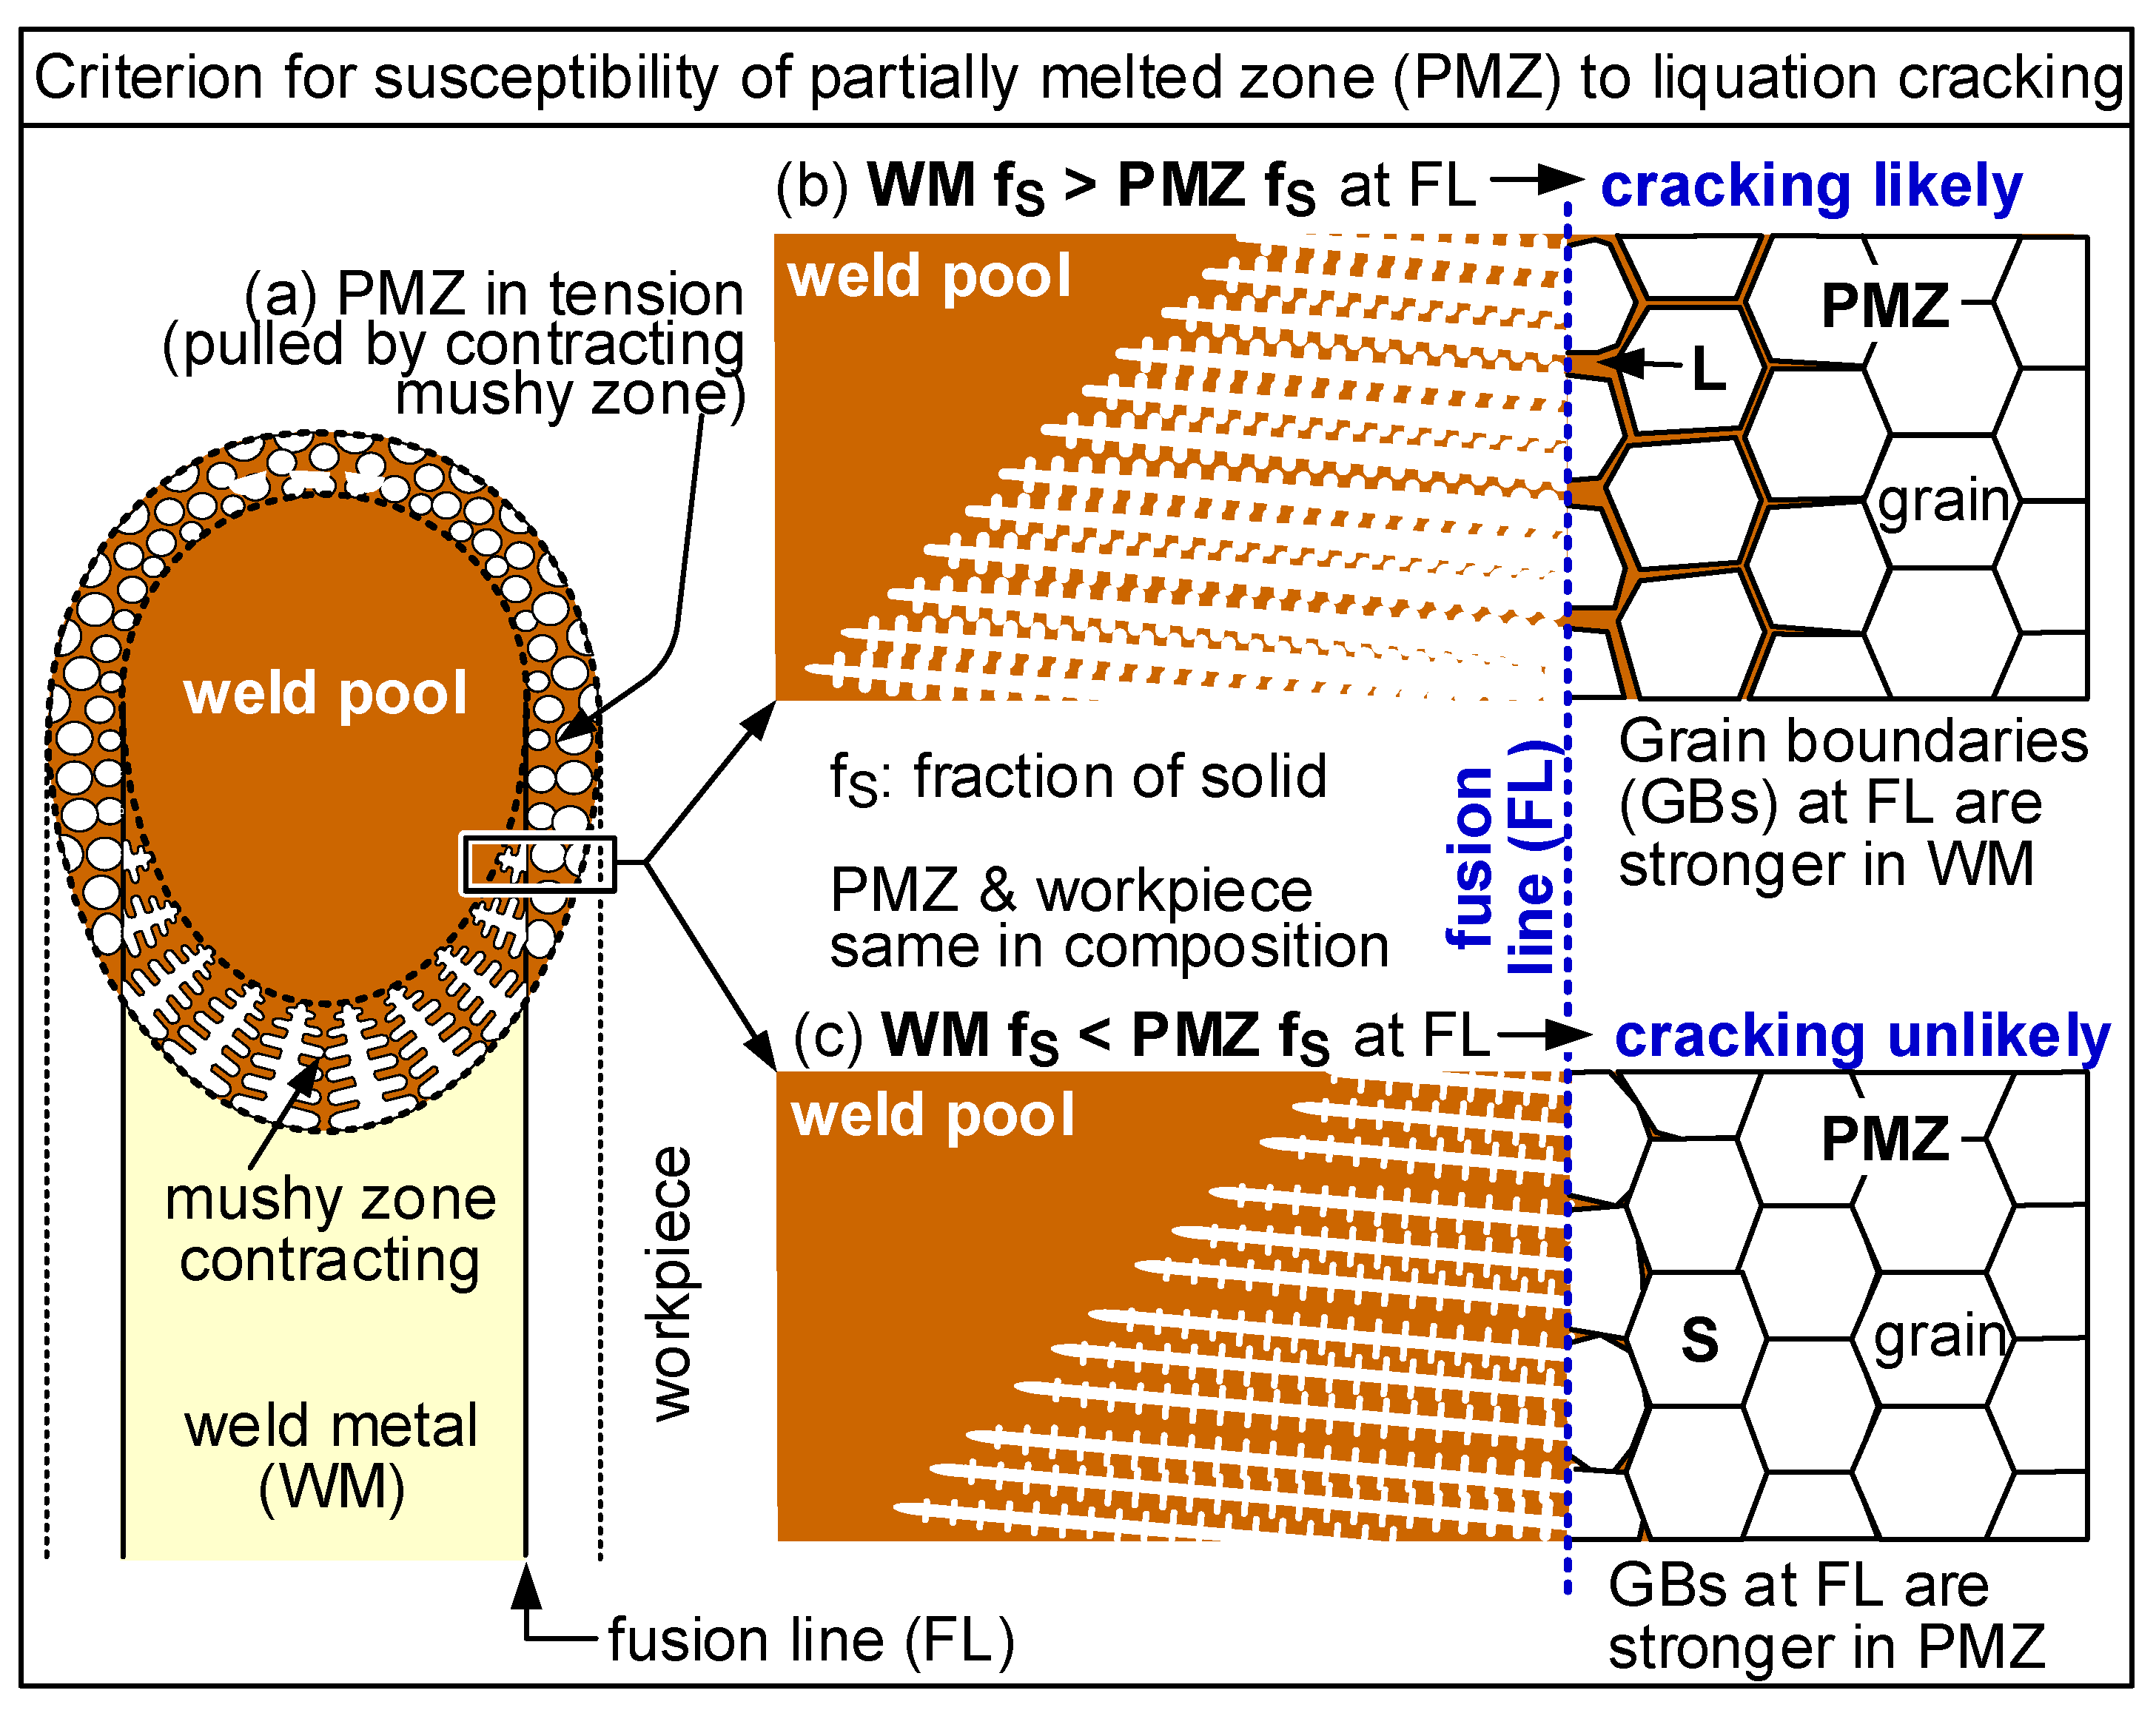
Figure 3 shows how the susceptibility to liquation cracking can be predicted based on the T-fS relationships calculated by CALPHAD modeling of solidification [33]. At a given T, the strength and hence the resistance of a semisolid to intergranular cracking is assumed to depend mainly on fS and not if the semisolid is dendritic or granular. Thus, if the weld-metal fS exceeds the PMZ fS at the fusion line, the susceptibility to liquation cracking can exist. The larger the difference is, the greater the susceptibility. On the other hand, if the weld-metal fS is less than the PMZ fS at the fusion line, there is no susceptibility to liquation cracking.
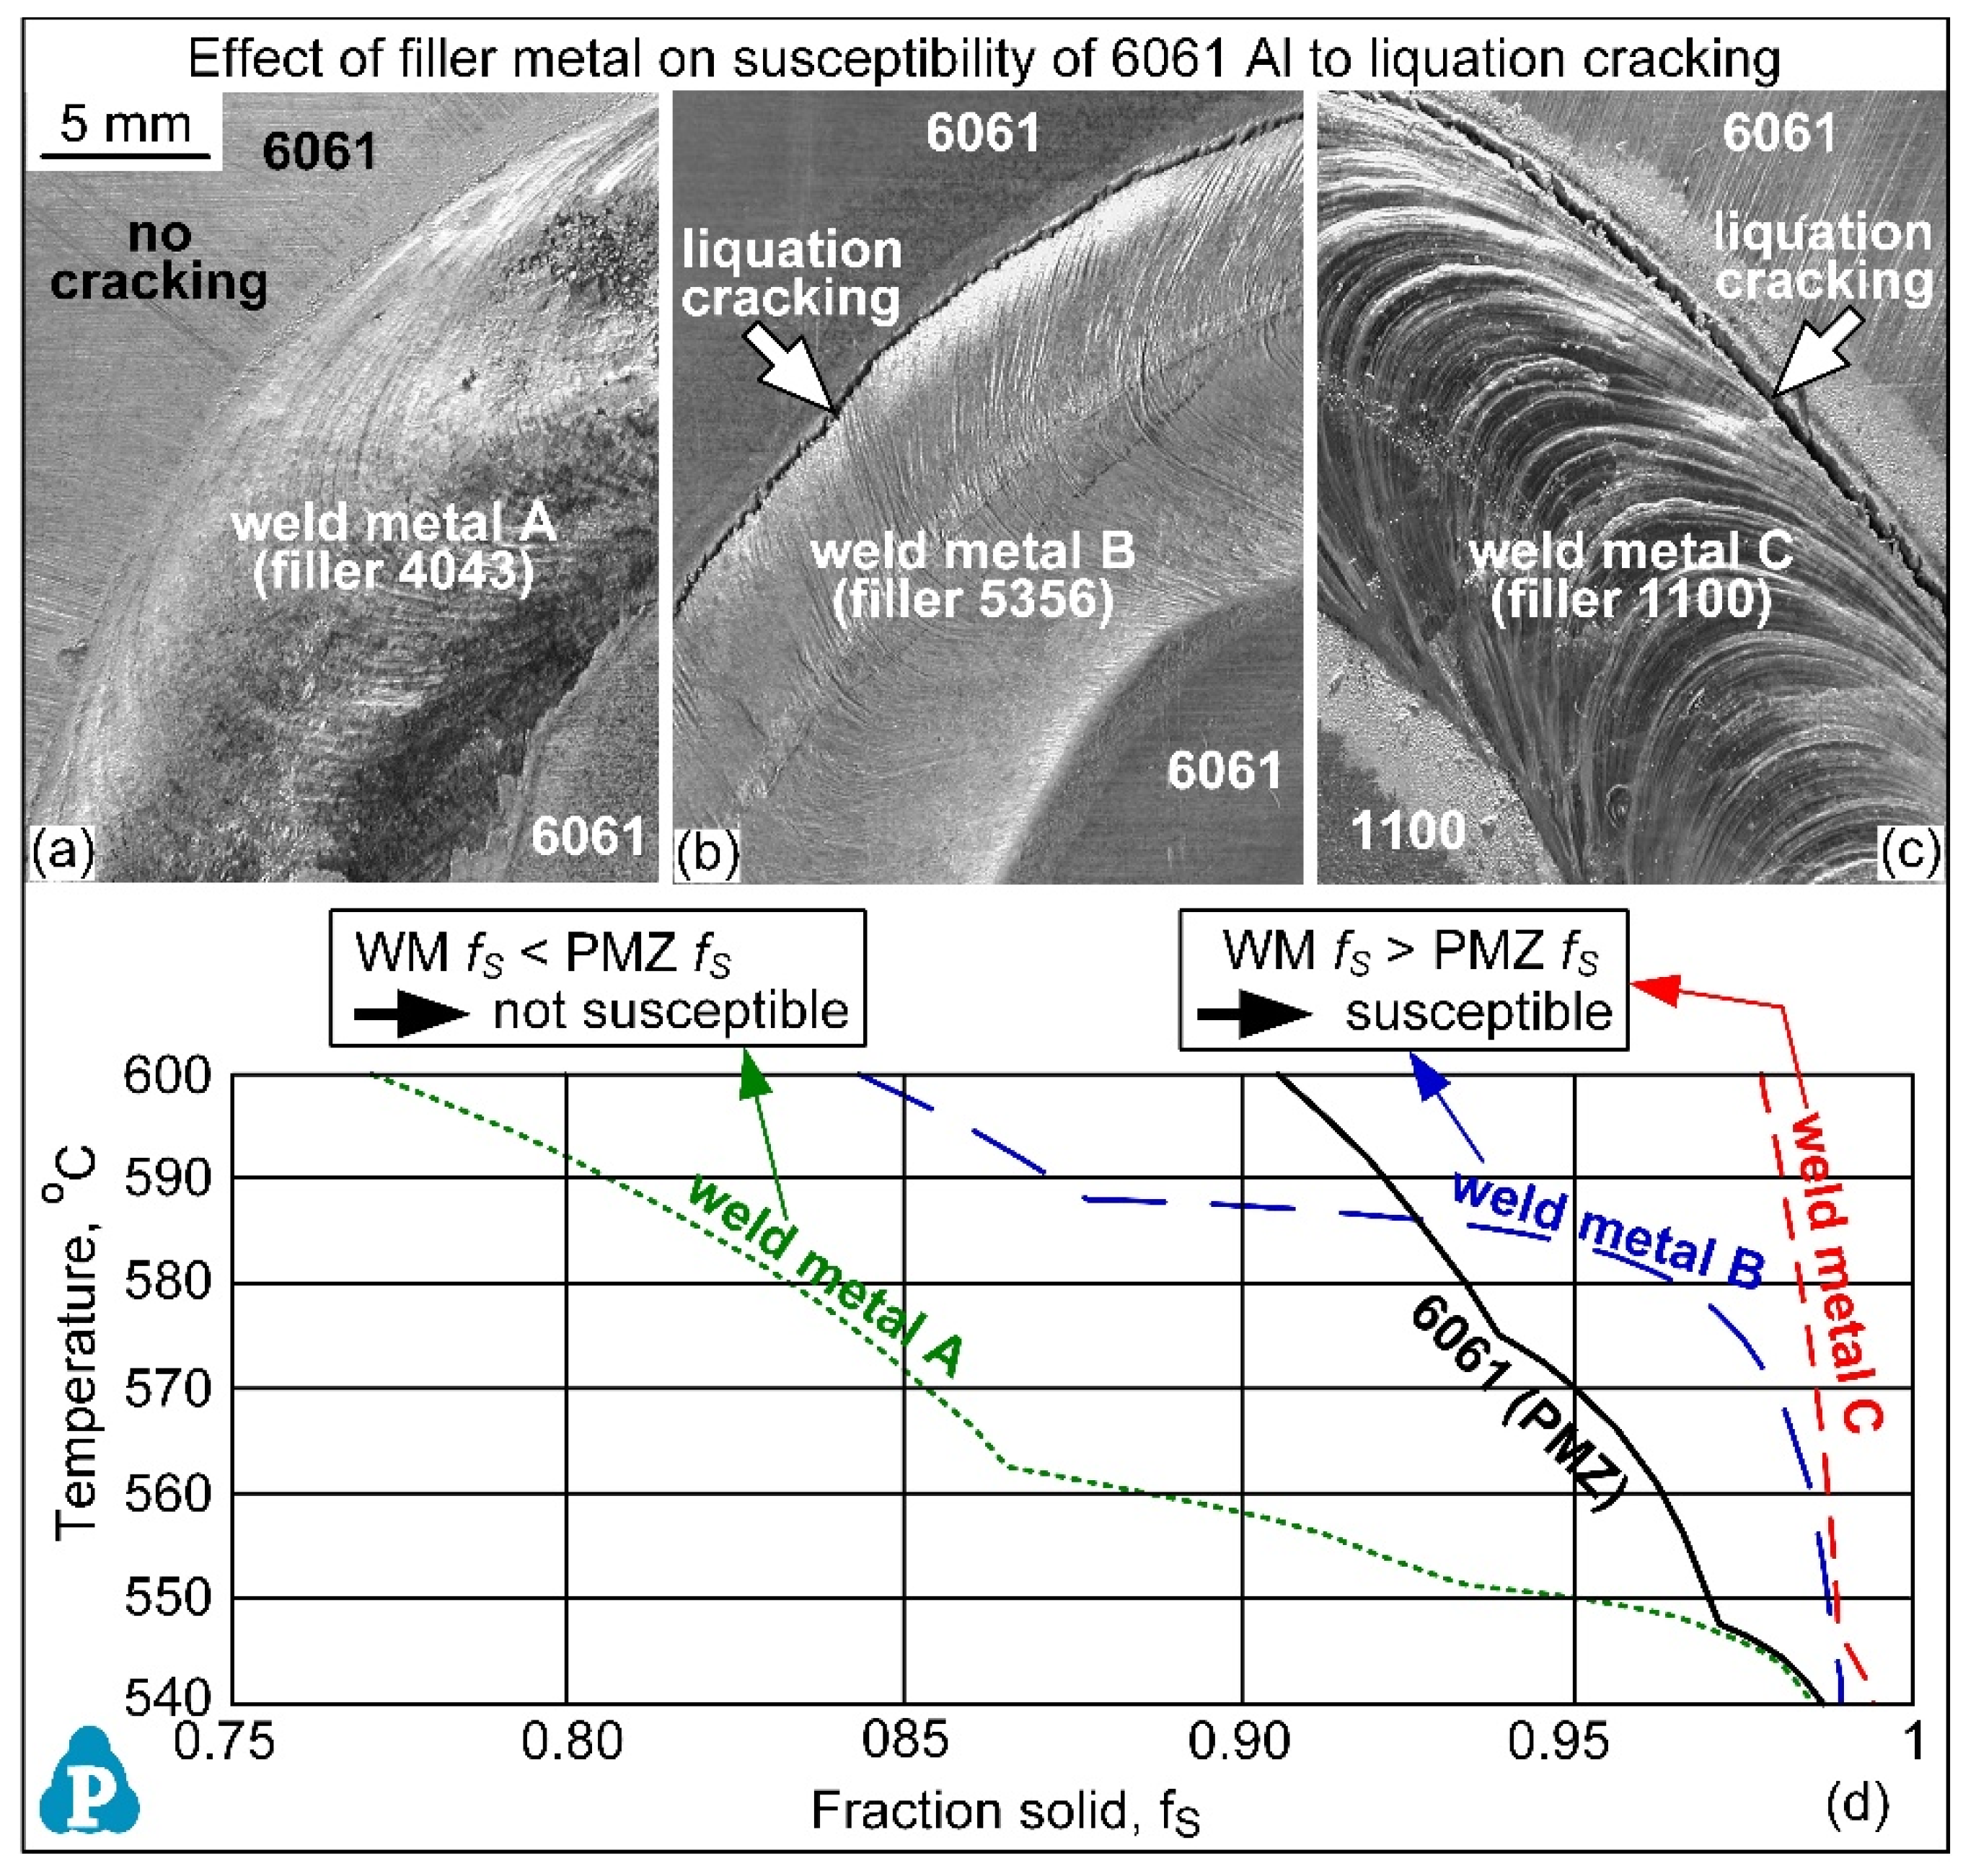
Figure 4 shows the effect of the filler metal on the susceptibility of 6061 Al to liquation cracking [7]. Using 4043 Al as the filler metal for welding 6061 Al, the weld metal composition is such that weld-metal fS < PMZ fS at all temperatures. The absence of liquation cracking in circular-patch welding confirms the validity of the prediction based on CALPHAD solidification modeling. With 5356 Al as the filler metal, however, weld-metal fS > PMZ fS occurs near the end of solidification. The weld-edge cracking confirms the validity of the prediction. With 1100 Al as the filler metal (and 1100 as the circular patch to further change the weld-metal composition), weld-metal fS > PMZ fS occurs even earlier before the end of solidification. The large crack along the weld edge is consistent with the large difference between the weld-metal fS and the PMZ fS.
Figure 5 shows the susceptibility of AZ31 Mg (Mg-3Al-1Zn) and AZ91 Mg (Mg-9Al-1Zn) to liquation cracking in circular-weld testing [34]. In the first case, AZ31 Mg is welded with AZ92 Mg (Mg-9Al-2Zn) as the filler wire and the weld-metal composition was Mg-6.81Al-1.64Zn-0.41Mn (36.5% dilution). The weld-metal fS is less than the PMZ fS, and there is no liquation cracking in the PMZ. In the second case, AZ91 Mg is welded with AZ31 Mg as the filler metal, and the weld-metal composition is Mg-5.21Al-0.89Zn-0.45Mn (36.9% dilution). The weld-metal fS exceeds the PMZ fS, and liquation cracking occurs in the PMZ of AZ91 Mg. Thus, Figure 4 and Figure 5 confirm that that CALPHAD solidification modeling can be used to predict the susceptibility of Al and Mg alloys to liquation cracking.
3.2. Solidification Cracking
Figure 6 shows solidification cracking in a bead-on-plate weld of 6061 Al made by gas-tungsten arc welding without a filler metal. Solidification cracking occurs in the mushy zone during welding, along the boundary between columnar grains growing side by side. This leaves behind open cracks in the fusion zone.
Figure 7 shows the relative crack susceptibility ranking among commercial wrought Al alloys. The maximum |dT/d(fS)1/2| up to (fS)1/2 = 0.99 is calculated to rank the crack susceptibility [16,17]. As shown, the predicted ranking is consistent with that reported by Dowd [35] and by Dudas and Collins [36]. They measured the total crack length in inverse-T welds between thick Al-plates made by gas-metal arc welding.
The classical data of Dowd [35] and Dudas and Collins [36] for the susceptibility of Al alloys to solidification cracking, shown in Figure 7c, were confirmed by numerous investigators in welding of wrought Al alloys. Usually, when conducting welding tests in a given study to rank the relative crack susceptibility among wrought Al alloys, the same welding process and conditions are used. Thus, the relative ranking among wrought Al alloys is not significantly affected by the specific welding process and conditions—otherwise, the data would be of little use. In fact, the relative ranking shown in Figure 7c has also been confirmed in laser-beam welding of wrought Al alloys.
The relative ranking in Figure 7b, predicted based on the maximum |dT/d(fS)1/2| up to (fS)1/2 = 0.99 as the index, agrees with the relative ranking in both arc welding and laser-beam welding. The index is intended for the intrinsic susceptibility of an alloy as it is based on its composition alone and not the welding conditions. If the effect of welding conditions can be included in the T-fS relationship, the index can show the effect. One example is back diffusion [23,24,25,26], which is affected by the cooling rate through welding conditions. Another example is undercooling, which can be significant under fast cooling in laser welding. The index has been used for welding, casting, and additive manufacturing.
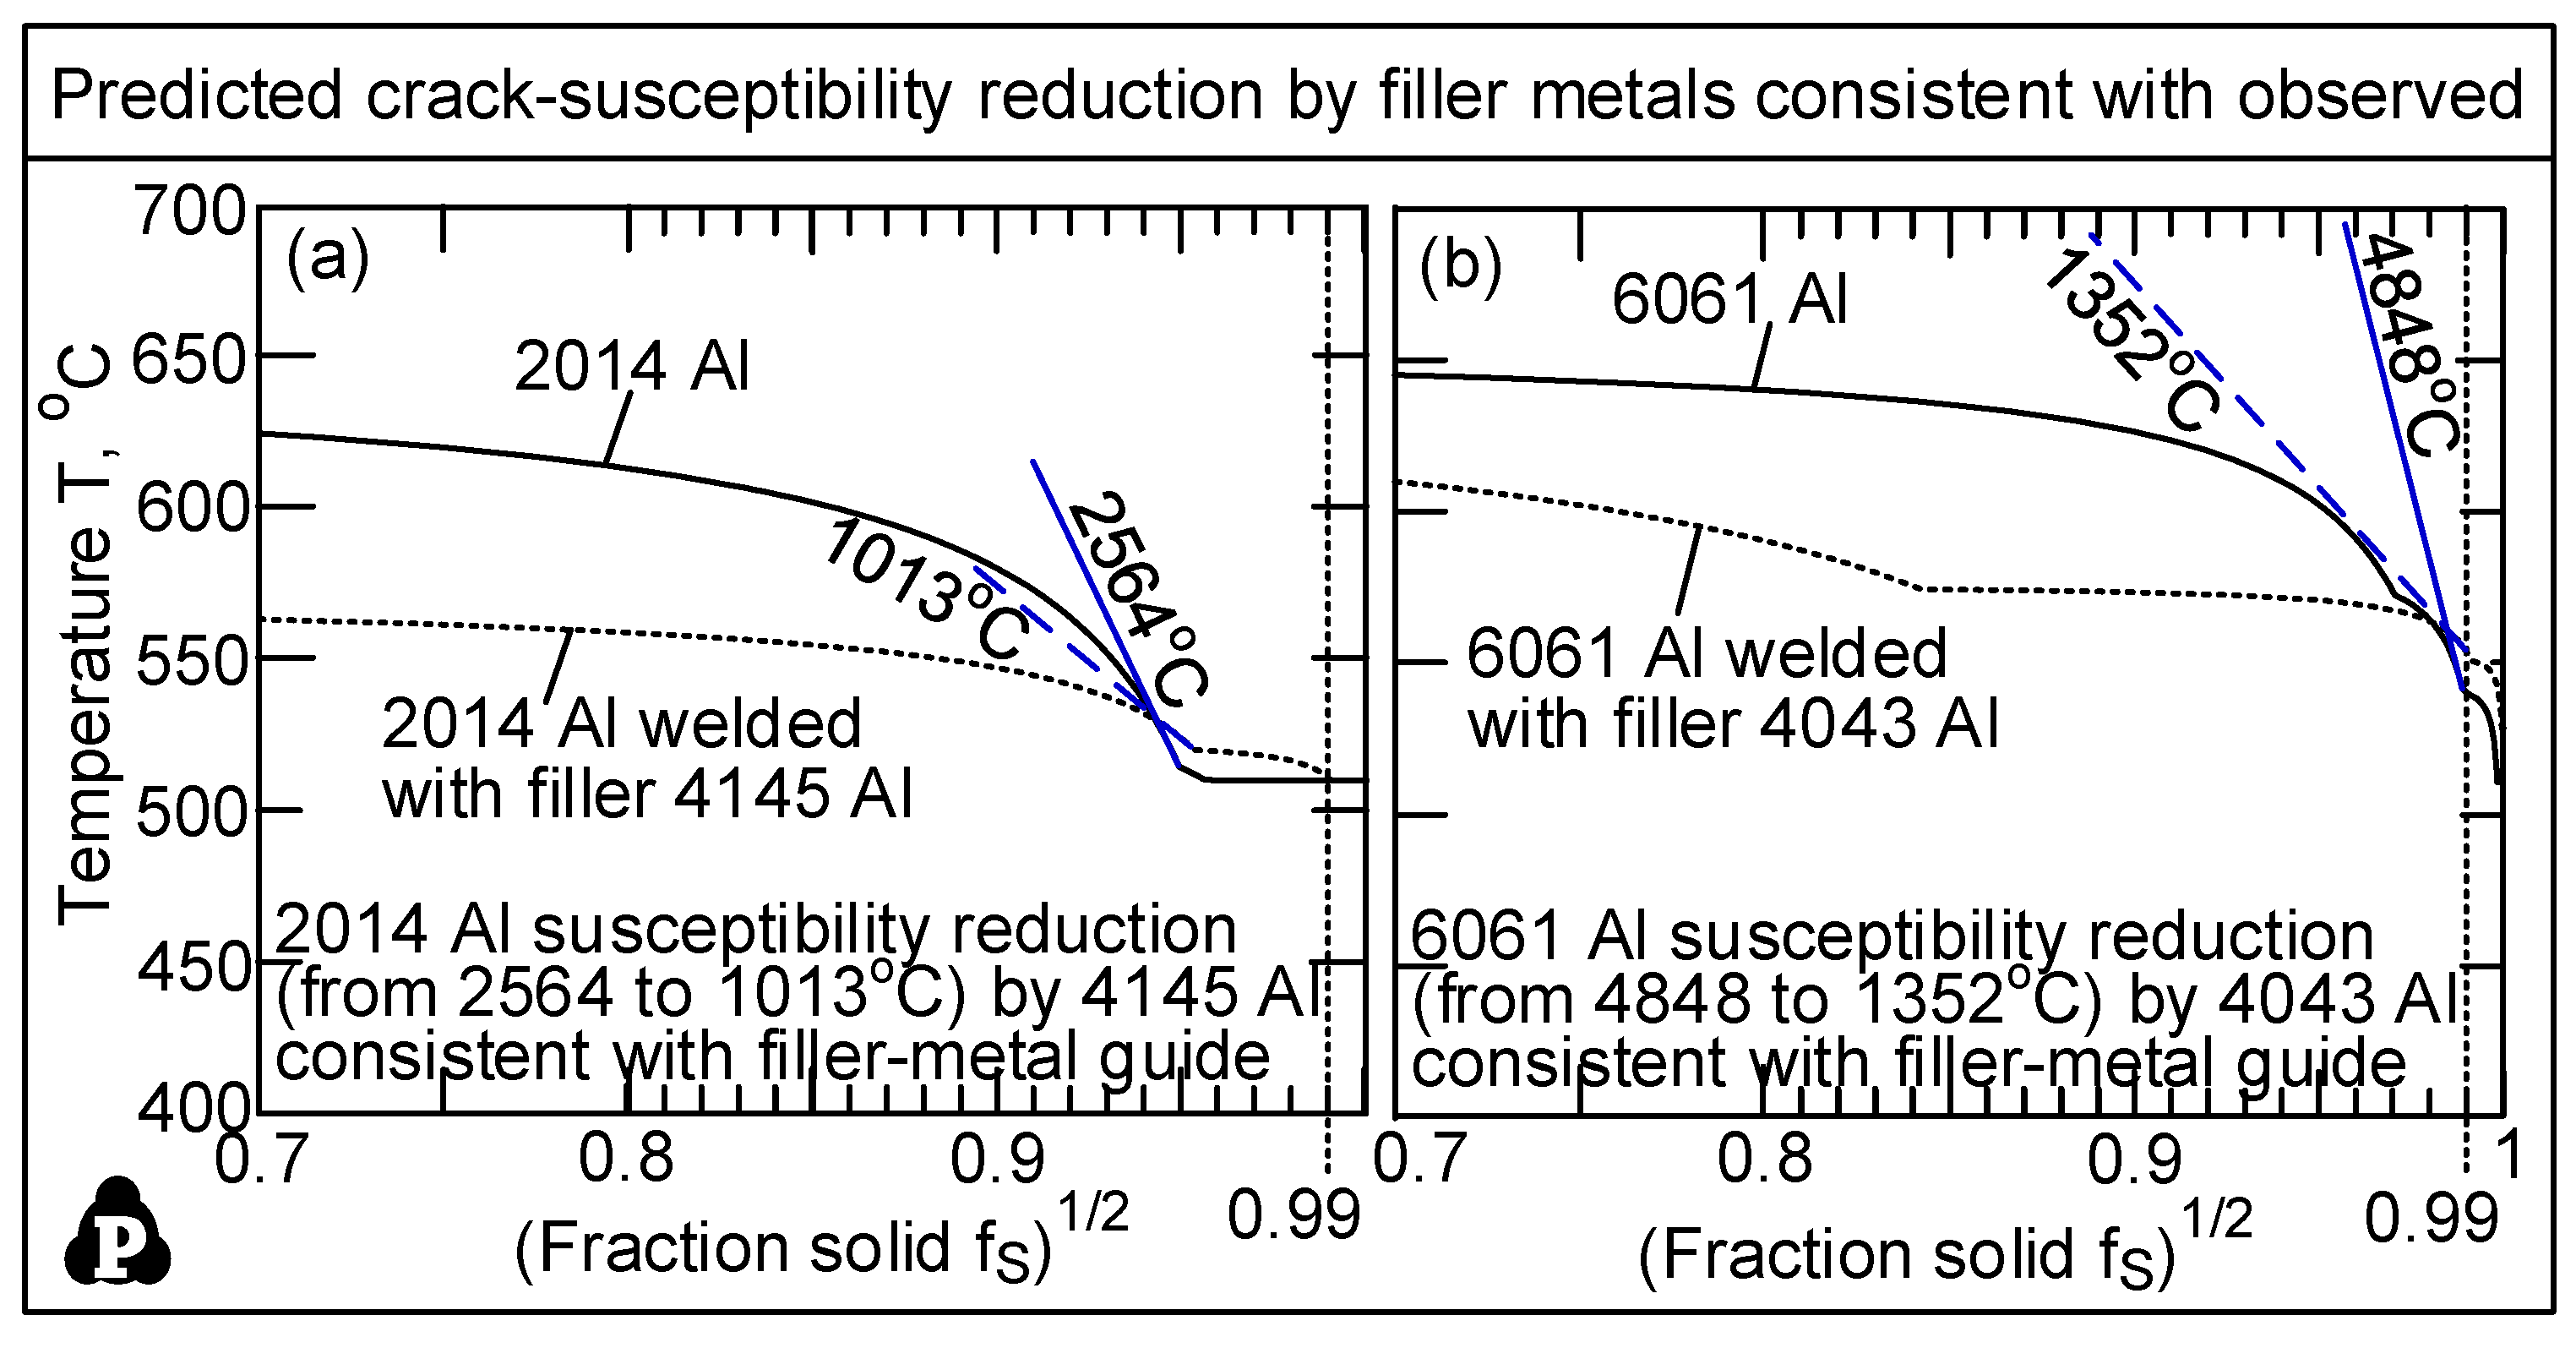
Figure 8 shows the effect of filler metals on the susceptibility to solidification cracking [17]. As shown, the susceptibility of 2014 Al can be effectively reduced by using 4145 Al as the filler metal. Likewise, the susceptibility of 6061 Al can be effectively reduced by using 4043 Al as the filler metal. These predictions are consistent with the filler-metal selection guides published by manufacturers of filler [37,38]. Note that these guides are intended to be generally useful and not restricted to certain specific welding process or conditions.
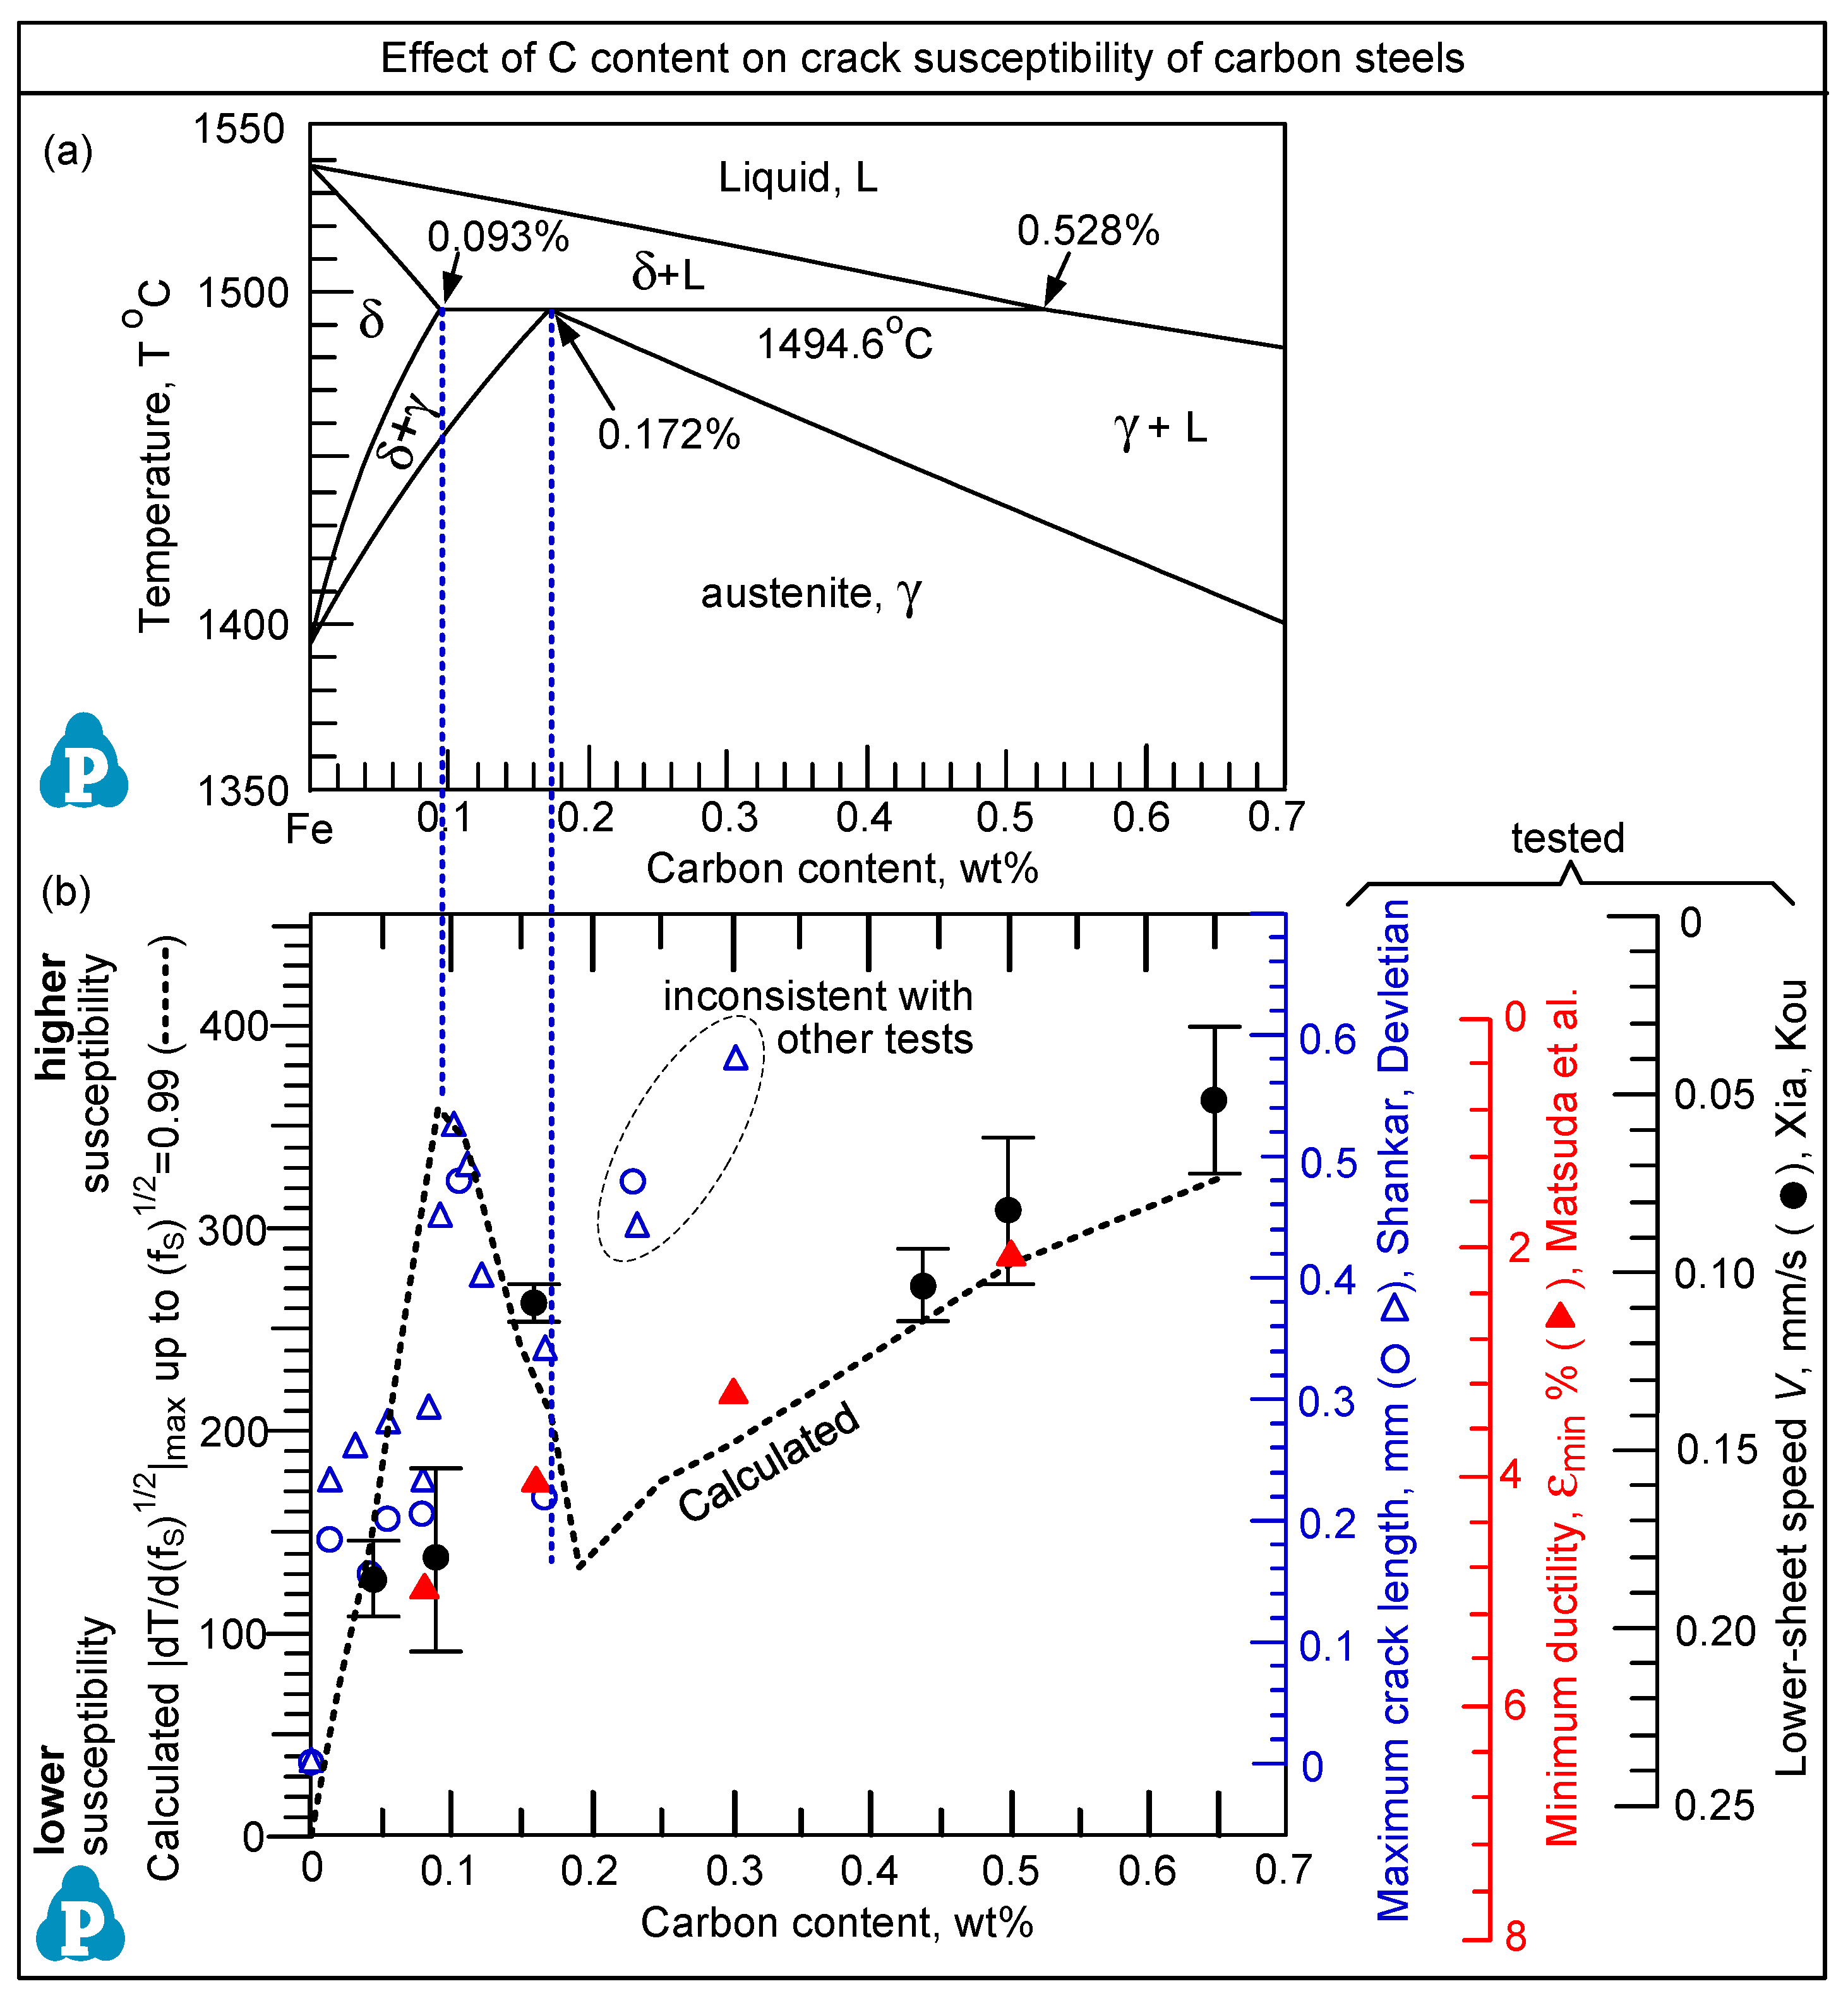
Figure 9 shows the effect of the carbon content on the susceptibility of carbon steels to solidification. The maximum |dT/d(fS)1/2| up to (fS)1/2 = 0.99 is the susceptibility index [21]. The relationships between T and fS and hence (fS)1/2 are calculated by CALPHAD solidification modeling. The carbon steels (very low in S and P) are assumed as binary Fe–C alloys as an approximation. The equilibrium solidification model was used in view of the very fast diffusion of interstitial C atoms in solid iron and liquid iron. The calculated susceptibility index increases with increasing C to a maximum at 0.093 wt% C, which is the maximum C solubility in δ. It then decreases to a minimum at 0.192 wt% C, which is near the peritectic composition 0.172 wt% C before increasing again with increasing C content. This trend is consistent with the results of various tests for solidification cracking. The equilibrium freezing temperature range was also calculated, but it did not agree well with the experimental data even though the C contents at the maximum and minimum susceptibility were similar to those shown in Figure 9b [21]. Thus, the effect of the C content cannot be explained based on the freezing temperature range.
4. Conclusions
- Based on the curves of T vs. fS calculated by commercial thermodynamic software and databases, the effect of the filler metal on the susceptibility to liquation cracking was predicted and verified with experimental results.
- Based on the curves of T vs. (fS)1/2 calculated likewise, the susceptibility to solidification cracking was predicted and verified with experimental results.
Funding
This research was funded by the National Science Foundation of the United States under grant nos. DMR-0098776, DMR 1500367, and DMR1904503.
Acknowledgments
The author thanks the contributions of his former coworkers, including C. Huang, G. Cao, T. Yuan, X. Chai, J. Liu, T. Soysal, C. Xia, and K. Liu.
Conflicts of Interest
The author declares no conflict of interest.
References
- Kou, S. Welding Metallurgy, 3rd ed.; John Wiley and Sons: Hoboken, NJ, USA, 2020; pp. 323–377, 419–449. [Google Scholar]
- Gittos, N.F.; Scott, M.H. Heat-affected zone cracking of Al-Mg-Si alloys. Weld. J. 1981, 60, 95–103. [Google Scholar]
- Katoh, M.; Kerr, H.W. Investigation of heat-affected zone cracking of GTA welds of Al-Mg-Si alloys using the Varestraint test. Weld. J. 1987, 66, 360–368. [Google Scholar]
- Kerr, H.W.; Katoh, M. Investigation of heat-affected zone cracking of GMA welds of Al-Mg-Si alloys using the Varestraint test. Weld. J. 1987, 66, 251–259. [Google Scholar]
- Miyazaki, M.; Nishio, K.; Katoh, M.; Mukae, S.; Kerr, H.W. Quantitative investigation of heat-affected zone cracking in aluminum alloy 6061. Weld. J. 1990, 69, 362–371. [Google Scholar]
- Huang, C.; Kou, S. Liquation Cracking in Full-Penetration Al-Cu Welds. Weld. J. 2004, 83, 50–58. [Google Scholar]
- Huang, C.; Kou, S. Liquation Cracking in Full-Penetration Al-Mg-Si Welds. Weld. J. 2004, 83, 111–122. [Google Scholar]
- Lippold, J.C. Welding Metallurgy and Weldability; John Wiley and Sons: Hoboken, NJ, USA, 2015. [Google Scholar]
- Pumphrey, W.I.; Jennings, P.H. A consideration of the nature of brittleness at temperatures above the solidus in castings and welds in aluminium alloys. J. Inst. Met. 1948, 75, 235–256. [Google Scholar]
- Apblett, W.R.; Pellini, W.S. Factors which influence weld hot cracking. Weld. J. 1954, 33, 83–90. [Google Scholar]
- Borland, J.C. Generalized theory of super-solidus cracking in welds (and castings). Br. Weld. J. 1960, 7, 508–512. [Google Scholar]
- Matsuda, F.; Nakagawa, H.; Sorada, K. Dynamic observation of solidification and solidification cracking during welding with optical microscope (I): Solidification front and behavior of cracking (materials, metallurgy & weldability). Trans. JWRI 1982, 11, 67–77. [Google Scholar]
- Prokhorov, N.N. Resistance to hot tearing of cast metals during solidification. Russian Castings Production. Russ. Cast. Prod. 1962, 2, 172–175. [Google Scholar]
- Clyne, T.; Davies, G. Influence of composition on solidification cracking susceptibility in binary alloy systems. Br. Foundryman 1981, 74, 65–73. [Google Scholar]
- Rappaz, M.; Drezet, J.M.; Gremaud, M. A new hot-tearing criterion. Metall. Mater. Trans. A 1999, 30, 449–455. [Google Scholar] [CrossRef]
- Kou, S. A Criterion for cracking during solidification. Acta Mater. 2015, 88, 366–374. [Google Scholar] [CrossRef]
- Kou, S. A Simple index for predicting the susceptibility to solidification cracking. Weld. J. 2015, 94, 374–388. [Google Scholar]
- Soysal, T.; Kou, S. A simple test for assessing solidification cracking susceptibility and checking validity of susceptibility prediction. Acta Mater. 2018, 143, 181–197. [Google Scholar] [CrossRef]
- Soysal, T.; Kou, S. Predicting the effect of filler metals on solidification cracking susceptibility of Al alloys 2024 and 6061. Sci. Technol. Weld. Join. 2019, 24, 559–565. [Google Scholar] [CrossRef]
- Liu, K.; Kou, S. Susceptibility of Magnesium Alloys to Solidification Cracking. Sci. Technol. Weld. Join. 2020, 25, 251–257. [Google Scholar] [CrossRef]
- Xia, C.; Kou, S. Calculating the susceptibility of carbon steels to solidification cracking during welding. Metall. Mater. Trans. B 2021, 52, 460–469. [Google Scholar] [CrossRef]
- Xia, C.; Kou, S. Evaluating susceptibility of Ni-Base Alloys to solidification cracking by Transverse Motion Weldability Test. Sci. Technol. Weld. Join. 2020, 25, 690–697. [Google Scholar] [CrossRef]
- Liu, J.; Kou, S. Effect of diffusion on susceptibility to cracking during solidification. Acta Mater. 2015, 100, 359–368. [Google Scholar] [CrossRef] [Green Version]
- Liu, J.; Kou, S. Crack susceptibility of binary aluminum alloys during solidification. Acta Mater. 2016, 110, 84–94. [Google Scholar] [CrossRef] [Green Version]
- Liu, J.; Duarte, H.P.; Kou, S. Evidence of back diffusion reducing cracking during solidification. Acta Mater. 2017, 122, 47–59. [Google Scholar] [CrossRef] [Green Version]
- Liu, J.; Kou, S. Susceptibility of ternary aluminum alloys to cracking during solidification. Acta Mater. 2017, 125, 513–523. [Google Scholar] [CrossRef] [Green Version]
- PandatTM. Thermodynamic Calculations and Kinetic Simulations. Available online: www.computherm.com (accessed on 5 March 2004).
- PanAluminum: Combined Thermodynamic and Mobility Database of Multicomponent Aluminum Alloys. Available online: www.computherm.com (accessed on 5 March 2004).
- PanMagnesium: Combined Thermodynamic and Mobility Database of Multicomponent Magnesium Alloys. Available online: www.computherm.com (accessed on 5 January 2015).
- PanIron: Combined Thermodynamic and Mobility Database of Multicomponent Iron Alloys. Available online: www.computherm.com (accessed on 10 April 2020).
- PanNickel: Combined Thermodynamic and Mobility Database of Multicomponent Nickel Alloys. Available online: www.computherm.com (accessed on 7 January 2020).
- Borland, J.C.; Rogerson, J.H. Examination of the patch test for assessing hot cracking tendencies of weld metal. Br. Weld. J. 1963, 8, 494–499. [Google Scholar]
- Yuan, T.; Chai, X.; Luo, Z.; Kou, S. Predicting susceptibility of magnesium alloys to weld-edge cracking. Acta Mater. 2015, 90, 242–251. [Google Scholar] [CrossRef]
- Chai, X.; Yuan, T.; Kou, S. Liquation and liquation cracking in partially melted zones of magnesium welds. Weld. J. 2016, 95, 57–67. [Google Scholar]
- Dowd, J.D. Weld cracking of aluminum alloys. Weld. J. 1952, 31, 448–456. [Google Scholar]
- Dudas, J.H.; Collins, F.R. Preventing weld cracks in high-strength aluminum alloys. Weld. J. 1966, 45, 241–249. [Google Scholar]
- Aluminum Filler Alloy Chart. Available online: http://www.alcotec.com/us/en/support/upload/Aluminum_Filler_Alloy_Selection_Chart.pdf (accessed on 11 January 2014).
- Maxal Guide for Aluminum Welding. Available online: http://maxal.com/Maxal_Product_Guide_5-11_1_doc.pdf (accessed on 11 January 2014).
Figure 1.
Weld pool, mushy zone, and partially melted zone of an alloy during welding.

Figure 2.
Circular-patch test for liquation cracking. Outer piece is bolted down tightly to thick base plate (not shown) to keep weld from shrinking, thus inducing transverse tension and liquation cracking along outer weld edge.
Figure 2.
Circular-patch test for liquation cracking. Outer piece is bolted down tightly to thick base plate (not shown) to keep weld from shrinking, thus inducing transverse tension and liquation cracking along outer weld edge.

Figure 3.
Criterion for liquation cracking at weld edge (fusion line): (a) schematic microstructure; (b) susceptible; (c) not susceptible.
Figure 3.
Criterion for liquation cracking at weld edge (fusion line): (a) schematic microstructure; (b) susceptible; (c) not susceptible.

Figure 4.
Effect of filler metal on liquation cracking in circular-patch test of 6061 Al (Al-1Mg-0.6Si): (a) filler 4043 Al (Al-5Si), weld metal A Al-2.146Si-0.631Mg-0.253Cu-0.064Mn-0.066Zn (67.6% dilution); (b) filler 5356 Al (Al-5Mg), weld metal B Al-2.376Mg-0.526Si-0.183Cu-0.063Mn-0.068Zn (64% dilution); (c) filler 1100 Al (pure Al), weld metal C Al-0.203Mg-0.225Si-0.122Cu-0.023Mn-0.022Zn (8.7% dilution from 6061 Al outer piece and 43.8% from 1100 Al patch); (d) T-fS curves for PMZ and weld metals.

Figure 5.
Susceptibility of Mg alloys to liquation cracking in circular-weld testing: (a) AZ31 Mg welded with AZ92 as filler metal; (b) AZ91 welded with AZ31 Mg as filler metal. Chai, Yuan, and Kou data from [34].
Figure 5.
Susceptibility of Mg alloys to liquation cracking in circular-weld testing: (a) AZ31 Mg welded with AZ92 as filler metal; (b) AZ91 welded with AZ31 Mg as filler metal. Chai, Yuan, and Kou data from [34].

Figure 6.
Solidification cracking: (a) columnar grains in 6061 Al near top surface of fusion zone; (b) cracking along grain boundary in mushy zone induced by transverse tension; (c) open cracks in 6061 Al bead-on-plate weld made by gas-tungsten-arc welding.
Figure 6.
Solidification cracking: (a) columnar grains in 6061 Al near top surface of fusion zone; (b) cracking along grain boundary in mushy zone induced by transverse tension; (c) open cracks in 6061 Al bead-on-plate weld made by gas-tungsten-arc welding.

Figure 7.
Susceptibility of wrought Al alloys to solidification cracking: (a) curves of T vs. (fS)1/2; (b) ranking based on Kou’s index data from [17]; (c) ranking based on crack susceptibility tests by Dowd [35] and Dudas and Collins data from [36].

Figure 8.
Reduction of susceptibility to solidification cracking by selecting proper filler metals: (a) 2014 Al welded with filler metal 4145 Al; (b) 6061 Al welded with filler metal 4043 Al. Predictions are consistent with filler-metal guides data from [37,38].

Figure 9.
The effect of carbon content on the susceptibility of carbon steels to solidification cracking in arc welding: (a) binary Fe-C phase diagram; (b) comparison between calculated susceptibility and experimental data. Xia and Kou data from [21].
Figure 9.
The effect of carbon content on the susceptibility of carbon steels to solidification cracking in arc welding: (a) binary Fe-C phase diagram; (b) comparison between calculated susceptibility and experimental data. Xia and Kou data from [21].

Publisher’s Note: MDPI stays neutral with regard to jurisdictional claims in published maps and institutional affiliations. |
© 2021 by the author. Licensee MDPI, Basel, Switzerland. This article is an open access article distributed under the terms and conditions of the Creative Commons Attribution (CC BY) license (https://creativecommons.org/licenses/by/4.0/).
Share and Cite
MDPI and ACS Style
Kou, S. Predicting Susceptibility to Solidification Cracking and Liquation Cracking by CALPHAD. Metals 2021, 11, 1442. https://doi.org/10.3390/met11091442
AMA Style
Kou S. Predicting Susceptibility to Solidification Cracking and Liquation Cracking by CALPHAD. Metals. 2021; 11(9):1442. https://doi.org/10.3390/met11091442
Chicago/Turabian StyleKou, Sindo. 2021. "Predicting Susceptibility to Solidification Cracking and Liquation Cracking by CALPHAD" Metals 11, no. 9: 1442. https://doi.org/10.3390/met11091442
Note that from the first issue of 2016, this journal uses article numbers instead of page numbers. See further details here.