Article

Effect of Cooling Rates on the Local—Overall Morphology Characteristics of Solidification Structure at Different Stages for High Carbon Steel

1
College of Materials Science and Engineering, Chongqing University, Chongqing 400044, China
2
Chongqing Key Laboratory of Vanadium-Titanium Metallurgy and Advanced Materials, Chongqing University, Chongqing 400044, China
*
Author to whom correspondence should be addressed.
Metals 2021, 11(8), 1291; https://doi.org/10.3390/met11081291
Submission received: 23 June 2021 / Revised: 10 August 2021 / Accepted: 14 August 2021 / Published: 16 August 2021
(This article belongs to the Special Issue Casting and Solidification Processing)

Abstract

:
The solidification characteristics of 70 steel at the stage of the superheat elimination and the liquid–solid phase transformation were analyzed at cooling rates from 10 to 150 °C/min based on a high-temperature confocal scanning laser microscope (HT-CSLM). Secondary dendrite arm spacing (SDAS) and fractal dimension (D) were used to quantitatively describe the local compactness and overall self-similar complexity of the solidification morphology. It was found that the cooling rate had a very important influence on the local and overall morphology characteristics of solidification structures. At the superheat elimination stage, the cooling rate affected the morphology of the microstructure through the dynamic structural fluctuation between the generation and disappearance of atomic clusters in the molten steel. At the liquid–solid phase transformation stage, the cooling rate affected the local morphology of the microstructure by affecting the solute diffusion rate between dendrite arms, while it affected the overall morphology by changing the concentration undercooling at the front of all solidified interfaces. The presented results show that adjusting the cooling system at the superheat elimination stage can also be an important way to control the solidified morphology of different alloys.

Graphical Abstract

1. Introduction

High carbon steel tends to solidify in a wide temperature range during continuous casting due to the high C content that is prone to internal quality defects such as macrosegregation and shrinkage cavities [1,2,3,4]. Macrosegregation in the casting occurs within the mushy zone. In general, it is mainly caused by interdendritic flow, driven by thermal convection or solute convection and solidification shrinkage [5,6,7]. It is an effective way to control the formation of macrosegregation defects during the solidification of metal alloys by controlling the morphology of the structure to increase the resistance of interdendritic flow. Thus, the morphology of the solidification structure plays a very important role in controlling the severity of macrosegregation. In addition, the morphology characteristics of the solidification structure in high carbon steel are very common, which is also very meaningful for similar phenomena in other alloys.
The cooling process of alloy includes the stage of the superheat elimination (i.e., the temperature of melt from the casting temperature to liquidus), the stage of liquid–solid transformation (i.e., the temperature of the melt from liquidus to solidus), and the stage of solid phase transformation (i.e., the temperature when the melt is lower than solidus). Previous studies have shown that superheat has an important influence on the solidification structure of alloys [8,9]. The level of superheat affects the temperature distribution and cooling conditions of the stage of superheat elimination. Wang et al. [10] studied the effect of superheat on the morphology characteristics of the solidification structure in GCr15 bearing steel with the same cooling rate. The results showed that secondary dendrite arm spacing increased with increasing superheat when the cooling rate was constant. This shows that the stage of superheat elimination also affects the solidification structure of the alloy. On the other hand, it is generally believed that the stage of liquid–solid transformation is the key stage affecting the solidification structure of the alloy. This is mainly because the crystal morphology during alloy solidification is not only affected by heat transfer, but it is also mainly affected by mass transfer. The diffusion of solutes at the front of the solidified interface will cause concentration undercooling [11,12]. The crystal morphology changes from planar grains to cellular grains and dendritic grains with the increase of constitutional undercooling. Tiller et al. [13] showed that the distribution of solutes at the front of the solid–liquid interface is affected by the cooling rate. Therefore, the cooling rate has an important effect on crystal morphology during the alloy cooling process. Related works have been reported in the literature. Garcia et al. [14] studied the effect of the cooling rate on the dendrite arm spacing and morphology of Ag3Sn intermetallic particles of a SnAg solder alloy. Fu et al. [15] discussed the effect of the cooling rate on the microstructures in AlSi304 stainless steel. In addition, the high-temperature confocal scanning laser microscope (HT-CSLM) is an in situ direct observation device of crystallization in undercooled melts, and it can accurately control the temperature of the solidification process. Therefore, HT-CSLM has a great potential for solidification process research. Hao et al. [16] studied the effect of the cooling rate on the solidification and segregation characteristics of Fe–Cr–Ni–Mo–N super austenitic stainless steel using an HT-CSLM. Miao et al. [17] investigated the in situ solidification process of a superalloy IN718 using an HT-CSLM. However, the previous works on the alloy cooling process did not distinguish between the stages of superheat elimination and liquid–solid phase transformation. It can be seen that the effect of the different cooling rates at the stage of superheat elimination and liquid–solid phase transformation on the solidification morphology of the alloy is unclear.
The morphology of the solidification structure is very complicated. Solidification structures have conventionally only been characterized by measuring the primary or secondary dendrite arm spacing in a dendritic network. However, these measurement methods cannot adequately describe the integral morphology of the solidification structure. To evaluate the self-similarity complexity and overall morphology characteristics of the solidification structure, the fractal dimension has been used to describe the structure of materials [18,19,20,21,22,23]. Ishida et al. [18] simulated the evolution process of dendrite morphology in Fe-based alloy using a phase-field method and quantitatively described the dendritic morphology by fractal dimension. Cao et al. [22] introduced the fractal dimension to quantitatively characterize the morphology of the solidification structure in the actual continuous casting billet. The results showed that the fractal dimension is an effective parameter to quantitatively describe the overall morphology characteristics of the solidification structure, and it changes with the change in solidification parameters. However, the effect of the cooling rate on the fractal dimension of the solidification structure has not yet been reported.
In the present work, the solidification process of high carbon steel (70 steel as an example) at different cooling rates (10, 50, 100, and 150 °C/min) of the stage of superheat elimination and the liquid–solid phase transformation was simulated and observed in situ based on HT-CSLM. The microstructure and macrostructure of 70 steel at different cooling rates were compared. In addition, secondary dendrite arm spacing and fractal dimension were used to quantitatively describe the local and overall morphology of solidification structures at different cooling rates, respectively. Finally, different influencing mechanisms of the cooling rate at the stage of superheat elimination and liquid–solid phase transformation on secondary dendrite arm spacing and fractal characteristics of the solidification structure are discussed.

2. Experiment

2.1. HT-CSLM Experiments

The liquidus temperature, solidus temperature, and chemical composition of the high carbon steel used in the present work are given in Table 1. The experiment was performed on a VL2000DX-SVF17SP (Lasertec, Yokohama, Japan) high-temperature confocal scanning laser microscope (HT-CSLM). A schematic diagram of the HT-CSLM and crucible can be found in the literature [24]. The HT-CSLM system consists of two main parts: the high-temperature heating furnace and the laser confocal microscope. The high temperature furnace is heated by a 1.5 kw halogen light source with an infrared reflective light collection and cooled by helium during the cooling stage. The temperature increase and fall process can be controlled according to a pre-established heating and cooling programme. In the present experiment, a cylindrical alumina crucible with a diameter of 7.8 mm and a height of 3 mm was used. The sample was placed in an alumina crucible located on the infrared light focus holder of the furnace, and a 1.5 kW halogen lamp was used to heat the sample through light radiation. The temperature of the crucible was measured by a thermocouple to obtain the temperature of the steel in the crucible. The protective gas was high-purity N2. To achieve rapid cooling of the samples, He was used as the auxiliary cooling gas. Theoretically, the fastest cooling rate can be up to 100 °C/s. Figure 1 depicts the heating and cooling curves of the HT-CSLM. The sample was first heated to 1515 °C (superheat 40 °C) and isothermal holding at 1515 °C for 1 min to melt completely. Then, the influence of the cooling rate (10, 50, 100, and 150 °C/min) on the morphology characteristics of solidification structure was studied at the stage of superheat elimination and liquid–solid phase transformation, respectively. To ensure the accuracy and reliability of the experiment, the solidification process of 70 steel at a cooling rate of 10 °C/min was repeated three times.
A cylinder specimen with a diameter of 7.8 mm and a height of 3 mm was cut from the surface layer of the actual billet. Then, the cylinder specimen was polished and cleaned by an ultrasonic wave. A prepared specimen was placed in a crucible of the HT-CSLM equipment, and a thermal simulation experiment was conducted according to the curve as shown in Figure 1. The cooling mode was mainly isothermal heat transfer because of the small size of samples. The heating and cooling process of the sample can be visualized in real time during the experiment. Images were saved at 1–10 frames per second according to different cooling rates. After the end of the HT-CSLM experiment, the surface of the sample was smoothed with sandpaper. Ensure all samples have the same height. Then, they were macroetched with a 1:1 warm hydrochloric acid–water solution at the temperature of 60~80 °C for revealing the solidification structure.

2.2. Characterization of Solidification Structure

Secondary dendrite arm spacing (SDAS) and fractal dimension were used to quantitatively describe the local and overall morphology characteristics of the solidification structure obtained by the HT-CSLM thermal simulation experiment in the present work. The SDAS of the billet was measured with the linear intercept method. The average spacing of multiple typical dendrite arms was taken as SDAS. Fractal dimension is a novel mathematical concept proposed by Mandelbrot [25,26] in the 1970s to describe the complexity and irregularity of geometric objects in nature. Since it was put forward, the fractal theory has been applied in many fields and has been further improved and developed. In the materials field, the fractal theory has been applied to describe the morphology of dendrites in different alloys. A fractal dimension is a quantitative index to evaluate the overall morphology characteristics of a dendritic array.
There are many methods to calculate a fractal dimension. In the present work, the fractal dimension of the solidification structure was calculated using the box-counting method [21,22]. Figure 2 shows the calculation process of the fractal dimension of the samples at the cooling rate of 10 °C/min at the stage of superheat elimination. The white and black regions are the solidification structure and segregation, respectively. The procedure of the box-counting method is as follows: The area, including the solidification structure and segregation, was divided into square meshes with the size of r. The number of meshes, N(r), in which the solidification structure was included, was counted (N(r) needs to be counted as long as it contains white). Then, the mesh size, r, was changed, and the same procedure was repeated. The fractal dimension of the solidification structure can be obtained by Equation (1). In actual calculations, a series of r and the corresponding N(r) were obtained. Then, the lnr was taken as the horizontal coordinate and the lnN(r) as the vertical coordinate. The fractal dimension (D) is the absolute value of the slope, which was obtained by linear fitting of all the data points in the graph with the least squares method.
N ( r ) = c × r D
where N(r) is the number of meshes, r the mesh size, D the fractal dimension, and c a size–independent constant.
Figure 3 shows the solidification structure morphology of 70 steel obtained by three repeated experiments at a cooling rate of 10 °C/min. SDAS and D of the solidification structure under three experiments were calculated as shown in Table 2. It can be seen that the D obtained by the three repeated experiments were very close, and so were the SDAS. This indicates that it is accurate and reliable to simulate the solidification process of 70 steel billet by HT-CSLM. It is feasible to study the solidification process of 70 steel at different cooling rates based on HT-CSLM. The first experimental results at a cooling rate 10 °C/min were selected for subsequent analysis.

3. Results

3.1. In Situ Microstructures upon Cooling Processes

The heating and cooling process of 70 steel can be observed in situ by HT-CSLM. Figure 4a–h shows the in situ microstructures’ evolution of the initial solidification process at a cooling rate of 10 °C/min at the stage of the liquid–solid phase transformation. There was no crystal core in the liquid phase at the beginning with the decrease in temperature during the cooling process of molten steel. A crystal core began to appear in molten steel when the temperature dropped near the liquidus temperature as shown in Figure 4b. The crystal nuclei were randomly generated in the liquid phase or formed with inclusions. Crystal nuclei grow gradually, and the new crystal nucleus was formed with the decrease in the liquid steel temperature. During the growth of crystal nuclei, the merging of crystal nuclei can also occur, i.e., two small crystal nuclei merge into a large crystal nucleus (as shown in Figure 4e). At the same time, the liquid phase decreased gradually, and the solid phase increased gradually until the liquid phase became a solid phase with the decrease in the molten steel temperature. It can be seen that the formation, growth, and merging of crystal nuclei were accompanied by the entire process of alloy solidification.
Figure 5a,b show the microstructural morphology at 1457 °C under different cooling rates at the stage of superheat elimination and the liquid–solid phase transformation, respectively. It can be seen from Figure 5a, the grains were coarser, and the number was smaller at 10 °C/min; the morphology of grains was dendritic at 50 °C/min; the grains became smaller and more numerous at 100 °C/min; the grain size was smaller at 150 °C/min. In Figure 5b, the grain size gradually decreased, and the number increased with the increase in the cooling rate. It can be seen that the cooling rate at the stage of superheat elimination and the liquid–solid phase transformation had an important effect on the microstructure of the initial solidification in alloys.

3.2. Morphology of Solidification Structure

3.2.1. Solidification Structure at Different Cooling Rates

The morphology of the solidification structure plays a very important role in governing the severity of macrosegregation. On the other hand, it directly determines the mechanical properties of the billets. Figure 6a,b show the optical microscopy (OM) solidification microstructures of HT-CSLM specimens obtained under four cooling rates at the stage of superheat elimination and the liquid–solid phase transformation, respectively. The solidification conditions are the same at 10 °C/min as shown in Figure 1; thus, solidification structures at 10 °C/min are the same at the stage of superheat elimination and liquidus to solidus. The white and black regions correspond to the solidification structure and segregation, respectively. It can be seen that the solidification structure was composed of equiaxed dendrites and columnar dendrites. Segregation was located in the interdendritic zone and was closely related to the morphology of the solidification structure. In Figure 6a, the change in the solidification morphology with the cooling rate is not obvious. In Figure 6b, the solidification structure is smaller, and the secondary dendrite arm is more developed with the increase in the cooling rate. To better understand the influence of the cooling rate on the morphology characteristics, secondary dendrite arm spacing and the fractal dimension were used to quantitatively describe the solidification structure.

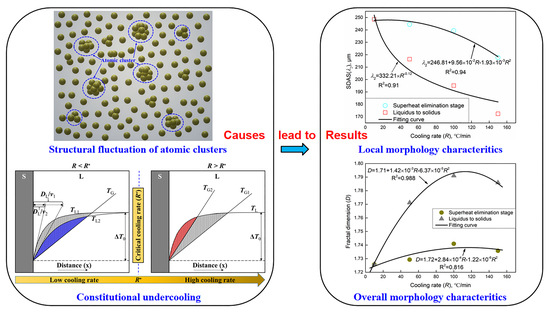
3.2.2. Secondary Dendrite Arm Spacing

Secondary dendrite arm spacing (SDAS, λ2) is an important parameter that reflects the local characteristics of the solidification structure. The smaller the SDAS, the denser the solidification structure. The size of the secondary dendrite arm spacing directly affects the distribution of component segregation, second phase, and microscopic cavities, thus having an impact on alloys properties. Particularly, the influence of dendrite arm spacing upon the mechanical properties, i.e., ultimate tensile strength [27], yield strength [28], and corrosion behavior [29]. Figure 7 shows the effect of the cooling rate on the SDAS. It can be seen that the SDAS at the stage of superheat elimination and the liquid–solid phase transformation decreases with the increase in the cooling rate. Previous studies found that SDAS mainly depends on the alloy composition and cooling rate [3,30,31]. The SDAS and cooling rate satisfy a certain relationship when the alloy composition is constant (i.e., λ2 = a·Rb), where a and b are constants under certain conditions of alloy composition, and R is the cooling rate. The SDAS and cooling rate at the stage of superheat elimination and the liquid–solid phase transformation were, respectively, fitted according to the equation λ2 = a·Rb as shown in Figure 7. λ2 = 274.22 × R−0.04 and the fitting coefficient was 0.39 for the stage of superheat elimination. λ2 = 332.21 × R−0.12 and the fitting coefficient was 0.91 for the stage of the liquid–solid phase transformation. At the stage of the superheat elimination, the SDAS was 249 μm at 10 °C/min, and the SDAS was 218 μm at 150 °C/min, which was reduced by 12.5%. At the stage of the liquid–solid phase transformation, the SDAS was 249 μm at 10 °C/min, and the SDAS was 1728 μm at 150 °C/min, which was reduced by 30.9%.

3.2.3. Fractal Dimension (D)

Figure 8 shows the effect of the cooling rate on the fractal dimension. It can be seen that the fractal dimension increased gradually with the increase in the cooling rate and then basically remained unchanged at the stage of the superheat elimination. The relationship between the fractal dimension and cooling rate was expressed as follows: D = 1.72 + 2.84 × 10⁻⁴ × R − 1.22 × 10⁻⁶ × R2; the fitting coefficient was 0.816. The fractal dimension first increased and then decreased with the increase in the cooling rate at the stage of the liquid–solid phase transformation. The relationship between the fractal dimension and cooling rate was expressed as follows: D = 1.71 + 1.42 × 10⁻³ × R − 6.37 × 10⁻⁵ × R2; the fitting coefficient was 0.988. The fractal dimension characterizes quantitatively the self-similar complexity of the solidification morphology. Therefore, the above results indicate that the self-similar complexity of the solidification morphology first increased and then decreased with the increase in the cooling rate. When the cooling rate was 100 °C/min at the stage of the superheat elimination and the liquid–solid phase transformation, the fractal dimension was the largest, which was 1.7410 and 1.7910, respectively. Moreover, it was found that the cooling rate had a greater influence on SDAS than the fractal dimension by comparison in Figure 7 and Figure 8.

4. Discussion

4.1. The Influence of the Superheat Elimination Stage

Figure 7 shows that the relationship between SDAS and cooling rate was expressed as follows: λ2 = 274.22 × R−0.04; the fitting coefficient was 0.39. It can be seen that the equation λ2 = a·Rb was not very suitable to describe the relationship between SDAS and the cooling rate at the stage of the superheat elimination. To describe the quantitative relationship between SDAS and the cooling rate at the stage of the superheat elimination more accurately, it was fitted again. The relationship between SDAS and the cooling rate was expressed as follows: λ2 = 253.81 − 0.21 × R, the fitting coefficient was 0.796 as shown in Figure 9. In addition, the relationship between the fractal dimension and cooling rate at the stage of the superheat elimination is shown in Figure 8.
The cooling rate at the stage of the superheat elimination had an important effect on the solidification structure of alloys as shown in Figure 8 and Figure 9. Generally, an alloy is liquid when the temperature is higher than the liquidus temperature, and the liquid metal structure shows “long-range disorder and short-range order” [32,33]. There are energy fluctuations, composition fluctuations, and phase fluctuations when the liquid metal is cooled, which makes atomic clusters appear in the liquid as shown in the blue dashed circle in Figure 10. Some of these atomic clusters continue to grow and become crystal nuclei, and some are remelted during subsequent cooling. The latest research by Jeon et al. [34] shows the early stages of atomic crystallization occur through dynamic structural fluctuations between disordered and crystalline states, rather than through a single irreversible transition.
Based on the above, it is speculated that more atomic clusters in the molten steel are retained and serve as the core of the crystal nuclei with the increase in the cooling rate at the stage of the superheat elimination. The higher the number of crystal nuclei, the smaller the SDAS. On the other hand, the degree of solid-phase disorder increases with the increase in the number of crystal grains, which makes the overall morphology of the solidification structure more complex, and the fractal dimension becomes larger. When the cooling rate is further increased, the fractal dimension remains basically unchanged. This indicates that the cooling rate at the stage of the superheat elimination affects the morphology characteristics by mainly affecting the number of atomic clusters. Consequently, the cooling rate at the stage of the superheat elimination has a limited effect on the overall morphology characteristics of the solidification structure.

4.2. The Influence of Liquid–Solid Phase Transformation Stage

The relationship between SDAS and cooling rate at the stage of the liquid–solid phase transformation is shown in Figure 7. It can be expressed by λ2 = 332.21 × R−0.12, the fitting coefficient was 0.910. It can be seen that the relationship between the SDAS and the cooling rate at the stage of the liquid–solid phase transformation obeys the equation: λ2 = a·Rb. Generally, SDAS is largely determined by the cooling process of dendrite growth. In the process of dendrite growth, the solute concentration in the liquid phase near the dendrite arm is different due to the fact of their different curvature. The smaller the dendrite curvature radius, the lower the concentration of solute in the liquid phase near the dendrite. Consequently, the solute concentration gradient will promote the solute diffusion from the thick branches to the thin branches, causing the thin branches to melt and the thick branches to thicken, i.e., dendrite coarsening [35,36,37]. The longer the residence time in the liquid–solid two-phase region, the more sufficient the above process and the larger SDAS. With the increase in the cooling rate, the shorter the residence time of the dendrites in the liquid–solid two-phase region and the smaller the SDAS.
Figure 8 shows the relationship between the fractal dimension and the cooling rate at the stage of liquid–solid phase transformation. It can be seen that the fractal dimension first increased and then decreased with an increase in the cooling rate. The morphology of the solidification structure during the alloys’ solidification was not only affected by heat transfer, but it was also mainly affected by mass transfer. For the alloy with an equilibrium distribution coefficient of solute less than 1, a stable solute-rich layer will be formed in the liquid phase at the solidified interface front, resulting in concentration undercooling [11,12]. Fractal dimension is a quantitative index to describe the characteristics of the solidification structure. Thus, the fractal dimension was also affected by concentration undercooling. Cao et al. [22] and Aritaka et al. [38] showed that the larger the concentration undercooling region, the more complex the solidification morphology and the larger the fractal dimension. Tiller et al. [13] proposed the criterion of concentration undercooling as shown in Equation (2). It can be seen that the degree of concentration undercooling is mainly affected by the temperature gradient at the front of the liquid–solid interface (GL), the growth rate (v), and the diffusion length scale(δN).
G L D L v < m L C 0 1 k 0 1 k 0 + e v D L δ N
where mL is the slope of the liquidus, DL is the solute diffusion coefficient, C0 is the original composition of the alloy, and k0 is the solute redistribution coefficient.
The cooling rate is the product of the temperature gradient and the growth rate, i.e., R = GLv. The size of the sample obtained by HT-CSLM was small (a cylindrical sample with a diameter of 7.8 mm and a height of 3 mm). At a low cooling rate, the temperature inside the sample has enough time to become the same. It can be considered that the temperature gradient is unchanged basically at different cooling rates. Thus, the growth rate of dendrite increases gradually with the increase in the cooling rate. In general, the rate of solute discharged at the solidified interface is proportional to the growth rate of dendrite. The discharged solute diffuses along the direction of the concentration gradient. Therefore, the higher the growth rate, the steeper the concentration gradient, i.e., the smaller the DL/v. According to Equation (2), the decrease in DL/v will increase the concentration undercooling zone at the liquid–solid interface, and the solidification morphology will be more complicated. When the cooling rate is greater than a certain critical value, the temperature inside the sample does not become the same in time. A large cooling rate is more likely to cause a large temperature gradient. It can be considered that the temperature distribution of the actual melt at the front of the liquid–solid interface is unchanged basically when the cooling rate increases due to the low element diffusion rate at a high cooling rate. GL will increase with the increase in the cooling rate at a high cooling rate, which reduces the concentration in the undercooling zone. Therefore, the complexity of solidified morphology is reduced at a high cooling rate.
Figure 11 shows the relationship between the cooling rate and the concentration undercooling at the front of the solidified interface. When the cooling rate was lower than the critical cooling rate (R < R*), the growth rate of the dendrite increased with the increase in the cooling rate, and the concentration gradient was steeper. Therefore, the cooling rate corresponding to v1 will produce a small concentration undercooling zone, and the cooling rate corresponding to v2 will produce a large concentration undercooling zone (the shadowed area) (v1 < v2). When the cooling rate exceeds the critical cooling rate (R > R*), TG1 and TG2 represent temperature gradients at a low and high cooling rate, respectively. It can be seen that the cooling rate corresponding to TG1 will produce a large concentration undercooling zone (the shadowed area), and the cooling rate corresponding to TG2 will produce a small concentration undercooling zone (the red shadowed area).
The concept of a “critical cooling rate” proposed in the present work was used to qualitatively describe the effect of the cooling rate on the morphology characteristics of the solidification structure in high carbon steel. When the cooling rate was less than the critical cooling rate, the concentration undercooling zone increased with an increase in the cooling rate. When the cooling rate was greater than the critical cooling rate, the concentration undercooling zone decreased with an increase in the cooling rate. The larger the concentration undercooling, the more complex the solidified morphology. Therefore, the fractal dimension first increased and then decreased with the increase in the cooling rate in the present work. Ali et al. [39] proposed the “critical cooling rate” to qualitatively describe the effect of the cooling rate on the grain refinement of cast alloys. It can be seen that the critical cooling rate has an important effect on the solidification characteristics of alloys. However, it is difficult for ordinary casting equipment to accurately measure the critical cooling rate. The present work shows that HT-CSLM can accurately control the cooling rate of the solidification process. Therefore, future work can be undertaken to verify the hypothesis of the critical cooling rate in other alloys and more accurately determine the critical value of cooling rate based on HT-CSLM.

5. Conclusions

Secondary dendrite arm spacing (SDAS) and fractal dimension (D) were used to quantitatively describe the local and overall morphology of the solidification structure, respectively. It was found that the cooling rate had different effects on the local and overall morphology characteristics of the solidification structure.
Through HT-CSLM experiments, the relationships between the cooling rate and the SDAS and fractal dimension were established. The corresponding expressions at the stage of the superheat elimination were λ2 = 253.81 − 0.21 × R and D = 1.72 + 2.84 × 10⁻⁴ × R − 1.22 × 10⁻⁶ × R2. The corresponding expressions at the stage of the liquid–solid phase transformation were λ2 = 332.21 × R−0.12 and D = 1.71 + 1.42 × 10⁻³ × R − 6.37 × 10⁻⁵ × R2.
The cooling rate at the stage of the superheat elimination also had an important effect on the morphology of the solidification structure. It is speculated that the cooling rate affects the dynamic structural fluctuations between the generation and disappearance of atomic clusters at the early stages of alloy crystallization.
The solidification structure of 70 steel is more compact with an increasing cooling rate at the stage of liquid–solid phase transformation, while the self-similar complexity of the solidification structure first increases and then decreases with an increasing cooling rate.

Author Contributions

Data analysis, J.C.; Investigation, Z.H.; Experimental verification, Z.Z.; Visualization, F.Z.; Software, D.G.; writing—original draft preparation, J.C.; writing—review and editing, Z.H. All authors have read and agreed to the published version of the manuscript.

Funding

This research was funded by United Funds between National Natural Science Foundation and Baowu Steel Group Corporation Limited from China (No. U1860101).

Institutional Review Board Statement

Not applicable.

Informed Consent Statement

Not applicable.

Data Availability Statement

Not applicable.

Acknowledgments

The authors are very grateful for support from United Funds between the National Natural Science Foundation and the Baowu Steel Group Corporation Limited of China (No. U1860101).

Conflicts of Interest

The authors declare no conflict of interest.

References

  1. Mayer, F.; Wu, M.; Ludwig, A. On the Formation of Centreline Segregation in Continuous Slab Casting of Steel due to Bulging and/or Feeding. Steel Res. Int. 2010, 81, 660–667. [Google Scholar] [CrossRef]
  2. Sang, B.; Kang, X.; Li, D. A novel technique for reducing macrosegregation in heavy steel ingots. J. Mater. Process. Technol. 2010, 210, 703–711. [Google Scholar] [CrossRef]
  3. Choudhary, S.; Ganguly, S.; SenGupta, A.; Sharma, V. Solidification morphology and segregation in continuously cast steel slab. J. Mater. Process. Technol. 2016, 243, 312–321. [Google Scholar] [CrossRef]
  4. Pickering, E. Macrosegregation in Steel Ingots: The Applicability of Modelling and Characterisation Techniques. ISIJ Int. 2013, 53, 935–949. [Google Scholar] [CrossRef] [Green Version]
  5. Flemings, M.C. Our Understanding of Macrosegregation. Past and Present. ISIJ Int. 2000, 40, 833–841. [Google Scholar] [CrossRef]
  6. Guan, R.; Ji, C.; Wu, C.; Zhu, M. Numerical modelling of fluid flow and macrosegregation in a continuous casting slab with asymmetrical bulging and mechanical reduction. Int. J. Heat Mass Transf. 2019, 141, 503–516. [Google Scholar] [CrossRef]
  7. Ge, H.; Li, J.; Han, X.; Xia, M.; Li, J. Dendritic model for macrosegregation prediction of large scale castings. J. Mater. Process. Technol. 2016, 227, 308–317. [Google Scholar] [CrossRef]
  8. Choudhary, S.K.; Ganguly, S. Morphology and Segregation in Continuously Cast High Carbon Steel Billets. ISIJ Int. 2007, 47, 1759–1766. [Google Scholar] [CrossRef] [Green Version]
  9. Hou, Z.; Jiang, F.; Cheng, G. Solidification Structure and Compactness Degree of Central Equiaxed Grain Zone in Continuous Casting Billet Using Cellular Automaton-Finite Element Method. ISIJ Int. 2012, 52, 1301–1309. [Google Scholar] [CrossRef] [Green Version]
  10. Wang, W. Effect of Superheat on the Internal Quality of Continuous-Casting Billet for Bearing Steel; Chongqing University: Chongqing, China, 2017. [Google Scholar]
  11. Rutter, J.W.; Chalmers, B.J. A prismatic substructure formed during solidification of metals. Can. J. Phys. 1953, 31, 15–39. [Google Scholar] [CrossRef]
  12. StJohn, D.H.; Prasad, A.; Easton, M.; Qian, M. The Contribution of Constitutional Supercooling to Nucleation and Grain Formation. Met. Mater. Trans. A 2015, 46, 4868–4885. [Google Scholar] [CrossRef] [Green Version]
  13. Tiller, W.; Jackson, K.; Rutter, J.; Chalmers, B. The redistribution of solute atoms during the solidification of metals. Acta Met. 1953, 1, 428–437. [Google Scholar] [CrossRef]
  14. Garcia, L.R.; Osório, W.R.; Garcia, A. The effect of cooling rate on the dendritic spacing and morphology of Ag3Sn intermetallic particles of a SnAg solder alloy. Mater. Des. 2011, 32, 3008–3012. [Google Scholar] [CrossRef]
  15. Fu, J.W.; Yang, Y.; Guo, J.J.; Tong, W.H. Effect of cooling rate on solidification microstructures in AISI 304 stainless steel. Mater. Sci. Technol. 2008, 24, 941–944. [Google Scholar] [CrossRef]
  16. Hao, Y.; Li, J.; Li, X.; Liu, W.; Cao, G.; Li, C.; Liu, Z. Influences of cooling rates on solidification and segregation characteristics of Fe-Cr-Ni-Mo-N super austenitic stainless steel. J. Mater. Process. Technol. 2019, 275, 116326. [Google Scholar] [CrossRef]
  17. Miao, Z.-J.; Shan, A.-D.; Wang, W.; Lu, J.; Xu, W.-L.; Song, H.-W. Solidification process of conventional superalloy by confocal scanning laser microscope. Trans. Nonferrous Met. Soc. China 2011, 21, 236–242. [Google Scholar] [CrossRef]
  18. Ishida, H.; Natsume, Y.; Ohsasa, K. Characterization of Dendrite Morphology for Evaluating Interdendritic Fluidity Based on Phase-field Simulation. ISIJ Int. 2009, 49, 37–43. [Google Scholar] [CrossRef] [Green Version]
  19. Yang, A.; Xiong, Y.; Liu, L. Fractal characteristics of dendrite and cellular structure in nickel–based superalloy at intermediate cooling rate. Sci. Technol. Adv. Mater. 2001, 2, 101–103. [Google Scholar] [CrossRef] [Green Version]
  20. Chang, Q.; Chen, D.L.; Ru, H.Q.; Yue, X.Y.; Yu, L.; Zhang, C.P. Three-dimensional fractal analysis of fracture surfaces in titanium–iron particulate reinforced hydroxyapatite composites: Relationship between fracture toughness and fractal dimension. J. Mater. Sci. 2011, 46, 6118–6123. [Google Scholar] [CrossRef]
  21. Kobayashi, S.; Maruyama, T.; Tsurekawa, S.; Watanabe, T. Grain boundary engineering based on fractal analysis for control of segregation-induced intergranular brittle fracture in polycrystalline nickel. Acta Mater. 2012, 60, 6200–6212. [Google Scholar] [CrossRef]
  22. Cao, J.; Hou, Z.; Guo, D.; Guo, Z.; Tang, P. Morphology characteristics of solidification structure in high-carbon steel billet based on fractal theory. J. Mater. Sci. 2019, 54, 12851–12862. [Google Scholar] [CrossRef]
  23. Cao, J.H.; Hou, Z.B.; Guo, Z.A.; Guo, D.W.; Tang, P. Effect of superheat on integral characteristics of solidification structure in bearing steel continuous casting billet. Acta Metall. Sin. 2021, 57, 586–594. [Google Scholar] [CrossRef]
  24. Liu, L.; Hu, M.-L.; Bai, C.-G.; Lü, X.-W.; Xu, Y.-Z.; Deng, Q.-Y. Effect of cooling rate on the crystallization behavior of perovskite in high titanium-bearing blast furnace slag. Int. J. Miner. Met. Mater. 2014, 21, 1052–1061. [Google Scholar] [CrossRef] [Green Version]
  25. Mandelbrot, B. How Long Is the Coast of Britain? Statistical Self-Similarity and Fractional Dimension. Science 1967, 156, 636–638. [Google Scholar] [CrossRef] [Green Version]
  26. Mandelbrot, B.B. The Fractal Geometry of Nature, 1st ed.; WH Freeman: New York, NY, USA, 1982. [Google Scholar]
  27. Ceschini, L.; Morri, A.; Morri, A.; Gamberini, A.; Messieri, S. Correlation between ultimate tensile strength and solidification microstructure for the sand cast A357 aluminium alloy. Mater. Des. 2009, 30, 4525–4531. [Google Scholar] [CrossRef]
  28. Ran, G.; Zhou, J.; Wang, Q. The effect of hot isostatic pressing on the microstructure and tensile properties of an unmodified A356-T6 cast aluminum alloy. J. Alloys Compd. 2006, 421, 80–86. [Google Scholar] [CrossRef]
  29. Berlanga-Labari, C.; Biezma-Moraleda, M.V.; Rivero, P.J. Corrosion of Cast Aluminum Alloys: A Review. Metals 2020, 10, 1384. [Google Scholar] [CrossRef]
  30. Perepezko, J.; Wilde, G. Melt undercooling and nucleation kinetics. Curr. Opin. Solid State Mater. Sci. 2016, 20, 3–12. [Google Scholar] [CrossRef] [Green Version]
  31. Won, Y.-M.; Thomas, B. Simple model of microsegregation during solidification of steels. Met. Mater. Trans. A 2001, 32, 1755–1767. [Google Scholar] [CrossRef]
  32. De Gennes, P.G. Long Range Order and Thermal Fluctuations in Liquid Crystals. Mol. Cryst. 1969, 7, 325–345. [Google Scholar] [CrossRef]
  33. Jia, P.; Li, X.; Zhang, J.; Zhang, K.; Teng, X.; Hu, X.; Yang, C.; Zhao, D. Liquid-liquid structure transition and its effect on the solidification behaviors and microstructure of Sn75Bi25 alloy. J. Mol. Liq. 2018, 263, 218–227. [Google Scholar] [CrossRef]
  34. Jeon, S.; Heo, T.; Hwang, S.-Y.; Ciston, J.; Bustillo, K.C.; Reed, B.W.; Ham, J.; Kang, S.; Kim, S.; Lim, J.; et al. Reversible disorder-order transitions in atomic crystal nucleation. Science 2021, 371, 498–503. [Google Scholar] [CrossRef]
  35. Rettenmayr, M. Melting and remelting phenomena. Int. Mater. Rev. 2009, 54, 1–17. [Google Scholar] [CrossRef]
  36. Terzi, S.; Salvo, L.; Suery, M.; Dahle, A.; Boller, E. Coarsening mechanisms in a dendritic Al–10% Cu alloy. Acta Mater. 2010, 58, 20–30. [Google Scholar] [CrossRef]
  37. Rowenhorst, D.; Voorhees, P. Measurement of Interfacial Evolution in Three Dimensions. Annu. Rev. Mater. Res. 2012, 42, 105–124. [Google Scholar] [CrossRef]
  38. Aritaka, E.; Esaka, H.; Shinozuka, K. Mechanism for Complex Morphology Due to Mechanical Vibration. ISIJ Int. 2016, 56, 1413–1419. [Google Scholar] [CrossRef] [Green Version]
  39. Ali, Y.; You, G.; Pan, F.; Zhang, M.-X. Grain Coarsening of Cast Magnesium Alloys at High Cooling Rate: A New Observation. Met. Mater. Trans. A 2016, 48, 474–481. [Google Scholar] [CrossRef]
Figure 1. Thermal scheme used in the present experiment: (a) the cooling rate at the stage of the liquid–solid phase transformation remains constant, changing the cooling rate at the stage of superheat elimination; (b) the cooling rate at the stage of superheat elimination remains constant, changing the cooling rate at the stage of the liquid–solid phase transformation.
Metals 11 01291 g001
Figure 2. Calculation process of fractal dimension: (a) the original solidification structure (white regions); (b) box grids overlaid on the solidification structure; (c) relation between lnN(r) and lnr for the fractal dimensions.
Metals 11 01291 g002
Figure 3. Solidification structures of three repeated experiments by HT-CSLM at 10 °C/min.
Metals 11 01291 g003
Figure 4. The microstructural evolution of the studied 70 steel upon the cooling processes by HT-CSLM: (a) 1493 °C; (b) 1473 °C; (c) 1469 °C; (d) 1462 °C; (e) 1457 °C; (f) 1442 °C; (g) 1431 °C; (h) 1417 °C.
Metals 11 01291 g004
Figure 5. Microstructures of the studied 70 steel using HT-CSLM under different cooling rates at 1457 °C. (a) Cooling rate was changed at the stage of the superheat elimination, (b) Cooling rate changed at the stage from liquidus to solidus.
Metals 11 01291 g005
Figure 6. OM solidification structures of the studied 70 steel by HT-CSLM at room temperature (typical dendrites are shown in the red circle). (a) Cooling rate was changed at the stage of the superheat elimination. (b) Cooling rate was changed at the stage of liquidus to solidus.
Metals 11 01291 g006
Figure 7. SDAS at different cooling rates.
Metals 11 01291 g007
Figure 8. Fractal dimension at different cooling rates.
Metals 11 01291 g008
Figure 9. Effect of the cooling rate on SDAS at the stage of superheat elimination.
Metals 11 01291 g009
Figure 10. Schematic drawing representing the structure of liquid metal.
Metals 11 01291 g010
Figure 11. Schematic drawing representing the relationship between the cooling rate and the concentration undercooling formation ahead of the S/L interface.
Metals 11 01291 g011
Table 1. Specification of studied alloys, wt.%.
Liquidus Temperature, °CSolidus Temperature, °CMain Chemical Compositions, Mass%
CSiMnPSFe
147513880.70.20.650.0110.0023Bal.
Table 2. SDAS and fractal dimensions (D) of three repeated experiments.
ParametersNo. 1No. 2No. 3
SDAS (μm)248.5255.5251.1
D1.72581.72891.7266
Publisher’s Note: MDPI stays neutral with regard to jurisdictional claims in published maps and institutional affiliations.

