Article

Numerical Simulation of Macrosegregation Formation in a 2.45 ton Steel Ingot Using a Three-Phase Equiaxed Solidification Model

1
Key Laboratory of Electromagnetic Processing of Materials (Ministry of Education), Northeastern University, Shenyang 110004, China
2
University Grenoble Alpes, CNRS, Grenoble INP, SIMAP, F-38000 Grenoble, France
3
School of Metallurgy, Northeastern University, Shenyang 110004, China
4
University Grenoble Alpes, CNRS, Grenoble INP, LEGI, F-38000 Grenoble, France
*
Author to whom correspondence should be addressed.
Metals 2021, 11(2), 262; https://doi.org/10.3390/met11020262
Submission received: 21 December 2020 / Revised: 21 January 2021 / Accepted: 28 January 2021 / Published: 4 February 2021
(This article belongs to the Special Issue Numerical Simulation of Solidification Processes)

Abstract

:
In the present work macrosegregation during solidification of a 2.45 ton steel ingot is simulated with a pure equiaxed model, which was tested previously via modeling of a benchmark experiment. While the columnar structure is not taken into account, a packed layer formed over inner walls of the mold at an early stage of solidification reproduces to some extent phenomena generally related to zones of columnar dendrites. Furthermore, it is demonstrated that interaction of free-floating equiaxed grains with ascending convective flow in the bulk liquid results in flow instabilities. This defines the irregular form of the negative segregation zone, the formation of which at the ingot bottom corresponds to experimental observation. Vertical channels reported in experimental measurements are reproduced in simulations. It is confirmed that intensification of ingot cooling may decrease segregation in the ingot.

1. Introduction

Manufacturing of large-size ingots is a fundamental process in industrial production of heavy machinery. The first thorough study of segregation in a large number of ingots ranging from 14 cwts. (765 kg) to 172 tons was presented in the first report of a special committee of the Iron and Steel Institute of Great Britain [1]. Apart from “the very thin extreme outer skin of true chill crystals,” three zones were revealed in the ingots studied. The zone adjacent to the outer thin layer (zone 1) consisted of columnar grains directed inward, while the thickness of the zone was found to be dependent on casting conditions and steel composition. The second zone (zone 2) beyond zone 1, proceeding inward in a radial direction, was reported to be richer in segregates with an annular inner boundary “having roughly the form of a truncated cone or pyramid.” In addition, A-shape segregates were documented for this zone. Furthermore, sulfur prints and etching revealed a central zone (zone 3) in which solid grains could be considered to be equiaxed or, as said in the report, “the crystals may cease to possess the hitherto well marked columnar form” [1]. Near the central axis, V-shape segregates were usually present: The lowest part of the central zone was defined as the purest, and the top of the ingot presented strong segregation.
Various laboratory-scale experiments were developed later in order to study the effect of solidification parameters on solid structure and segregation, and patterns similar to those reported for large-size ingots were found [2,3,4]. These experiments served for validation of solidification models, which were further used to explain the segregation phenomenon in ingots. Thus, the gravity-induced flow of liquid through the mushy zone and the remelting of the solid phase were shown to be potentially responsible for the formation of centerline segregation, as well as of A-type and V-type segregates, depending on density variation due to liquid enrichment and on the variation and direction of the thermal gradient [5]. This analysis was then extended to multicomponent alloys [6]. State of the art regarding numerical simulations of segregation in ingots was thoroughly reviewed in 1999 [7] and 2009 [8]. Compact but detailed reviews were also provided for later periods [9,10] regarding both experimental and numerical studies aiming to reproduce segregation patterns observed in large-scale ingots. In this paper, we provide only a brief description of the limited number of numerical simulations conducted for large-size ingots with coupled equations, accounting for flow of the liquid phase, heat and mass transfer, and phase transition. In most of them, calculated values of segregation were compared with measurements performed in ingots. For example, multicomponent segregation was modeled for a 6.2 ton steel ingot and the distribution of carbon concentration obtained numerically was found to be qualitatively similar to that measured in axial and to transversal directions. However, negative segregation at the ingot bottom was clearly not obtained in simulations [11]. This discrepancy between numerical and experimental results was attributed to the eventual sedimentation of solid grains, which was not included in the model. Based on a volume-averaged formulation of a model that accounted for shrinkage, evolution of primary dendrite arm spacing and back-diffusion in the solid was used for the simulation of the solidification of a large steel ingot [7]. Although the predicted two-dimensional distribution of the carbon concentration qualitatively reproduced macrosegregation in the ingot, it did not show A-segregates, which is explained by the coarse mesh used in the simulation. Again, the negative segregation cone was not reproduced as the settling of solid crystals was not taken into account in the modeling. However, in more recent works, numerical models with fixed solid phase were still employed when particular parameters of solidification processes were studied. For example, flow instabilities as a result of buoyancy-induced thermal and solutal effects were shown to form either A-shaped or V-shaped channels [12], i.e., a qualitative analysis performed earlier [5] was undertaken for a 3.3 ton ingot with a more rigorous numerical model. It was shown that V-oriented or A-oriented segregates may form without any remelting of the solid phase. In addition, weak segregation at the ingot bottom (segregation index ~4%) was demonstrated for the case when solutal convection strongly prevailed over thermal convection, counteracting the latter. Later, formation of a negative segregation cone at the ingot bottom was confirmed [13] with expansion coefficients equal to the corresponding ones in the reference [12]. However, segregation in the upper part of the ingot was different, a fact that again can be attributed to the coarser mesh used for the simulation. Another numerical study with fixed solid phase carried out for a 3.3 ton steel ingot demonstrated that macrosegregation can be alleviated by increasing the cooling intensity of the ingot [14]. To date, the fixed solid phase approach remains attractive for numerical studies of solidification of large-scale industrial ingots, as it greatly reduces modeling complexity.
However, according to references elsewhere [3], even prior to publishing the report in 1926 [1], the central ingot zone had been supposed to be formed from free-floating equiaxed grains. One of the first attempts to numerically study the effect of the sedimentation of grains on macrosegregation was made for a 4 ton ingot [15]. Simulations were conducted for different zones with a simplified system of equations, where only the vertical component of velocity with a pre-calculated value was taken in the zone with the sedimentation cone. Later, a theory developed on the basis of volume averaging (or statistical ensemble averaging) provided a system of equations able to account for the floating equiaxed dendrites. A detailed review of equiaxed model development can be found elsewhere [16]. However, although the formulation was available, its application required the definition of multiple parameters for auxiliary closure equations, and this is still the case. Nevertheless, the pure equiaxed solidification model was applied to the study of macrosegregation in the 3.3 ton steel ingot [8,17,18]. Combeau et al. [8] numerically studied three cases, which corresponded to the fixed solid phase, to free-floating equiaxed grains with a dendrite structure, and to free-floating grains of globular shape. Similar to previous modeling for steel ingots [11], the initial temperature of the melt was equal to the liquidus temperature of the nominal composition of steel, but this time the growth kinetic was taken into account for the solid phase. Probably due to the latter, the predicted negative segregation at the ingot bottom was more pronounced than in previous results in the case of fixed solid grains [11]. Qualitatively, segregation distribution obtained with free-floating dendrites was quite similar to results with the fixed solid phase but had a more “diffused” character. Although both cases demonstrated A-type segregation bands, the formation of which was found sensitive to mesh, a zone with positive segregation observed in the real ingot was only partially reproduced with free-floating grains. When the dendritic structure of grains was ignored, the negative segregation in the ingot was seriously overestimated. The same type of study was carried out with a slightly different formulation for momentum equation for the solid phase and a different drag force between the solid and liquid phases [17]. In addition, formation of the shrinkage cavity was considered in one of three cases studied. Results were quite similar to those obtained by Combeau et al. [8]. In the work of Nguyen et al. [18], a time-splitting technique was implemented in a model constructed using the finite element method (FEM) and applied to modeling of segregation in a 3.3 ton steel ingot accounting for different types of floating solid grains [8]. However, the study was focused on numerical treatment of the problem using FEM.
Finally, it should be mentioned that soon after pure equiaxed models started being used, three-phase columnar and equiaxed models [19,20,21,22], as well as models with an even greater number of phases [23], began to be exploited. Although these models allow some insight into the origin of various zones that form in the ingot [1], it must be accepted that these simulations are very sensitive to the choice made for closure relations and numerical parameters. On the other hand, application of pure equiaxed models with regard to large ingots was studied only for a very limited combination of parameters. In our previous paper, we presented a three-phase equiaxed solidification model that accounted for the growth of equiaxed grains, their motion, and the formation of macrosegregation [24]. In the model, a specific approach to the calculation of solute diffusion length under convective flow was applied. This model was then validated through numerical simulation for benchmark solidification of a Sn–10 wt.%Pb alloy in the AFRODITE setup [25]. In this study, we present the numerical simulation for the solidification of a 2.45 ton steel ingot to study the role of equiaxed grain transportation in the formation of global segregation. The effect of surface cooling intensity on grain growth, melt flow, and macrosegregation is also investigated.

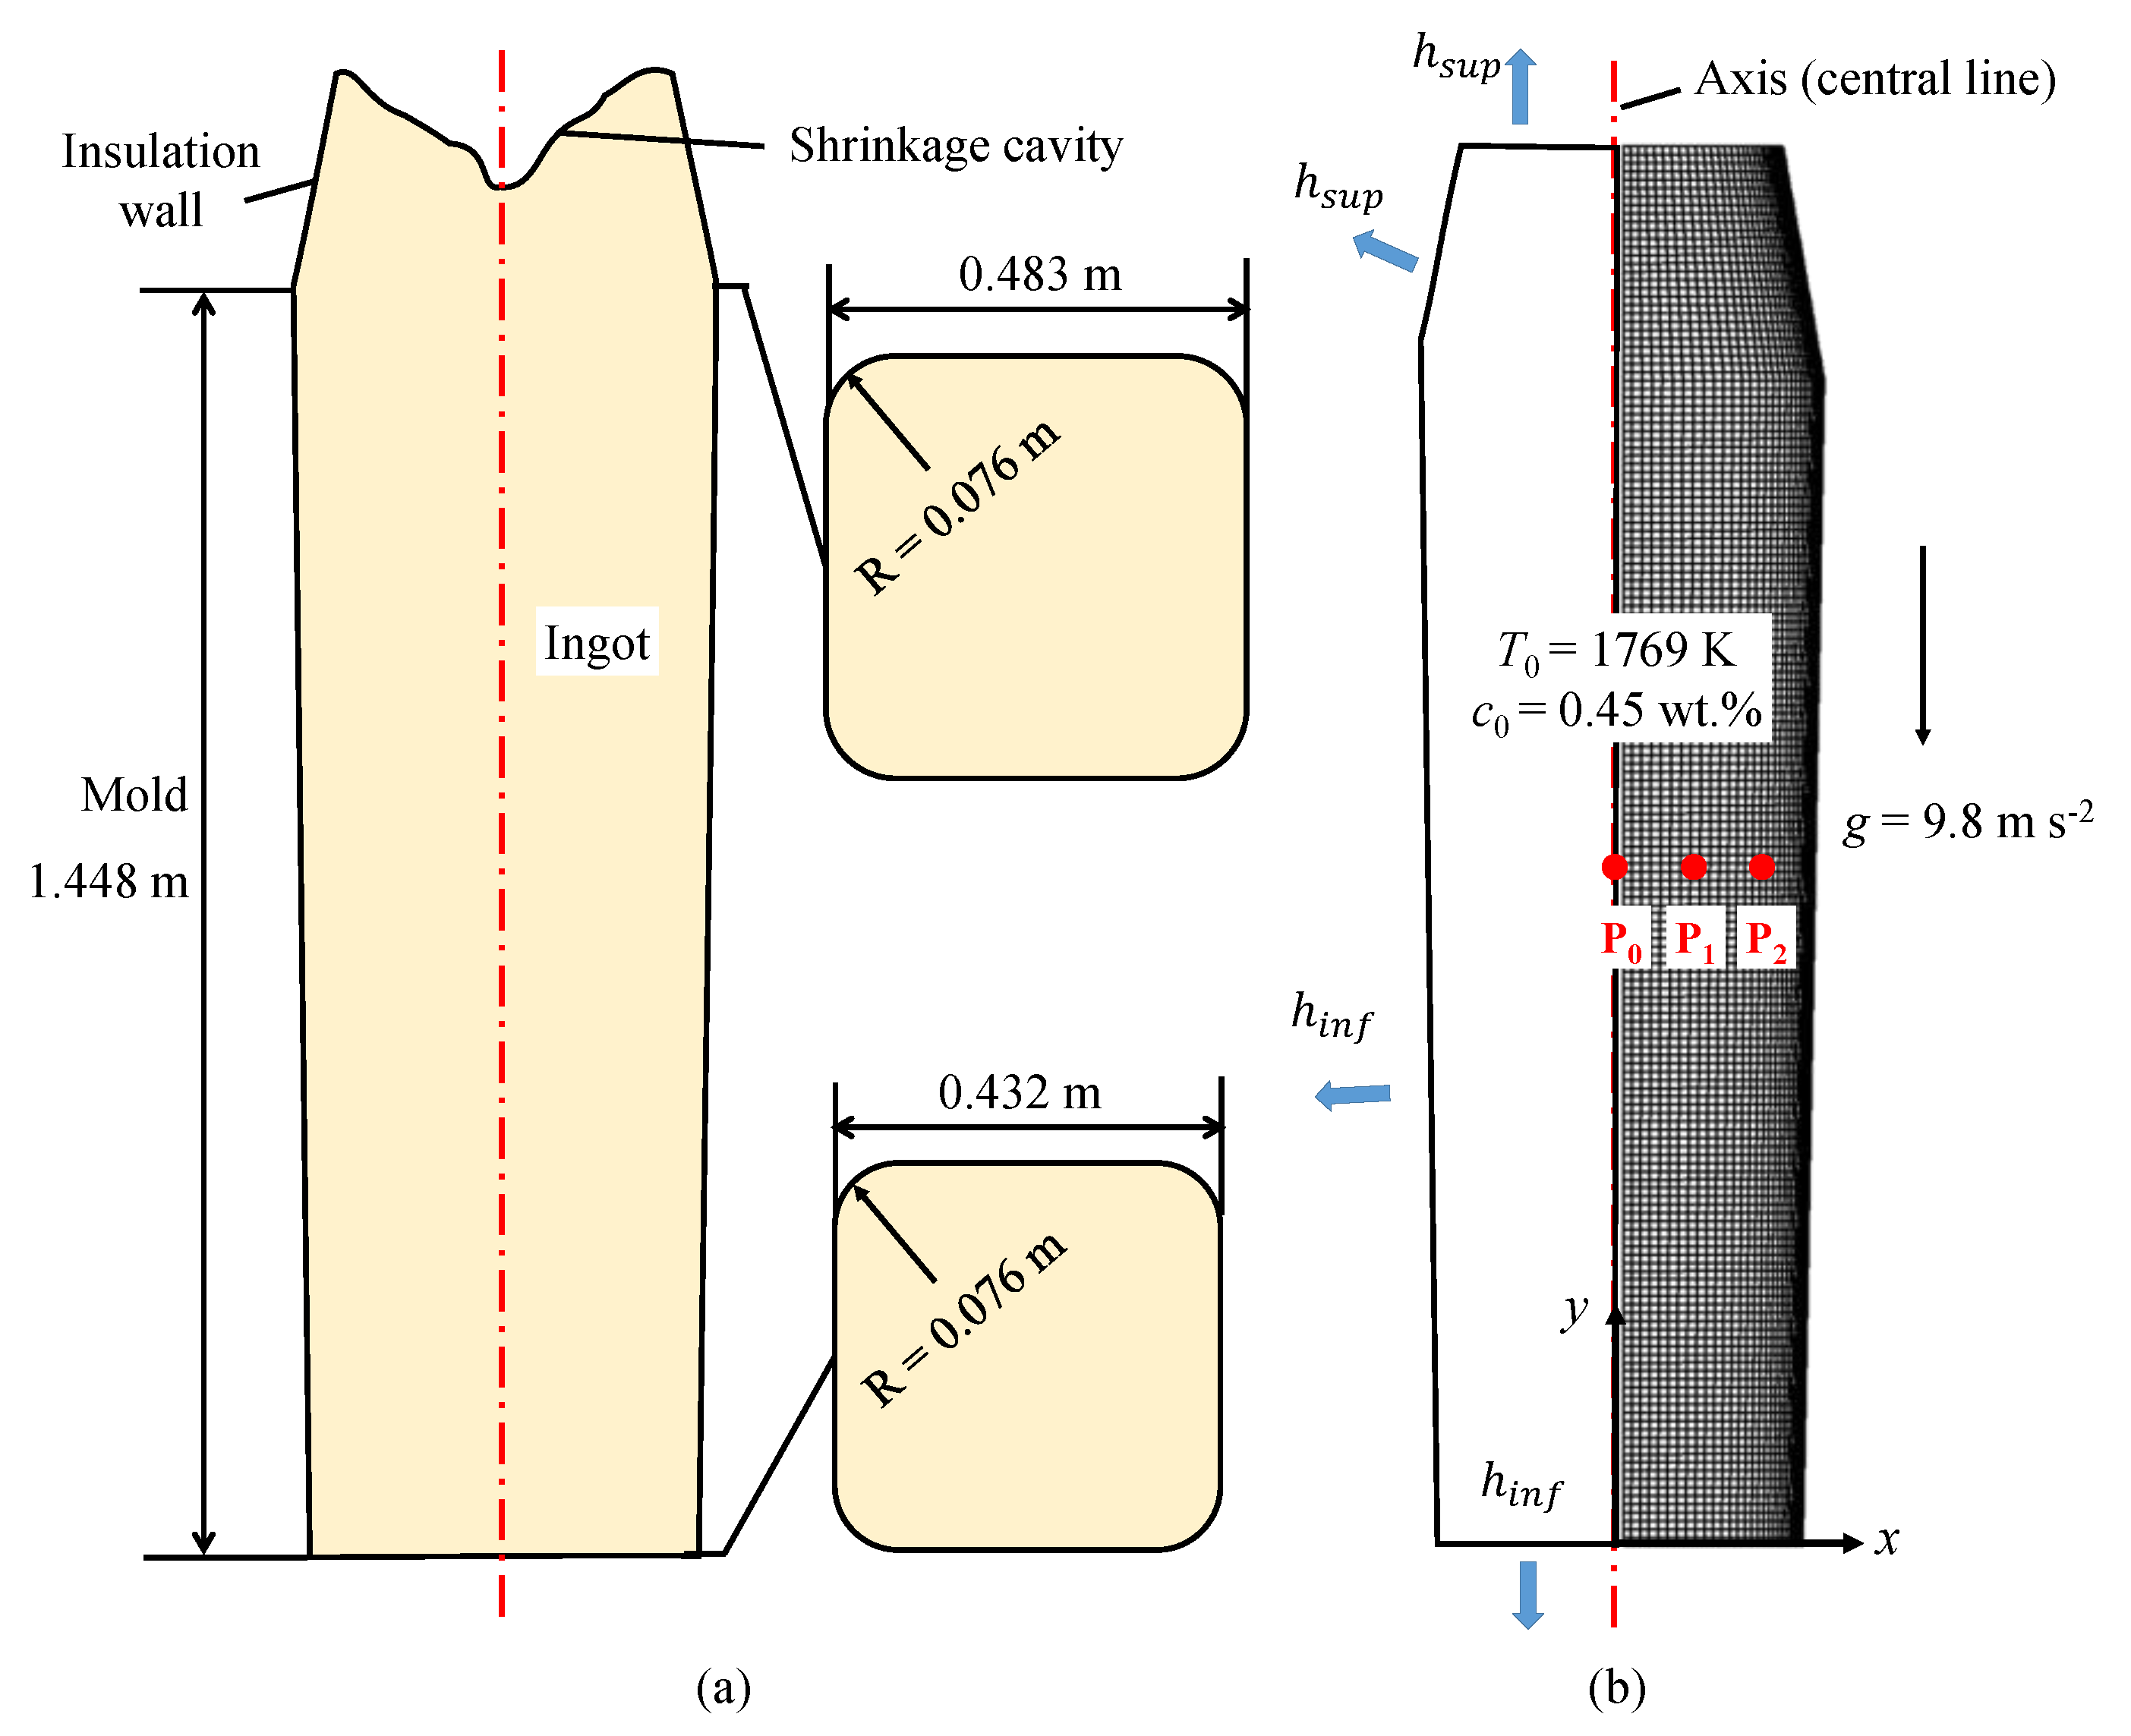
2. Experiment Introduction

Numerical simulation was used to predict macrosegregation in a 2.45 ton steel ingot (Fe–0.45 wt.%C), which corresponded to a reported cast experiment [1]. The ingot was cast in a chill mold with the inner shape of a square-based pyramid, as schematically illustrated in Figure 1a. For the current simulation, only the ingot was considered, without the surrounding multi-layer mold, and a 2D axisymmetric geometry was used to approximate the three-dimensional shape of the ingot. The computational domain and mesh are presented in Figure 1b. Most of the mesh cells had a general size of 5 mm × 5 mm, but the cells near the cooling boundary were refined to 1 mm × 5 mm to allow a more precise calculation of the thermal gradient, the dynamic boundary layer, and the related transportation processes. At the beginning of simulation, the hot metal in the mold was assumed to be still and to have a uniform temperature of 1769 K, i.e., overheated by ~0.1 K with respect to its nominal liquidus temperature. Cooling conditions were applied directly to the ingot surface and were written via convective heat exchange with coefficients, accounting for heat transfer through different construction elements. Similar to Li et al. [20], the ambient temperature was set to 373 K, and two different convective heat transfer coefficients were applied: h s u p = 30   W   m 2   K 1 in the upper zone and h i n f = 300   W   m 2   K 1 in the lower zone. The boundary and initial conditions are provided in Figure 1b.

3. Model Description

It is assumed that solidification occurs with equiaxed dendritic grains, which are allowed to float at the early stage of solidification and become immovable at the later stage. The model, described in detail elsewhere [25], combines multiphase flow, energy transportation, grain growth, and solute transportation with use of the volume average method. The key features and assumptions are enumerated below.
(1) Three phases are defined: the solid dendrite skeleton (s-phase); liquid within the imaginary surface (envelope), i.e., interdendritic liquid phase (d-phase); and extradendritic liquid phase (l-phase), as presented in Figure 2. The summation rule is satisfied for volume fractions associated with these phases: f s + f d + f l = 1 .
(2) Solidification is composed of the growth of the solid phase at the expense of the interdendritic liquid and expansion of the grain envelope, i.e., grain growth; see Figure 2. The former process is defined by the solute diffusive transportation rate, and grain growth rate is calculated using the Lipton–Glicksman–Kurz (LGK) model [26].
(3) When accounting for multiphase flow, only two moving phases are identified: the phase corresponding to the extradendritic liquid (l-phase) and the phase corresponding to the equiaxed grains (e-phase). The latter is actually composed of the united s-phase and the d-phase, where the volume fraction is defined as f e = f s + f d . For free-floating grains, the momentum exchange coefficient between the liquid and grain phases is calculated using the Happel model [27]. When grains get packed, i.e., become immovable, permeability of the phase corresponding to grains is evaluated by the Kozeny–Carman equation.
(4) Grains to be packed should have at least one immovable neighbor to which they can attach. This immovable neighbor can be either a wall or an already packed region. Once the previous condition has been satisfied, the grain phase motion is set to zero once the phase fraction f e reaches the packing limit value f p e .
(5) Nucleation is modeled with a source term for a grain number density of n max per unit time in those cells of the mesh where local temperature drops below local liquidus temperature for the first time, or where local grain density is less than 1   m 3 and local temperature is lower than the liquidus temperature [8].
(6) In the conservation equations, all densities are constant and equal to the reference density, that is, ρ l = ρ s = ρ e = ρ d = ρ r e f . The reference density corresponds to the liquid density, with nominal solute concentration and initial temperature. In the buoyancy term, the solid phase inside the grain is assumed to have a larger density than the liquid phase. In addition, a constant difference between solid phase density and reference density is introduced. Liquid density is dependent on solute concentration and temperature, according to the Boussinesq approach, with the values of the thermal and solutal expansion coefficients ( β T and β c ) taken from elsewhere [8]. The momentum transport equations as well as turbulent model are gathered in Appendix A.
In simulation, the multiphase flow and macroscopic transportation of energy, solute, and grain number density are solved using ANSYS FLUENT® software (ANSYS Inc., Canonsburg, PA, USA), in which the modeling of the solidification at the micro scale is implemented with user-defined functions. To simplify comparison with the results in reference [20], maximal grain number density is set to n max = 2 × 10 9   m 3 . The phase diagram data and properties of the Fe-C alloy are listed in Table 1.

4. Results and Discussion

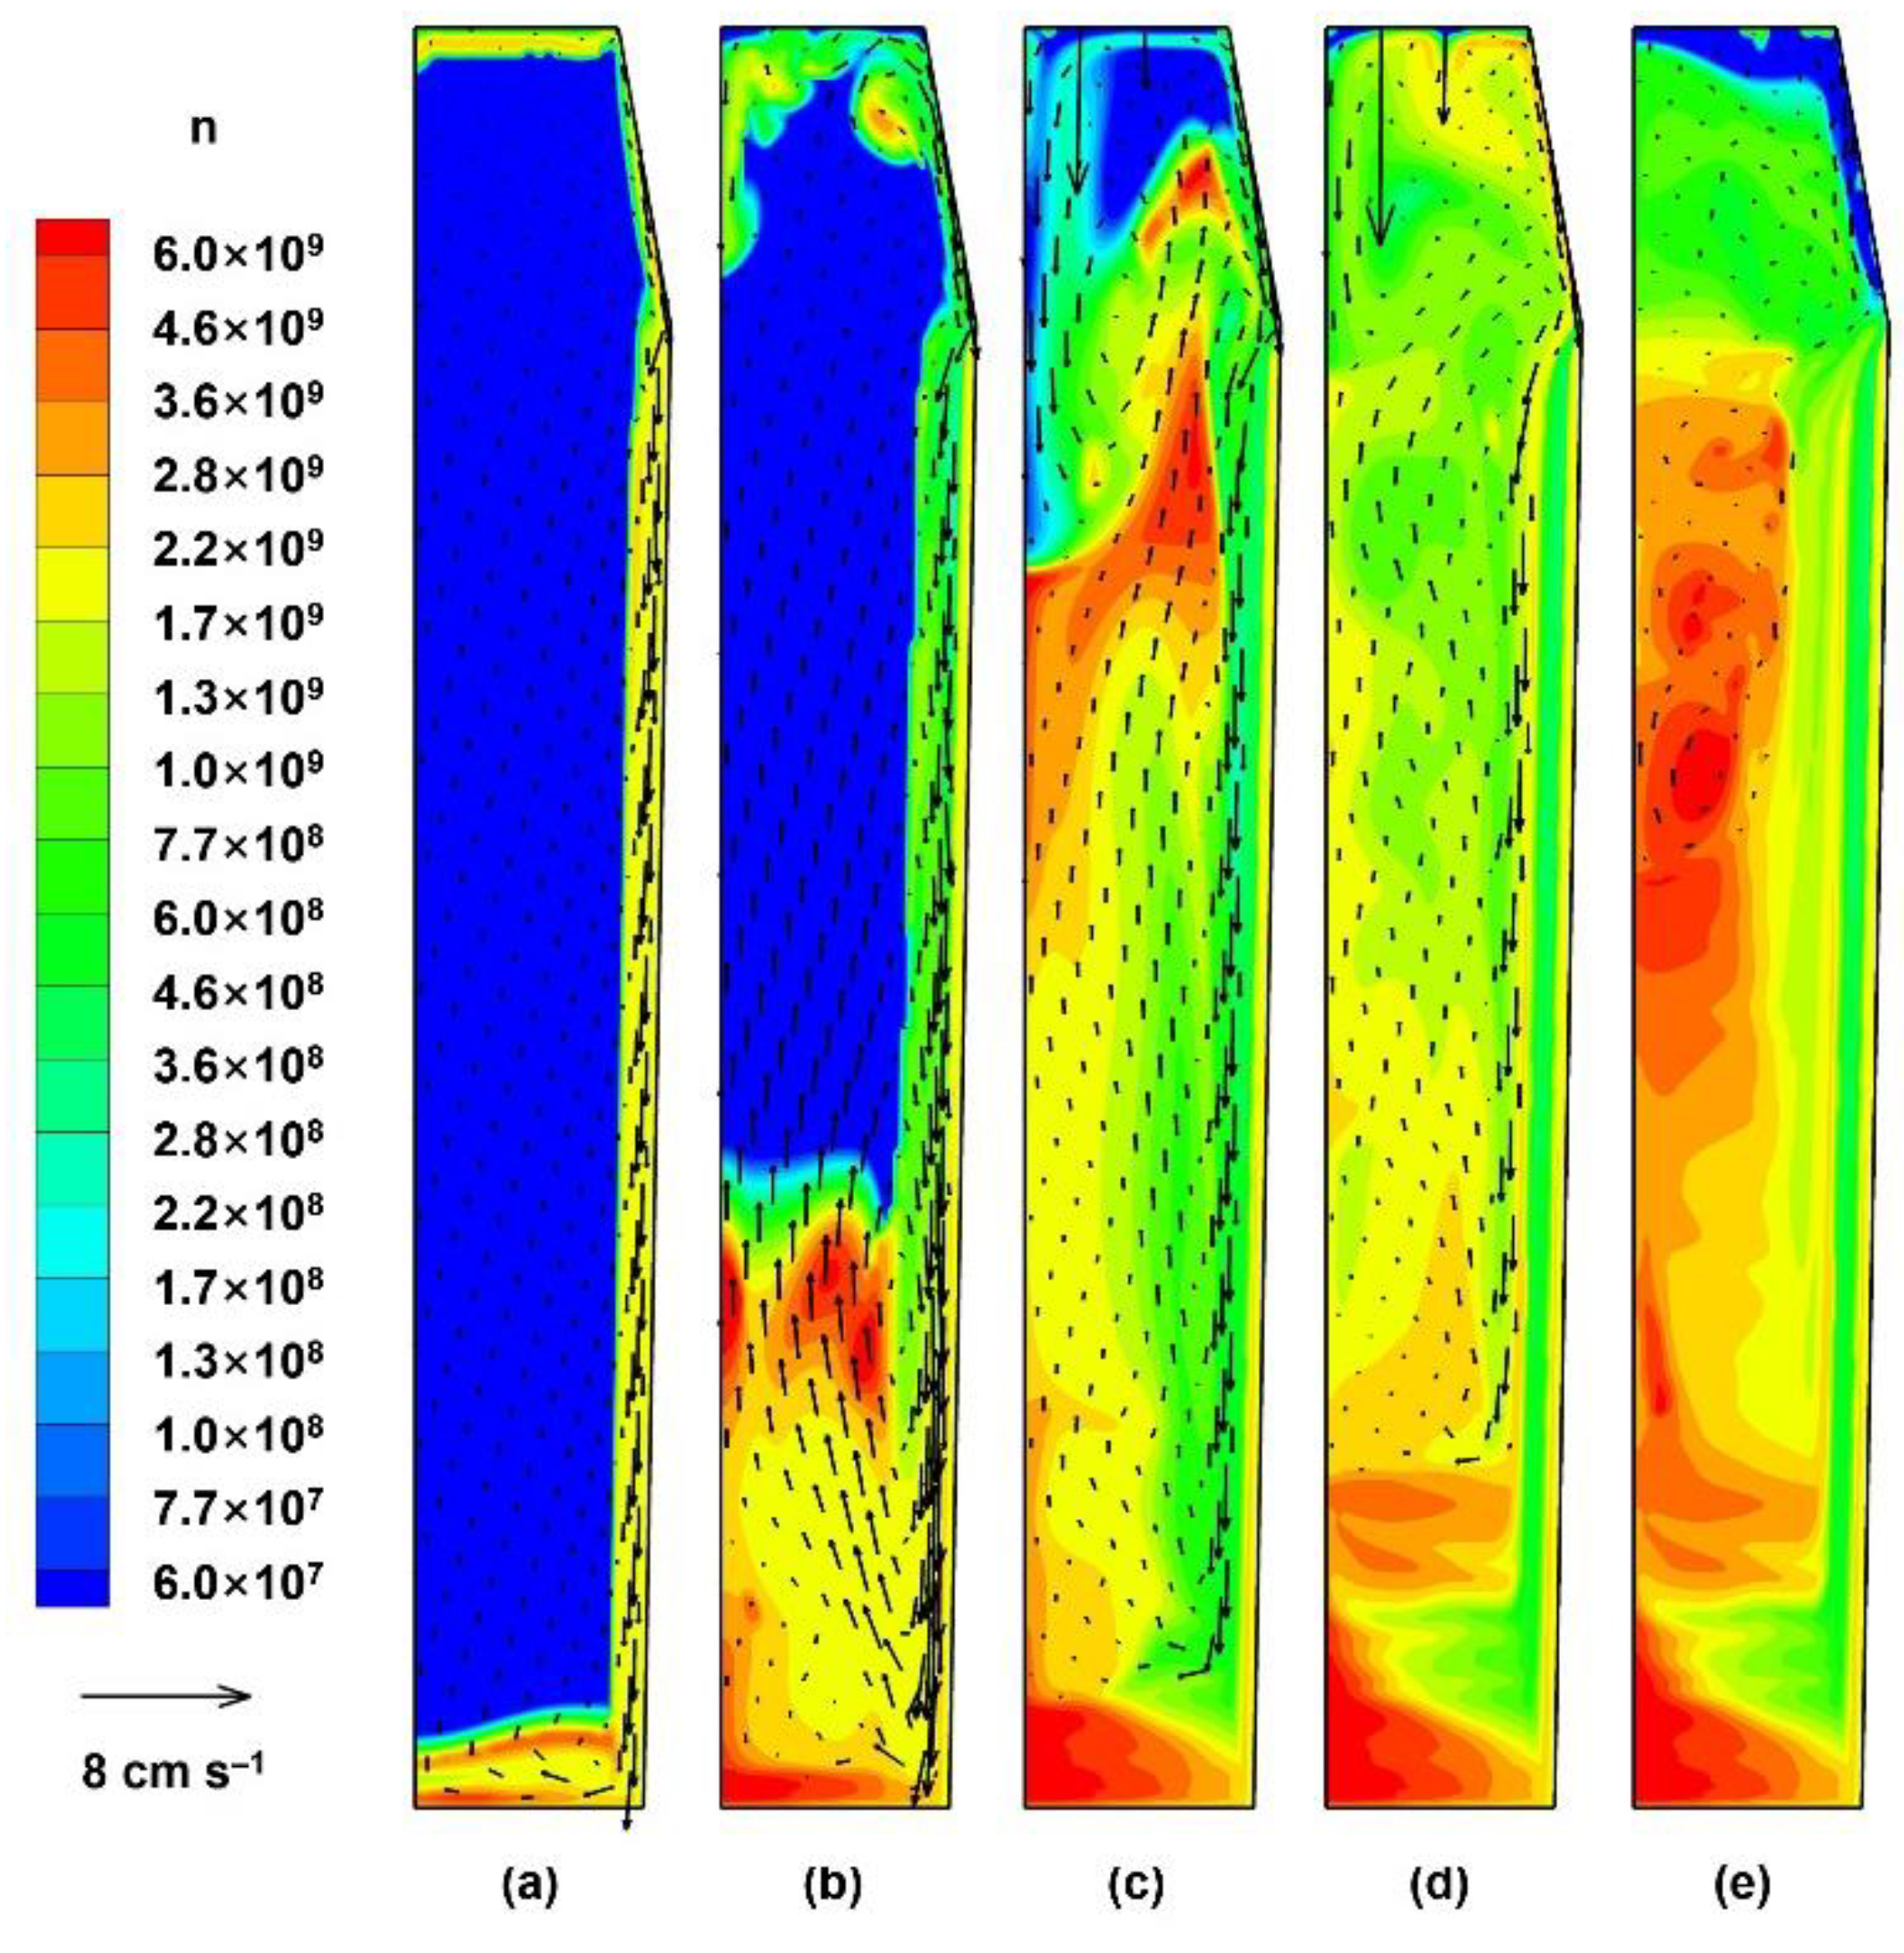
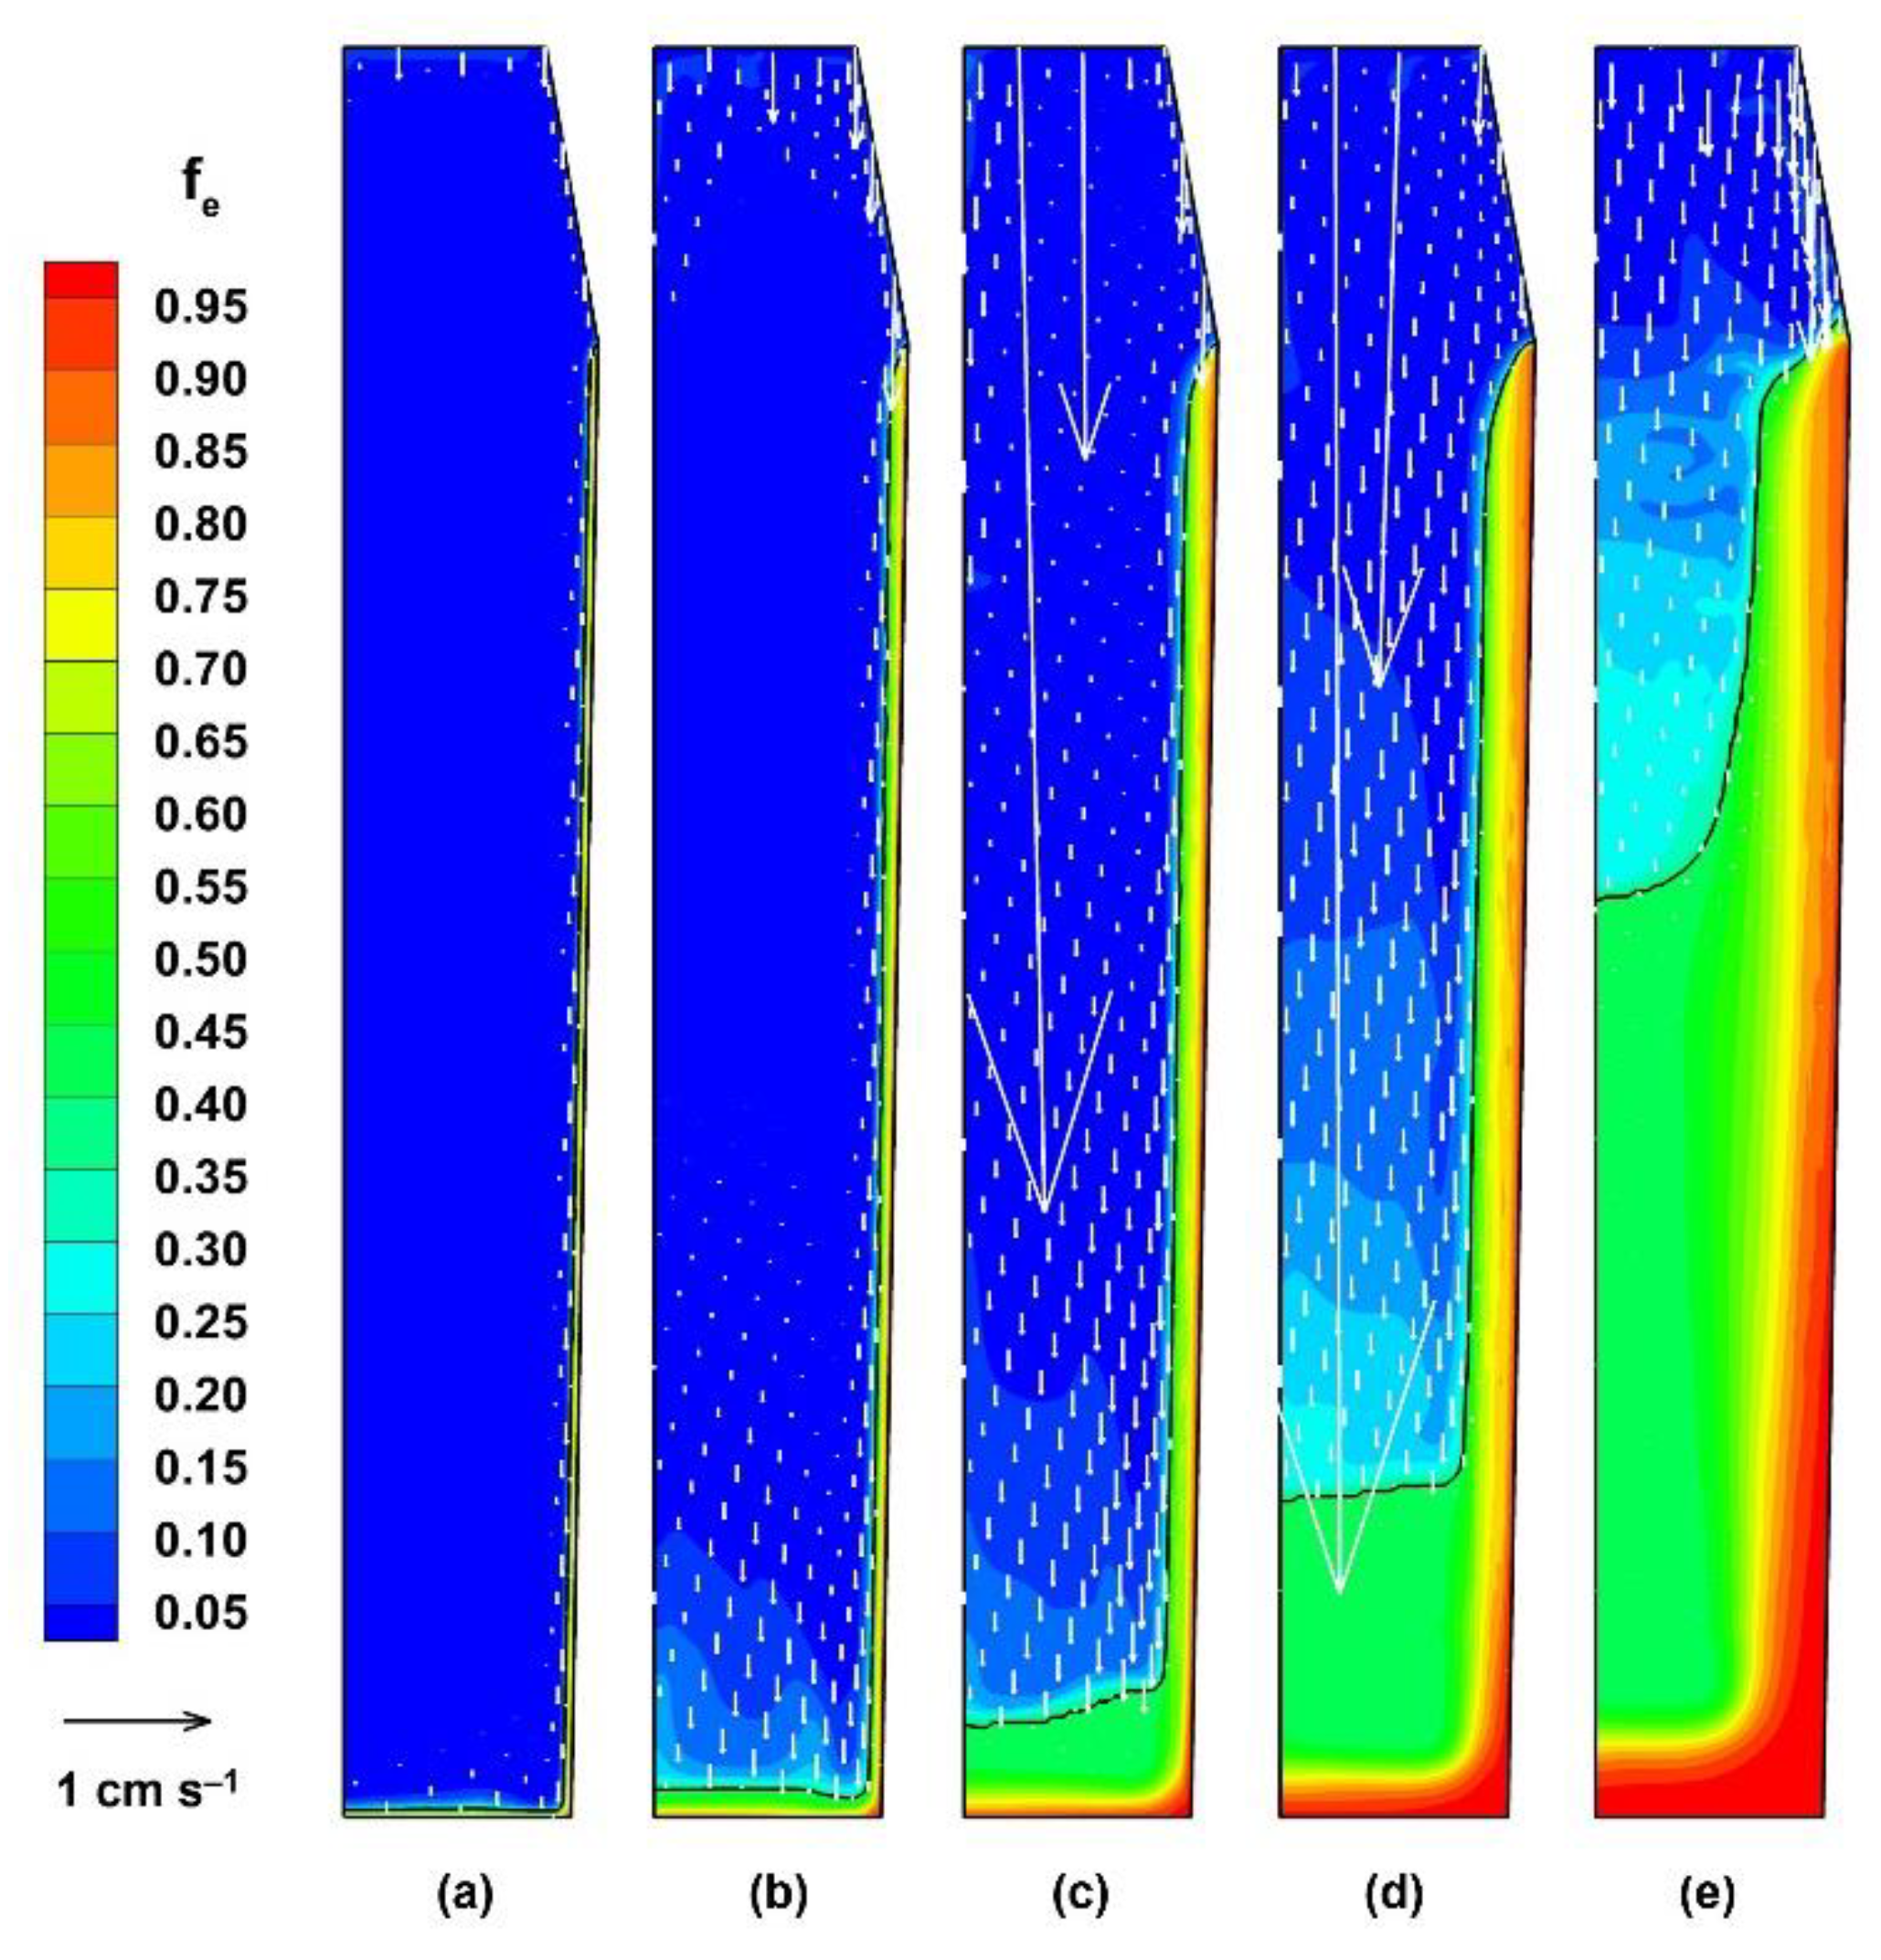
4.1. Nucleation and Grain Growth

According to the variation in the convective heat exchange coefficient along the ingot surface, the coldest zone formed at the bottom corner and the very first grains nucleated there when local temperature dropped below the liquidus temperature. Then nucleation extended over the bottom, sidewall, and top of the ingot, as presented in Figure 3a,b, via the distribution of the grain number density. Although redistribution of the grain number density due to grain sedimentation was observed near the top boundary (Figure 3a), after a while these grains were dispersed into bulk liquid (Figure 3b,c). The liquid near the chilled boundary and the nucleated grains moved downward, the former as a result of buoyancy due to the temperature difference, the latter due to drag force from the liquid and the imposed density difference between solid and liquid. Indeed, although the solid fraction was very small at 20 s and 50 s, after cooling started, the grains moved faster than liquid, as presented in Figure 4a,b. Due to strong cooling, the temperature near the ingot surface decreased rapidly and melt undercooling remained high, meaning that the grains descending along the wall grew quickly. Once grain volume fraction reached the packing limit value, the grains became attached to the wall or to the already packed layer and became immovable. At t = 20 s, a thin packed layer was mainly located near the bottom and lower sidewall, as seen in Figure 4a. Some grains descended to the bottom of the volume before being “captured” and may have accumulated there. However, the melt flow changed direction at the bottom of the ingot, moved toward the central axis, and rose to the middle region of the ingot. Consequently, some grains were dragged upward by the flow (Figure 3b), but with lower velocity (Figure 4b). It can be noted that the grain number density in the layer packed over the sidewall was slightly below the maximal value n max = 2 × 10 9   m 3 , whereas at the ingot bottom and central axis this value could locally be as high as 6 × 10 9   m 3 .
As the packing layer at the sidewall thickened, the temperature gradient and thermal buoyancy force at the solidification frontier decreased. The downward velocity of the liquid slowly decreased with time while the gravity force acting on the free-floating grains increased as they grew. At t = 100 s, the equiaxed grains ahead of the packed layer continuously descended to the bottom region, whereas the incoming flow from the upper region had virtually no nuclei or grains. In fact, the grain number density was low in these cells but remained above the 1 m−3 that prevents new nucleation there. Consequently, the grain number density in the region within 1 cm to 4 cm from the lateral surface was less than the mean value (Figure 3c). The lack of equiaxed grains in this region can explain why, in real ingots, the corresponding location is occupied by a columnar structure. At t = 100 s, a large grain number density was also observed in the upper region of the ingot, whereas the grain phase was mainly concentrated in the lower region (Figure 4c), indicating that a large number of small grains were dragged by the central upward flow. On the contrary, some larger equiaxed grains sedimented to the bottom since the buoyancy term related to their heavier mass prevailed over the upward drag force from the melt and piled up at the ingot center. This could be observed by grain number density at the ingot bottom, which was in the range of 3 × 10 9 6 × 10 9   m 3 (Figure 3c), and by the grain fraction distribution (Figure 4c).
As discussed below, solutal convection started to affect liquid phase flow after 100 s and supported the ascending melt flow near the central axis. At the same time, solid growth increased the mass of equiaxed grains, meaning that the grains in the upper region tended to fall down and continuously pile up toward the top of the ingot (Figure 3d and Figure 4d). At t = 400 s, equiaxed grains had filled most of the volume in the chill mold. At a later stage, solidification slowed down as the heat transfer rate in the hot top region was much lower. Finally, at about t = 1000 s, the whole ingot was fully filled by packed grain, but solidification continued for a long time until the temperature dropped below the eutectic temperature of 1461.37 K [12]. However, we stopped the calculation at this stage because the grain distribution and macrosegregation would then barely change due to the very weak flow of residual liquid in the packed zone.

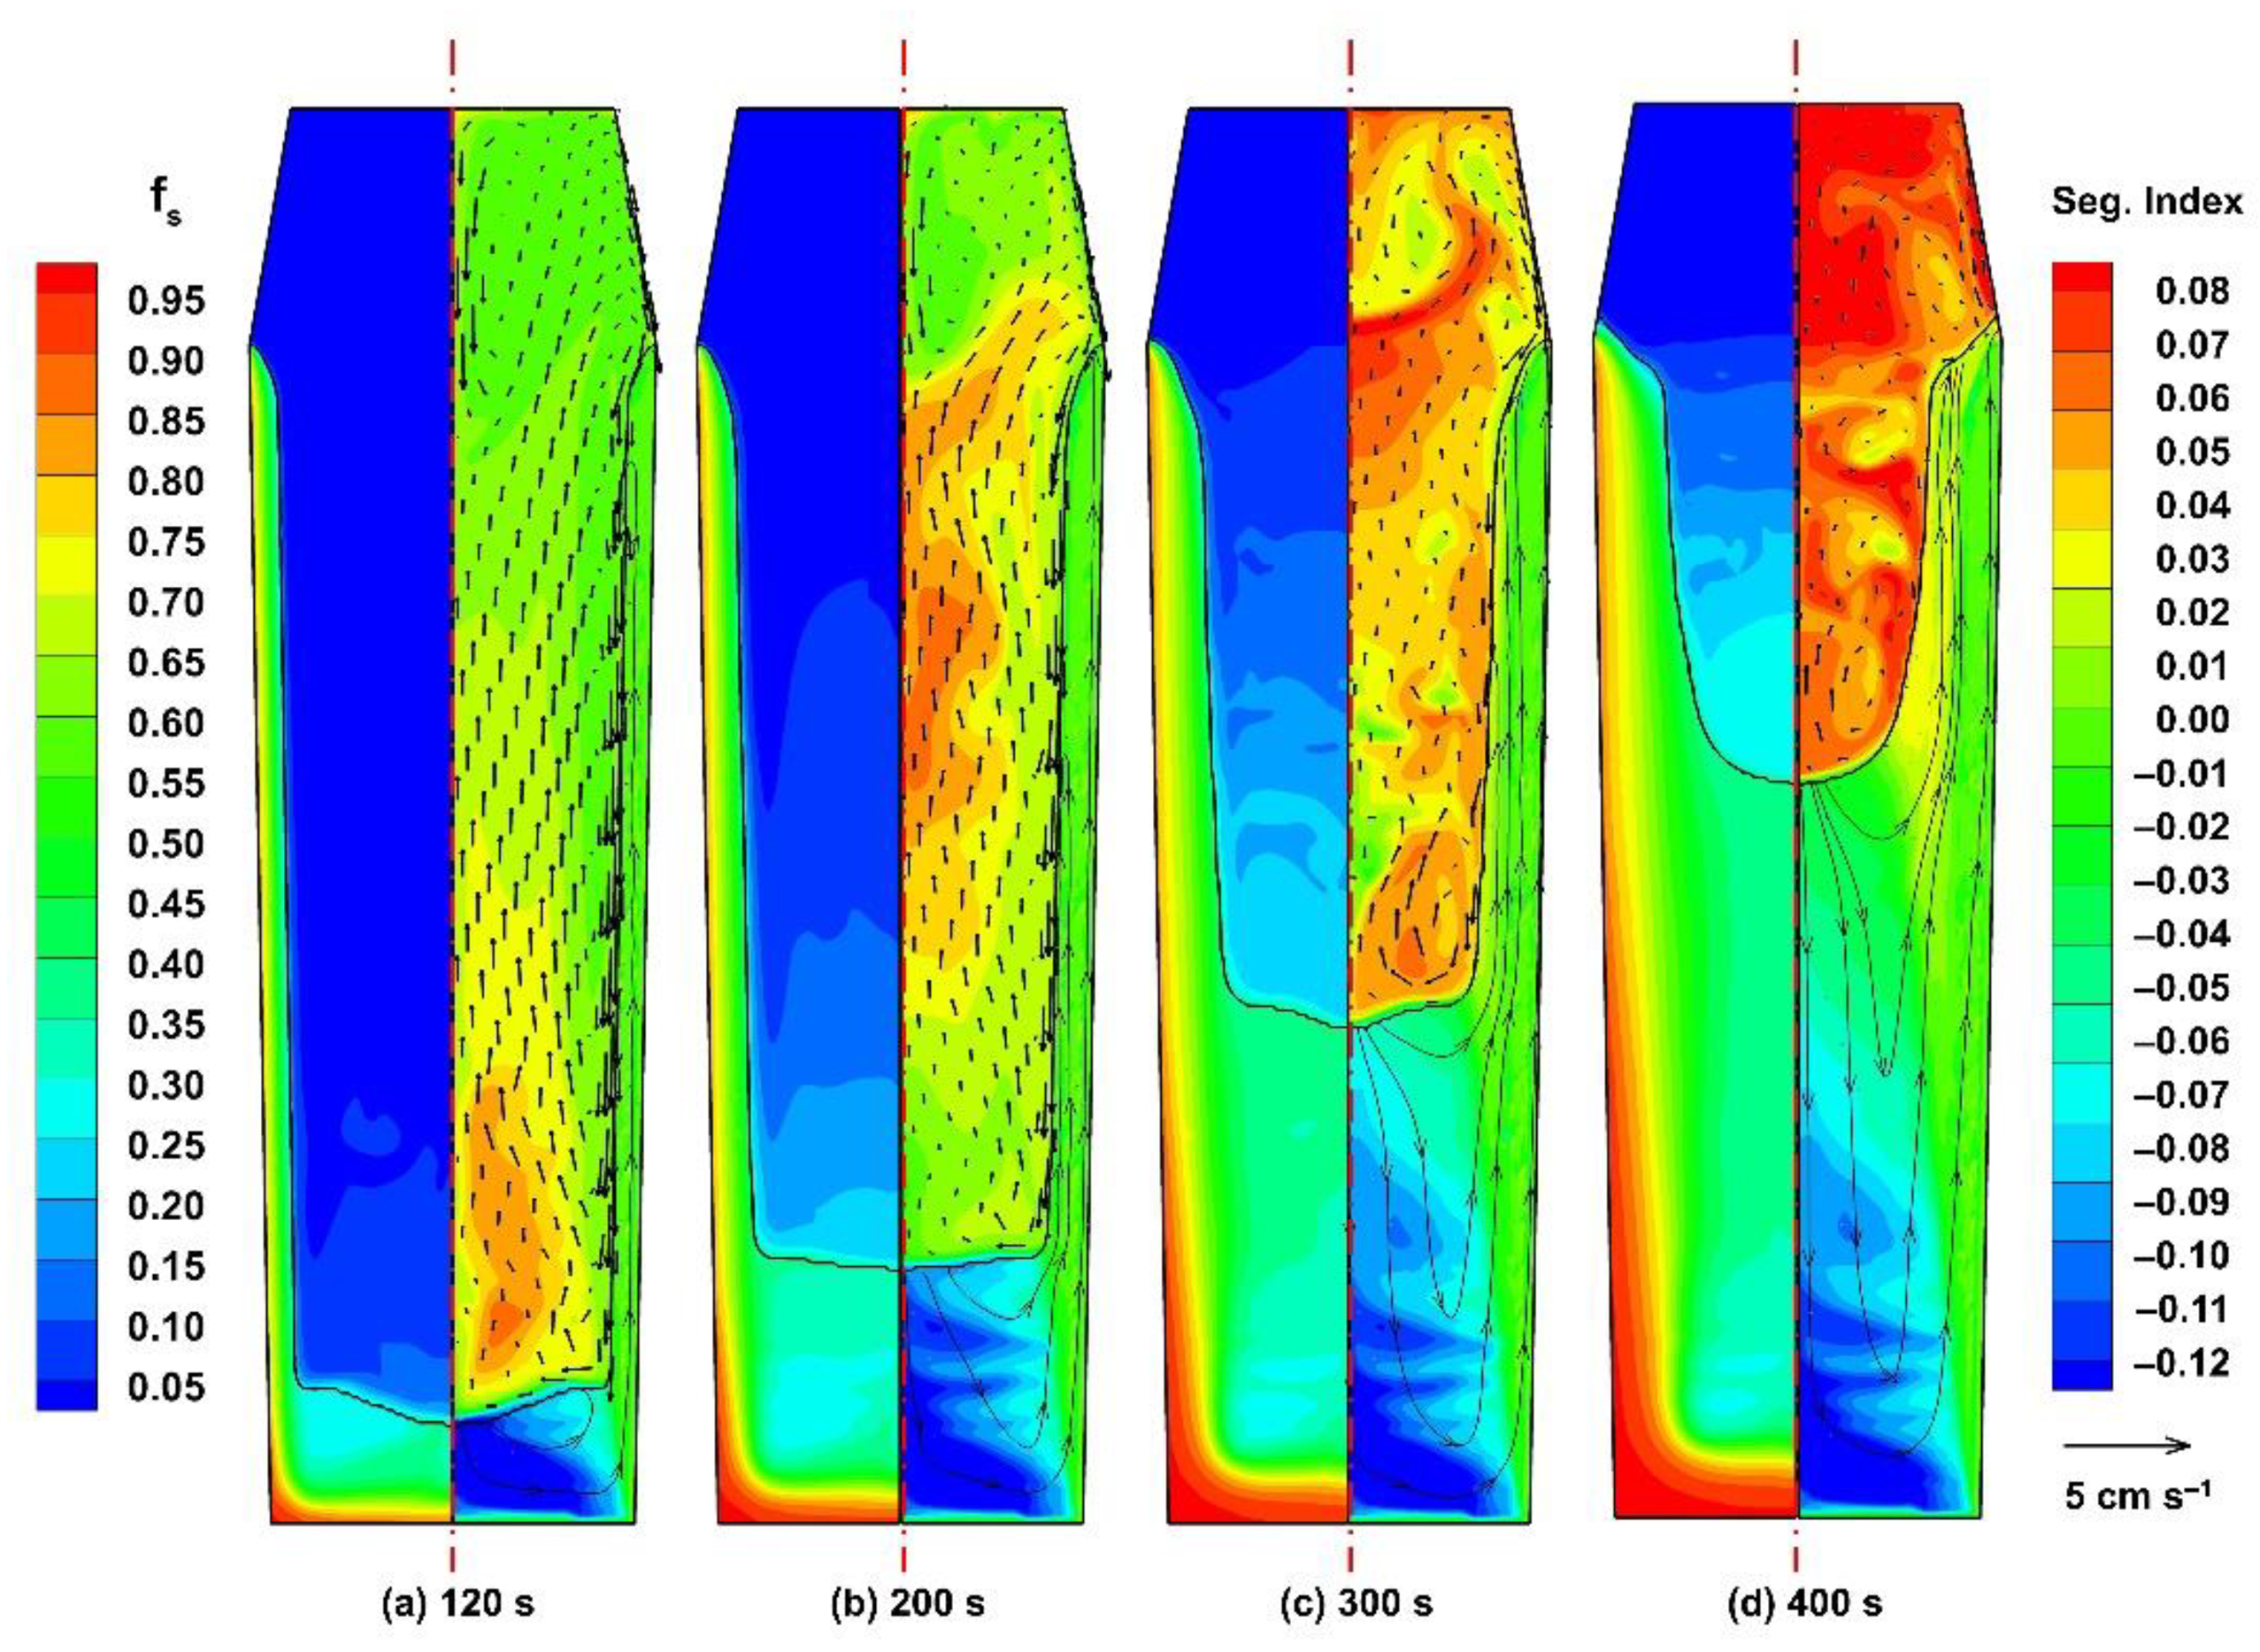
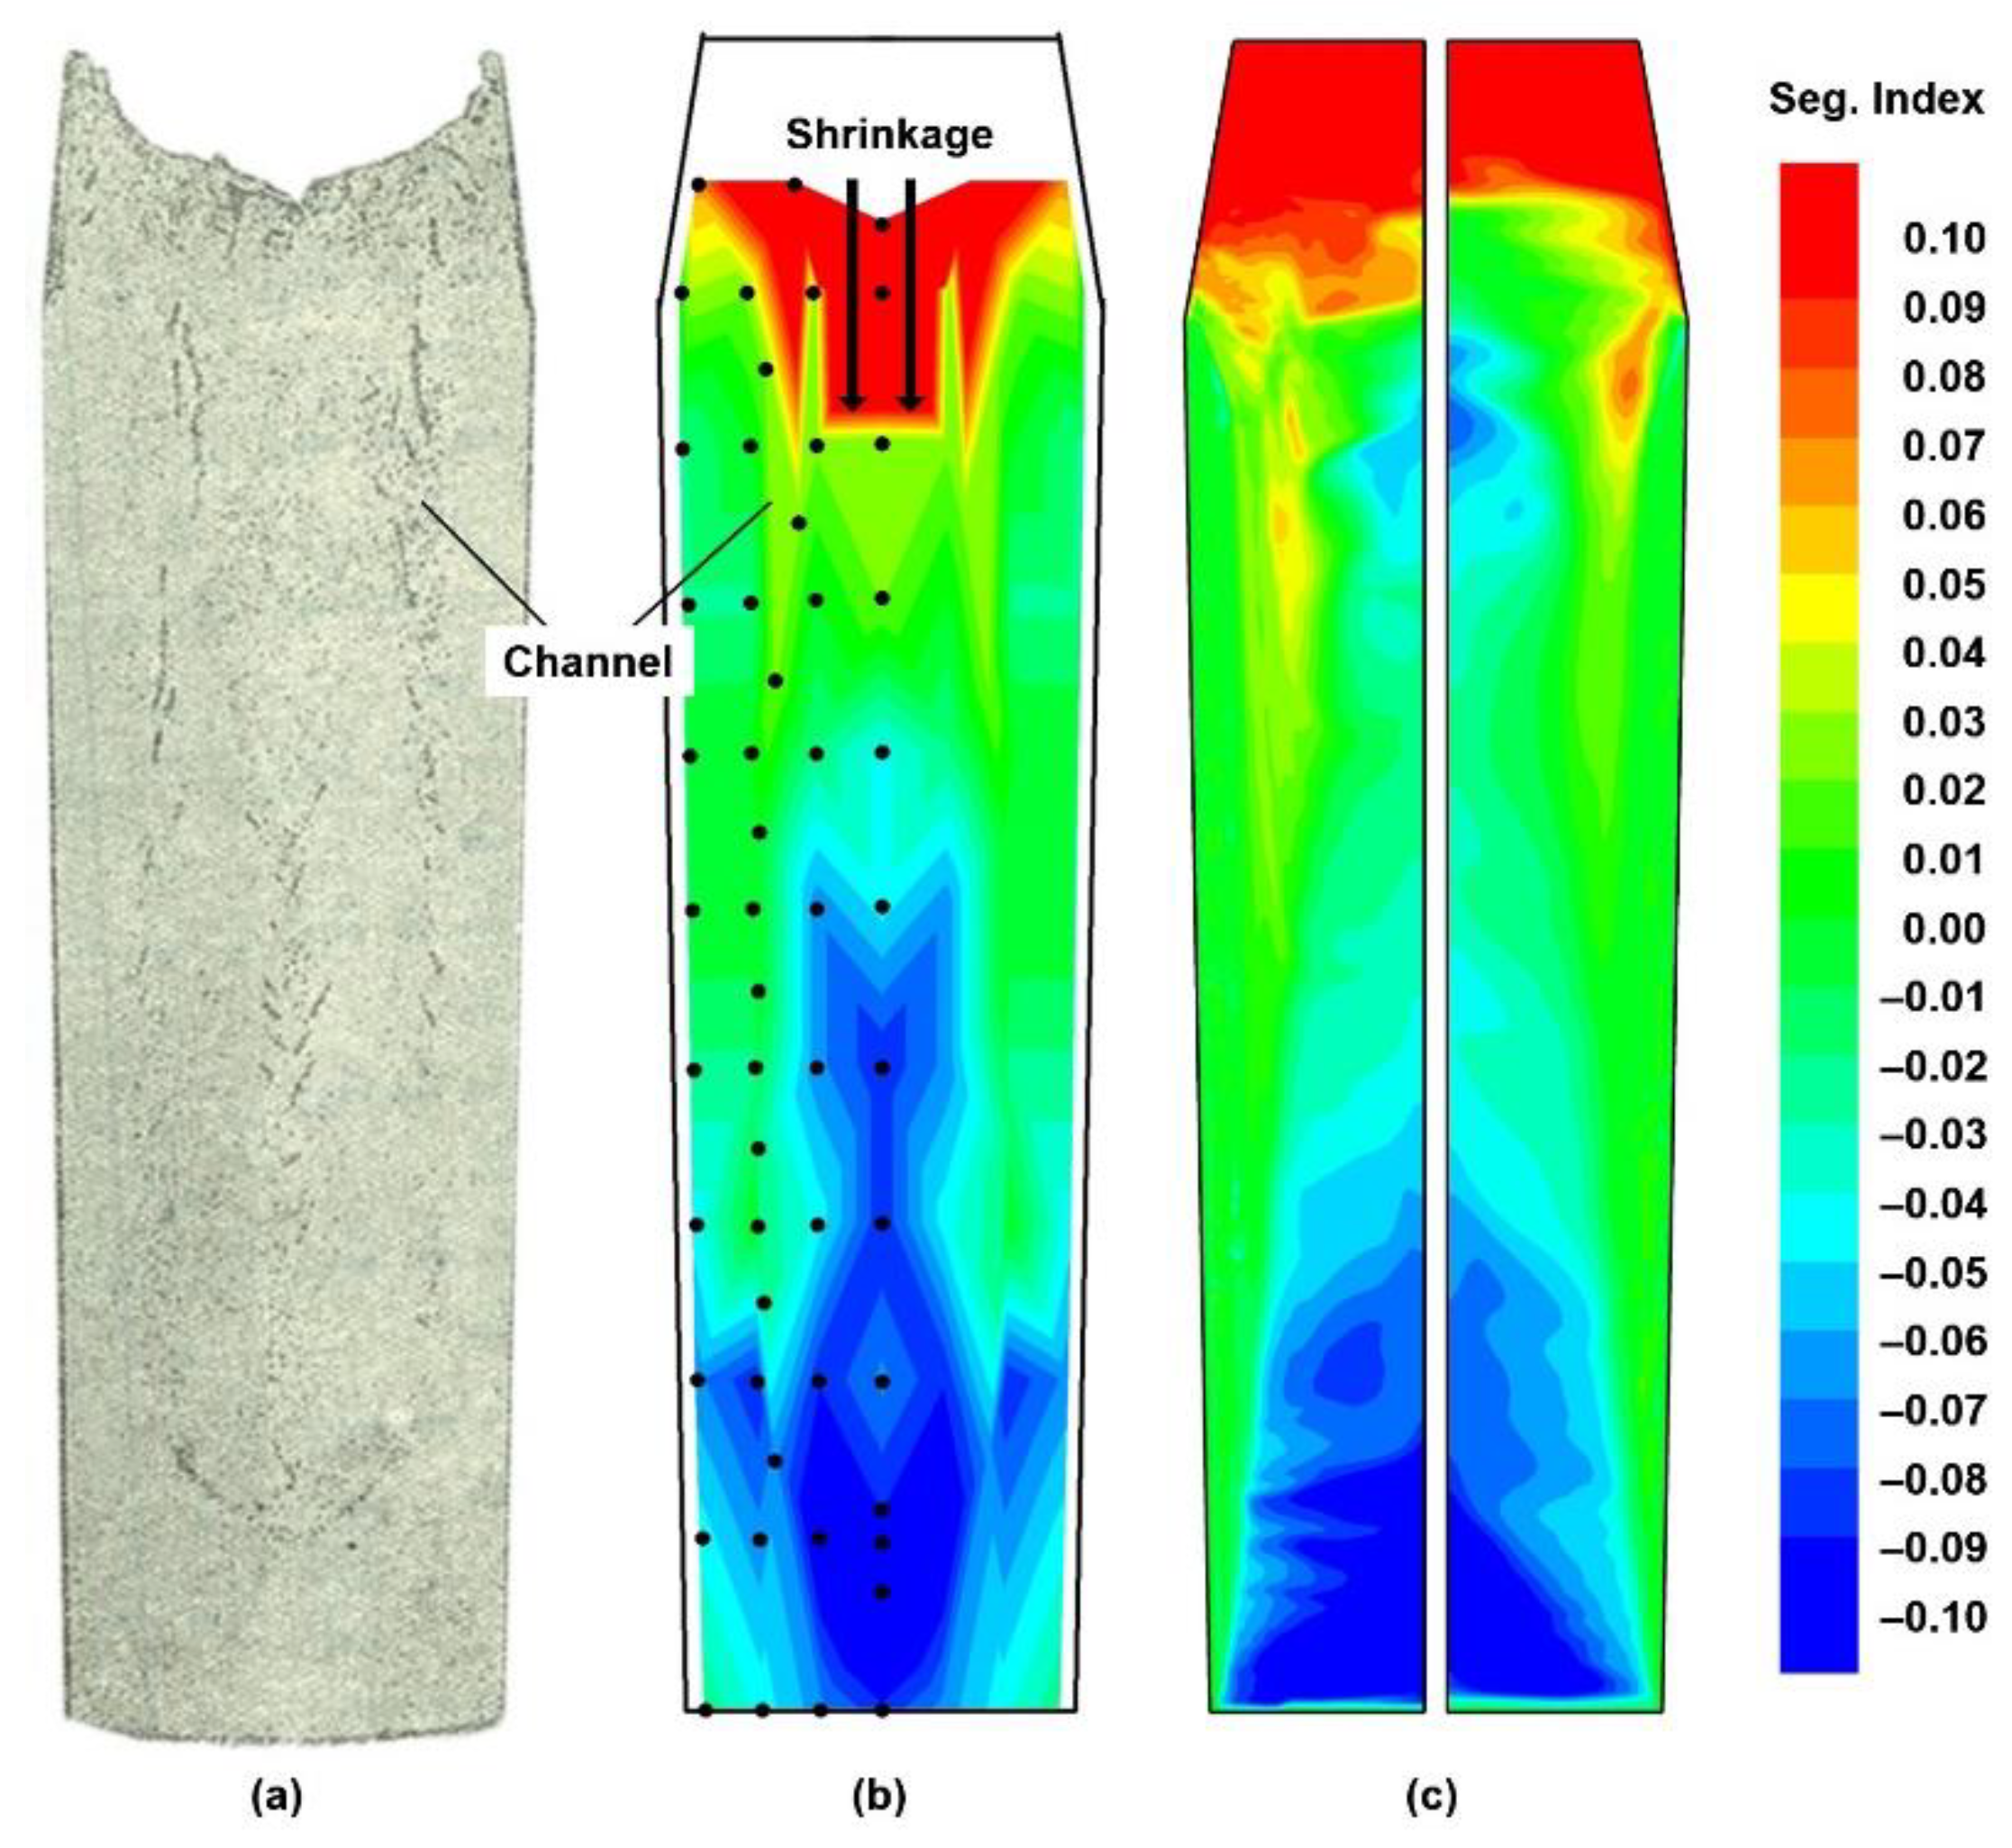
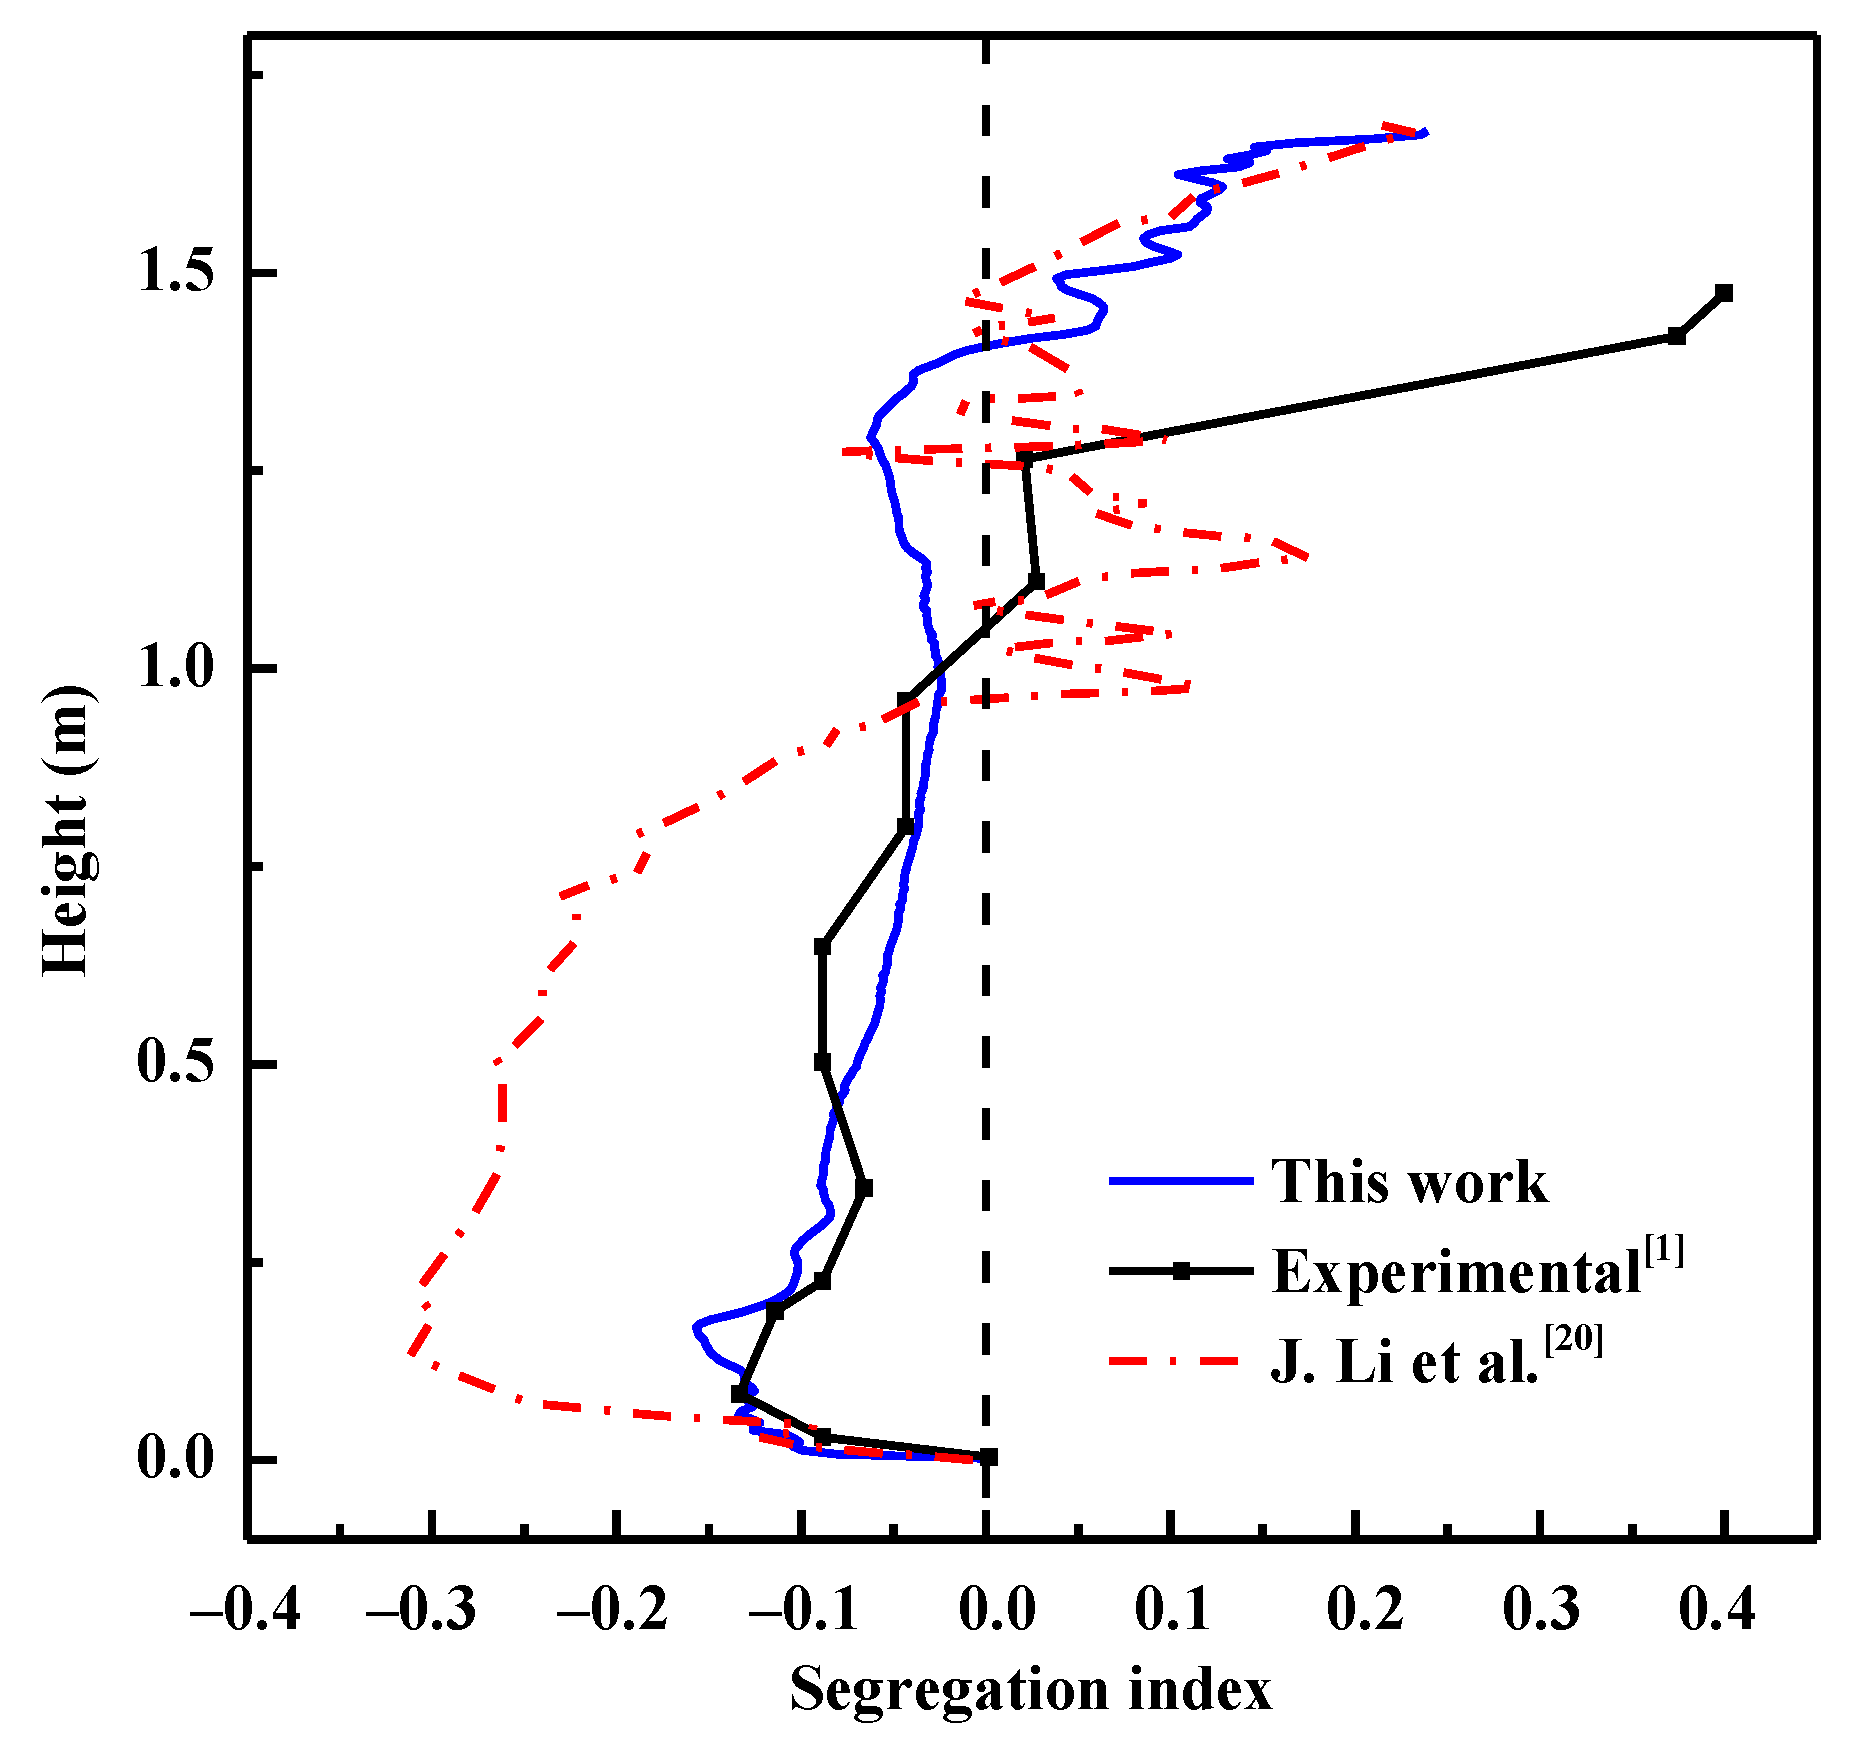
4.2. Macrosegregation Formation

Segregation in the ingot is characterized by the segregation index (SI), calculated as SI = ( c m i x c 0 ) / c 0 , where the solute concentration for the solid and liquid mixture c m i x is calculated as the sum of the averaged concentration in the grain phase and extradendritic liquid weighted with corresponding volume fractions: c m i x = f e c e + f l c l . To understand the evolution of the segregation pattern presented in Figure 5, it should be borne in mind that solute is rejected at the interface between the solid phase and the interdendritic liquid and is transported to the extradendritic liquid according to the evolution of the fraction corresponding to the interdendritic liquid and by diffusion. In the model, the effect of convective flow on boundary layer thickness around the envelope surface is taken into account. Further distribution of the solute in the bulk is defined by the flow of extradenritic liquid, which is affected by thermal and solutal buoyancy force, as well as by grain motion.
At the initial cooling stage, when both extradendritic liquid and grains descended along the wall, equiaxed grains grew but the solid fraction remained small. Consequently, little solute was rejected at this stage. The growth of the solid phase became noticeable inside the packed layer, mainly at the bottom, leading to the emergence of a “plume” near the central axis at 120 s, with an ascending flow as the extradendritic liquid enriched with carbon became lighter (Figure 5a). The upward flow inside the packed layer over the sidewall could probably be attributed to the pressure effect rather than to solutal buoyancy. However, to confirm this statement, additional parametric studies would be required. This flow was very weak since it occurred between grains whose fraction was within the range of 0.6–0.9, and provided strong resistance to the flow. The instantaneous segregation pattern presented at t = 200 s was defined by the redistribution of solute, which was continuously rejected by the solid phase growing in a lower ingot region, due to the upward flow of extrandendritic liquid. The latter was supported by solutal buoyancy but was counteracted by a drag force from descending grains (Figure 5b). Since the local value of solutal gravity was dependent on the solute distribution in the liquid and varied with time, it may have been balanced by the downward drag force or even conceded to the latter. This led to oscillation of the vertical component of velocity in the liquid in the central part of the ingot, resulting in negative segregation in the form of a “Christmas tree.” Similarly, at a later stage (300 s and 400 s, Figure 5c,d, respectively), the clockwise vortex just above the packed layer was the result of upward solutal convection and the downward motion of grains. Incipient formation of vertical channels could be observed at t = 300 s (Figure 5c) at the edge of the packed layer, where the solid fraction increased (~0.3), whereas the extradendritic liquid flow still had a velocity in the order of several millimeters per second.
As mentioned above, we believed that the final segregation pattern could be evaluated at t = 1000 s (Figure 6c), since by that time the ingot was filled with packed grains with a fraction of more than 0.4 for most of the volume. Consequently, residual flow between the grains was negligibly small ( ~ 10 12   m   s 1 ) and practically did not affect distribution of the solute at the later solidification stage. As proof, it can be noted that the segregation pattern at the bottom part of the ingot did not change between t = 400 s (Figure 5d, right) and t = 1000 s (Figure 6c, left), (note that the color scale is slightly different between the indicated figures), but changes occurred in the upper part of the ingot where grains were not yet packed at t = 400 s.
Note that in Figure 6c, results obtained with two different grids with cell sizes of 5 mm × 5 mm and 10 mm × 10 mm are presented. Similar to previously reported studies, mesh size did not severely affect macrosegregation distribution. Rather, the difference related to mesoscale in terms of the number and location of the segregation channels at the upper part of the ingot and in the bottom zone of negative segregation. Thus, simulation with both grids showed vertical segregation channels (Figure 6c), the formation of which started at t = 300 s. However, with coarser mesh these channels were less pronounced and had a different configuration. It should be stressed that qualitatively similar vertical segregation lines were also observed in experiments near the columnar-equiaxed transition line (Figure 6b). The shape of the negative segregation zone obtained in the simulation was different than the reported one. In our opinion, this can be attributed mainly to the uncertainty of the boundary conditions that governed temperature distribution in the bottom corner of the ingot. Furthermore, the lack of measurements close to the ingot bottom did not really permit comparisons in the bottom vicinity. The discrepancy in height of the negative segregation zone between the experiments and the calculations probably indicates that interaction between ascending solutal flow and grain sedimentation was not extremely well reproduced. Yet again, this can be attributed to boundary conditions, since variation in cooling intensity clearly affected the height of that zone (Section 4.3). However, another option is the effect of shrinkage during solidification, which was not taken into account in the model and which could affect the flow of both phases when the solid fraction starts to develop. Moreover, an air gap may appear between the casting and the mold due to shrinkage, thereby increasing thermal resistance at the cooled wall and altering boundary conditions. Finally, it is clearly shrinkage that affected segregation at the last solidification stage in the experiment and that defined solute distribution in the upper part of the ingot. Consequently, comparison was not really possible for this zone. We discuss the role of columnar dendrites in our conclusion.
A comparison of the segregation index along the central line between the calculation and the measurement (Figure 7) shows that the calculation accurately reproduced a general trend detectable in the measurements, i.e., negative segregation in the lower region and positive segregation in the upper region. Macrosegregation distribution along the central line predicted by the present model was compared with that carried out for the same-sized ingot with a three-phase mixed columnar-equiaxed model [20], in which equiaxed dendrites were considered globular. Similar to results reported elsewhere for 3.3 ton ingots [12,13], negative segregation at the centerline obtained with globular equiaxed grains was strongly overestimated [20], whereas results with the proposed description matched more accurately with the experiment.

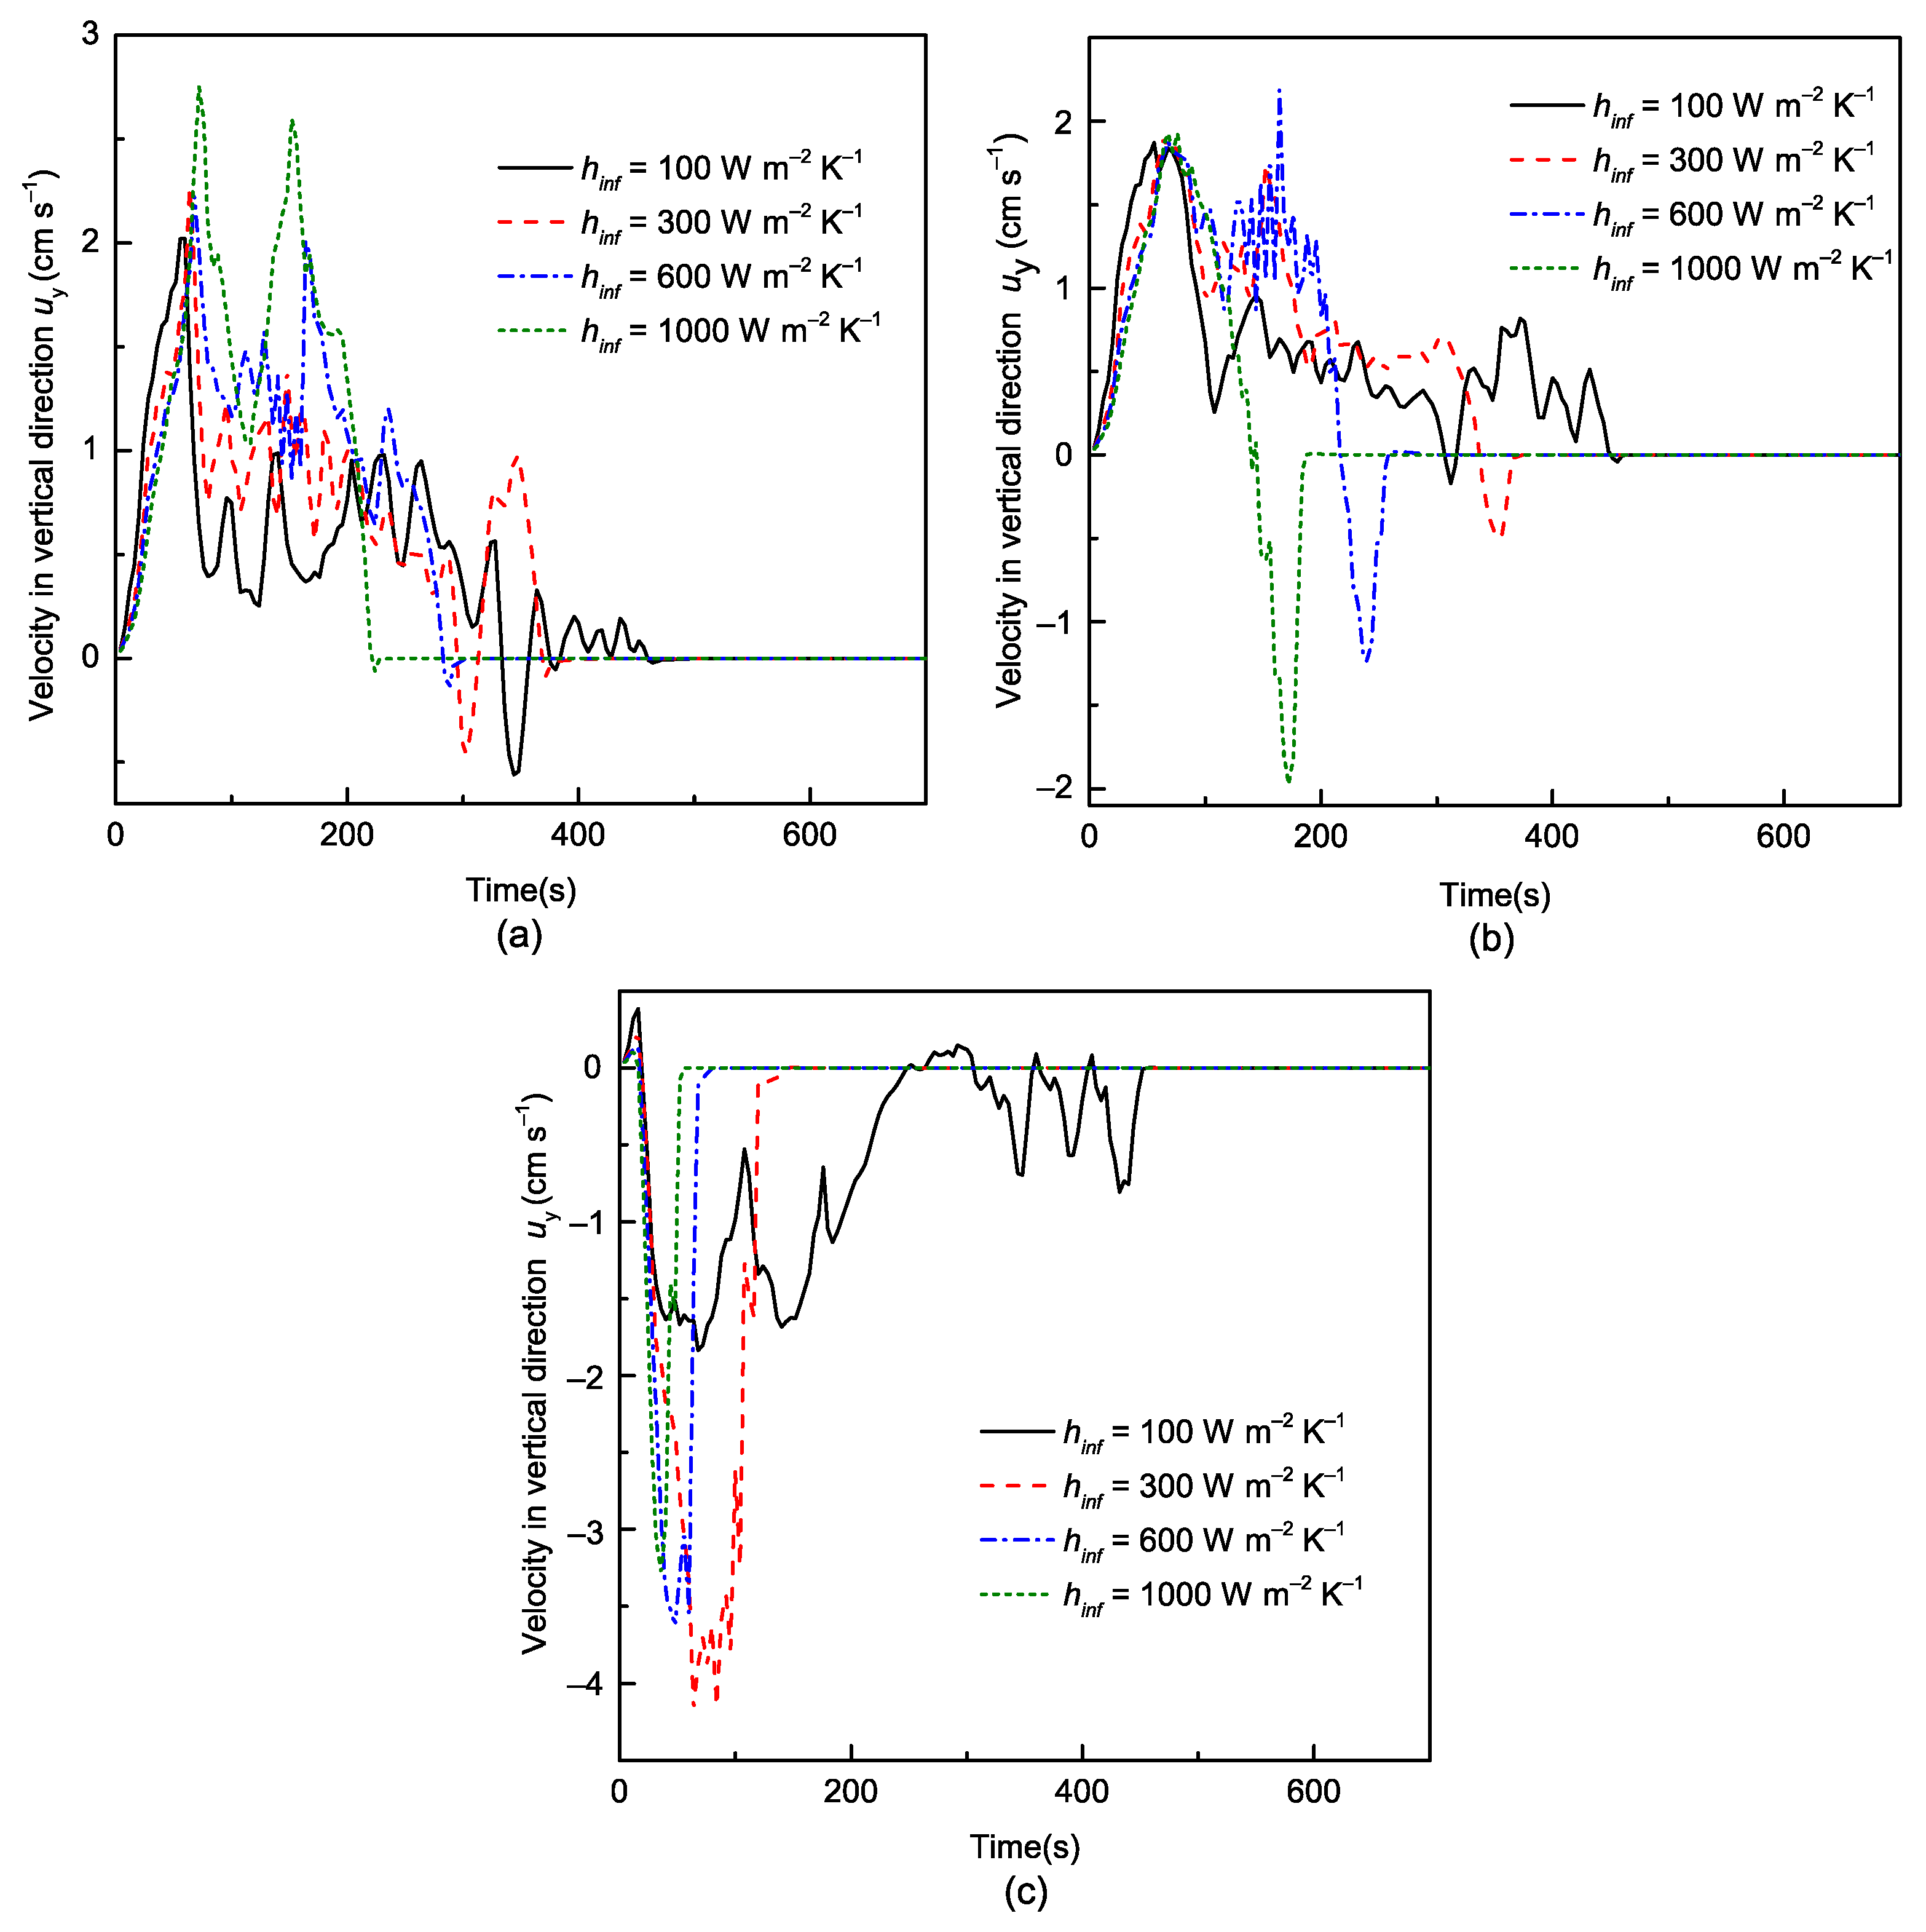
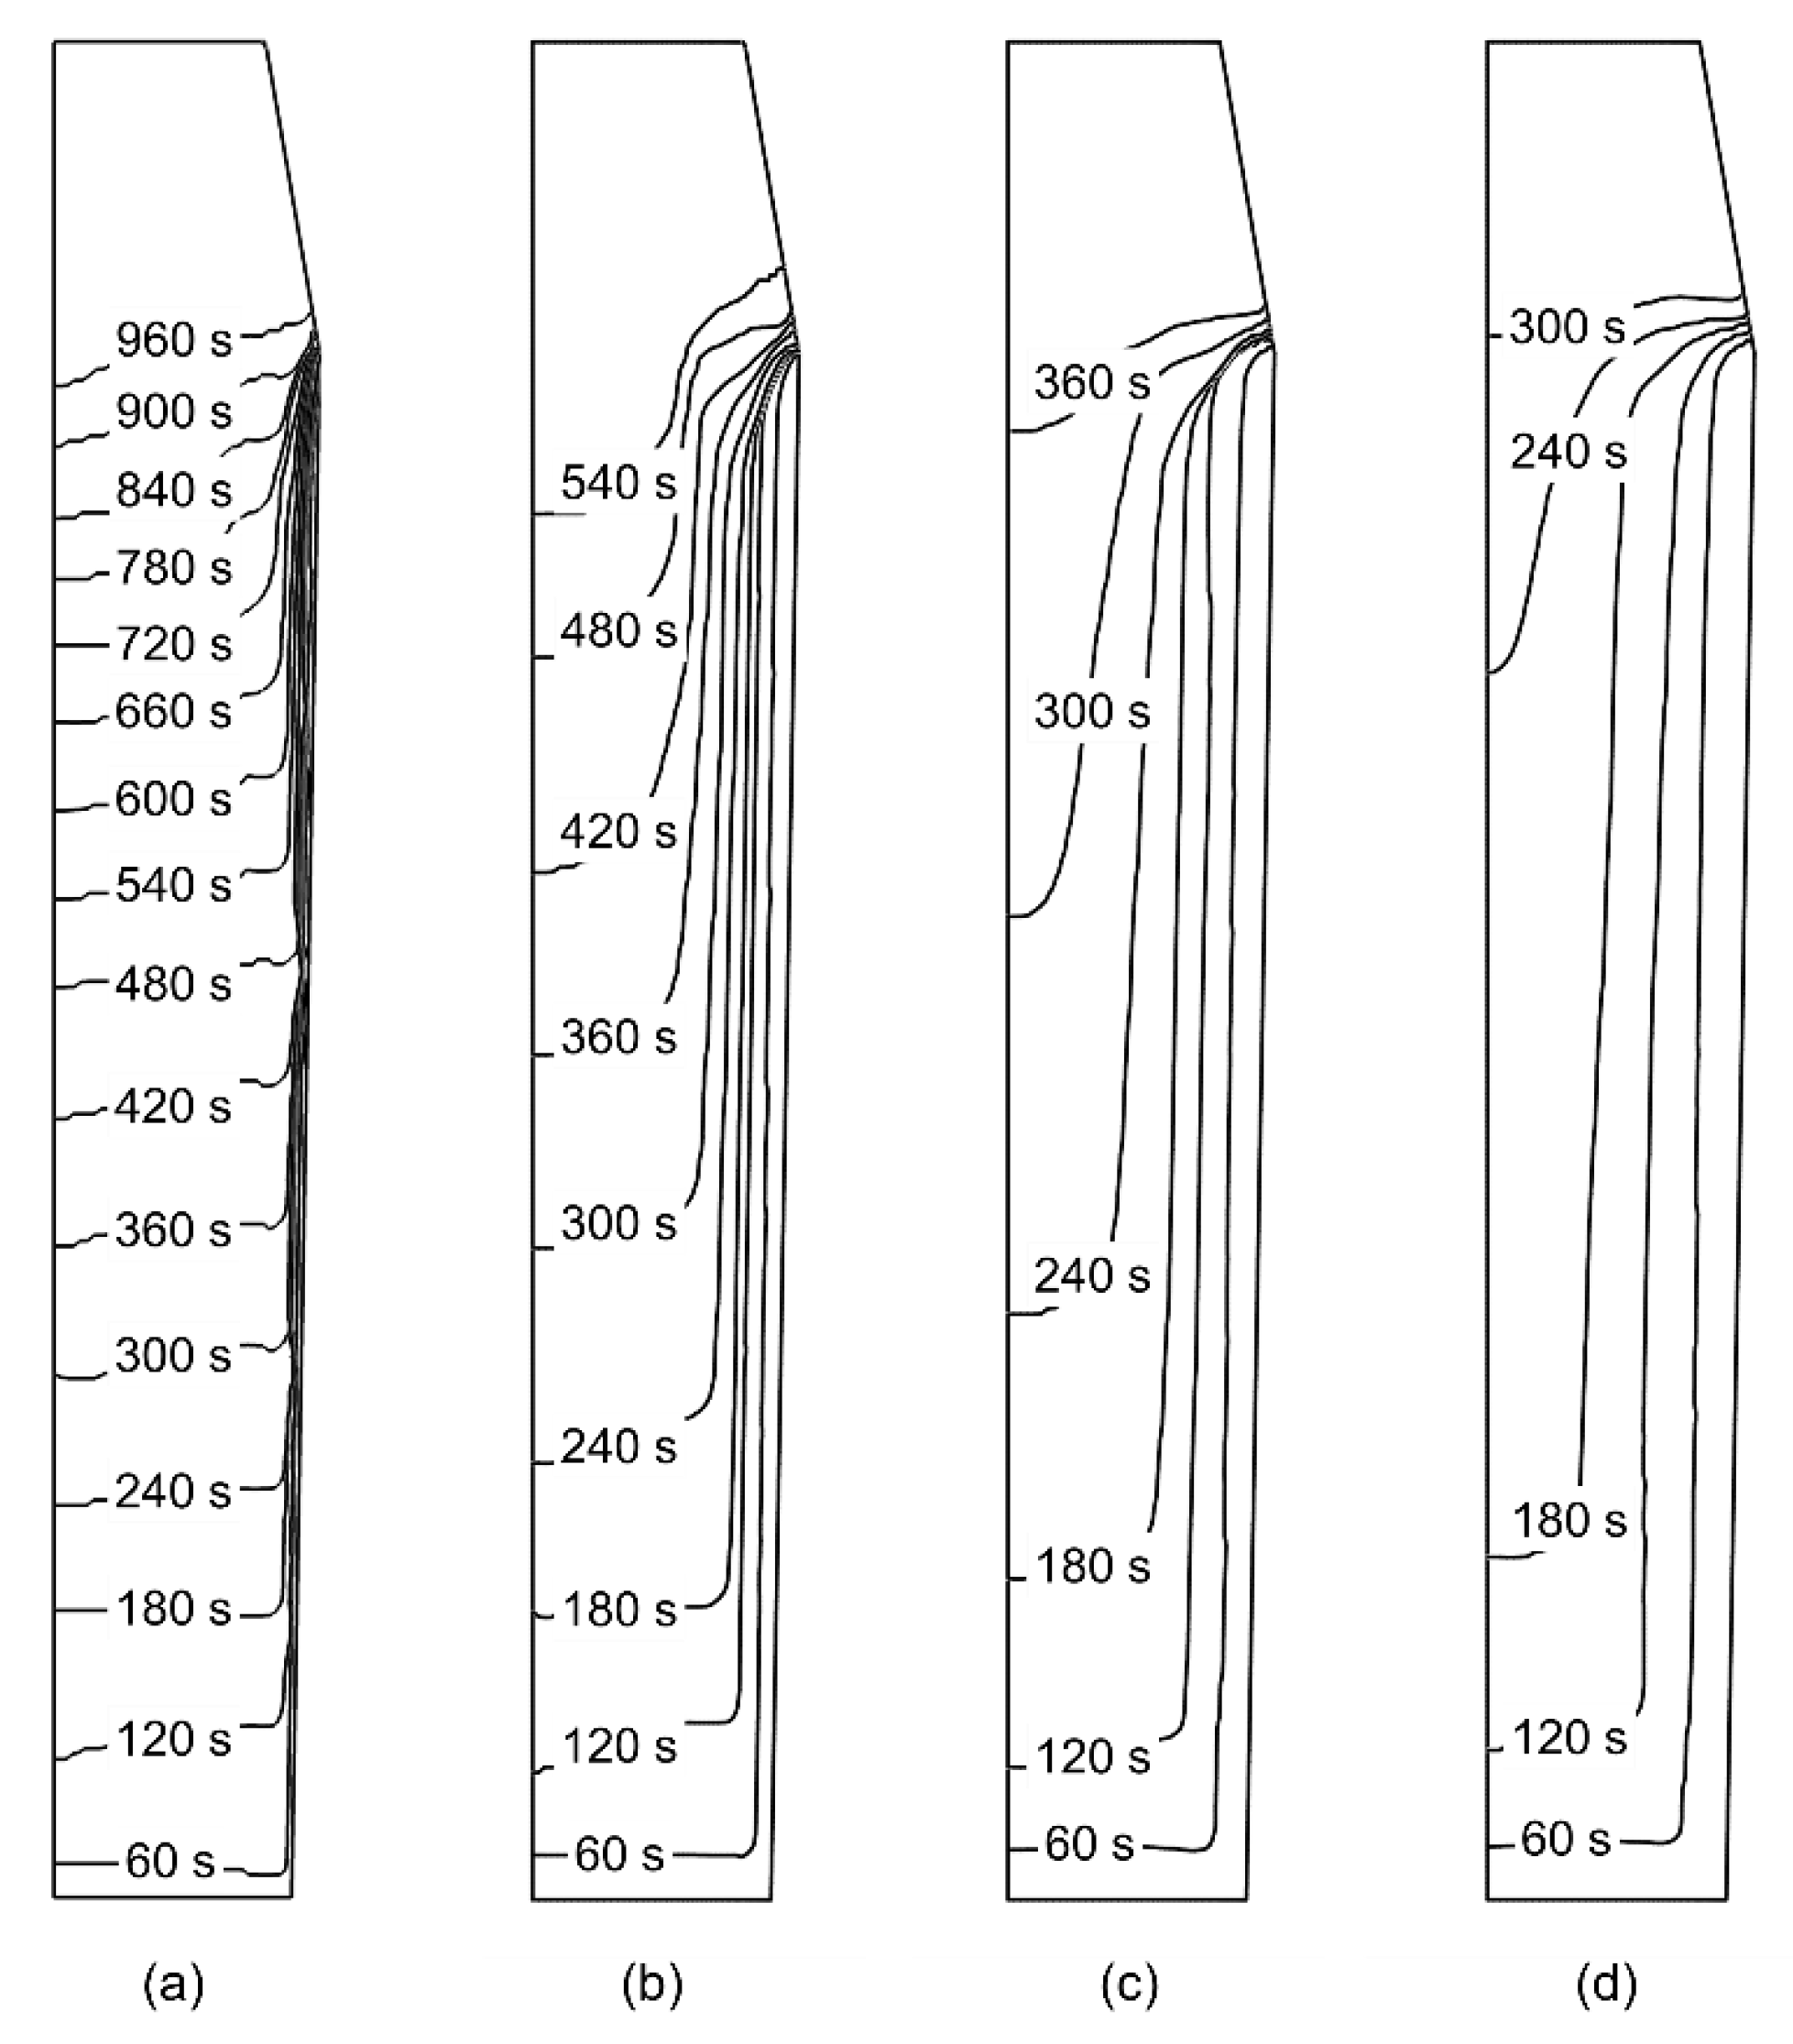
4.3. Effect of Mold Cooling Intensity

It has long been understood that an increase in ingot size favors macrosegregation formation. It has been demonstrated numerically that a special cooling procedure [22] or an increase in cooling rate [14] could alleviate macrosegregation. However, the effect of the cooling rate was studied with a fixed solid phase. In this section, we present a study aimed at verifying the effect of surface cooling intensity on final carbon macrosegregation with an equiaxed model. Initial conditions and ambient temperature remained the same as in the previous section, but the heat transfer coefficient h i n f was set to 100   W   m 2   K 1 , 300   W   m 2   K 1 , 600   W   m 2   K 1 , and 1000   W   m 2   K 1 . Although it is virtually impossible for the latter value of the heat transfer coefficient to be reached in industrial conditions, because this value was considered earlier [14] it is kept here as an illustration of a limiting case.
For all heat transfer coefficient values, the final distribution of the carbon concentration (Figure 8) presented positive segregation at the upper region of the ingot, which remained hot for a long time and was the last to solidify, and a negative cone near the ingot bottom. However, as the value of h i n f increased, the volume of ingots with very low segregation, −0.02 ≤ SI ≤ 0.03, also increased, whereas the height of the negative segregation cone at the bottom decreased. The positive segregation channels, discussed in Section 4.2, were also observed for higher values of the heat transfer coefficient (Figure 8c,d). However, their locations were transferred deeper into the ingot core, i.e., they moved closer to the axis of symmetry and farther from the top of the ingot.
To explain the effect of the cooling rate at different solidification stages, it is appropriate to analyze fluid flow at characteristic points P0 (0, 0.8), P1 (0.1, 0.8), and P2 (0.2, 0.8), the positions of which are indicated in Figure 1b. In Figure 9, a comparison of the evolution of the vertical component of liquid velocity over time at these points is presented for considered heat transfer coefficient values. Generally, the overall flow loop descended along the solidification front, which was parallel to the sidewall, and ascended in the ingot core, meaning that the vertical velocity had mainly a positive value at P0 (Figure 9a) and mainly a negative value at P2 (Figure 9c). When the grain phase was packed, liquid flow velocity approached zero due to large flow resistance from the fixed grain network. It is easy to observe that, at each point, the velocity obtained in the calculation with larger cooling coefficients reverted to zero at earlier stages.
The downward flow of liquid along the cooled sidewall intensified as the heat transfer coefficient increased. However it should be borne in mind that higher cooling rates promote earlier and faster growth of the solid phase, and this has a twofold effect. On the one hand, sedimentation of grains starts earlier everywhere in the volume and should be more intense. On the other hand, solute rejection at the solid–liquid interface also increases and contributes more intensively to the ascending flow. As already discussed above, the variation in the vertical component of velocity of extradendritic liquid near the axis and in the central part of the ingot is a result of competition between solutal upward convection and the downward drag effect from sedimenting grains.
Figure 9a shows that with stronger surface cooling, the upward flow rate at the central line monotonically increased with a maximal value of 2.27 cm s−1 for h i n f = 100   W   m 2   K 1 versus 2.75 cm s−1 at t = 72 s for h i n f = 1000   W   m 2   K 1 . That means that solutal buoyancy was stronger with a larger h i n f   and that more grains, the solid fraction of which was still small, were transported by the central flow to the upper region under stronger cooling conditions. A decrease in velocity signified an increase in solid fraction at point P0, whereas, since the axial velocity remained positive, the downward drag force from the grains was not enough to reverse the liquid motion at the early stage of the process. Grains with a solid fraction descended, but “released” rejected solute that again helped intensify the upward solute convection. This process was repeated twice for h i n f = 1000   W   m 2   K 1 with large variations in amplitude of axial velocity, and was stopped by the packed layer, which reached this height at ~200 s (Figure 10d). For smaller heat transfer coefficients, competition between growth of the solid fraction followed by descending grains and solutal convection gave rise to multiple flow oscillations that were finally also stopped due to grain packing. These oscillations gave an irregular form to the central zone of negative segregation.
The results obtained at point P2, 0.2 m from the central line and about 0.03 m from the ingot surface, are presented in Figure 9c. Here, the downward velocity value initially increased due to development of the flow field under the action of thermal buoyancy, before quickly reverting to zero when the packing layer reached that point. For the lowest value of the heat transfer coefficient, the process was different and was accompanied by flow oscillations that indicated flow instabilities similar to those described above. The effect of these instabilities on solute distribution in the ingot was also visible in Figure 8a as a variation in the segregation index near the ingot boundary. Finally, the flow behavior at point P1, located 0.1 m from the central line (Figure 9b), presented a combination of effects described for point P0 at the axis, which were followed by a change in flow direction to a descending one due to the sedimentation of the grains, the solid fraction of which was sufficiently developed to counteract solutal convection. Yet with the lowest value of h i n f , velocity oscillations persisted until the packed layer was reached.
Finally, the evolution of the location of the zone edge (the packing line) for different cases is shown in Figure 10. The comparison was performed for periods of time, ranging from the beginning of cooling until the moment when the equiaxed grains piled up to the top of the mold. This took about 960 s, where h i n f = 100   W   m 2   K 1 , 540 s where h i n f = 300   W   m 2   K 1 , 360 s where h i n f = 600   W   m 2   K 1 , and 300 s where h i n f = 1000   W   m 2   K 1 for grains piling up the mold. After this, it took 500 more seconds for the equiaxed grains to fill the hot top region for each case. It should be noted that ingot solidification was still far from completion since the grains were packed at f e = 0.4 , whereas the solid fraction varied from 0.25 to 0.3.

5. Conclusions

A three-phase equiaxed solidification model was applied to study the formation of macrosegregation in a 2.45 ton industrial steel ingot. A comparison of the calculated macrosegregation with the reported measurements [1] showed their qualitative agreement despite uncertainties in boundary conditions and a rather sizeable simplification of physical phenomena in the model. Numerical results revealed flow instabilities related to competition between solutal and thermal buoyancy effects in the liquid, added to which was the gravity force acting on grains depending on the solid fraction. These instabilities led to an irregular form of the central zone with negative segregation perturbed by horizontal channels and the emergence of long vertical channels, also observed in experiments. However, V-type channels along the axis were not reproduced. The study of the effect of cooling intensity confirmed that stronger surface cooling relieves macrosegregation of ingots as flow is stabilized by faster development of the packed layer. Yet, in real industrial processes, improvement of cooling conditions is difficult because of the formation of an air gap between the solidifying ingot and the mold due to shrinkage. Therefore, more investigation is needed to improve the cooling conditions of chill molds.
One of the most important simplifications in the model is the absence of the shrinkage effect, which may alter the multiphase flow during the process once the solid phase starts to appear, and which is clearly responsible for the segregation pattern in the upper part of the ingot. The role of columnar growth, which is not taken into account in the model, is, however, less clear. Indeed, in simulation, a layer of packed grains along the cooled walls and bottom appeared quite quickly once the process began and somehow corresponded to columnar dendrites observed in various reported experiments [1,3,4,8,12] or calculations elsewhere [19,21].

Author Contributions

Conceptualization, E.W.; literature search, O.B. and T.W.; development of numerical code, T.W., Y.D. and Y.F.; calculation and production of figures, T.W.; data analysis, E.W., Y.D. and O.B.; mathematical description, Y.F.; original draft preparation, T.W. All authors have read and agreed to the published version of the manuscript.

Funding

This research was funded by the National Nature Science Foundation of China (Grant No. U1760206), the National Key R&D Program of China (Grant No. 2017YFE0107900), the Project of Introducing Talents of Discipline Innovation to Universities 2.0 (the 111 Project of China 2.0, No. BP0719037), and the ESA-MAP MICAST project contract 14347/01/NL/SH.

Institutional Review Board Statement

Not applicable.

Informed Consent Statement

Not applicable.

Data Availability Statement

No new data were created or analyzed in this study. Data sharing is not applicable to this article.

Conflicts of Interest

The authors declare no conflict of interest.

Appendix A

Equations for momentum conservation are required only for grain phase and for extradendritic liquid phase, and they are given with the Navier–Stokes equations coupled with a realizable k ε ε turbulent model. Conditions for the grain packed region and unpacked region should be distinguished. If both phases can freely move, the momentum conservation equations are given by Equations (A1) and (A2) for the liquid and grain phases, respectively. If the grain phase becomes packed, the equation of motion for the grain phase reduces to u e 0 (instead of Equation (A2)) whereas the motion of the liquid is still described by Equation (A1).
( f l ρ l u l ) t + ( f l ρ l u l u l ) = f l P + [ ( μ l + ρ l C μ k ε 2 ε ) f l ( u l + ( u l ) T ) ] + F B l + K l e ( u e u l )
( f e ρ e u e ) t + ( f e ρ e u e u e ) = f e P + [ ( μ e + ρ e C μ k ε 2 ε ) f e ( u e + ( u e ) T ) ] + F B e + K l e ( u l u e )
where F B l represents the bouyancy force, which is treated with the Boussinesque approximation for extradendritic liquid accounting for thermal and solutal expansion:
F B l = f l ρ l g [ β T ( T r e f b T l ) + β c ( c l r e f c l ) ]
A similar term for the grain phase takes the Boussinesque approximation for interdendritic liquid and contains an additional term for the solid phase:
F B e = f d ρ l g [ β T ( T r e f b T l ) + β c ( c l r e f c d ) ] + f s Δ ρ g
where c l , c d , and c s are intrinsic solute concentrations associated with extradendritic liuid, interdendritic liquid, and solid phases, respectively, Δ ρ is the difference between solid phase density and reference density.
For the free-floating region, i.e., f e < f p e , the momentum exchange coefficient between the liquid and grain phases K l e is calculated with the Happel model [27]. When f e f p e , the coefficient K l e is evaluated with the Kozeny–Carman equation:
K l e = { 18 f l 2 f e μ l d e 2 2 + 4 / 3 f e 5 / 3 2 3 f e 1 / 3 + 3 f e 5 / 3 2 f e 2             f e < f p e 150 μ l f e 2 / ( d k 2 f l 3 )             f e f p e
The governing equations for k ε and ε are given below.
( ρ m k ε ) t + ( ρ m u m k ε ) = [ ( μ m + μ t , m σ k ) k ε ] + G k , m ρ m ε
( ρ m ε ) t + ( ρ m u m ε ) = [ ( μ m + μ t , m σ ε ) ε ] + ρ m C 1 S ε ρ m C 2 ε 2 k ε + μ t , m ε / ρ m
where index m is used for the mixture of l- and e-phases, whose properties are defined as ρ m = f l ρ l + f e ρ e ,   μ m = f l μ l + f e μ e ,   u m = ( f l ρ l u l + f e ρ e u e ) / ρ m . Closure relations and values for the constants used in Equations (A1)–(A7) are given in Table A1.
Table A1. Empirical constants and functions in the realizable k ε ε model.
ParametersParameters
G k , m = 2 μ t S 2 S = S i j S i j
μ t , m = ρ m C μ k ε 2 / ε C 1 = m a x   [ 0.43 , η / ( η + 5 ) ]
S i j = 1 / 2 ( u j / x i + u i / x j ) C μ = 1 / ( 4.04 + A s k ε U * ) / ε )
η = 2 S k ε / ε φ = cos 1 ( 6 W ) / 3
A s = 6 cos φ Ω i j = 1 / 2 ( u j / x i u i / x j )
U * = S i j S i j + Ω ˜ i j Ω ˜ i j W = S i j S j k S k i / S 3
C 2 = 1.9 A 0 = 4.4
σ k = 1.0 σ ε = 1.2

References

  1. Report on the heterogeneity of steel ingots. J. Iron Steel Inst. 1926, 113, 39–176.
  2. Flemings, M.C. Directional Solidification and Composite Structures. In Surfaces and Interfaces II; Springer: Boston, MA, USA, 1968; pp. 313–352. [Google Scholar]
  3. Fredriksson, H.; Hillert, M. On the formation of the central equiaxed zone in ingots. Metall. Trans. 1972, 3, 569–574. [Google Scholar] [CrossRef]
  4. Fredriksson, H.; Nilsson, S.O. On the formation of macrosegregations in ingots. Metall. Trans. B 1978, 9, 111–120. [Google Scholar] [CrossRef]
  5. Mehrabian, R.; Keane, M.A.; Flemings, M.C. Experiments on macrosegregation and freckle formation. Metall. Trans. 1970, 1, 3238–3241. [Google Scholar]
  6. Fujii, T.; Poirier, D.R.; Flemings, M.C. Macrosegregation in a multicomponent low alloy steel. Metall. Trans. B 1979, 10, 331–339. [Google Scholar] [CrossRef]
  7. Gu, J.P.; Beckermann, C. Simulation of convection and macrosegregation in a large steel ingot. Metall. Mater. Trans. A Phys. Metall. Mater. Sci. 1999, 30, 1357–1366. [Google Scholar] [CrossRef] [Green Version]
  8. Combeau, H.; Založnik, M.; Hans, S.; Richy, P.E. Prediction of macrosegregation in steel ingots: Influence of the motion and the morphology of equiaxed grains. Metall. Mater. Trans. B Process Metall. Mater. Process. Sci. 2009, 40, 289–304. [Google Scholar] [CrossRef]
  9. Pardeshi, R.; Voller, V.R.; Singh, A.K.; Dutta, P. An explicit-implicit time stepping scheme for solidification models. Int. J. Heat Mass Transf. 2008, 51, 3399–3409. [Google Scholar] [CrossRef]
  10. Pickering, E.J. Macrosegregation in steel ingots: The applicability of modelling and characterisation techniques. ISIJ Int. 2013, 53, 935–949. [Google Scholar] [CrossRef] [Green Version]
  11. Vannier, I.; Combeau, H.; Lesoult, G. Numerical model for prediction of the final segregation pattern of bearing steel ingots. Mater. Sci. Eng. A 1993, 173, 317–321. [Google Scholar] [CrossRef]
  12. Založnik, M.; Combeau, H. Thermosolutal flow in steel ingots and the formation of mesosegregates. Int. J. Therm. Sci. 2010, 49, 1500–1509. [Google Scholar] [CrossRef]
  13. Li, W.; Shen, H.; Zhang, X.; Liu, B. Modeling of species transport and macrosegregation in heavy steel ingots. Metall. Mater. Trans. B Process Metall. Mater. Process. Sci. 2014, 45, 464–471. [Google Scholar] [CrossRef]
  14. Meng, Q.; Wang, F.; Li, C.; Li, M.; Zhang, J.; Cui, G. Numerical simulation of macrosegregation in water-cooled heavy flat ingot during solidification. JOM 2014, 66, 1166–1174. [Google Scholar] [CrossRef]
  15. Chuang, Y.-K.; Schwerdtfeger, K. Equations for Calculating Sedimentation Segregation in Killed Steel. Arch. Eisenhuttenwes. 1975, 46, 303–310. [Google Scholar]
  16. Beckermann, C.; Wang, C.Y. Multiphase/-scale modeling of alloy solidification. Annu. Rev. Heat Transf. 1995, 115–198. [Google Scholar] [CrossRef]
  17. Li, W.S.; Shen, H.F.; Liu, B.C. Numerical simulation of macrosegregation in steel ingots using a two-phase model. Int. J. Miner. Metall. Mater. 2012, 19, 787–794. [Google Scholar] [CrossRef]
  18. Nguyen, T.T.M.; Gandin, C.A.; Combeau, H.; Založnik, M.; Bellet, M. Finite Element Multi-scale Modeling of Chemical Segregation in Steel Solidification Taking into Account the Transport of Equiaxed Grains. Metall. Mater. Trans. A Phys. Metall. Mater. Sci. 2018, 49, 1725–1748. [Google Scholar] [CrossRef]
  19. Wu, M.; Nunner, G.; Ludwig, A.; Li, J.; Schumacher, P. Evaluation of a mixed columnar-equiaxed solidification model with laboratory castings. IOP Conf. Ser. Mater. Sci. Eng. 2012, 27, 012018. [Google Scholar] [CrossRef] [Green Version]
  20. Li, J.; Wu, M.; Ludwig, A.; Kharicha, A. Simulation of macrosegregation in a 2.45-ton steel ingot using a three-phase mixed columnar-equiaxed model. Int. J. Heat Mass Transf. 2014, 72, 668–679. [Google Scholar] [CrossRef] [PubMed] [Green Version]
  21. Leriche, N.; Combeau, H.; Gandin, C.A.; Založnik, M. Modelling of columnar-to-equiaxed and equiaxed-to- columnar transitions in ingots using a multiphase model. IOP Conf. Ser. Mater. Sci. Eng. 2015, 84, 1–8. [Google Scholar] [CrossRef] [Green Version]
  22. Ge, H.; Ren, F.; Cai, D.; Hao, J.; Li, J.; Li, J. Gradual-cooling solidification approach to alleviate macrosegregation in large steel ingots. J. Mater. Process. Technol. 2018, 262, 232–238. [Google Scholar] [CrossRef]
  23. Wu, M.; Ludwig, A.; Kharicha, A. A four phase model for the macrosegregation and shrinkage cavity during solidification of steel ingot. Appl. Math. Model. 2017, 41, 102–120. [Google Scholar] [CrossRef]
  24. Wang, T.; Semenov, S.; Wang, E.; Delannoy, Y.; Fautrelle, Y.; Budenkova, O. Effect of Diffusion Length in Modeling of Equiaxed Dendritic Solidification under Buoyancy Flow in a Configuration of Hebditch-Hunt Experiment. Metall. Mater. Trans. B 2019, 50, 3039–3054. [Google Scholar] [CrossRef]
  25. Wang, T.; Hachani, L.; Fautrelle, Y.; Delannoy, Y.; Wang, E.; Wang, X.; Budenkova, O. Numerical modeling of a benchmark experiment on equiaxed solidification of a Sn–Pb alloy with electromagnetic stirring and natural convection. Int. J. Heat Mass Transf. 2020, 151, 119414. [Google Scholar] [CrossRef]
  26. Lipton, J.; Glicksman, M.E.; Kurz, W. Dendritic growth into undercooled alloy metals. Mater. Sci. Eng. 1984, 65, 57–63. [Google Scholar] [CrossRef]
  27. Happel, J. Viscous flow in multiparticle systems: Slow motion of fluids relative to beds of spherical particles. AIChE J. 1958, 4, 197–201. [Google Scholar] [CrossRef]
  28. Kubota, K.; Murakami, K.; Okamoto, T. Fluid flow and macrosegregation in cylindrical ingots. Mater. Sci. Eng. 1986, 79, 67–77. [Google Scholar] [CrossRef]
  29. Sun, H.; Zhang, J. Study on the Macrosegregation Behavior for the Bloom Continuous Casting: Model Development and Validation. Metall. Mater. Trans. B 2014, 45, 1133–1149. [Google Scholar] [CrossRef]
  30. Badillo, A.; Ceynar, D.; Beckermann, C. Growth of equiaxed dendritic crystals settling in an undercooled melt, Part 2: Internal solid fraction. J. Cryst. Growth 2007, 309, 216–224. [Google Scholar] [CrossRef]
  31. Dou, K.; Yang, Z.; Liu, Q.; Huang, Y.; Dong, H. Influence of Secondary Cooling Mode on Solidification Structure and Macro-segregation Behavior for High-carbon Continuous Casting Bloom. High Temp. Mater. Process. 2017, 36, 741–753. [Google Scholar] [CrossRef]
Figure 1. (a) Scheme of a 2.45 ton ingot with indication of sizes and (b) corresponding calculation domain. The initial conditions for the simulations are given, and two coefficients for convective heat exchange, h s u p   and   h i n f , are associated with the upper and lower parts of the ingot surface, respectively. The initial conditions for the simulations are T 0 = 1769   K , c 0 = 0.45   wt . % , and zero velocities in the liquid. The two coefficients for convective heat exchange, are h sup and h inf , with the upper and lower parts of the ingot surface defining the intensity of convective heat removal from the ingot as h s u p ( T 373   K ) and h i n f ( T 373   K ) for these parts, respectively. The indicated points P0, P1, and P2 serve for the analysis of the calculation results.
Metals 11 00262 g001
Figure 2. (a) Schematic figure for the dendritic structure and grain growth process, which consists of the expansion of the envelope (indicated by the red line), and (b) growth of the solid phase at the expense of the interdendritic liquid.
Metals 11 00262 g002
Figure 3. Grain number density distribution and velocity vectors of the grain phase at different times: (a) 20 s, (b) 50 s, (c) 100 s, (d) 200 s, and (e) 400 s. A logarithmic scale is used for the color map.
Metals 11 00262 g003
Figure 4. Grain phase fraction distribution and vectors of relative velocity between the e-phase and l-phase u e u l , where the black line indicates the interface between packed and unpacked regions at different times: (a) 20 s, (b) 50 s, (c) 100 s, (d) 200 s, and (e) 400 s.
Metals 11 00262 g004
Figure 5. Solid phase fraction distribution (left half) and distribution of the solute concentration in the mixture overlapped by streamlines of fluid flow in the packed region and by velocity vectors of the liquid phase in the unpacked region (right half) at different times: (a) 120 s, (b) 200 s, (c) 300 s, and (d) 400 s. The black line indicates the interface between the packed and unpacked regions.
Metals 11 00262 g005
Figure 6. Comparison of the macrosegregation map between the experiment and the calculation: (a) sulfur print [1] (b) measured carbon segregation index [1], and (c) calculated carbon segregation index at t = 1000 s. Left: fine mesh. Right: coarse mesh.
Metals 11 00262 g006
Figure 7. Comparison of the distribution of the segregation index along the central line of ingots between the calculation and the experimental measurement.
Metals 11 00262 g007
Figure 8. The final carbon segregation index profiles under different cooling intensities: (a) 100 W m−2 K−1, (b) 300 W m−2 K−1, (c) 600 W m−2 K−1, and (d) 1000 W m−2 K1.
Metals 11 00262 g008
Figure 9. Variation in the vertical component of the liquid velocity at points P0 (a), P1 (b), and P2 (c) during solidification for different values of the heat transfer coefficients.
Metals 11 00262 g009
Figure 10. Packing line evolution at different heat transfer coefficients under different cooling intensities: (a) 100 W m−2 K−1, (b) 300 W m−2 K−1, (c) 600 W m−2 K−1, and (d) 1000 W m−2 K1.
Metals 11 00262 g010
Table 1. Thermodynamic and physical properties.
PropertyUnitsQuantityReferences
Carbon contentwt.%0.45-
Melting point of pure ironK1805.15[8]
Liquidus slope K   ( wt . % ) 1 −80.45[8]
Equilibrium partition coefficient10.314[8]
Reference density kg   m 3 7200[28]
Solid–liquid density difference kg   m 3 200-
Specific heat J   kg 1   K 1 725[29]
Thermal conductivity W   m 1   K 1 34[8]
Latent heat J   kg 1 2.72 × 10⁵[29]
Viscosity kg   m 1   s 1 4.2 × 10⁻³[8]
Thermal expansion coefficient K 1 1.07 × 10⁻⁴[8]
Solutal expansion coefficient ( wt . % ) 1 1.4 × 10⁻²[8]
Maximal grain number density m 3 2.0 × 10⁹[8]
Grain packing limit fraction10.4[8]
Secondary arm spacingm5.0 × 10−4[8]
Shape factor for tip growth10.18[30]
Sphericity10.53[30]
Liquid diffusion coefficient m 2   s 1 2.0 × 10⁻⁸[8]
Gibbs–Thomson coefficient m 2   s 1 1.9 × 10⁻⁷[31]
Publisher’s Note: MDPI stays neutral with regard to jurisdictional claims in published maps and institutional affiliations.

