Study of Wire Deformation Characterization and Size Effects during the Micro-Flat-Rolling Process

1
School of Mechanical, Materials, Mechatronic and Biomedical Engineering, University of Wollongong, Wollongong 2522, Australia
2
Department of Mechanical Engineering, Tokyo Metropolitan University, Hachioji, Tokyo 192-0397, Japan
*
Author to whom correspondence should be addressed.
Metals 2020, 10(3), 405; https://doi.org/10.3390/met10030405
Submission received: 29 February 2020
/
Revised: 19 March 2020
/
Accepted: 20 March 2020
/
Published: 22 March 2020
(This article belongs to the Special Issue Metal Micro-forming)
Abstract
:A comprehensive research on the flat rolling deformation characterization of microwire has been conducted systematically through finite element simulation and testified by the results from the experimental analysis. The obtained results are compared in terms of lateral spread, geometrical characteristic, contact area width and surface roughness considering the effects of pass reduction and initial wire diameter. The size effect has been identified and surface layer modeling has been set up based on surface grain share and grain size distribution. The numerical method combined with varied flow stress has been verified by experimental value with a maximum difference of 3.7% for the 1.5 mm wire. With the increase of the height reduction, the curvature radius is decreased while the lateral spread and contact area width are increased. Surface roughness evolution in the range of 0.52–0.85 µm for the rolled wire has also been investigated.
1. Introduction
During cold rolling, microwire with a circular cross-section is flat-rolled at room temperature through two rolls to gain the required ratio of thickness-to-width under one or several passes with a specific cross-section due to the barreling effect. The flattened wire products are widely used in medical catheters, electric parts, springs, guide rails and piston rings [1,2] where this side-barrel type cross-section cannot be produced by normal strips or plates through flat rolling. More complex profiles can be manufactured by adding subsequent profile rolling steps. The edge rounding and lateral spreading are two key factors that are related to the rolled wire quality.
Inhomogeneous deformation occurs during the wire flattening rolling deformation process under different height reduction, which influences the contact stress distribution and the deformation force. The methods and techniques applied in the macro-domain cannot be used directly in the micro-domain [3], the size effect due to downscaling should be considered in the micro-forming process [4]. The shear band idea has been used to calculate the contact area width, and the lateral spread and the rolling load can be predicated by slab analysis [5], where the investigation on the effects of height reduction on the effective strain field during flat wire rolling had been conducted and the evolution of the shear bands was predicted as well. The different contact pressure patterns were investigated and confirmed by 3D numerical analysis [6]. The relationship between contact stress distributions and the deformation homogeneity has been identified in flat wire rolling [7,8,9]. The authors of [10] reported an experimental investigation on the deformation behavior where the influences of the rolling parameter were discussed, and the quantitative relationship of contact area width with rolling reduction was established [11]. The influencing parameters on the spread, residual stresses, loads, and pressure distribution have been reported in references [12,13,14,15]. The mechanical anisotropy has played an important role in the geometry evolution of steel wire rolling [13]. Grain size has long been known in influencing the material properties during the forming process, such as surface quality, material flow and yield stress [16,17,18,19,20,21]. The size effects in the simulation and experiment have been reported in references [22,23]. Although the research mentioned above, the real physical mechanism of size effect is still unclear in the micro-flat-rolling of wires.
In this study, the effects of wire height reduction on the contact area width between the rolls and wire will be investigated and their influence on rolled product characteristics and quality will also be identified. The study will conduct experimentally and numerically on the impact of height reduction on the lateral spread variations during the rolling process. In order to investigate the size effect, flat wire experimental rolling with different wire diameters will be carried out and compared with the finite element (FE) simulation results and this comparison will evaluate their simulation accuracy. The research findings obtained discover the effects of rolling process parameters and further analysis of deformation mechanism during flat microwire rolling will, therefore, provide a parameter optimization method for micro-forming process design.
2. Experimental and Simulation
2.1. Micro-Rolling Mill and Materials Used
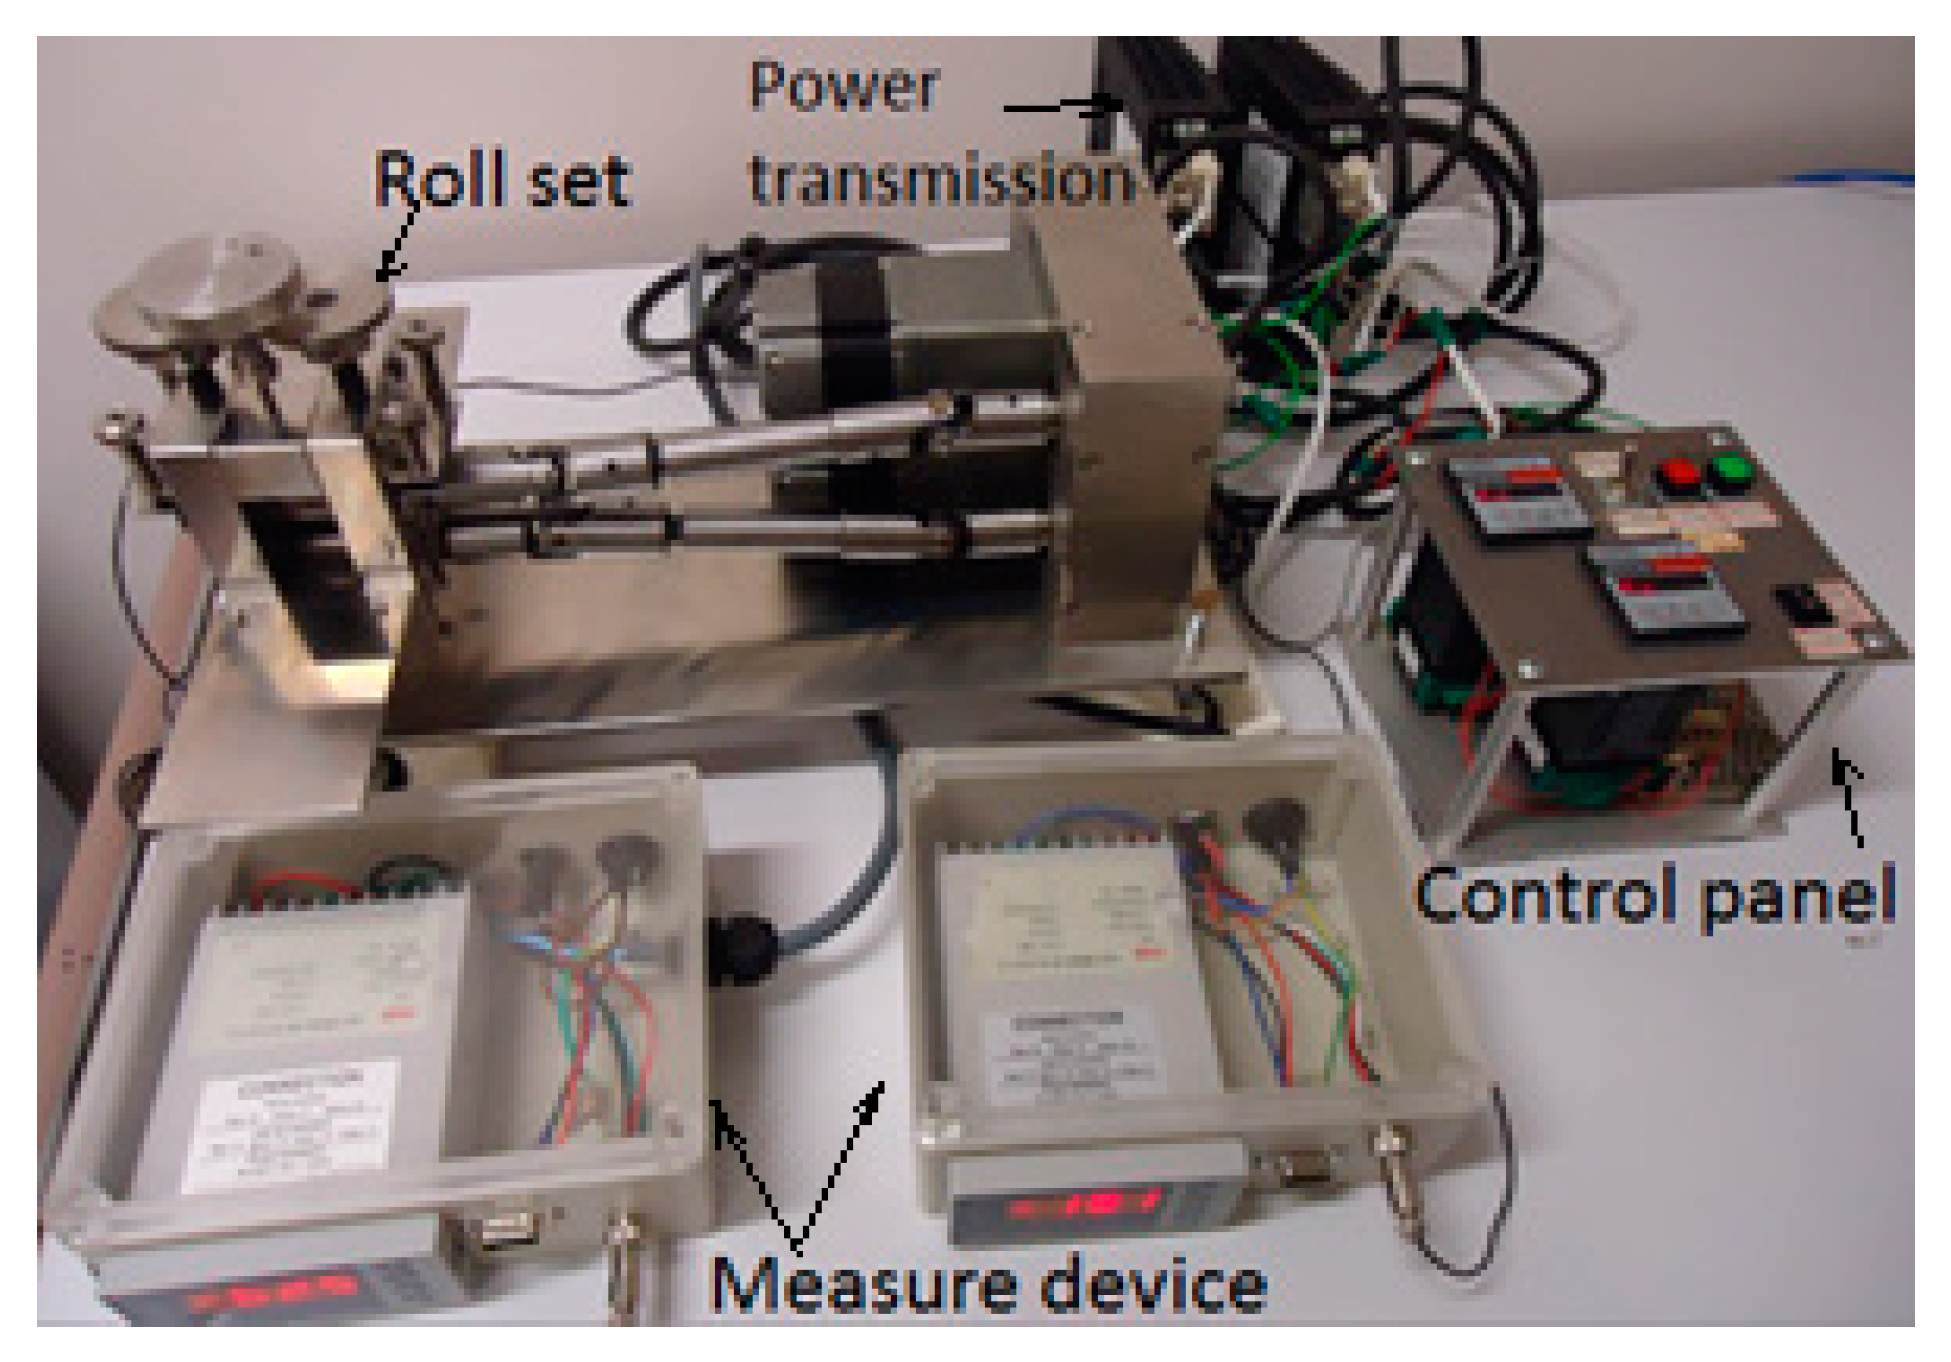
The micro-flat-rolling mill system and two-high rolling mill are shown in Figure 1. The rolling mill system includes a roll set, power transmission, a measurement system and a control panel. The two-high roll set consists of two work rolls with 27 mm in diameter and 29.5 mm in barrel length which are made by two different materials: an ultra-strength alloy of cemented carbide (Young’s Modulus: 580 GPa) and tool steel SKD 11 (Young’s Modulus: 210 GPa), respectively. This kind of work roll with cemented carbide significantly enhances the rolling mill’s rigidity and decreases the deflection of the rolls. Turning the screw through the knob to adjust the roll gap and then wire products with the desired thickness can be obtained through the rolling process. By adjusting the electric voltage frequency, various rolling speeds could be applied to investigate the effect of rolling speeds on the micro-rolling process. The rolling capacity of this designed rolling mill is featured with a rolling load of 40 kN. The pure copper wire is used as initially rolled materials, and their chemical composition is shown in Table 1. Two different work rolls are applied and copper wire has three different diameters of 0.8 mm, 1.0 mm and 1.5 mm, respectively.
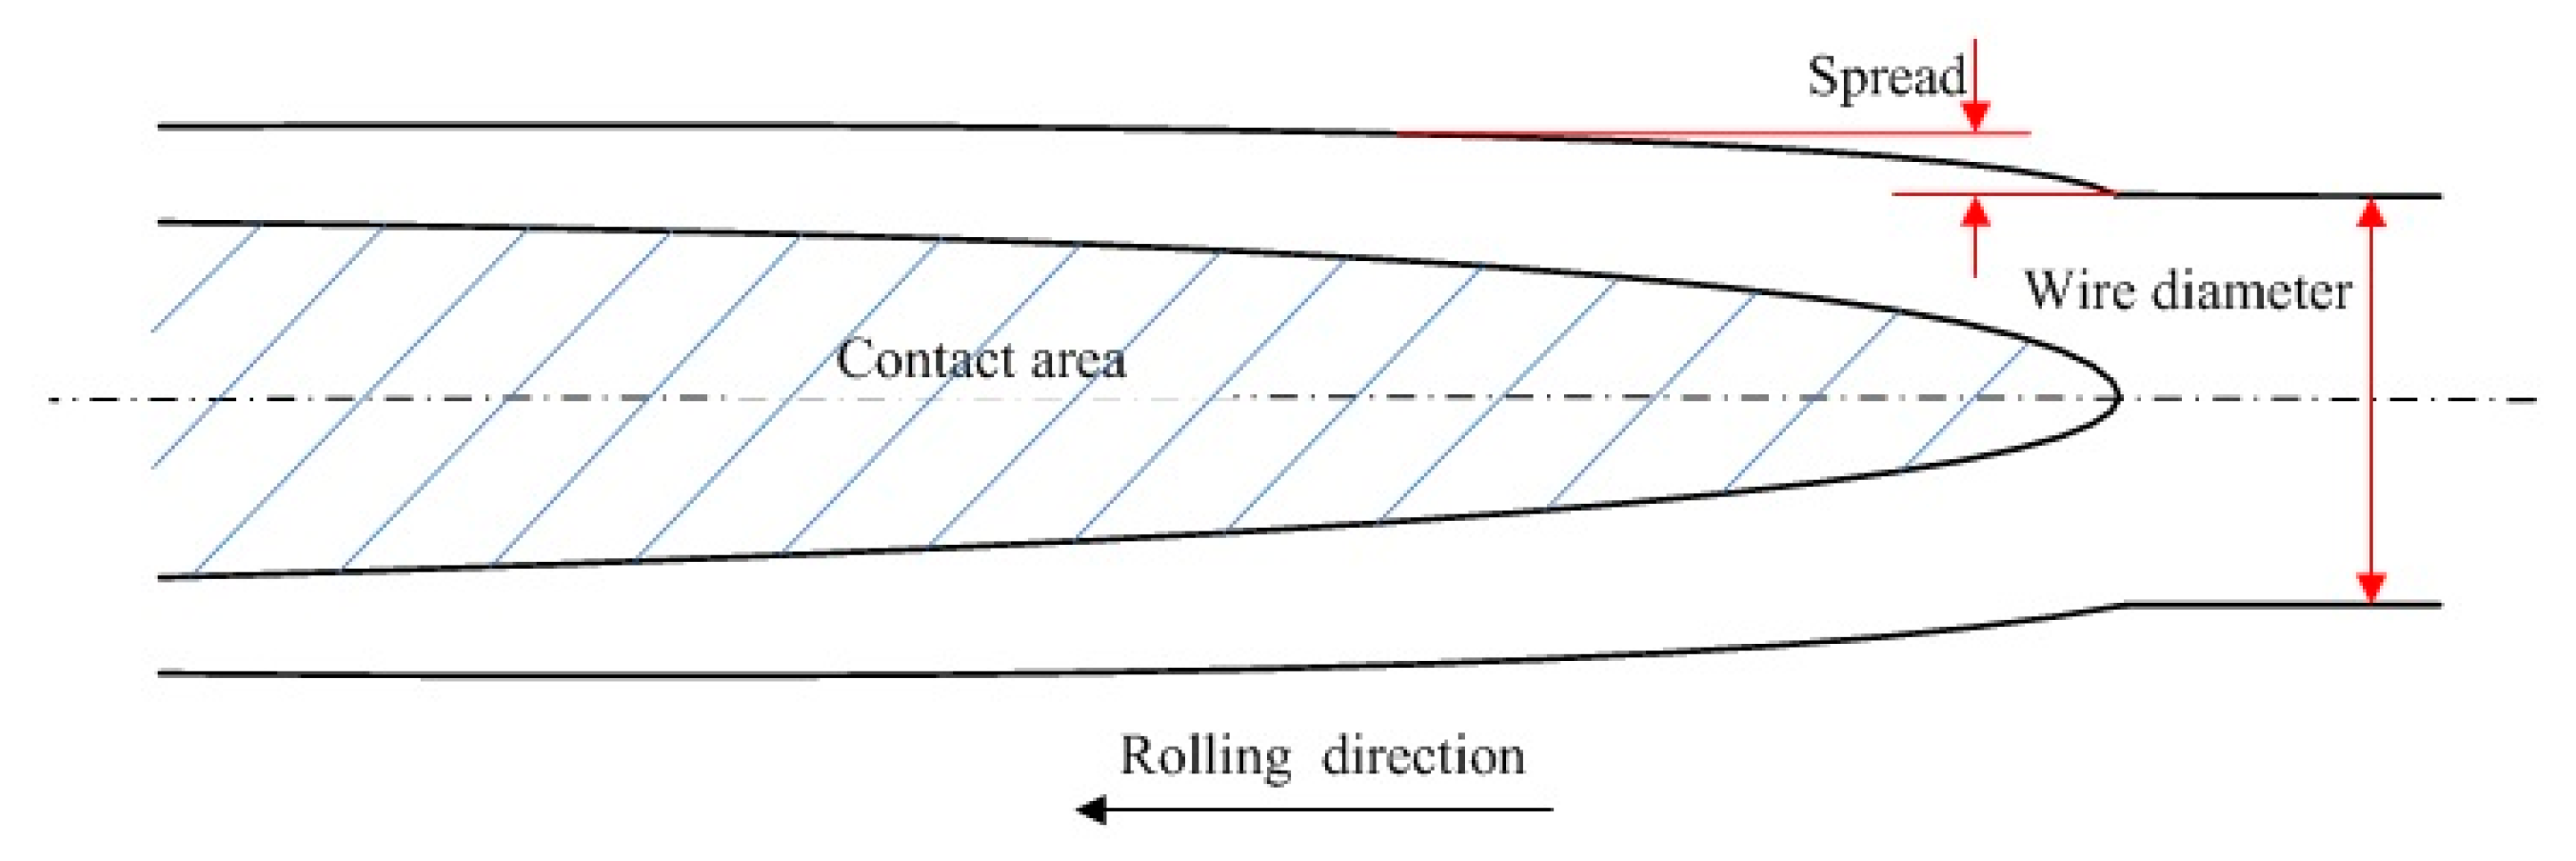
Figure 2 illustrates the sketch drawing of the deformed wire. It can be seen that the spread is a significant feature in micro-flat-rolling. The main parameters of contact area and spread are included.
2.2. Numerical Simulation
In this study, the explicit dynamic finite element software, LS-DYNA R8 (LSTC), is applied to analyze the deformation behavior of the flat microwire rolling process, where the element type solid164 with a three-dimensional 8 node solid element has been used for the rolling simulation. The simulation parameters of the roll and rolled material used in the finite element analysis are the same as the values in the real rolling experiment.
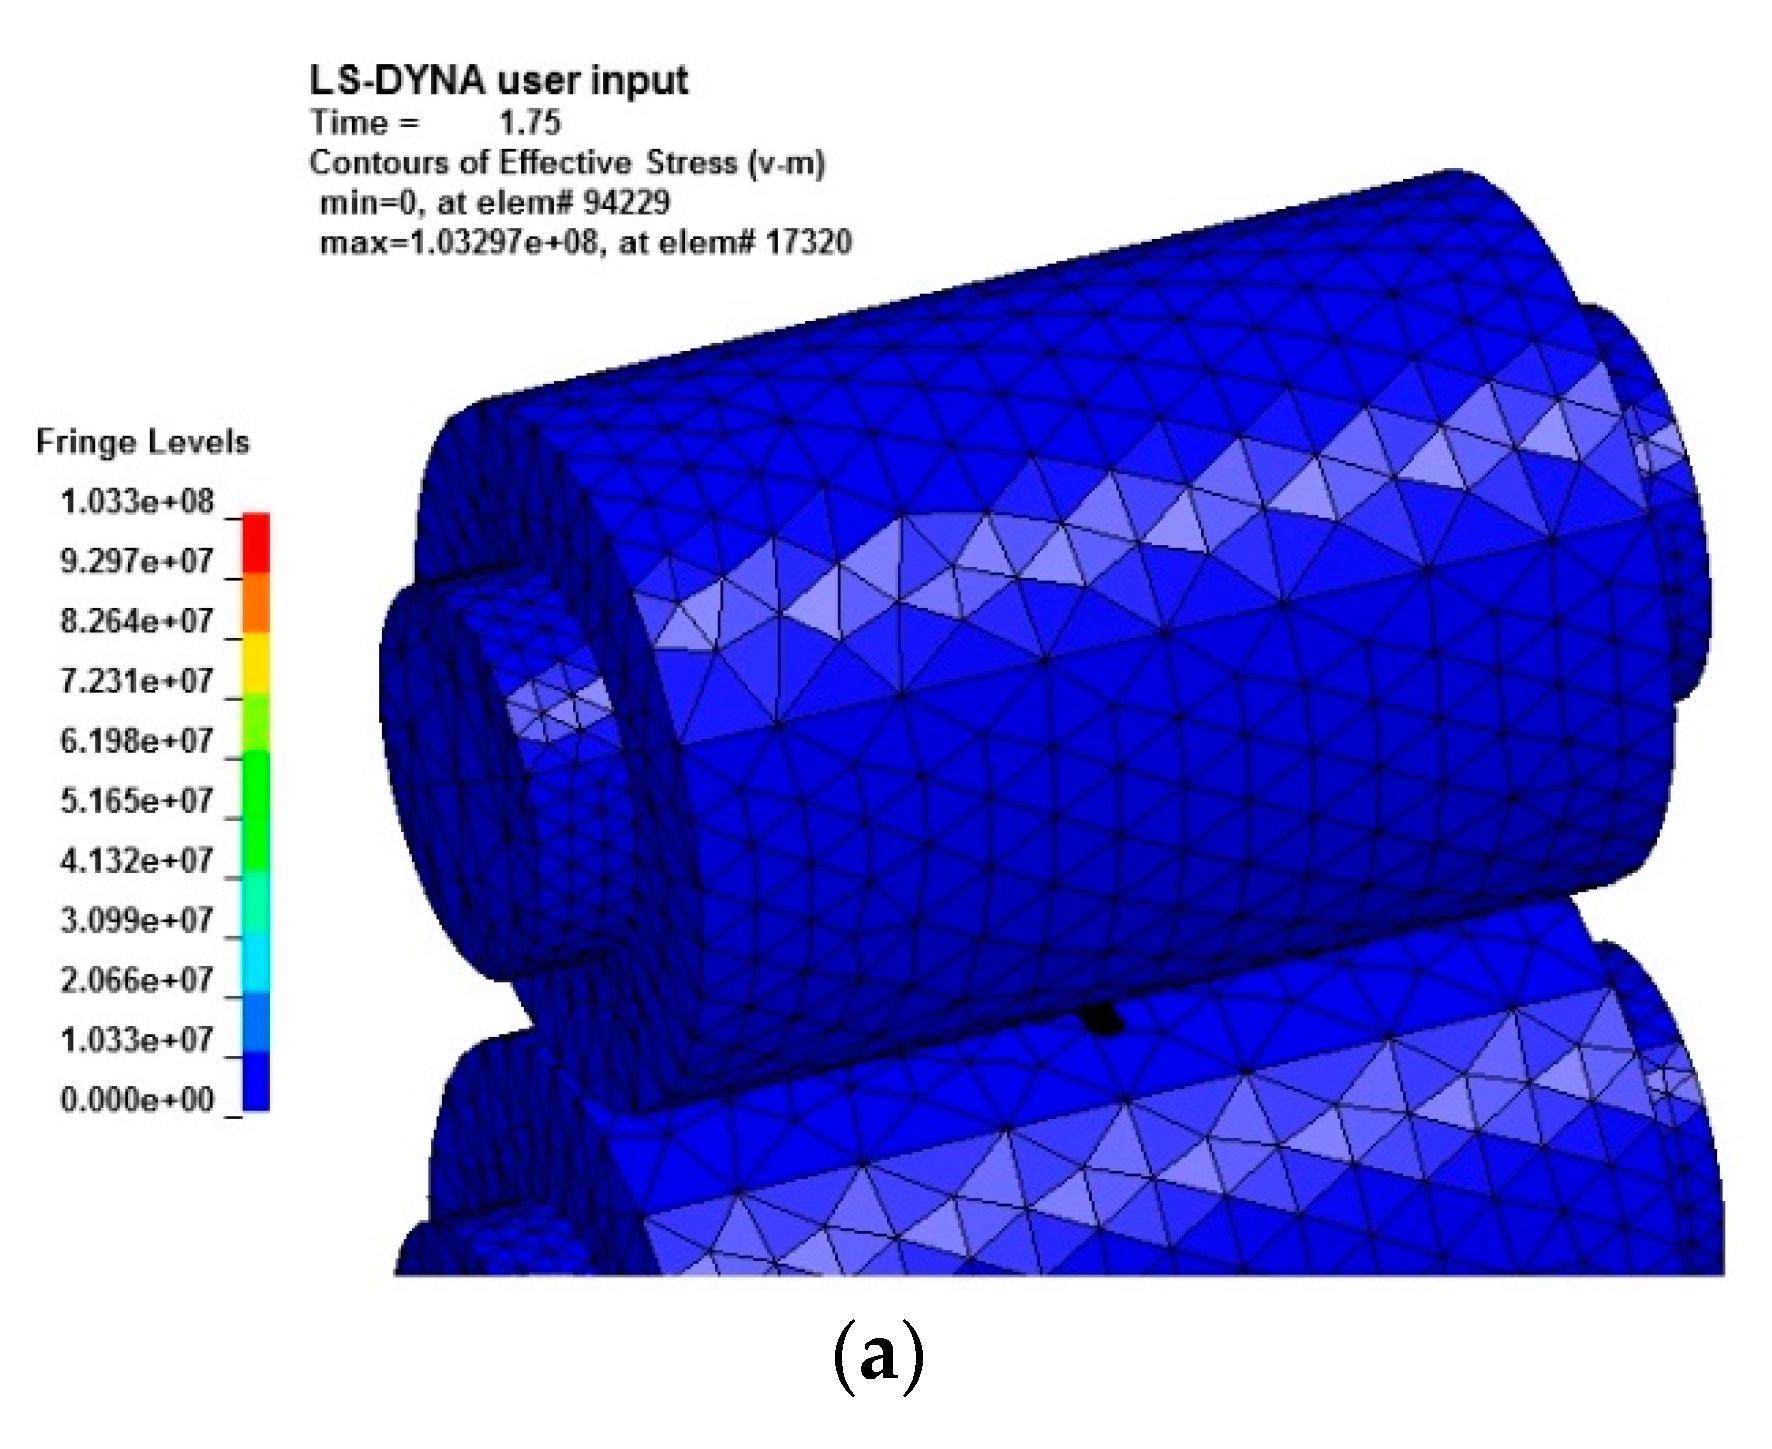
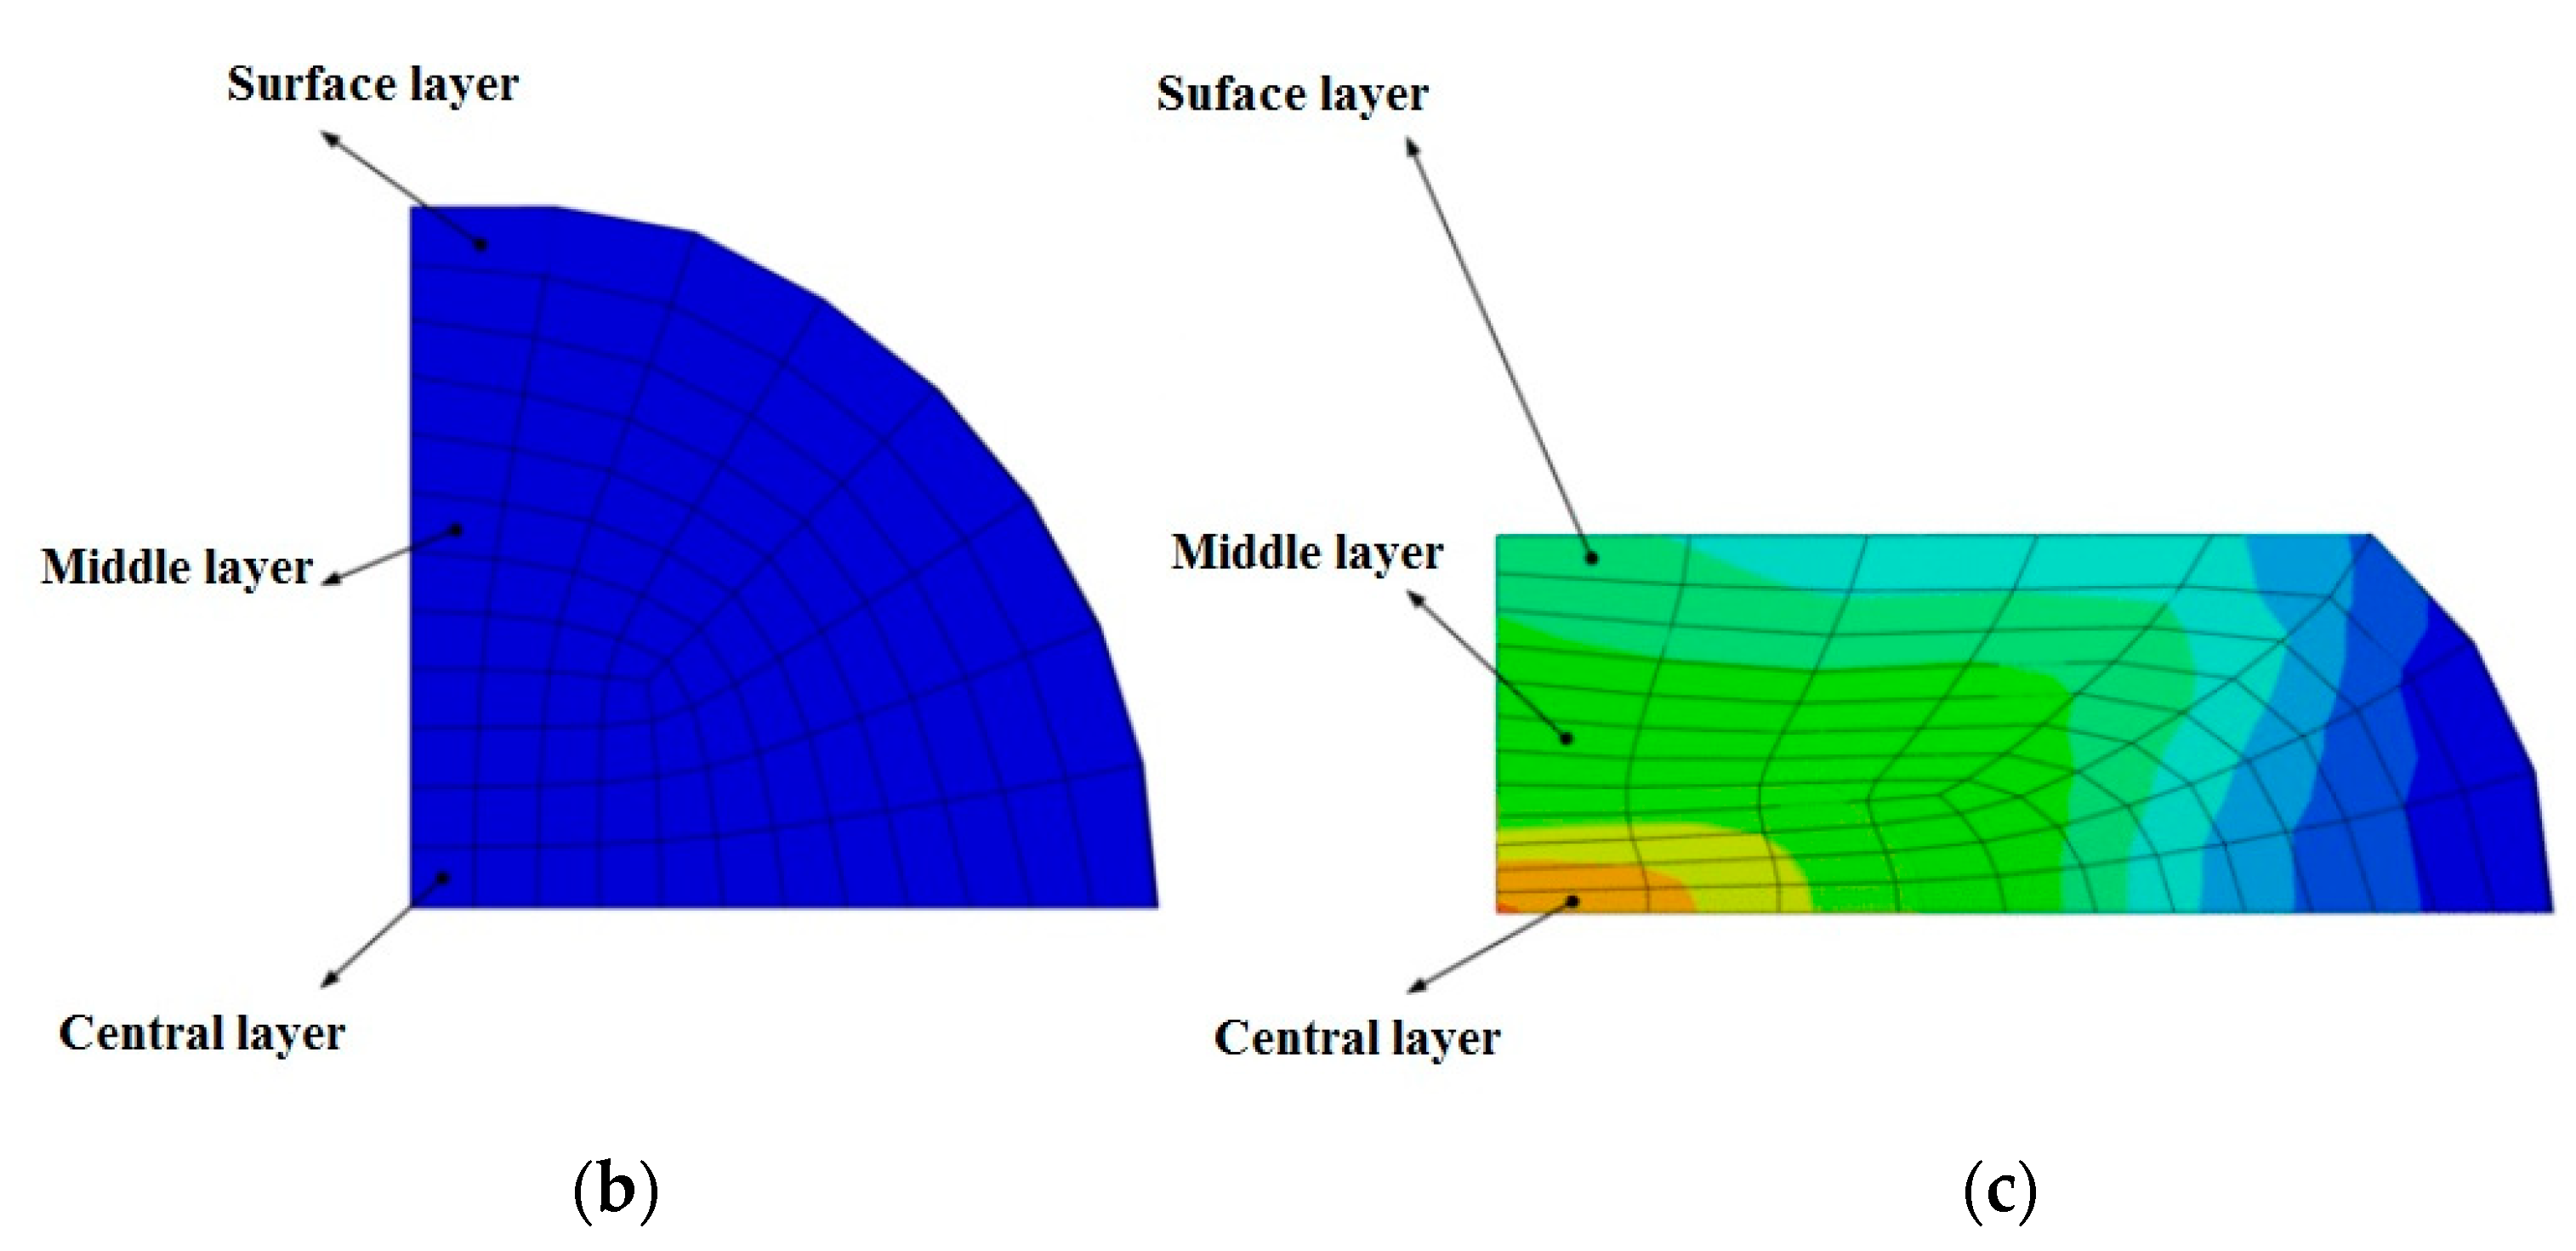
During the simulation of the rolling process, a fixed angular speed is applied on the roll for roll rotation. We can assume the copper wire moves along the rolling direction at a certain speed. When the copper wire moves forward into the bite zone, the friction force between rolls and rolled wire will take effect. The rolling process will go ahead. A coefficient of friction (COF) of 0.18 is applied in rolling simulation after experimental tests. Considering the effect of elastic deformation of work roll, the work roll is considered a linear-elastic material. The rolled copper wire is assumed to be isotropic elastoplastic. Figure 3 shows a simulation model of wire flat rolling on a two-high rolling mill. Figure 3a is the roll meshing in the flat micro-rolling of wire. Figure 3b,c are the cross-section before and after rolling, respectively. In the simulation, the forming resistance, the rolling spread, contact width and rolled wire surface quality are evaluated.
2.3. Micro-Compression Test
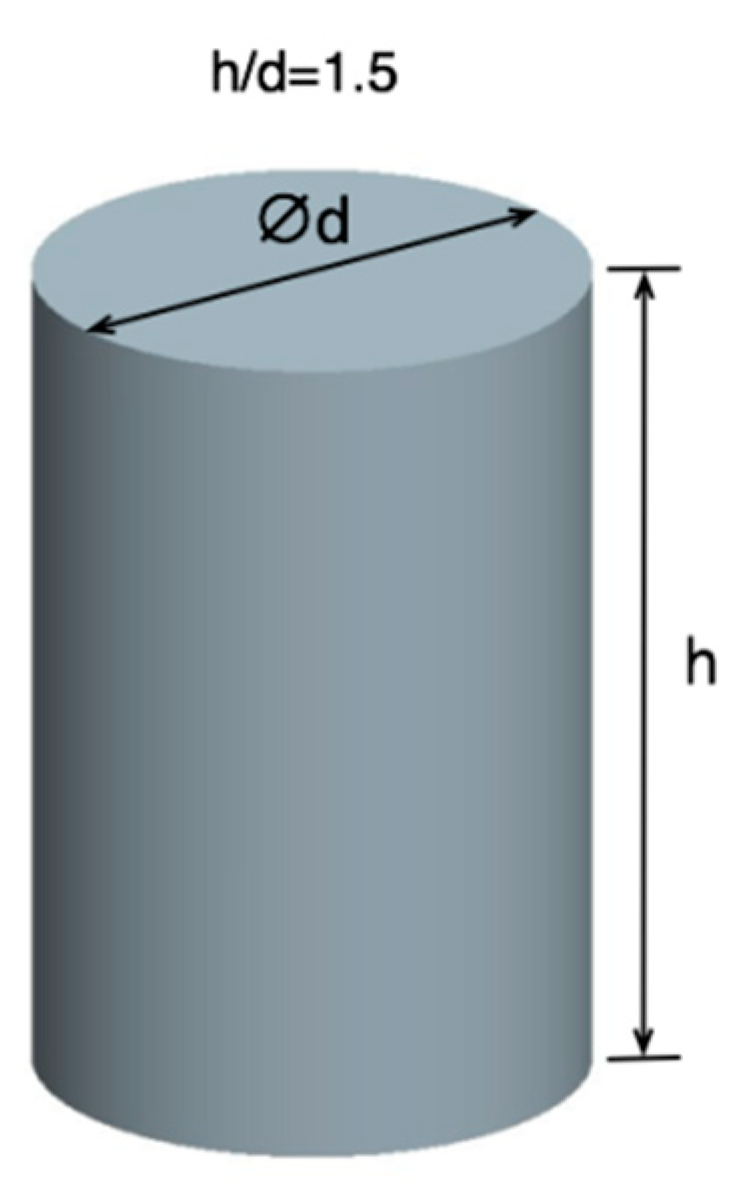
In the micro-compression test, the experimental samples are pure copper with three different geometrical dimensions of Φ 0.8 mm × 1.2 mm, Φ 1.0 mm × 1.5 mm, and Φ 1.5 mm × 1.8 mm, respectively. The wire cutting process is applied to prepare for the cylindrical samples as shown in Figure 4, which indicates a 1.5 ratio of height to diameter.
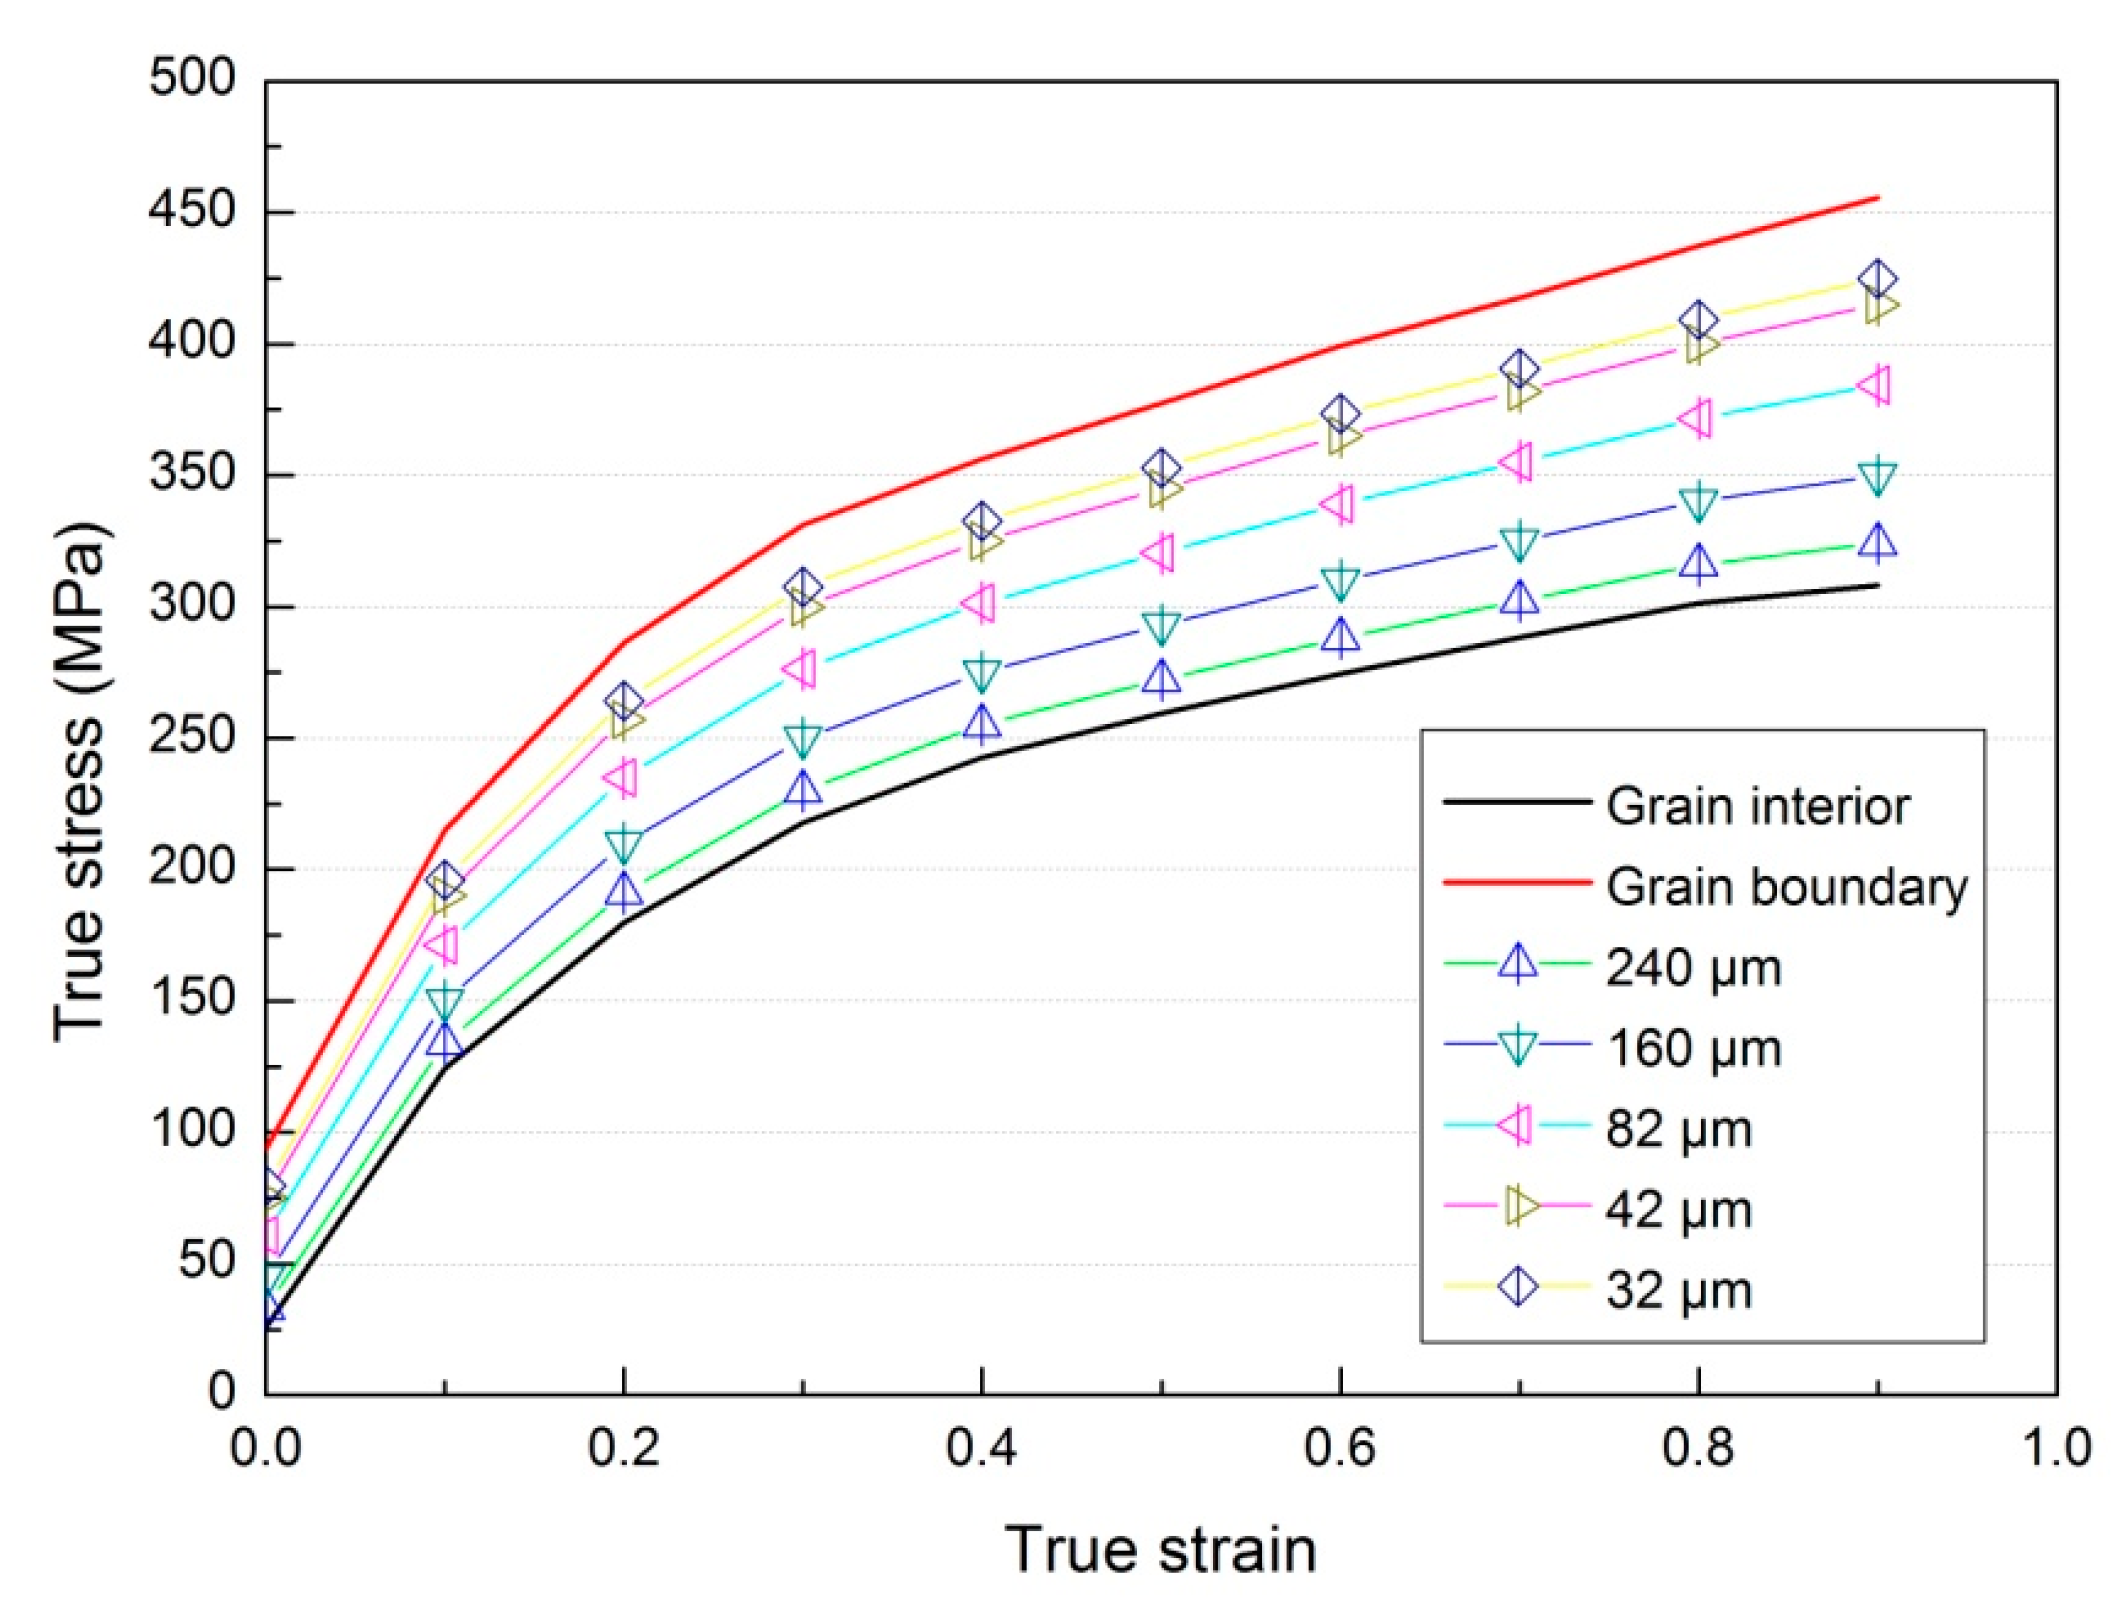
A digital spiral micrometer is used to measure accurately the testing sample geometries. In order to minimize the influence of friction at the interface of tools and samples, the sample cross-sections are rubbed by fine sandpaper [17]. The side surface of these samples was polished using chamois before experimental testing in order to remove any macro-surface defects. Stripping off the disturbance of the initial surface asperity of the specimen is necessary when investigating the variation of specimen side surface during compression deformation. The specimen is annealed under different holding times to obtain various grain sizes. The annealing process of copper wire has been listed in Table 2. The strain–stress curves for various grain sized copper wire are shown in Figure 5 during the micro-compression test. It can be seen that the stress increases with decreased grain size under different strains.
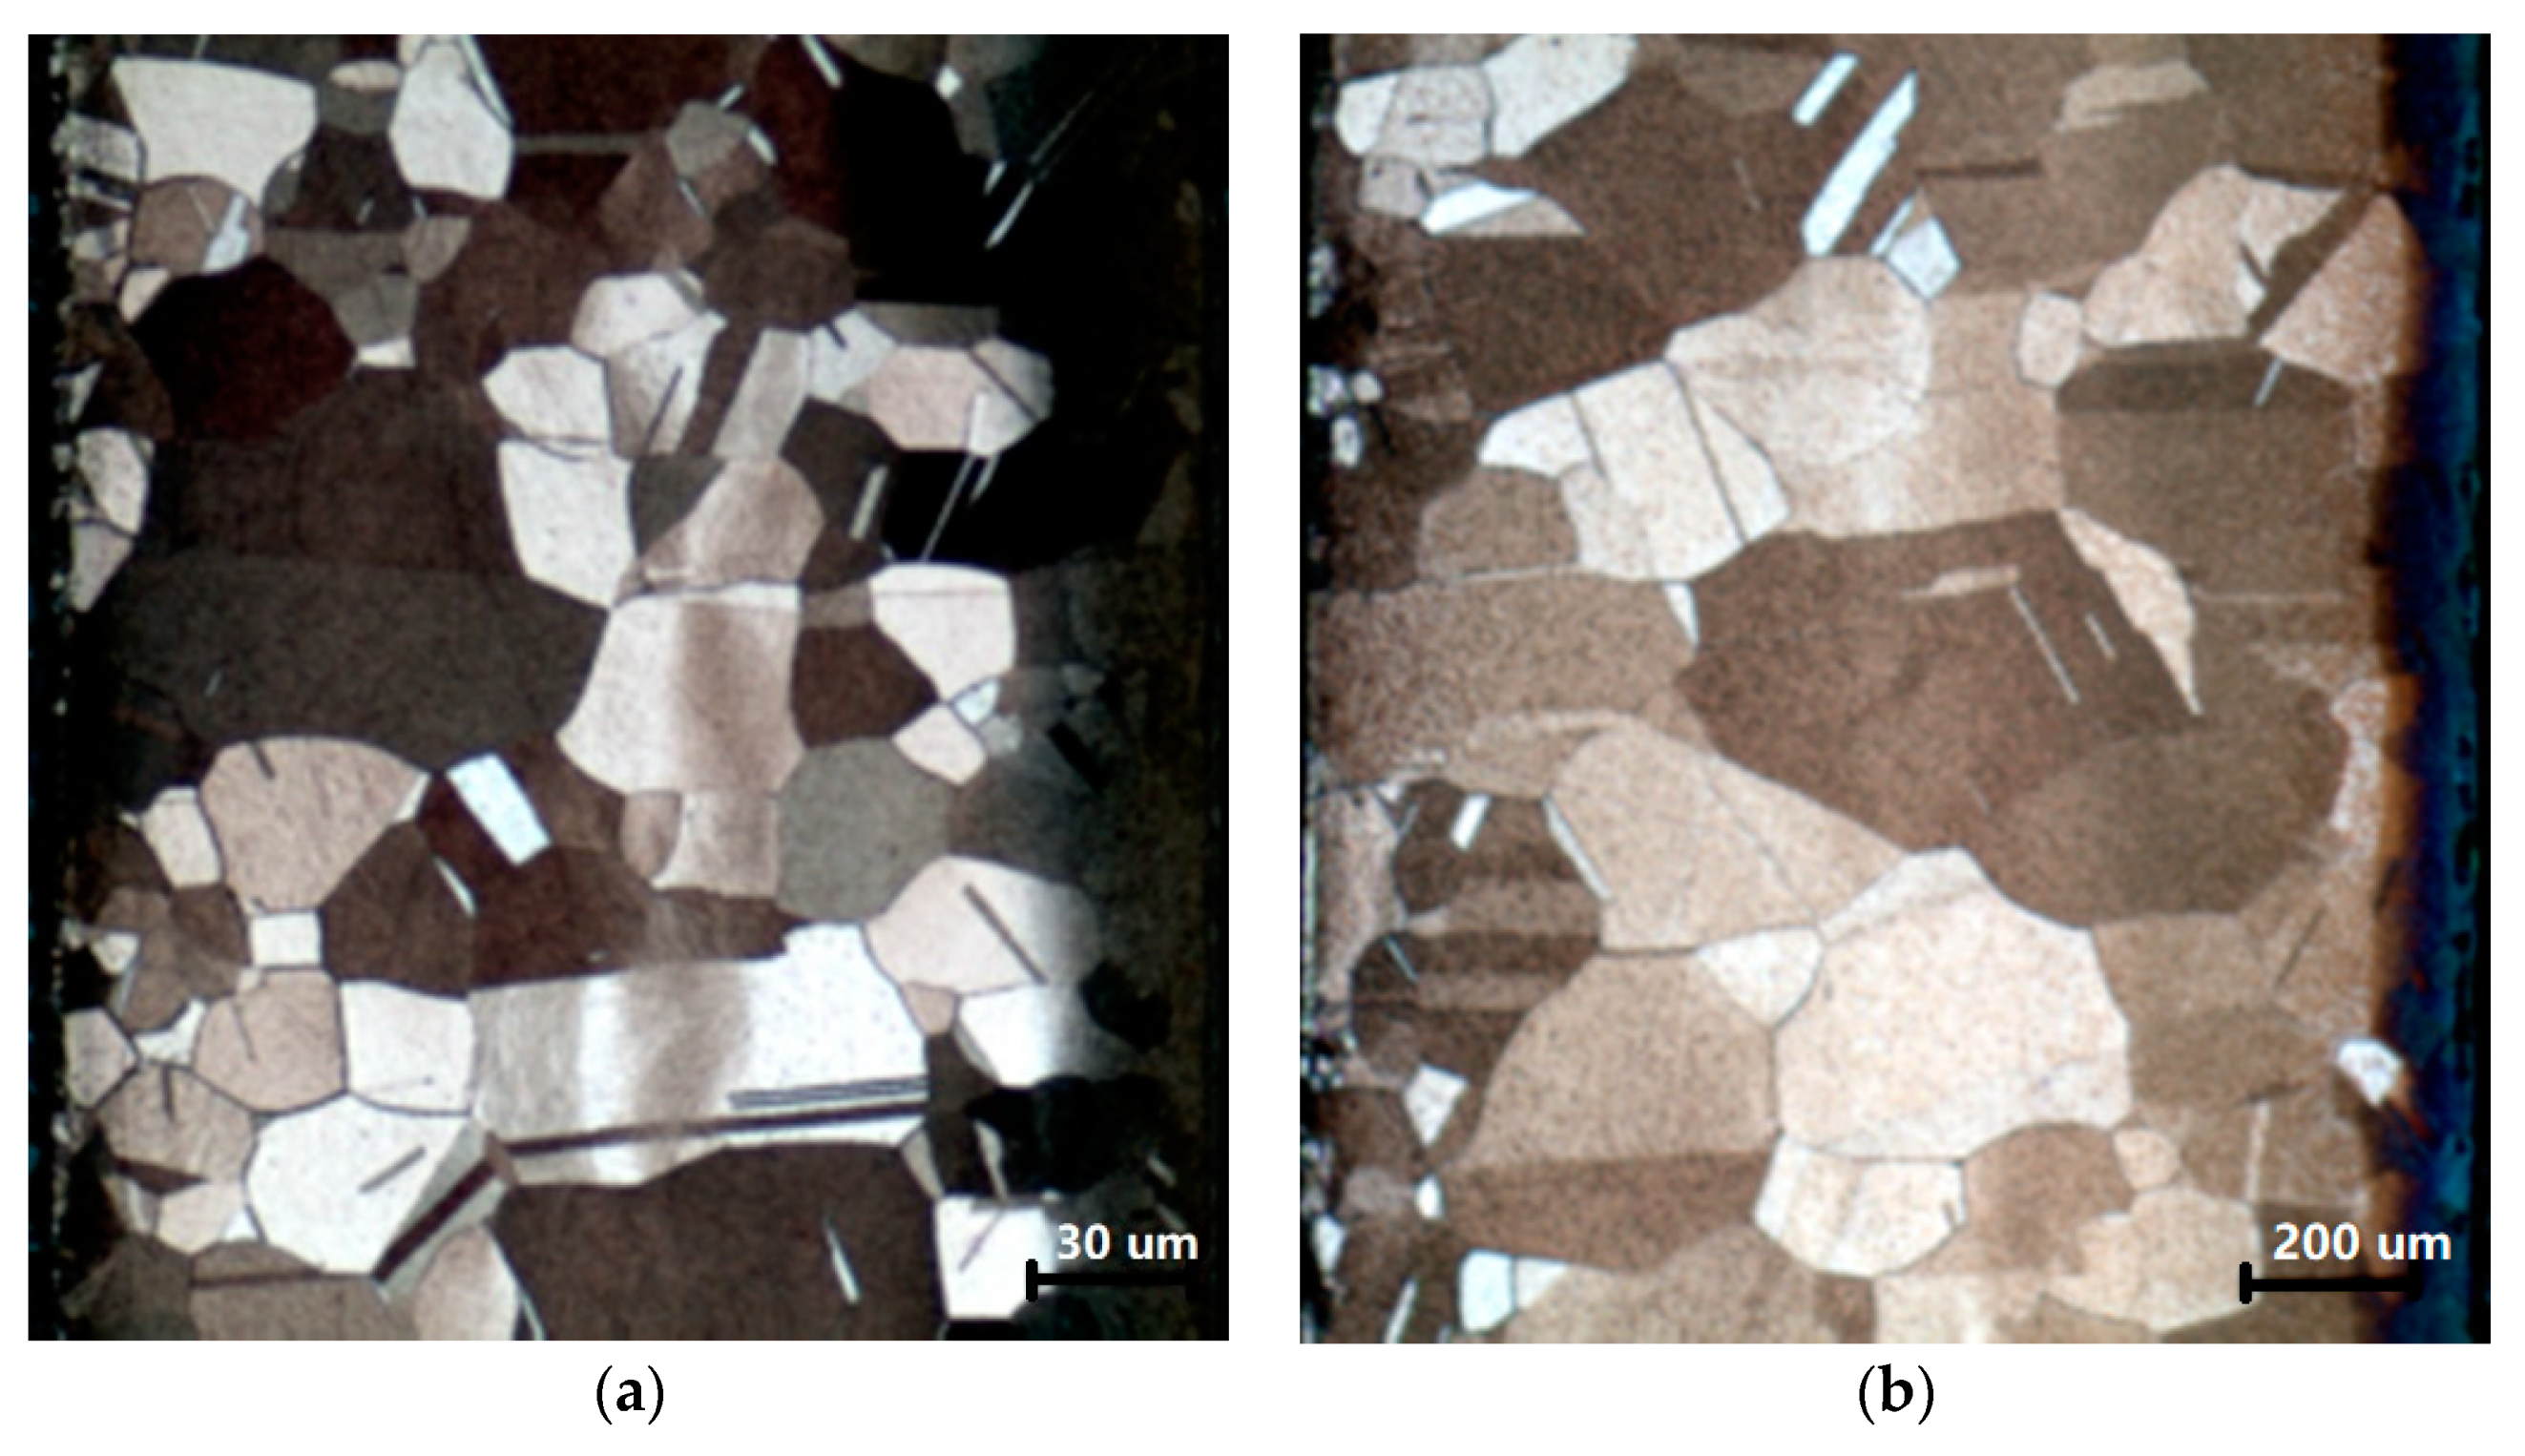
The microstructure for 32 µm and 240 µm after annealing process are shown in Figure 6.
Assuming that there is an elastoplastic behavior involving isotropic deformation hardening, the deformed material was modeled, using the J2 plasticity model which is independent of the deformation rate. A Young modulus E = 120 GPa and a Poisson ratio of 0.355 were used to model the elastic deformation zone. The linear hardening law is applied for the plastic deformation zone during simulation,
where and are the equivalent plastic stress and strain, respectively; is the strain hardening exponent. The values of 183.4 and 1.605 are initial equivalent stress and strength index, respectively, which can be obtained by experiments.
3. Results and Discussion
3.1. Theoretical Analysis
In the flat rolling process of wire, the existence of friction between the wire and rolls will cause the formation of two dead metal zones, resulting in the macroscopic shear bands, which are observed in metallographic cross-section of wire. Their morphology after the pass reduction in height of the wire as shown in Figure 7a–c (initial wire, the first pass and the second pass, respectively). It can be seen that the shear bands are in the form of X as shown in these figures, which may be considered as the slip line in flat rolling of wire.
The contact area width between the wire and rolls can be formed below:
where is the thickness reduction, and are the initial diameter and the thickness after flat rolling, respectively. From Equation (2), the wire contact area width is in the proportional relationship with the square root of height reduction.
The wire lateral spread is another important parameter in the deformation process, which can be obtained by the following equation [13,14]:
where p is a function of the roll diameter and ratio of the initial width to the height of wire. are correction factors, which are related to the grain size, material composition, roll material, rolling speed and rolling temperature, respectively, and the values of these parameters can be obtained by experiments.
3.2. Microstructure Evolution and Surface Layer Modeling
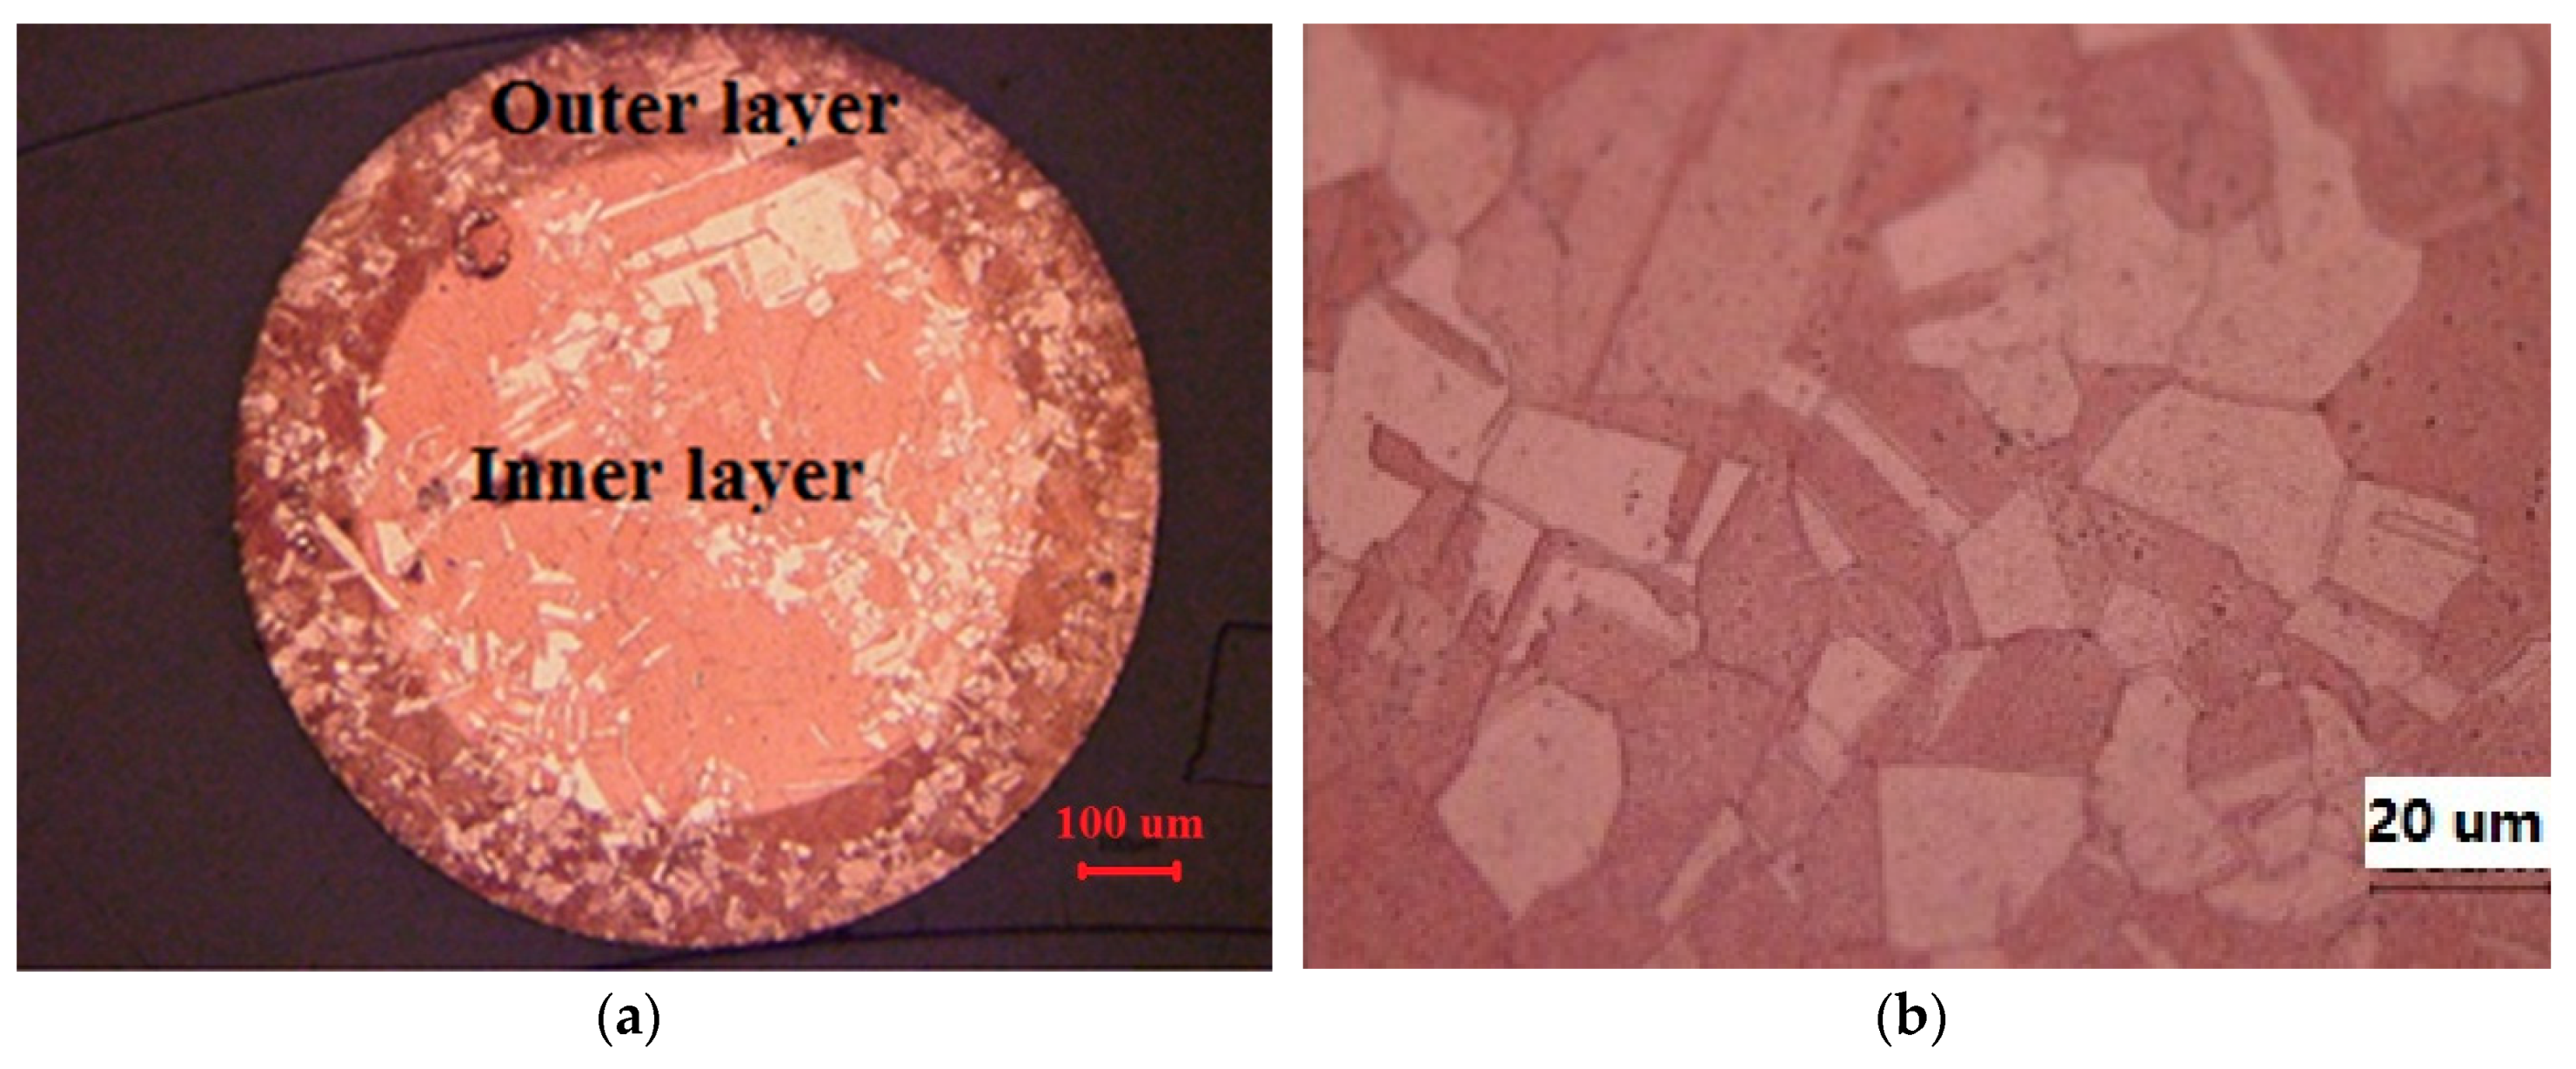
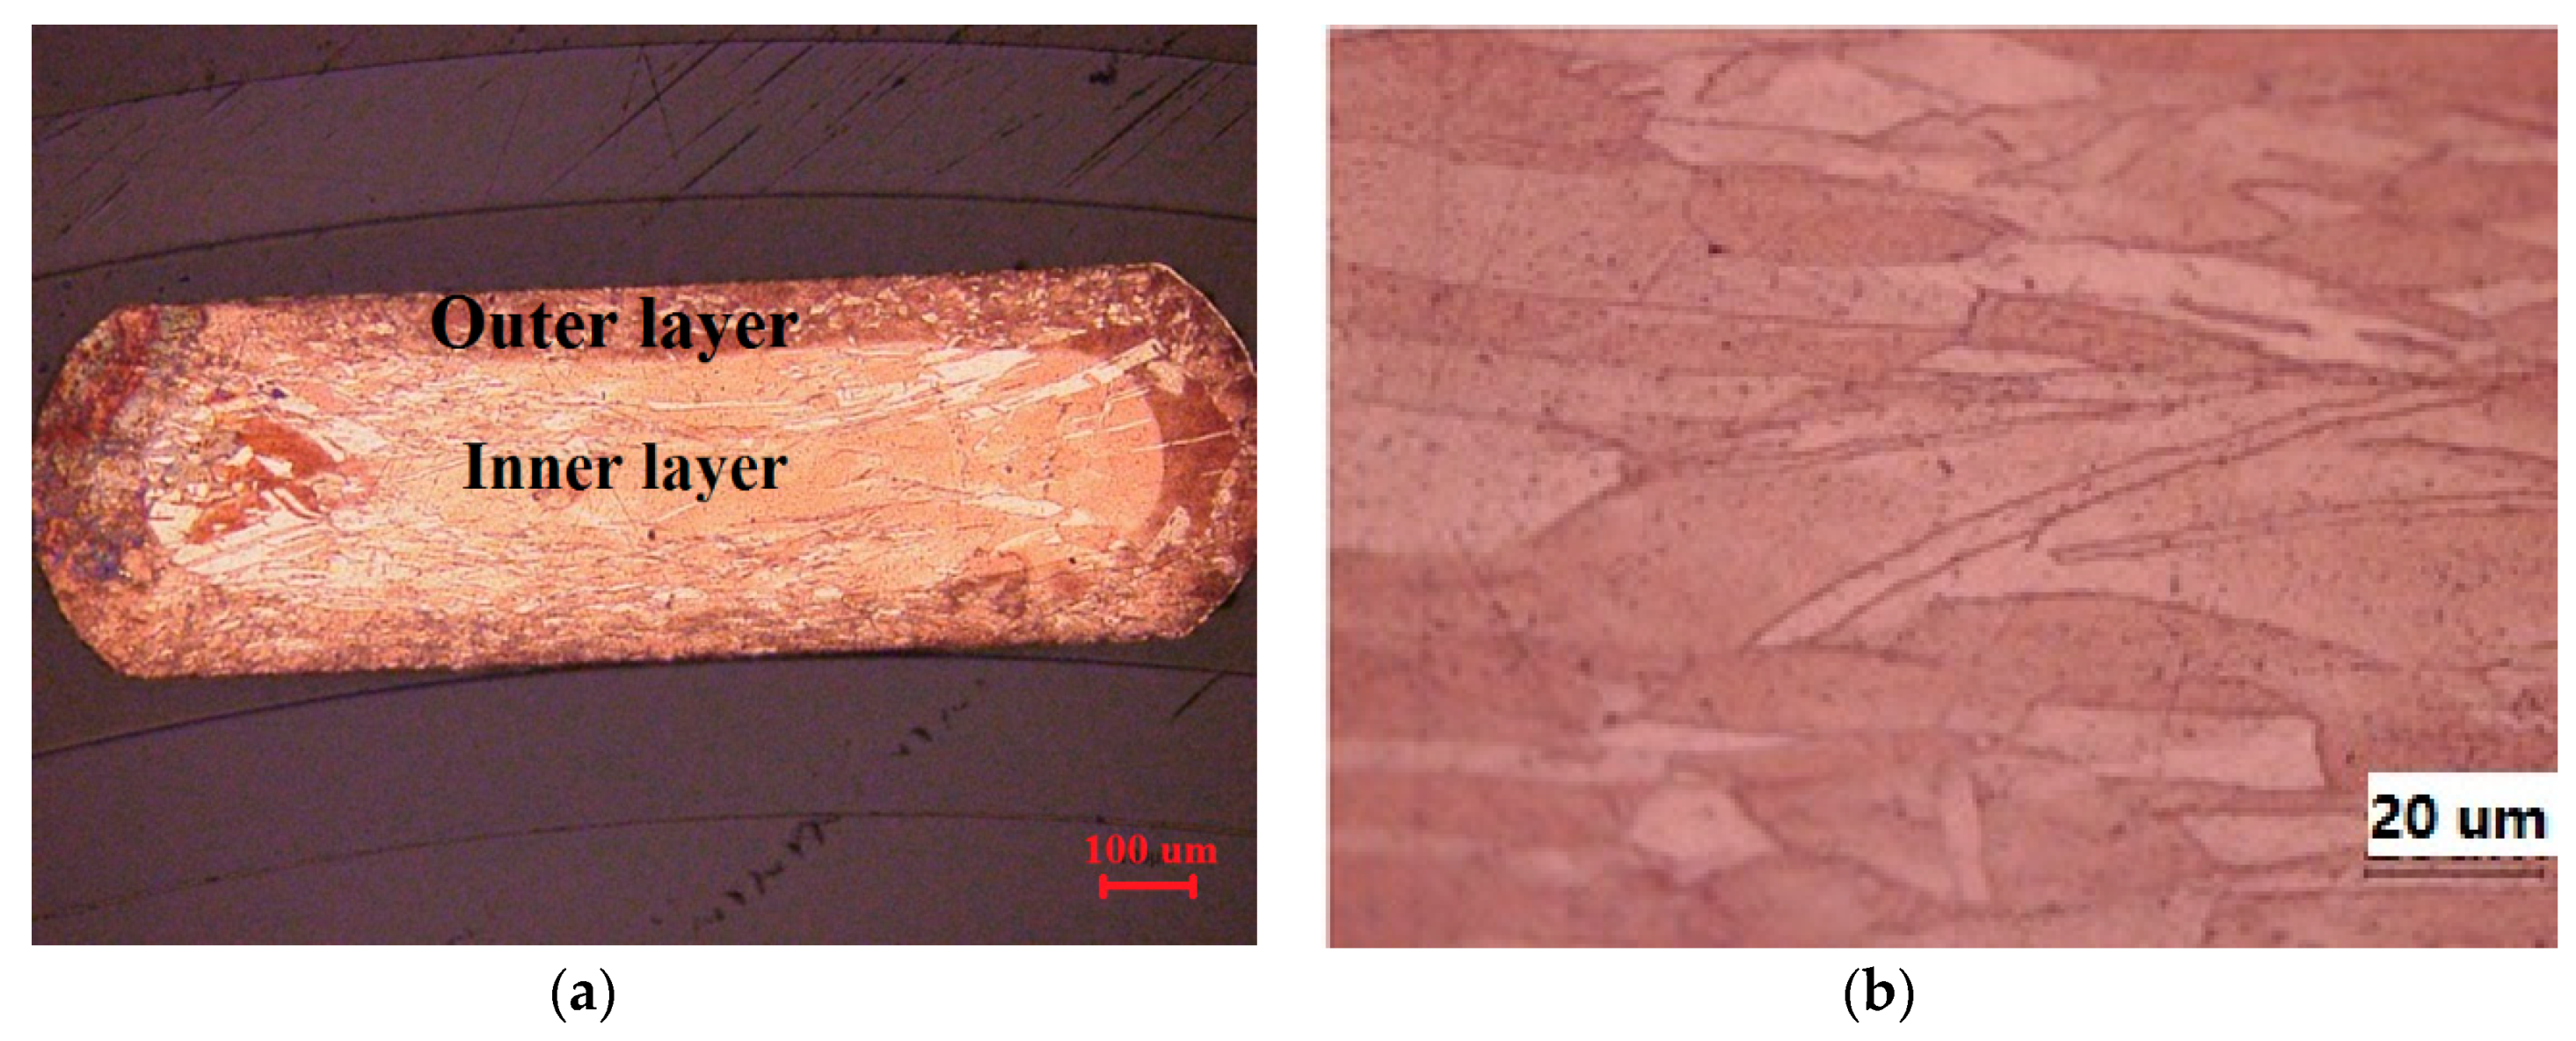
Figure 8 and Figure 9 illustrate the microstructure evolution before and after micro-flat-wire rolling. The initial diameter of the rolled wire is 1 mm. From these figures, it is noted that there is a remarkable interface between the microstructures of the inner layer and the outer layer. The ratio of the surface layer in the initial wire is 25%. The ratio of the surface layer is 33.33% and 19.23%, respectively, in the normal direction and transverse direction after a reduction of 45%, while the outer layer thickness of the transverse direction is higher than that of the normal direction. This indicates that the outer layer of the free side surface of rolled samples remains the same before and after rolling.
As the shape of the component changes, the ratio of surface area to volume changes. The grains on the surface are loosely held compared to the grains in the interior, because of a lesser number of grains surrounding the surface grains. Hence, as the ratio of surface area to volume increases, the flow strength of the material decreases. As the ratio of surface to volume increases, the adhesion of a small-sized component to a gripper is more than a normal-sized component. The size-dependent flow stress can be used to establish a better correlation between the experimental results and numerical ones.
According to surface layer theory [17], the flow stress of polycrystalline aggregate can be obtained through the composite model:
where is the polycrystalline aggregate flow stress. is the grain boundary volume fraction. and are the grain interior flow stress and boundary flow stress, respectively.
3.3. Rolling Parameter Analysis
3.3.1. Forming Resistance
In order to investigate if there exists a size effect during the micro-rolling process of the microstrip from the microwire, a series of rolling experiments have been conducted for different diameter wires in which the rolling process is on the micro-scale. The term of the forming resistance has been introduced in this research, which is the ratio of the rolling force to the contact area between the roll and the rolled wire. The forming resistance during the deformation process is compared between numerical simulation and experiments.
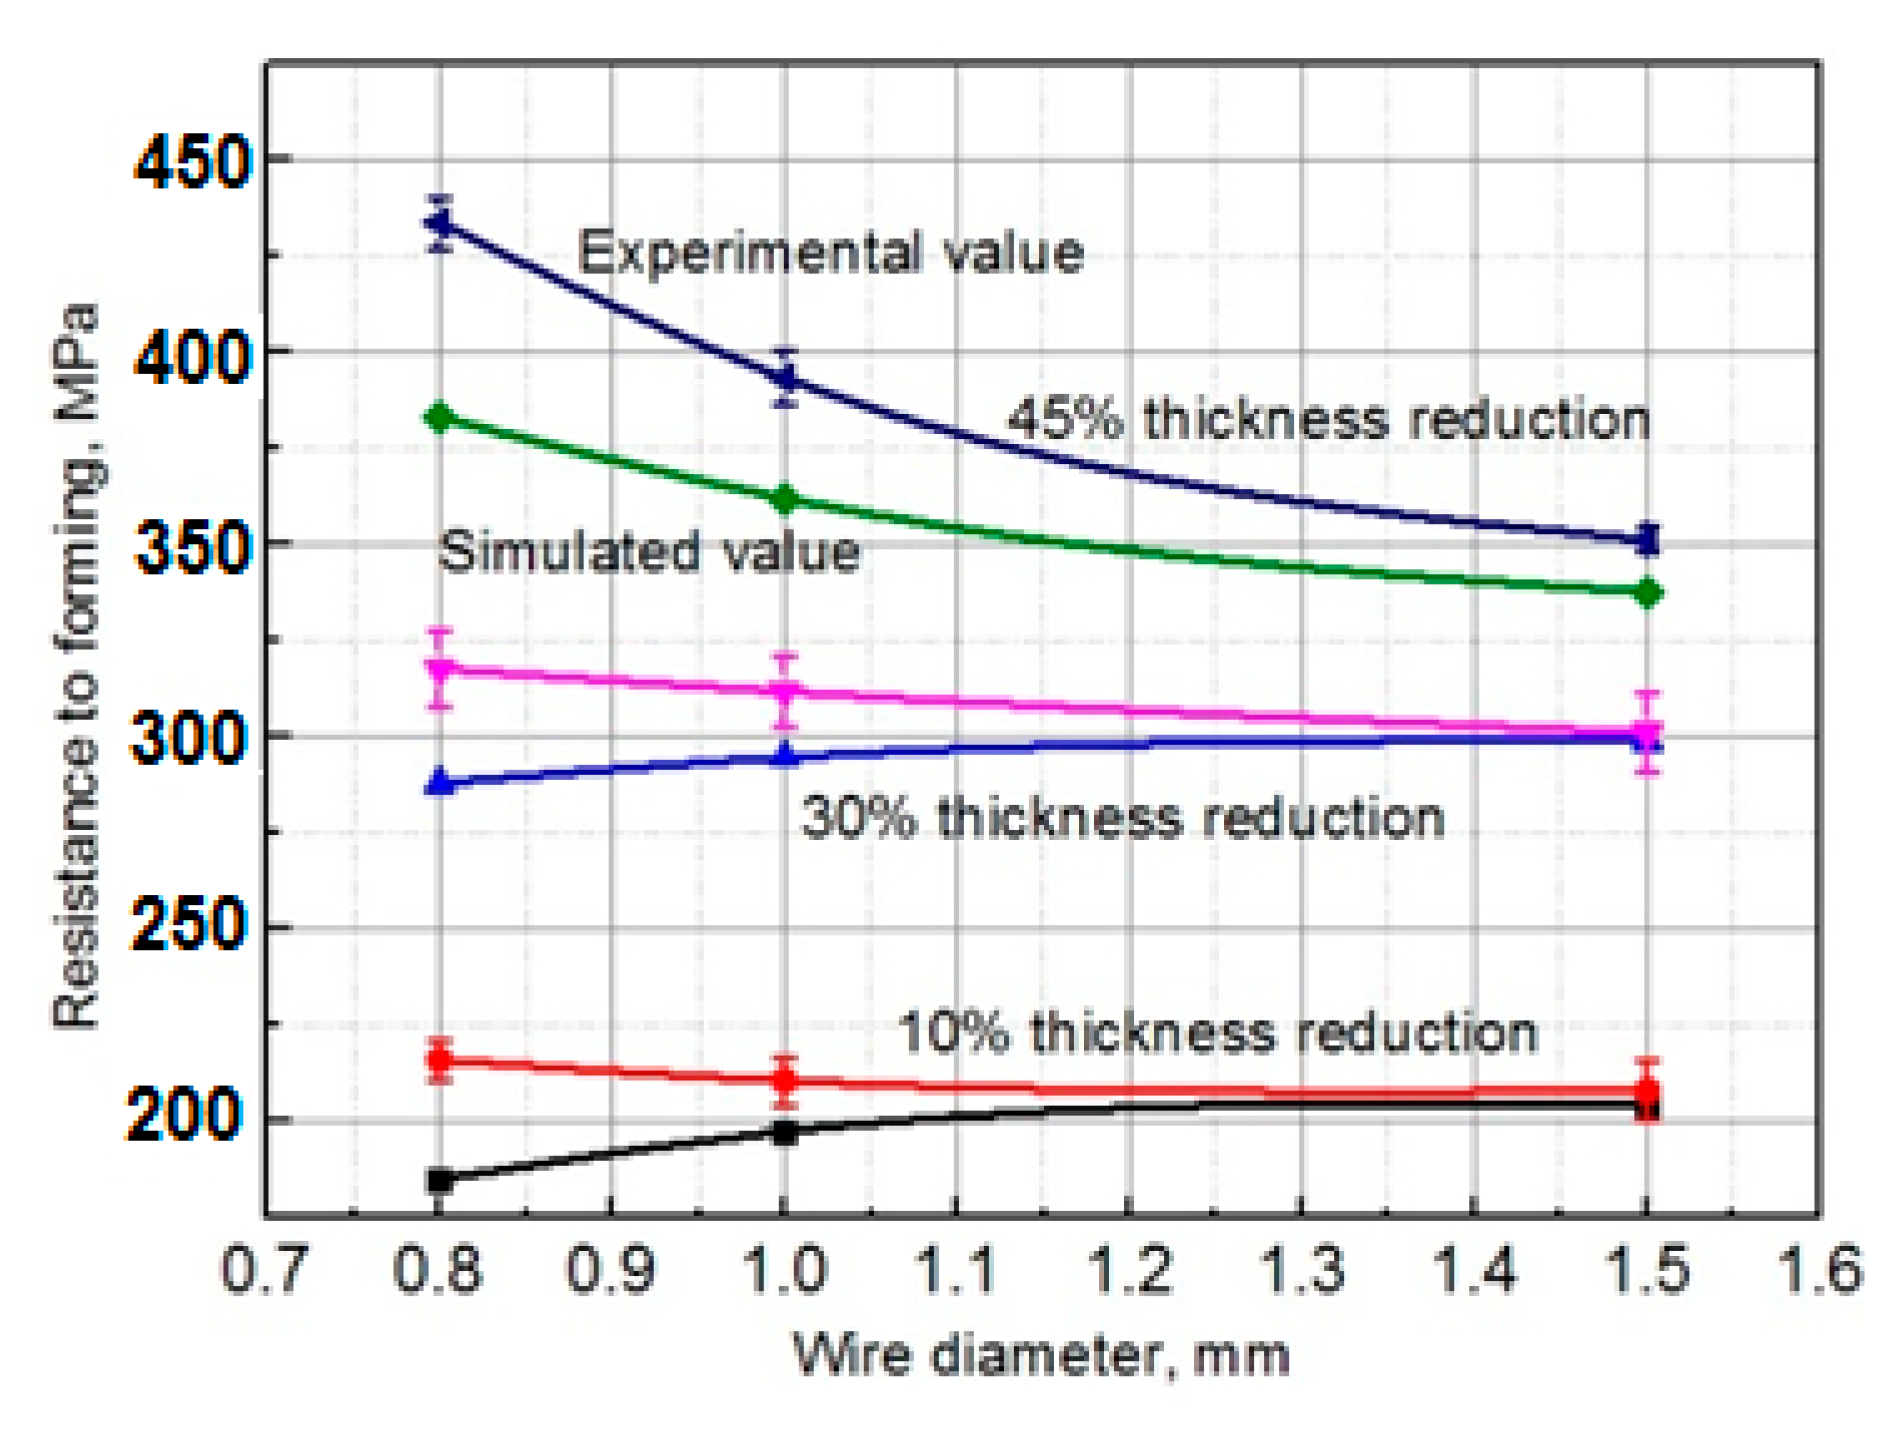
In this study, in order to investigate the size effect of micro-flat-wire rolling, the experimental results have been compared with the numerical simulation ones during the rolling process. Soft annealed pure copper rods of 15 mm length cut out from wire with diameters of 0.8, 1.0 and 1.5 mm are rolled with a height reduction of 10%, 30% and 45%, respectively. The forming resistance of pure copper under various reductions for different wire diameters is shown in Figure 10. It can be seen that for the 1.5 mm wire diameter, the experimental results are in very close agreement with the numerical simulation results with a maximum difference of 3.7% for the 1.5 mm wire, and these results are in the macroscopic domain. The difference between the experiment and numerical simulation results is increasing from 7.5% to 12.8% with a decrease of wire diameter from 1.0 mm to 0.8 mm. Within a reduction range of 10% and 30%, the experimental results are of a different trend from the simulation results. For a 45% reduction, the trend between experimental and simulation results is the same, but the absolute values of the forming resistance are different with a difference of 11.6% for the 0.8 mm wire. The differences between experimental and simulation results indicate that size effects influence the experimental results.
The different trends between the experimental and simulation results could be illustrated in the following different size effects. The first one is the sample size effect, where the deformation resistance increases with a decrease in sample size. This kind of size effect will be investigated based on surface layer grain share and grain size distribution in the following sections through micro-compression test and microstructure observation. The second one is the COF size effect, where the COF decreases with an increase of sample dimensions [18]. This behavior can be illustrated by the lubricant pockets model. As we know, the wire surface is not smooth and contains many pockets. The closed pockets that are not extended to rolled sample edges can hold some lubricant during deformation. The open pockets that are extended to edges cannot hold some lubricant when the rolling process is conducted. During rolling, with the increase of rolling pressure, the surface peak asperity will be crushed and get flattened, which will increase the friction force. In a lower height reduction within 10–30%, the first size effect can be applied to explain that the forming resistance increases with an increase of wire diameters. When the height reduction increases up to 45%, frictional size effect can be the main factor and will result in forming a resistance to decrease with an increase of wire diameters.
3.3.2. Lateral Spread and Barreling Radius
In wire rolling, there exists plastic deformation along the length direction and side direction in the first several passes. After several passes, the deformation on the flattened sample is similar to the strip rolling; the lateral spread will reduce and can be ignored.
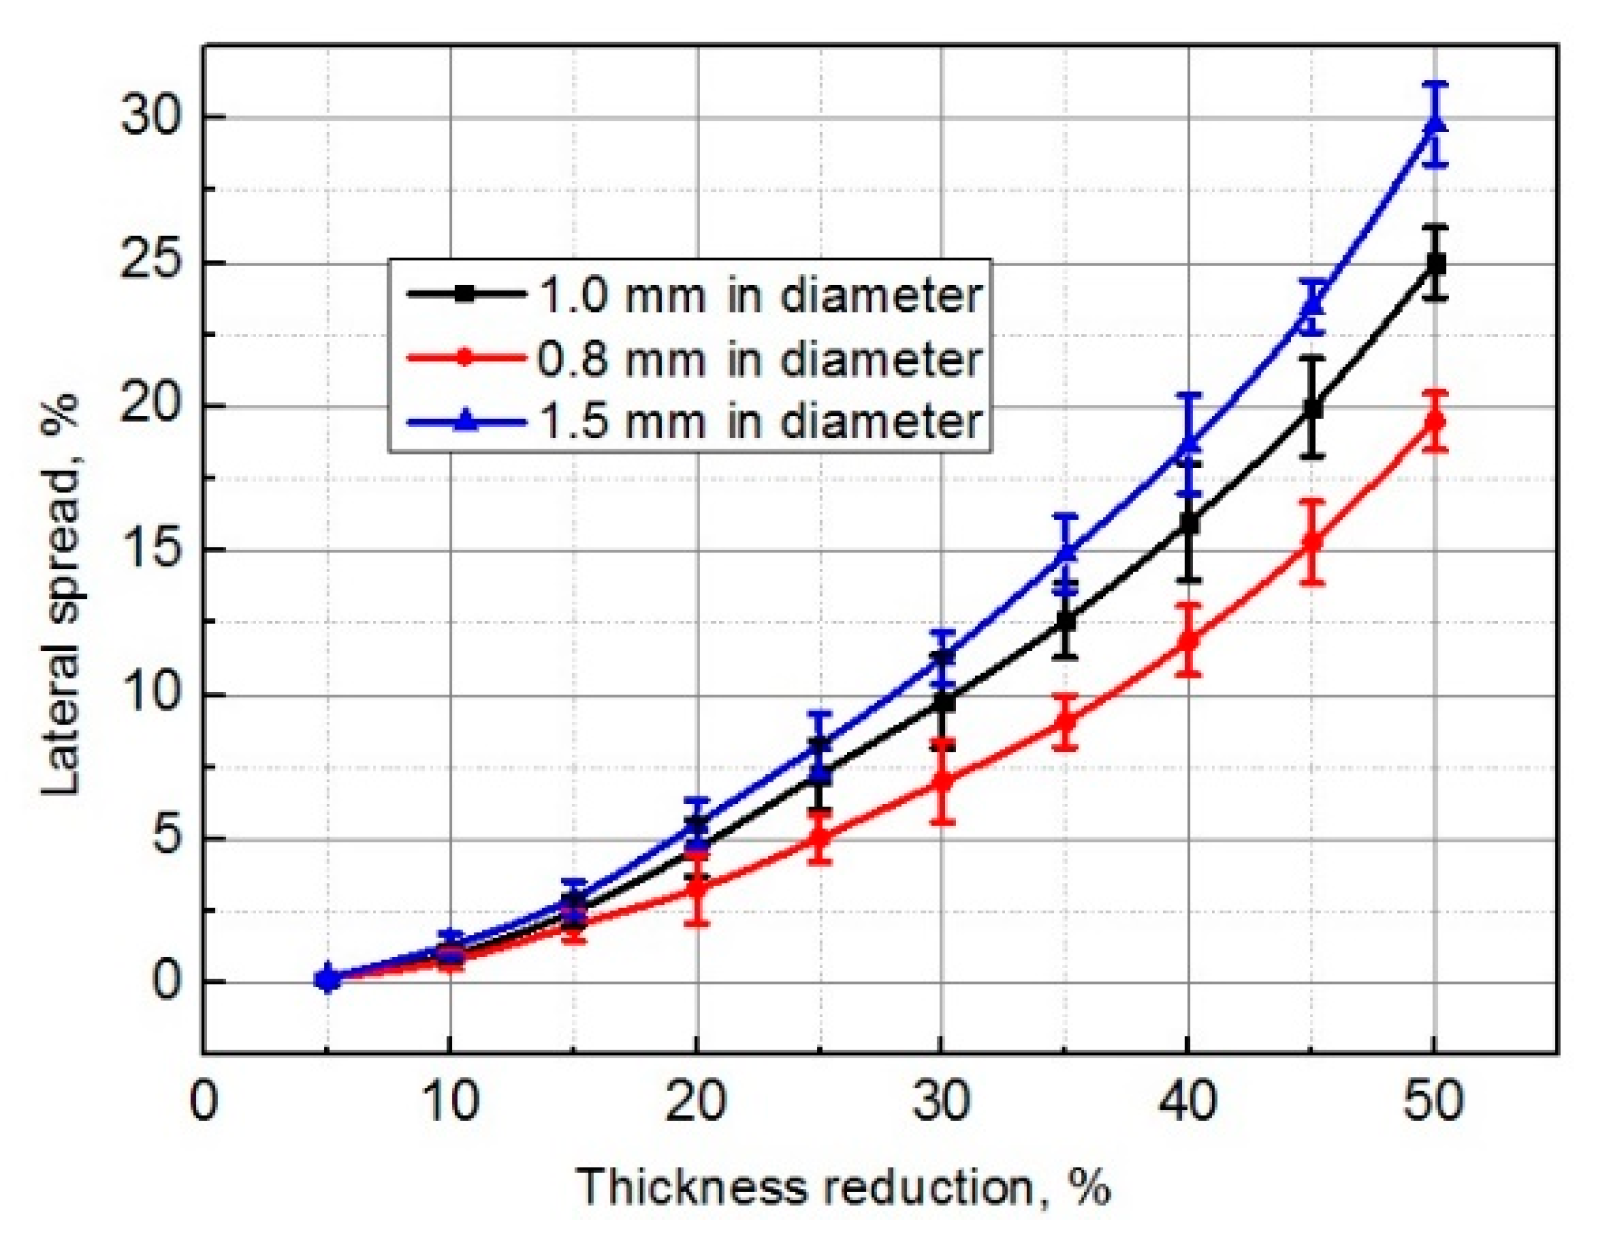
The effects of wire diameter and thickness reduction on the lateral spread are illustrated in Figure 11. The lateral spread increases with thickness reductions while decreases with wire diameters.
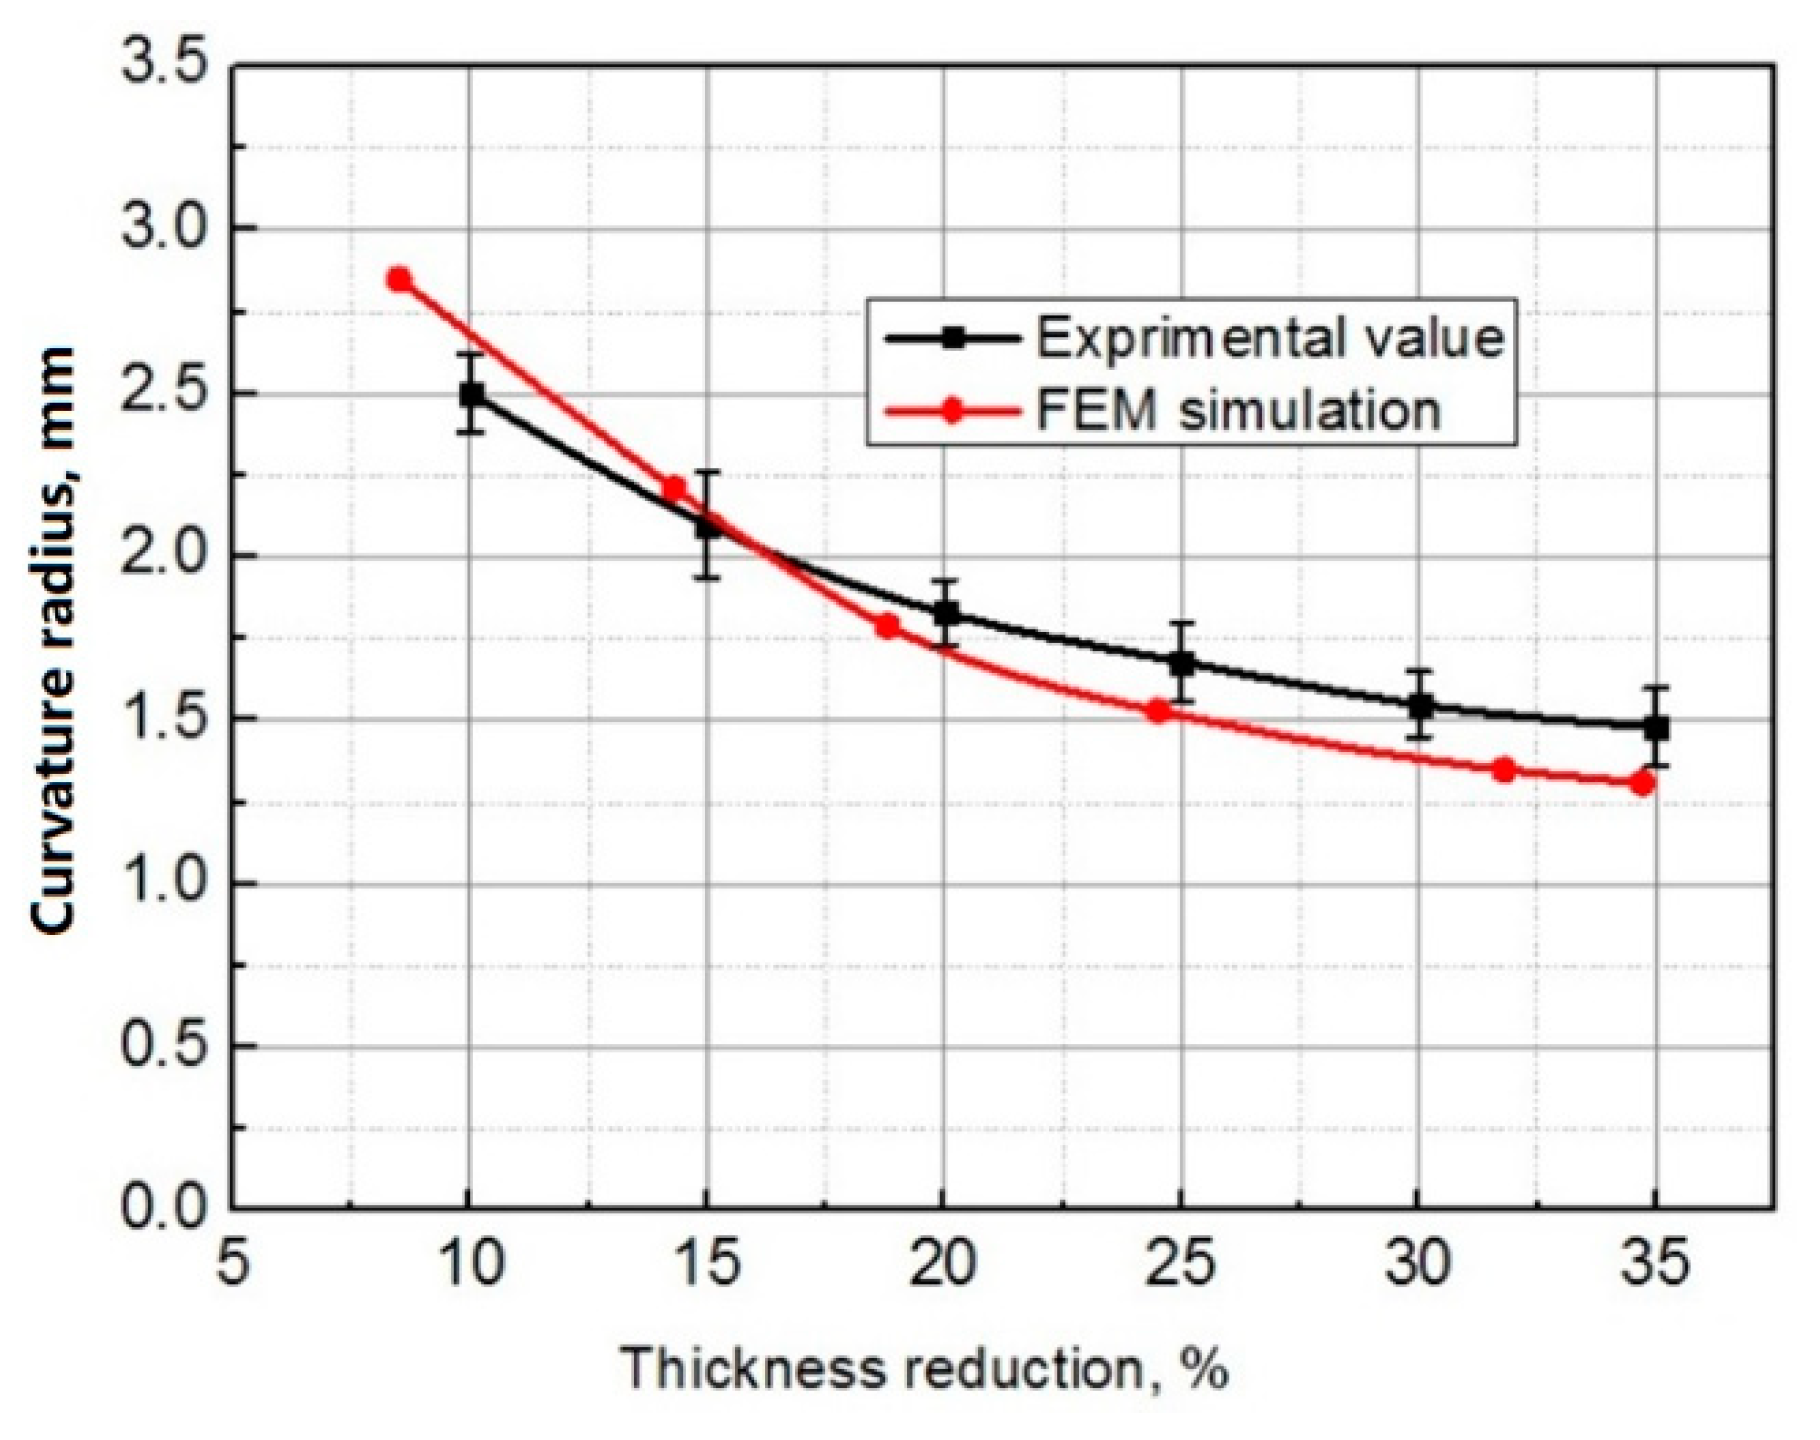
Figure 12 illustrates the barreling radius versus the thickness reduction in the experiment and FEM simulation. As seen from this figure, the simulation values are in close agreement with the experimental values. In a lower thickness reduction (below 15%), the radius in the FEM simulation is higher than that in the experimental one, while in a higher thickness reduction case, the experimental value is higher than that in the FEM simulation. This is because of the size effect under higher thickness reduction. In addition, this result validates the proposed model with a maximum difference of 7.5% with the experimental one and it can be used to simulate the micro-rolling process.
3.3.3. Contact Width
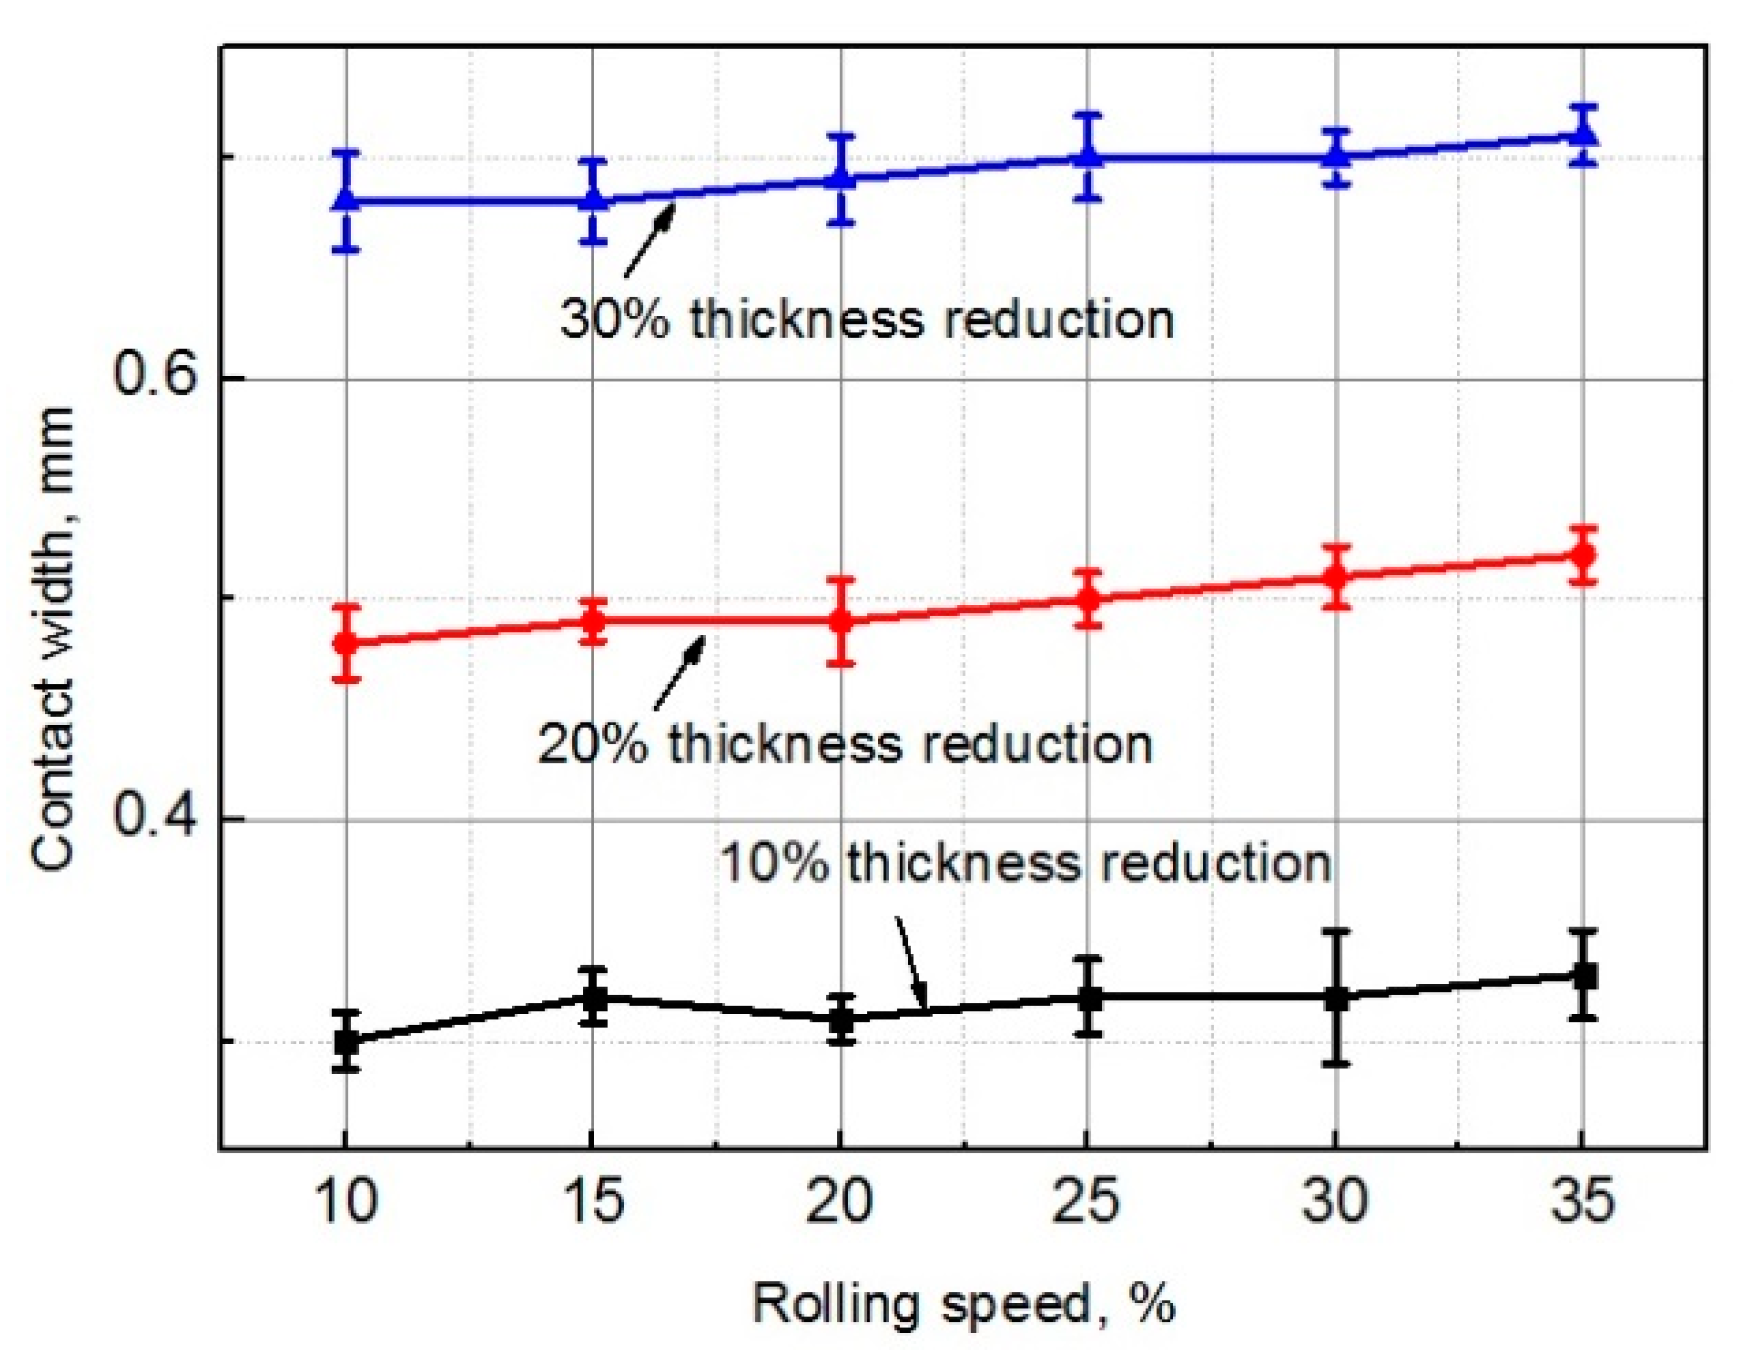
The contact width versus the reduction in thickness under different rolling speeds is shown in Figure 13. It can be seen that the contact width increases with thickness reduction, and the effect of rolling speed is not significant on the contact width. The increased rolling speed will increase the redundant work on the close sample surface, thus increasing the rolling force. Additionally, by increasing the rolling force, the coefficient of friction between the wire and rolls decreases, causing a reduction of friction work, therefore, the rolling force decreases. In addition, it can be seen that the rolling speed in flat wire rolling has less influence on rolling force, thus its effect on contact width is insignificant.
3.3.4. Surface Roughness Evolution
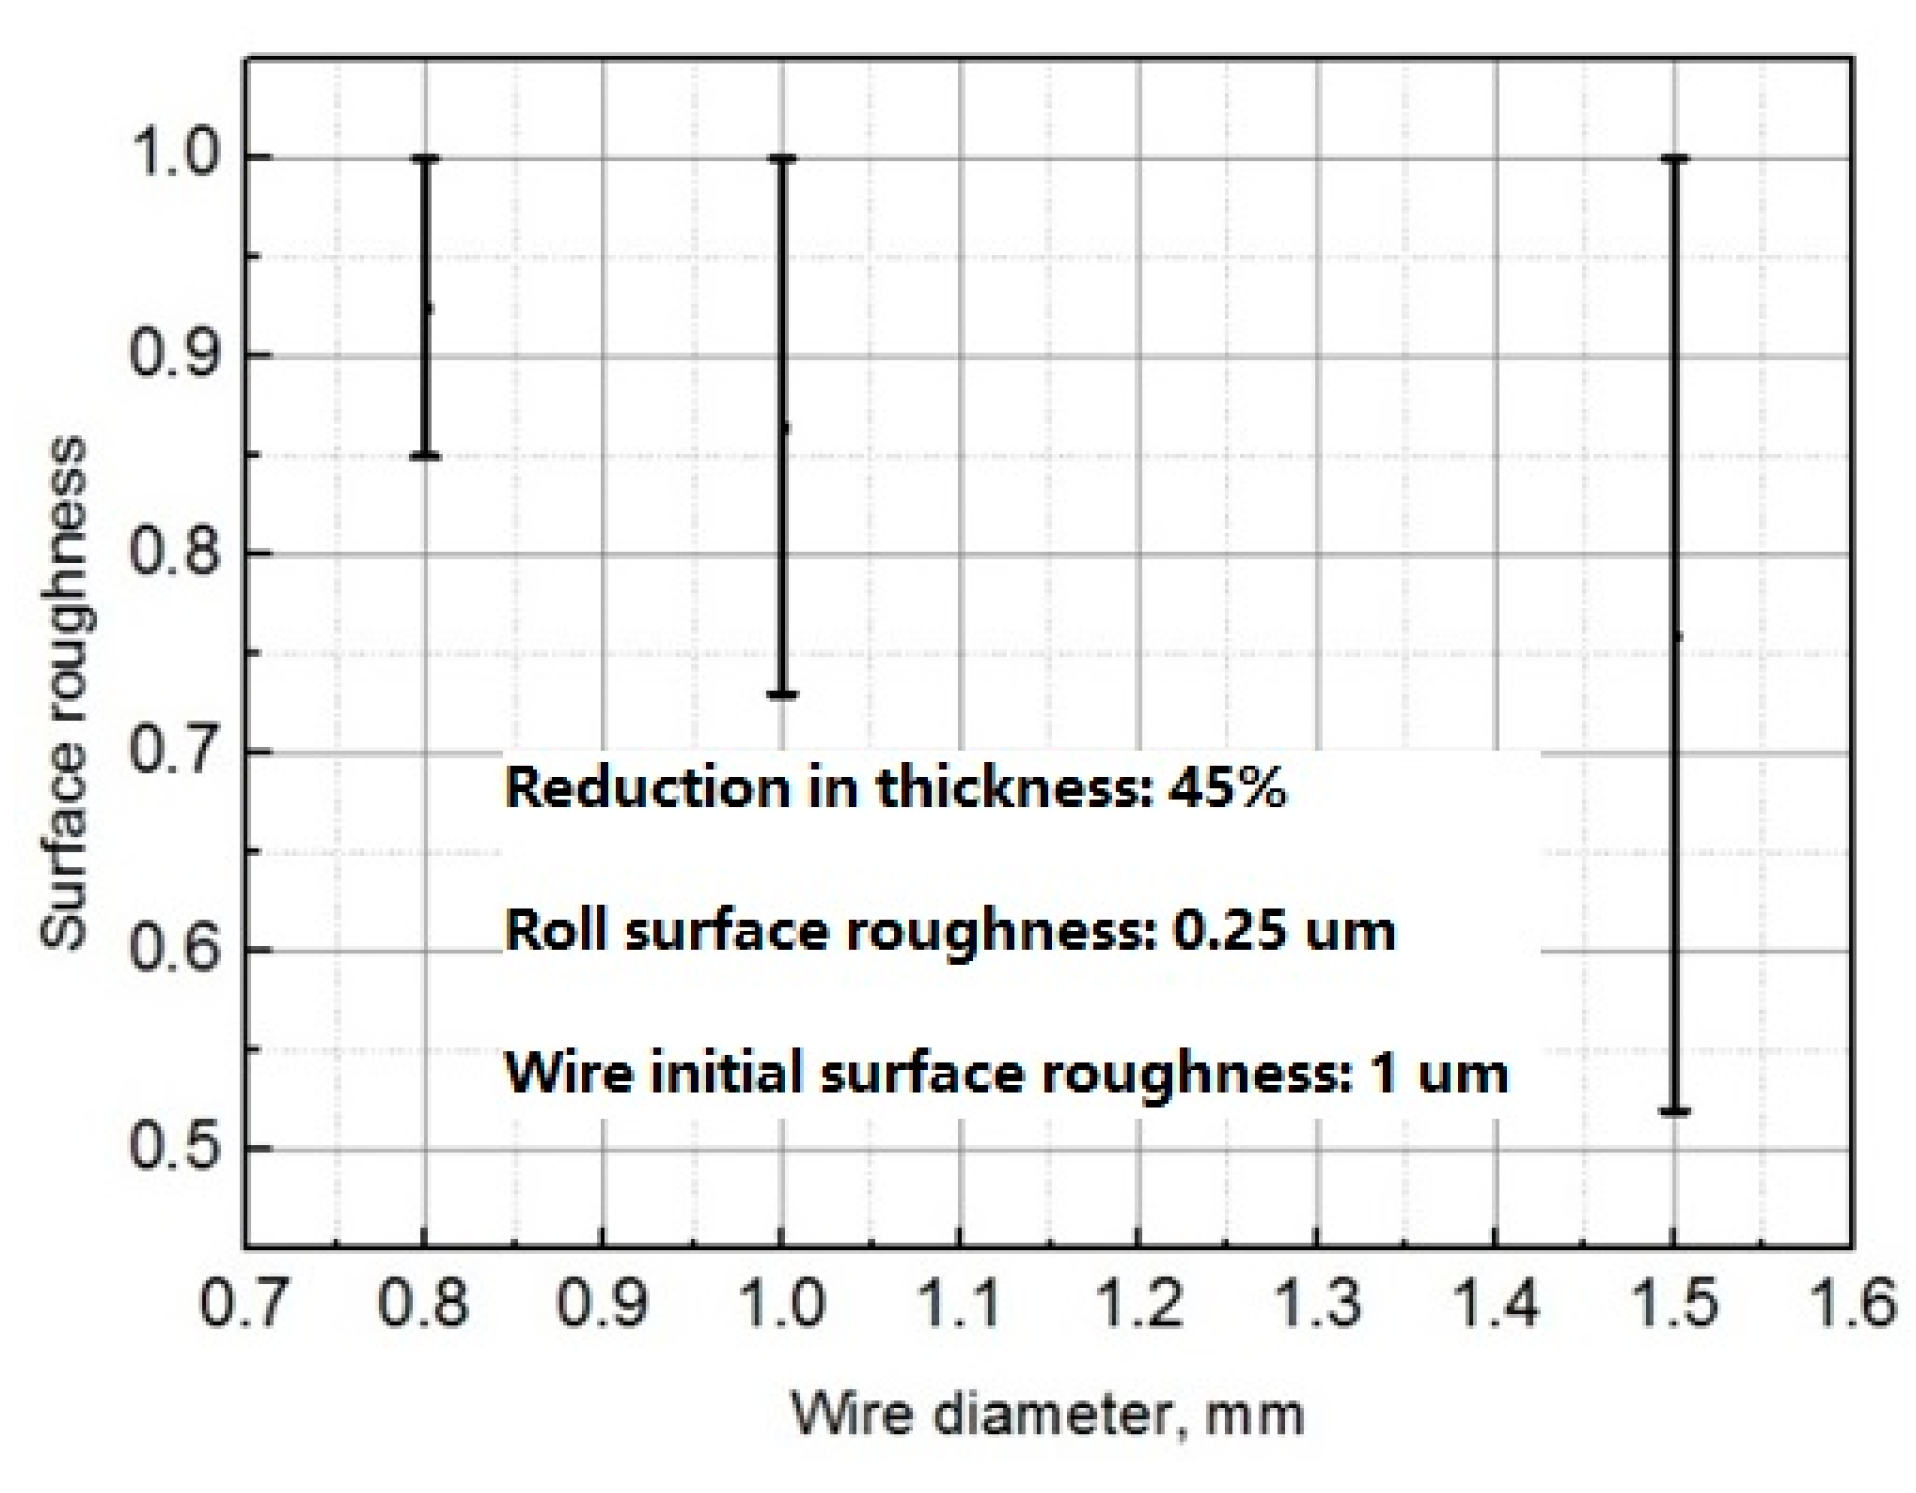
Figure 14 shows the surface roughness of the initial wire surface and rolled wire surface. It can be seen that the rolling trace is remarkable on the product surface. Normally, the surface roughness of the rolled wire is reduced via compression by the roll because of the smoother surface of the roll. Due to the boundary constraint by the rolls, the surface grains of the rolled sample in the deformation zone cannot deform freely. Therefore, the surface roughness of the contact surface of the rolled wire is reprinted by the roll. Figure 15 illustrates the surface roughness change with wire diameter under a reduction of 45% in the first pass. The initial surface roughness for the three wire diameters is the same, around 1 µm. The roll surface roughness is 0.25 µm. After rolling, the surface roughness is 0.85, 0.73 and 0.52 µm for 0.8, 1.0 and 1.5 mm wire diameters, respectively. The reprinting effect between the roll and wire is less significant for smaller diameter wire, and this is because there are more open pockets on the surface of small diameter wire. These open pockets play an important role in the friction behavior between the roll and wire, and thus influence the deformation of the wire.
4. Conclusions
In this study, the deformation characterization of microwire rolling has been investigated by numerical simulation and rolling experiments via the developed micro-rolling mill. The proposed numerical model has been validated by experimental values in terms of forming resistance and curvature radius with a maximum difference of 3.7% and 7.5%, respectively. The size effect in forming resistance for different wire diameters has been investigated by the comprising rolling experimental results with numerical results. The strain–stress curves have been identified for various grain sizes. The experiment shows the microstructure difference between the outer and inner layers which provide a basis for surface layer modeling with consideration of size effect. Under a higher reduction of small diameter wire, this effect has a significant influence on the deformation behavior of wire flat rolling. The surface roughness evolution from 1 µm to 0.52–0.85 µm before and after rolling for 1.5 mm and 0.8 mm wire, respectively, has been obtained. The findings will provide a theatrical and mechanical basis for the microwire rolling process.
Author Contributions
Conceptualization, H.X., K.-i.M and Z.J.; methodology, H.X. and Z.J.; software, H.X.; validation, H.X., K.-i.M. and Z.J.; formal analysis, H.X. and K.-i.M.; investigation, H.X., K.-i.M. and Z.J.; resources, H.X.; data curation, H.X. and Z.J.; writing—original draft preparation, H.X.; writing—review and editing, H.X. and Z.J.; visualization, H.X.; supervision, Z.J.; project administration, Z.J.; funding acquisition, Z.J. All authors have read and agreed to the published version of the manuscript.
Funding
This research was funded by Australian Research Council (ARC) Discovery Projects, grant number DP190100408.
Conflicts of Interest
The authors declare no conflicts of interest.
References
- Kazeminezhad, M.; Taheri, A.K. A theoretical and experimental investigation on wire flat rolling process using deformation pattern. Mater. Design. 2005, 26, 99–103. [Google Scholar] [CrossRef]
- Utsunomiya, H.; Hartley, P. Pilinger. J. Manuf. Sci. Eng. 2001, 123, 397–404. [Google Scholar] [CrossRef]
- Vollertsen, F.; Biermann, D.; Hansen, H.N.; Jawahir, I.S.; Kuzman, K. Size effects in manufacturing of metallic components. CIRP Ann. Manuf. Technol. 2009, 58, 566–587. [Google Scholar] [CrossRef]
- Xie, H.B.; Manabe, K.; Furushima, T.; Tada, K.; Jiang, Z.Y. Deformation characterization of micro rolling for stainless steel foil. Procedia Eng. 2014, 81, 179–184. [Google Scholar] [CrossRef] [Green Version]
- Kazeminezhad, M.; Taheri, A.K. Calculation of the rolling pressure distribution and force in wire flat rollingprocess. J. Mater. Process. Technol. 2006, 171, 253–258. [Google Scholar] [CrossRef]
- Vallellano, C.; Cabanillas, P.A.; Garcia-Lomas, F.J. Analysis of deformations and stresses in flat rolling of wire. J. Mater. Process. Technol. 2008, 195, 63–71.14. [Google Scholar] [CrossRef]
- Kazeminezhad, M.; Taheri, A.K. An experimental investigation on the deformation behavior during wire flat rolling process. J. Mater. Process. Technol. 2005, 160, 313–320. [Google Scholar] [CrossRef]
- Kim, N.; Lee, S.M.; Shin, W.; Shivpuri, R. Simulation of square to oval single pass rolling using a computationally effective finite and slab element method. J. Eng. Ind. 1992, 114, 329–335. [Google Scholar] [CrossRef]
- Kobayashi, M. Influence of rolling conditions on spreadingin flat rolling of round wire. J. Jpn. Soc. Technol. Plast. 1978, 19, 630–637. (In Japanese) [Google Scholar]
- Francesco, L.; Antoniomaria, D.I. A parametric study on residual stresses and loads in drawing process with idle rolls. Mater. Des. 2011, 32, 4832–4838. [Google Scholar]
- Bjorn, C. The contact pressure distribution in flat rolling of wire. J. Mater. Process. Technol. 1998, 73, 1–6. [Google Scholar]
- Massé, T.; Chastel, Y.; Montmitonnet, P.; Bobadilla, C.; Persem, N.; Foissey, S. Impact of mechanical anisotropy on the geometry of flat-rolled fully pearlitic steel wires. J. Mater. Process. Technol. 2011, 211, 103–112. [Google Scholar] [CrossRef]
- Helmi, A.; Alexander, J.M. Geometric factors affecting spread in hot flat rolling of steel. J. Iron Steel Inst. 1968, 206, 1110–1117. [Google Scholar]
- Saito, Y.; Takahashi, Y.; Kato, K. Calculation of spread, elongation, effective roll radius, roll force and torque when rolling in the square-diamond, square-oval, and round-oval passes. J. Iron Steel Inst. Jpn. 1983, 2, 1070–1077. [Google Scholar]
- Chitkara, N.R.; Johnson, W. Some experimental results concerning spread in the rolling of lead. ASME J. Basic Eng. 1966, 489–499. [Google Scholar] [CrossRef]
- van Putten, K.; Hirt, G. Size effects on miniaturised rolling processes. Ironmak. Steelmak. 2010, 37, 283–289. [Google Scholar] [CrossRef]
- Lu, H.N.; Wei, D.B.; Jiang, Z.Y.; Liu, X.H.; Manabe, K. Modelling of size effects in microforming process with consideration of grained heterogeneity. Comput. Mater. Sci. 2013, 77, 44–52. [Google Scholar] [CrossRef] [Green Version]
- Xie, H.B.; Manabe, K.; Furushima, T.; Tada, K.; Jiang, Z.Y. An experimental and numerical investigation on micro rolling for ultra-thin strip. Int. J. Mater. Form. 2016, 9, 405–412. [Google Scholar] [CrossRef] [Green Version]
- Hum, K.M.; Zhang, W.M.; Zhong, Z.Y.; Peng, Z.K.; Meng, G. Effect of surface layer thickness on buckling and vibration of nonlocal nanowires. Phys. Lett. A 2014, 378, 650–654. [Google Scholar]
- Zhu, T.T.; Bushby, A.J.; Dunstan, D.J. Materials Mechanical size effects: A review. Mater. Technol. 2008, 23, 196–209. [Google Scholar] [CrossRef]
- Liu, J.G.; Fu, M.W.; Chan, W.L. A constitutive model for modeling of the deformation behaviour in microforming with a consideration of grain boundary strengthening. Comput. Mater. Sci. 2012, 55, 85–94. [Google Scholar] [CrossRef]
- Corrado, M.; Paggi, M.; Carpinteri, A. A multi-scale numerical method for the study of size-scale effects in ductile fracture. Metals 2014, 4, 428–444. [Google Scholar] [CrossRef] [Green Version]
- Wang, C.J.; Wang, S.; Wang, S.T.; Chen, G.; Zhang, P. Investigation on springback behavior of Cu/Ni clad foils during flexible die micro V-bending process. Metals 2019, 9, 892. [Google Scholar] [CrossRef] [Green Version]
- Lu, H. A Study on the Micro Cross Wedge Rolling of Metals. Ph.D. Thesis, School of Mechanical, Materials and Mechatronic Engineering, University of Wollongong, Wollongong, Australia, 2013. [Google Scholar]
Figure 1.
Micro-flat-rolling mill system (two-high).

Figure 2.
Schematic of the deformed wire (from above).

Figure 3.
Simulation of wire flat rolling process. (a) Roll meshing in micro-flat-rolling of wire; (b) cross-section before rolling; (c) cross-section after rolling.
Figure 3.
Simulation of wire flat rolling process. (a) Roll meshing in micro-flat-rolling of wire; (b) cross-section before rolling; (c) cross-section after rolling.


Figure 4.
Schematic illustration of cylindrical specimens.

Figure 5.
Strain–stress curves.

Figure 6.
Microstructure distribution after annealing process (a) 32 µm and (b) 240 µm.

Figure 7.
Schematic illustration of the effect of wire height reduction on shear bands. (a) Initial wire (b) rolled wire after Pass 1 (c) rolled wire after Pass 2.
Figure 7.
Schematic illustration of the effect of wire height reduction on shear bands. (a) Initial wire (b) rolled wire after Pass 1 (c) rolled wire after Pass 2.

Figure 8.
Microstructure of copper wire before micro-rolling (initial diameter: 1 mm). (a) Whole initial wire; (b) inner layer.
Figure 8.
Microstructure of copper wire before micro-rolling (initial diameter: 1 mm). (a) Whole initial wire; (b) inner layer.

Figure 9.
Microstructure of rolled wire after micro-rolling. (a) Whole rolled wire; (b) inner layer.
Figure 9.
Microstructure of rolled wire after micro-rolling. (a) Whole rolled wire; (b) inner layer.

Figure 10.
Forming resistance of pure copper wires under various reductions (10%, 30% and 45%) and wire diameters (0.8 mm, 1.0 mm and 1.5 mm).
Figure 10.
Forming resistance of pure copper wires under various reductions (10%, 30% and 45%) and wire diameters (0.8 mm, 1.0 mm and 1.5 mm).

Figure 11.
Lateral spread with wire diameter under various rolling thickness reductions.

Figure 12.
Barreling radius as obtained in the simulations and experiment (1 mm in diameter).

Figure 13.
Contact width with rolling reduction and rolling speed (1 mm in diameter).

Figure 14.
Surface roughness: initial wire surface (a), and rolled wire surface (b).

Figure 15.
The effect of wire diameter on surface roughness.


Table 1.
Chemical composition of copper wire (not more than, wt %) [24].
Table 1.
Chemical composition of copper wire (not more than, wt %) [24].
| Bi | Te | As | Fe | Ni |
| 0.001 | 0.002 | 0.002 | 0.005 | 0.002 |
| Sn | S | Zn | O | Cu |
| 0.002 | 0.002 | 0.005 | 0.06 | balance |
Table 2.
Annealing process of copper wire for different holding time under 700 °C.
| Annealing | 1 | 2 | 3 | 4 | 5 |
|---|---|---|---|---|---|
| Holding time, min | 10 | 20 | 30 | 90 | 120 |
| Grain size, µm | 32 | 42 | 82 | 160 | 240 |
© 2020 by the authors. Licensee MDPI, Basel, Switzerland. This article is an open access article distributed under the terms and conditions of the Creative Commons Attribution (CC BY) license (http://creativecommons.org/licenses/by/4.0/).
Share and Cite
MDPI and ACS Style
Xie, H.; Manabe, K.-i.; Jiang, Z. Study of Wire Deformation Characterization and Size Effects during the Micro-Flat-Rolling Process. Metals 2020, 10, 405. https://doi.org/10.3390/met10030405
AMA Style
Xie H, Manabe K-i, Jiang Z. Study of Wire Deformation Characterization and Size Effects during the Micro-Flat-Rolling Process. Metals. 2020; 10(3):405. https://doi.org/10.3390/met10030405
Chicago/Turabian StyleXie, Haibo, Ken-ichi Manabe, and Zhengyi Jiang. 2020. "Study of Wire Deformation Characterization and Size Effects during the Micro-Flat-Rolling Process" Metals 10, no. 3: 405. https://doi.org/10.3390/met10030405
Note that from the first issue of 2016, this journal uses article numbers instead of page numbers. See further details here.