
Relation between Handgrip Strength and Quality of Life in Patients with Arthritis in Korea: The Korea National Health and Nutrition Examination Survey, 2015–2018


Abstract
:1. Introduction
2. Materials and Methods
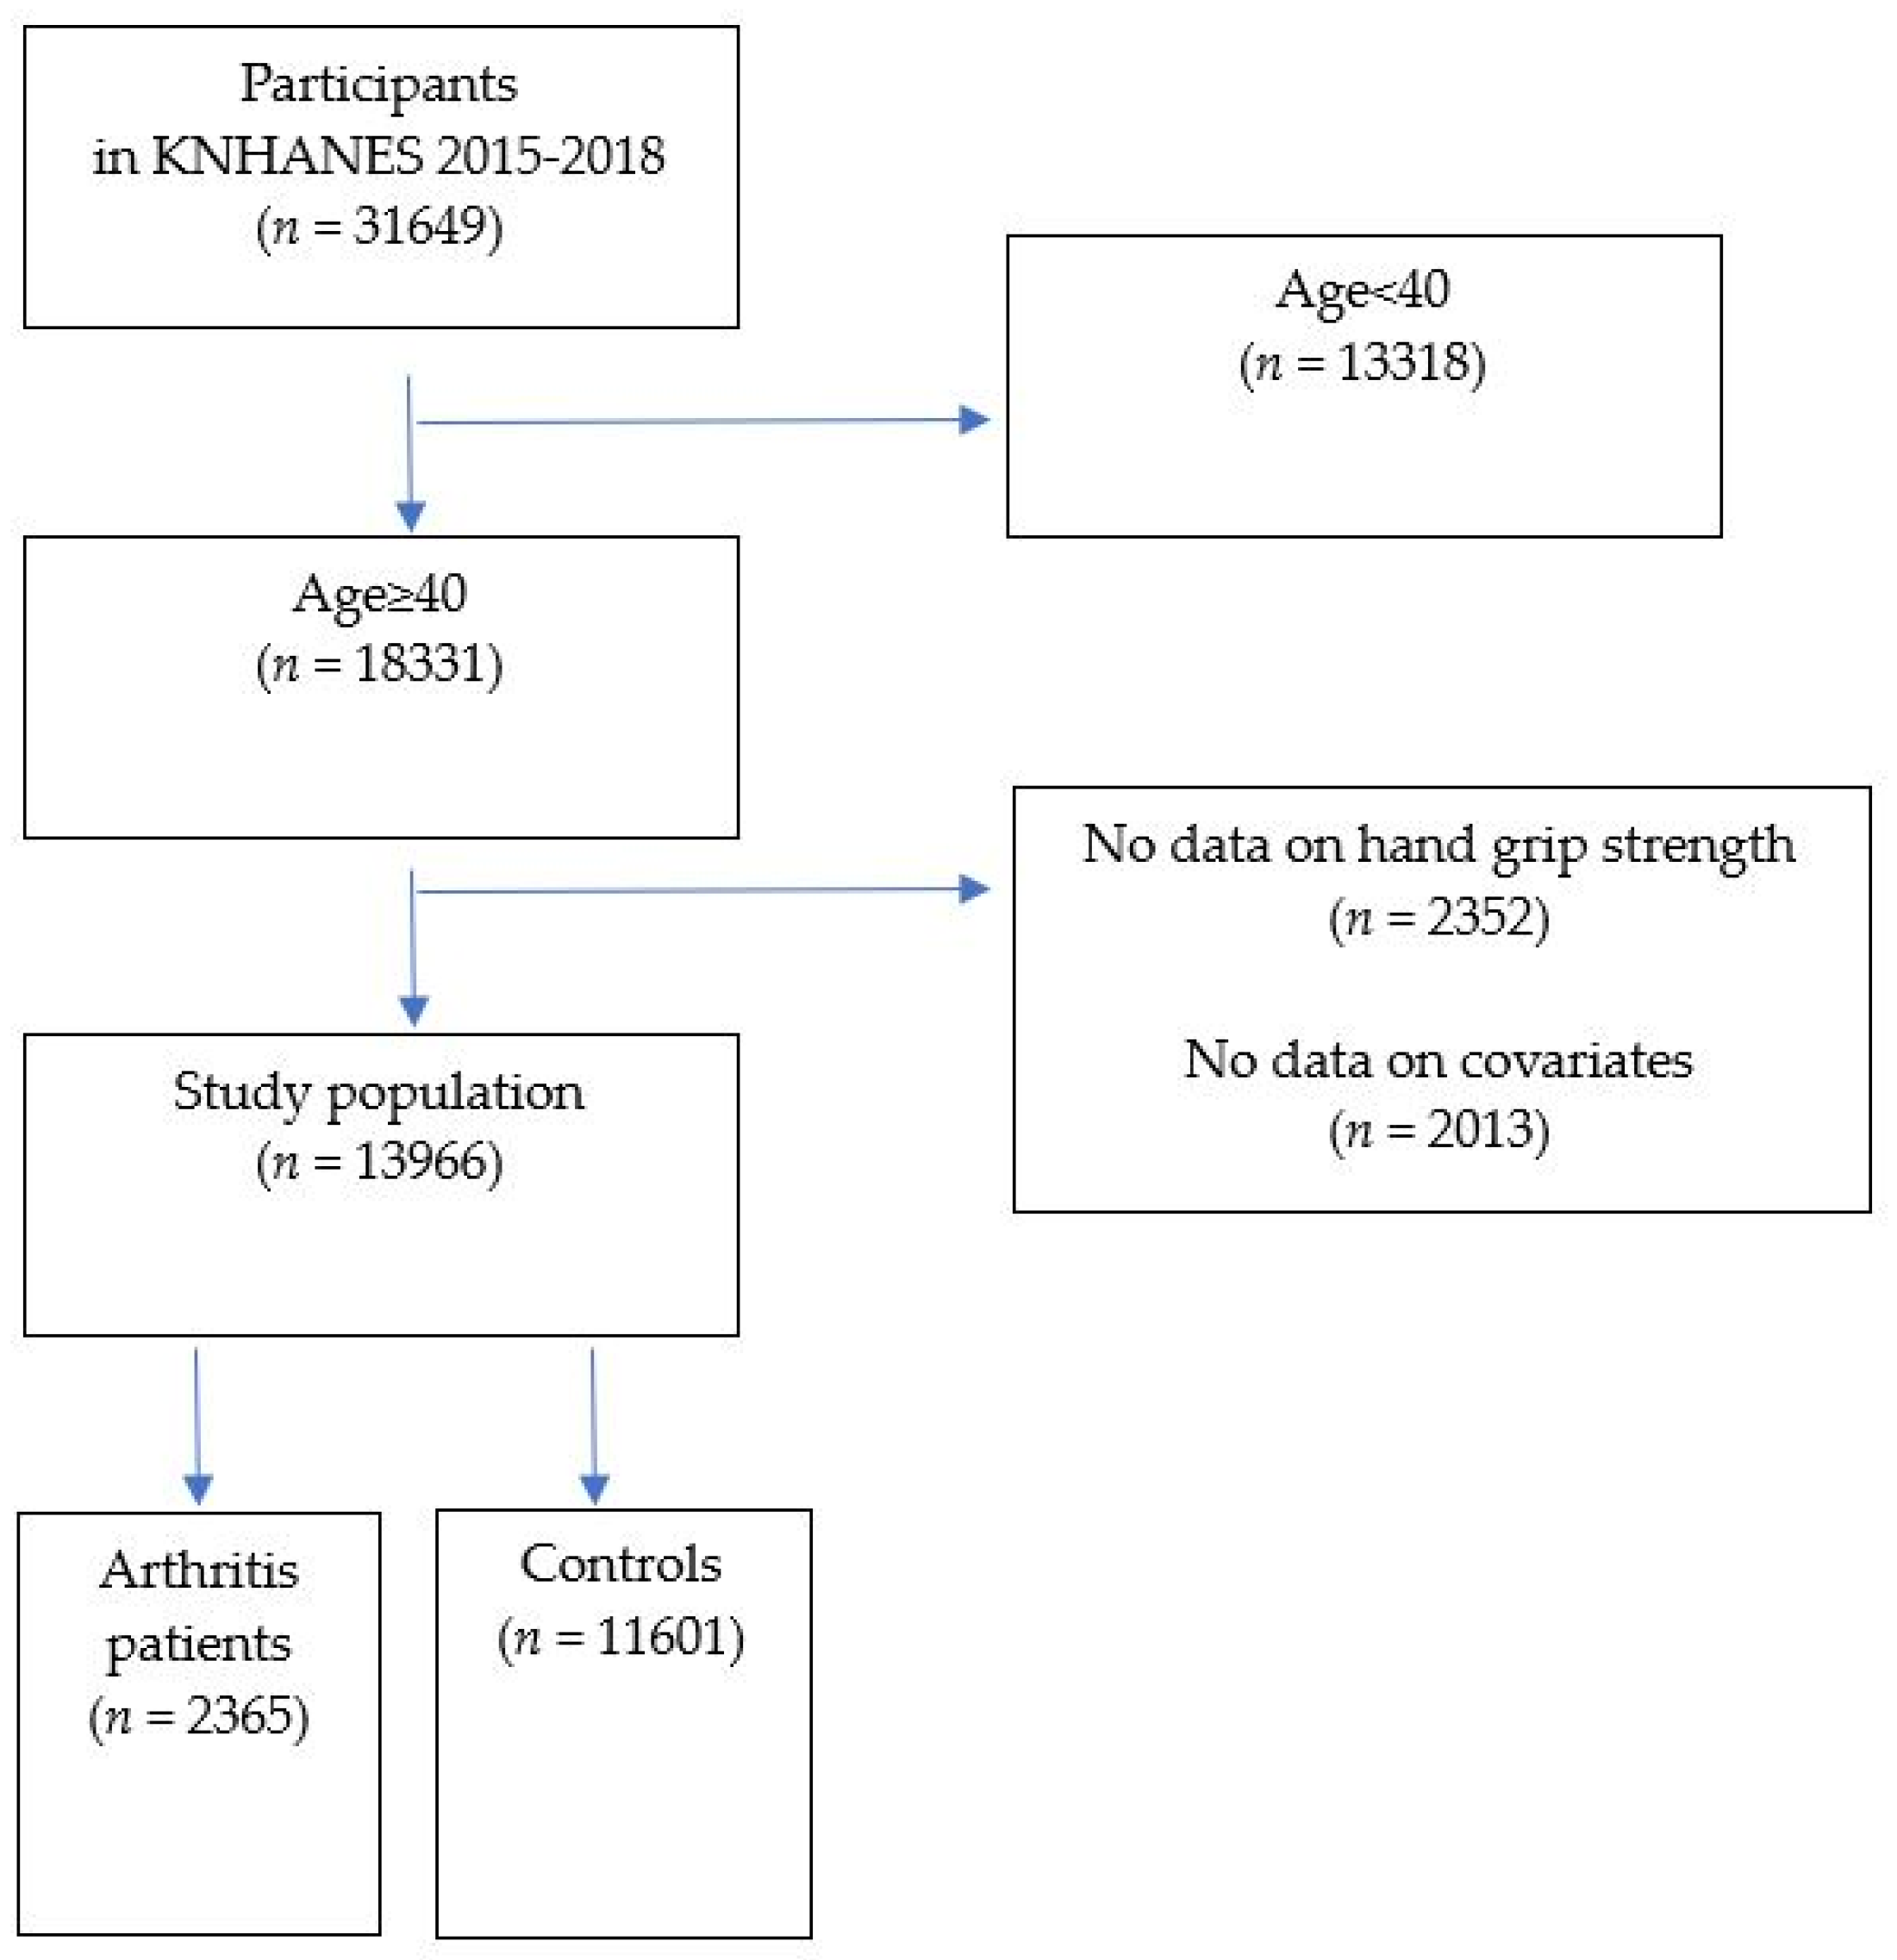
2.1. Study Population
2.2. Demographic and Clinical Characteristics
2.3. Measurement of HGS
2.4. Evaluation of HRQOL
2.5. Statistical Analysis
3. Results
4. Discussion
5. Conclusions
Author Contributions
Funding
Institutional Review Board Statement
Informed Consent Statement
Data Availability Statement
Conflicts of Interest
References
- James, S.L.; Abate, D.; Abate, K.H.; Abay, S.M.; Abbafati, C.; Abbasi, N.; Abbastabar, H.; Abd-Allah, F.; Abdela, J.; Abdelalim, A.; et al. Global, regional, and national incidence, prevalence, and years lived with disability for 354 diseases and injuries for 195 countries and territories, 1990–2017: A systematic analysis for the Global Burden of Disease Study 2017. Lancet 2018, 392, 1789–1858. [Google Scholar] [CrossRef] [Green Version]
- The Burden of Musculoskeletal Conditions at the Start of the New Millennium; World Health Organization Technical Report Series; World Health Organization: Geneva, Switzerland, 2003; Volume 919, pp. i–x, 1–218, back cover.
- Cross, M.; Smith, E.; Hoy, D.; Nolte, S.; Ackerman, I.; Fransen, M.; Bridgett, L.; Williams, S.; Guillemin, F.; Hill, C.L.; et al. The global burden of hip and knee osteoarthritis: Estimates from the global burden of disease 2010 study. Ann. Rheum. Dis. 2014, 73, 1323–1330. [Google Scholar] [CrossRef] [PubMed]
- Mobasheri, A.; Batt, M. An update on the pathophysiology of osteoarthritis. Ann. Phys. Rehabil. Med. 2016, 59, 333–339. [Google Scholar] [CrossRef] [PubMed]
- McInnes, I.B.; Schett, G. The pathogenesis of rheumatoid arthritis. N. Engl. J. Med. 2011, 365, 2205–2219. [Google Scholar] [CrossRef] [Green Version]
- van Dijk, G.M.; Veenhof, C.; Spreeuwenberg, P.; Coene, N.; Burger, B.J.; van Schaardenburg, D.; van den Ende, C.H.; Lankhorst, G.J.; Dekker, J. Prognosis of limitations in activities in osteoarthritis of the hip or knee: A 3-year cohort study. Arch. Phys. Med. Rehabil. 2010, 91, 58–66. [Google Scholar] [CrossRef] [Green Version]
- Geryk, L.L.; Carpenter, D.M.; Blalock, S.J.; DeVellis, R.F.; Jordan, J.M. The impact of co-morbidity on health-related quality of life in rheumatoid arthritis and osteoarthritis patients. Clin. Exp. Rheumatol. 2015, 33, 366–374. [Google Scholar] [PubMed]
- Slatkowsky-Christensen, B.; Mowinckel, P.; Loge, J.H.; Kvien, T.K. Health-related quality of life in women with symptomatic hand osteoarthritis: A comparison with rheumatoid arthritis patients, healthy controls, and normative data. Arthritis Rheum. 2007, 57, 1404–1409. [Google Scholar] [CrossRef]
- Lee, Y.; Lee, S.H.; Lim, S.M.; Baek, S.H.; Ha, I.H. Mental health and quality of life of patients with osteoarthritis pain: The sixth Korea National Health and Nutrition Examination Survey (2013–2015). PLoS ONE 2020, 15, e0242077. [Google Scholar] [CrossRef]
- Crilly, M.A.; Johnston, M.C.; Black, C. Relationship of EQ-5D quality of life with the presence of co-morbidity and extra-articular features in patients with rheumatoid arthritis. Qual. Life Res. 2014, 23, 1435–1443. [Google Scholar] [CrossRef]
- Leong, D.P.; Teo, K.K.; Rangarajan, S.; Lopez-Jaramillo, P.; Avezum, A., Jr.; Orlandini, A.; Seron, P.; Ahmed, S.H.; Rosengren, A.; Kelishadi, R.; et al. Prognostic value of grip strength: Findings from the Prospective Urban Rural Epidemiology (PURE) study. Lancet 2015, 386, 266–273. [Google Scholar] [CrossRef]
- Peterson, M.D.; Duchowny, K.; Meng, Q.; Wang, Y.; Chen, X.; Zhao, Y. Low Normalized Grip Strength is a Biomarker for Cardiometabolic Disease and Physical Disabilities Among U.S. and Chinese Adults. J. Gerontol. A Biol. Sci. Med. Sci. 2017, 72, 1525–1531. [Google Scholar] [CrossRef] [PubMed] [Green Version]
- Chen, L.K.; Woo, J.; Assantachai, P.; Auyeung, T.W.; Chou, M.Y.; Iijima, K.; Jang, H.C.; Kang, L.; Kim, M.; Kim, S.; et al. Asian Working Group for Sarcopenia: 2019 Consensus Update on Sarcopenia Diagnosis and Treatment. J. Am. Med. Dir. Assoc. 2020, 21, 300–307.e2. [Google Scholar] [CrossRef] [PubMed]
- Marques, L.P.; Confortin, S.C.; Ono, L.M.; Barbosa, A.R.; d’Orsi, E. Quality of life associated with handgrip strength and sarcopenia: EpiFloripa Aging Study. Arch. Gerontol. Geriatr. 2019, 81, 234–239. [Google Scholar] [CrossRef] [PubMed]
- Bohannon, R.W. Muscle strength: Clinical and prognostic value of hand-grip dynamometry. Curr. Opin. Clin. Nutr. Metab. Care 2015, 18, 465–470. [Google Scholar] [CrossRef]
- McNicholl, T.; Curtis, L.; Dubin, J.A.; Mourtzakis, M.; Nasser, R.; Laporte, M.; Keller, H. Handgrip strength predicts length of stay and quality of life in and out of hospital. Clin. Nutr. 2020, 39, 2501–2509. [Google Scholar] [CrossRef]
- Kweon, S.; Kim, Y.; Jang, M.J.; Kim, Y.; Kim, K.; Choi, S.; Chun, C.; Khang, Y.H.; Oh, K. Data resource profile: The Korea National Health and Nutrition Examination Survey (KNHANES). Int. J. Epidemiol. 2014, 43, 69–77. [Google Scholar] [CrossRef] [Green Version]
- Kim, Y. The Korea National Health and Nutrition Examination Survey (KNHANES): Current status and challenges. Epidemiol. Health 2014, 36, e2014002. [Google Scholar] [CrossRef] [Green Version]
- Roberts, H.C.; Denison, H.J.; Martin, H.J.; Patel, H.P.; Syddall, H.; Cooper, C.; Sayer, A.A. A review of the measurement of grip strength in clinical and epidemiological studies: Towards a standardised approach. Age Ageing 2011, 40, 423–429. [Google Scholar] [CrossRef] [Green Version]
- Balestroni, G.; Bertolotti, G. EuroQol-5D (EQ-5D): An instrument for measuring quality of life. Monaldi Arch. Chest Dis. 2012, 78, 155–159. [Google Scholar] [CrossRef]
- Kang, S.Y.; Lim, J.; Park, H.S. Relationship between low handgrip strength and quality of life in Korean men and women. Qual. Life Res. 2018, 27, 2571–2580. [Google Scholar] [CrossRef]
- Halaweh, H. Correlation between Health-Related Quality of Life and Hand Grip Strength among Older Adults. Exp. Aging Res. 2020, 46, 178–191. [Google Scholar] [CrossRef] [PubMed]
- Kwak, Y.; Kim, Y. Quality of life and subjective health status according to handgrip strength in the elderly: A cross-sectional study. Aging Ment. Health 2019, 23, 107–112. [Google Scholar] [CrossRef] [PubMed]
- Rashed, A.M.; Abdel-Wahab, N.; Moussa, E.M.M.; Hammam, N. Association of hand grip strength with disease activity, disability and quality of life in children and adolescents with Juvenile Idiopathic Arthritis. Adv. Rheumatol. 2018, 58, 11. [Google Scholar] [CrossRef] [PubMed] [Green Version]
- Bijlsma, J.W.; Berenbaum, F.; Lafeber, F.P. Osteoarthritis: An update with relevance for clinical practice. Lancet 2011, 377, 2115–2126. [Google Scholar] [CrossRef]
- Wasserman, A.M. Diagnosis and management of rheumatoid arthritis. Am. Fam. Physician 2011, 84, 1245–1252. [Google Scholar]
- Nguyen, C.; Lefèvre-Colau, M.M.; Poiraudeau, S.; Rannou, F. Rehabilitation (exercise and strength training) and osteoarthritis: A critical narrative review. Ann. Phys. Rehabil. Med. 2016, 59, 190–195. [Google Scholar] [CrossRef]
- Metsios, G.S.; Kitas, G.D. Physical activity, exercise and rheumatoid arthritis: Effectiveness, mechanisms and implementation. Best Pract. Res. Clin. Rheumatol. 2018, 32, 669–682. [Google Scholar] [CrossRef]
- Cruz-Jentoft, A.J.; Baeyens, J.P.; Bauer, J.M.; Boirie, Y.; Cederholm, T.; Landi, F.; Martin, F.C.; Michel, J.P.; Rolland, Y.; Schneider, S.M.; et al. Sarcopenia: European consensus on definition and diagnosis: Report of the European Working Group on Sarcopenia in Older People. Age Ageing 2010, 39, 412–423. [Google Scholar] [CrossRef] [Green Version]


| Characteristics | Arthritis (n = 2365) | Control (n = 11,601) | p-Value |
|---|---|---|---|
| Age (years) | 65.06 ± 0.25 | 54.87 ± 0.16 | <0.0001 * |
| Sex | <0.0001 * | ||
| Male | 21.79 (0.97) | 53.83 (0.45) | |
| Female | 78.21 (0.97) | 46.17 (0.45) | |
| HGS (kg) | 24.39 ± 0.2 | 32.54 ± 0.12 | <0.0001 * |
| Weak HGS | 36.19 (1.16) | 18.84 (0.5) | <0.0001 * |
| Low income | 36.93 (1.26) | 14.47 (0.54) | <0.0001 * |
| Education ≥ 10 years | 33.47 (1.25) | 71.71 (0.7) | <0.0001 * |
| Smoking | <0.0001 * | ||
| Non smoker | 77.39 (1.05) | 53.68 (0.5) | |
| Ex-smoker | 14.77 (0.88) | 25.6 (0.45) | |
| Current smoker | 7.84 (0.73) | 20.72 (0.5) | |
| Drinking | <0.0001 * | ||
| Non | 44.35 (1.23) | 24.97 (0.52) | |
| Low risk | 52.36 (1.25) | 65.1 (0.57) | |
| High risk | 3.29 (0.48) | 9.93 (0.32) | |
| Aerobic physical activity | 34.07 (1.19) | 44.29 (0.63) | <0.0001 * |
| Diabetes mellitus | 19.75 (1.04) | 13.86 (0.38) | <0.0001 * |
| Hypertension | 52.77 (1.19) | 35.2 (0.58) | <0.0001 * |
| Hypercholesterolemia | 36.12 (1.11) | 24.26 (0.49) | <0.0001 * |
| Body mass index (kg/m2) | 24.93 ± 0.08 | 24.06 ± 0.04 | <0.0001 * |
| Waist circumference (cm) | 85.25 ± 0.24 | 83.38 ± 0.11 | <.0001 * |
| Systolic blood pressure (mmHg) | 125.63 ± 0.4 | 120.15 ± 0.21 | <0.0001 * |
| Diastolic blood pressure (mmHg) | 74.99 ± 0.24 | 77.35 ± 0.13 | <0.0001 * |
| Glucose | 104.54 ± 0.63 | 103.56 ± 0.28 | 0.1489 |
| Cholesterol | 193.19 ± 0.97 | 196.39 ± 0.44 | 0.0022 * |
| High-density lipoprotein | 50.03 ± 0.32 | 50.13 ± 0.14 | 0.7748 |
| EQ-5D | |||
| Mobility | 40.53 (1.15) | 9.37 (0.33) | <0.0001 * |
| Self-care | 9.09 (0.66) | 2.2 (0.15) | <0.0001 * |
| Usual activities | 21.16 (0.95) | 4.84 (0.23) | <0.0001 * |
| Pain/discomfort | 49.84 (1.21) | 18.24 (0.43) | <0.0001 * |
| Anxiety/depression | 18.17 (0.95) | 7.13 (0.29) | <0.0001 * |
| n | Model 1 † | Model 2 ‡ | Model 3 § | |
|---|---|---|---|---|
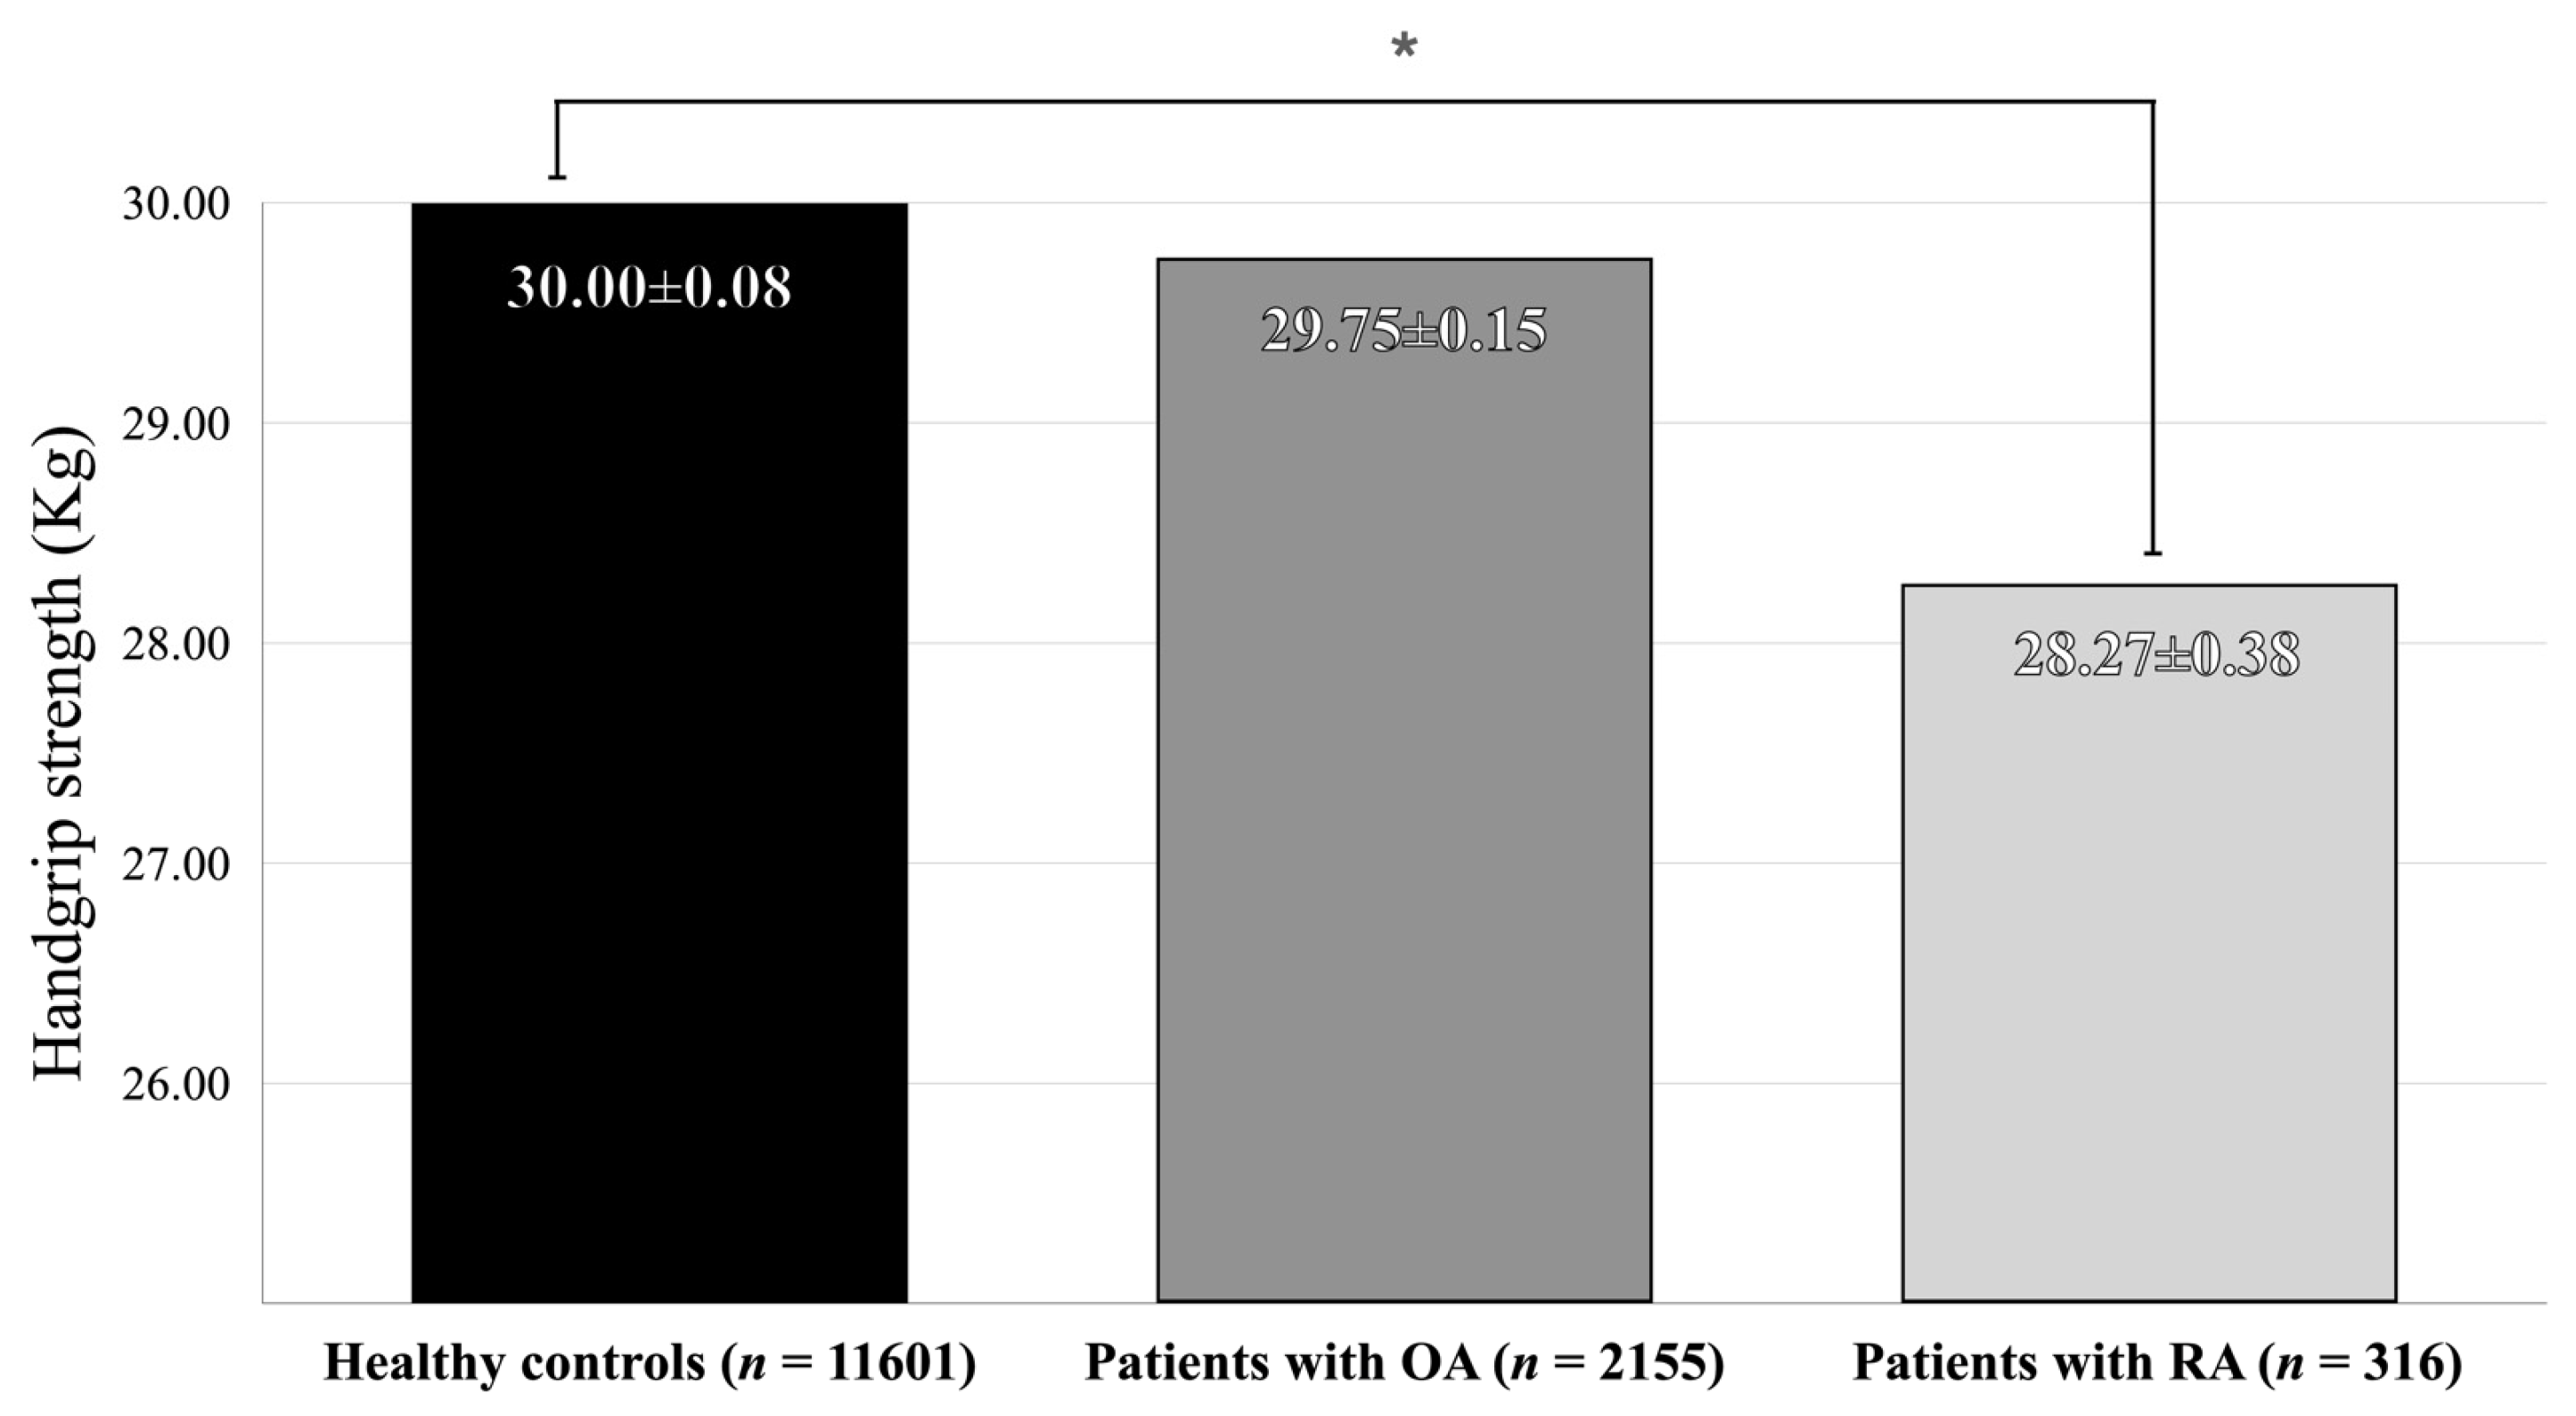
| Controls | 11,601 | 32.54 ± 0.12 | 29.99 ± 0.08 | 30 ± 0.08 |
| Patients with arthritis | 2365 | 24.39 ± 0.2 | 29.56 ± 0.14 | 29.54 ± 0.15 |
| p-value | <0.0001 * | 0.0049 * | 0.0035 * |
| n | Model 1 † | Model 2 ‡ | Model 3 § | |
|---|---|---|---|---|
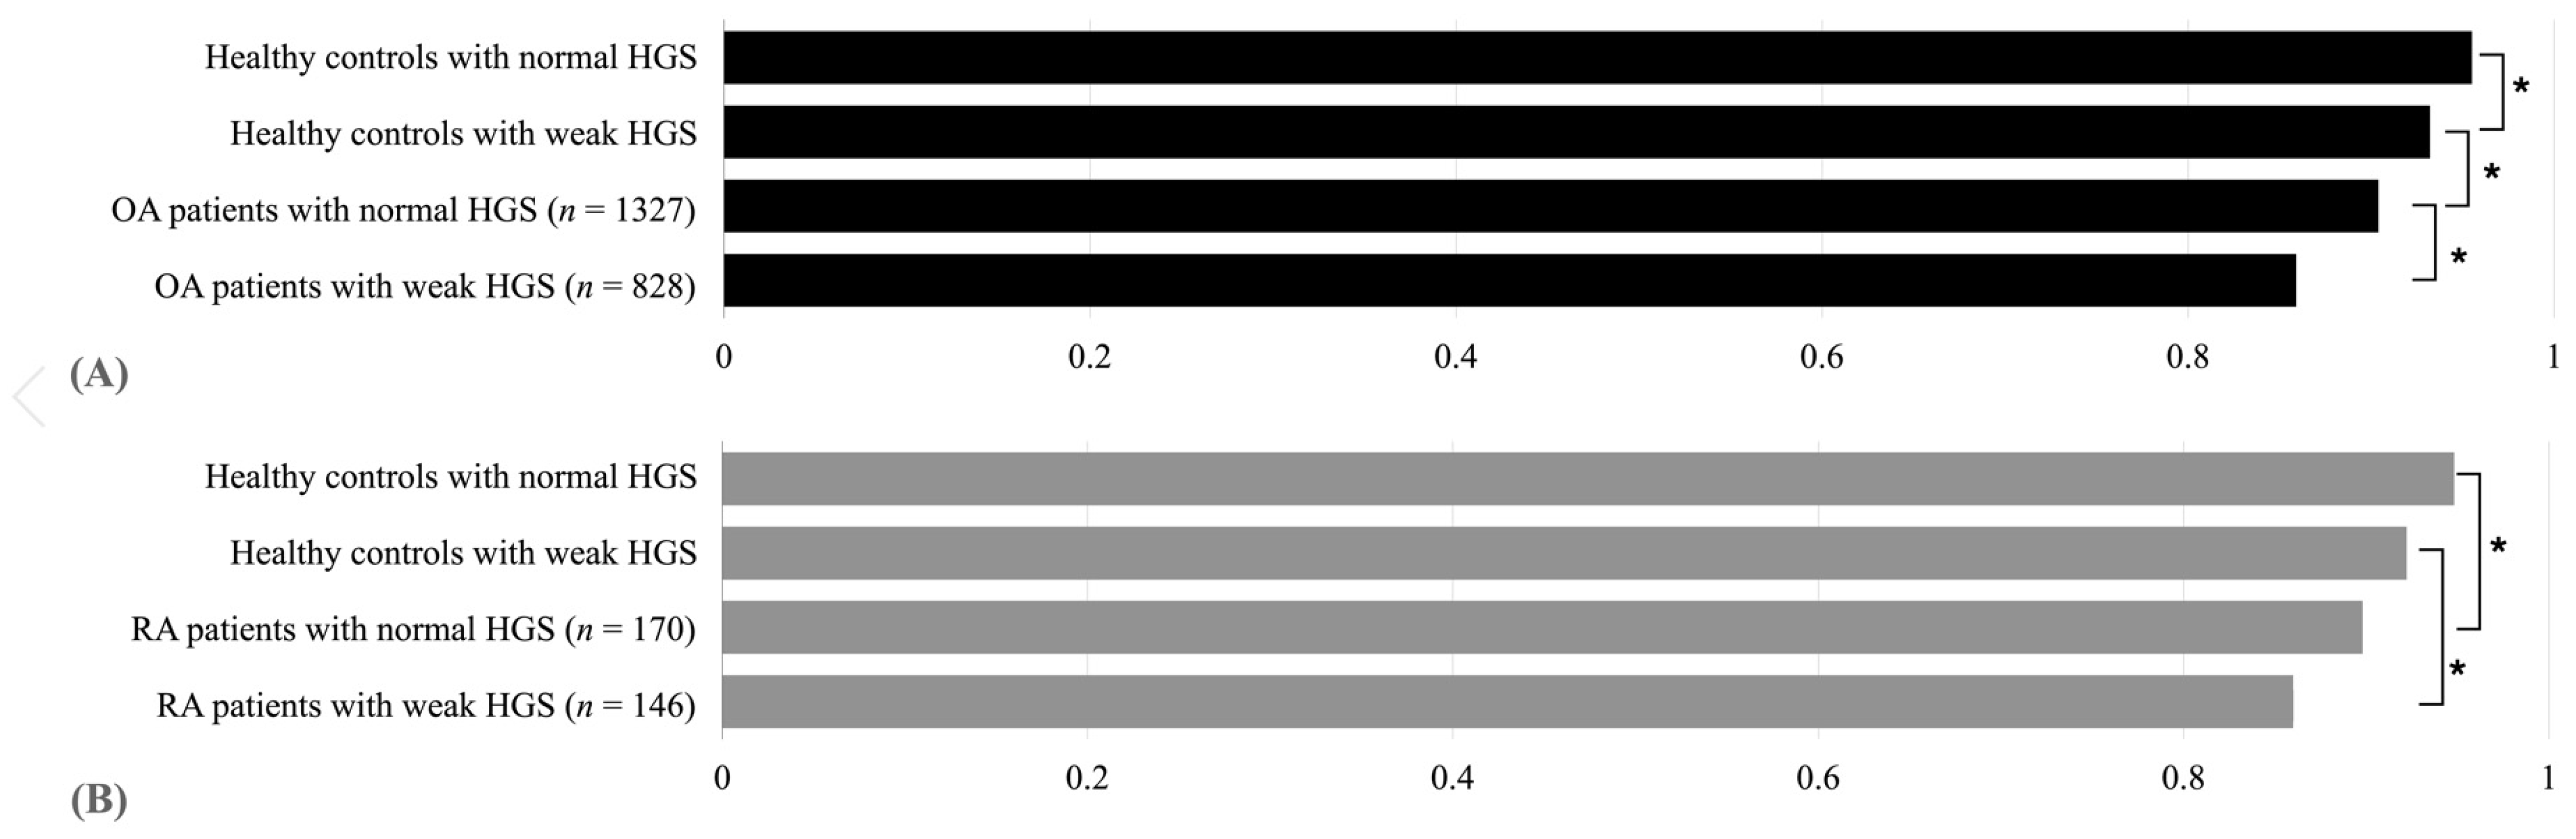
| Healthy controls with normal HGS | 9012 | 0.971 ± 0.001 | 0.956 ± 0.001 | 0.956 ± 0.001 |
| Healthy controls with weak HGS | 2589 | 0.925 ± 0.003 | 0.933 ± 0.003 | 0.933 ± 0.003 |
| Arthritis patients with normal HGS | 1438 | 0.889 ± 0.004 | 0.905 ± 0.004 | 0.905 ± 0.004 |
| Arthritis patients with weak HGS | 927 | 0.829 ± 0.007 | 0.862 ± 0.006 | 0.862 ± 0.006 |
| p-value | <0.0001 * | <0.0001 * | <0.0001 * |
| Dimension of the EQ-5D | Groups | Model 1 † | Model 2 ‡ | Model 3 § |
|---|---|---|---|---|
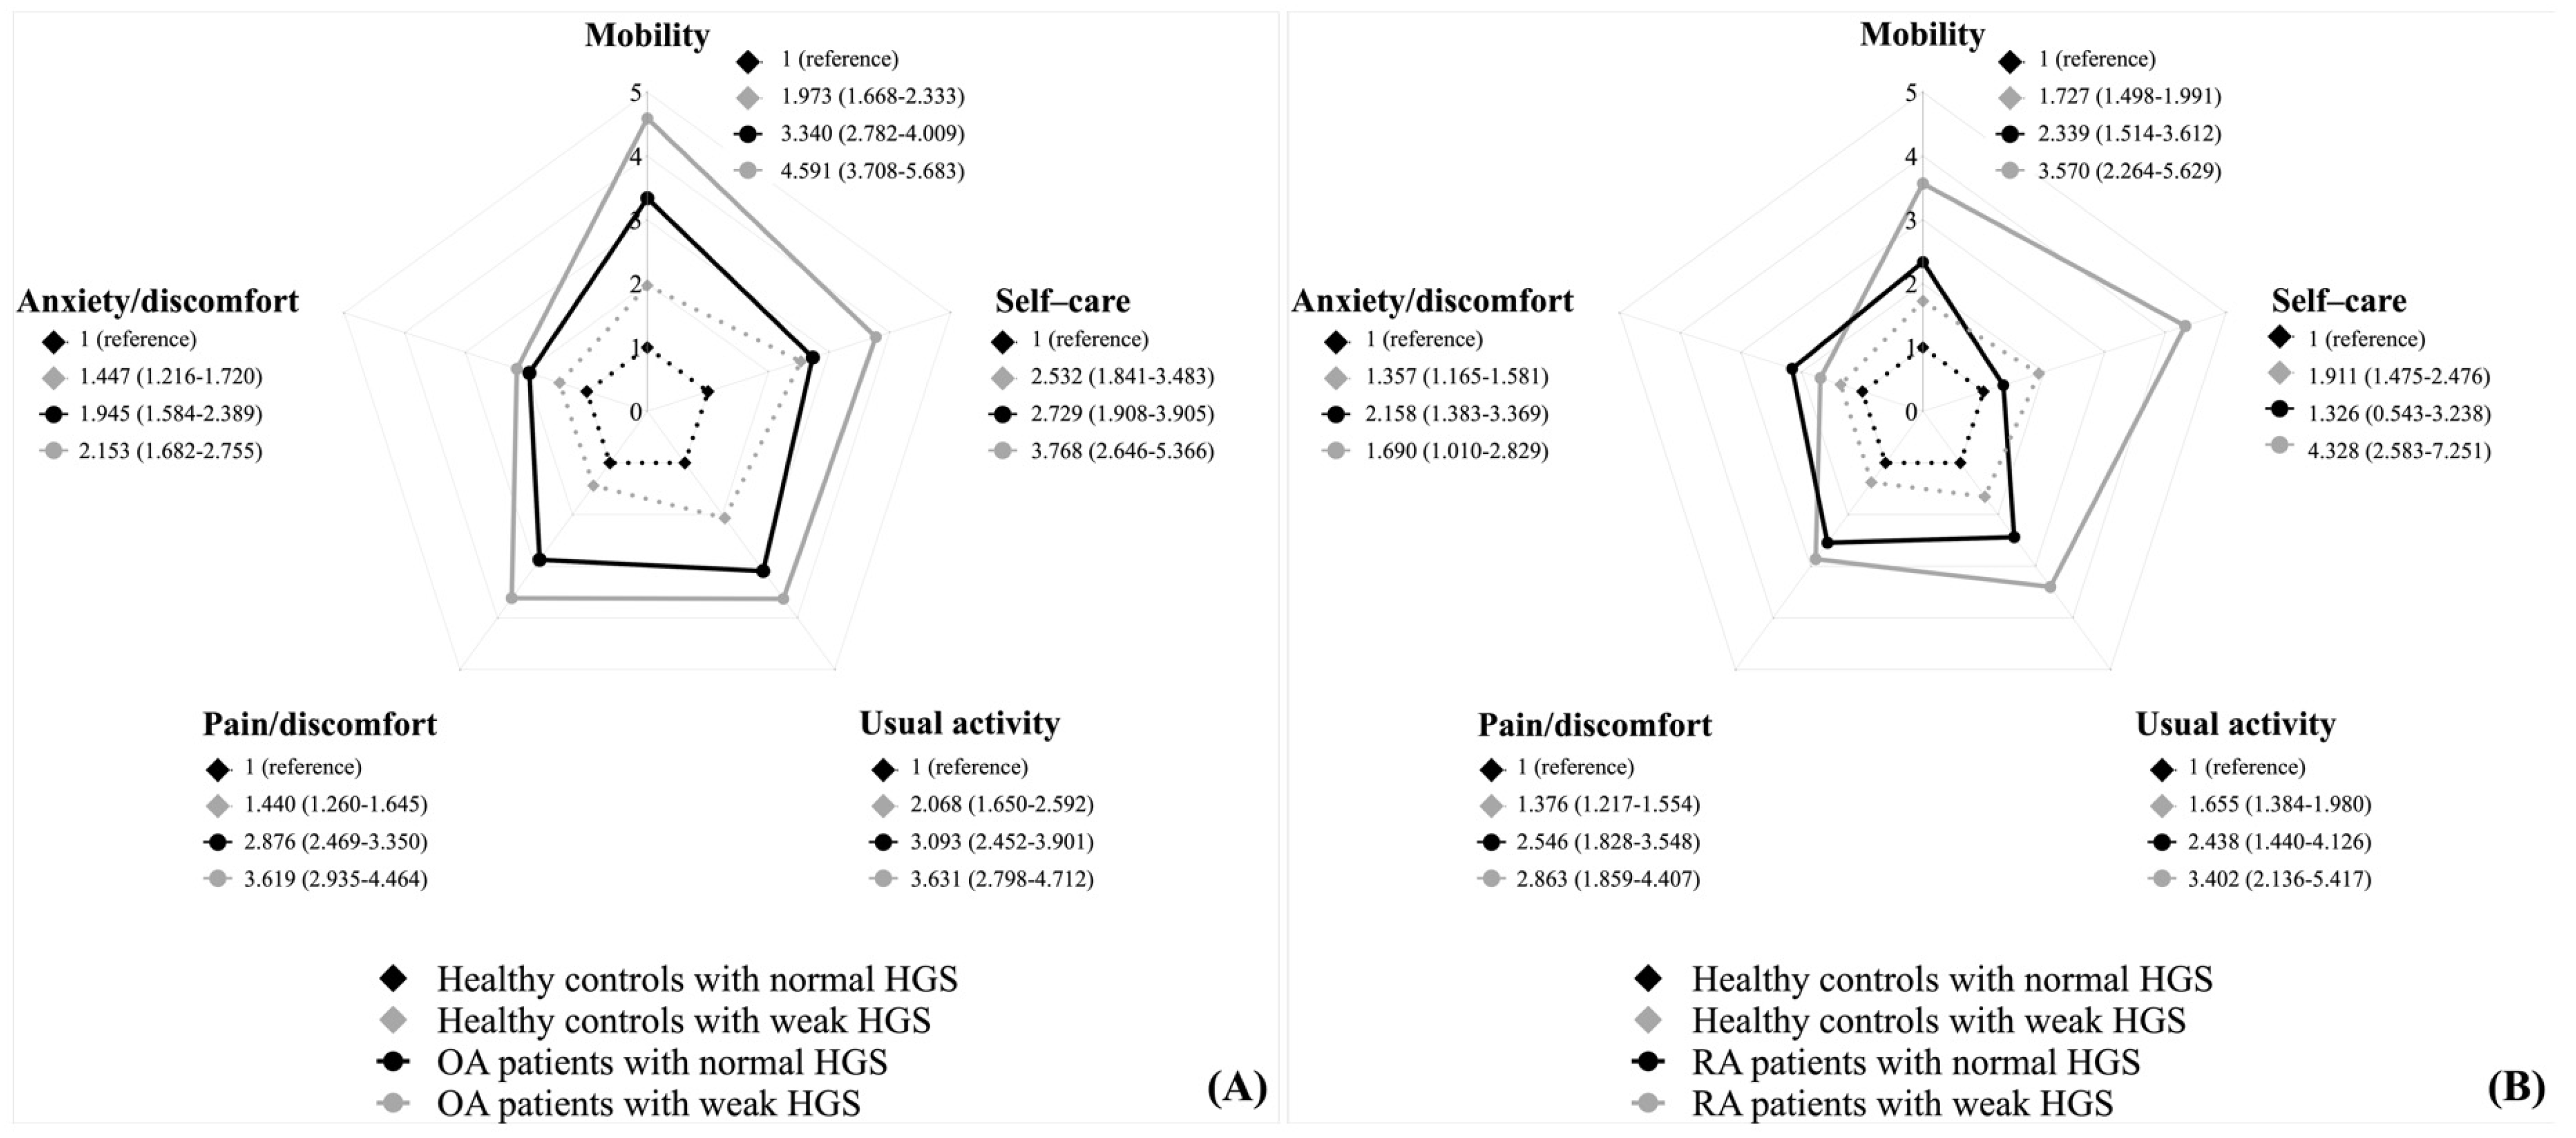
| Mobility | Healthy control with normal HGS | 1 (ref.) | 1 (ref.) | 1 (ref.) |
| Healthy control with weak HGS | 4.202 (3.642–4.847) | 1.976 (1.663–2.347) | 1.969 (1.659–2.337) | |
| Arthritis patients with normal HGS | 7.521 (6.447–8.774) | 3.351 (2.811–3.994) | 3.367 (2.823–4.015) | |
| Arthritis patients with weak HGS | 16.086 (13.524–19.134) | 4.608 (3.768–5.636) | 4.596 (3.758–5.62) | |
| p-value | <0.0001 * | <0.0001 * | <0.0001 * | |
| Self-care | Healthy control with normal HGS | 1 (ref.) | 1 (ref.) | 1 (ref.) |
| Healthy control with weak HGS | 5.233 (3.995–6.855) | 2.49 (1.808–3.429) | 2.466 (1.788–3.402) | |
| Arthritis patients with normal HGS | 5.481 (3.981–7.547) | 2.619 (1.836–3.734) | 2.652 (1.857–3.787) | |
| Arthritis patients with weak HGS | 12.349 (9.411–16.205) | 3.872 (2.754–5.445) | 3.866 (2.748–5.438) | |
| p-value | <0.0001 * | <0.0001 * | <0.0001 * | |
| Usual activity | Healthy control with normal HGS | 1 (ref.) | 1 (ref.) | 1 (ref.) |
| Healthy control with weak HGS | 4.106 (3.373–4.998) | 2.043 (1.626–2.567) | 2.036 (1.62–2.56) | |
| Arthritis patients with normal HGS | 6.343 (5.188–7.754) | 3.066 (2.451–3.836) | 3.088 (2.466–3.868) | |
| Arthritis patients with weak HGS | 11.744 (9.436–14.615) | 3.775 (2.942–4.844) | 3.763 (2.934–4.826) | |
| p-value | <0.0001 * | <0.0001 * | <0.0001 * | |
| Pain /discomfort | Healthy control with normal HGS | 1 (ref.) | 1 (ref.) | 1 (ref.) |
| Healthy control with weak HGS | 1.868 (1.651–2.115) | 1.426 (1.245–1.633) | 1.417 (1.237–1.624) | |
| Arthritis patients with normal HGS | 4.434 (3.864–5.087) | 2.898 (2.505–3.351) | 2.901 (2.508–3.356) | |
| Arthritis patients with weak HGS | 6.562 (5.514–7.809) | 3.663 (2.995–4.481) | 3.662 (2.993–4.48) | |
| p-value | <0.0001 * | <0.0001 * | <.00001 * | |
| Anxiety /depression | Healthy control with normal HGS | 1 (ref.) | 1 (ref.) | 1 (ref.) |
| Healthy control with weak HGS | 1.947 (1.656–2.289) | 1.464 (1.229–1.743) | 1.46 (1.226–1.739) | |
| Arthritis patients with normal HGS | 3.088 (2.565–3.718) | 2.025 (1.656–2.475) | 2.029 (1.659–2.481) | |
| Arthritis patients with weak HGS | 3.933 (3.186–4.856) | 2.205 (1.734–2.805) | 2.196 (1.726–2.794) | |
| p-value | <0.0001 * | <0.0001 * | <0.0001 * |
Publisher’s Note: MDPI stays neutral with regard to jurisdictional claims in published maps and institutional affiliations. |
© 2022 by the authors. Licensee MDPI, Basel, Switzerland. This article is an open access article distributed under the terms and conditions of the Creative Commons Attribution (CC BY) license (https://creativecommons.org/licenses/by/4.0/).
Share and Cite
Chang, S.-Y.; Han, B.-D.; Han, K.-D.; Park, H.-J.; Kang, S. Relation between Handgrip Strength and Quality of Life in Patients with Arthritis in Korea: The Korea National Health and Nutrition Examination Survey, 2015–2018. Medicina 2022, 58, 172. https://doi.org/10.3390/medicina58020172
Chang S-Y, Han B-D, Han K-D, Park H-J, Kang S. Relation between Handgrip Strength and Quality of Life in Patients with Arthritis in Korea: The Korea National Health and Nutrition Examination Survey, 2015–2018. Medicina. 2022; 58(2):172. https://doi.org/10.3390/medicina58020172
Chicago/Turabian StyleChang, So-Youn, Byoung-Duck Han, Kyung-Do Han, Hyo-Jin Park, and Seok Kang. 2022. "Relation between Handgrip Strength and Quality of Life in Patients with Arthritis in Korea: The Korea National Health and Nutrition Examination Survey, 2015–2018" Medicina 58, no. 2: 172. https://doi.org/10.3390/medicina58020172