Article

Lactones from the Sponge-Derived Fungus Talaromyces rugulosus

1
Institute of Pharmaceutical Biology and Biotechnology, Heinrich-Heine-Universität Düsseldorf, 40225 Düsseldorf, Germany
2
Department of Pharmacognosy, Faculty of Pharmacy, Mansoura University, Mansoura 35516, Egypt
3
Department of Organic Chemistry, University of Debrecen, 4032 Debrecen, Hungary
4
Department of Pharmacognosy, Faculty of Pharmacy, King Saud University, Riyadh 11451, Saudi Arabia
5
Institute of Physiological Chemistry, Universitätsmedizin der Johannes Gutenberg-Universität Mainz, 55128 Mainz, Germany
6
Institute of Complex Systems: Strukturbiochemie, ForschungszentrumJuelich, 52428 Juelich, Germany
7
State Key Laboratory of Natural and Biomimetic Drugs, Peking University, Beijing 100191, China
8
FukangPharma, North-East of Dongwaihuan Road, Dongcheng Industrial Area, Shouguang City 262700, China
*
Authors to whom correspondence should be addressed.
These authors contributed equally to this work.
Mar. Drugs 2017, 15(11), 359; https://doi.org/10.3390/md15110359
Submission received: 12 October 2017 / Revised: 6 November 2017 / Accepted: 9 November 2017 / Published: 14 November 2017
(This article belongs to the Special Issue Bioactive Compounds from Marine Microbes - II)

Abstract

:
The marine-derived fungus Talaromyces rugulosus isolated from the Mediterranean sponge Axinella cannabina and cultured on solid rice medium yielded seventeen lactone derivatives including five butenolides (15), seven (3S)-resorcylide derivatives (612), two butenolide-resorcylide dimers (13 and 14), and three dihydroisocoumarins (1517). Among them, fourteen compounds (13, 616) are new natural products. The structures of the isolated compounds were elucidated by 1D and 2D NMR (Nuclear Magnetic Resonance) spectroscopy as well as by ESI-HRMS (ElectroSpray Ionization-High Resolution Mass Spectrometry). TDDFT-ECD (Time-Dependent Density Functional Theory-Electronic Circular Dichroism) calculations were performed to determine the absolute configurations of chiral compounds. The butenolide-resorcylide dimers talarodilactones A and B (13 and 14) exhibited potent cytotoxicity against the L5178Y murine lymphoma cell line with IC50 values of 3.9 and 1.3 µM, respectively.

1. Introduction

Marine-derived fungi are prolific sources for bioactive secondary metabolites, such as the famous antibiotic cephalosporin C obtained from the fungus Acremonium chrysogenum [1], or halimide derived from an algiculous fungus, which gave rise to the semisynthetic metabolite plinabulin that is now in Phase II clinical studies for its anticancer potential against either solid tumours or lymphomas [2,3].
During our ongoing search for new bioactive secondary metabolites from fungal origin [4,5,6,7], we investigated Talaromyces rugulosus, which was isolated from the Mediterranean sponge Axinella cannabina. The fungal genus Talaromyces is known to produce diverse bioactive secondary metabolites including tetraene lactones [8], polyketides [9,10], alkaloids and peptides with some of them exhibiting antibiotic, cytotoxic and anti-HBV (Hepatitis B Virus) activities [11]. Only a few research papers are devoted to the chemical constituents of Talaromyces rugulosus. Yilmaz et al. reported the isolation of skyrin, endocrocin, emodin, prugosins A-C and a bis-anthraquinoid pigment, rugulosin A, which showed antibacterial activity against Staphylococcus aureus [12]. This encouraged us to investigate the natural products of the sponge-derived strain of T. rugulosus.
The EtOAc (ethyl acetate) extract of the fungus when fermented on solid rice medium yielded three new butenolides (13), seven new resorcylide derivatives (612), two new butenolide-resorcylide dimers (13 and 14) and two new dihydroisocoumarins (15 and 16) as well as three known analogues (4, 5 and 17) (Figure 1). The structure elucidation including the absolute configuration assignment and biological activities of the isolated compounds are discussed in this report.

2. Results

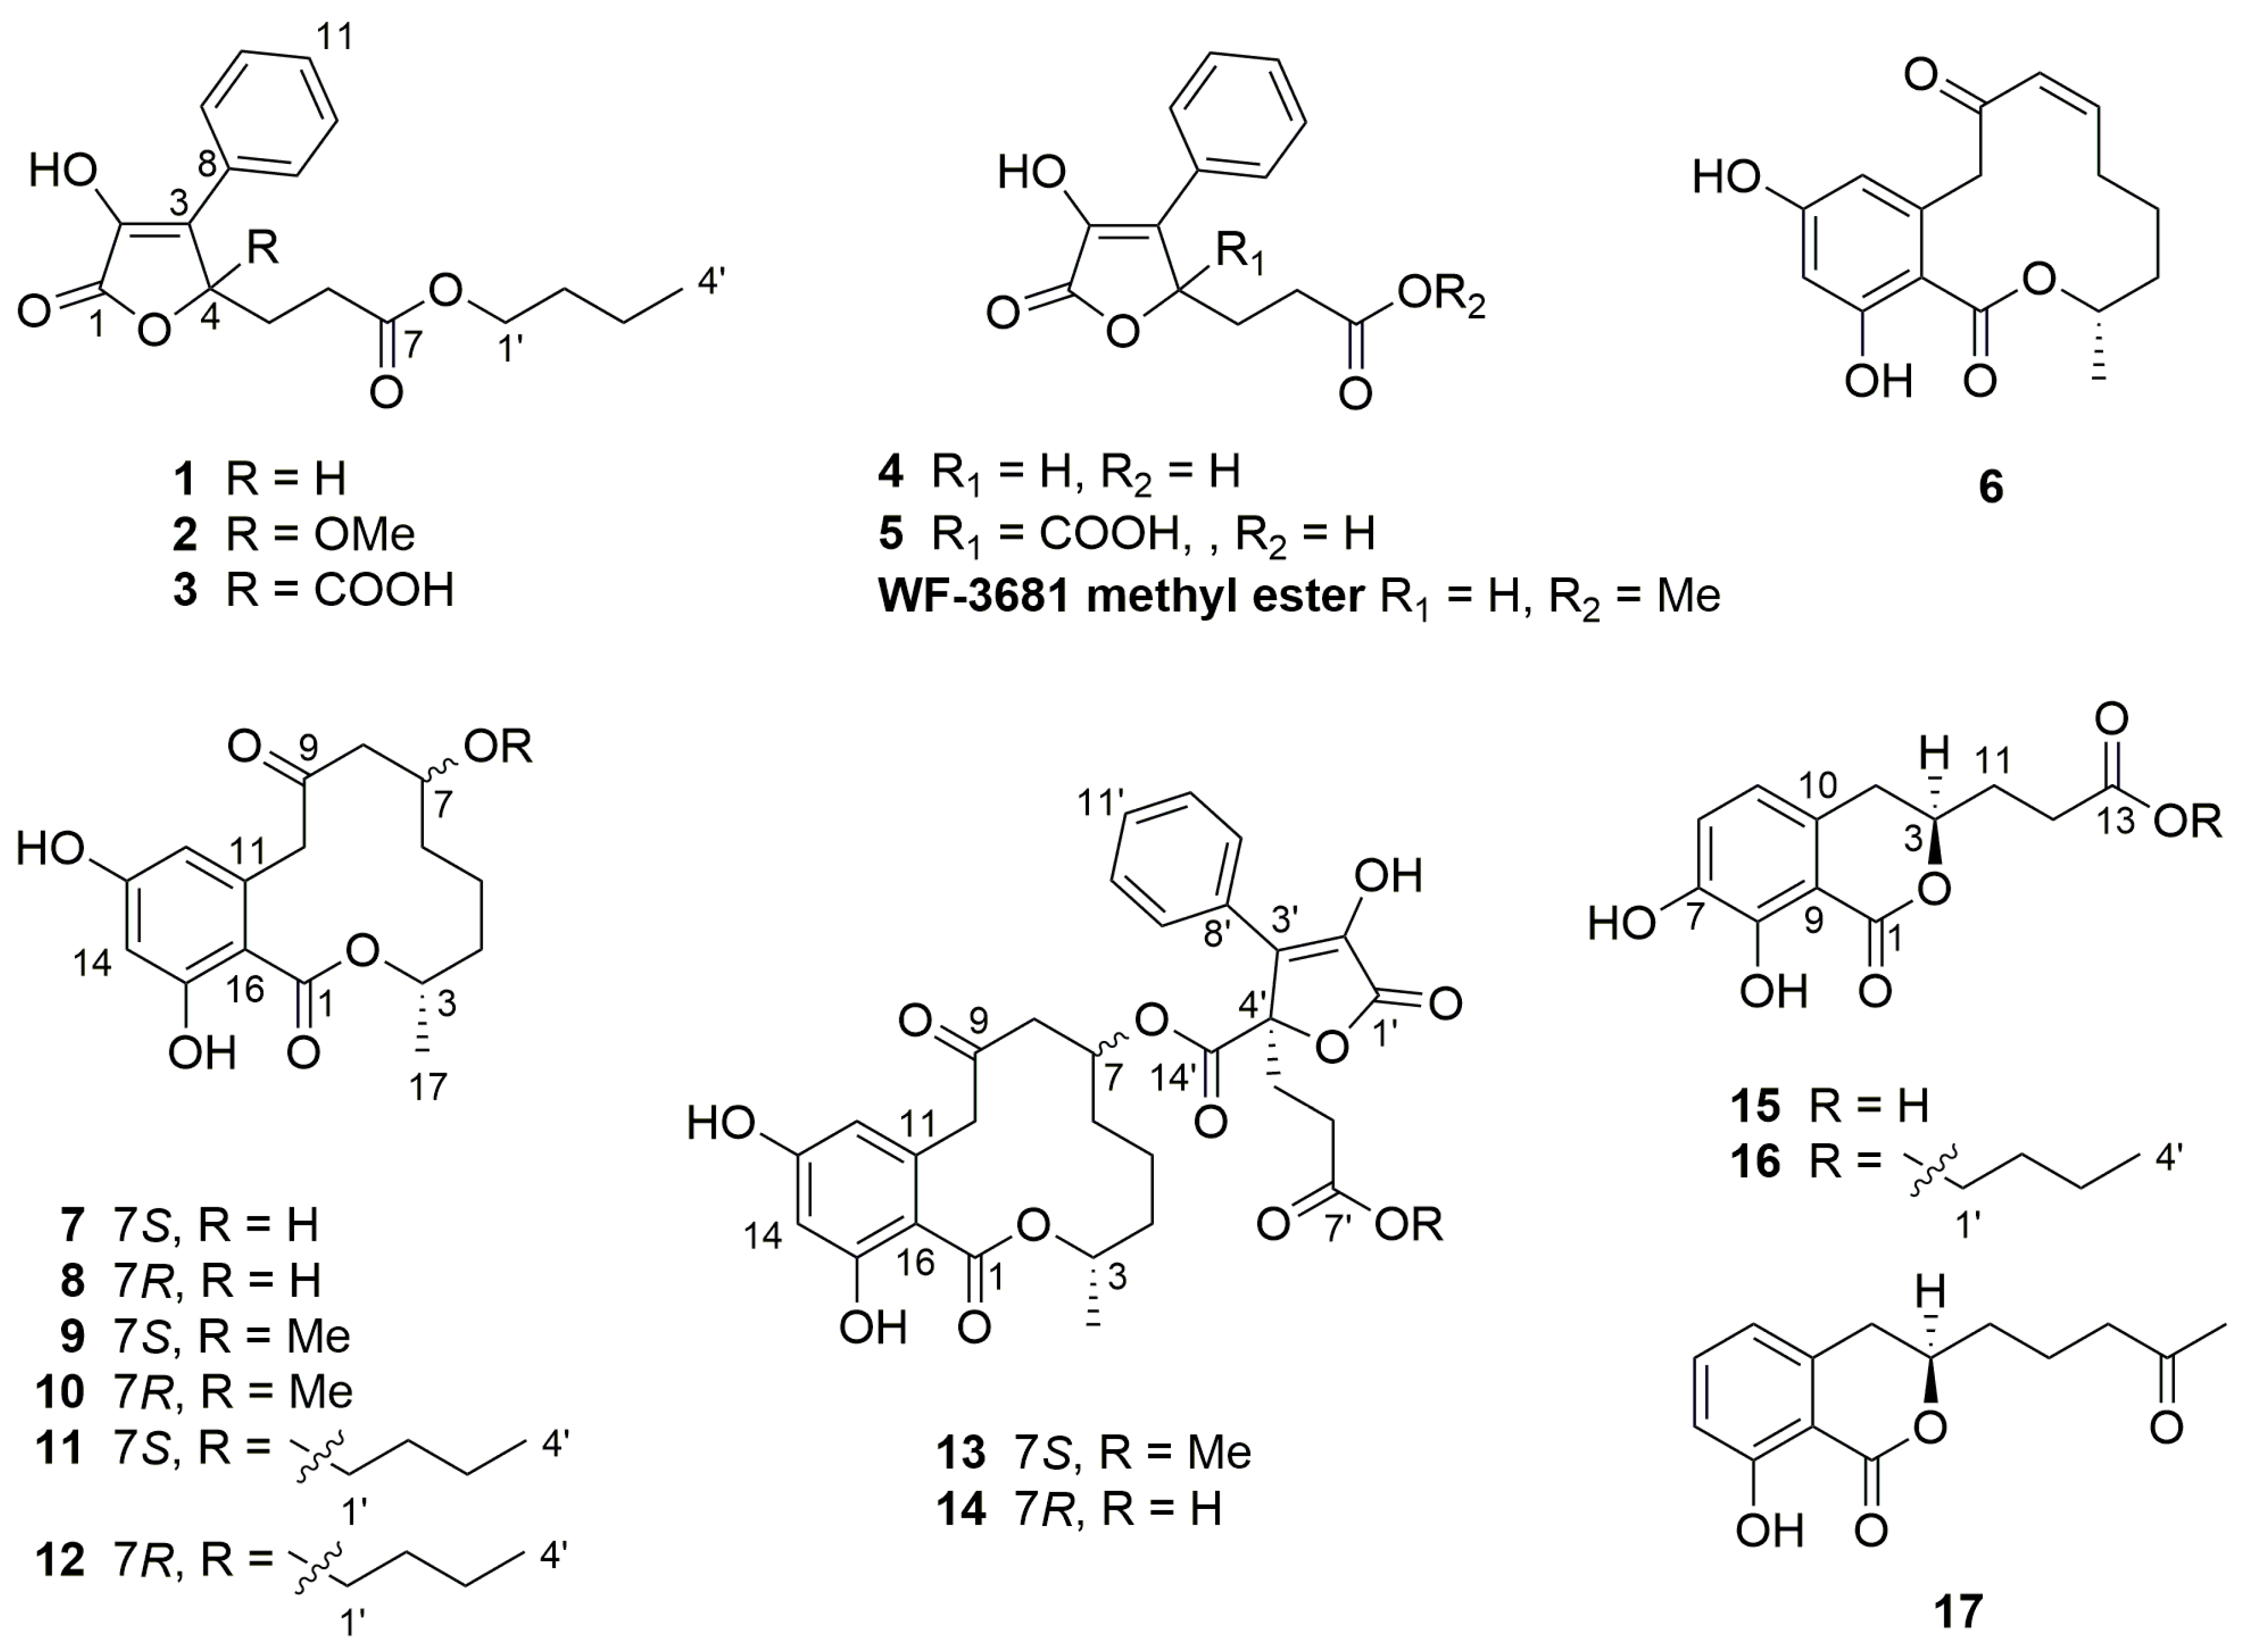
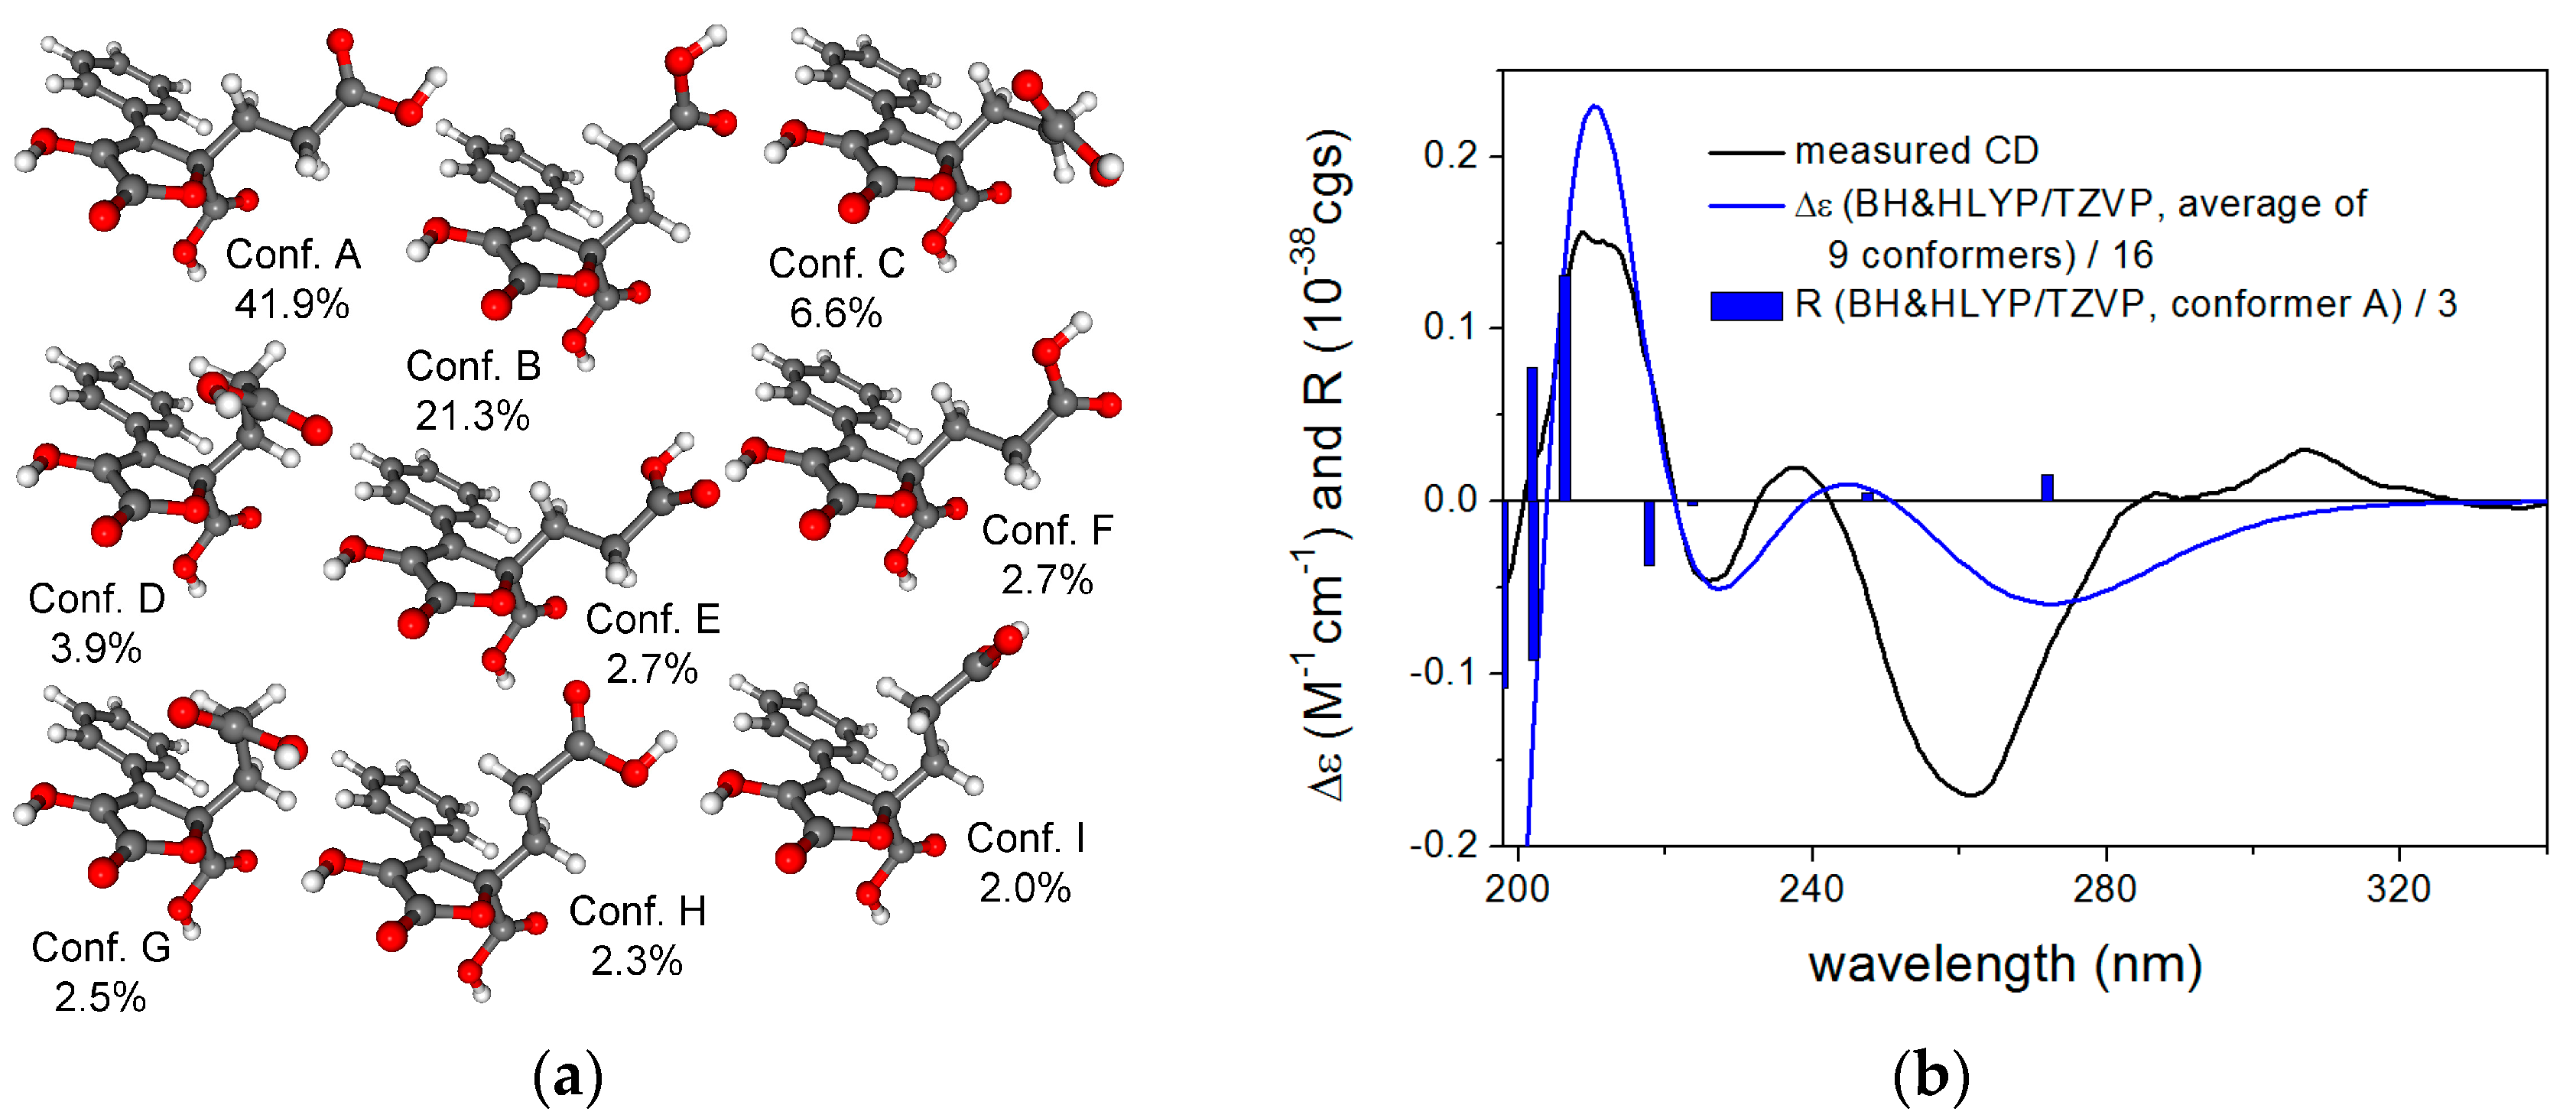
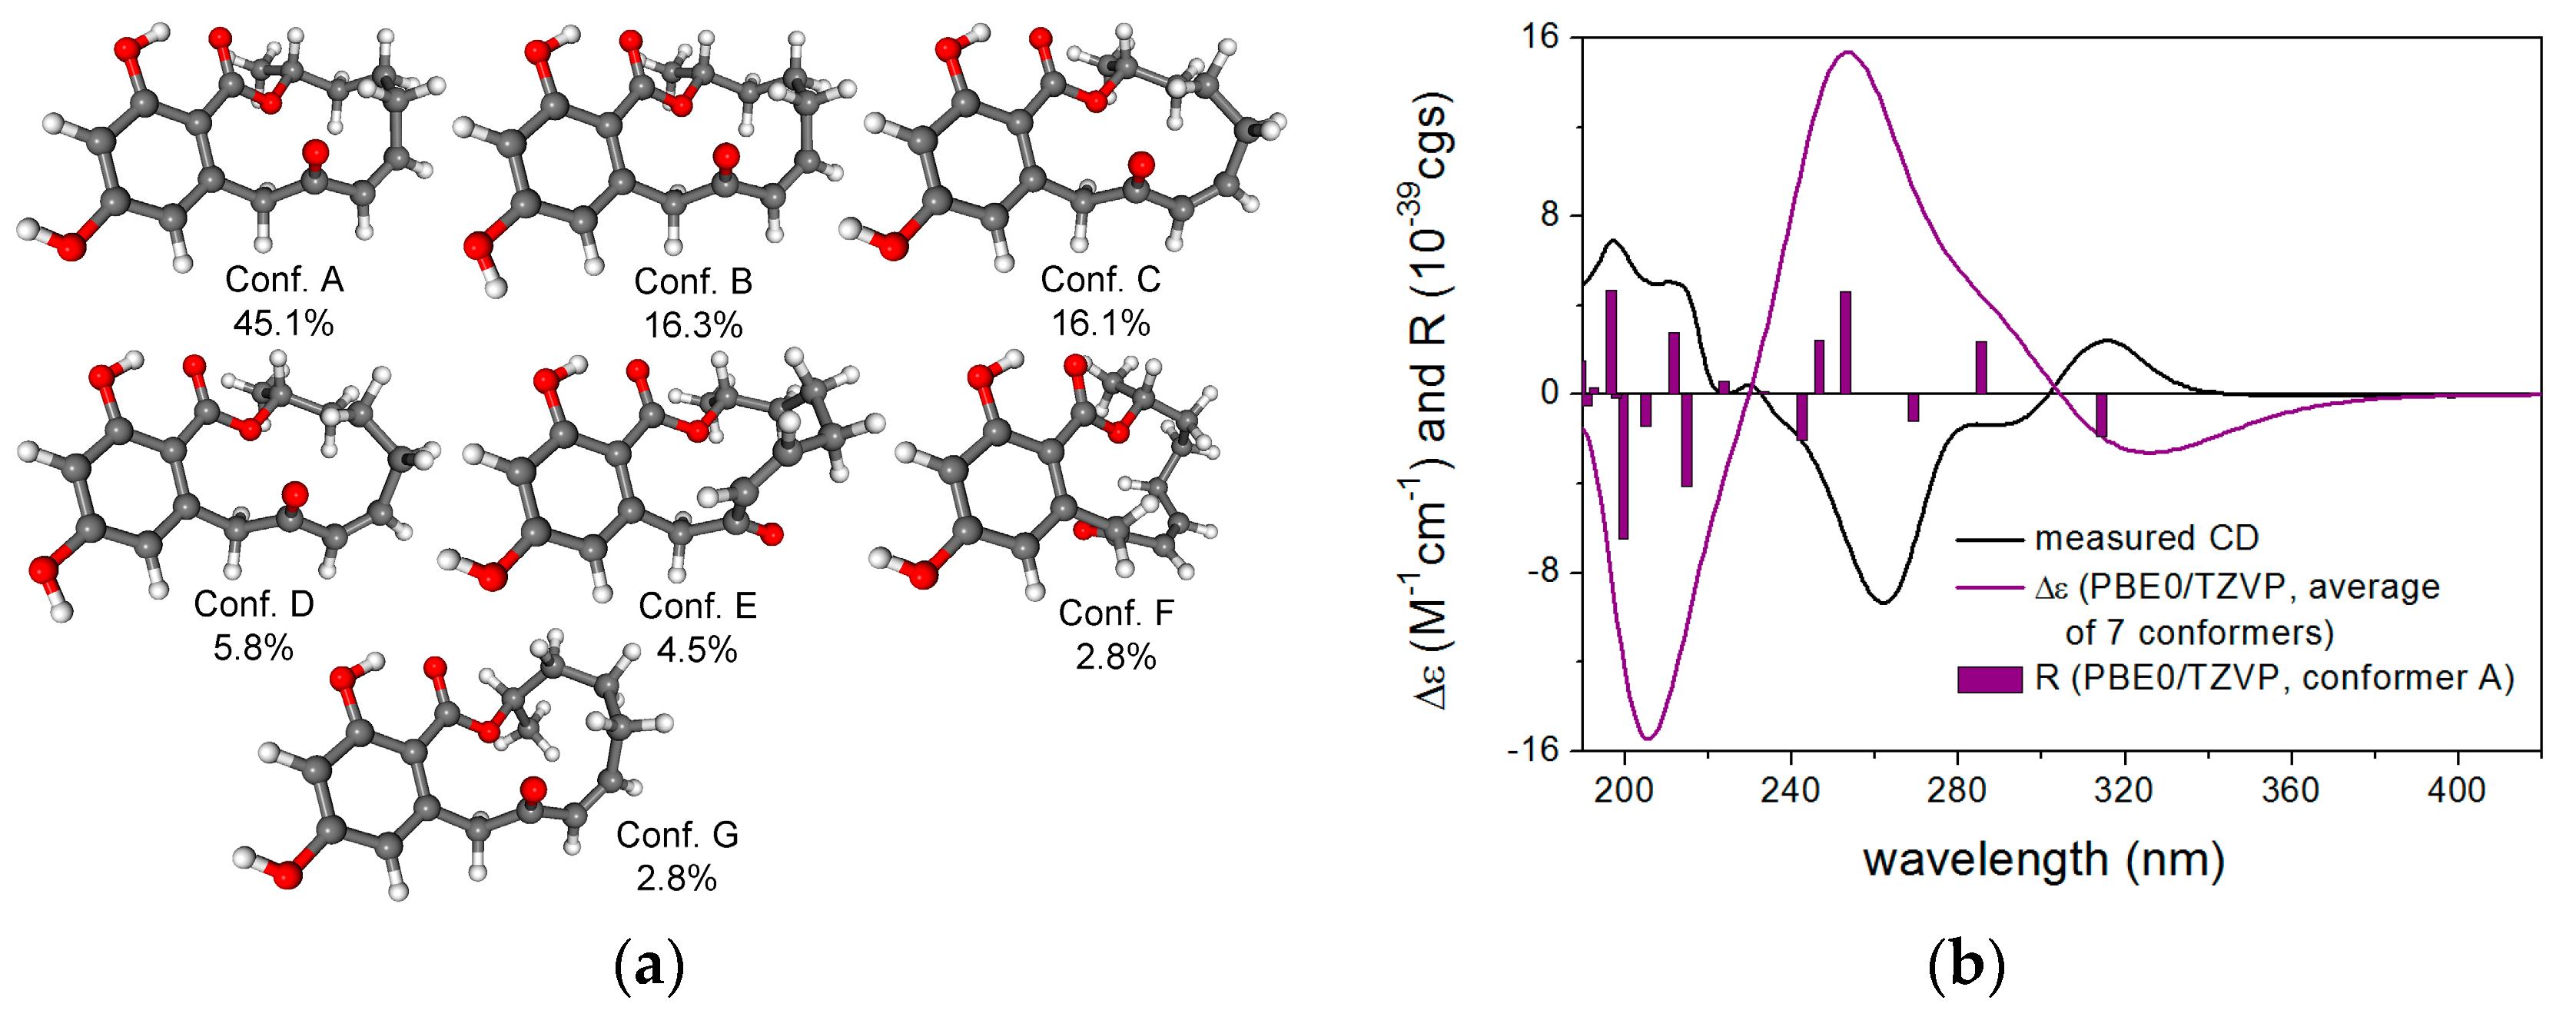
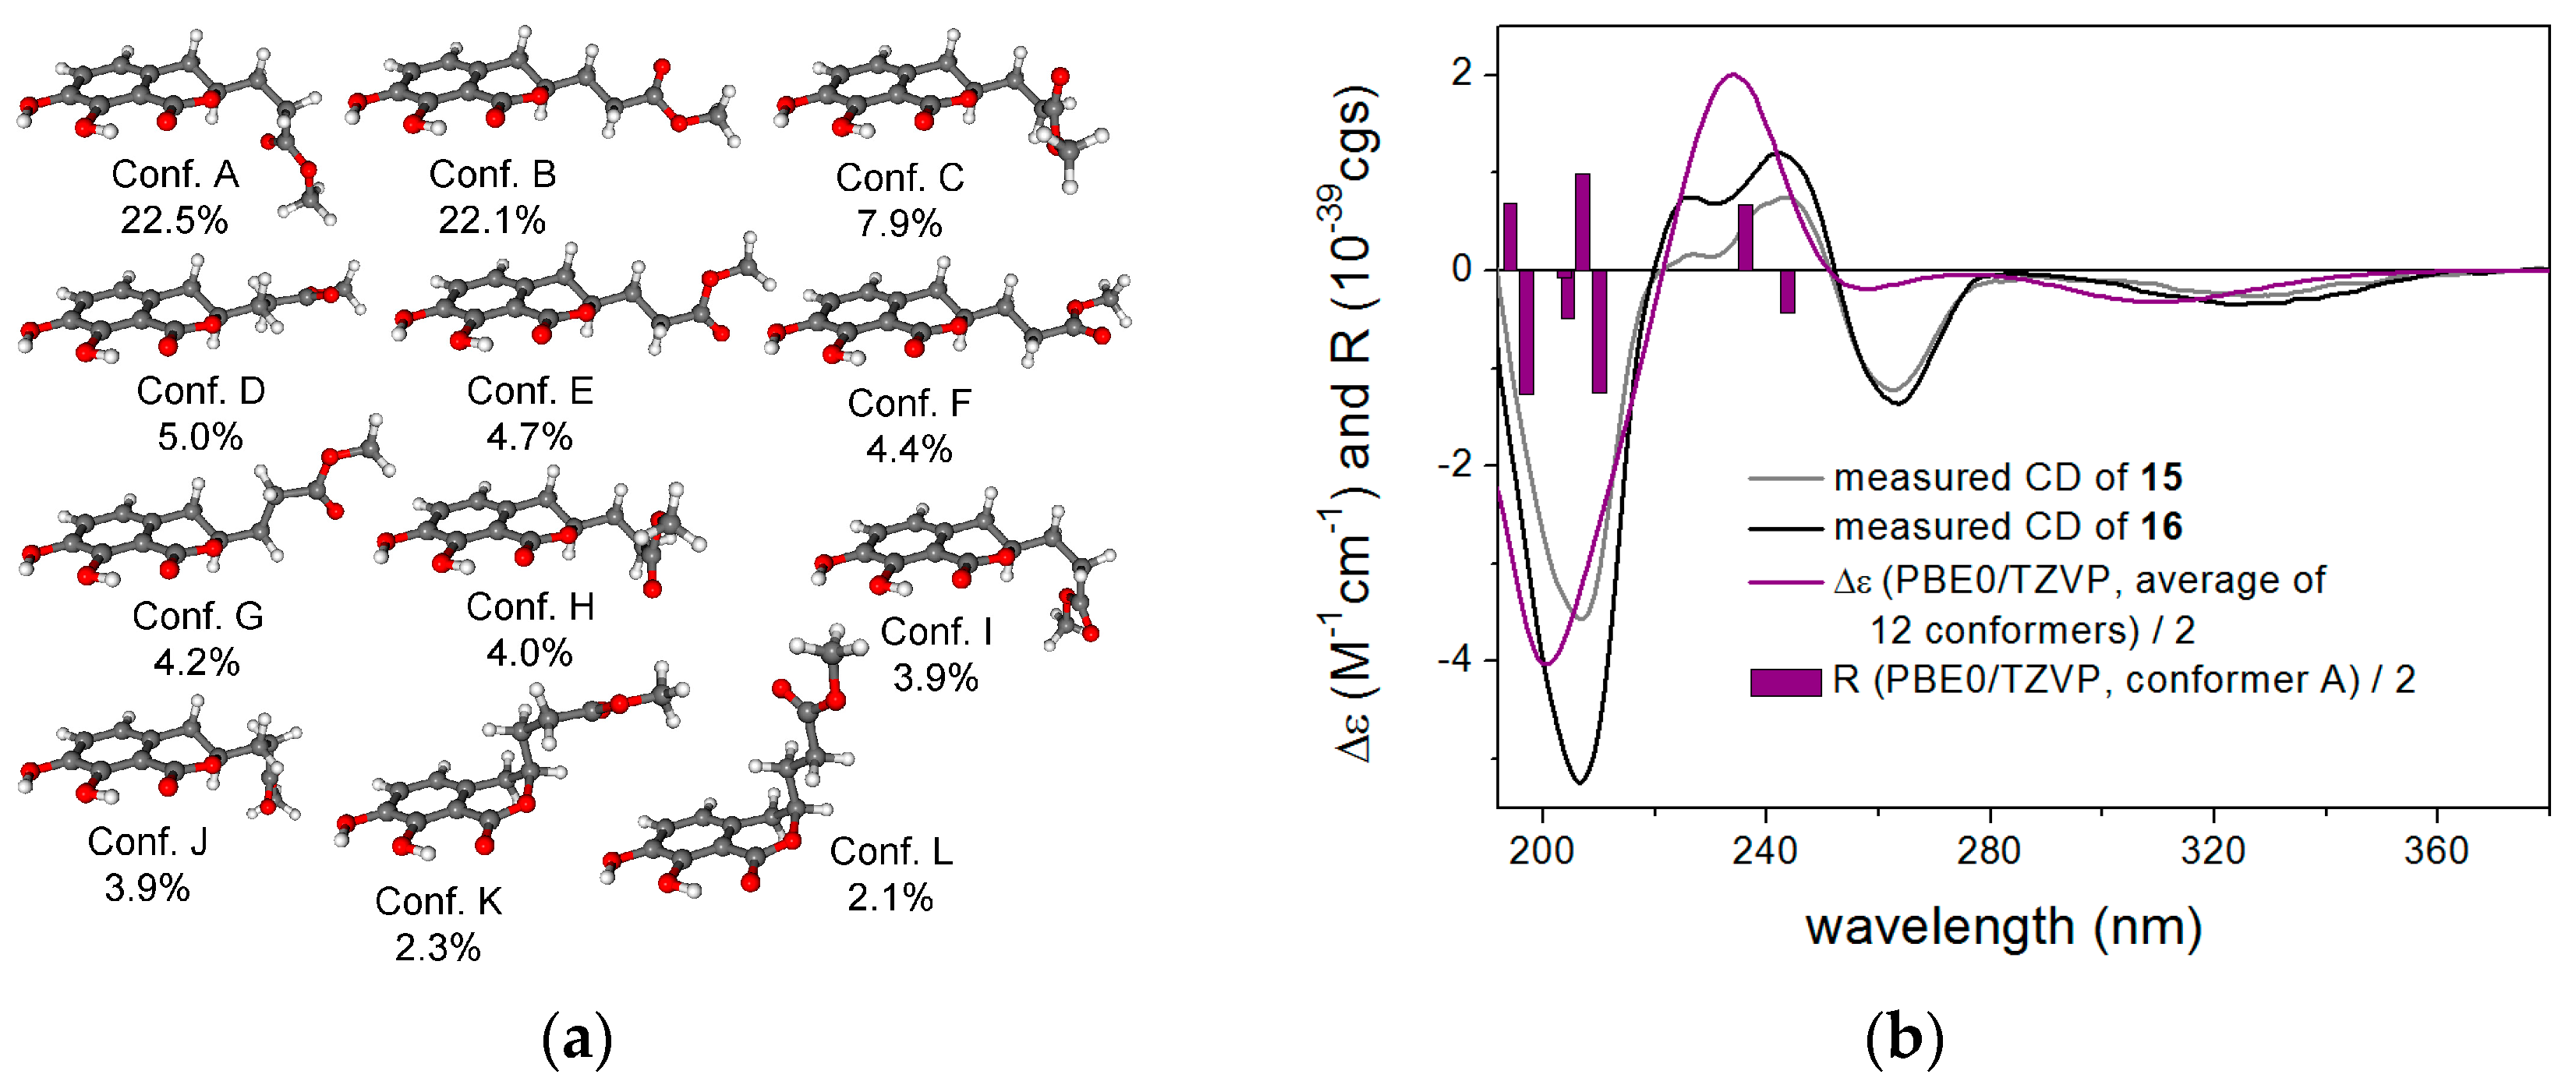
2.1. Structure Elucidation

Compound 1 was isolated as a brown amorphous solid. It has the molecular formula C17H20O5 as determined by ESI-HRMS (ElectroSpray Ionization-High Resolution Mass Spectrometry) corresponding to eight degrees of unsaturation. Its UV absorbances at λmax 207, 218 and 288 nm were similar to those of the co-isolated known butenolide derivative lactone acid (4) [13]. The NMR (Nuclear Magnetic Resonance) data of compound 1 (Table 1) were likewise comparable to those of 4 and included typical signals for a mono-substituted benzene ring at δH 7.75 (2H, d, J = 7.5 Hz, H-9 and H-13), 7.44 (2H, t, J = 7.5 Hz, H-10 and H-12) and 7.35 (1H, t, J = 7.5 Hz, H-11), an oxygenated methine proton at δH 5.52 (H-4), as well as two methylene groups at δH 2.45, 1.75 (Hab-5) and 2.44 (H2-6). The COSY (Correlation SpectroscopY) correlations between H-4/H2-5 and H2-5/H2-6 together with the HMBC (Heteronuclear Multiple Bond Correlation) correlations from H-4 to C-1 (δC 171.0), C-2 (δC 139.5), C-3 (δC 130.6) and C-8 (δC 131.9) and from Hab-5 and H2-6 to C-7 (δC 174.6) indicated that compound 1 shared the same core structure as 4. In addition, signals of a methyl at δH 0.94 (Me-4′) and three methylene groups at δH 1.38 (H2-3′), 1.60 (H2-2′), 4.08 (H-1′a) and 4.04 (H-1′b) were observed. The COSY correlations between Me-4′/H2-3′/H2-2′/Hab-1′ and the HMBC correlation from Hab-1′ to C-7 confirmed a n-butyl side chain to be attached to C-7 through an ester bond. Thus, the planar structure of 1 was elucidated as an unsaturated γ-lactone with propanoic acid n-butyl ester side chain. The absolute configuration of 1 was elucidated by comparing its experimental ECD spectrum with that of WF-3681 methyl ester [14], which can be considered a close analogue of 1. Based on the good overall agreement, 1 has (S) absolute configuration.
The UV (UltraViolet) spectrum of compound 2 was similar to that of 1. The ESI-HRMS data revealed the molecular formula C18H22O6, suggesting the presence of an additional methoxy group in 2 compared to 1, which was observed at δH 3.18 and δC 50.7, respectively. The disappearance of the oxygenated methine proton along with the HMBC correlation from the protons of the methoxy group to C-4 (δC 109.8) indicated this additional methoxy group to be located at the C-4 position. The remaining structure of 2 was elucidated to be identical to that of 1 as indicated by detailed analysis of the 2D NMR spectra of 2. Thus, compound 2 was identified as 4-methoxylactone acid n-butyl ester. The ECD spectrum of 2 was rather weak and noisy, but similar to that of chaetobutenolide C [14], which can be used for ECD correlation and indicated a non-racemic mixture of (R) and (S) isomers with a slight excess of the (R) enantiomer.
The molecular formula of 3 was deduced as C18H20O7 from ESI-HRMS data. The UV and NMR data (Table 1) of 3 resembled those of the co-isolated lactone diacid (5) [13], except for the observation of an additional n-butyl chain as described for 1. In the HMBC spectrum of 3, H2-5 (δH 2.68 and 2.48), H2-6 (δH 2.25 and 2.15) and H2-1′ (δH 4.00 and 3.94) exhibited correlations to C-7 (δC 174.2) while only H2-5 showed correlation to C-14 (δC 171.9), indicating the O-n-butyl group to be attached to C-7. Thus, compound 3 was elucidated as lactone diacid 7-O-n-butyl ester. Compound 3 decomposed before ECD measurements. Its absolute configuration can be tentatively assigned upon biosynthetic considerations as (R) similarly to 5.
To elucidate the absolute configuration of the known natural product 5, the solution TDDFT-ECD (Time-Dependent Density Functional Theory-Electronic Circular Dichroism) protocol was applied on the arbitrarily chosen (R) enantiomer [15,16]. Merck Molecular Force Field (MMFF) conformational search with an implicit solvent model for CHCl3 resulted in 149 conformers in a 21 kJ/mol energy window. DFT reoptimization of these yielded 9, 12 and 12 low-energy (≥2%) conformers at the B3LYP/6-31G(d) in vacuo, the B97D/TZVP PCM (Polarizable Continuum Model)/MeCN and the CAM-B3LYP/TZVP PCM/MeCN levels, respectively. Boltzmann-averaged ECD spectra of (R)-5 resembled the experimental ECD spectrum allowing elucidation of the absolute configuration as (R) (Figure 2).
The NMR data of compounds 610 were found to be identical to those of (3R)-cis-resorcylide, (3R,7R)-7-hydroxyresorcylide, (3R,7S)-7-hydroxyresorcylide, (3R,7R)-7-methoxyresorcylide and (3R,7S)-7-methoxyresorcylide, respectively (Table 2 and Table 3). These resorcylides were first reported by Barrow et al. and the absolute configuration at C-3 was suggested to be S in consideration of their biosynthesis [17]. Later, it was revised to (3R) by chemical derivatization, ECD calculation and X-ray diffraction analysis [18,19,20]. However, the resorcylides isolated in this study exhibited mirror-imaged CD (Circular dichroism) curves compared to those of the corresponding compounds found in the literature, indicating that they should be enantiomers of the previously reported resorcylides derivatives and possess 3S configuration. The above-mentioned TDDFT-ECD protocol was carried out on the arbitrarily chosen (R) enantiomer of 6 yielding 33 MMFF conformers, and 7 and 12 low-energy conformers at the B3LYP/6-31G(d) and the B97D/TZVP levels. Boltzmann averaged ECD spectra computed for both sets of conformers gave mirror-image agreement with the experimental spectrum, allowing elucidation of the absolute configuration as (S) in line with the literature (Figure 3).
Similar ECD pattern was observed in the experimental ECD spectrum of 9, and good agreement of the experimental and TDDFT-ECD spectra allowed determining the absolute configuration as (3S,7S)-9 (Figure S92). The calculations also confirmed that the stereochemistry of the C-3 lactone carbon has dominant contribution to the ECD spectra. Thus, compounds 610 are determined as (3S)-cis-resorcylide, (3S,7S)-7-hydroxyresorcylide, (3S,7R)-7-hydroxyresorcylide, (3S,7S)-7-methoxy-resorcylide and (3S,7R)-7-methoxyresorcylide, respectively.
Based on ESI-HRMS data, the molecular formula of compound 11 was determined to be C20H28O6, containing an additional C4H8 unit when compared to 7. Comparison of the 1H and 13C NMR data of 7 and 11 (Table 4) revealed the existence of an additional n-butyl group in 11, which is further confirmed by the COSY correlations between Me-4′ (δH 0.95)/H2-3′ (δH 1.42), H2-3′/H2-2′ (δH 1.56), H2-2′/Ha-1′ (δH 3.63) and H2-2′/Hb-1′ (δH 3.51). Examination of the 2D NMR spectra of 11 indicated it to share the same resorcylide ring structure as found in compounds 710. Key HMBC correlations from Hab-1′ to C-7 (δC 75.4) and from H-7 (δH 4.04) to C-1′ (δC 69.7) confirmed the linkage between C-7 and the additional n-butyl group via an ether bond in 11. Thus, the planar structure of 11 was elucidated as 7-O-n-butylresorcylide. Compound 12 shared the same gross structure as 11 as confirmed by 2D NMR and ESI-HRMS data. The structural difference between 11 and 12 is confined to the configuration at C-7 as already found for 7 and 8, and for 9 and 10. Comparison of the NMR data of 11 and 12, especially of the coupling constants between H-7 and Hab-8 and of the chemical shifts of C-3, H-3 and C-17 (Table 5), indicated that 11 shared the same relative configuration as 7 and 9, whereas 12 shared the same relative configuration as 8 and 10. Moreover, the CD data of 11 were comparable to those of 7 and 9, whereas the ECD data of 12 resembled those of 8 and 10. The above findings revealed compounds 11 and 12 to be (3S,7S)-7-O-n-butylresorcylide and (3S,7R)-7-O-n-butylresorcylide, respectively.
Compound 13 was isolated as a brown amorphous solid. Its molecular formula was established as C31H32O12 from ESI-HRMS data. Interestingly, the 1H and 13C NMR spectra of 13 (Table 6) showed two sets of signals corresponding to the macrolide (3R,7R)-7-hydroxyresorcylide (7) and the butenolide lactone diacid (5), which were co-isolated in the present study. For example, the two meta-coupling aromatic protons at δH 6.26 (d, J = 2.5 Hz, H-14) and 6.14 (d, J = 2.5 Hz, H-12), the two oxygenated methine protons at δH 5.54 (m, H-7) and 4.93 (m, H-3), the isolated methylene protons at δH 4.67 (d, J = 18.8 Hz, Ha-10) and 3.78 (d, J = 18.8 Hz, Hb-10) and the doublet methyl at δH 1.28 (d, J = 6.2 Hz, Me-17) represented characteristic signals for 7-hydroxyresorcylide. On the other side, signals of the mono-substituted benzene ring at δH 7.73 (d, J = 7.7 Hz, H-9′ and H-13′), 7.44 (2H, t, J = 7.7 Hz, H-10′ and H-12′) and 7.37 (1H, t, J = 7.7 Hz, H-11′) along with those of two methylene groups at δH 2.77, 2.59 (Hab-5′) and 2.29, 2.22 (Hab-6′) indicated the butenolide lactone diacid (5).
Detailed analysis of the 2D NMR spectra of 13 established the two subunits of resorcylide and butenolide as shown. The HMBC correlations from H-7 and Hab-5′ to C-14′ (δC 169.9) indicated the connection of these two subunits through the C(7)-O-C(14′) ester bond. In addition, the attachment of a methoxy group (δH 3.58 and δC 52.3) at C-7′ was deduced by the HMBC correlation from the protons of the methoxy group to C-7′ (δC 174.4). Thus, the structure of compound 13 was elucidated as shown, representing a butenolide-resorcylide dimer, for which the name talarodilactone A is proposed. Comparison of its NMR data with those of other resorcylide derivatives (Table 5) indicated that compound 13 shared the same relative configuration as 7, 9 and 11 regarding the macrolactone part. The ECD spectrum of 13 was found to be similar to those of resorcylide monomers, which suggested that the ECD spectrum of 13 is mainly governed by the C-3 chiral center of the resorcylide moiety and thus the absolute configuration of this chiral center could be unambiguously elucidated as (3S). On the basis of the (3S*,7S*) relative configuration determined by NMR experiments, the absolute configuration of the RAL subunit of 13 was determined as (3S,7S). Considering the shape of the ECD spectrum of 13, it more resembles those of 7 and 9 than those of 8 and 10 supporting the assignment of C-7 as (S). The absolute configuration of the butenolide part can be tentatively assiged as (R) on the basis of biosynthetic considerations.
The molecular formula of compound 14 was determined to be C30H30O12, suggesting the loss of one methoxy group compared to 13, which was confirmed by the disappearance of the respective signal in the NMR spectra of 14. Furthermore, comparison of the NMR data of 14 with those of the other resorcylide derivatives isolated in this study (Table 5) revealed that 14 shared the same relative configuration as 8, 10 and 12 at C-3 and C-7. Similarly to 13, the (3S) absolute configuration of 14 can be unambiguously deduced from the ECD spectrum, while that of C-7 can be determined as (R) by utilizing the experimental NMR data. The C-4′ chiral center can be only tentatively assigned as (R) on the basis of biosynthetic considerations.
Compound 15 was isolated as a brown amorphous solid, exhibiting UV absorbance maxima at 220, 258 and 334 nm. Its molecular formula was found to be C12H12O6 as confirmed by ESI-HRMS data, indicating seven degrees of unsaturation. The 1H NMR spectrum of 15 (Table 7) showed two ortho-coupling protons at δH 7.01 (d, J = 8.0 Hz, H-6) and 6.63 (d, J = 8.0 Hz, H-5), suggesting the presence of a 1,2,3,4-tetrasubstituted benzene ring. A spin system containing an oxygenated methine at δH 4.63 (H-3) and three aliphatic methylenes at δH 2.94 and 2.83 (Hab-4), 1.96 (H2-11) and 2.42 (H2-12) was identified by their COSY correlations. In addition, three hydroxy groups at δH 12.21 (s, OH-13), 10.82 (s, OH-8) and 9.33 (s, OH-7) were observed. The HMBC correlations from H-5 to C-7 (δC 144.4) and C-9 (δC 108.4), from H-6 to C-8 (δC 149.9) and C-10 (δC 129.1), from OH-7 to C-6 (δC 121.6), C-7 and C-8, and from OH-8 to C-7, C-8 and C-9 established a benzene ring with two hydroxy groups at C-7 and C-8. The HMBC correlations from H-5 to C-4 (δC 31.2), from Hab-4 to C-5 (δC 117.5), C-9 and C-10 as well as from H2-11 and H2-12 to C-13 (δC 173.8) indicated a 5-carboxypentyl chain to be attached at the C-10 position. Furthermore, the presence of an additional six-membered lactone ring fused with the benzene ring was confirmed by the HMBC correlations from H-5 and H-3 to C-1 (δC 169.6) combined with its molecular formula. The above findings concluded the structure of 15 as a new dihydroisocoumarin derivative as shown, for which the trivial name talumarin A is proposed.
Compound 16 shares almost identical UV absorptions with 15, suggesting the dihydroisocoumarin nature of the latter. The ESI-HRMS data established the molecular formula C16H20O6 for 16. The NMR data of 16 were likewise similar to those of 15 (Table 7). However, signals of an additional n-butyl moiety were observed in the NMR spectra of 16, which was further confirmed by the COSY correlations between Me-4′ (δH 0.95)/H2-3′ (δH 1.40), H2-3′/H2-2′ (δH 1.63), and H2-2′/H2-1′ (δH 4.11). In the HMBC spectrum, H2-1′ showed correlation to C-12 (δC 174.4), indicating the attachment of the n-butyl moiety to C-12 through an ester bond. The remaining structure of 16 was found to be identical to that of 15 by detailed analysis of the 2D NMR data of 16.
To elucidate the absolute configuration of 15 and 16, TDDFT-ECD calculations were performed on a truncated model compound of 16 (R = Me). MMFF conformational search of the (R) enantiomer resulted in 42 conformers in a 21 kJ/mol energy window—DFT reoptimization of which yielded 8, 18 and 12 low-energy conformers at the B3LYP/6-31G(d) in vacuo, the B97D/TZVP PCM/MeCN and the CAM-B3LYP/TZVP PCM/MeCN levels. ECD calculations performed for each set of conformers gave moderate to good overall agreement with the experimental spectra of 15 and 16, allowing elucidation of the absolute configuration of 15 and 16 as (R) (Figure 4). The result of the ECD calculation corroborated with the previous ECD studies of the dihydroisocoumarin chromophore well [21,22,23], which located the n-π* ECD transition in the range of 250–270 nm and correlated the P/M helicity of the condensed heteroring with positive/negative n-π* Cotton effect, respectively. In the case of 15 and 16, the heteroring adopts M helicity with equatorial C-3 substituent, which gives rise to a negative n-π* Cotton effect at 263 and 262 nm, respectively.
The remaining known compounds were identified as lactone acid (4) [13], lactone diacid (5) [13], and aspergillumarin A (17) by comparison of their spectroscopic data with those in the literature [24,25].

2.2. Biological Activities

All isolated compounds (117) were evaluated for their cytotoxic activity against the L5178Y mouse lymphoma cell line. Only the two butenolide-resorcylide dimmers talarodilactones A and B (13 and 14) exhibited potent cytotoxicity with IC50 (half maximal Inhibitory Concentration) values of 3.9 and 1.3 µM, respectively. Interestingly, the monomeric building blocks of 13 and 14, which were also isolated in this study, were inactive in comparison.
Moreover, all compounds were tested for their antimicrobial activities against Mycobacterium tuberculosis (H37Rv), Staphylococcus aureus (ATCC 25923) and Acinetobacter baumannii (ATCC BAA-1605) using a broth micro dilution assay. However, none of them was active at a dose of 25 µg/mL.

3. Discussion

In conclusion, analysis of the sponge-derived fungus T. rugulosus afforded seventeen lactone derivatives divided into four groups: five butenolides (15), seven resorcylide derivatives (612), two butenolide-resorcylide dimers (13 and 14) and three dihydroisocoumarins (1517).Compounds 13, 11, 12 and 16 exhibited a butyl side chain in their structures. Many butylated natural products have been isolated from fungi [26,27,28] and plants [29,30]. In our study, all butylated derivatives were clearly detected in the original crude fungal extract by LC-MS. Moreover, the extraction and isolation processes did not involve n-BuOH. After incubation of the corresponding non-butylated compounds with n-BuOH for one week, no butylation of these compounds was detected by LC-MS. These results confirm that the butylated compounds isolated in the present study are natural compounds.
Numerous (3R)-resorcylide derivatives have been reported [17,18,19,20]. Some of them that were initially presumed to possess 3S configuration were later revised to have 3R configuration instead. However, all resorcylide derivatives (614) isolated in the present study were unambiguously assigned as (3S)-series by CD analysis. To the best of our knowledge, this is the first report of (3S)-resorcylide derivatives in nature. In addition, talarodilactones A and B (13 and 14) represent a new class of butenolide-resorcylide dimers that showed significant cytotoxicity against the L5178Y murine lymphoma cell line with IC50 values of 3.9 and 1.3 µM, respectively.

4. Materials and Methods

4.1. General Experimental Procedures

Optical rotations were measured using a PerkinElmer-241 MC polarimeter (Waltham, MA, USA). Bruker AVANCE DMX 300 or 600 NMR spectrometers (Karlsruhe, Germany) were employed to record 1H, 13C and 2D NMR spectra. A Thermo Finnigan LCQ Deca LC-MS system (San Jose, CA, USA) was used to analysis the crude extract. ESI-HRMS data were obtained by a FT-HRMS-Orbitrap (Thermo Finnigan, San Jose, CA, USA) mass spectrometer. A Dionex P580 system (Germering, Germany) coupled to a photodiode array detector (UVD340S) was used to perform HPLC analysis. A Europhere 10 C18 (125 × 4 mm, L × ID, Knauer, Germany) was used for analytical separation. HPLC separation was carried out with a Lachrom-Merck Hitachi semi-preparative HPLC system (Darmstadt, Germany) (Pump L7100; UV detector L7400; column: Europhere 100 C18, 300 × 8 mm, Knauer, Germany). Merck MN silica gel 60 M (0.04–0.063 mm, Dueren, Germany) or Sephadex LH-20 (Darmstadt, Germany) were applied for column chromatography as stationary phases. Pre-coated silica gel 60 F254 plates (Merck) were used for TLC (Thin layer chromatography) analysis under detection at 254 and 366 nm and/or using anisaldehyde as spray-reagent. Spectral grade solvents were used for spectroscopic measurements while distilled solvents were used for column chromatographic separations. ECD spectra were recorded on a J-810 spectropolarimeter.

4.2. Fungal Material

The fungal strain was isolated from the healthy inner tissues of the sponge A. cannabina collected and identified by Semih Engin at Sığaçık-İzmir, Turkey. It was identified as Talaromyces rugulosus (GenBank accession No. KT071708) according to DNA amplification and sequencing of the fungal ITS region as described before [31].

4.3. Fermentation, Extraction and Isolation

The fungal strain was cultivated on solid rice medium in twelve 1L Erlenmeyer flasks (autoclaving 100 g of rice and 110 mL of 3.5% sea salt solution in each Erlenmeyer flask) at room temperature under static conditions. After 30 d, each flask was extracted overnight with ethyl acetate (3 × 400 mL), followed by filtration and evaporation. The obtained crude extract (5 g) was then partitioned between n-hexane and 90% aqueous MeOH. The MeOH extract was then subjected to vacuum liquid chromatography (VLC) on silica gel 60 using a gradient solvent elution system of n-hexane/EtOAc and CH2Cl2/MeOH to obtain 16 fractions (Fr.1 to Fr.16).
Fr.4 (509 mg) was fractionated on a Sephadex LH-20 column using MeOH as eluent to give ten subfractions (Fr.4-1 to Fr.4-10), among which subfraction Fr.4-6 was found to be the pure compound 6 (14.0 mg). Subfraction Fr.4-5 (119 mg) was further purified by semi-preparative HPLC with 60% MeOH/H2O as eluting system to afford 1 (9.9 mg), 11 (2.1mg), 12 (2.5 mg) and 16 (2.0 mg).
Fr.5 (2.4 g) was subjected to a Sephadex LH-20 column with MeOH as mobile phase to yield nine subfractions (Fr.5-1 to Fr.5-9). Compounds 14 (3.9 mg) and 15 (3.1 mg) were obtained from subfraction Fr.5-6 (50.5 mg) by semi-preparative HPLC with a gradient of MeOH/H2O as eluent. Subfraction Fr.5-4(570 mg) was chromatographed over a Sephadex LH-20 column using acetone to afford eight subfractions (Fr.5-4-1 to Fr.5-4-8). After purification by semi-preparative RP (Reversed Phase)-HPLC using a gradient elution of MeOH/H2O, subfractions Fr.5-4-5 (18.9 mg) and Fr.5-4-6 (13.1 mg) yielded compounds 8 (1.2 mg) and 4 (6.2 mg) ,respectively. Subfraction Fr.5-3 (788 mg) was fractionated over a Sephadex LH-20column using MeOH as eluent to give five subfractions (Fr.5-3-1 to Fr.5-3-5). SubfractionFr.5-3-2 (47.2 mg) was purified by semi-preparative RP-HPLC using a gradient elution of MeOH/H2O to yield 17 (9.3 mg). Following the same procedure as described for Fr.5-3-2, compounds 2 (2.2 mg) 3 (16.7 mg) and 5 (2.4 mg) were obtained from Fr.5-3-3 (71.5 mg) while compounds 7 (1.8 mg), 9 (1.5 mg), 10 (1.4 mg) and 13 (1.6 mg) were obtained from Fr.5-3-4 (53.7 mg).
Lactone acid n-butyl ester (1): brown amorphous solid; [ α ] D 23 +2 (c 0.54, EtOH); UV λmax 207, 217 and 288 nm; ECD {MeCN, λ [nm] (Δε), c = 3.29 × 10⁻⁴ M} 281 (+0.30), 231sh (−0.07); 1H and 13C NMR, see Table 1; ESI-HRMS m/z 327.1206 [M + Na]+ (calcd. for C17H20O5Na, 327.1203).
4-Methoxylactone acid n-butyl ester (2): brown amorphous solid; [ α ] D 23 −4 (c 0.33, EtOH); UV λmax 203, 220 and 292 nm; ECD {MeCN, λ [nm] (Δε), c = 2.47 × 10⁻⁴ M} 263 (−0.32), 222 (−0.76), 210 (+0.16); 1H and 13C NMR, see Table 1; ESI-HRMS m/z 357.1308 [M + Na]+ (calcd. for C18H22O6Na, 357.1309).
Lactone diacid 7-O-n-butyl ester (3): brown amorphous solid; [ α ] D 23 −4 (c 0.53, EtOH); UV λmax 204, 220 and 292 nm; 1H and 13C NMR, see Table 1; ESI-HRMS m/z 371.1101 [M + Na]+ (calcd. for C18H20O7Na, 371.1101).
Lactone diacid (5): brown amorphous solid; [ α ] D 23 −3 (c 0.53, EtOH); UV λmax 219 and 292 nm; ECD {MeCN, λ [nm] (Δε), c = 3.51 × 10⁻⁴ M} 307 (+0.03), 262 (−0.17), 238 (+0.02), 226 (−0.05), 209 (+0.16), 198 (−0.05); LC-MS m/z 315.0 [M + Na]+, 291.3 [M − H].
(3S)-cis-Resorcylide (6): brown amorphous solid; [ α ] D 23 +2 (c 0.10, MeOH); UV λmax 216, 266 and 303 nm; ECD {MeCN, λ [nm] (Δε), c = 3.88 × 10⁻⁴ M} 316 (+2.41), 288sh (−1.37), 262 (−9.35), 230sh (+0.42), 211sh (+5.08), 198 (+6.90); 1H and 13C NMR, see Table 2; ESI-HRMS m/z 291.1233 [M + H]+ (calcd. for C16H19O5, 291.1227).
(3S,7S)-7-Hydroxyresorcylide (7): brown amorphous solid; [ α ] D 23 +18 (c 0.11 MeOH); UV λmax 212, 264 and 302 nm; ECD {MeCN, λ [nm] (Δε), c = 2.27 × 10⁻⁴ M} 306 (+1.11), 286sh (+0.15), 261 (−5.71), 228sh (−1.99), 212 (+5.82); 1H and 13C NMR, see Table 2; ESI-HRMS m/z 309.1333 [M + H]+ (calcd. for C16H21O6, 309.1333).
(3S,7R)-7-Hydroxyresorcylide (8): brown amorphous solid; [ α ] D 23 −8 (c 0.13 MeOH); UV λmax 213, 263 and 302 nm; ECD {MeCN, λ [nm] (Δε), c = 3.24 × 10⁻⁴ M} 308 (+0.28), 285sh (−0.54), 260 (−3.33), 228sh (−1.81), 211 (+5.46); 1H and 13C NMR, see Table 2; ESI-HRMS m/z 309.1327 [M + H]+ (calcd. for C16H21O6, 309.1333).
(3S,7S)-7-Methoxyresorcylide (9): brown amorphous solid; [ α ] D 23 +4 (c 0.13, MeOH); UV λmax 213, 263 and 304 nm; ECD {MeCN, λ [nm] (Δε), c = 3.72 × 10⁻⁴ M} 302 (+1.62), 284sh (+0.78), 260 (−6.22), 228sh (−1.53), 212 (+3.34), 191 (−5.60); 1H and 13C NMR, see Table 3; ESI-HRMS m/z 323.1495 [M + H]+ (calcd. for C17H23O6, 323.1489.
(3S,7R)-7-Methoxyresorcylide (10): brown amorphous solid; [ α ] D 23 −8 (c 0.12, MeOH); UV λmax 213, 265 and 298 nm; ECD {MeCN, λ [nm] (Δε), c = 1.86 × 10⁻⁴ M} 308 (+0.50), 287sh (−0.79), 260 (−5.47), 228sh (−2.77), 211 (+9.62); 1H and 13C NMR, see Table 3; ESI-HRMS m/z 323.1493 [M + H]+ (calcd. for C17H23O6, 323.1489).
(3S,7S)-7-O-n-Butylresorcylide (11): brown amorphous solid; [ α ] D 23 +5 (c 0.20, MeOH); UV λmax 213, 265 and 303 nm; ECD {MeCN, λ [nm] (Δε), c = 1.58 × 10⁻⁴ M} 302 (+6.88), 284sh (+3.87), 261 (−21.91), 230sh (−5.75), 212 (+16.12), 191 (−22.28); 1H and 13C NMR, see Table 4; ESI-HRMS m/z 365.1964 [M + H]+ (calcd. for C20H29O6, 365.1959).
(3S,7R)-7-O-n-Butylresorcylide (12): brown amorphous solid; [ α ] D 23 −17 (c 0.20, MeOH); UV λmax 213, 264 and 303 nm; ECD {MeCN, λ [nm] (Δε), c = 2.88 × 10⁻⁴ M} 309 (+0.23), 287sh (−0.74), 260 (−4.38), 227sh (−2.93), 210 (+8.23); 1H and 13C NMR, see Table 4; ESI-HRMS m/z 365.1961 [M + H]+ (calcd. for C20H29O6, 365.1959).
Talarodilactone A (13): brown amorphous solid; [ α ] D 23 +9 (c 0.21, MeOH); UV λmax 212, 269 and 291 nm; ECD {MeCN, λ [nm] (Δε), c = 1.68 × 10⁻⁴ M} 296sh (+1.05), 284 (+1.11), 260 (−4.22), 226sh (−1.51), 209 (+3.86); 1H and 13C NMR, see Table 6; ESI-HRMS m/z 619.1794 [M + Na]+ (calcd. for C31H32O12Na, 619.1786).
Talarodilactone B (14): brown amorphous solid; [ α ] D 23 −22 (c 0.21, MeOH); UV λmax 212, 268 and 291 nm; ECD {MeCN, λ [nm] (Δε), c = 2.49 × 10⁻⁴ M} 298 (+0.79), 285sh (+0.31), 259 (−5.69), 235 (+0.25), 225 (−4.24), 208 (+11.95); 1H and 13C NMR, see Table 6; ESI-HRMS m/z 605.1625 [M + Na]+ (calcd. for C30H30O12Na, 605.1629).
Talumarin A (15): brown amorphous solid; [ α ] D 23 −18 (c 0.27, CHCl3); UV λmax 220, 258 and 334 nm; ECD {MeCN, λ [nm] (Δε), c = 9.91 × 10⁻⁵ M} 324 (−0.35), 263 (−1.36), 242 (+1.20), 226sh (+0.75), 207 (−5.24); 1H and 13C NMR, see Table 7; ESI-HRMS m/z 275.0528 [M + Na]+ (calcd. for C12H12O6Na, 275.0526).
Talumarin B (16): brown amorphous solid; [ α ] D 23 −32 (c 0.27, CHCl3); UV λmax 221, 258 and 330 nm; ECD {MeCN, λ [nm] (Δε), c = 7.09 × 10⁻⁵ M} 327 (−0.26), 262 (−1.22), 243 (+0.75), 226sh (+0.17), 206 (−3.57); 1H and 13C NMR, see Table 7; ESI-HRMS m/z 331.1151 [M + Na]+ (calcd. for C16H20O6Na, 331.1151).

4.4. Computational Section

Geometry optimizations (B3LYP/6-31G(d) in vacuo, B97D/TZVP [32,33] and CAM-B3LYP/TZVP [34] with PCM solvent model for MeCN), and TDDFT calculations were performed with Gaussian 09 using various functionals (B3LYP, BH&HLYP, CAM-B3LYP and PBE0) and the TZVP basis set [35]. ECD spectra were generated as the sum of Gaussians with 2400 and 3000 cm−1 half-height width (corresponding to c.a. 14 and 17 nm at 240 nm), using dipole-velocity computed rotational strengths [36]. Mixed torsional/low mode conformational searches were carried out by means of the Macromodel 10.8.011 software (New York, NY, USA) using Merck Molecular Force Field (MMFF) with implicit solvent model for CHCl3 applying a 21 kJ/mol energy window [37]. Boltzmann distributions were estimated from the B3LYP, B97D and CAM-B3LYP energies. In the case of the B3LYP/6-31G(d) in vacuo level, ZPVE corrections were applied. The MOLEKEL software package (New York, NY, USA) was used for visualization of the results [38].

4.5. Cytotoxicity Assay

Cytotoxicity against the L5178Y murine lymphoma cell line was tested using the MTT (3-(4,5-dimethylthiazol-2-yl)-2,5-diphenyltetrazolium bromide) method. The depsipeptide kahalalide F was used as positive control [39].

4.6. Antimicrobial Assay

The inoculum was obtained by direct colony suspension preparation. Antibacterial activities against Mycobacterium tuberculosis (H37Rv), Staphylococcus aureus (ATCC 25923) and Acinetobacter baumannii (ATCC BAA-1605) were evaluated by broth micro dilution methodology as stated by the recommendations of the Clinical and Laboratory Standards Institute (CLSI) [40].

Supplementary Materials

The following are available online at www.mdpi.com/1660-3397/15/11/359/s1, ESI-HRMS, 1D and 2D NMR spectra of all the new compounds as well as ECD spectra of compounds 1, 2, 516 and ECD calculations for compound 9.

Acknowledgments

Peter Proksch wants to thank the Manchot Foundation and the DFG (GRK2158) for support. Tibor Kurtán and Attila Mándi thank the National Research, Development and Innovation Office (NKFI K120181 and PD121020) for financial support and the Governmental Information-Technology Development Agency (KIFÜ) for CPU time. We are grateful to Rainer Kalscheuer (University of Duesseldorf, Germany) for performing antimicrobial studies. Peter Proksch and Raha S. Orfali acknowledge support by the International Scientific Partnership Program of King Saud University (ISPP# 0065).

Author Contributions

Lisa Küppers and Weaam Ebrahim performed the experiments of extraction and isolation; Mona El-Neketi prepared the manuscriptand contributed to part of the data analysis; Ferhat C. Özkaya and Weaam Ebrahim isolated, purified and identified the fungal strain; Attila Mándi and Tibor Kurtán preformed the ECD calculations; Werner E. G. Müller carried out the cytotoxicity assay; Raha S. Orfali contributed to part of the data analysis; Rudolf Hartmann measured the 1D and 2D NMR spectra; Wenhan Lin and Weiguo Song contributed to part of the structure elucidation; Zhen Liu and Peter Proksch supervised the research work and revised the manuscript.

Conflicts of Interest

The authors declare no conflict of interest.

References

  1. Hong, J.H.; Jang, S.; Heo, Y.M.; Min, M.; Lee, H.; Lee, Y.M.; Lee, H.; Kim, J.J. Investigation of marine-derived fungal diversity and their exploitable biological activities. Mar. Drugs 2015, 13, 4137–4155. [Google Scholar] [CrossRef] [PubMed]
  2. Mayer, A.M.S.; Glaser, K.B.; Cuevas, C.; Jacobs, R.S.; Kem, W.; Little, R.D.; McIntosh, J.M.; Newman, D.J.; Potts, B.C.; Shuster, D.E. The odyssey of marine pharmaceuticals: A current pipeline perspective. Trends Pharmacol. Sci. 2010, 31, 255–265. [Google Scholar] [CrossRef] [PubMed]
  3. Ebada, S.; Proksch, P. Marine-Derived Fungal Metabolites. In Springer Handbook of Marine Biotechnology; Springer: Berlin/Heidelberg, Germany, 2015; pp. 759–788. [Google Scholar]
  4. Ebrahim, W.; El-Neketi, M.; Lewald, L.I.; Orfali, R.S.; Lin, W.; Rehberg, N.; Kalscheuer, R.; Daletos, G.; Proksch, P. Metabolites from the fungal endophyte Aspergillus austroafricanus in axenic culture and in fungal-bacterial mixed cultures. J. Nat. Prod. 2016, 79, 914–922. [Google Scholar] [CrossRef] [PubMed]
  5. Liu, S.; Dai, H.; Makhloufi, G.; Heering, C.; Janiak, C.; Hartmann, R.; Mándi, A.; Kurtán, T.; Müller, W.E.G.; Kassack, M.U.; et al. Cytotoxic 14-membered macrolides from a mangrove-derived endophytic fungus, Pestalotiopsis microspora. J. Nat. Prod. 2016, 79, 2332–2340. [Google Scholar] [CrossRef] [PubMed]
  6. Elnaggar, M.S.; Ebada, S.S.; Ashour, M.L.; Ebrahim, W.; Müller, W.E.G.; Mándi, A.; Kurtán, T.; Singab, A.; Lin, W.; Liu, Z.; et al. Xanthones and sesquiterpene derivatives from a marine-derived fungus Scopulariopsis sp. Tetrahedron 2016, 72, 2411–2419. [Google Scholar] [CrossRef]
  7. Elnaggar, M.S.; Ebada, S.S.; Ashour, M.L.; Ebrahim, W.; Singab, A.; Lin, W.; Liu, Z.; Proksch, P. Two new triterpenoids and a new naphthoquinone derivative isolated from a hard coral-derived fungus Scopulariopsis sp. Fitoterapia 2017, 116, 126–130. [Google Scholar] [CrossRef] [PubMed]
  8. Dong, Y.; Lin, J.; Lu, X.; Zheng, Z.; Ren, X.; Zhang, H.; He, J.; Yang, J. Cathepsin B inhibitory tetraene lactones from the fungus Talaromyces wortmannii. Helv. Chim. Acta 2009, 92, 567–574. [Google Scholar] [CrossRef]
  9. Liu, F.; Cai, X.L.; Yang, H.; Xia, X.K.; Guo, Z.Y.; Yuan, J.; Li, M.F.; She, Z.G.; Lin, Y.C. The bioactive metabolites of the mangrove endophytic fungus Talaromyces sp. ZH-154 isolated from Kandelia candel (L.) Druce. Planta Med. 2010, 76, 185–189. [Google Scholar] [CrossRef] [PubMed]
  10. Bara, R.; Aly, A.H.; Pretsch, A.; Wray, V.; Wang, B.; Proksch, P.; Debbab, A. Antibiotically active metabolites from Talaromyces wortmannii, an endophyte of Aloe vera. J. Antibiot. 2013, 66, 491–493. [Google Scholar] [CrossRef] [PubMed]
  11. Zhai, M.M.; Li, J.; Jiang, C.X.; Shi, Y.P.; Di, D.L.; Crews, P.; Wu, Q.X. The bioactive secondary metabolites from Talaromyces species. Nat. Prod. Bioprospect. 2016, 6, 1–24. [Google Scholar] [CrossRef] [PubMed]
  12. Yilmaz, N.; Visagie, C.M.; Houbraken, J.; Frisvad, J.C.; Samson, R.A. Polyphasic taxonomy of the genus Talaromyces. Stud. Mycol. 2014, 78, 175–341. [Google Scholar] [CrossRef] [PubMed] [Green Version]
  13. Ghisalberti, E.L.; Hargreaves, J.R.; McConville, E. Butenolides from a cultured microfungus, Acremonium sp. Nat. Prod. Res. 2004, 18, 105–109. [Google Scholar] [CrossRef] [PubMed]
  14. Ancheeva, E.; Küppers, L.; Akone, S.H.; Ebrahim, W.; Liu, Z.; Mándi, A.; Kurtán, T.; Lin, W.; Orfali, R.; Rehberg, N.; et al. Expanding the metabolic profile of the fungus Chaetomium sp. through co-culture with autoclaved Pseudomonas aeruginosa. Eur. J. Org. Chem. 2017, 2017, 3256–3264. [Google Scholar] [CrossRef]
  15. Pescitelli, G.; Bruhn, T. Good computational practice in the assignment of absolute configurations by TDDFT calculations of ECD spectra. Chirality 2016, 28, 466–474. [Google Scholar] [CrossRef] [PubMed]
  16. Mándi, A.; Mudianta, I.W.; Kurtán, T.; Garson, M.J. Absolute configuration and conformational study of psammaplysins A and B from the Balinese marine sponge Aplysinella strongylata. J. Nat. Prod. 2015, 78, 2051–2056. [Google Scholar] [CrossRef] [PubMed]
  17. Barrow, C.J. New macrocyclic lactones from a Penicillium species. J. Nat. Prod. 1997, 60, 1023–1025. [Google Scholar] [CrossRef]
  18. Xu, Y.; Zhou, T.; Espinosa-Artiles, P.; Tang, Y.; Zhan, J.; Molnár, I. Insights into the biosynthesis of 12-membered resorcylic acid lactones from heterologous production in Saccharomyces cerevisiae. ACS Chem. Biol. 2014, 9, 1119–1127. [Google Scholar] [CrossRef] [PubMed]
  19. Zhang, P.; Meng, L.H.; Mándi, A.; Li, X.M.; Kurtán, T.; Wang, B.G. Structure, absolute configuration, and conformational study of resorcylic acid derivatives and related congeners from the fungus Penicillium brocae. RSC Adv. 2015, 5, 39870–39877. [Google Scholar] [CrossRef]
  20. An, Y.N.; Zhang, X.; Zhang, T.Y.; Zhang, M.Y.; Zhang, Q.; Deng, X.Y.; Zhao, F.; Zhu, L.J.; Wang, G.; Zhang, J.; et al. Penicimenolides A–F, resorcylic acid lactones from Penicillium sp., isolated from the rhizosphere soil of Panax notoginseng. Sci. Rep. 2016, 6, 27396–27409. [Google Scholar] [CrossRef] [PubMed]
  21. Kerti, G.; Kurtán, T.; Illyés, T.Z.; Kövér, K.E.; Sólyom, S.; Pescitelli, G.; Fujioka, N.; Berova, N.; Antus, S. Enantioselective synthesis of 3-methylisochromans and determination of their absolute configurations by circular dichroism. Eur. J. Org. Chem. 2007, 296–305. [Google Scholar] [CrossRef]
  22. Krohn, K.; Kock, I.; Elsässer, B.; Flörke, U.; Schulz, B.; Dräger, S.; Pescitelli, G.; Antus, S.; Kurtán, T. Bioactive natural products from the endophytic fungus Ascochyta sp. from meliotus dentatus—Configurational assignment by solid-state CD and TDDFT calculations. Eur. J. Org. Chem. 2007, 1123–1129. [Google Scholar]
  23. Hussain, H.; Akhtar, N.; Dräger, S.; Schulz, B.; Pescitelli, G.; Salvadori, P.; Antus, S.; Kurtán, T.; Krohn, K. New bioactive 2,3-epoxycyclohexenes and isocoumarins from the endophytic fungus Phomopsis sp. from Laurus azorica. Eur. J. Org. Chem. 2009, 749–756. [Google Scholar] [CrossRef]
  24. Li, S.; Wei, M.; Chen, G.; Lin, Y. Two new dihydroisocoumarins from the endophytic fungus Aspergillus sp. collected from the South China Sea. Chem. Nat. Compd. 2012, 48, 371–373. [Google Scholar] [CrossRef]
  25. Yadav, J.S.; Mishra, A.K.; Dachavaram, S.S.; Kumar, S.G.; Das, S. First enantioselective total synthesis of penicimarin B, aspergillumarins A and B. Tetrahedron Lett. 2014, 55, 2921–2923. [Google Scholar] [CrossRef]
  26. El Amrani, M.; Debbab, A.; Aly, A.H.; Wray, V.; Dobretsov, S.; Müller, W.E.G.; Lin, W.; Lai, D.; Proksch, P. Farinomalein derivatives from an unidentified endophytic fungus isolated from the mangrove plant Avicennia marina. Tetrahedron Lett. 2012, 53, 6721–6724. [Google Scholar] [CrossRef]
  27. Ebrahim, W.; Aly, A.H.; Mándi, A.; Totzke, F.; Kubbutat, M.H.G.; Wray, V.; Lin, W.H.; Dai, H.; Proksch, P.; Kurtán, T.; et al. Decalactone derivatives from Corynespora cassiicola, an endophytic fungus of the mangrove plant Laguncularia racemosa. Eur. J. Org. Chem. 2012, 2012, 3476–3484. [Google Scholar] [CrossRef]
  28. Zhuravleva, O.I.; Sobolevskaya, M.P.; Leshchenko, E.V.; Kirichuk, N.N.; Denisenko, V.A.; Dmitrenok, P.S.; Dyshlovoy, S.A.; Zakharenko, A.M.; Kim, N.Y.; Afiyatullov, S.S. Meroterpenoids from the alga-derived fungi Penicillium thomii Maire and Penicillium lividum Westling. J. Nat. Prod. 2014, 77, 1390–1395. [Google Scholar] [CrossRef] [PubMed]
  29. Chen, J.; Chen, J.J.; Yang, L.Q.; Hua, L.; Gao, K. Labdanediterpenoids and shikimic acid derivatives from Araucaria cunninghamii. Planta Med. 2011, 77, 485–488. [Google Scholar] [CrossRef] [PubMed]
  30. Dar, A.A.; Dangroo, N.A.; Raina, A.; Qayum, A.; Singh, S.; Kumar, A.; Sangwan, P.L. Biologically active xanthones from Codonopsis ovate. Phytochemistry 2016, 132, 102–108. [Google Scholar] [CrossRef] [PubMed]
  31. Kjer, J.; Debbab, A.; Aly, A.H.; Proksch, P. Methods for isolation of marine-derived endophytic fungi and their bioactive secondary products. Nat. Protoc. 2010, 5, 479–490. [Google Scholar] [CrossRef] [PubMed]
  32. Grimme, S. Semiempirical GGA-type density functional constructed with a long-range dispersion correction. J. Comput. Chem. 2006, 27, 1787–1799. [Google Scholar] [CrossRef] [PubMed]
  33. Sun, P.; Xu, D.X.; Mándi, A.; Kurtán, T.; Li, T.J.; Schulz, B.; Zhang, W. Structure, absolute configuration, and conformational study of 12-membered macrolides from the fungus Dendrodochium sp. associated with the sea cucumber Holothuria nobilis Selenka. J. Org. Chem. 2013, 78, 7030–7047. [Google Scholar] [CrossRef] [PubMed]
  34. Yanai, T.; Tew, D.P.; Handy, N.C. A new hybrid exchange–correlation functional using the Coulomb-attenuating method (CAM-B3LYP). Chem. Phys. Lett. 2004, 393, 51–57. [Google Scholar] [CrossRef]
  35. Frisch, M.J.; Trucks, G.W.; Schlegel, H.B.; Scuseria, G.E.; Robb, M.A.; Cheeseman, J.R.; Scalmani, G.; Barone, V.; Mennucci, B.; Petersson, G.A.; et al. Gaussian 09, revision B.01; Gaussian, Inc.: Wallingford, CT, USA, 2010.
  36. Stephens, P.J.; Harada, N. ECD cotton effect approximated by the Gaussian curve and other methods. Chirality 2010, 22, 229–233. [Google Scholar] [CrossRef] [PubMed]
  37. MacroModel. Schrödinger, LLC, 2015. Available online: http://www.schrodinger.com/ (accessed on 31 December 2013).
  38. Varetto, U. MOLEKEL, version 5.4; Swiss National Supercomputing Centre: Manno, Switzerland, 2009.
  39. Ashour, M.; Edrada, R.; Ebel, R.; Wray, V.; Wätjen, W.; Padmakumar, K.; Müller, W.E.G.; Lin, W.H.; Proksch, P. Kahalalide derivatives from the Indian sacoglossan mollusk Elysia grandifolia. J. Nat. Prod. 2006, 69, 1547–1553. [Google Scholar] [CrossRef] [PubMed]
  40. Clinical and Laboratory Standards Institute (CLSI). Methods for Dilution Antimicrobial Susceptibility Tests for Bacteria That Grow Aerobically: Approved Standard, 9th ed.; Clinical and Laboratory Standards Institute: Wayne, PA, USA, 2012. [Google Scholar]
Figure 1. Structures of the compounds isolated from Talaromyces rugulosus.
Marinedrugs 15 00359 g001
Figure 2. (a) structures and populations of the low-energy B3LYP/6-31G(d) in vacuo conformers (≥2%) of (R)-5; (b) experimental ECD spectrum of 5 in MeCN compared with the Boltzmann-weighted BH&HLYP/TZVP ECD spectrum of (R)-5 computed for the B3LYP/6-31G(d) in vacuo conformers. Bars represent the rotational strength values of the lowest-energy conformer.
Marinedrugs 15 00359 g002
Figure 3. (a) structures and populations of the low-energy B3LYP/6-31G(d) in vacuo conformers (≥2%) of (R)-6; (b) experimental ECD spectrum of 6 in MeCN compared with the Boltzmann-weighted PBE0/TZVP ECD spectrum of (R)-6 computed for the B3LYP/6-31G(d) in vacuo conformers. Bars represent the rotational strength values of the lowest-energy conformer.
Marinedrugs 15 00359 g003
Figure 4. (a) structures and populations of the low-energy CAM-B3LYP/TZVP PCM/MeCN conformers (≥2%) of the truncated model compound of (R)-16; (b) experimental ECD spectra of 15 and 16 in MeCN compared with the Boltzmann-weighted PBE0/TZVP PCM/MeCN ECD spectrum of the truncated model compound of (R)-16 computed for the CAM-B3LYP/TZVP PCM/MeCN conformers. Bars represent the rotational strength values of the lowest-energy conformer.
Marinedrugs 15 00359 g004
Table 1. 1H and 13C NMR (Nuclear Magnetic Resonance) Data for compounds 13.
No.1 a2 a3 a
δC, TypeδH (J in Hz)δC, TypeδH (J in Hz)δC, TypeδH (J in Hz)
1171.0, C 168.3, C 170.0, C
2139.5, C 142.7, C 141.6, C
3130.6, C 124.6, C 128.7, C
479.3, CH5.52, dd (8.1, 2.2)109.8, C 86.8, C
530.5, CH22.45, m34.6, CH22.54, ddd
(14.5, 7.9, 6.5)
30.0, CH22.68, ddd
(15.2, 8.7, 6.4)
1.75, m 2.18, ddd
(14.5, 7.9, 6.5)
2.48, ddd
(15.2, 8.7, 6.4)
630.0, CH22.44, m29.4, CH22.42, ddd
(16.0, 7.9, 6.5)
29.1, CH22.25, ddd
(15.8, 8.7, 6.4)
2.31, ddd
(16.0, 7.9, 6.5)
2.15, ddd
(15.8, 8.7, 6.4)
7174.6, C 174.5, C 174.2, C
8131.9, C 131.3, C 131.3, C
9, 13128.6, CH7.75, d (7.5)128.6, CH7.93, d (7.5)128.6, CH7.76, d (7.4)
10, 12129.7, CH7.44, t (7.5)129.8, CH7.45, t (7.5)129.7, CH7.42, t (7.4)
11129.7, CH7.35, t (7.5)129.8, CH7.36, t (7.5)129.9, CH7.35, t (7.4)
14 171.9, C
1′65.6, CH24.08, dt
(10.8, 6.6)
65.6, CH24.02, dt
(10.8, 6.7)
65.7, CH24.00, dt
(10.8, 6.7)
4.04, dt
(10.8, 6.6)
3.97, dt
(10.8, 6.7)
3.94, dt
(10.8, 6.7)
2′31.7, CH21.60, m31.7, CH21.56, m31.6, CH21.54, m
3′20.2, CH21.38, m20.2, CH21.36, m20.1, CH21.34, m
4′14.0, CH30.94, t (7.3)14.0, CH30.93, t (7.3)14.0, CH30.91, t (7.3)
OMe-4 50.7, CH33.18, s
a Recorded at 300 MHz (1H) and 75 MHz (13C) in CD3OD.
Table 2. 1H and 13C NMR Data for compounds 68.
No.6 a7 b8 b
δC, TypeδH (J in Hz)δC, Type cδH (J in Hz)δC, Type cδH (J in Hz)
1172.9, C n.d. d n.d. d
376.9, CH5.03, m75.5, CH4.95, m73.1, CH5.19, m
432.2, CH21.87, m33.1, CH21.91, m32.9, CH21.68, m
1.65, m 1.75, m
526.4, CH21.68, m21.5, CH21.70, m18.9, CH21.58, m
1.43, m
627.6, CH22.52, m36.5, CH21.58, m36.8, CH21.81, m
2.21, m 1.50, m
7139.9, CH5.81, ddd
(11.8, 10.0, 5.7)
66.2, CH4.39, m66.9, CH4.36, m
8132.8, CH6.51, br d (11.8)53.5, CH23.03, dd
(13.0, 3.1)
51.3, CH22.94, dd
(15.4, 10.1)
2.42, dd
(13.0, 10.3)
2.61, dd
(15.4, 1.6)
9204.7, C 206.3, C 205.2, C
1051.5, CH24.58, d (18.4)50.2, CH24.84, d (18.4)52.3, CH24.59, d (18.5)
3.65, d (18.4) 3.75, d (18.4) 3.90, d (18.5)
11140.1, C 140.0, C 140.2, C
12113.9, CH6.16, d (2.5)113.5, CH6.23, d (2.5)113.2, CH6.23, d (2.5)
13164.1, C 162.7, C 162.9, C
14103.0, CH6.26, d (2.5)102.2, CH6.31, d (2.5)102.3, CH6.32, d (2.5)
15167.1, C 165.5, C 166.4, C
16106.2, C 106.3, C 105.6, C
1721.5, CH31.28, d (6.2)20.9, CH31.31, d (6.1)18.2, CH31.29, d (6.4)
7-OMe
a Recorded at 600 MHz (1H) and 150 MHz (13C) in CD3OD. b Recorded at 600 MHz (1H) and 150 MHz (13C) in CD3COCD3. c Data extracted from HSQC (Heteronuclear Single Quantum Correlation) and HMBC. d n.d. = not detected.
Table 3. 1H and 13C NMR Data for compounds 9 and 10.
No.9 a10 a
δC, TypeδH (J in Hz)δC, TypeδH (J in Hz)
1172.5, C 172.3, C
376.1, CH4.93, m73.8, CH5.19, m
433.8, CH21.82, m33.5, CH21.63, m
1.75, m
521.7, CH21.68, m19.0, CH21.58, m
1.40, m
634.4, CH21.69, m34.0, CH21.87, m
1.50, m 1.49, m
777.1, CH3.95, m78.2, CH3.90, m
849.6, CH23.10, dd (13.3, 2.8)47.4, CH22.89, dd (15.7, 9.7)
2.40, dd (13.3, 10.2) 2.71, dd (15.7, 1.0)
9208.8, C 208.1, C
1051.0, CH24.68, d (18.7)53.2, CH24.63, d (18.8)
3.80, d (18.7) 3.84, d (18.8)
11139.6, C 139.9, C
12113.9, CH6.14, d (2.5)113.7, CH6.13, d (2.5)
13163.7, C 163.9, C
14102.9, CH6.25, d (2.5)103.0, CH6.25, d (2.5)
15166.0, C 166.9, C
16107.0, C 106.4, C
1721.1, CH31.32, d (6.1)18.5, CH31.29, d (6.4)
7-OMe56.7, CH33.42, s56.5, CH33.34, s
a Recorded at 600 MHz (1H) and 150 MHz (13C) in CD3OD.
Table 4. 1H and 13C NMR Data for compounds 11 and 12.
No.11 a12 b
δC, TypeδH (J in Hz)δC, TypeδH (J in Hz)
1172.5, C 172.3, C
376.2, CH4.94, m73.9, CH5.19, m
433.8, CH21.80, m33.6, CH21.64, m
1.75, m
521.9, CH21.69, m19.1, CH21.58, m
1.40, m
634.6, CH21.66, m34.3, CH21.84, m
1.50, m 1.51, m
775.4, CH4.04, m76.5, CH3.98, m
850.3, CH23.09, dd (13.2, 3.0)48.2, CH22.90, dd (15.6, 9.8)
2.40, dd (13.2, 10.3) 2.69, dd (15.6, 1.0)
9208.9, C 208.3, C
1050.9, CH24.69, d (18.7)53.1, CH24.61, d (18.8)
3.78, d (18.7) 3.84, d (18.8)
11139.6, C 139.9, C
12114.0, CH6.13, d (2.5)113.8, CH6.12, d (2.5)
13163.7, C 163.9, C
14102.9, CH6.25, d (2.5)103.1, CH6.25, d (2.5)
15166.0, C 166.8, C
16107.0, C 106.5, C
1721.1, CH31.31, d (6.1)18.6, CH31.29, d (6.4)
1′69.7, CH23.63, dt (9.2, 6.4)69.5, CH23.51, dt (9.3, 6.5)
3.51, dt (9.2, 6.4) 3.45, dt (9.3, 6.5)
2′33.2, CH21.56, m33.2, CH21.53, m
3′20.4, CH21.42, m20.4, CH21.38, m
4′14.3, CH30.95, t (7.3)14.2, CH30.93, t (7.3)
a Recorded at 300 MHz (1H) and 75 MHz (13C) in CD3OD. b Recorded at 500 MHz (1H) and 125 MHz (13C) in CD3OD.
Table 5. Key differences of NMR Data for compounds 714.
Compounds7911138101214
3J7,8a (Hz)3.12.83.03.110.19.69.810.4
3J7,8b (Hz)10.310.210.310.41.61.01.0- a
C-375.576.176.276.173.173.873.974.0
H-34.954.934.944.935.195.195.195.13
C-1720.921.121.120.918.218.518.618.9
a Signals overlapped.
Table 6. 1H and 13C NMR Data for compounds 13 and 14.
No.13 a14 a
δC, TypeδH (J in Hz)δC, TypeδH (J in Hz)
1172.4, C 172.2, C
376.1, CH4.93, m74.0, CH5.13, m
433.4, CH21.75, m33.8, CH21.66, m
1.61, m
521.2, CH21.39, m19.0, CH21.52, m
1.31, m
633.2, CH21.57, m32.8, CH21.84, m
1.56, m
772.9, CH5.54, m74.2, CH5.53, m
849.2, CH22.94, dd (13.3, 3.1)46.9, CH23.07, dd (15.8, 10.4)
2.58, dd (13.3, 10.4) 2.49, d (15.8)
9206.6, C 206.1, C
1050.8, CH24.67, d (18.8)52.8, CH24.52, d (18.8)
3.78, d (18.8) 3.73, d (18.8)
11139.3, C 139.6, C
12114.1, CH6.14, d (2.4)113.8, CH6.07, d (2.5)
13163.8, C 163.9, C
14103.0, CH6.26, d (2.4)103.0, CH6.24, d (2.5)
15166.2, C 166.8, C
16106.7, C 106.2, C
1720.9, CH31.28, d (6.2)18.9, CH31.27, d (6.4)
1′169.8, C 169.7, C
2′141.9, C 141.8, C
3′128.1, C 128.6, C
4′86.6, C 86.6, CH
5′30.1, CH22.77, ddd (15.2, 8.6, 6.4)30.0, CH22.72, ddd (15.3, 8.7, 6.5)
2.59, ddd (15.2, 8.6, 6.4) 2.49, ddd (15.3, 8.7, 6.5)
6′28.7, CH22.29, ddd (16.0, 8.6, 6.4)28.7, CH22.23, ddd (15.9, 8.7, 6.5)
2.22, ddd (16.0, 8.6, 6.4) 2.14, ddd (15.9, 8.7, 6.5)
7′174.4, C 175.9, C
8′131.0, C 131.0, C
9′, 13′128.6, CH7.73, d (7.7)128.5, CH7.70, d (7.4)
10′, 12′129.9, CH7.44, t (7.7)129.9, CH7.44, t (7.4)
11′130.1, CH7.37, t (7.7)130.1, CH7.37, t (7.4)
14′169.9, C 169.5, C
OMe52.3, C3.58, s
a Recorded at 700 MHz (1H) and 175 MHz (13C) in CD3OD.
Table 7. 1H and 13C NMR Data for compounds 15 and 16.
No.15 a16 b
δC, TypeδH (J in Hz)δC, TypeδH (J in Hz)
1169.6, C 169.5, C
379.3, CH4.63, m80.8, CH4.63, m
431.2, CH22.94, dd (16.4, 3.6)32.7, CH22.96, dd (16.1, 4.1)
2.83, dd (16.4, 10.9) 2.87, dd (16.1, 10.4)
5117.5, CH6.63, d (8.0)118.6, CH6.65, d (8.0)
6121.6, CH7.01, d (8.0)122.4, CH7.01, d (8.0)
7144.4, C 145.7, C
8149.9, C 151.0, C
9108.4, C 109.4, C
10129.1, C 130.7, C
1129.3, CH21.96, m30.7, CH22.09, m
1229.1, CH22.42, m30.3, CH22.58, m
13173.8, C 174.4, C
1′ 65.3, CH24.11, t (6.6)
2′ 31.6, CH21.63, m
3′ 19.9, CH21.40, m
4′ 13.7, CH30.95, t (7.4)
OH-7 9.33, s
OH-8 10.82, s
OH-13 12.21, s
a Recorded at 300 MHz (1H) and 75 MHz (13C) in DMSO-d6. b Recorded at 300 MHz (1H) and 75 MHz (13C) in CD3OD.

