
Classification of Initial Stages of Alzheimer’s Disease through Pet Neuroimaging Modality and Deep Learning: Quantifying the Impact of Image Filtering Approaches

 ,
,  , , and
Abstract
:1. Introduction
2. Datasets Description
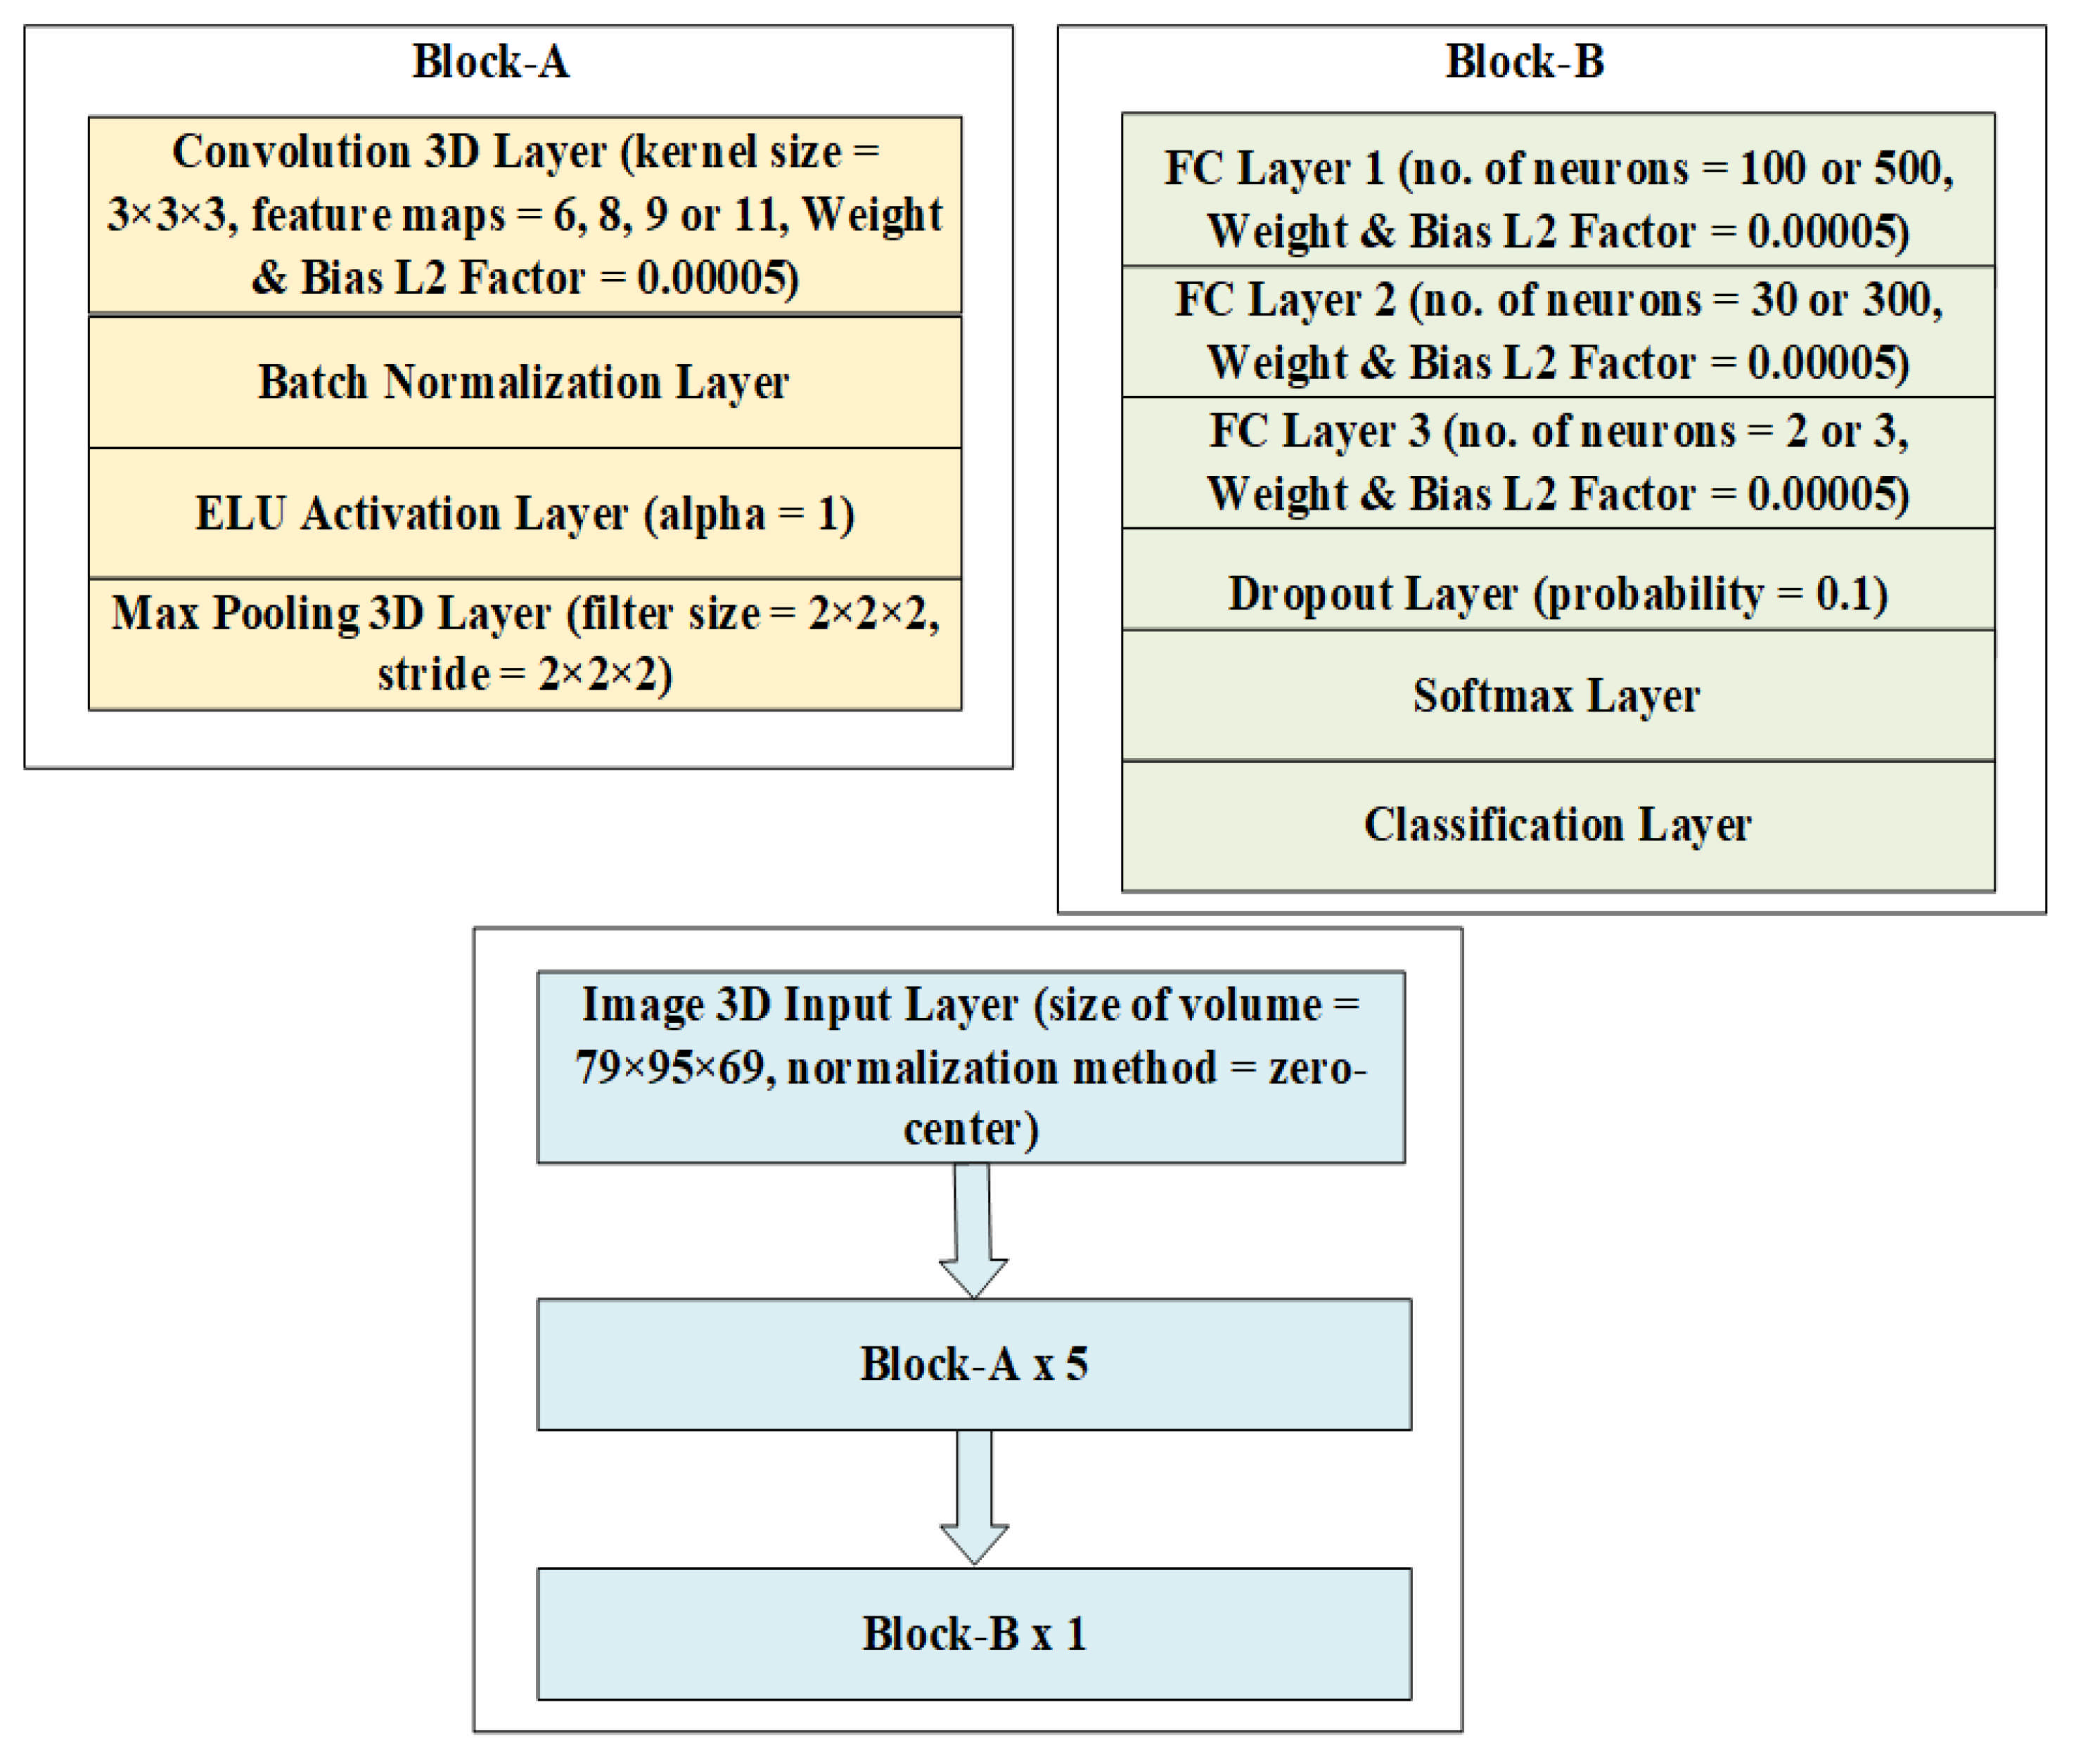
3. Methodology
4. Experiments and Results
5. Discussion
6. Conclusions
Author Contributions
Funding
Institutional Review Board Statement
Informed Consent Statement
Data Availability Statement
Conflicts of Interest
References
- Liu, F.; Wee, C.-Y.; Chen, H.; Shen, D. Inter-Modality Relationship Constrained Multi-modality Multi-Task Feature Selection for Alzheimer’s Disease and Mild Cognitive Impairment Identification. Neuroimage 2014, 84, 466–475. [Google Scholar] [CrossRef] [Green Version]
- Bruna, J.; Mallat, S. Invariant Scattering Convolution Networks. Comput. Vis. Pattern Recognit. 2012, 35, 1872–1886. [Google Scholar] [CrossRef] [PubMed] [Green Version]
- Schuff, N.; Woerner, N.; Boreta, L.; Kornfield, T.; Shaw, L.M.; Trojanowski, J.Q.; Thompson, P.M.; Jack, C.R.; Weiner, M.W. MRI of hippocampal volume loss in early Alzheimer’s disease in relation to ApoE genotype and biomarkers. Brain 2009, 132, 1067–1077. [Google Scholar] [CrossRef] [PubMed] [Green Version]
- Wang, H.; Nie, F.; Huang, H.; Kim, S.; Nho, K.; Risacher, S.L.; Saykin, A.J.; Shen, L. Identifying quantitative trait loci via group-sparse multitask regression and feature selection: An imaging genetics study of the ADNI cohort. Bioinformatics 2012, 28, 229–237. [Google Scholar] [CrossRef] [Green Version]
- Moradi, E.; Pepe, A.; Gaser, C.; Huttunen, H.; Tohka, J. Machine learning framework for early MRI-based Alzheimer’s conversion prediction in MCI subjects. Neuroimage 2015, 104, 398–412. [Google Scholar] [CrossRef] [Green Version]
- Jagust, W. Imaging the evolution and pathophysiology of Alzheimer disease. Nat. Rev. Neurosci. 2018, 19, 687–700. [Google Scholar] [CrossRef] [PubMed]
- Cheng, B.; Liu, M.; Shen, D.; Li, Z.; Zhang, D.; the Alzheimer’s Disease Neuroimaging Initiative. Multi-Domain Transfer Learning for Early Diagnosis of Alzheimer’s Disease. Neuroinformatics 2017, 15, 115–132. [Google Scholar] [CrossRef] [Green Version]
- Ye, J.; Farnum, M.; Yang, E.; Verbeeck, R.; Lobanov, V.; Raghavan, N.; Novak, G.; Dibernardo, A.; Narayan, V.A. Sparse learning and stability selection for predicting MCI to AD conversion using baseline ADNI data. BMC Neurol. 2012, 12, 46. [Google Scholar] [CrossRef] [Green Version]
- Wolz, R.; Julkunen, V.; Koikkalainen, J.; Niskanen, E.; Zhang, D.P.; Rueckert, D.; Soininen, H.; Lötjönen, J.; the Alzheimer’s Disease Neuroimaging Initiative. Multi-Method Analysis of MRI Images in Early Diagnostics of Alzheimer’s Disease. PLoS ONE 2011, 6, e25446. [Google Scholar] [CrossRef] [Green Version]
- Adeli, E.; Thung, K.-H.; An, L.; Wu, G.; Shi, F.; Wang, T.; Shen, D. Semi-Supervised Discriminative Classification Robust to Sample-Outliers and Feature-Noises. IEEE Trans. Pattern Anal. Mach. Intell. 2019, 41, 515–522. [Google Scholar] [CrossRef] [PubMed]
- Matthews, K.A.; Xu, W.; Gaglioti, A.H.; Holt, J.B.; Croft, J.B.; Mack, D.; McGuire, L.C. Racial and ethnic estimates of Alzheimers’ disease and related dementias in the United States (2015–2060) in adults aged 65 years. Alzheimers Dement. 2019, 15, 17–24. [Google Scholar] [CrossRef]
- Suk, H.-I.; Lee, S.-W.; Shen, D.; The Alzheimer’s Disease Neuroimaging Initiative. Latent feature representation with stacked auto-encoder for AD/MCI diagnosis. Brain Struct. Funct. 2015, 220, 841–859. [Google Scholar] [CrossRef] [PubMed]
- Esalvatore, C.; Ecerasa, A.; Battista, P.; Egilardi, M.C.; Equattrone, A.; Ecastiglioni, I. Magnetic resonance imaging biomarkers for the early diagnosis of Alzheimer’s disease: A machine learning approach. Front. Neurosci. 2015, 9, 307. [Google Scholar]
- Zhang, D.; Wang, Y.; Zhou, L.; Yuan, H.; Shen, D. Multimodal Classification of Alzheimer’s Disease and Mild Cognitive Impairment. Neuroimage 2011, 55, 856–867. [Google Scholar] [CrossRef] [Green Version]
- Lu, D.; Initiative, A.D.N.; Popuri, K.; Ding, G.W.; Balachandar, R.; Beg, M.F. Multimodal and Multiscale Deep Neural Networks for the Early Diagnosis of Alzheimer’s Disease using structural MR and FDG-PET images. Sci. Rep. 2018, 8, 5697. [Google Scholar] [CrossRef] [Green Version]
- Arbabshirani, M.R.; Plis, S.; Sui, J.; Calhoun, V.D. Single Subject Prediction of Brain Disorders in Neuroimaging: Promises and Pitfalls. Neuroimage 2017, 145, 137–165. [Google Scholar] [CrossRef] [PubMed] [Green Version]
- Vieira, S.; Pinaya, W.H.L.; Mechelli, A. Using deep learning to investigate the neuroimaging correlates of psychiatric and neurological disorders: Methods and applications. Neurosci. Biobehav. Rev. 2017, 74, 58–75. [Google Scholar] [CrossRef] [Green Version]
- Zeiler, M.D.; Fergus, R. Visualizing and Understanding Convolutional Networks. Comput. Vis. Pattern Recognit. 2013, arXiv:1311.2901v3. [Google Scholar]
- Wang, H.; Nie, F.; Huang, H.; Risacher, S.L.; Saykin, A.J.; Shen, L.; the Alzheimer’s Disease Neuroimaging Initiative. Identifying disease sensitive and quantitative trait relevant biomarkers from multidimensional heterogeneous imaging genetics data via sparse multimodal multitask learning. Bioinformatics 2012, 28, i127–i136. [Google Scholar] [CrossRef] [PubMed]
- Liu, X.; Tosun, D.; Weiner, M.W.; Schuff, N. Locally Linear Embedding (LLE) for MRI based Alzheimer’s Disease Classification. Neuroimage 2013, 83, 148–157. [Google Scholar] [CrossRef] [PubMed] [Green Version]
- Huang, M.; Initiative, T.A.D.N.; Yang, W.; Feng, Q.; Chen, W.; Weiner, M.W. Longitudinal measurement and hierarchical classification framework for the prediction of Alzheimer’s disease. Sci. Rep. 2017, 7, 39880. [Google Scholar] [CrossRef] [Green Version]
- Risacher, S.L.; Shen, L.; West, J.D.; Kim, S.; McDonald, B.C.; Beckett, L.A.; Harvey, D.J.; Jack, C.R.; Weiner, M.W.; Saykin, A.J. Longitudinal MRI atrophy biomarkers: Relationship to conversion in the ADNI cohort. Neurobiol. Aging 2010, 31, 1401–1418. [Google Scholar] [CrossRef] [Green Version]
- Liu, S.; Liu, S.; Cai, W.; Che, H.; Pujol, S.; Kikinis, R.; Feng, D.; Fulham, M.J. Multi-Modal Neuroimaging Feature Learning for Multi-Class Diagnosis of Alzheimer’s Disease. IEEE Trans. Biomed. Eng. 2015, 62, 1132–1140. [Google Scholar] [CrossRef] [PubMed] [Green Version]
- Liu, M.; Cheng, D.; Wang, K.; Wang, Y.; the Alzheimer’s Disease Neuroimaging Initiative. Multi-Modality Cascaded Convolutional Neural Networks for Alzheimer’s Disease Diagnosis. Neuroinformatics 2018, 16, 295–308. [Google Scholar] [CrossRef] [PubMed]
- Lu, D.; Popuri, K.; Ding, G.W.; Balachandar, R.; Beg, M.F. Multiscale deep neural network based analysis of FDG-PET images for the early diagnosis of Alzheimer’s disease. Med Image Anal. 2018, 46, 26–34. [Google Scholar] [CrossRef]
- Wolz, R.; Aljabar, P.; Hajnal, J.V.; Lötjönen, J.; Rueckert, D. Nonlinear dimensionality reduction combining MR imaging with non-imaging information. Med. Image Anal. 2012, 16, 819–830. [Google Scholar] [CrossRef]
- Payan, A.; Montana, G. Predicting Alzheimer’s disease: A neuroimaging study with 3D convolutional neural networks. arXiv 2015, arXiv:1502.02506v1. [Google Scholar]
- Choi, H.; Jin, K.H. Predicting cognitive decline with deep learning of brain metabolism and amyloid imaging. Behav. Brain Res. 2018, 344, 103–109. [Google Scholar] [CrossRef] [Green Version]
- Hojjati, S.H.; Ebrahimzadeh, A.; Khazaee, A.; Babajani-Feremi, A. Predicting conversion from MCI to AD using resting-state fMRI, graph theoretical approach and SVM. J. Neurosci. Methods 2017, 282, 69–80. [Google Scholar] [CrossRef] [Green Version]
- Korolev, I.O.; Symonds, L.L.; Bozoki, A.C. Predicting Progression from Mild Cognitive Impairment to Alzheimer’s Dementia Using Clinical, MRI, and Plasma Biomarkers via Probabilistic Pattern Classification. PLoS ONE 2016, 11, e0138866. [Google Scholar] [CrossRef] [Green Version]
- Lu, L.; Wang, H.; Yao, X.; Risacher, S.; Saykin, A.; Shen, L. Predicting progressions of cognitive outcomes via high-order multi-modal multi-task feature learning. In Proceedings of the 2018 IEEE 15th International Symposium on Biomedical Imaging (ISBI 2018), Washington, DC, USA, 4–7 April 2018. [Google Scholar]
- Davatzikos, C.; Bhatt, P.; Shaw, L.M.; Batmanghelich, K.N.; Trojanowski, J.Q. Prediction of mci to ad Conversion, via MRI, CSF Biomarkers, and Pattern Classification. Neurobiol. Aging 2011, 32, 2322.e19–2322.e27. [Google Scholar] [CrossRef] [PubMed] [Green Version]
- Liu, K.; Chen, K.; Yao, L.; Guo, X. Prediction of Mild Cognitive Impairment Conversion Using a Combination of Independent Component Analysis and the Cox Model. Front. Hum. Neurosci. 2017, 11, 33. [Google Scholar] [CrossRef] [PubMed]
- Samper-González, J.; Burgos, N.; Bottani, S.; Fontanella, S.; Lu, P.; Marcoux, A.; Routier, A.; Guillon, J.; Bacci, M.; Wen, J.; et al. Reproducible evaluation of classification methods in Alzheimer’s disease: Framework and application to MRI and PET data. Neuroimage 2018, 183, 504–521. [Google Scholar] [CrossRef] [PubMed] [Green Version]
- Li, S.; Okonkwo, O.; Albert, M.; Wang, M.-C. Variation in Variables that Predict Progression from MCI to AD Dementia over Duration of Follow-up. Am. J. Alzheimers Dis. 2013, 2, 12–28. [Google Scholar] [CrossRef] [PubMed]
- Diederik, K.; Ba, J. Adam: A method for stochastic optimization. arXiv 2014, arXiv:1412.6980. [Google Scholar]
- Cuingnet, R.; Gerardin, E.; Tessieras, J.; Auzias, G.; Lehéricy, S.; Habert, M.O.; Chupin, M.; Benali, H.; Colliot, O.; Alzheimer’s Disease Neuroimaging Initiative. Automatic classification of patients with Alzheimer’s disease from structural MRI: A comparison of ten methods using the ADNI database. Neuroimage 2011, 56, 766–781. [Google Scholar] [CrossRef] [Green Version]
- Basheer, S.; Bhatia, S.; Sakri, S.B. Computational Modeling of Dementia Prediction Using Deep Neural Network: Analysis on OASIS Dataset. IEEE Access 2021, 9, 42449–42462. [Google Scholar] [CrossRef]
- Choi, J.Y.; Lee, B. Combining of Multiple Deep Networks via Ensemble Generalization Loss, Based on MRI Images, for Alzheimer’s Disease Classification. IEEE Signal Process. Lett. 2020, 27, 206–210. [Google Scholar] [CrossRef]
- Zhu, T.; Cao, C.; Wang, Z.; Xu, G.; Qiao, J. Anatomical Landmarks and DAG Network Learning for Alzheimer’s Disease Diagnosis. IEEE Access 2020, 8, 206063–206073. [Google Scholar] [CrossRef]
- Lian, C.; Liu, M.; Zhang, J.; Shen, D. Hierarchical Fully Convolutional Network for Joint Atrophy Localization and Alzheimer’s Disease Diagnosis Using Structural MRI. IEEE Trans. Pattern Anal. Mach. Intell. 2020, 42, 880–893. [Google Scholar] [CrossRef] [PubMed]
- Xia, Z.; Zhou, T.; Mamoon, S.; Lu, J. Recognition of Dementia Biomarkers With Deep Finer-DBN. IEEE Trans. Neural Syst. Rehabil. Eng. 2021, 29, 1926–1935. [Google Scholar] [CrossRef] [PubMed]
- Er, F.; Goularas, D. Predicting the Prognosis of MCI Patients Using Longitudinal MRI Data. IEEE/ACM Trans. Comput. Biol. Bioinform. 2021, 18, 1164–1173. [Google Scholar] [CrossRef] [PubMed]
- Oh, K.; Chung, Y.-C.; Kim, K.W.; Kim, W.-S.; Oh, I.-S. Author correction: Classification and visualization of Alzheimer’s disease using volumetric convolutional neural network and transfer learning. Sci. Rep. 2020, 10, 1–16. [Google Scholar]
- Yagis, E.; Citi, L.; Diciotti, S.; Marzi, C.; Atnafu, S.W.; De Herrera, A.G.S. 3D Convolutional Neural Networks for Diagnosis of Alzheimer’s Disease via Structural MRI. In Proceedings of the 2020 IEEE 33rd International Symposium on Computer-Based Medical Systems (CBMS), Rochester, MN, USA, 28–30 July 2020. [Google Scholar]
- Ieracitano, C.; Mammone, N.; Hussain, A.; Morabito, F.C. A Convolutional Neural Network based self-learning approach for classifying neurodegenerative states from EEG signals in dementia. In Proceedings of the 2020 International Joint Conference on Neural Networks, IJCNN, Glasgow, UK, 19–24 July 2020. [Google Scholar]
- Prajapati, R.; Khatri, U.; Kwon, G.R. An Efficient Deep Neural Network Binary Classifier for Alzheimer’s disease Classification. In Proceedings of the 2021 International Conference on Artificial Intelligence in Information and Communication, ICAIIC, Jeju Island, Korea, 13–16 April 2021. [Google Scholar]
- Tomassini, S.; Falcionelli, N.; Sernani, P.; Müller, H.; Dragoni, A.F. An End-to-End 3D ConvLSTM-based Framework for Early Diagnosis of Alzheimer’s Disease from Full-Resolution Whole-Brain sMRI Scans. In Proceedings of the 2021 IEEE 34th International Symposium on Computer-Based Medical Systems, CBMS, Aveiro, Portugal, 7–9 June 2021. [Google Scholar]
- Rejusha, T.R.; Vipin Kumar, K.S. Artificial MRI Image Generation using Deep Convolutional GAN and its Comparison with other Augmentation Methods. In Proceedings of the 2021 International Conference on Communication, Control and Information Sciences, ICCISc, Idukki, India, 16–18 June 2021. [Google Scholar]
- Yagis, E.; de Herrera, A.G.S.; Citi, L. Convolutional Autoencoder based Deep Learning Approach for Alzheimer’s Disease Diagnosis using Brain MRI. In Proceedings of the 2021 IEEE 34th International Symposium on Computer-Based Medical Systems, CBMS, Aveiro, Portugal, 7–9 June 2021. [Google Scholar]
- Sarasua, I.; Lee, J.; Wachinger, C. Geometric Deep Learning on Anatomical Meshes for the Prediction of Alzheimer’s disease. In Proceedings of the 2021 IEEE 18th International Symposium on Biomedical Imaging, ISBI, Nice, France, 13–16 April 2021. [Google Scholar]
- Fedorov, A.; Wu, L.; Sylvain, T.; Luck, M.; DeRamus, T.P.; Bleklov, D.; Plis, S.M.; Calhoun, V.D. On Self-Supervised Multimodal Representation Learning: An Application to Alzheimer’s disease. In Proceedings of the 2021 IEEE 18th International Symposium on Biomedical Imaging, ISBI, Nice, France, 13–16 April 2021. [Google Scholar]
- Aderghal, K.; Boissenin, M.; Benois-Pineau, J.; Catheline, G.; Afdel, K. Classification of sMRI for AD Diagnosis with Convolutional Neuronal Networks: A Pilot 2-D+ɛ Study on ADNI. Proc. Int. Conf. Multimed. Model. MMM 2017, 10132, 690–701. [Google Scholar] [CrossRef]
- Aderghal, K.; Benois-Pineau, J.; Afdel, K. FuseMe: Classification of sMRI images by fusion of Deep CNNs in 2D+ε projections. Proc. Int. Workshop Content Based Multimed. Index. CBMI 2017, 1–7. [Google Scholar] [CrossRef]
- Kam, T.-E.; Zhang, H.; Jiao, Z.; Shen, D. Deep Learning of Static and Dynamic Brain Functional Networks for Early MCI Detection. IEEE Trans. Med. Imaging 2020, 39, 478–487. [Google Scholar] [CrossRef]
- Ahmed, O.B.; Mizotin, M.; Benois-Pineau, J.; Allard, M.; Catheline, G.; Amar, C.B. Alzheimer’s disease diagnosis on structural MR images using circular harmonic functions descriptors on hippocampus and posterior cingulate cortex. Comput. Med. Imaging Graph. 2015, 44, 13–25. [Google Scholar] [CrossRef] [PubMed]
- Khagi, B.; Kwon, G.-R. 3D CNN Design for the Classification of Alzheimer’s Disease Using Brain MRI and PET. IEEE Access 2020, 8, 217830–217847. [Google Scholar] [CrossRef]
- Puspaningrum, E.Y.; Wahid, R.R.; Amaliyah, R.P.; Nisa’, C. Alzheimer’s Disease Stage Classification using Deep Convolutional Neural Networks on Oversampled Imbalance Data. In Proceedings of the 2020 6th Information Technology International Seminar, ITIS, Surabaya, Indonesia, 14–16 October 2020. [Google Scholar]
- Li, Y.; Huang, J.-B. Narendra Ahuja and Ming-Hsuan Yang. Deep Joint Image Filtering. In European Conference on Computer Vision; Springer: Cham, Switzerland, 2016; pp. 154–169. [Google Scholar]
- Tufail, A.B.; Ma, Y.-K.; Kaabar, M.K.A.; Martínez, F.; Junejo, A.R.; Ullah, I.; Khan, R. Deep Learning in Cancer Diagnosis and Prognosis Prediction: A Minireview on Challenges, Recent Trends, and Future Directions. Comput. Math. Methods Med. 2021, 2021, 9025470. [Google Scholar] [CrossRef] [PubMed]


| Research Group | NC | MCI | AD |
|---|---|---|---|
| Number of Subjects | 102 | 97 | 94 |
| Age | 76.01 (62.2–86.6) | 74.54 (55.3–87.2) | 75.82 (55.3–88) |
| FAQ Total Score | 0.186 (0–6) | 3.16 (0–15) | 13.67 (0–27) |
| NPI-Q Total Score | 0.402 (0–5) | 1.97 (0–17) | 4.074 (0–15) |
| Architecture | Performance Metrics |
|---|---|
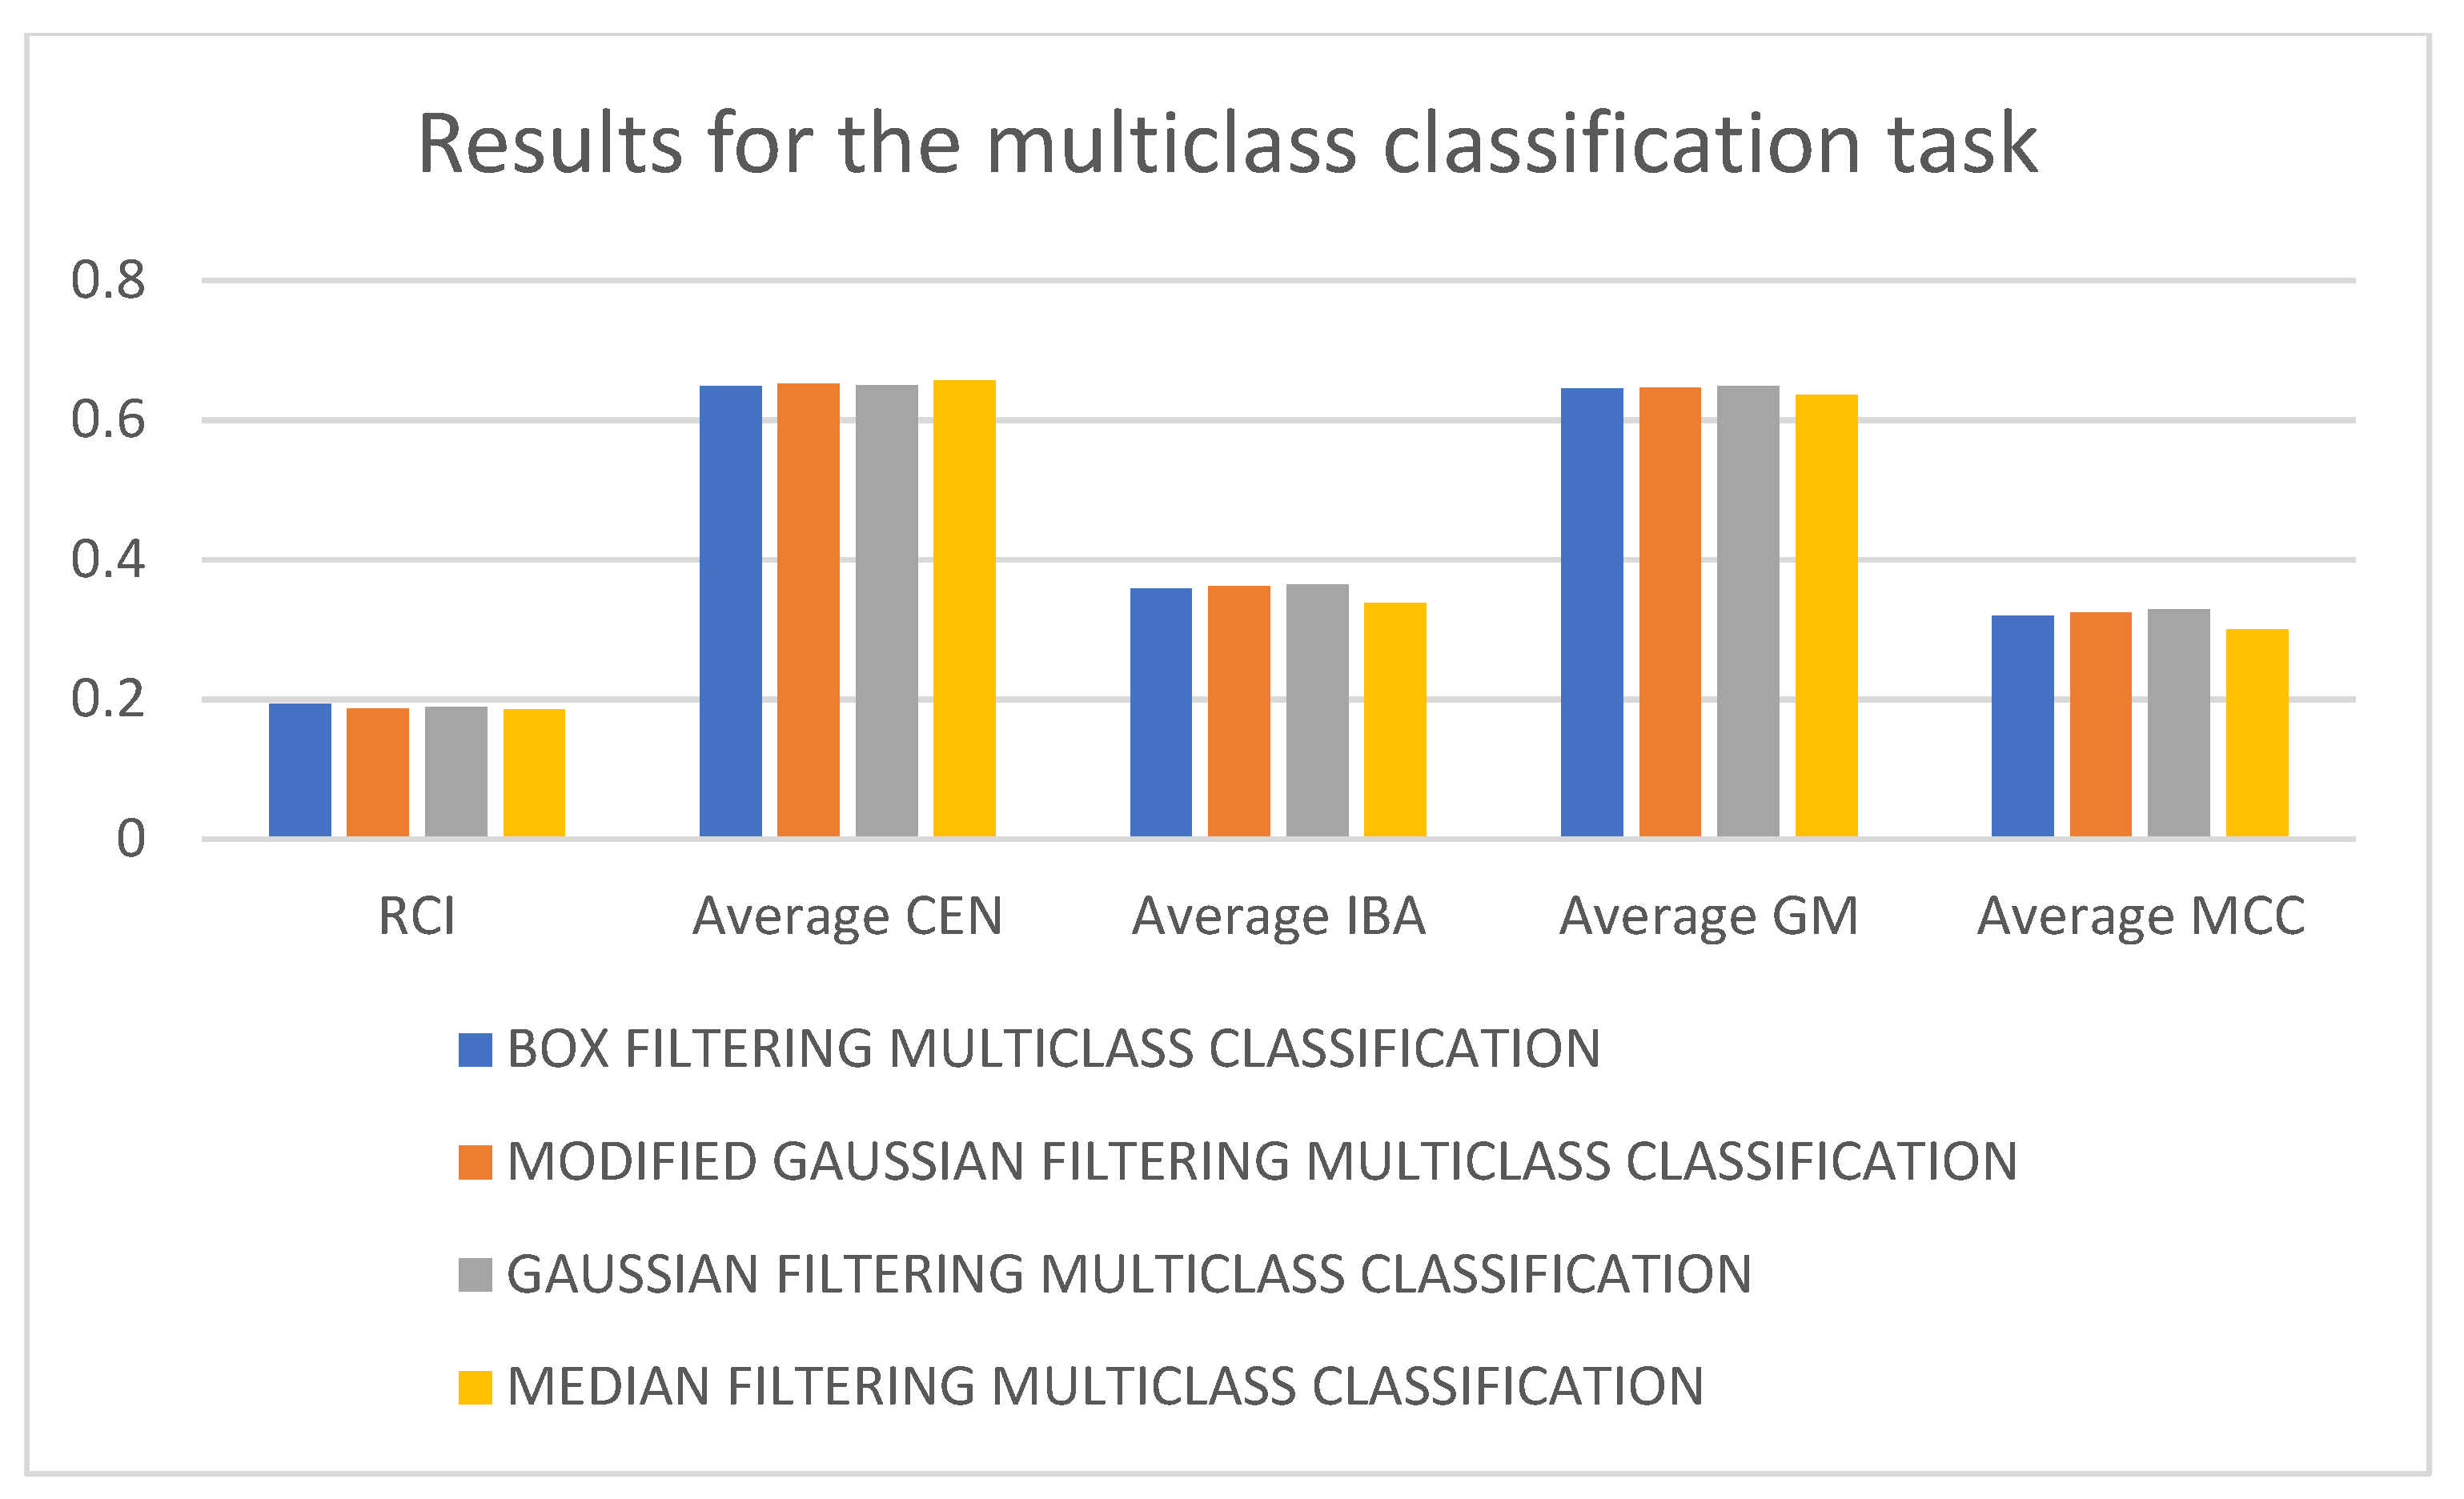
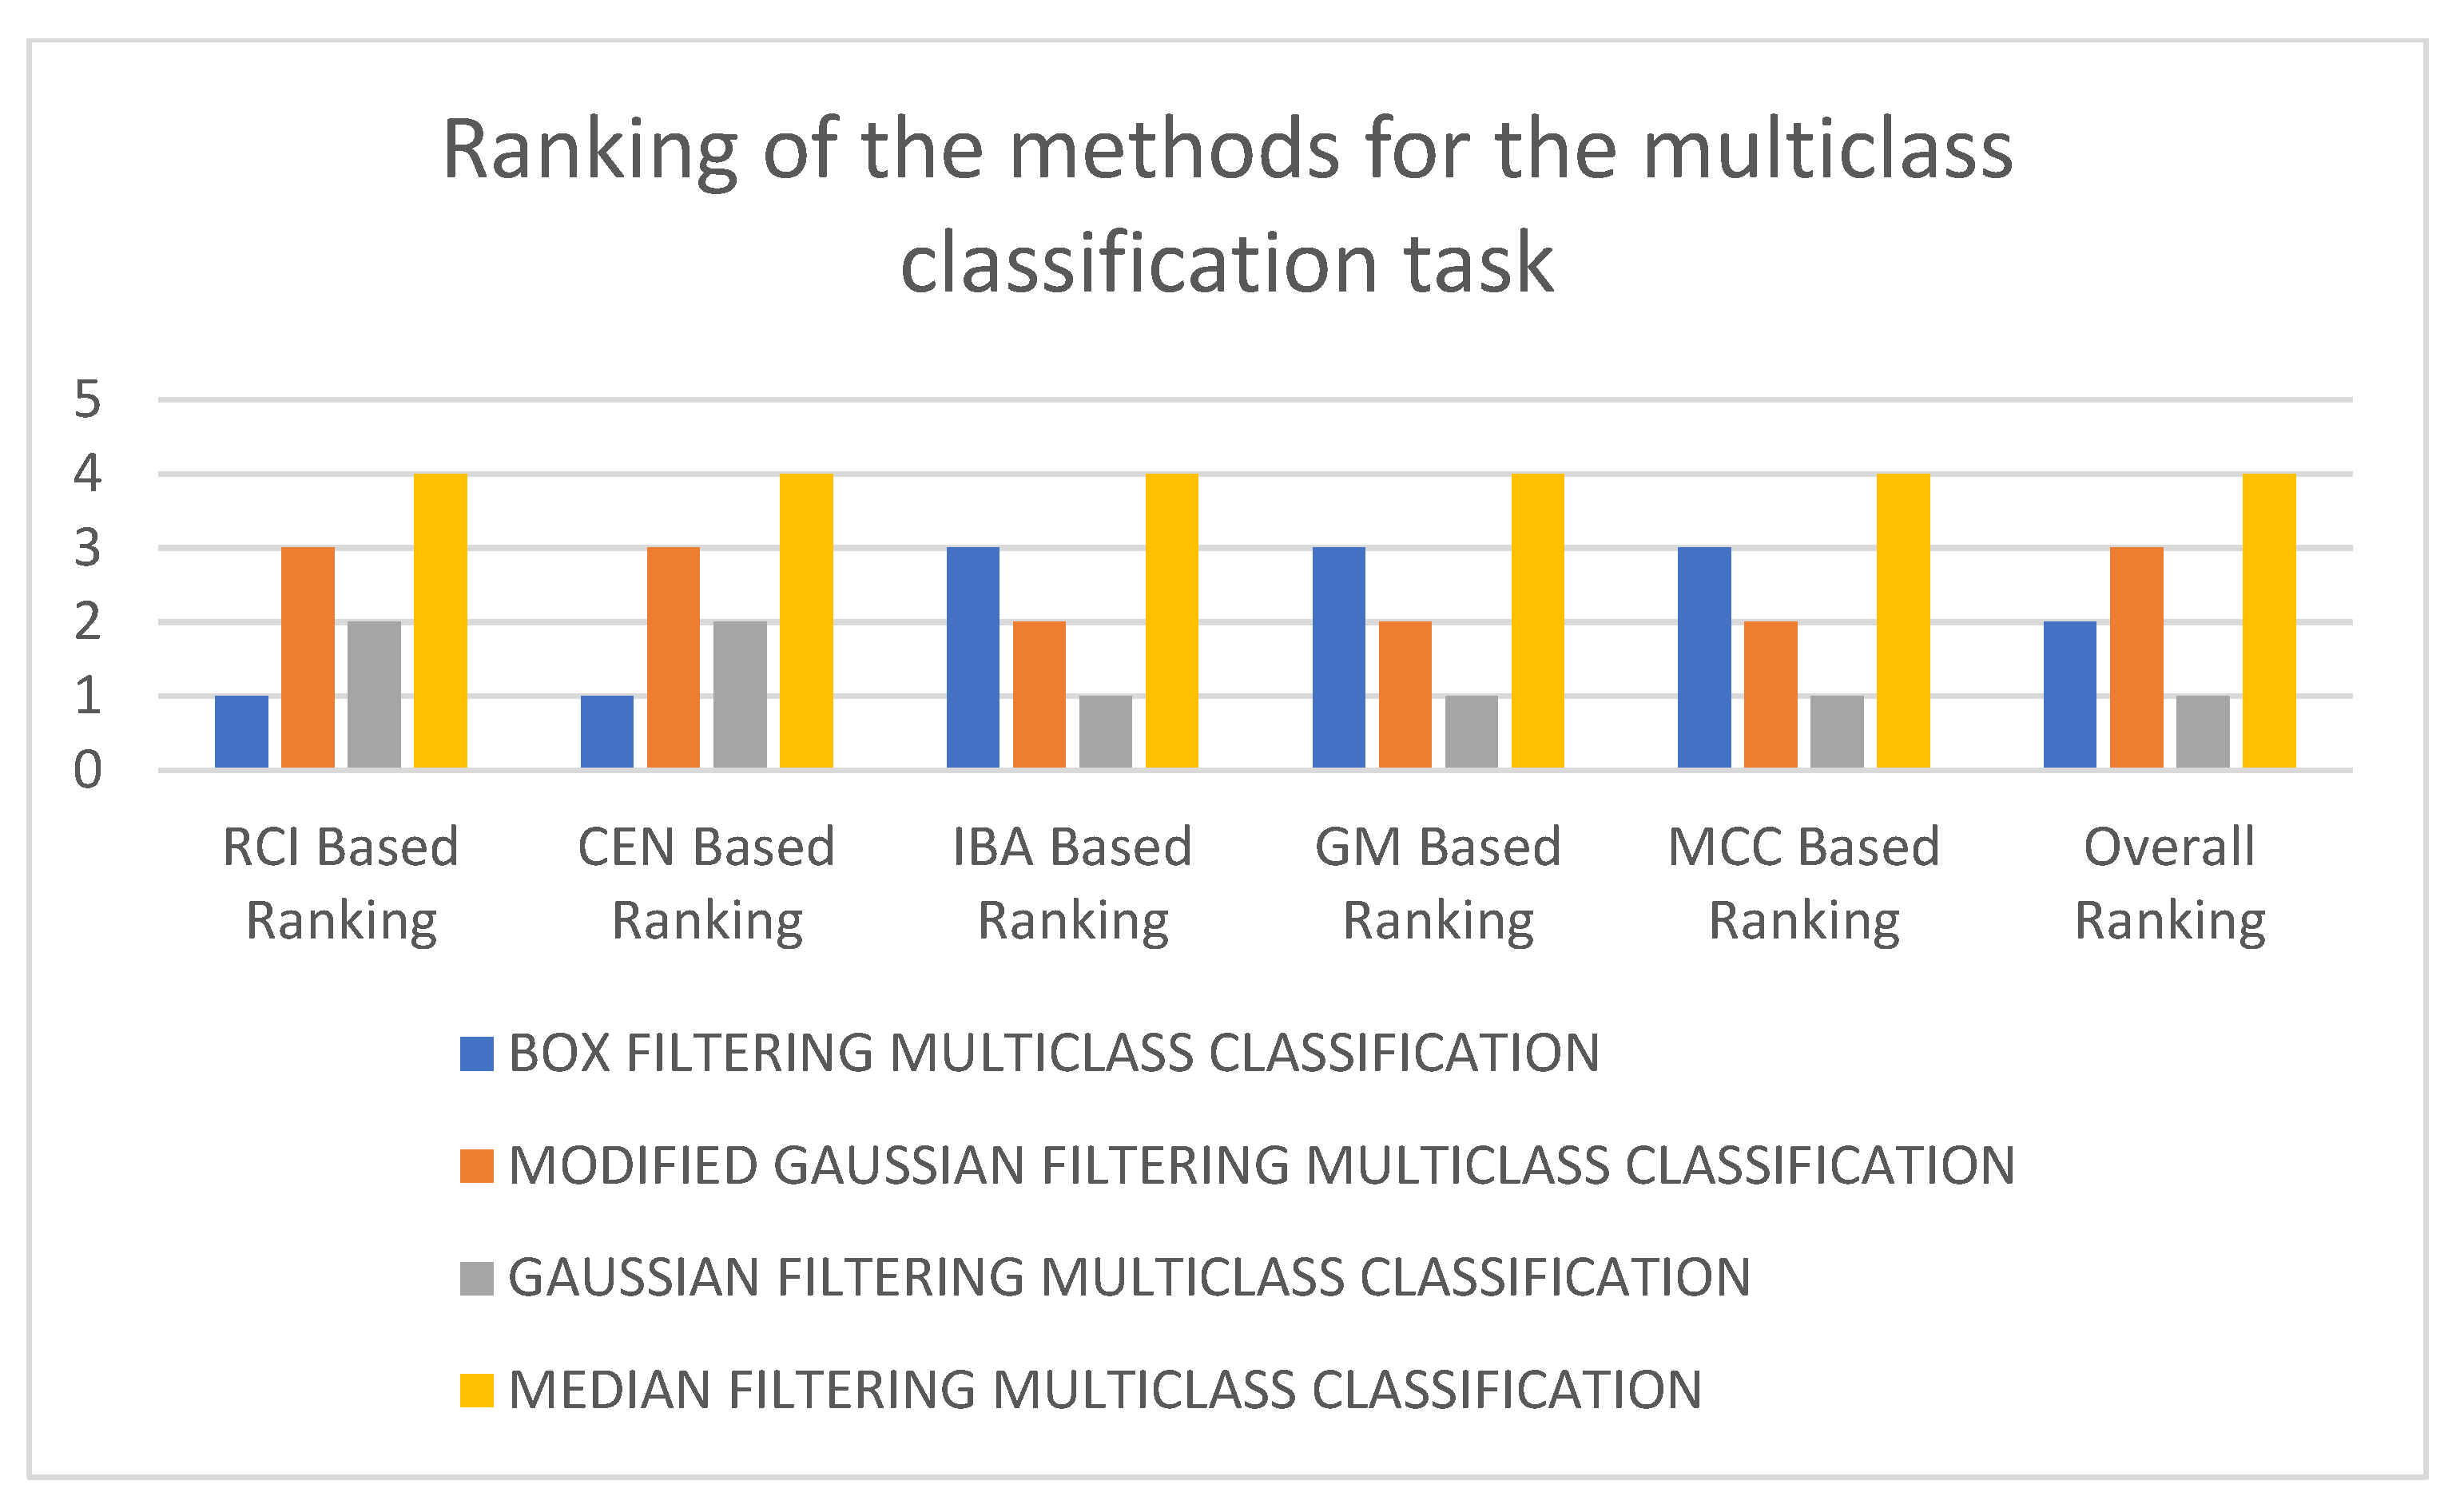
| 3D-CNN trained with application of box filtering | RCI = 0.19275, CEN = {‘AD’: 0.52135, ‘MCI’: 0.8566, ‘NC’: 0.5687}, Average CEN = 0.6488, IBA = {‘AD’: 0.5358, ‘MCI’: 0.1241, ‘NC’: 0.4145}, Average IBA = 0.3581, GM = {‘AD’: 0.7697, ‘MCI’: 0.467, ‘NC’: 0.6972}, Average GM = 0.6446, MCC = {‘AD’: 0.5292, ‘MCI’: 0.0299, ‘NC’: 0.398}, Average MCC = 0.3190 |
| 3D-CNN trained with application of modified Gaussian filtering | RCI = 0.1861, CEN = {‘AD’: 0.5301, ‘MCI’: 0.8498, ‘NC’: 0.5762}, Average CEN = 0.6520, IBA = {‘AD’: 0.5351, ‘MCI’: 0.1233, ‘NC’: 0.4258}, Average IBA = 0.3614, GM = {‘AD’: 0.765, ‘MCI’: 0.4719, ‘NC’: 0.7027}, Average GM = 0.6465, MCC = {‘AD’: 0.5172, ‘MCI’: 0.0465, ‘NC’: 0.4069}, Average MCC = 0.3235 |
| 3D-CNN trained with application of Gaussian filtering | RCI = 0.18909, CEN = {‘AD’: 0.53229, ‘MCI’: 0.85359, ‘NC’: 0.5627}, Average CEN = 0.6495, IBA = {‘AD’: 0.5217, ‘MCI’: 0.1233, ‘NC’: 0.4485}, Average IBA = 0.3645, GM = {‘AD’: 0.764, ‘MCI’: 0.4719, ‘NC’: 0.711}, Average GM = 0.6489, MCC = {‘AD’: 0.5199, ‘MCI’: 0.0465, ‘NC’: 0.4188}, Average MCC = 0.3284 |
| 3D-CNN trained with application of median filtering | RCI = 0.1848, CEN = {‘AD’: 0.54475, ‘MCI’: 0.86487, ‘NC’: 0.559}, Average CEN = 0.6562, IBA = {‘AD’: 0.4671, ‘MCI’: 0.13193, ‘NC’: 0.4151}, Average IBA = 0.3380, GM = {‘AD’: 0.7386, ‘MCI’: 0.4649, ‘NC’: 0.7043}, Average GM = 0.6359, MCC = {‘AD’: 0.4767, ‘MCI’: 0.0084, ‘NC’: 0.4161}, Average MCC = 0.3004 |
| Architecture | Performance Metrics |
|---|---|
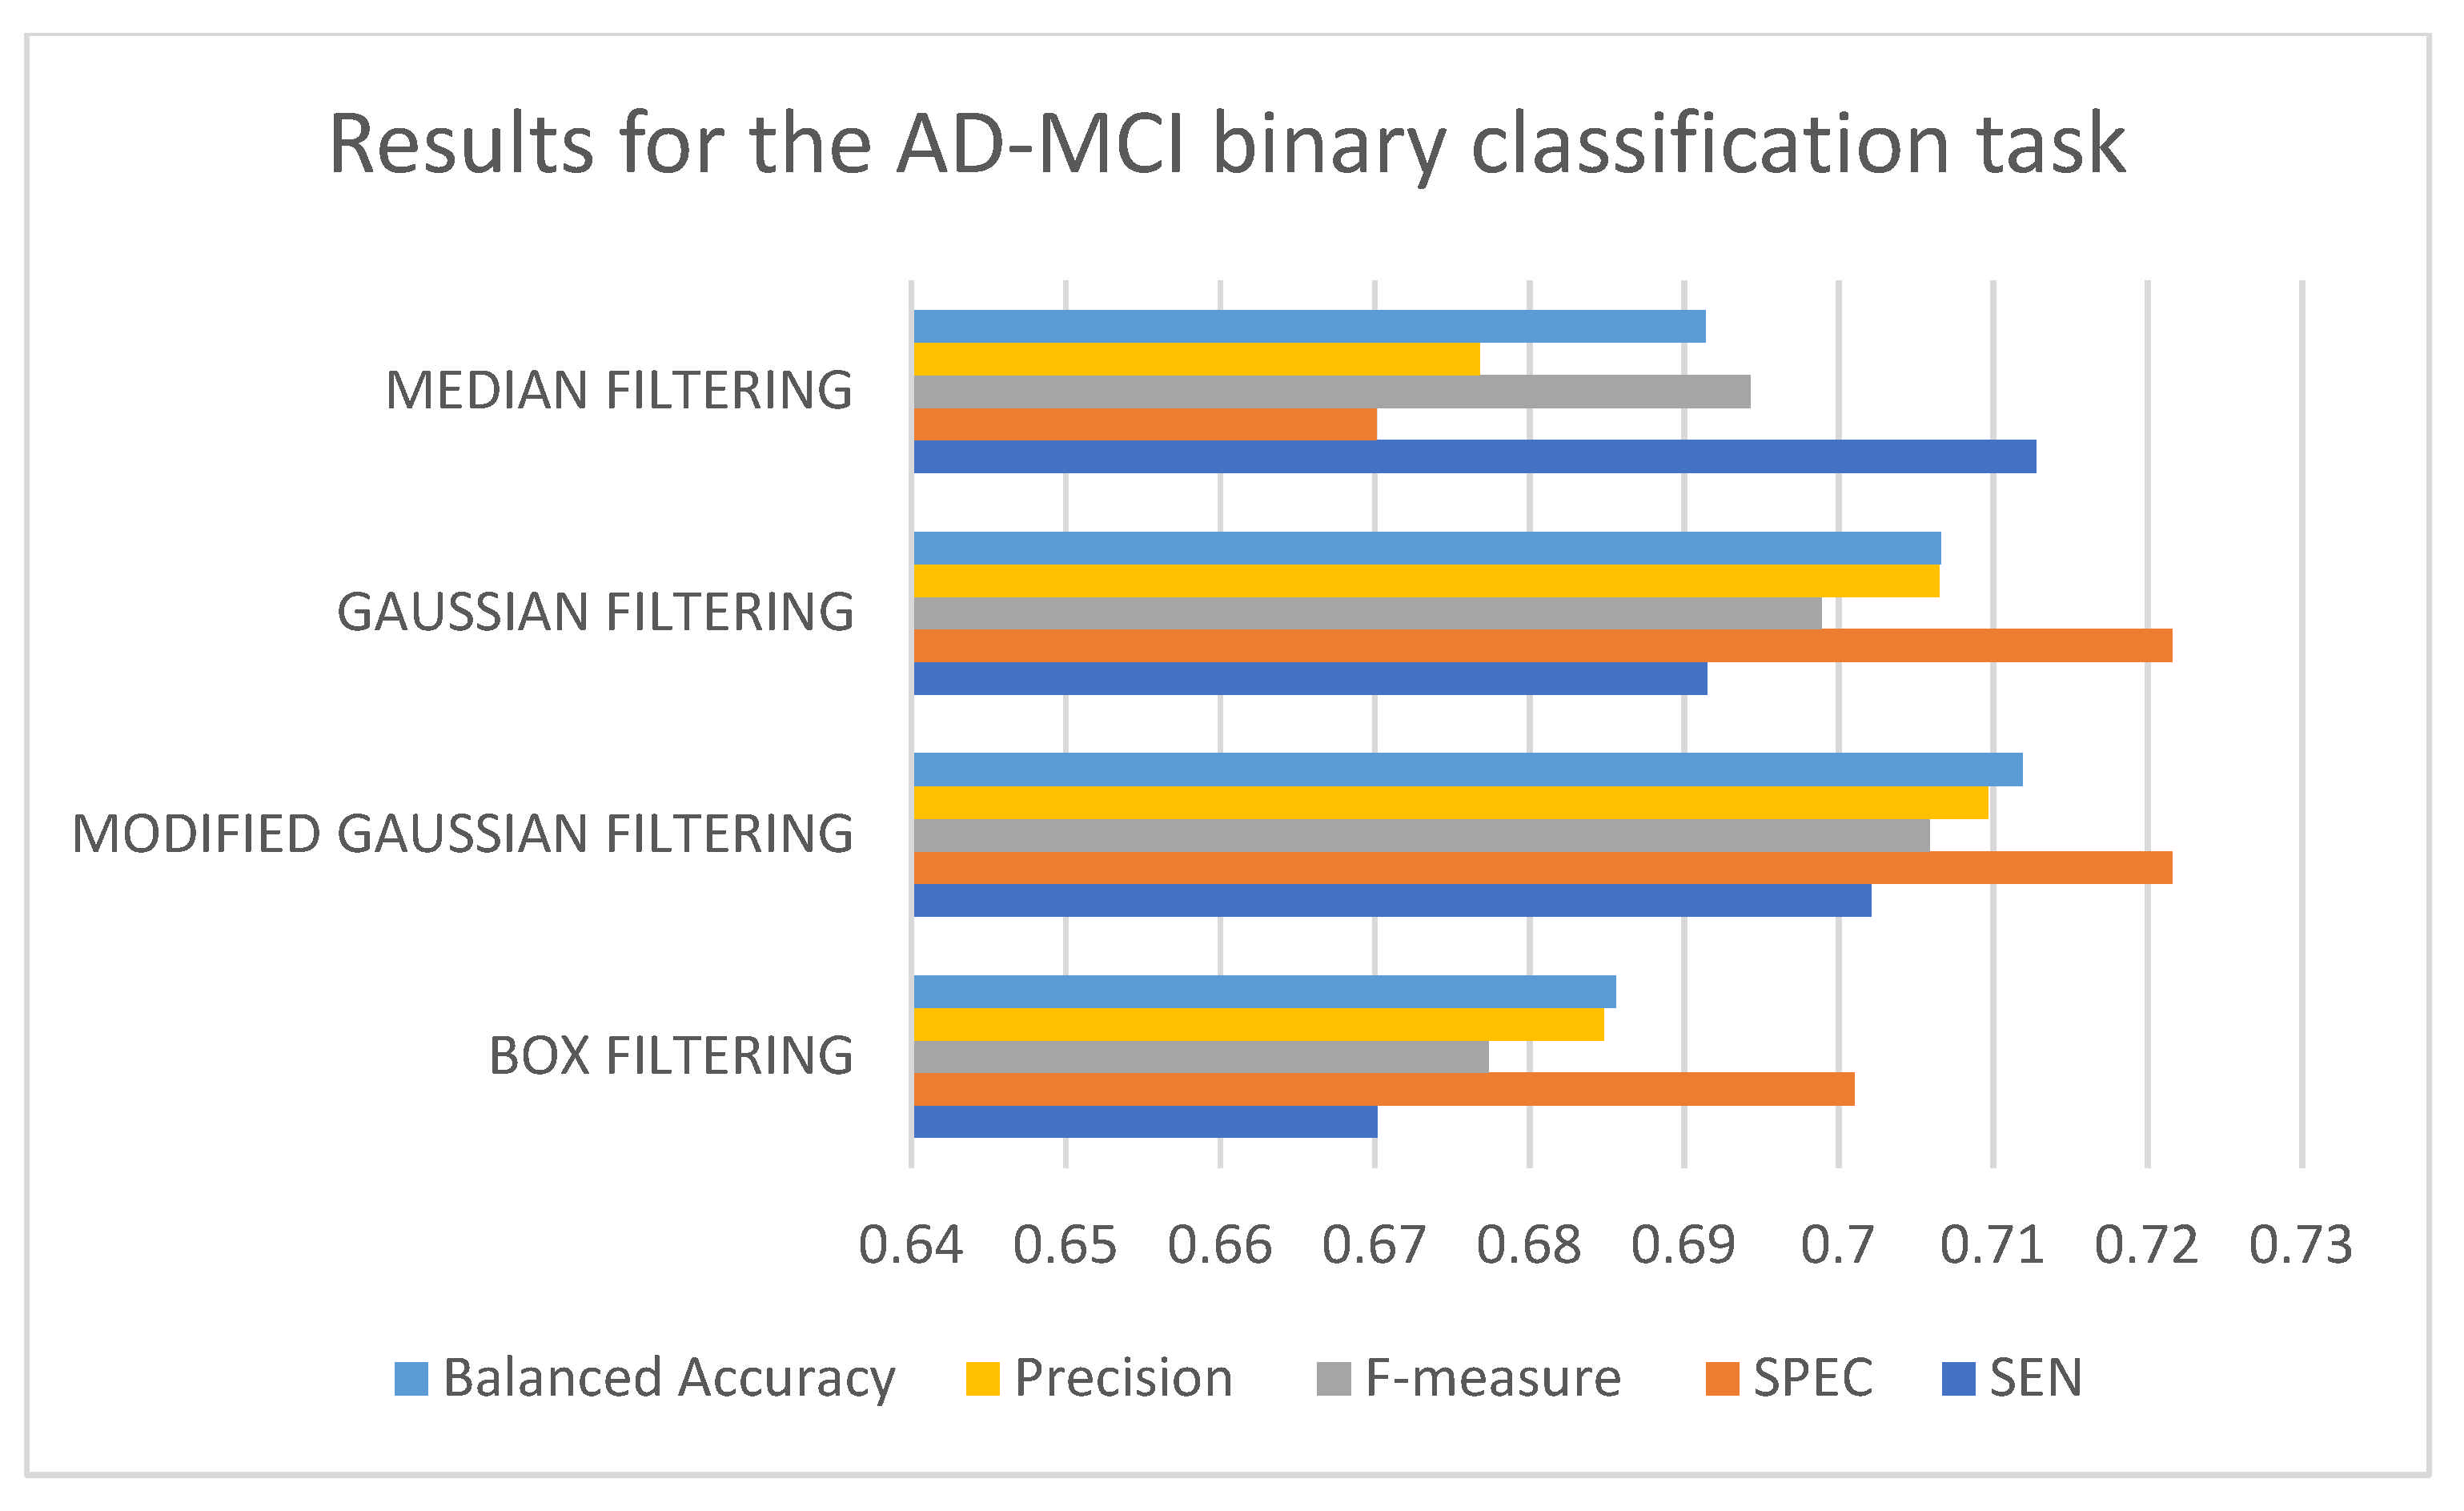
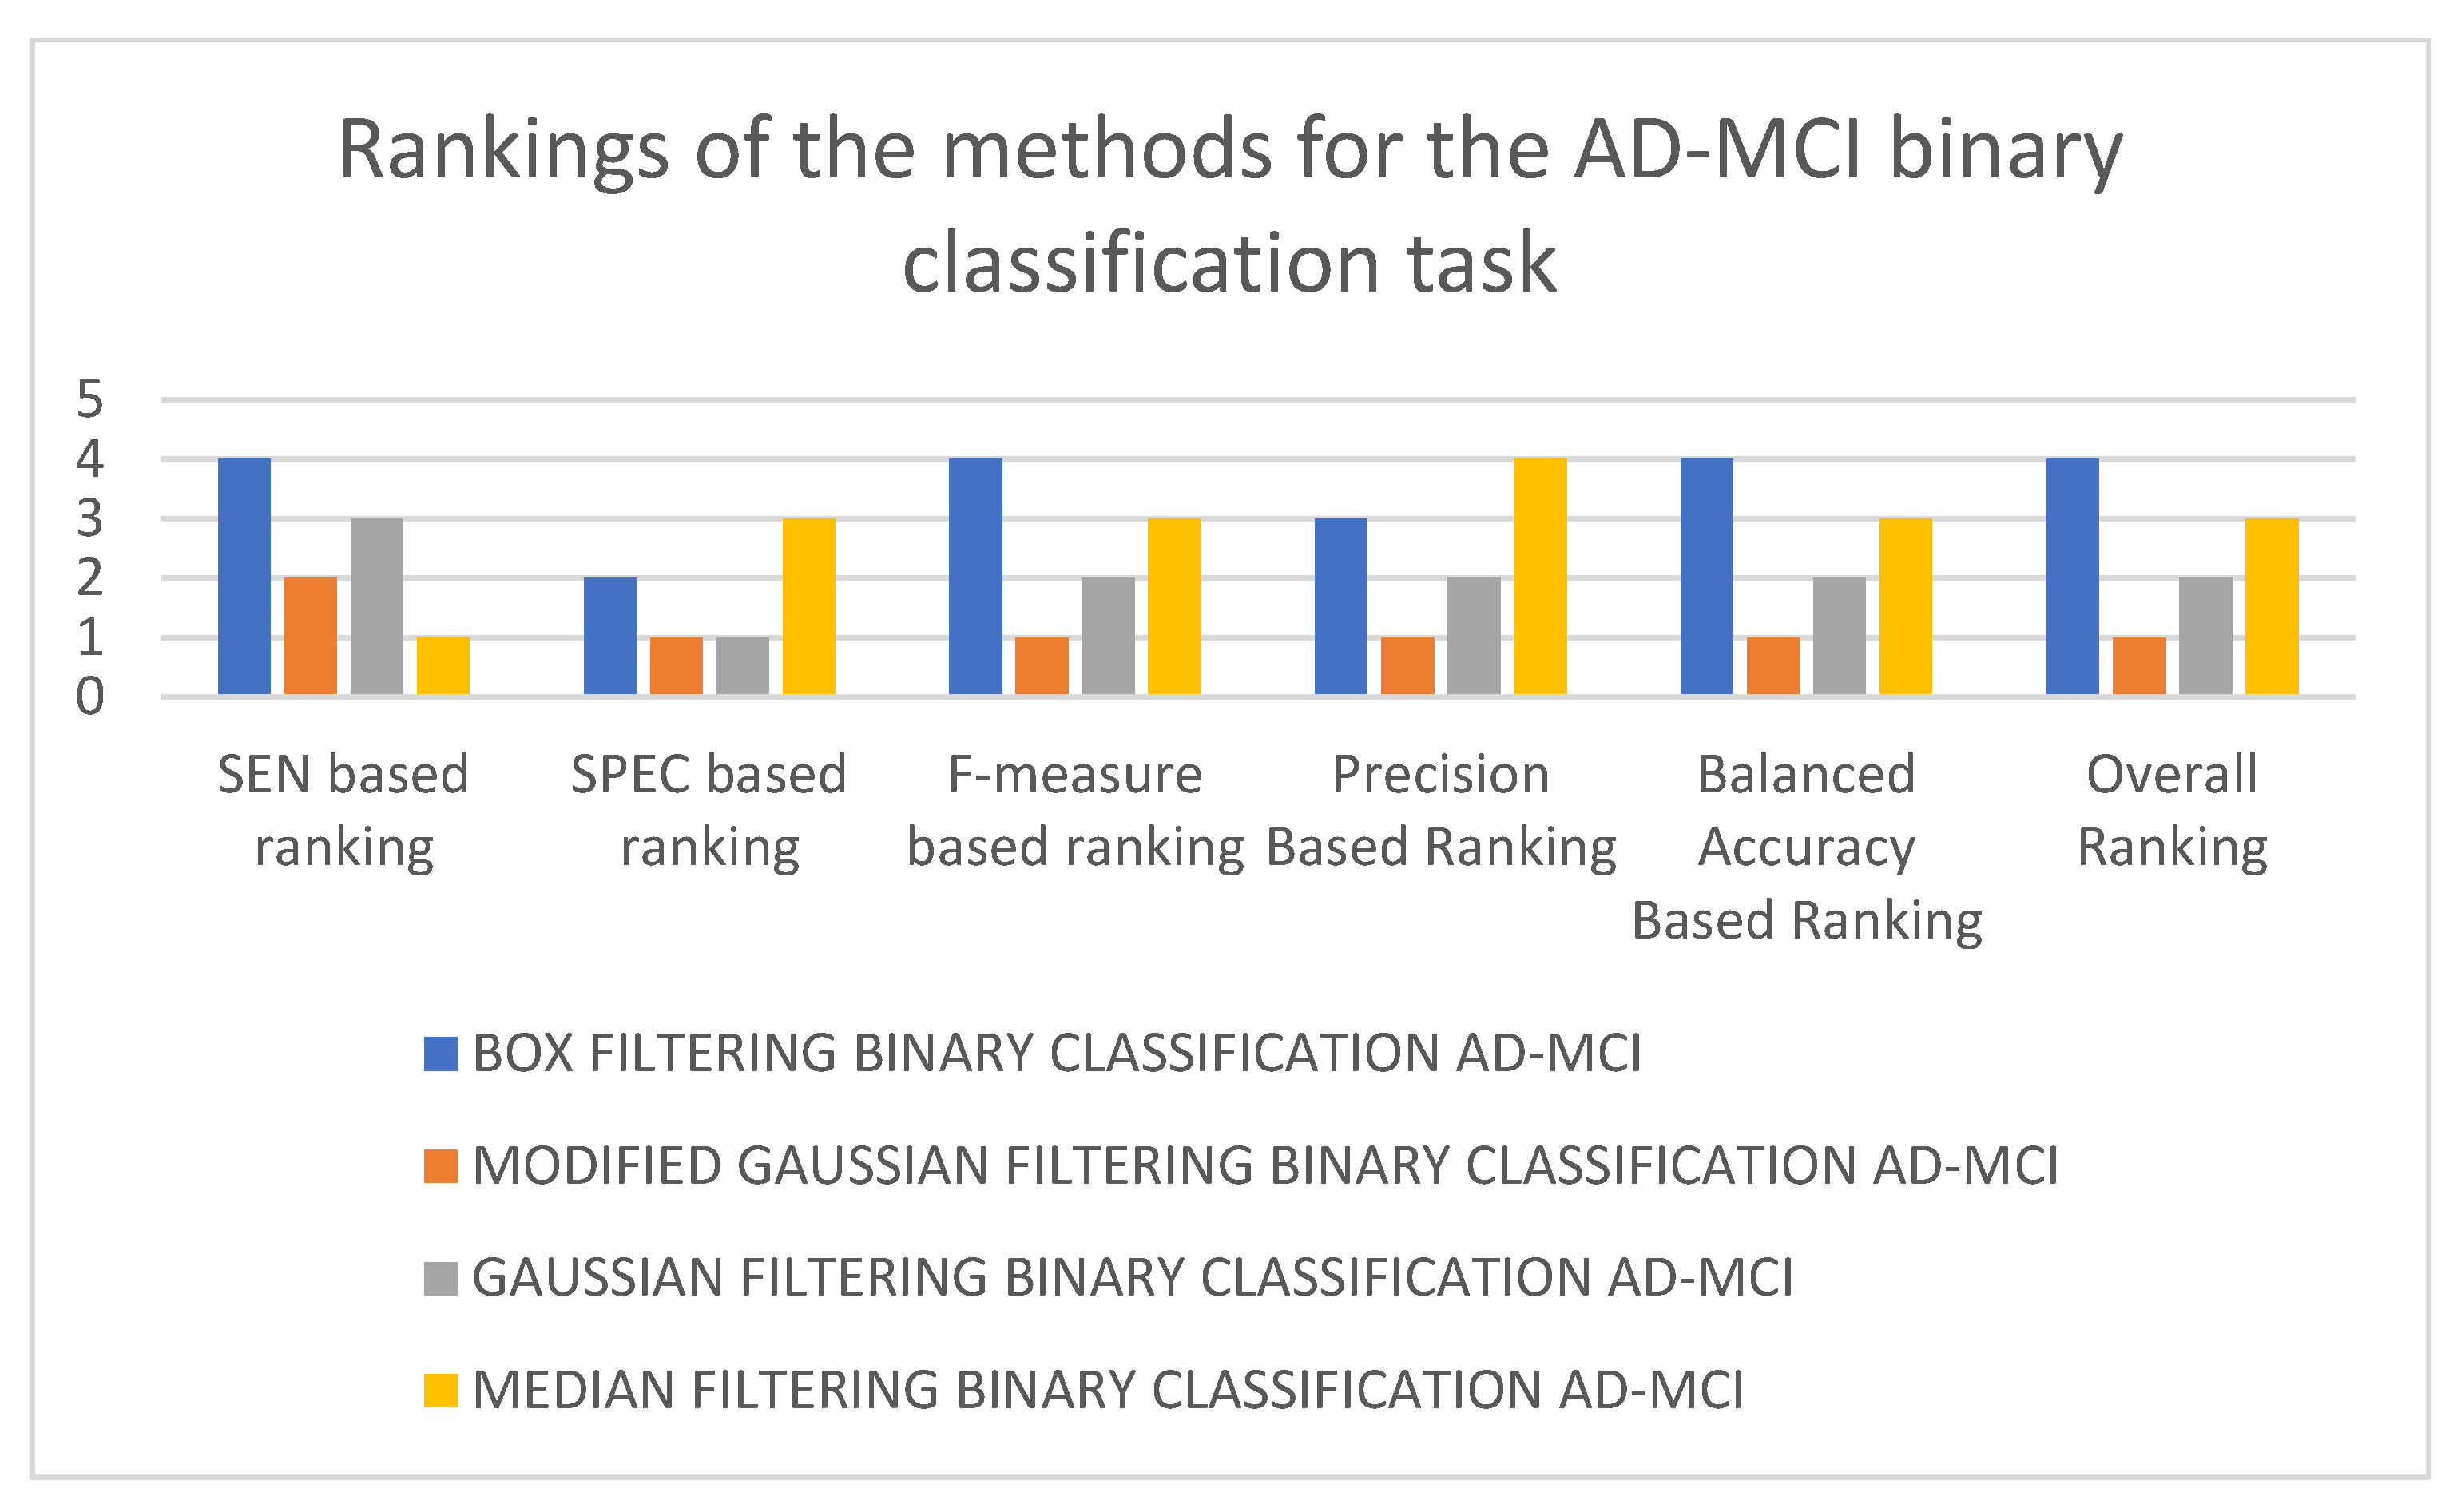
| 3D-CNN trained with application of box filtering | SEN = 0.6702, SPEC = 0.701, F-measure = 0.6774, Precision = 0.6848, Balanced Accuracy = 0.6856 |
| 3D-CNN trained with application of modified Gaussian filtering | SEN = 0.7021, SPEC = 0.7216, F-measure = 0.7059, Precision = 0.7097, Balanced Accuracy = 0.7119 |
| 3D-CNN trained with application of Gaussian filtering | SEN = 0.6915, SPEC = 0.7216, F-measure = 0.6989, Precision = 0.7065, Balanced Accuracy = 0.7066 |
| 3D-CNN trained with application of median filtering | SEN = 0.7128, SPEC = 0.6701, F-measure = 0.6943, Precision = 0.6768, Balanced Accuracy = 0.6914 |
| Architecture | Performance Metrics |
|---|---|
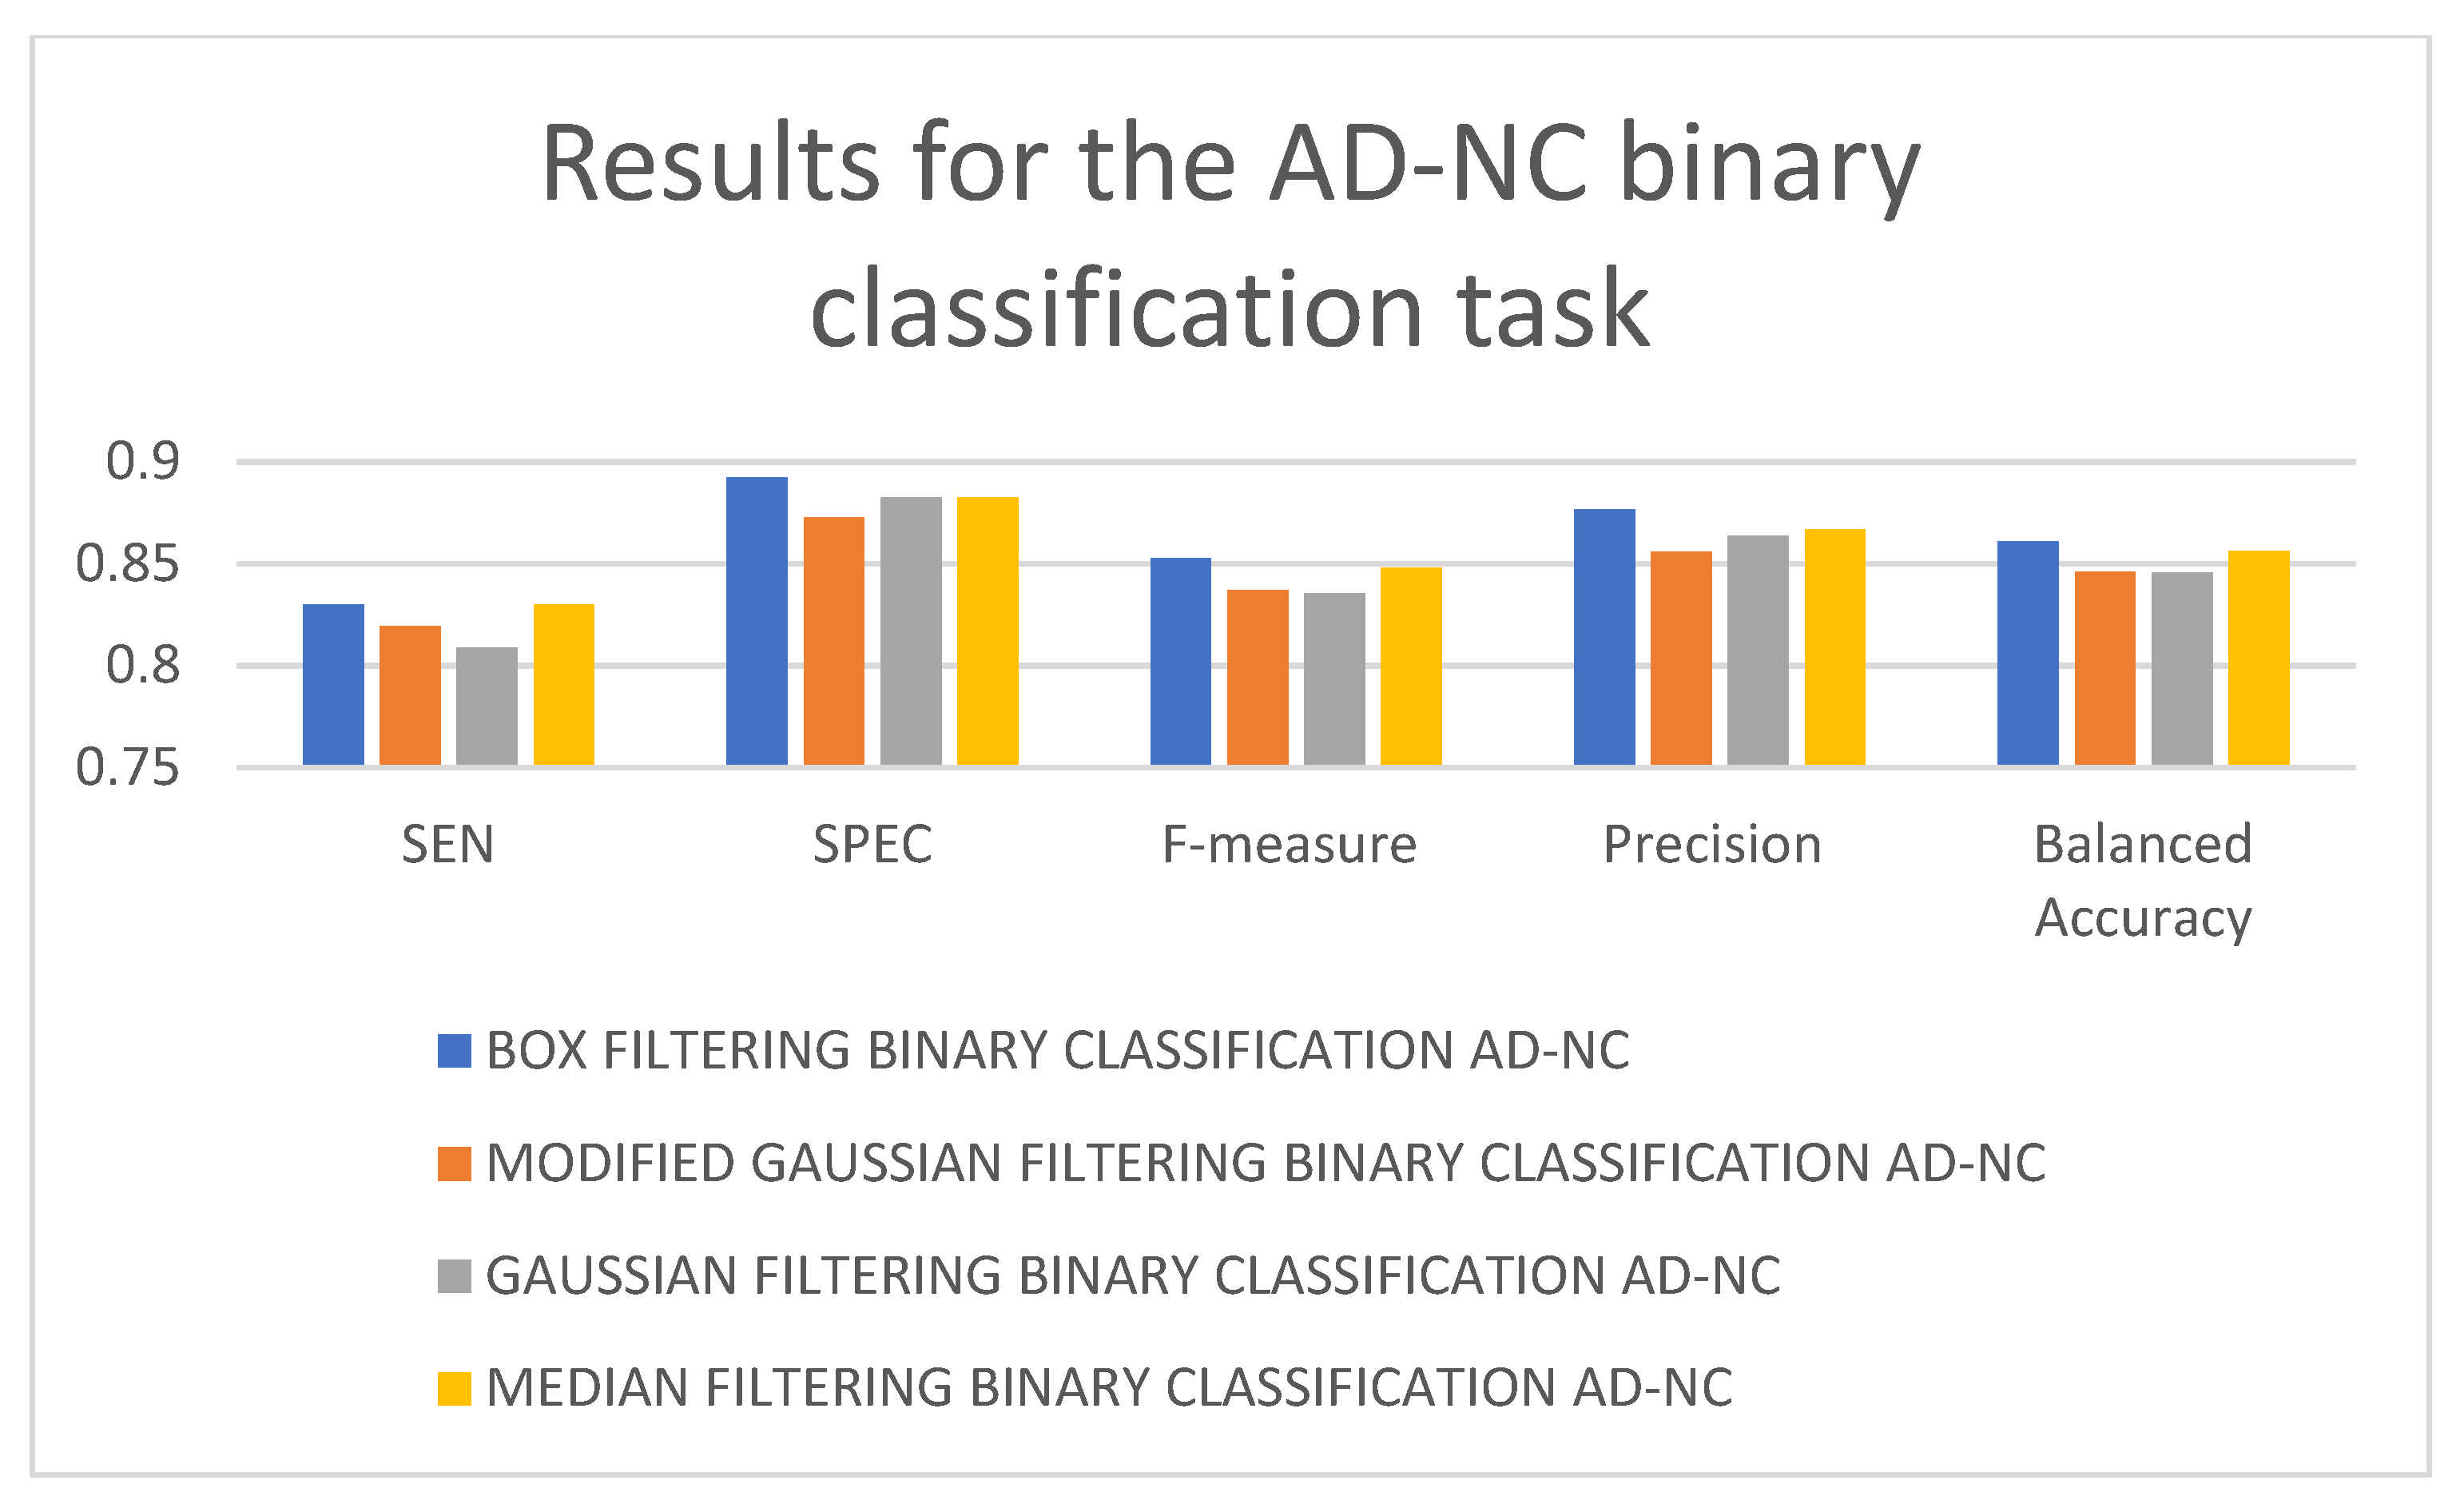
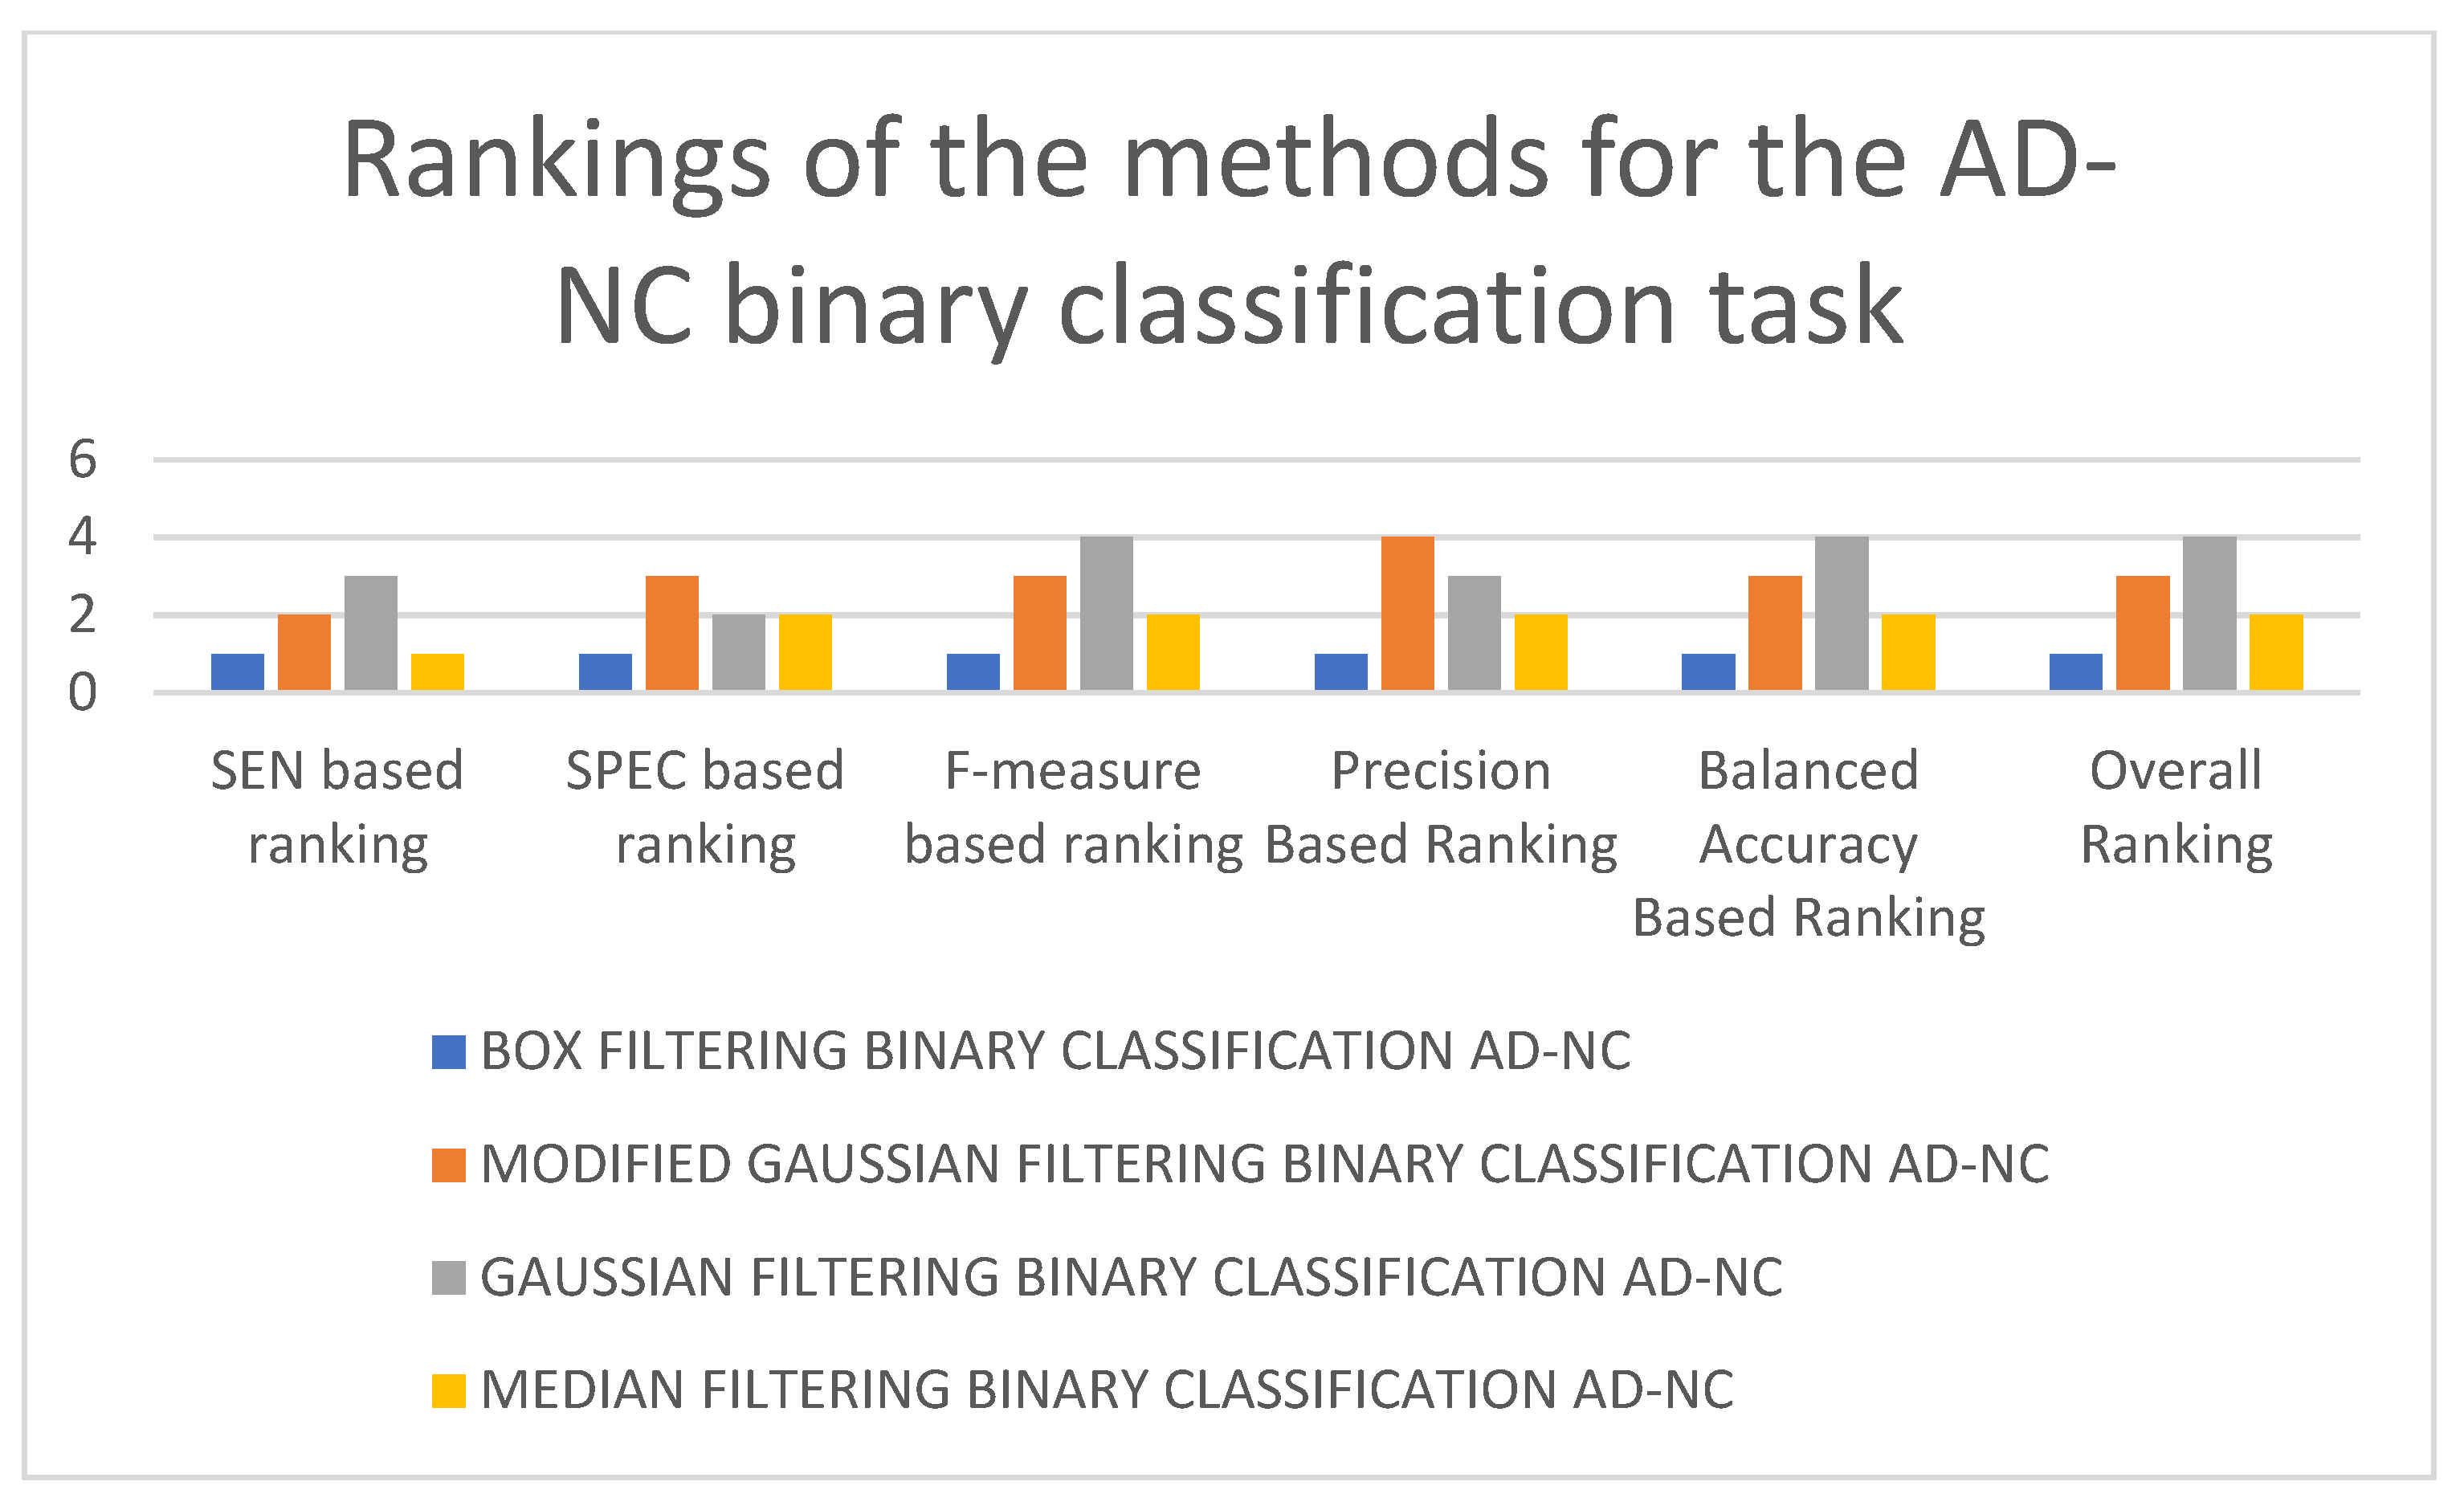
| 3D-CNN trained with application of box filtering | SEN = 0.8298, SPEC = 0.8922, F-measure = 0.8525, Precision = 0.8764, Balanced Accuracy = 0.861 |
| 3D-CNN trained with application of modified Gaussian filtering | SEN = 0.8191, SPEC = 0.8725, F-measure = 0.837, Precision = 0.8556, Balanced Accuracy = 0.8458 |
| 3D-CNN trained with application of Gaussian filtering | SEN = 0.8085, SPEC = 0.8824, F-measure = 0.8352, Precision = 0.8636, Balanced Accuracy = 0.8454 |
| 3D-CNN trained with application of median filtering | SEN = 0.8298, SPEC = 0.8824, F-measure = 0.8478, Precision = 0.8667, Balanced Accuracy = 0.8561 |
| Architecture | Performance Metrics |
|---|---|
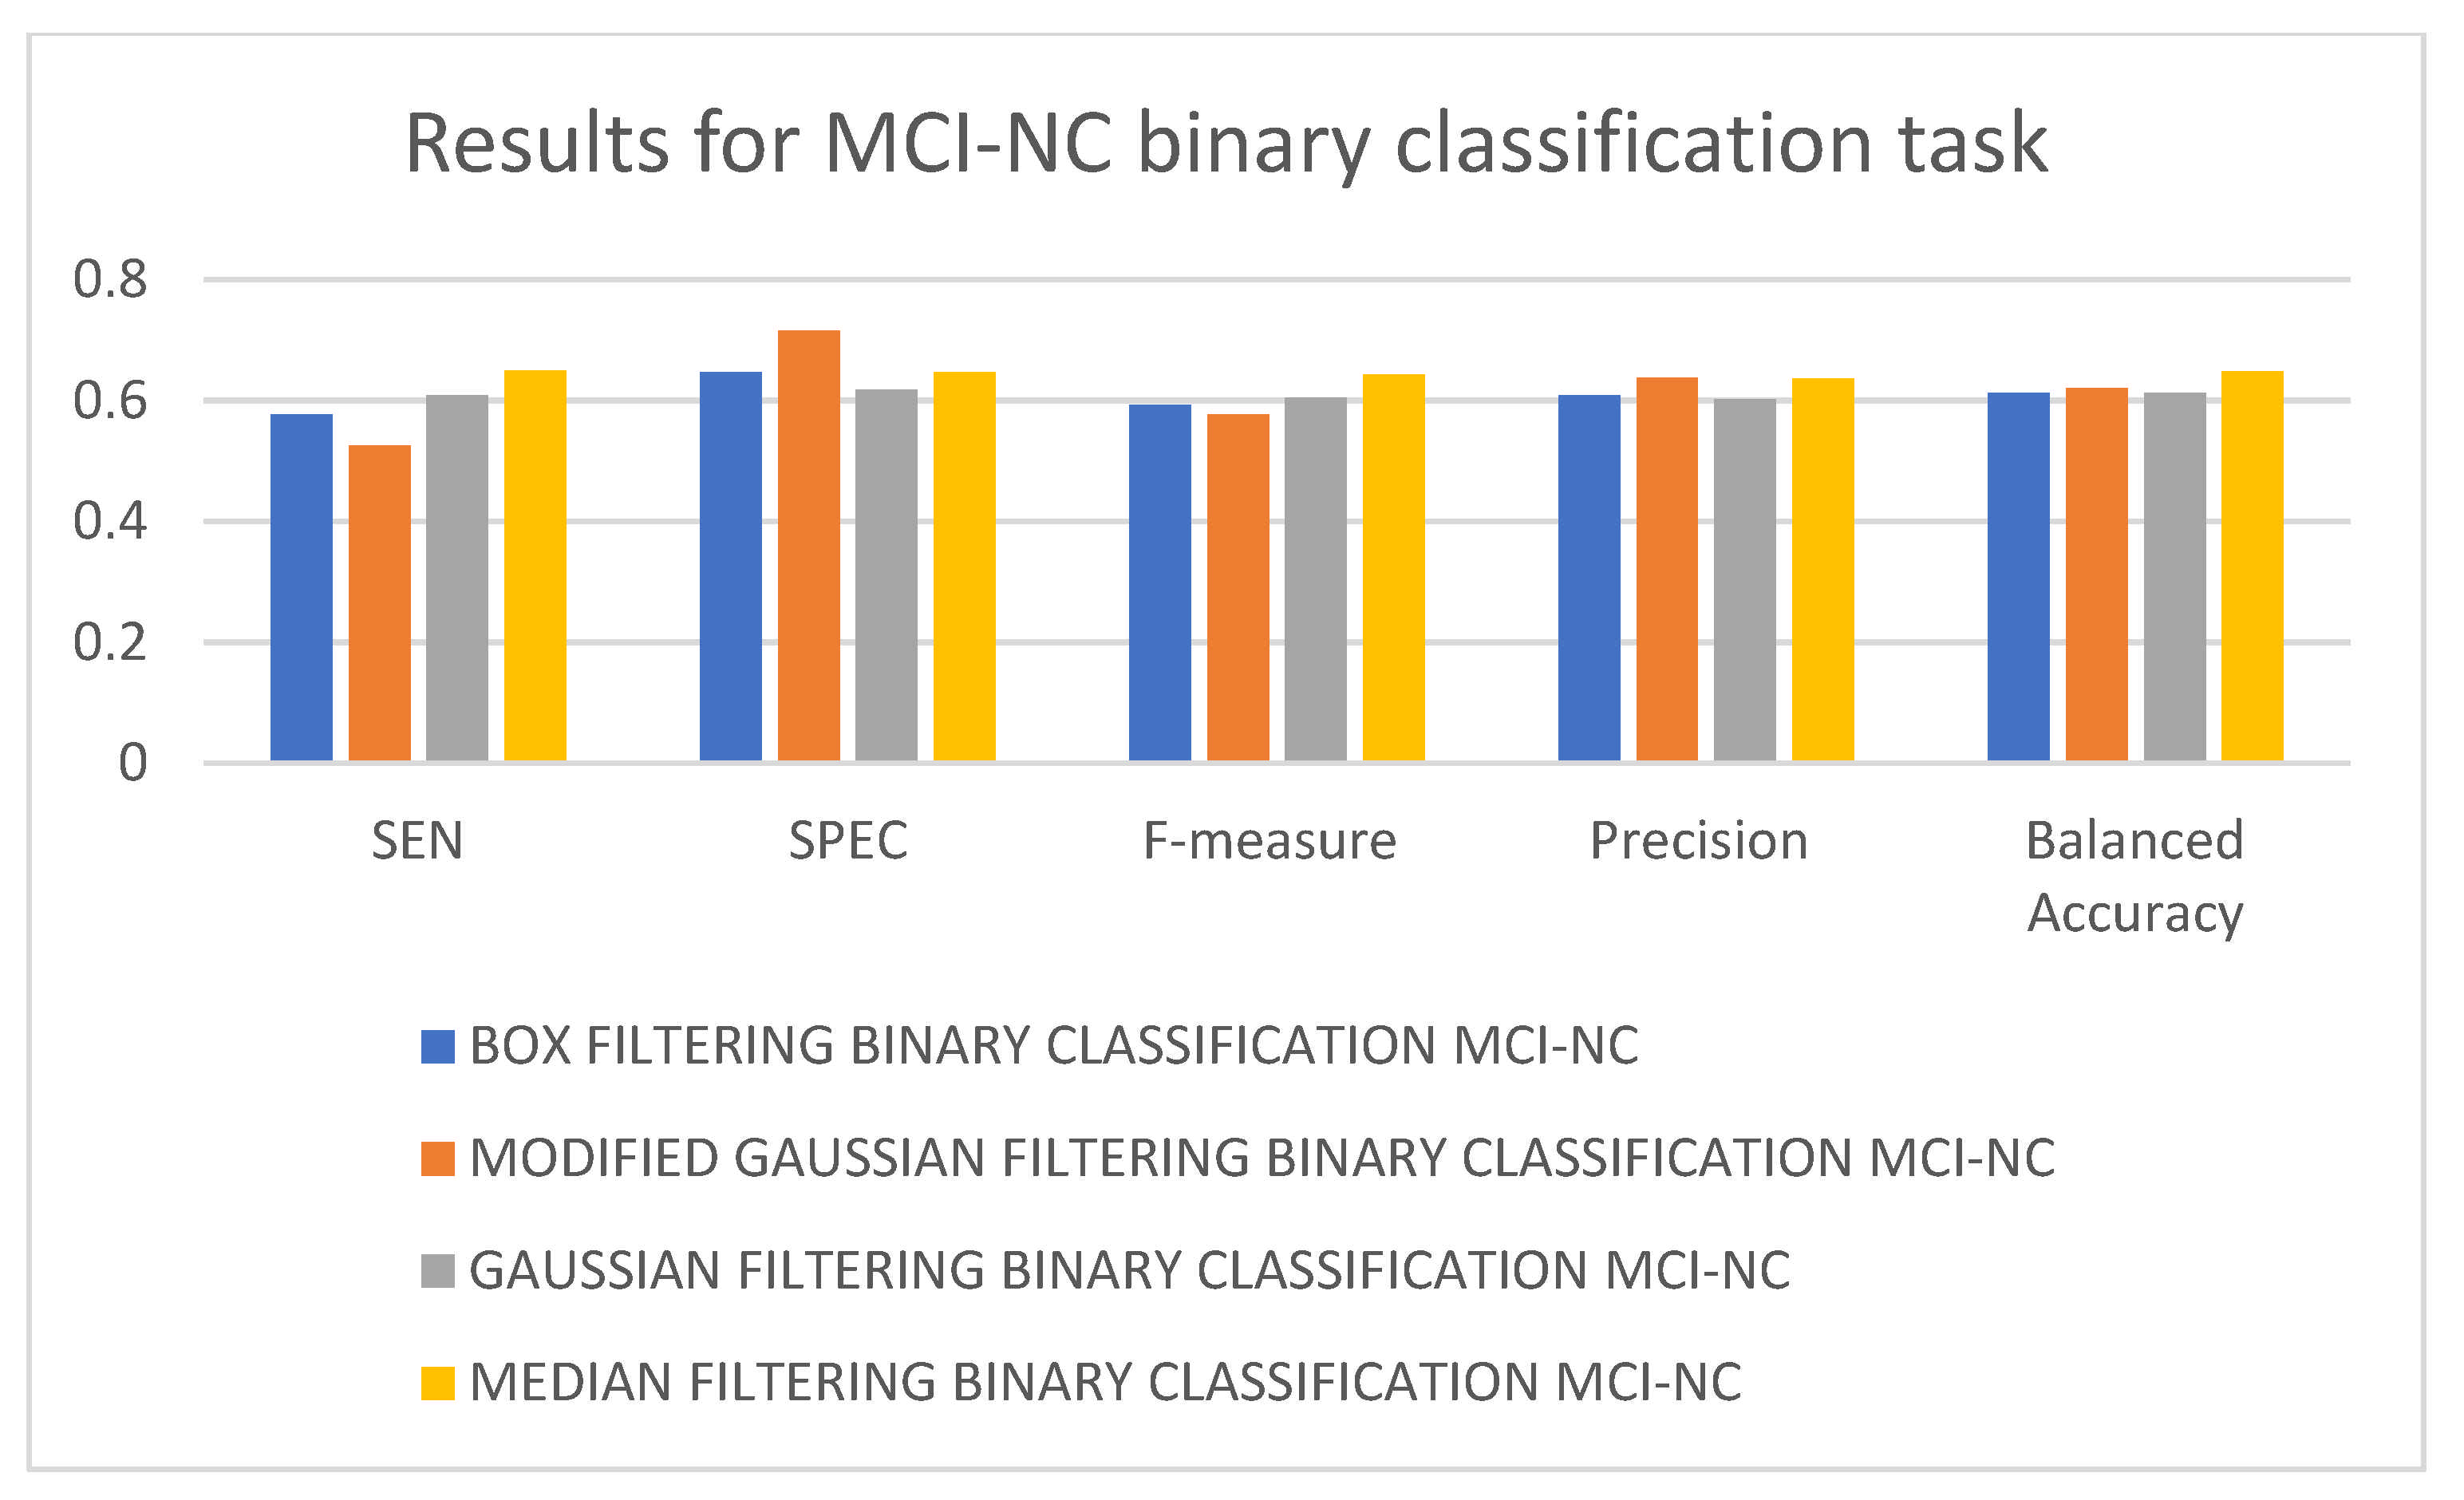
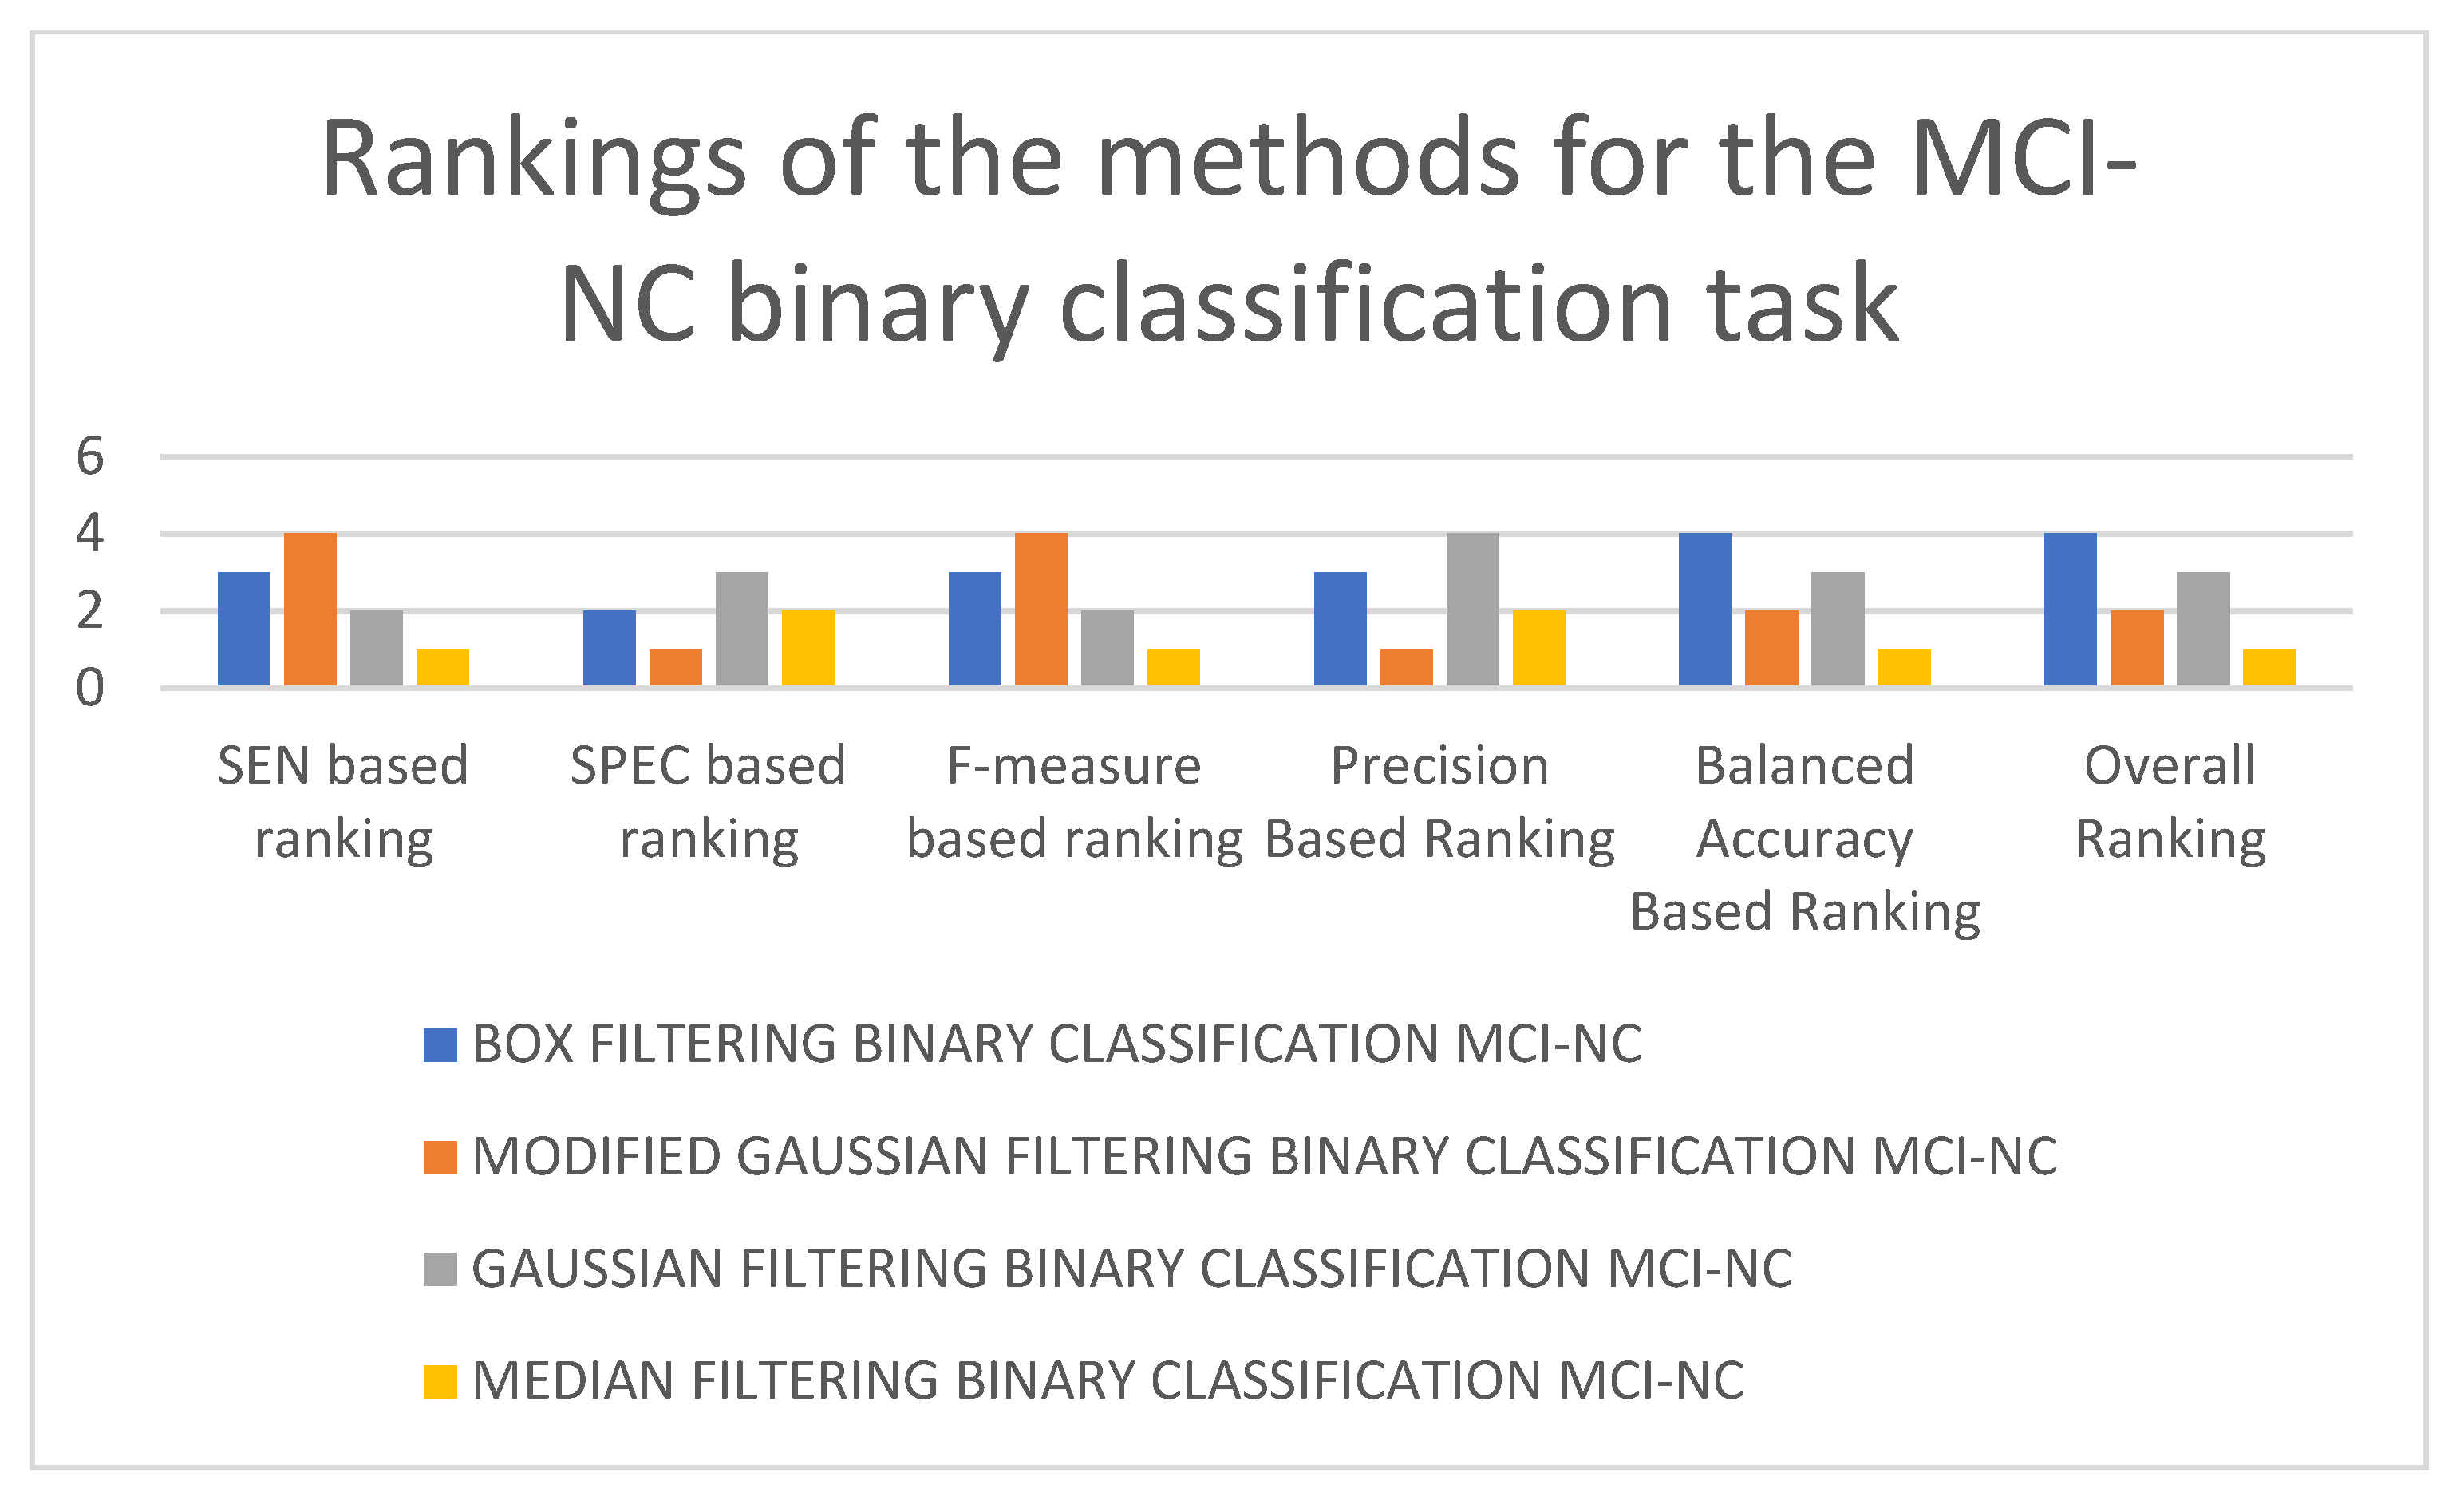
| 3D-CNN trained with application of box filtering | SEN = 0.5773, SPEC = 0.6471, F-measure = 0.5926, Precision = 0.6087, Balanced Accuracy = 0.6122 |
| 3D-CNN trained with application of modified Gaussian filtering | SEN = 0.5258, SPEC = 0.7157, F-measure = 0.5763, Precision = 0.6375, Balanced Accuracy = 0.6207 |
| 3D-CNN trained with application of Gaussian filtering | SEN = 0.6082, SPEC = 0.6176, F-measure = 0.6051, Precision = 0.602, Balanced Accuracy = 0.6129 |
| 3D-CNN trained with application of median filtering | SEN = 0.6495, SPEC = 0.6471, F-measure = 0.6429, Precision = 0.6364, Balanced Accuracy = 0.6483 |
| Author | Data | Method | Accuracy | Classification Task |
|---|---|---|---|---|
| Oh et al. [44] | MRI | Inception autoencoder based CNN architecture | 84.5% | AD/NC Binary Classification |
| Ekin Yagis et al. [45] | MRI | 3D-CNN architectures | 73.4% | AD/NC Binary Classification |
| Cosimo Ieracitano et al. [46] | MRI | Electroencephalographic signals | 85.78% | AD/NC Binary Classification |
| Rukesh Prajapati et al. [47] | MRI | DL model employing FC layers | 85.19% | AD/NC Binary Classification |
| Selene Tomassini et al. [48] | MRI | 3D Convolutional long short-term memory-based network | 86% | AD/NC Binary Classification |
| Rejusha T R et al. [49] | MRI | Deep convolutional GAN | 83% | AD/NC Binary Classification |
| Ekin Yagis et al. [50] | MRI | 2D-CNN autoencoder architecture | 74.66% | AD/NC Binary Classification |
| Ignacio Sarasua et al. [51] | Functional MRI | Template-based DL architecture | 77.3% | AD/NC Binary Classification |
| Alex Fedorov et al. [52] | MRI | Multimodal architectures | 84.1% | AD/NC Binary Classification |
| Our approach (Box filtering) | PET | 3D-CNN Whole brain | 86.22% | AD/NC Binary Classification |
| Karim Aderghal et al. [53] | MRI | 2D CNNs hippocampal region | 66.5% | AD/MCI Binary Classification |
| Karim Aderghal et al. [54] | MRI | 2D CNNs coronal, sagittal and axial projections | 63.28% | AD/MCI Binary Classification |
| Our approach (Modified Gaussian filtering) | PET | 3D-CNN Whole brain | 71.2% | AD/MCI Binary Classification |
| Tae-Eui Kam et al. [55] | Resting-state functional MRI | CNN framework | 73.85% | NC/MCI Binary Classification |
| Olfa Ben Ahmed et al. [56] | MRI | Circular Harmonic Functions | 69.45% | NC/MCI Binary Classification |
| Our approach (Median filtering) | PET | 3D-CNN Whole brain | 64.82% | NC/MCI Binary Classification |
| Bijen Khagi et al. [57] | PET, MRI | DL architecture employing 3D-CNN layers | 50.21% | AD/NC/MCI Multiclass Classification |
| Eva Y Puspaningrum et al. [58] | MRI | Deep CNN architecture having three convolutional layers | 55.27% | AD/NC/MCI Multiclass Classification |
| Our approach (Gaussian filtering) | PET | 3D-CNN Whole brain | 55.63% | AD/NC/MCI Multiclass Classification |
Publisher’s Note: MDPI stays neutral with regard to jurisdictional claims in published maps and institutional affiliations. |
© 2021 by the authors. Licensee MDPI, Basel, Switzerland. This article is an open access article distributed under the terms and conditions of the Creative Commons Attribution (CC BY) license (https://creativecommons.org/licenses/by/4.0/).
Share and Cite
Tufail, A.B.; Ma, Y.-K.; Kaabar, M.K.A.; Rehman, A.U.; Khan, R.; Cheikhrouhou, O. Classification of Initial Stages of Alzheimer’s Disease through Pet Neuroimaging Modality and Deep Learning: Quantifying the Impact of Image Filtering Approaches. Mathematics 2021, 9, 3101. https://doi.org/10.3390/math9233101
Tufail AB, Ma Y-K, Kaabar MKA, Rehman AU, Khan R, Cheikhrouhou O. Classification of Initial Stages of Alzheimer’s Disease through Pet Neuroimaging Modality and Deep Learning: Quantifying the Impact of Image Filtering Approaches. Mathematics. 2021; 9(23):3101. https://doi.org/10.3390/math9233101
Chicago/Turabian StyleTufail, Ahsan Bin, Yong-Kui Ma, Mohammed K. A. Kaabar, Ateeq Ur Rehman, Rahim Khan, and Omar Cheikhrouhou. 2021. "Classification of Initial Stages of Alzheimer’s Disease through Pet Neuroimaging Modality and Deep Learning: Quantifying the Impact of Image Filtering Approaches" Mathematics 9, no. 23: 3101. https://doi.org/10.3390/math9233101