1. Introduction
The food and beverage industry have a historical link to humanity since the ancient times until the present period. In this modern society, its importance still remains as an indispensable factor in human life. People have been serving food and beverages to provide for their daily necessities for several thousands of years. Then later, with the appearance of trade routes by accident, the exchange of food and beverage have begun [
1].
The food and beverage (F&B) industry is an extremely broad scope that includes raw materials, semi-finished, and finished products ready for sale to the consumers [
2]. In recent years, the F&B industry has taken advantage of technological resources in the production, packaging, and distribution processes to meet the customer requirements such as food safety, nutrition, and convenience. On the contrary, competition in the food market has become increasingly fierce and customer needs change rapidly. As a result, the F&B industry has to meet more new challenges to survive and grow. Moreover, the main raw materials used for the F&B industry came from natural resources and agricultural products. Additionally, domestic customers occupy a major proportion in the consumption of food and beverage products. Thus, the industry has a powerful impact on the agriculture sector in particular and the national economy in general. Therefore, the efficient performance of the F&B industry plays an important role not only in developing domestic economy, but also expanding the export market [
3].
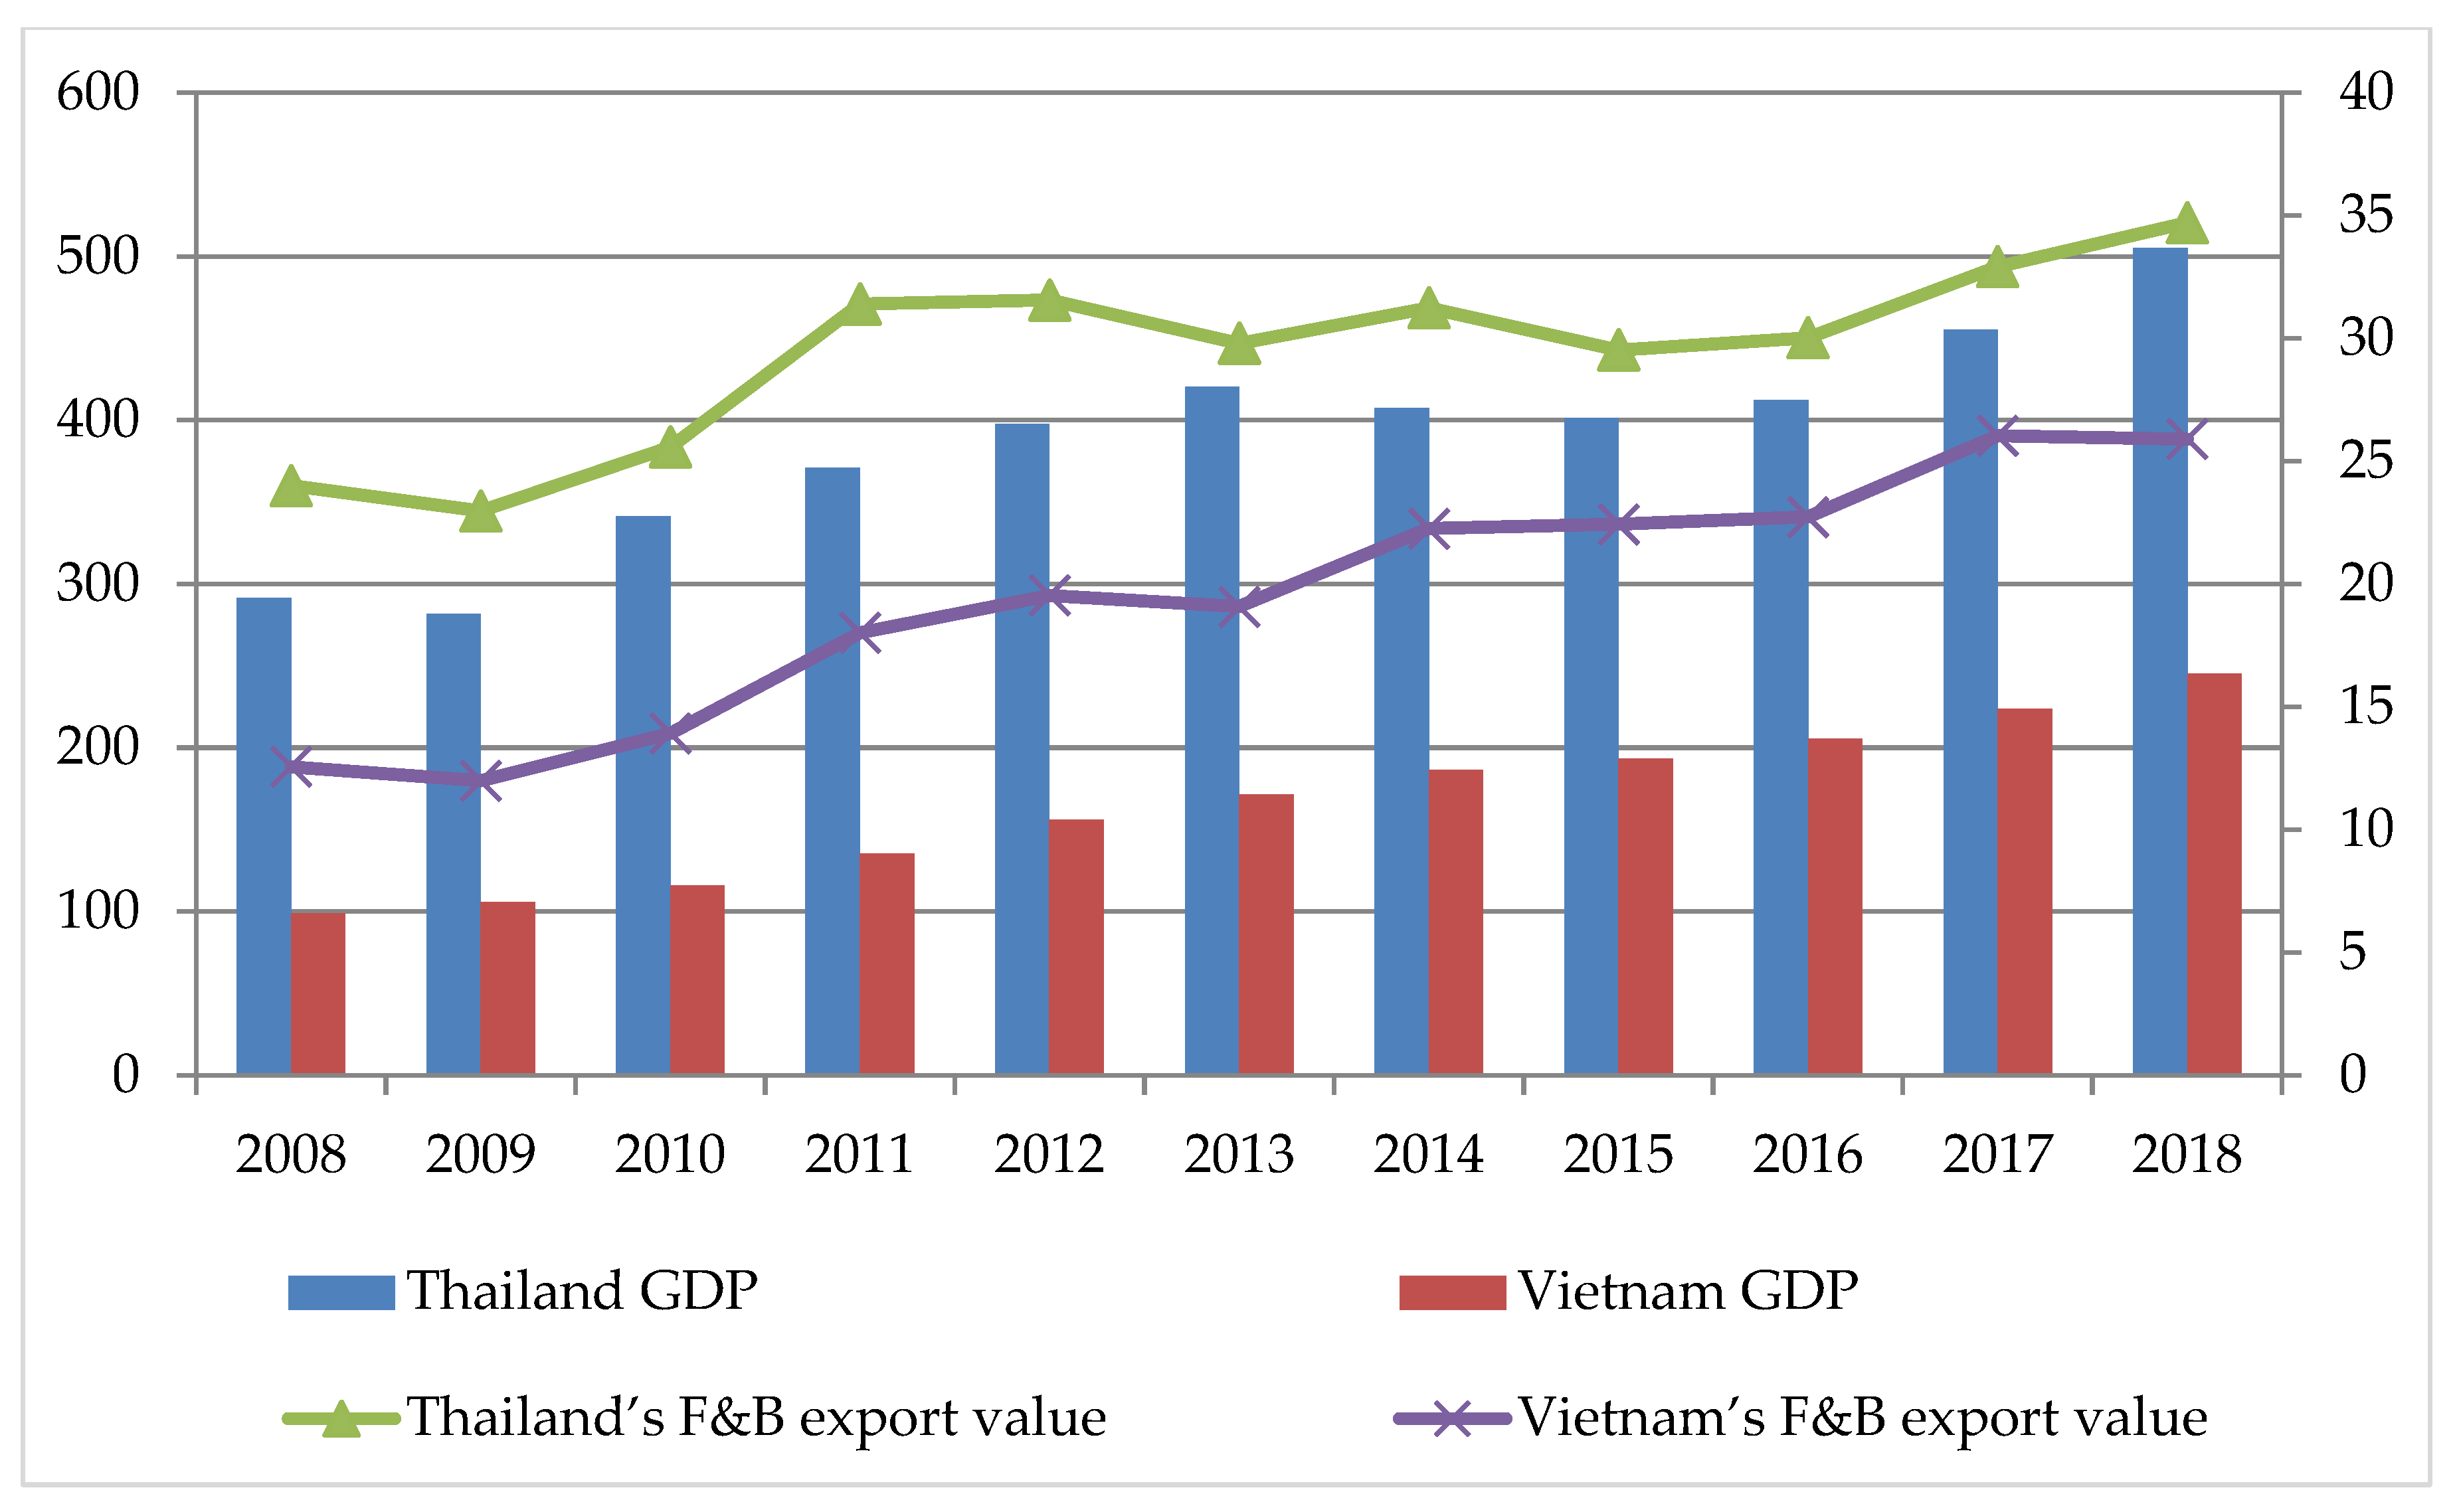
In the past decades, the food and beverage industry had a significant contribution to Asia’s overall economy. Thailand and Vietnam are two emerging economies that have the most potential to develop the F&B industry, not only in Asia but may have also outstretched in global regions. Thailand has long been referred to as “the kitchen of the world” with its abundant natural resources, highly educated and skilled labor force, and smart economic policies of their government [
4]. In Thailand, the F&B industry amounted to about 23% of the GDP and also the third-largest industry. The country is considered as the largest net food exporting country in the world and becomes the 3rd food exporter in Asia after the big giants, China, and India [
5]. Vietnam has a population of approximately 97 million people, 15th largest in the world, which is expected to grow to 100 million by 2020. Vietnam is also recorded as one of the fastest-growing countries in Asia recently, having achieved an average GDP growth rate of around 6–7% over the past 10 years, and is projected to continue growing by 6.5% in 2020 [
6]. At present, the Vietnamese F&B industry is one of the most thriving sectors in its growing economy; it occupies around 15% of the GDP of Vietnam in 2018 and has a steady growth of 7% annually [
7]. The reason for this expected growth comes from the positive indicators such as economic growth, GDP per capita, and advantages of the young population.
Figure 1 below shows the Gross Domestic Product (GDP) and the export value of the food and beverage industry (F&B) industry of Thailand and Vietnam during 2008-2018.
Despite the similarities and favorable conditions for growth, the Thai and Vietnamese F&B industry still faces great challenges. Food and beverage production is a complex matter, affecting peoples’ lives, profit of organization, and the benefits of stakeholders as well. According to Olsen et al. [
8], different ethical issues can be raised regarding this sector. One of those is the issue caused by the different interests of stakeholders such as food suppliers, consumers, and regulators [
9]. According to Zhu et al. [
9], in order to achieve food safety, the ethic of the food market must be established in which the policy with legalization should play the most important role. The safety of food is not just an issue of legal responsibility but also an ethical one. In order to ensure the safety of food, setting safety standards is the must do thing. However, setting standards is the easier part. The more challenging issue is how to actually and effectively implement those standards. According to Dospinescu et al. [
10], labelling is one important factor that affect the consumer’s decision to purchase a product. Therefore, the manufacturer tries to make the information on the label as attractive as possible. Additionally, this can lead to the ethical issue, too. The ethic of food safety is the most concern of all food companies.
Moreover, the rising worldwide competition and the evolution of consumer demand have been posing remarkable challenges for Thailand and Vietnam food and beverage companies. Due to the highly efficient and innovative global competitors, food and beverage firms have to face the increasing levels of competition. In addition, the requirement of the customer is getting higher, which requires firms to provide the high-quality products or services at suitable prices. Moreover, those firms are already encountering competition from other countries such as Korea, China, etc., those which have abundant resources, high technology, and lower labor costs [
11]. Looking from each country’s perspective, despite the same natural and human advantages, the value of the F&B industry in Vietnam is lower compared to Thailand. This leads to the competitive advantage of Thai products over than the Vietnamese goods. The reason for this problem, as assessed by experts, is because the food and beverage factories in Thailand strictly follow safety standards such as GMP, ISO, and HACCP as well as pay more attention to the brand improvement and the market requirements. Whereas, the Vietnamese F&B industry is considered to be lacking in terms of introducing new technologies and has not yet maintained and controlled the quality of products professionally [
12]. However, when assessing the potential of the F&B industry growth, with diverse agricultural products, a large domestic market, and the active adoption of new technologies, Vietnam is forecasted to be number one among the Asian countries to have a fast-growing F&B industry. In order to remain as one of the top countries in terms of food and beverage processing efficiency in the region, the improvement of the F&B industry is one of the most important determinants. Therefore, it has become one of the primary concerns of the government of both countries. To improve the efficiency of the F&B industry, taking current advantages is not enough, it also requires Thailand and Vietnam to overcome the existing limitations and challenges in this industry. Thus, an in-dept and comprehensive research evaluating the current performance, and forecasting the future operation, as well as examining the improvement from the past to the future of different firms operating in the industry is crucial, which motivated the authors to do this study.
This study applied the DEA resampling past-present-future model in measuring and forecasting the performance of the Thai and Vietnamese F&B industry. Unlike previous studies, the performance of their F&B industries is compared on a large scale by the t-test method. This gives readers an overview of the F&B industry in both these two emerging markets. Depending on the research results, the authors can examine the effectiveness of the two F&B industries and recommends several ways to encourage performance in the two countries. The authors’ optimism is that the research will identify the target companies which will have good performance in the future. This helps each company decide to expand the business or improve weaknesses in the companies that have bad performance in the future.
The research is organized as follows: Literature review is provided in
Section 2, the DEA resampling past-present-future model is presented in
Section 3, and
Section 4 contains the empirical analysis and results. The conclusions and suggestions are described in
Section 5 and 6, respectively.
2. Methodology Discussion and Related Literature Review
The act of benchmarking in firms is frequently restricted to contrasting the company′s bookkeeping information with openly accessible industry midpoints. Shockingly, this does not generally consider a company′s specific working conditions [
13]. Despite the fact that not all benchmarking devices apply to undertakings, research demonstrates that fitting benchmarking is compelling in improving execution in firms [
14]. One of the difficulties in benchmarking is choosing appropriate indicators for comparison [
15]. Some financial ratios are counted as the partial measures of efficiency such as sale per employee (labour productivity), rate of return on equity, rate of return of assets, etc. However, the major drawback of partial measures is that the firm may focus and perform well in one or some ratios but poorly using other indicators.
Additionally, there is a tight relationship between reputation and productivity. In other words, the productivity can influence the company’s reputation and also be influenced by the reputation. Corporate social responsibility and the safety of food are two major factors affecting the reputations of the food and beverage company [
16]. From above, it is obvious to see that the issue of choosing a suitable indicator is especially intense in small firms where firm-explicit data is not freely accessible [
13] and there are so many different factors that can have an impact on the performance productivity.
There are several methods used in measuring the efficiency of one particular sector such as the stochastic frontier analysis (SFA), deterministic Frontier Analysis (DFA), variable factor productivity (VFP), directional distance function (DDF), and total factor productivity (TFP) [
17]. Among these methods, DFA, SFA, and DEA were originally developed to measure and compare the efficiencies of decision-making units (DMUs) within a cross-sectional context [
18]. To deal with the ranking of DMUs, AHP is a common method.
In this section, the authors would like to compare four popular methods SFA, DEA, DFA, and AHP.
DFA is a parametric method. Therefore, it carries the advantages of the parametric method such as the ability to allow a random error in efficiency estimation [
18]. Additionally, this technique is flexible in measuring the frontier production function, which provides a meaningful estimate of the measurement error [
18]. Therefore, it enables the ability of modelling inefficiency and noise [
18].
The SFA was independently presented by Aigner et al. [
19] and Meeusen et al. [
20]. The strength of SFA is the possibility it offers for a richer specification, especially in the case of panel data and allowing for statistical noise [
18]. However, due to the need to form the efficiency frontier, this method requires strong assumptions, which is counted as one of the major disadvantages of SFA. Additionally, SFA does not permit the prediction of the technical efficiencies of DMUs that produce multiple outputs and requires a large number of DMUs.
On the other hand, the DEA is a nonparametric method, which is recently widely used in the measuring and analysis of efficiency in different sectors of the economy thanks to its unique ability to evaluate the efficiency of multiple-inputs and multiple-outputs without assigning prior weight to inputs and outputs and imposing a priori parametric restrictions on the underlying technology [
18]. Furthermore, DEA does not require the extract functional form between inputs and outputs approach [
18]. Therefore, recent theoretical and mathematical research has made important contributions to the deeper understanding of this approach. However, DEA also carries some draw backs. First of all, this approach does not have a solid statistical foundation. In addition, the conventional performance ratios used in DEA is influenced by several factors such as the price of inputs and outputs, the size of the firm, and other exogenous factors. Secondly, due to having no assumption of the functional form, the nonparametric approach does not allow a random error [
18].
The analytical hierarchy process (AHP) deals with multiple criteria decisions and is one of the popular methods to rank multiple alternatives [
21]. It enables the decision makers to determine the effect of many different unknown and complex situations; therefore, it helps in adjusting some priorities. Another advantage of this method is that the structure of AHP yields a simple route for a scholastic individual to take care of complex issues. However, this method needs to do the expert questionnaires; thus, there exists the cognitive biases which affect the judgments [
21]. Moreover, the more complex the decision is, the longer the comparison process. Additionally, group decision-making may make it difficult to handle consistency problems.
Each of the above alternatives has its own advantages and disadvantages. Thus, choosing one among these models requires different trade-offs regarding the type of data, the purpose of the study, etc. The DEA was found to be the most suitable method for this study.
As mentioned in the introduction part, the main purpose of this study is not only to measure and compare the efficiencies of the food and beverage sector in Thailand and Vietnam, but also to forecast the performance in the future. However, in the literature, there is no model in DEA that can deal with forecasting the future efficiency until Tone [
22] proposed the resampling model in DEA. Thus, previous researchers attempted to combine the DEA model with other methods such as Grey forecasting, which consumes a huge amount of time and effort. Tone’s resampling model named the past-present-future model not only can calculate the efficiency score of DMUs but also enables the researchers to predict the future value of inputs and outputs; thus, it suits the main purposes of this study very well. Therefore, this study will apply the resampling method proposed by Tone [
22].
The data envelopment analysis is a non-parametric approach that was applied to the productive efficiency of decision-making units (DMUs). After being introduced by Charnes et al. in 1978 [
23,
24], the DEA has been widely used in many industries including airlines, hospitals, banking, mining, logistics, and many other industries due to various advantages of the method [
25].
The DEA approach is commonly applied for evaluating the efficiency and competitiveness in the F&B industry in many countries. Rodmanee et al. [
11] applied a relational two-stage DEA to analyze the efficiency of 23 F&B companies in Thailand in 2011. The results showed that the low-efficiency score of the profit generation process leads to the low overall efficiency score of the companies. Lukac and Gardijan [
26] conducted a study on measuring the efficiency of the F&B industry in the central and east European countries by using DEA. In their study, the BCC model is applied to measure the efficiency of more than 200 very large companies from 13 central and east European countries over the period of 2005 to 2013. Results of that study revealed that there was no design within the effectiveness of the F&B industry and subsectors may well be recognized in spite of the fact that there were some nations found to be more productive than other nations over the observed period. Shamsudin et al. [
27] used the DEA to measure the market competitiveness of small and medium size firms in the Malaysian processing food industry over the period of 2000 to 2006. The result of Shamsudin’s study indicated that the technical efficiency of enterprises operating in the Malaysian processing food industry during the observed period was low at 0.75, implying that these companies have to expand the output by 24.4% in order to be efficient. Rina et al. [
28] presented an integrated simulation and the DEA model in improving the performance of the SME food production system in Malaysia. The results of the combination of these two models helped the companies find the best improvement model. The results provided useful information and good ideas for the SME food companies to strengthen and raise the efficiency of the production system. Kotey et al. [
29] utilized DEA to gauge the general effectiveness of SMEs in the Australian food, beverage, and tobacco manufacturing industry. The creators evaluated specialized effectiveness, cost productivity, and afterward utilized Tobit regression to clarify the variation in the levels of efficiency. The outcomes proposed that family firms and firms with a low organization enrollment were less effective than other firms. A study by Giokas et al. [
30] investigated the efficiency of Food and Beverage producers in Greece during the period of 2006 to 2012. In this study, the Malmquist productivity index showed that the productivity witnessed a slight progress during the research period, and this was primarily caused by a decreased technical efficiency and an increased technology efficiency. Moreover, the study found that pure technical inefficiencies are the main cause of overall technical inefficiencies. A study conducted by Gardijan and Lukač [
31] used the BCC output—an oriented model to evaluate 7000 companies from the F&B industry in the 19 EU countries between 2011 and 2015. They found the leading countries in the F&B industry and which countries have the largest percentage of inefficiency companies. In addition, the model identified the cash liquidity factor as the principal area of inefficiency of countries. Finally, they also suggested that the EU offers specialized funds, procurement and economic policies to support companies overcome difficulties on a country level. Recently, Pervan [
32] estimated the overall technical, pure technical as well as the scale efficiency of large Croatian firms operating in the F&B industry by using both CCR and BCC output-oriented models. Findings of this study confirmed that the DEA can identify the efficient and inefficient firms. Additionally, Pervan’s study found that the F&B firms in Croatia have the high overall technical, pure technical, and scale efficiency; however, those firms seem to over-utilize the existing scale size.
Positive results of previous studies confirmed that the DEA is a useful tool for evaluating and comparing the efficiency of firms in the F&B industry. However, in the literature, DEA models are only applied to analyze a firm’s performance in the past and present without fully evaluating a firm’s efficiency by explicitly considering its inputs and outputs including the past-present-future time span. One of the most popular models used to forecast the efficiency is the Grey model GM (1,1) thanks to its computational efficiency [
33]. Chiou et al. [
34] applied the Grey model GM (1,1) in forecasting the demand for planned spare parts in the navy of Taiwan. Zhou and He [
35] applied the Grey GM (1,1) model in forecasting the production of fuel. Many other studies using the Grey model in forecasting various fields can be found in the literature [
36,
37,
38,
39,
40,
41,
42,
43]. Researchers combined the use of the DEA and Grey model in measuring and forecasting efficiency [
44,
45,
46,
47,
48] due to the lack of the DEA model which can forecast the future efficiency. However, recently, Tone [
22] proposed the one DEA model named resampling past-present-future which not only allows the research to evaluate the efficiency based on historical data but also enables researchers to predict the future value of inputs and outputs which can be used later to measure the efficiency for future years/period. Chia-Nan Wang [
47] measured the performance of certain countries and Lai-Wang Wang [
48] evaluated the cost efficiency of Vietnamese Commercial Banks in the past-present-future time by applying resampling models to forecast the future performance in their researches. These studies prove that the resampling models are suitable models for forecasting the future efficiency. In conclusion, despite the similarity of the research model, these studies just stopped at analyzing the F&B industry on a small scale and there is no study found on the performance assessment of the F&B industry in countries.
3. Materials and Methodologies
3.1. Research Process
The DEA resampling past-present-future model is applied to measure and forecast the performance of the F&B industry in Thailand and Vietnam. The authors use historical data from 2016 to 2019 to measure the actual performance of 40 selected companies from the F&B industry of Thailand and Vietnam. Then, the resampling past-present-future model is applied to forecast the performance in the future period from 2020 to 2023. From the results and analysis, the productivity of Thailand and Vietnam will be compared according to the past, current, and future perspective by using a t-test. This study was divided into four parts.
Part 1: Research Background
First, the authors identify the research question. Then, the topic under investigation will be given a broad study and the related literatures reviewed. In reality, the F&B industry in both countries have recently met some challenges in promoting sustainable development and to improve the quality of human life. Some theories and a database were chosen and studied including the historical information and development process, the real situation of this industry, etc. Additionally, the authors also have considered historical researches in this field.
Part 2: Data collection
The collection of data is a critical step in providing the information needed to answer the research question. The actual study begins with the collection of data. From the data collection, the authors continued to choose input/output factors and data correction for the field of research.
Part 3: Data analysis
Data analysis is the core of the research process, in which the authors coordinate several DEA models to measure and estimate the relative efficiency of the F&B companies. In the first stage, the authors applied the Super-SBM model to measure the efficiency of 40 selected food and beverage companies in Thailand and Vietnam during the past period from 2016 to 2019. Secondly, the resampling method is used to forecast the efficiency of these companies over the period of 2020 to 2023. The Malmquist productivity index is one of the most widely used methods which helps compare a variety of productivity changes of companies in the industry [
49]. In the past recent decades, this index has demonstrated to be an extremely helpful apparatus for estimating the efficiency change of DMUs [
50]. MPI provides several advantages compared to others such as the Fishers index. Firstly, the calculation of MPI just requires a limited number of inputs and outputs without the need of many modifications. Secondly, MPI does not need the evaluator to make an attempt to maximize the output or minimize the inputs. Furthermore, MPI does not rely on the fixed weight of inputs and outputs. Thanks to these advantages, MPI has been widely applied. Therefore, it is employed in this study at the last stage to estimate the productivity changes over the period of 2016 to 2023.
Part 4: Results and Discussions
This study mainly focuses on the results obtained from the Super-SBM model, resampling, and Malmquist model to understand clearly the recent situation of the Thailand’s and Vietnam’s F&B industry. Then, the empirical results will be checked and summed up in a way straightforwardly identified with the exploration issue. In light of the research results, the authors will provide some suggestions.
3.2. Super Efficiency model
In this research, the authors used the Super Efficiency SBM model to evaluate the efficiency of a company each year. The research used a DEA model “Slacks-based measure of super-efficiency”, this model was introduced by Tone [
50], which was developed on the slacks-based measure of efficiency model.
The authors will deal with
n DMUs with input and output matrices
, and
, respectively. The λ is a non-negative vector in
. The vectors
and
indicate the input excess and output shortfall of this expression, respectively, and are called slacks. The SBM model in a fractional form is as follows:
Subject to: and , .
In this research, we discuss the super-efficiency issues under the assumption that , i.e., the DMU is super-SBM. This situation is equal to = 0 and = 0, in the optimal solution, the inputs are guaranteed and the output is stable. The efficiency which is used to measure the SBM returns between 0 and 1.
Tone [
50] discriminated these efficient DMUs and ranked the efficient DMUs by using the super-SBM model. Assuming the DMU
is SBM-efficient,
and the super-SBM model will be followed:
If the output r has no positive elements, then it is defined as
=
= 1. The term is replaced by
in the objective function in the following way (value
never changes in constraint conditions).
The B esteem within the DEA-solver is 100. In any case, the recommendation is positive and more tightly than . Furthermore, it is inversely proportional to the distance and it is related to the magnitude of the unsupportive output. The score obtained is the units’ invariant, i.e., it is independent of the used measurement unit.
3.3. Resampling Model in DEA
According to Chang et al. [
51], it is very important to assess the past, the present record, and the future potential when evaluating the performance of any DMU. However, it needs to combine different methods if the past, the present record, and the future performance is taken into account together such as combining between the DEA and Grey model. Tone [
22] proposed one model in DEA that can deal with this issue, named resampling past-present and resampling past-present-future based on the resampling approach. The past-present model estimates the confidence interval of the DEA score over the past and present time frame based on the super slack-base measure model (super-SBM), and then this model is extended to the past-present-future time frame [
22].
3.3.1. Resampling Past-Present Model
Let us consider () (t = 1,…, T) is the matrix of the historical inputs and outputs. Where t =1 is the first observed period and t = T is the last observed period with the input vector ( and the output vector () and n is the number of DMU.
First, the DEA model that is used to obtain the efficiency is chosen. Tone [
22] chose to use the super-SBM model as this model is not bounded by unity (
) which causes the difficulty in comparing efficient DMUs.
Secondly, the weight is set. The choice of weight depends on the decision maker’s perspective and knowledge of how the past should influence the present. In this paper, we follow the weight chosen by Tone [
22]: The
for a period t with an assumption that more recent periods carry information that is more relevant to estimate efficiency scores in the present. Thus, the following Lucas number series
, is a candidate where
. Let
L be the sum of the series:
L =
. The weight
then is defined by:
Thirdly, the confidence interval is gauged by using replicas of historical data based on bootstrapping. As replicas are representative of the dataset, the preliminary analysis of the data should be done in order to find out about features of datasets [
22]. If the replicas are not representative of the dataset, they should be rejected and resampled again. However, for the dataset which is non-correlated and homoscedastic, the hypothesis test or confidence interval based on Fisher′s z transformation can be applied to compare the patterns in the past and present data. The correlation between all pairs of inputs, outputs, and input-output of all DMUs can be computed for the present time period data. Then, computing their 95% confidence intervals using Fisher’s z transformation [
52]. The resampled data will be discarded or approved based on the corresponding correlation. If the corresponding correlation is in the range of this interval, the resampled data is accepted vice versa and the resampled data is discarded if the corresponding correlation is out of the interval’s range. Therefore, the inappropriate samples of the last period are eliminated from the sampling. This 95% confidence interval is optional; however, the narrower the interval is, the closer the sample will be to the last period data [
52].
3.3.2. Past-Present-Future Based Resampling
After obtaining the confidence interval of the last period’s scores, the forecast for the future namely
is obtained by using the past-present data
with (t = 1, …, T) and forecasting the efficiency score of DMU in the future time period along with their confidence intervals [
42]. In this resampling, the past-present time-based framework is extended to the past-present-future time-based framework. To do that, first, the future is forecasted by letting the following be the observed data of the past-present with a certain input i (i = 1,…, m) and output r (r = 1,…, s) of a DMU:
We wish to forecast
from
. There are three predictions that are introduced to obtain the forecasts named the Trend analysis, Lucas weight analysis, and the hybrid model [
22]. Once obtaining the forecasts, the super-efficiency score of the future time period will be estimated.
3.4. Malmquist Productivity Index
Caves et al. [
53] proposed the Malmquist productivity index (MPI) to assess changes in the general profitability development of each DMU over two years by ascertaining the efficiency score. To evaluate the total F&B performance of DMUs, this study applied the original and extended MPI by Färe et al. [
54].
The output based MPI with time t and t + 1 technology are defined by Caves et al. [
53] as:
If (or ) indicates that the DMU performance has increased or declined.
Färe et al. [
54] decomposed the MPI into two different components as (1) the efficiency change or catch-up effect and the technical changes or frontier-shift effect, then the total productivity change will be the product of these two components. By decomposing different components, this act can avoid difficulties in choosing reference technologies, i.e., whether to use time t or t+1 technologies. The catch-up effect reflects the change in DMU’s efficiency while the frontier-shift demonstrates the fluctuation in the efficient frontier. The MPI index is calculated as follows:
MPI > 1 means the productivity improved between period t + 1 and t. On the other hand, MPI < 1 indicates productivity deterioration. Since the total productivity changes are the product of efficiency change and technical change, the productivity improvement is influenced by the change in efficiency and technical.
3.5. The Data Collection
Data collection (or called decision-making unit (DMU) collection): This study used the database of traded corporations in the F&B industry in Thailand and Vietnam. Data of inputs and outputs over the period of 2016 to 2019 were collected from Vietstock [
55] and Thaistock [
56]. These two sources published the financial statement of all the public joint-stock companies in the two countries. After considering the data availability of these companies, the authors selected the data of the 20 largest companies in Thailand and the 20 largest companies in Vietnam in terms of total assets for the period of 2016 to 2019 to consider and evaluate the performance, which is listed in the following
Table 1.
Establish inputs and output variables: Input and output variables should be chosen before applying DEA for the calculation of efficiency scores. Based on literature reviews of the DEA and the F&B industry as shown in
Table 2 as well as the suitable correlation between the input and output [
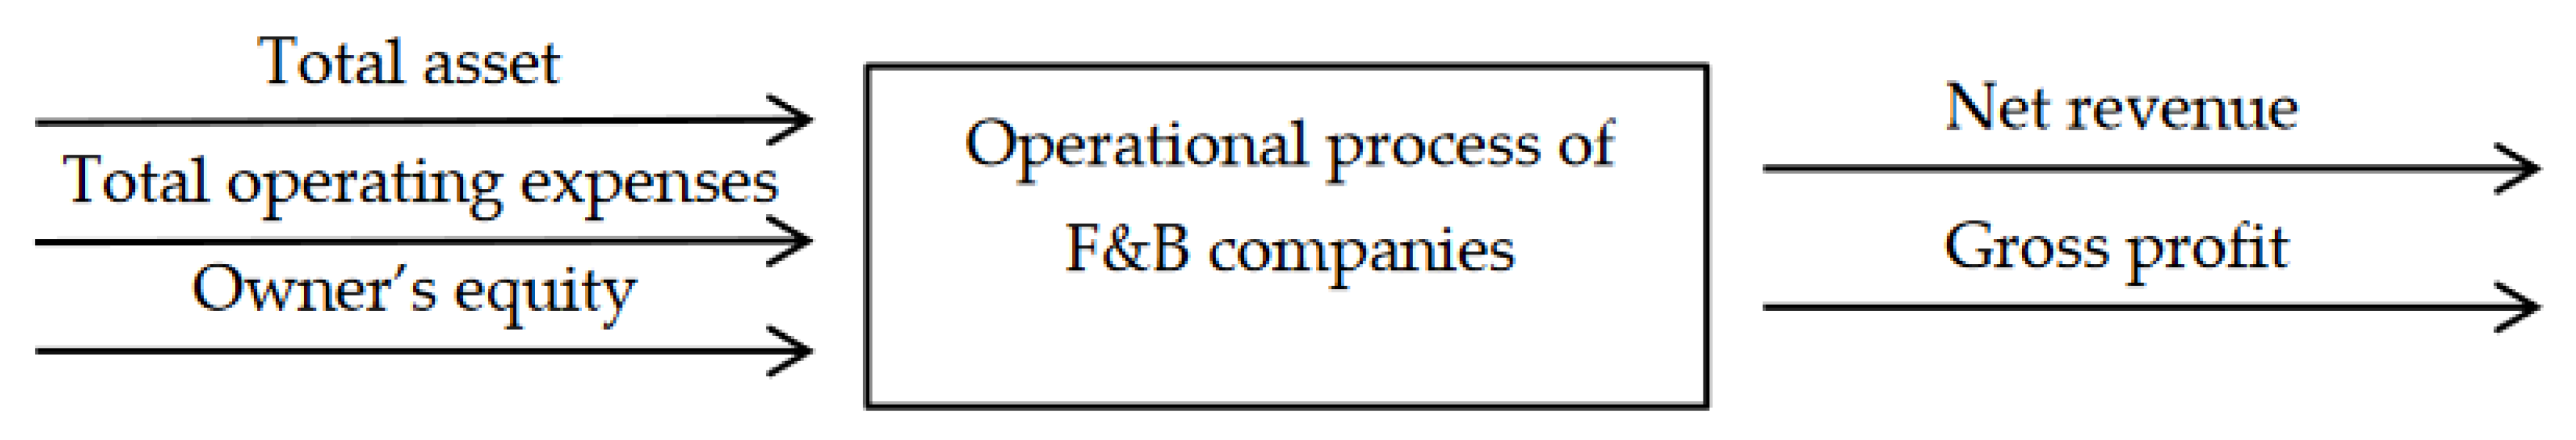
57], the authors decided to select three input factors, this includes total assets (TA), total operating expenses (TOE), and owner’s equity (OE), while net revenue (NR) and gross profit (GP) are chosen as output factors. The operational process of F&B companies is presented in
Figure 2 whereas the statistical data between 2016 and 2019 was shown in
Table 3.
4. Empirical Analysis and Results
4.1. Efficiency over the Period of 2016 to 2019
The super-SBM model is applied in this section to measure the efficiency of both Thailand and Vietnam food and beverage companies. The obtained super-efficiency scores are presented in
Table 4 along with the graph presenting the comparison of the average efficiency score of two countries over the past period 2016 to 2019 in
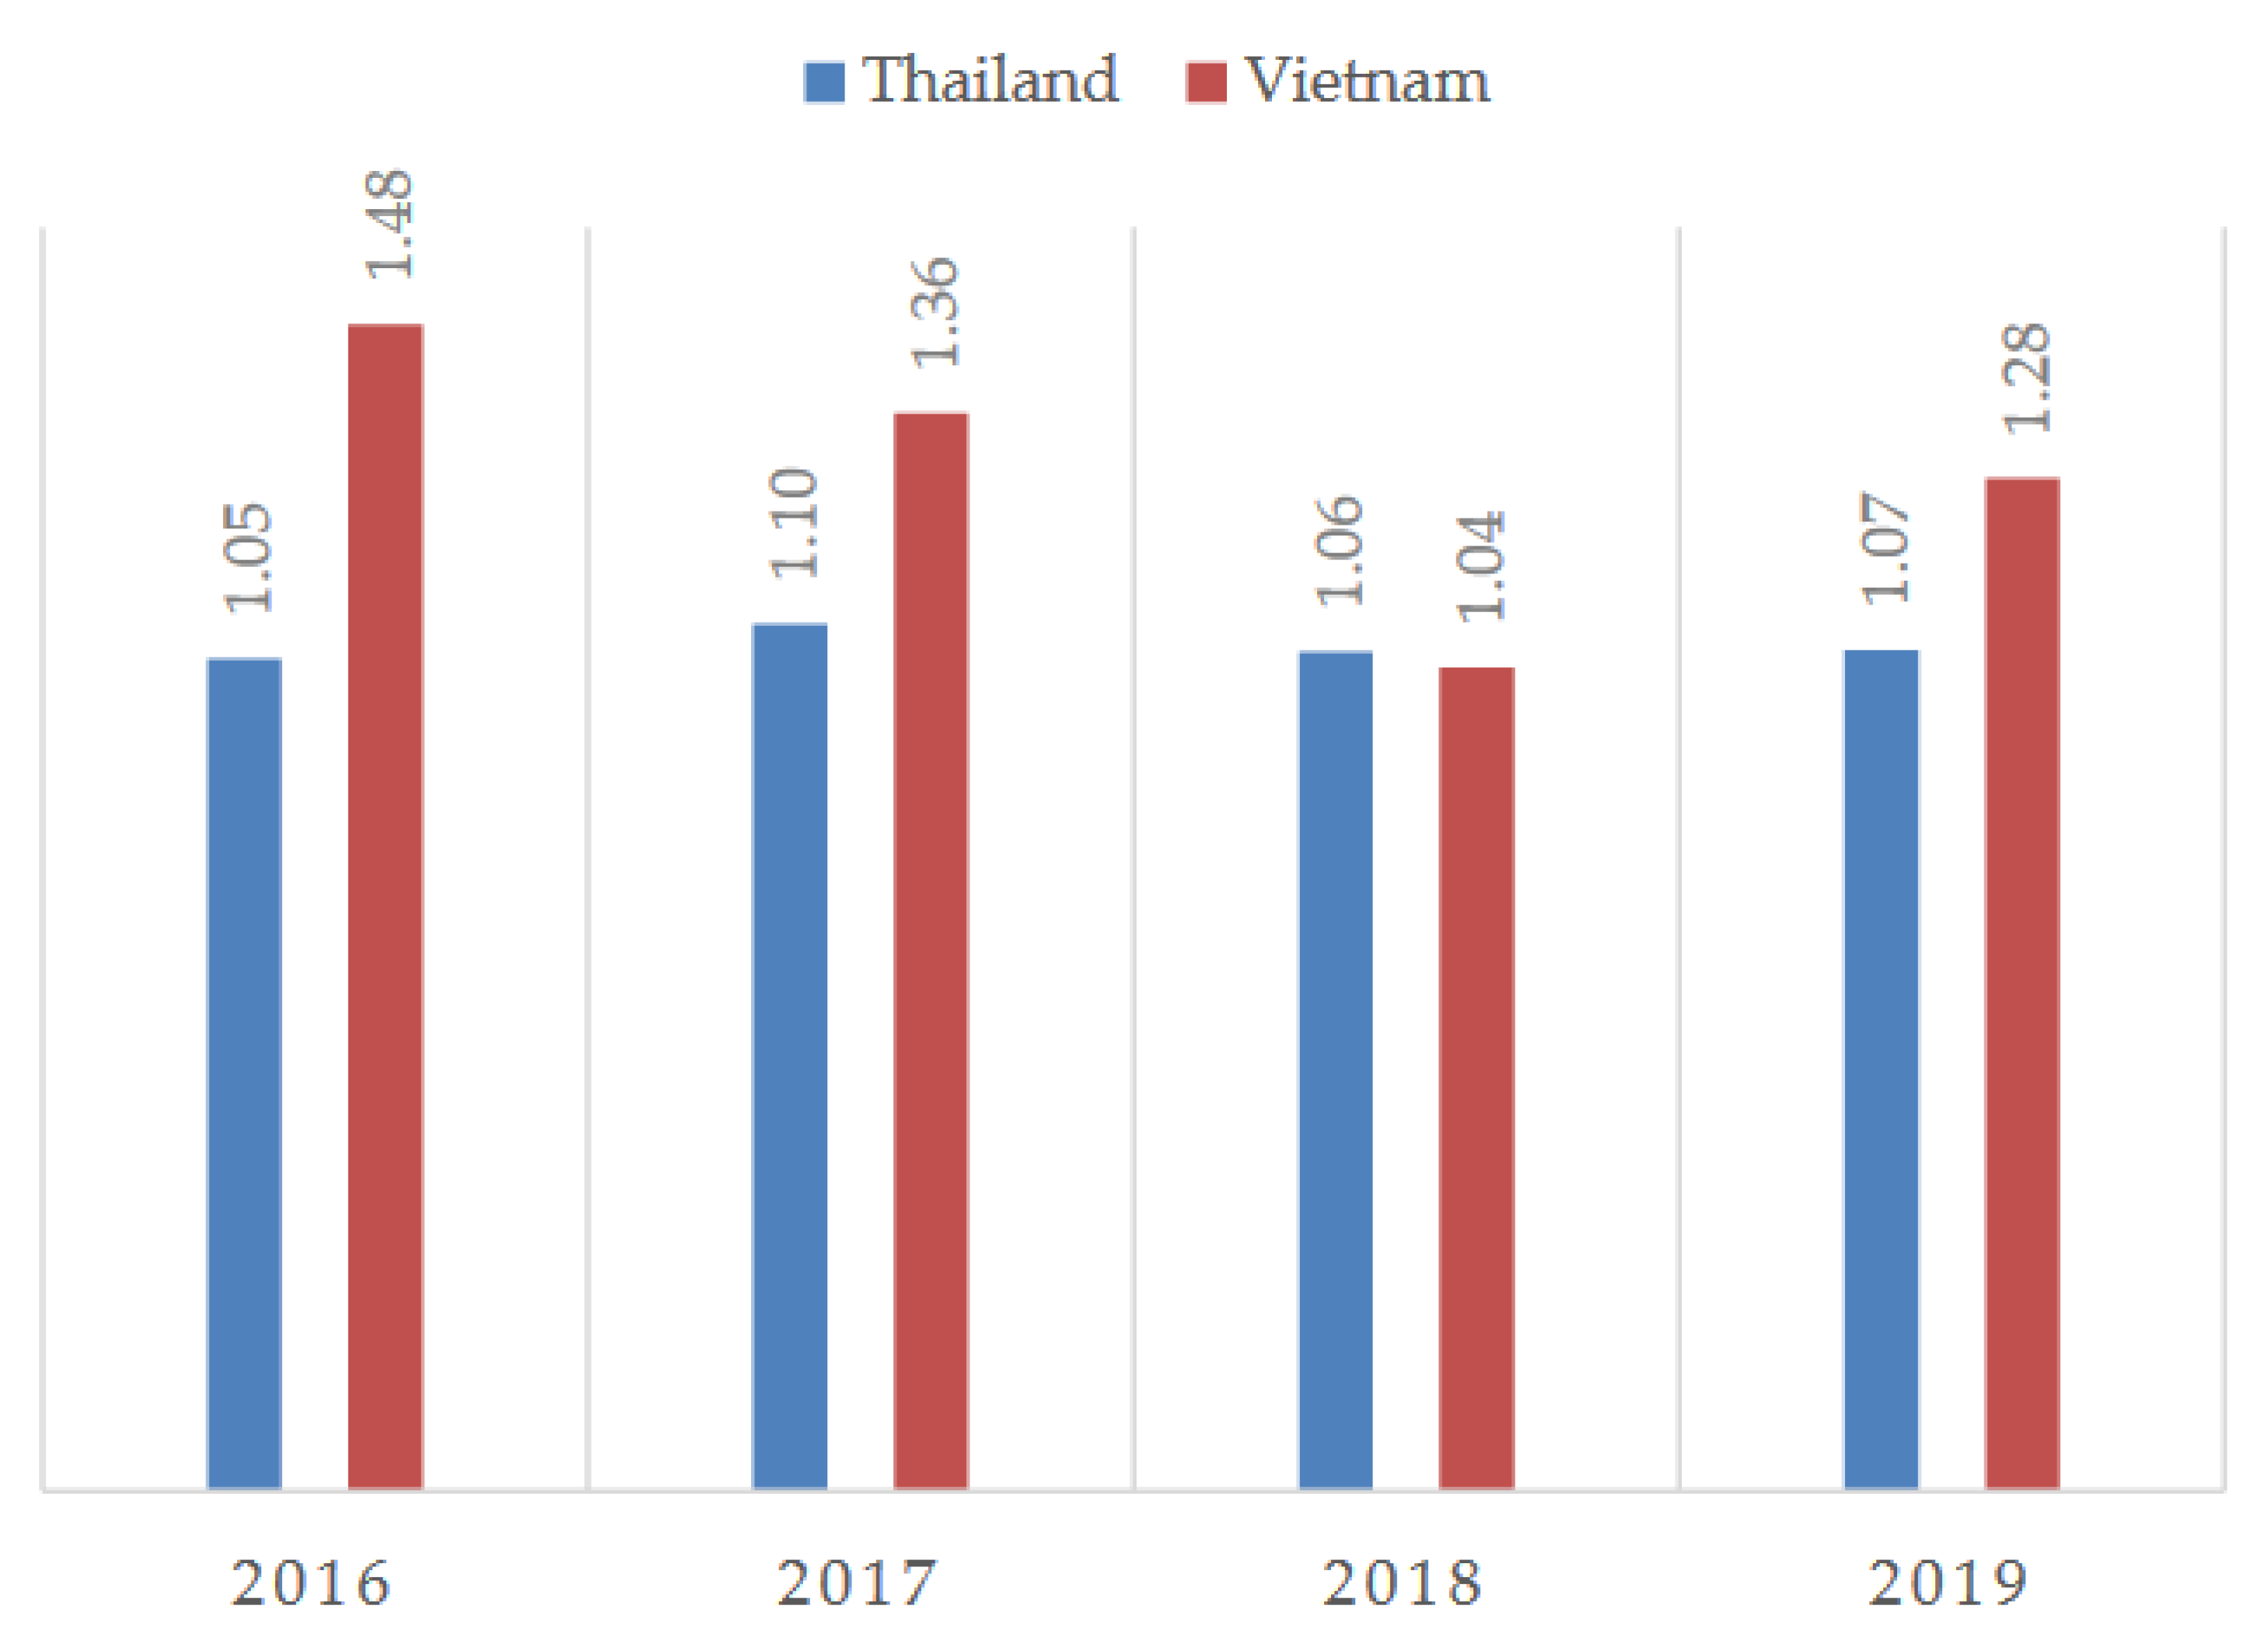
Figure 3.
As observed, the efficiency scores of Thailand firms slightly fluctuated and reached the overall average score of 1.07 over the period of 2016 to 2019. The average score for the four-year-period was 1.07 indicating that as a whole, Thailand food and beverage firms operated well and were found to be efficient. However, it is noted that among the 20 selected firms, there are some efficient while some firms are inefficient and the distance between the lowest and the highest score are notable as presented in
Table 4 in which the lowest is 0.39 and the highest is 1.63. This finding implies that some firms are good at balancing inputs and outputs, on the other hand, some companies are very bad at controlling inputs.
For the case of Vietnamese companies, the overall average score of the entire period is 1.29, indicating as a whole that these 20 companies are efficient. However, the efficiency score tends to decrease over an observed period. The highest was found in the beginning of the year 2016 with the score of 1.48 then noticeably went down to 1.36 in the next year 2017, then sharply dropped to the lowest in 2018 with the score of 1.04, after that the score significantly increased to 1.28 in 2019. In general, the score of these 20 Vietnamese companies fluctuated, which is hard to predict the trend in the future.
In comparison, Vietnamese companies have a higher score than Thailand’s, which implies that Vietnamese firms are operating better than those of Thailand. The comparison of average score during 2016 to 2019 is illustrated in
Figure 3. As mentioned above, the distance between the highest and the lowest score among Thailand companies are notable and this is also true in the case of Vietnamese firms. The highest score of Vietnamese food and beverage companies is 5.81 while the lowest is just 0.31. The big gap between the lowest and the highest score indicates the difference in balancing inputs and outputs of these companies. The excess of inputs, particularly the use of too much operating expense is the main reason for the low score. For example, the case of firm VN4, as shown in the slack analysis, the overuse of 68.5% of the operating expense while there is around a 57.4% shortage of revenue, are the reason for the inefficiency. The same is observed for the Thailand firm that has the lowest score-TL8. The excess of approximately 57% in the operating expense caused the inefficiency. In order to be efficient, these companies must better control the price of materials needed to produce products along with improving other factors influencing the operating cost such as equipment and labour productivity.
Additionally, as observed, although Thailand has the lower average efficiency score than Vietnam, the number of efficient companies of Thailand is greater. There are 12 out of 20 selected Thailand companies that are found to be efficient, which accounted for 60% while among the 20 sample Vietnamese companies, nine are efficient (45%). According to the efficiency scores, it is seen that the higher efficiency score of Vietnamese firms is caused by the extreme high score of VN12 in the year 2019 (6.91) and VN11 in 2016 and 2017 with the score of 11.4 and 9.14. If these two companies are not included in the sample size of Vietnam, the average score of Vietnam will be lower than those of Thailand.
4.2. The Past-Present Framework Illustration
In this stage, the past-present model is applied to obtain the efficiency scores of the year 2019, which will be used as the basis to compare the accuracy of the forecast model in the next stage. The authors would like to examine the variation of the scores by using the different numbers of the replicas. The results of 5000 vs. 500 replicas in the case of Thailand are presented in
Table 5 which indicated that the results obtained with a 95% confidence interval was statistically negligibly small while with the DEA scores are exactly the same. Thus, 500 replicas can be applicable in this research.
The correlation matrix of the observed year (2019) is described in
Table 6. The correlation value ranges from −1 to +1 and the closer the value is to (±1), the closer the relation between variables.
Table 6 confirms the significant and positive correlations between inputs and outputs. Therefore, the selected inputs and outputs are suitable.
4.3. The Past-Present-Future Framework Illustration
In order to forecast the efficiency of a total of 40 food and beverage companies in the future period, the past-present-future model is utilized in this sector. To forecast the future performance, the period of 2016 to 2018 is considered as the past-present while the year 2019 is considered as the future. Secondly, three different predictions (trend, Lucas weight, and the hybrid model combining the trend and Lucas weight models) are used to obtain the forecasted efficiency of year 2019. Then, the actual efficiency score obtained in the above section will be used to compare with the forecast score to test the accuracy of the predictions. As mentioned above, 500 replicas are acceptable; therefore, this section also applied 500 replicas with the 95% confidence interval to forecast the future efficiency score of 40 Vietnamese and Thailand companies operating in the food and beverage industry.
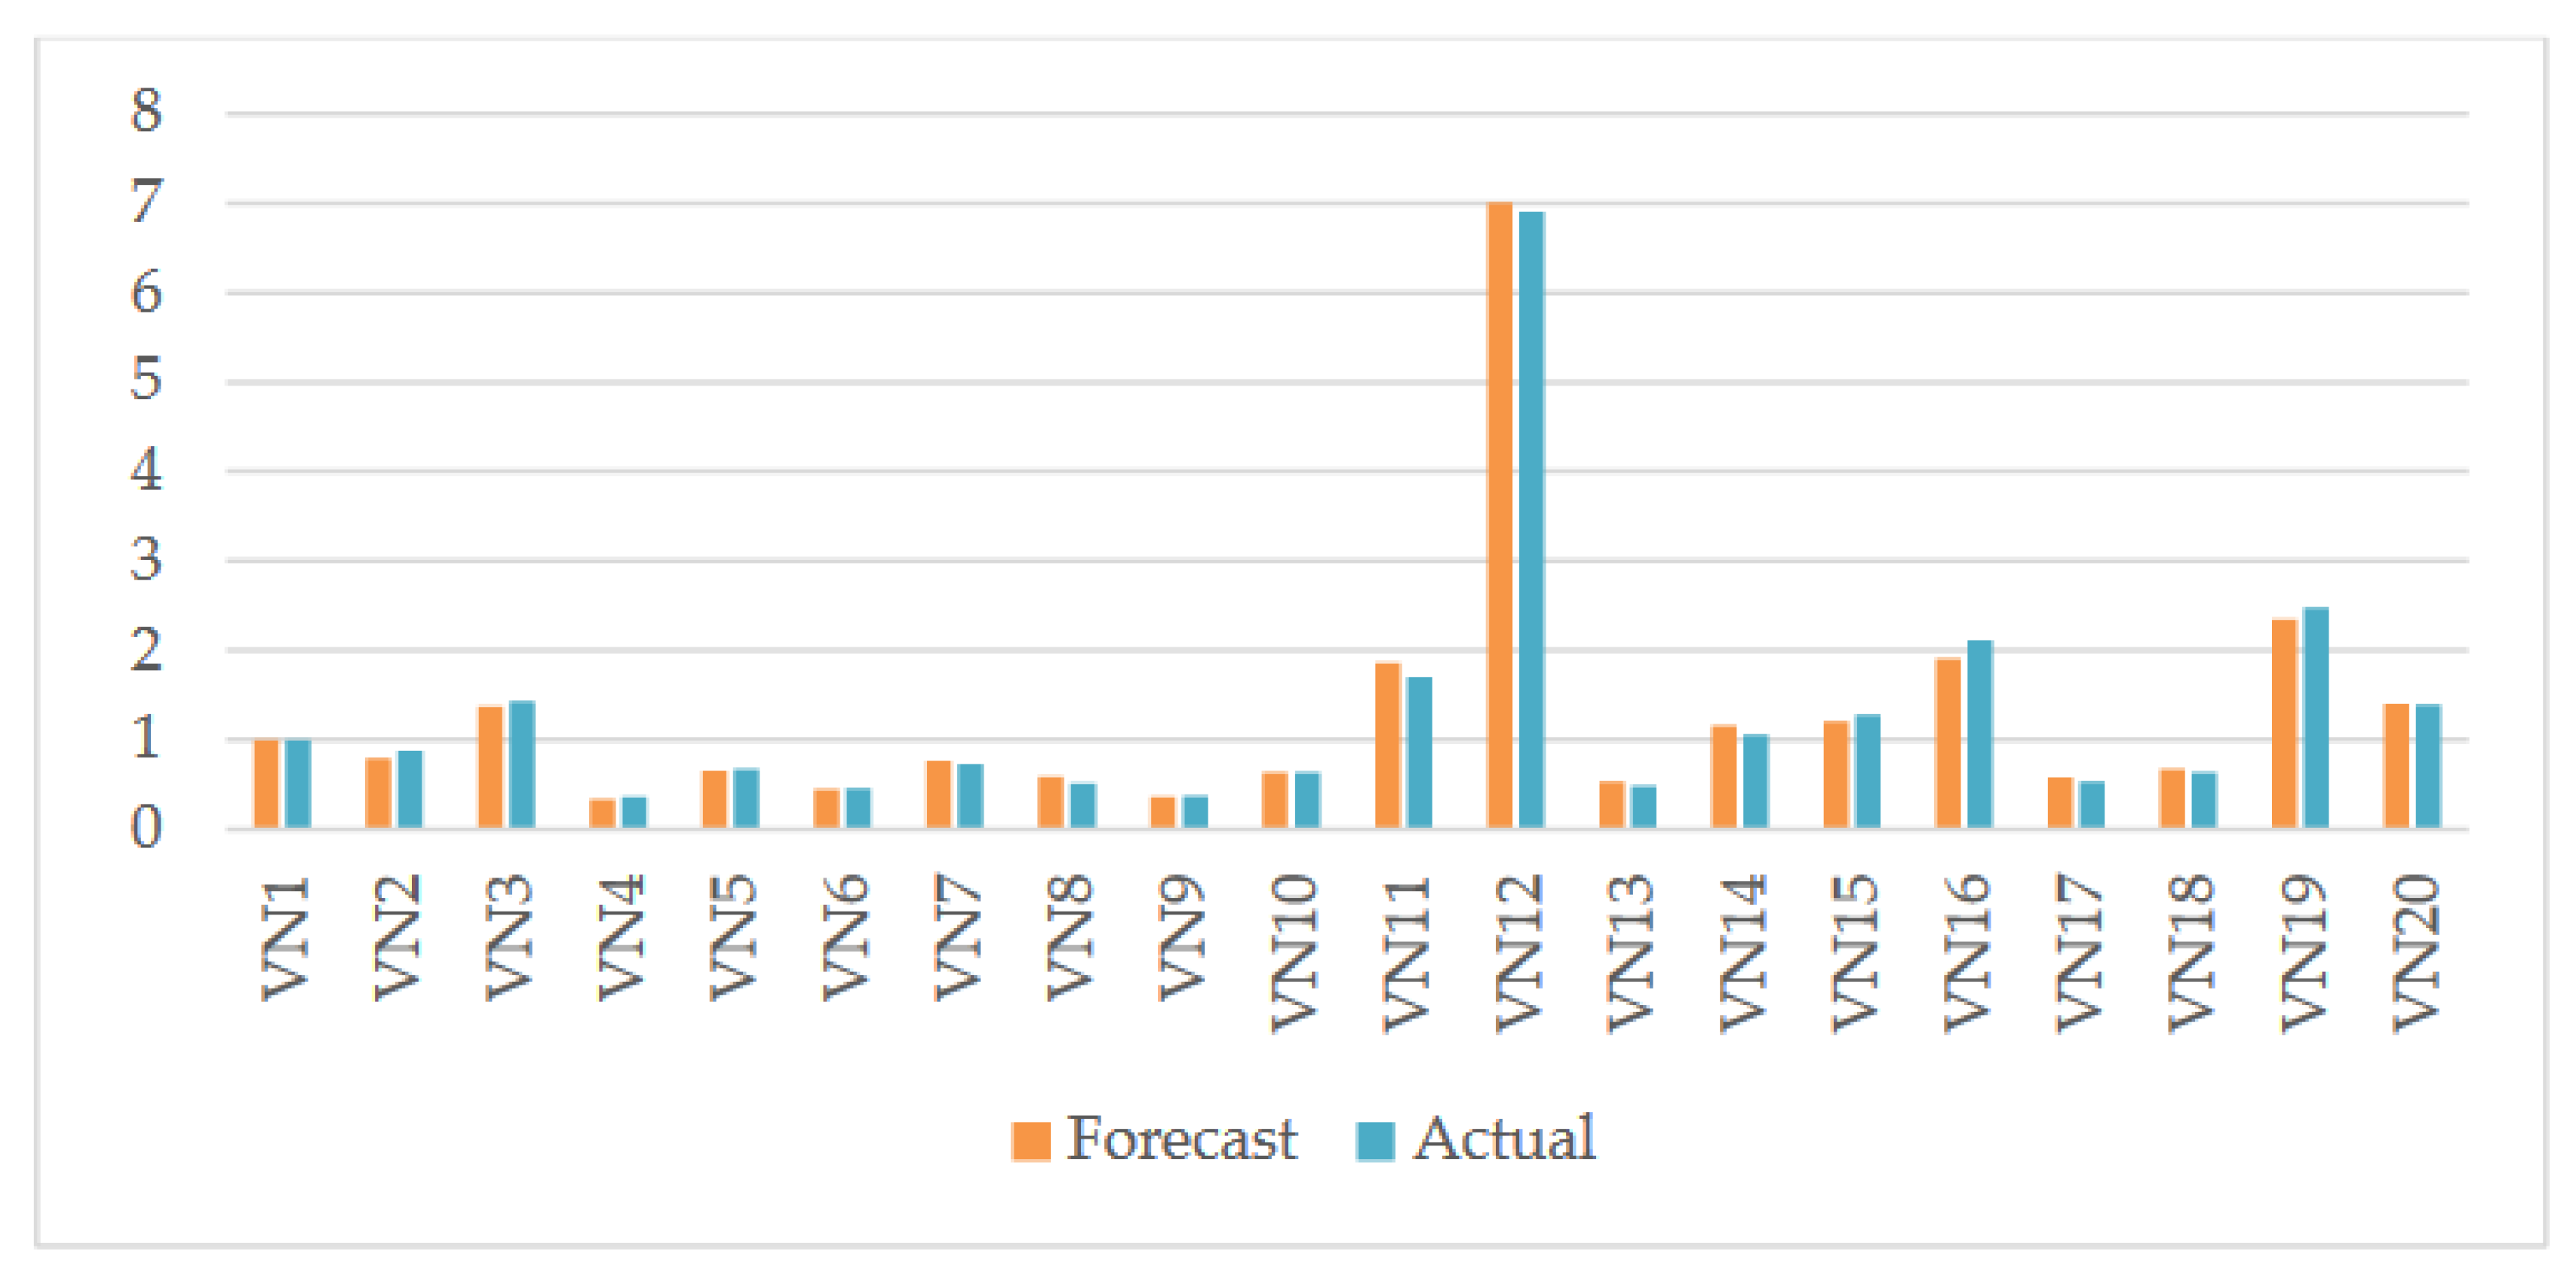
First, the comparison between the actual score of 2019 and efficiency scores obtained by the trend prediction showed that of the 40 sample companies, the actual scores of all 40 companies that are included as the actual scores are not within the 95% confidence interval and the average Forecast-Actual is 14%. Secondly, by using the Lucas weight prediction, the actual scores of all 40 companies are included in the 95% confidence interval and the average Forecast-Actual is 7%. Lastly, by using the hybrid model, the results also indicate that all actual scores of the 40 companies are included and the average Forecast-Actual is 10%.
The results of these three predictions are consistent and the average of Forecast-Actual over the 40 DMUs is lowest in the Lucas weight model. Based on the above results, the Lucas weight model is selected to forecast the efficiency score of the next four years from 2020–2023.
Table 7 presents the comparison between the actual and forecast score (forecasted by the Lucas weight model) of year 2019 along with the graph presenting the comparison in
Figure 4 and
Figure 5.
4.4. Future Forecast Performance Evaluation Results-Efficiency over the Period of 2020 to 2023
The efficiency scores of 40 Vietnamese and Thailand companies over the future period of 2020 to 2023 will be forecasted by applying the past-present-future model with the Lucas weight prediction.
Table 8 displays the efficiency score during 2020 to 2023 while
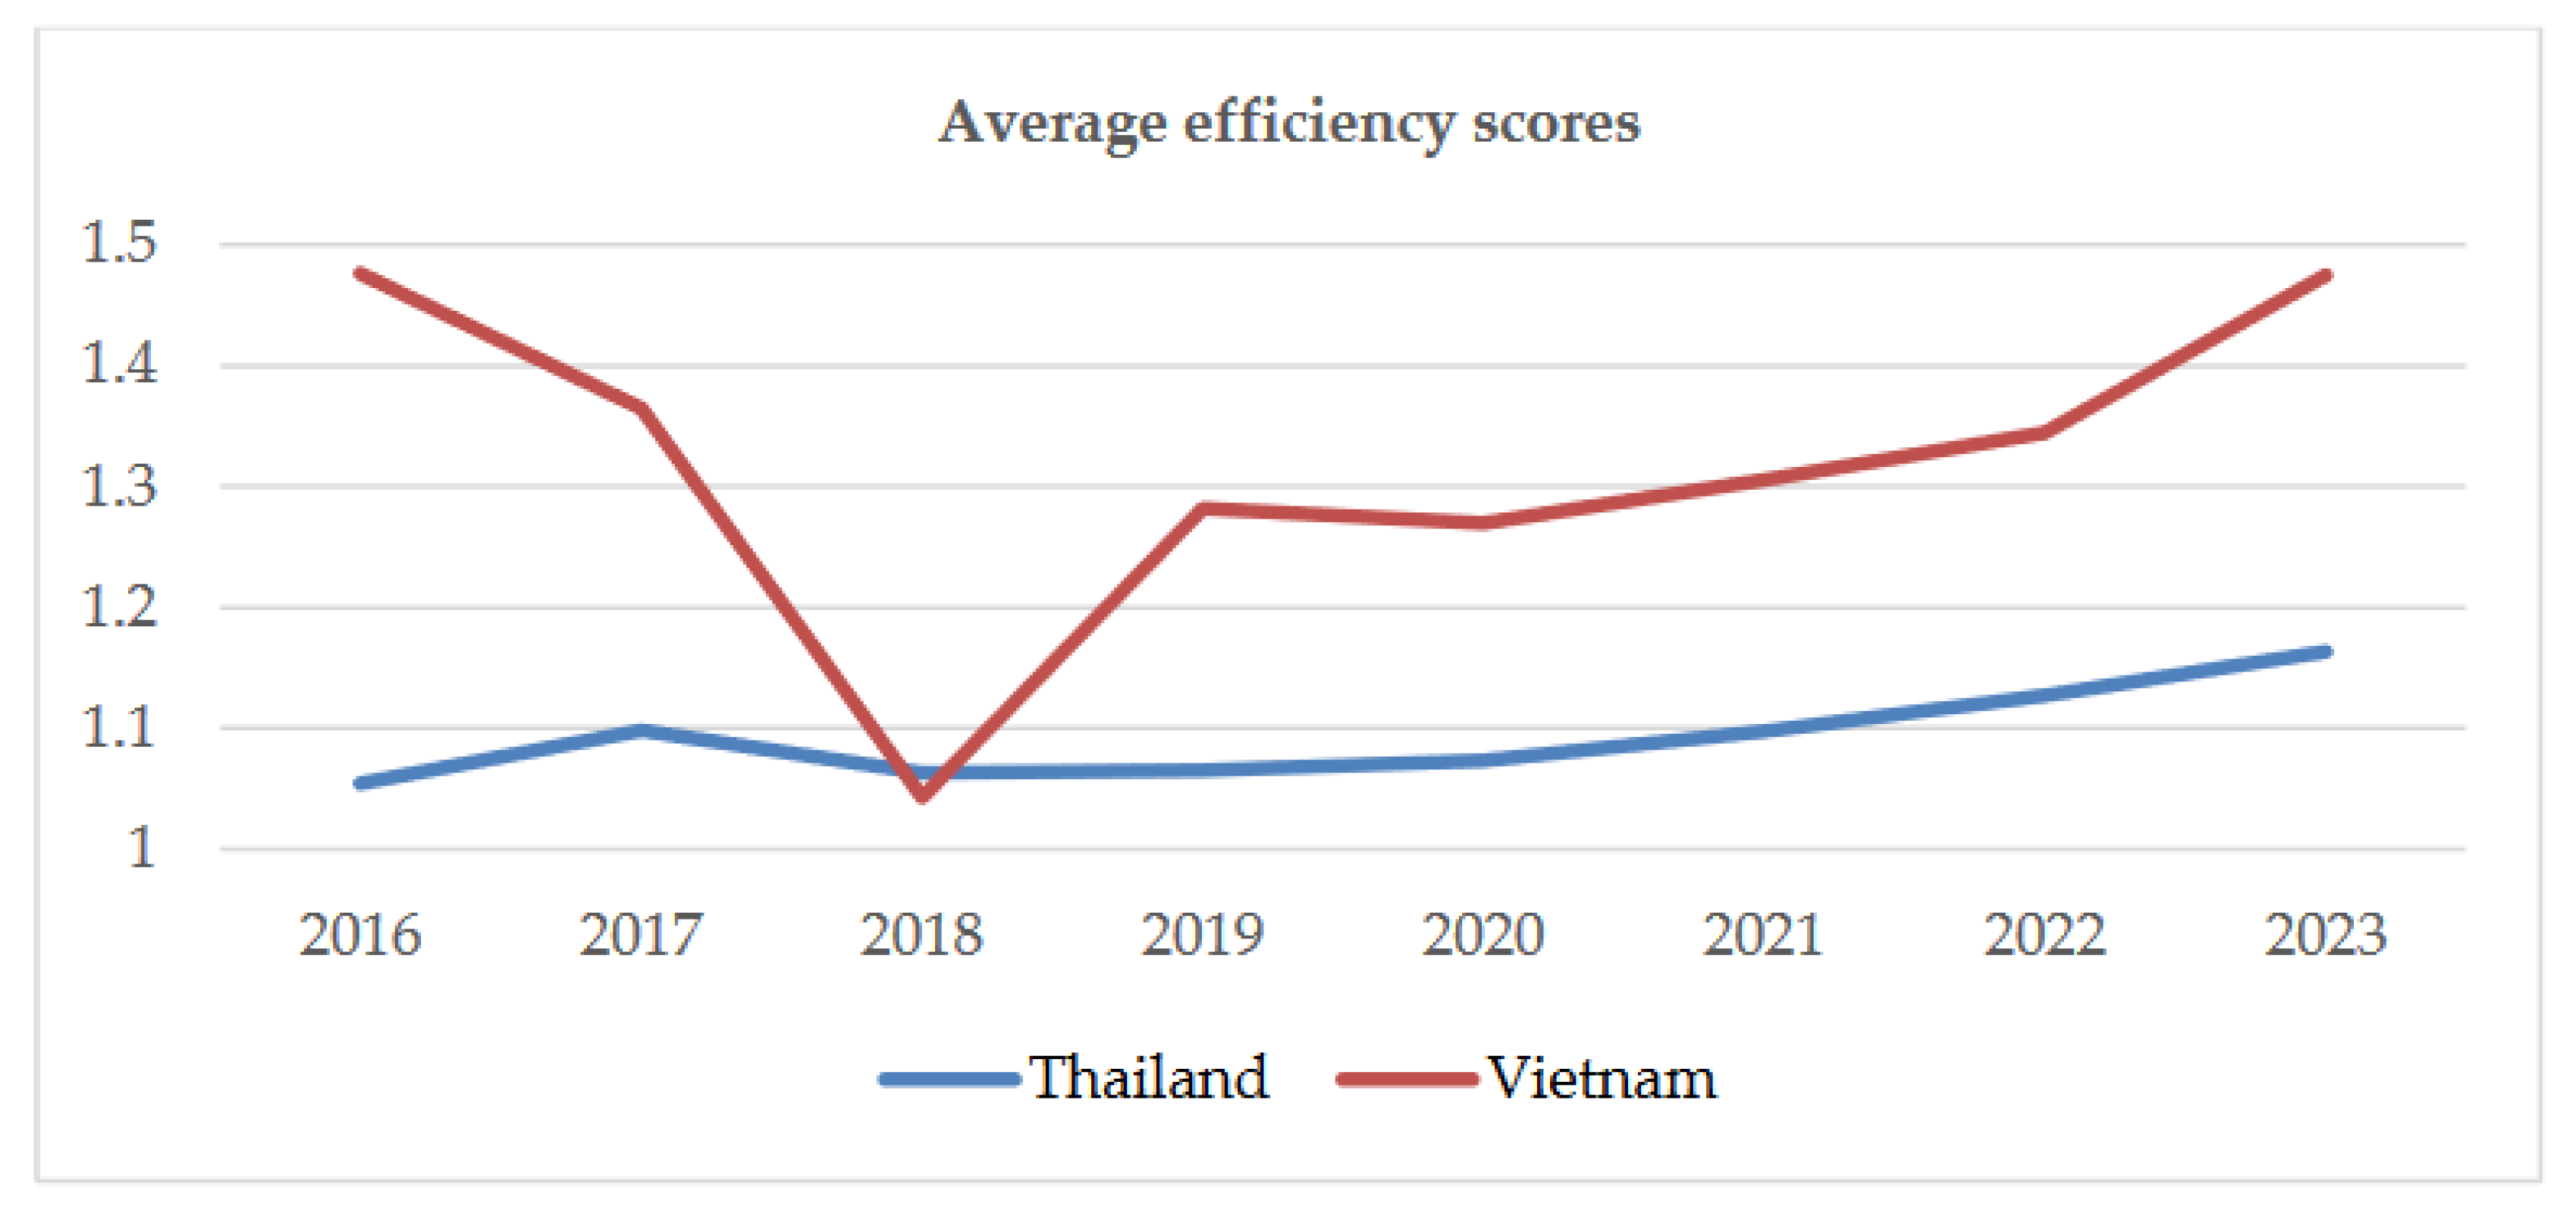
Figure 6 graphically describes the average score over the period of 2016 to 2023.
As presented in
Table 9, the average efficiency scores in the future will be higher than those in the period of 2016 to 2019 due to the increasing scores of most companies. From 2020 to 2023, the food and beverage industry in both Vietnam and Thailand will demonstrate a better operating performance with the stable increasing trend over the years. Over the period of 2020 to 2023, the average efficiency scores of the whole period in Thailand will be 1.12, in which 14 out of 20 companies will have efficiency scores equal to or higher than 1. In the case of Vietnamese firms, the average score for the 20 companies over the four future year period will be 1.35 and the number of efficient companies will increase from nine to eleven during the 2016 to 2019 period. The results indicate that most of the Vietnamese and Thailand food and beverage companies will have a better performance. However, the results also imply the imbalances between companies operating in the same industry, particularly in Vietnam. There is one firm “VN12” that has an outstanding efficiency score, which helps increase the average score of the whole industry. After analyzing the slack results, it is found that the operating expense of this company is so low and only accounts for approximately 0.45% of the total net revenue, in contrast with the ratio of other companies which is around 22% to 25%. This company is very good in controlling their operating expense, in which this factor is considered as the biggest cost in food and beverage firm.
Figure 6 shows a performance comparative graph of the F&B industry in Thailand and Vietnam over the period of 2016 to 2023. The comparative results display that Thailand′s business activities did not reach a high level during the previous periods and no significant fluctuation as seen by the stable increasing trend throughout the research period. In contrast, Vietnam has had a remarkable growth rate in 2016, then constantly decreased at a high level momentum for the next three years and reached the bottom in 2018 with the score even lower than the lowest score of Thailand. After that, Vietnam demonstrated a more stable trend and increase year by year. As shown in
Figure 6, it is clear that the scores of Thailand’s are stable with an increasing trend while the efficiency scores of Vietnam fluctuated over the period of 2016 to 2023. Additionally, as mentioned above, the higher score of Vietnam is due to the very high score of one company, VN12. Therefore, if these companies operate worse, the average score of the whole industry will significantly drop.
4.5. Efficiency Improvement
To examine the productivity change of 40 selected firms over the period of 2016 to 2023, the MPI is utilized in this section. As mentioned in the methodology section, MPI was decomposed into the efficiency change or catch-up effect and the technical change or frontier-shift effect, then the total productivity change (MPI) will be the product of these two components.
Table 9 below reports the results of MPI.
The results of MPI shown in
Table 9 indicate that both Thailand and Vietnamese F&B companies improve in terms of technical efficiency with the corresponding average catch-up score higher than 1. However, as observed the number of companies that have the technical efficiency improvement of Thailand is higher than Vietnam. Of the 20 Thailand companies, 14 of them have demonstrated better technical efficiency over 2016 to 2023, and only one company remains unchanged with the corresponding catch-up score of 1, while five companies have regressed with a score lower than 1. In general, the technical efficiency of Thailand F&B companies improved by 2%. Although, the average efficiency scores of Vietnamese F&B firms are higher than Thailand’s, the number of companies that have a positive technical efficiency change is lower. There are twelve out of twenty obtained catch-up scores higher than 1, one firm with a score of 1, and seven companies have scores lower than 1. As a result, the technical efficiency improvement in the Vietnamese F&B company is 1%.
In terms of the technological efficiency change, both Thailand and Vietnam demonstrate regress with the corresponding frontier-shift scores of 0.98 and 0.99, respectively. The decline in frontier-shift implies the worse technological efficiency or the technological capacities of these companies over the period of 2016 to 2023. Just two out of twenty Thailand companies improve their technological efficiency with scores higher than 1, while two companies remain unchanged and the rest worsens. As a consequence, the technological efficiency of Thailand drops by 2%. By observing each period, it can be noted that the technological efficiency changed negatively during 2016 to 2017 and 2017 to 2018 with the scores 0.91 and 0.96. However, there was a recovery in the period 2018 to 2019 with a score of 1.03%. After this period, the score slightly decreased by 0.99 in 2019 to 2020 and then remained at 1. The same happened to Vietnam with 14 companies lowering their technological capacity. As a result, the average frontier-shift score goes down by 1%. According to the results of MPI, during the whole period, the score is 0.97 revealing the worse technological development in 2017 as compared to 2016. Then, in the period 2017 to 2018, the score reached its highest value of 1.02, which means there is a 2% progress in technological capacity. However, this was not stable enough as the scores significantly reduced to 0.91, decreasing by 11%. The trend was continuously fluctuating, when the frontier-shift score went up to 1.01 in 2019 to 2020 then remained at 1 in the next period. As the technological development in the industry has been extremely improving, these chosen organizations neglected to keep up the progress and even seriously relapsed for the most part during the observed periods. The low frontier-shift scores likewise suggest that the innovation play area in the worldwide food and beverage industry is amazingly serious and holds lots of possibilities for all organizations operating in this business.
The MPI shows the overall productivity growth especially in the aspects of technical and technological efficiency. The overall average MPI of Thailand is equal to 1 indicating no change in the total productivity. On the other hand, the MPI of 0.99 implies a little regress in the total productivity of Vietnamese companies. However, by observing the individual companies, there are five Thailand and nine Vietnamese firms that exhibit positive changes in total productivity. As gathered in
Table 9, there is no significant contrast in the MPI of the Thailand and Vietnamese F&B industry. However, despite having more companies that improve in terms of total productivity, Vietnam regressed while Thailand remained the same. These results might come from the uniformity. As observed, the scores of Thailand is more even between different companies and even between different periods. Meanwhile, in Vietnam, the scores are highly different. Since MPI is the product of efficiency change and technical change, the results of MPI indicate that both Thailand and Vietnamese companies are able to improve their technical efficiency but are facing the challenges in improving technological capacity. Therefore, the F&B industry in both countries must focus more on handling technological development and innovation as they are now operating in the generation of industry 4.0. Moreover, the F&B industry in Thailand and Vietnam should also need to balance their focus between technical change and technological change since these two aspects can be developed simultaneously to help enable these companies to achieve a progressive outcome. Although their potentials might get affected by factors such as natural resources, climatic behavior, market size, etc. The inefficient management system and bad planning restrained the development of the F&B industry in Vietnam during a long-time period in the past. This led to the lower efficiency values of the F&B industry in Vietnam as compared to Thailand, even though the two countries have similar conditions. However, in recent years, Vietnam has launched a free-market economy as well as foreign investments. As a result, along with more capital investments, the foreign businesses also help Vietnamese companies improve internal management, organizational structure, human resource quality, and products. Therefore, using their inherent potentials, the Vietnamese F&B industry has experienced a period of miraculous development in recent years, and the trend is forecasted to continue in the future. For Thai companies, although there are few externalities in development, the better management system continued to help the Thai F&B industries develop in the current and future periods.
4.6. Comparing the Sector Performance between Thailand and Vietnam
The focus of this study is on the evaluation and comparison of the productivity of the F&B industry between Vietnam and Thailand. Therefore, in this section, the results of the efficiency score and MPI of two industries are compared. After which, some suggestions to improve their efficiencies will be recommended by the authors.
4.6.1. The Efficiency Scores
In this section, a
t-test will be applied to find out if the means between the two populations are significantly different. There are two models in the
t-test method, the two-sample assuming equal variances and two-sample assuming unequal variances. Both these models produce similar results. Therefore, this study uses the two-sample assuming equal variances model. The results of the
t-test for the efficiency scores are presented in
Table 10 which shows the
p-value of 0.008 (0.08%) lower than 5%, indicating that there is a significant difference in the efficiency means of the two countries. From this result, it confirms the above conclusion that the Vietnamese F&B industry performed better than Thailand with higher average efficiencies.
4.6.2. The Malmquist Productivity Index
The comparison of the productivity of the F&B industry in Vietnam and Thailand is done by the
t-test method. The three indexes in the MPI model, the catch-up effect, frontier-shift, and MPI, were also compared. Results of the
t-test analysis are presented in
Table 11.
The results in
Table 11 show that the
p-value in the three indexes are all higher than 5%, which means that there is no significant evidence that can depict any difference in efficiency changes. Thus, it can be said that both of the countries do not have much difference in efficiency changes during the research period of 2016 to 2023. These results can be observed in
Table 11.
5. Conclusions and Discussion
The outstanding development of the F&B industry in emerging countries, notably Thailand and Vietnam is the motivation of this study. This paper applied the resampling method to evaluate and forecast as well as compare the productivity of F&B companies in Thailand and Vietnam over the period from 2016 to 2023. By using the resampling DEA model, the authors are not only able to measure the efficiency of the F&B industry but also can forecast the performance efficiency potential in the future.
Although there are some similarities to previous studies measuring the efficiency of the F&B industry, the results of this study are significantly different due to the subjects, variables, and methods of research. Therefore, the evaluation of the effectiveness of the studies has not been yet comprehensive for the F&B industry. The difference of this study is the cross-nation research scale, which enables containing a comparison between the same industry in different countries. Additionally, this study uses
t-test methods to compare the industry of two countries in the time-series. Additionally, as suggested by Tone [
22], it is very important to include both the past and present record with the future potential when evaluating the performance of any decision-making unit. Therefore, in this study, the future performance of the F&B industry in both Thailand and Vietnam is predicted.
This research has taken the following steps. First, this research described the theoretical concepts in the productivity and efficiency of the F&B industry. After choosing the DMUs from these two countries, the data input and output were selected based on previous research studies. The authors used the super-SBM model to calculate the efficiencies of selected companies over the period from 2016 to 2019. Second, the DEA resampling past-present-future is applied to provide forecast values of the operational input and output factors in the future. At the next stage, the authors employ the DEA Malmquist productivity index to measure and rank the F&B industry efficiencies.
Aggregate results from the research data provide the overall picture of Thailand’s and Vietnam’s F&B industry performance during the research period from 2016 to 2023. Among the Thai companies TL6 (Thai Vegetable Oil), TL9 (Mk Restaurant Group), TL15 (S & P Syndicate), TL3 (Minor International), TL19 (Surapon Foods), TL7 (Thai President Foods), and TL20 (Seafresh Industry) are companies who maintain high rankings with the score higher than the average in the industry. On the other hand, some companies including TL2 (Thai Union Group), TL8 (Khon Kaen Sugar Industry), TL13 (President Bakery), TL14 (Bangkok Ranch), TL16 (Haad Thip), and TL18 (Khonburi Sugar) have shown inefficiency and were positioned at the bottom of the ranking. On the other hand, seven Vietnam companies including VN12 (Minh Phu Seafood), VN11 (Hung Vuong), VN19 (KIDO Frozen Foods), VN16 (Vietnam Vegetable Oils Industry), VN14 (Vinh Hoan), VN3 (Saigon Beer - Alcohol - Beverage), and VN20 (Vietnam Livestock) are the best companies in terms of productivity and ranking while VN7 (Quang Ngai Sugar), VN13 (Tin Nghia), VN9 (GTNFoods), and VN4 (KIDO Group) are regarded to be the most exceedingly awful, positioning at the bottom. A remarkable instance for Vietnamese companies is that one company VN12 (Minh Phu Seafood) has exhibited a very high efficiency score since 2019 due to the ration between the minor operating expense and total net revenue.
The results of measuring and forecasting the performance efficiency score may give valuable information and practical suggestions for the improvement of underperforming companies as well as to enhance competitiveness for companies operating effectively that wish to reach out to the global market. Moreover, this study has focused on measurement indicators such as efficiency changes, technology changes, productivity changes, and efficient business measurement. The research results help companies make considerations on choosing the direction of the company in the near future to achieve better performance. Observing trends in the indexes also help the managers to have better understanding of their company′s status. With these results, the companies may reconsider their plans to improve the measurement indicators, enhance the competitiveness in the region and the world. At the same time, the companies can formulate strategies to suit the requirements and demands of innovation in international economies.
6. Suggestions
6.1. Suggestions for the Thailand F&B Industry
Compared with the Vietnamese F&B companies, the companies in Thailand have more advantages and opportunities to develop. The most obvious difference is by having unique and well-known products across the world. In addition, there are a lot of big manufacturers which are well equipped with knowledge, technology, and better-trained workforces in Thailand than Vietnam. The Thai companies should take advantage of this to develop the market, as well as gain a solid foothold in the market amidst fierce competition.
One of the most important weak points of the Thailand F&B industry is the low adaptation in technological changes. This weakness can be overcome if Thai enterprises enhance their application of scientific and technical practices in raw material and processing production. In addition, it is important to train food scientists, researchers, and technicians. However, the solutions cannot be made only by companies that require substantial support from the Thai government. The Thai government has been trying to transfer Thailand into a high-tech food and agriculture hub. While the government tries to do its part, the enterprises operating in the food and beverage sector need to adapt more technological applications to enhance their weakness of technology.
In addition, some reports also indicated that the Thai production system management has not met the development and customer demand. Most farmers lack adequate information about what raw materials the manufacturers need. This leads to a shortage of raw materials for production and forces manufacturers to import raw materials via middlemen or close down their businesses. Consequently, the prices of goods were lowered by middlemen who complicated physical distribution around the world, contributing to various problems such as food contamination [
4,
12]. To solve this problem, Thailand should consider pushing the coordination between companies and the government in developing the information exchange system and enhancing e-commerce. One of the possible applications that can be applied is the technological integration proposed by Dospinescu and Perca [
58] which provides an end user a significant increase in the level of contextual information without wasted time and effort with the help of mobile devices and the internet.
6.2. Suggestions for the Vietnamese F&B Industry
Research results indicated that Vietnam′s F&B industry has a huge competitive advantage because F&B companies know how to apply technology changes to improve efficiency. However, the forecast results also indicated that the performance and ranking of Vietnam′s F&B industry may slow down in the coming years. These are important forecasts for the government and the F&B industry to consider in order to build efficient plans to maintain and to develop a sustainable F&B industry.
Developing markets, international economic integration, and building a brand strategy for the Vietnamese food industry will help increase the recognition of products on the world market. To do this thing, the government and Ministries need to enhance market forecasting capacities, to help with legal issues, expand export markets, etc. This can help the F&B companies enter into the global market in a more efficient way.
6.3. Future Research Directions
As mentioned in the previous part, there are several methods to measuring, comparing, and ranking the productivity of DMUs. Each of these tools has advantages and drawbacks and the choice of using the methods depends on the data, the purpose of the study, etc. Since there is a weakness in each method, the integration which combined different models and methods might be a good research direction in the future. This research shows that the multiple methods approach is the optimal choice to measure and compare the performance of the F&B industry. However, this paper only focuses on quantitative models, and the results revealed the relative performance. Future researches including some external environmental factors are encouraged. This will help the comparison of productivity become more accurate and complete.
Additionally, there are not many studies evaluating the performance of food and beverage sector found in the literature; thus, the foundation for choosing appropriate inputs and outputs is not so solid.
In summary, future research should focus more on identifying the appropriate indicators for efficiency and try to integrate different research methods, which provides better and more practical results.


