
Applying Regressive Machine Learning Techniques in Determination of COVID-19 Vaccinated Patients’ Influence on the Number of Confirmed and Deceased Patients

 ,
,  ,
,  ,
,  , , ,
, , ,  and
and 
Abstract
:1. Introduction
- Is there a correlation between the number of vaccinated, fully vaccinated, and boosted patients and the number of new confirmed and deceased cases?
- Can the above be modeled using AI-based regression methods?
- Does the use of cross-correlation determined lags (the time-shifts of discrete data points between the input and output datasets) enable better performance when regressing with AI-based regression methods?
2. Materials and Methods
2.1. Dataset
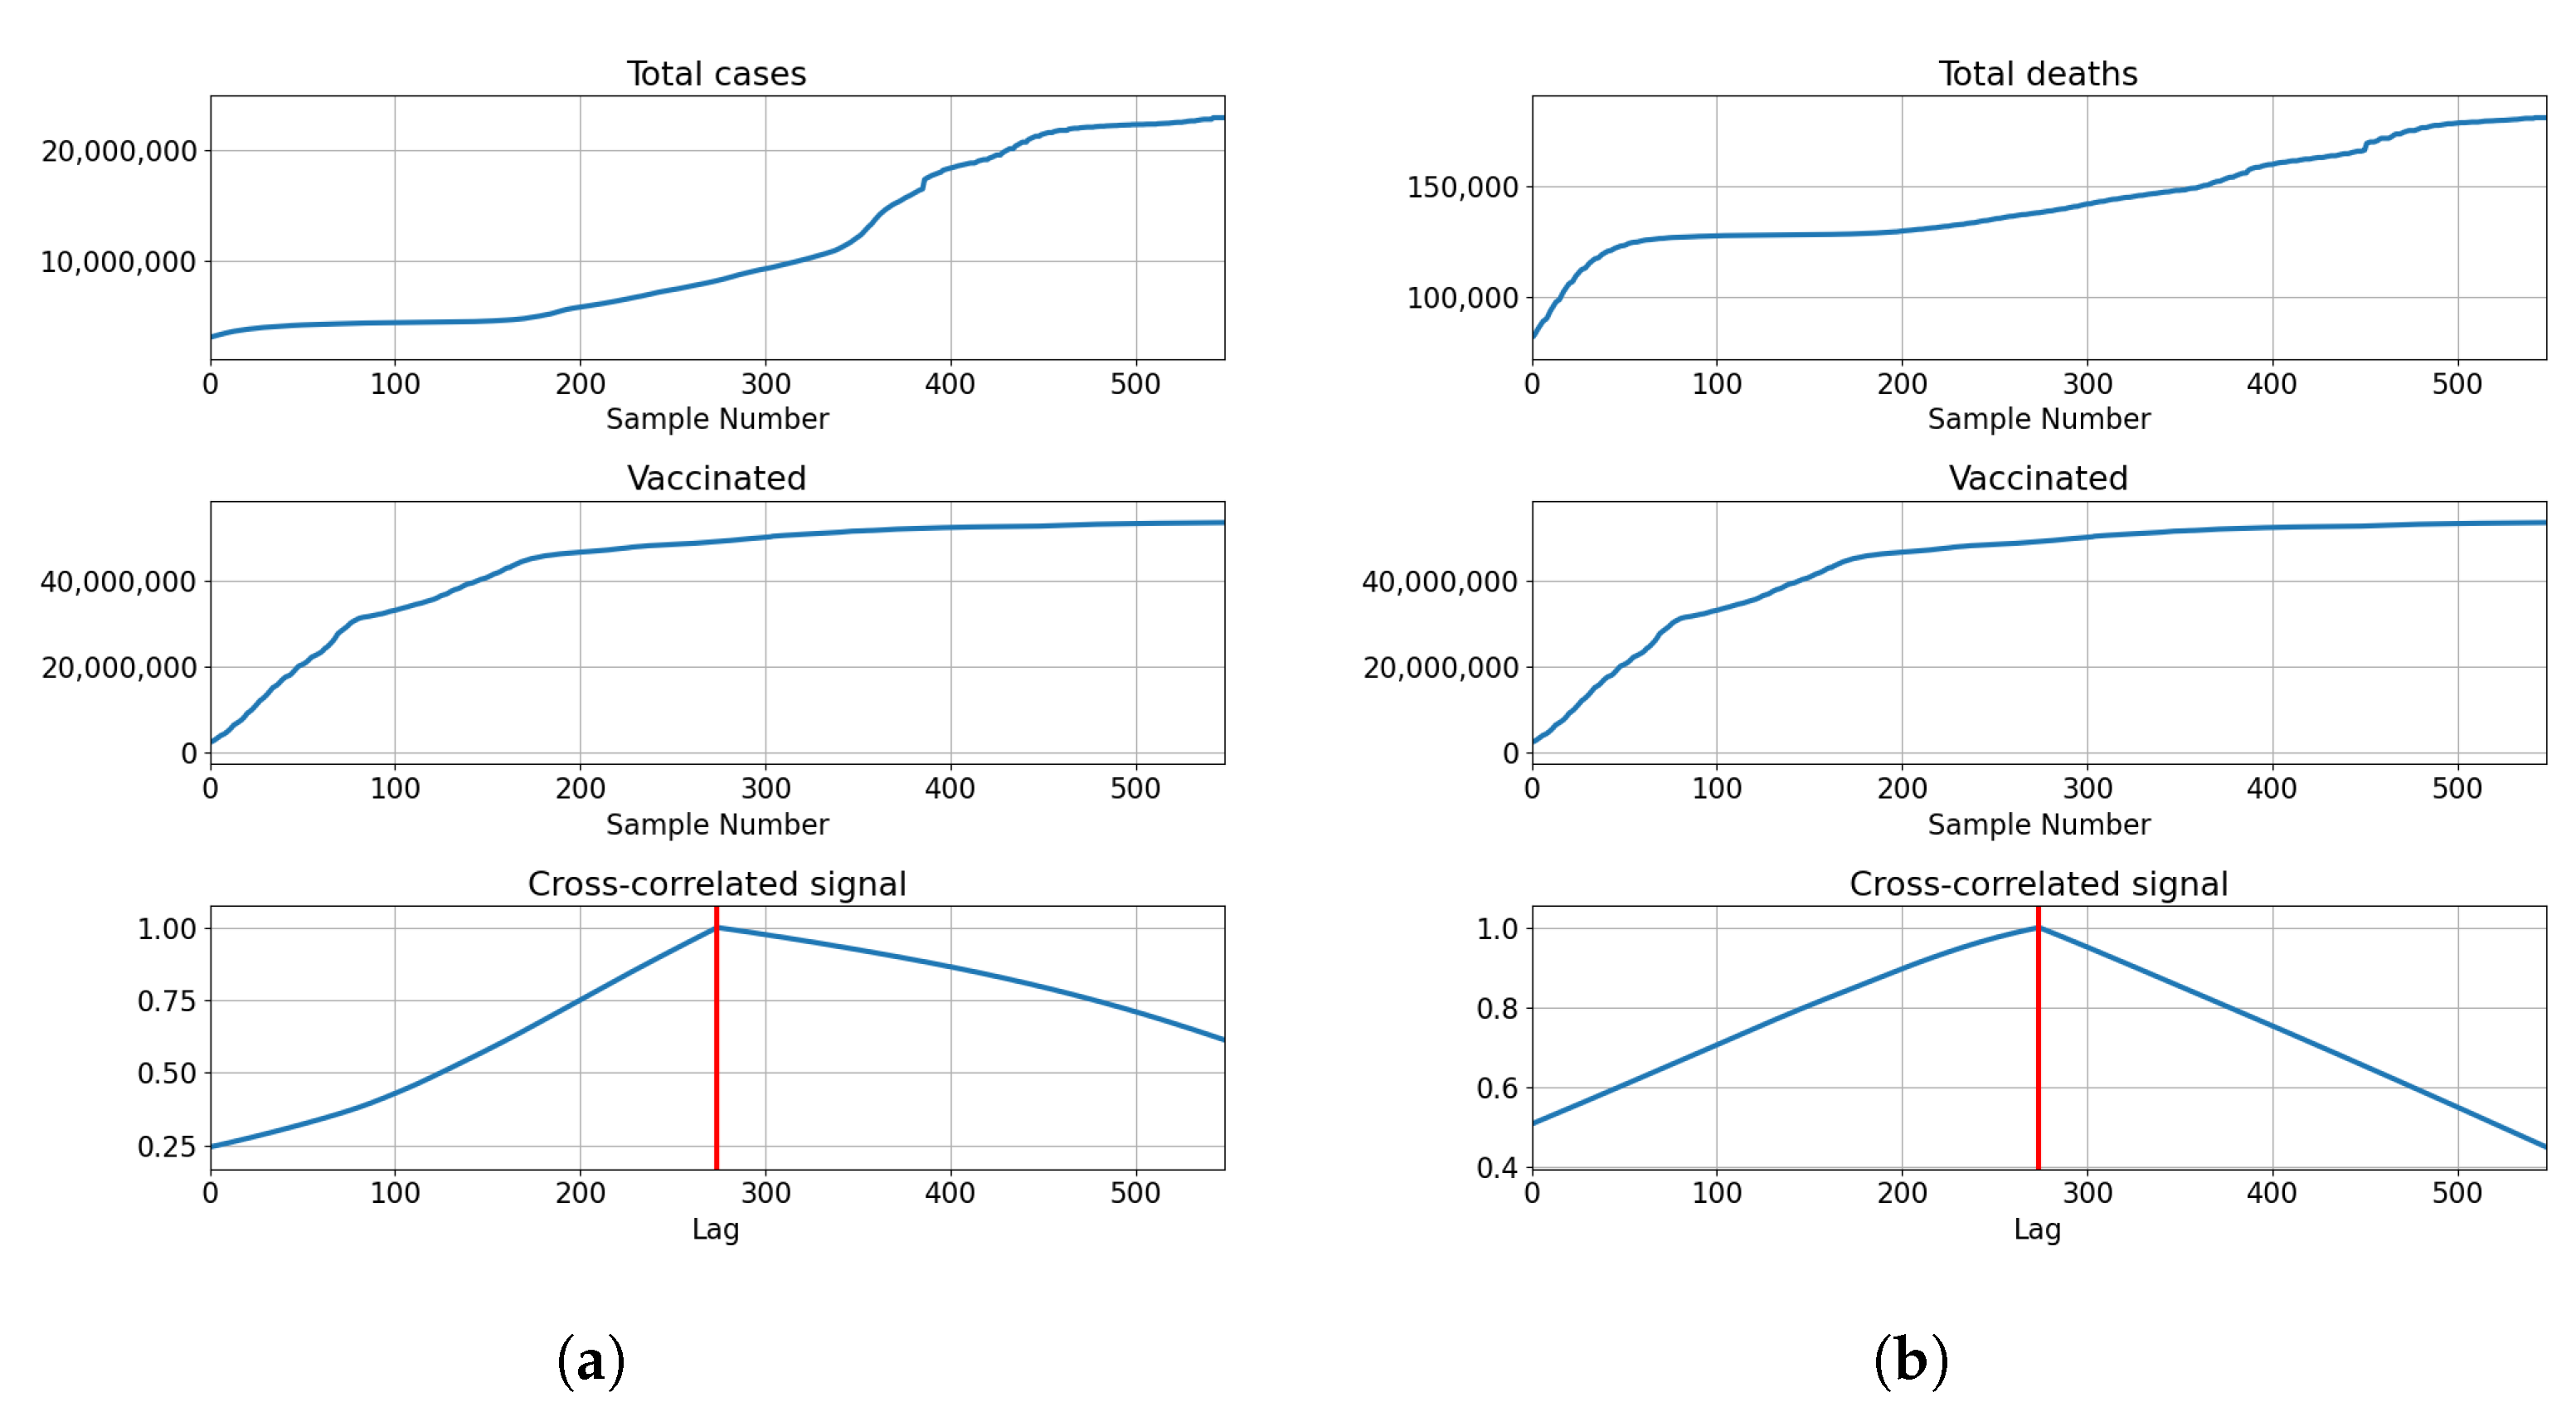
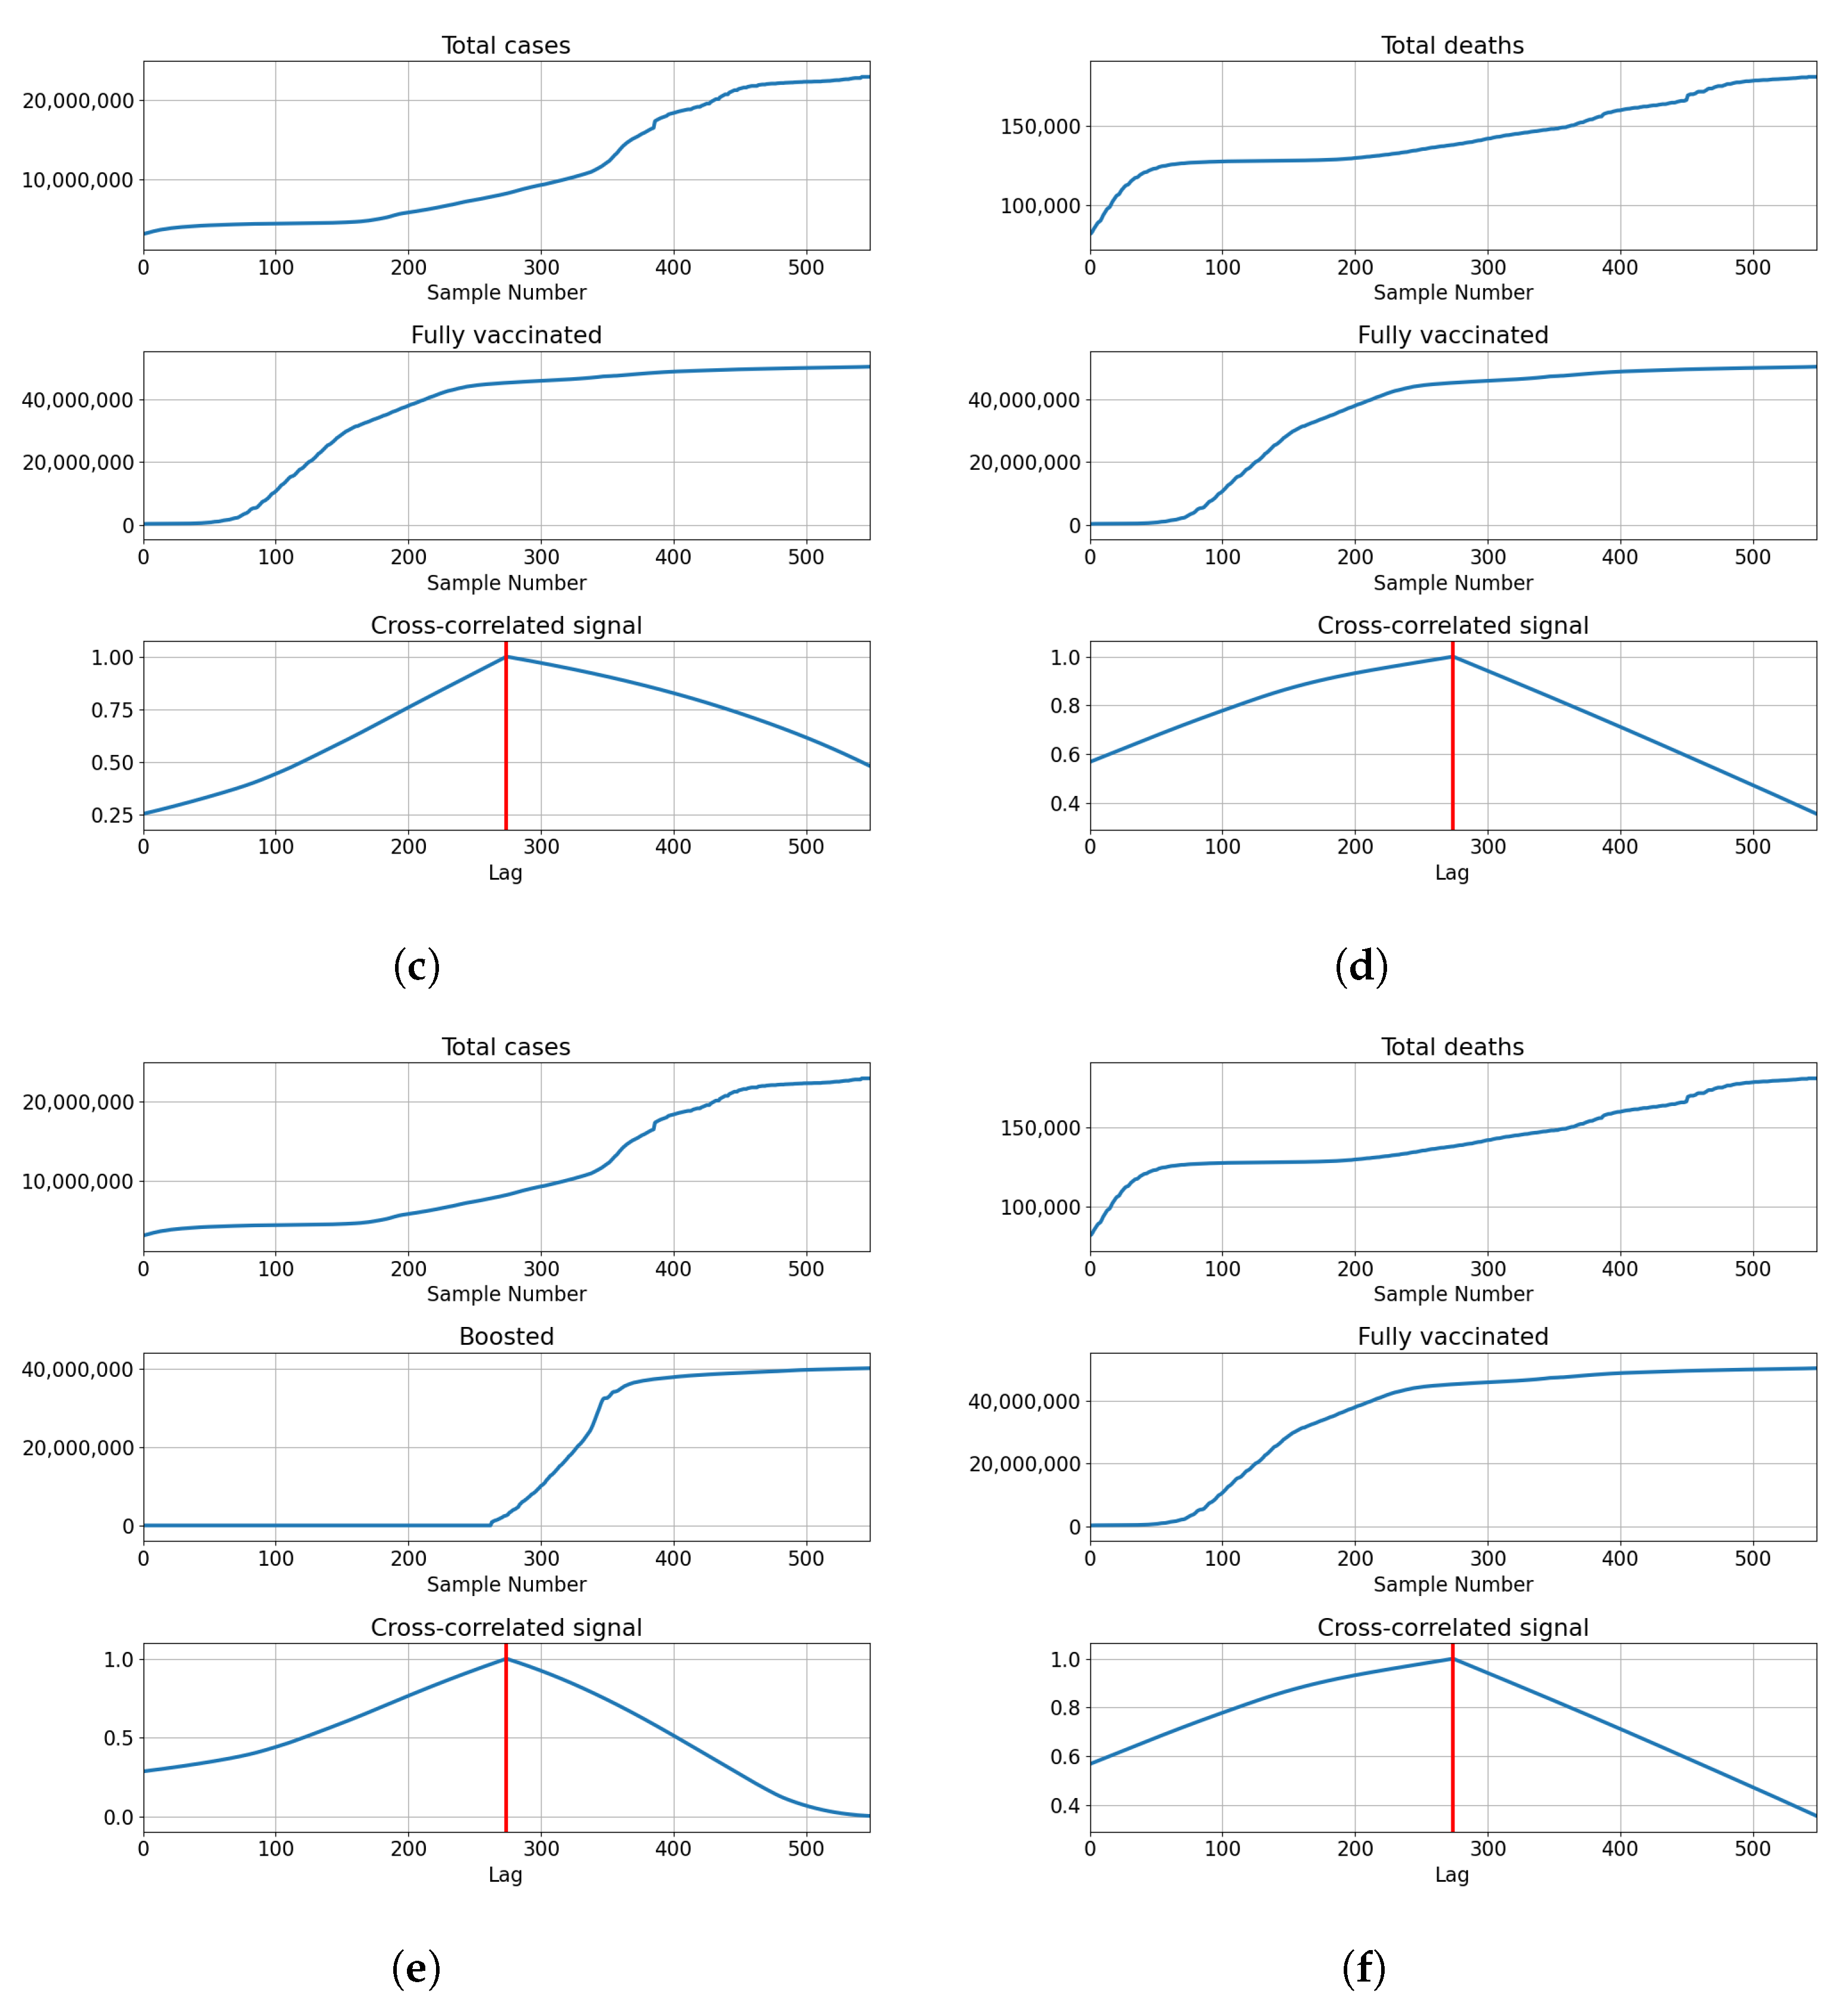
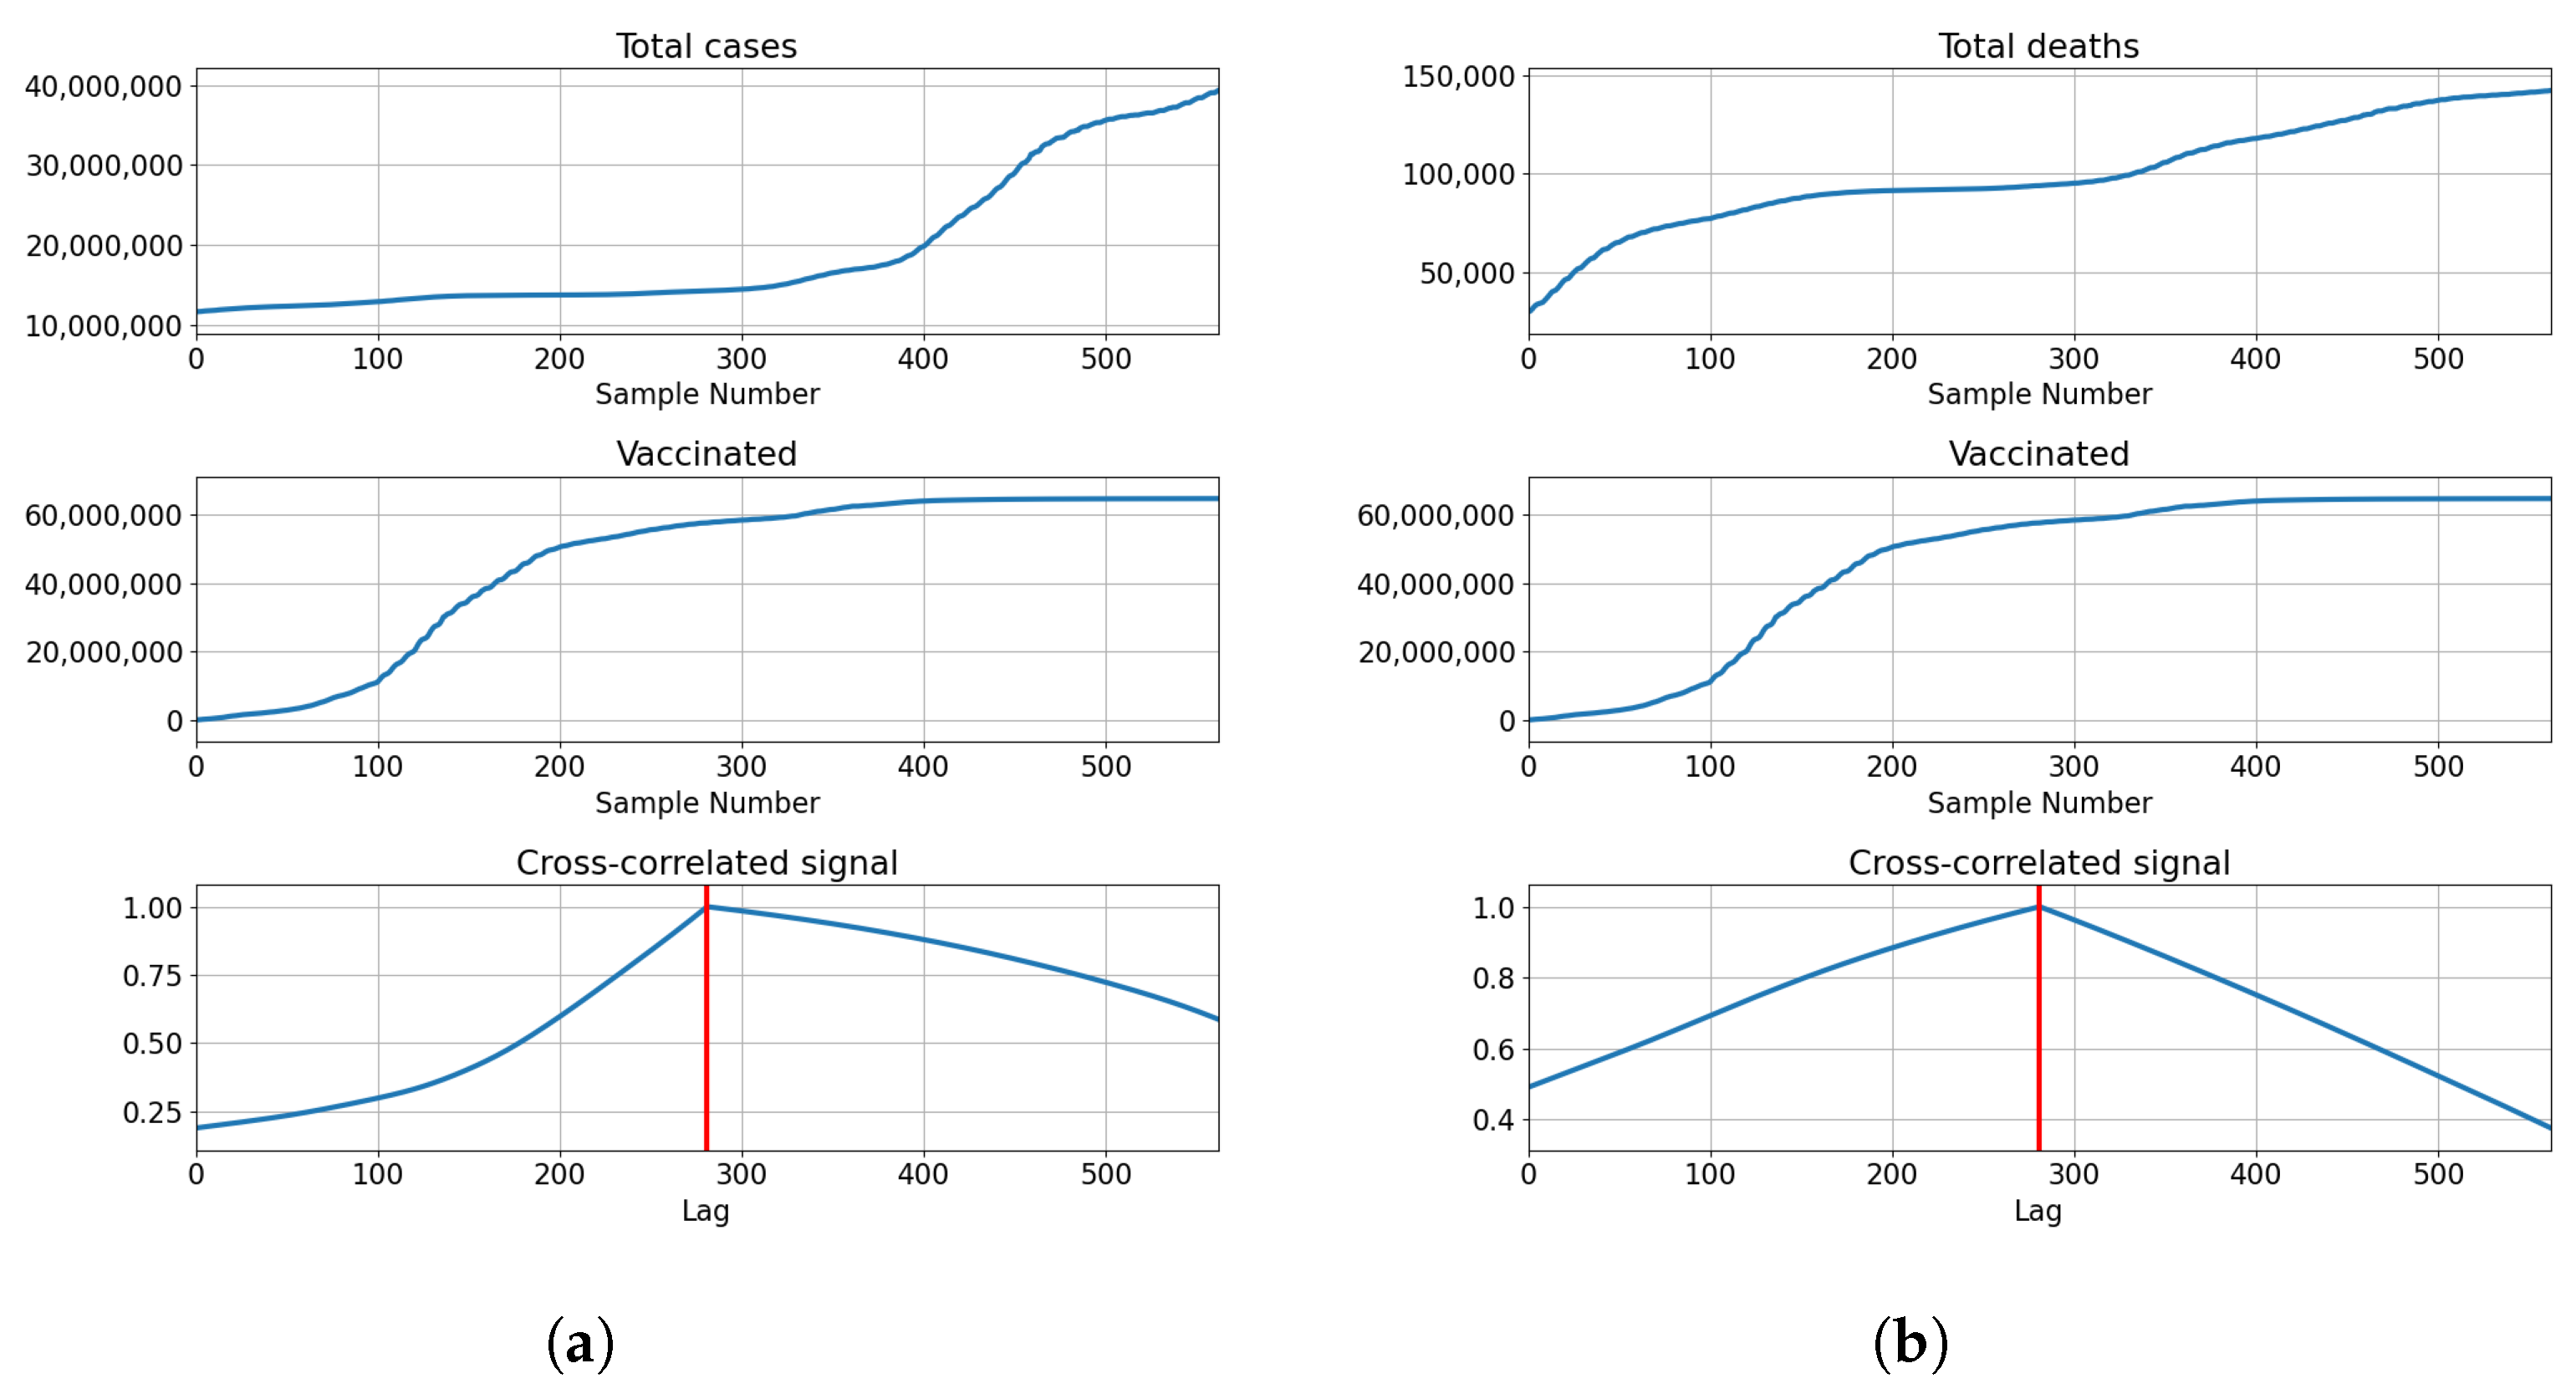
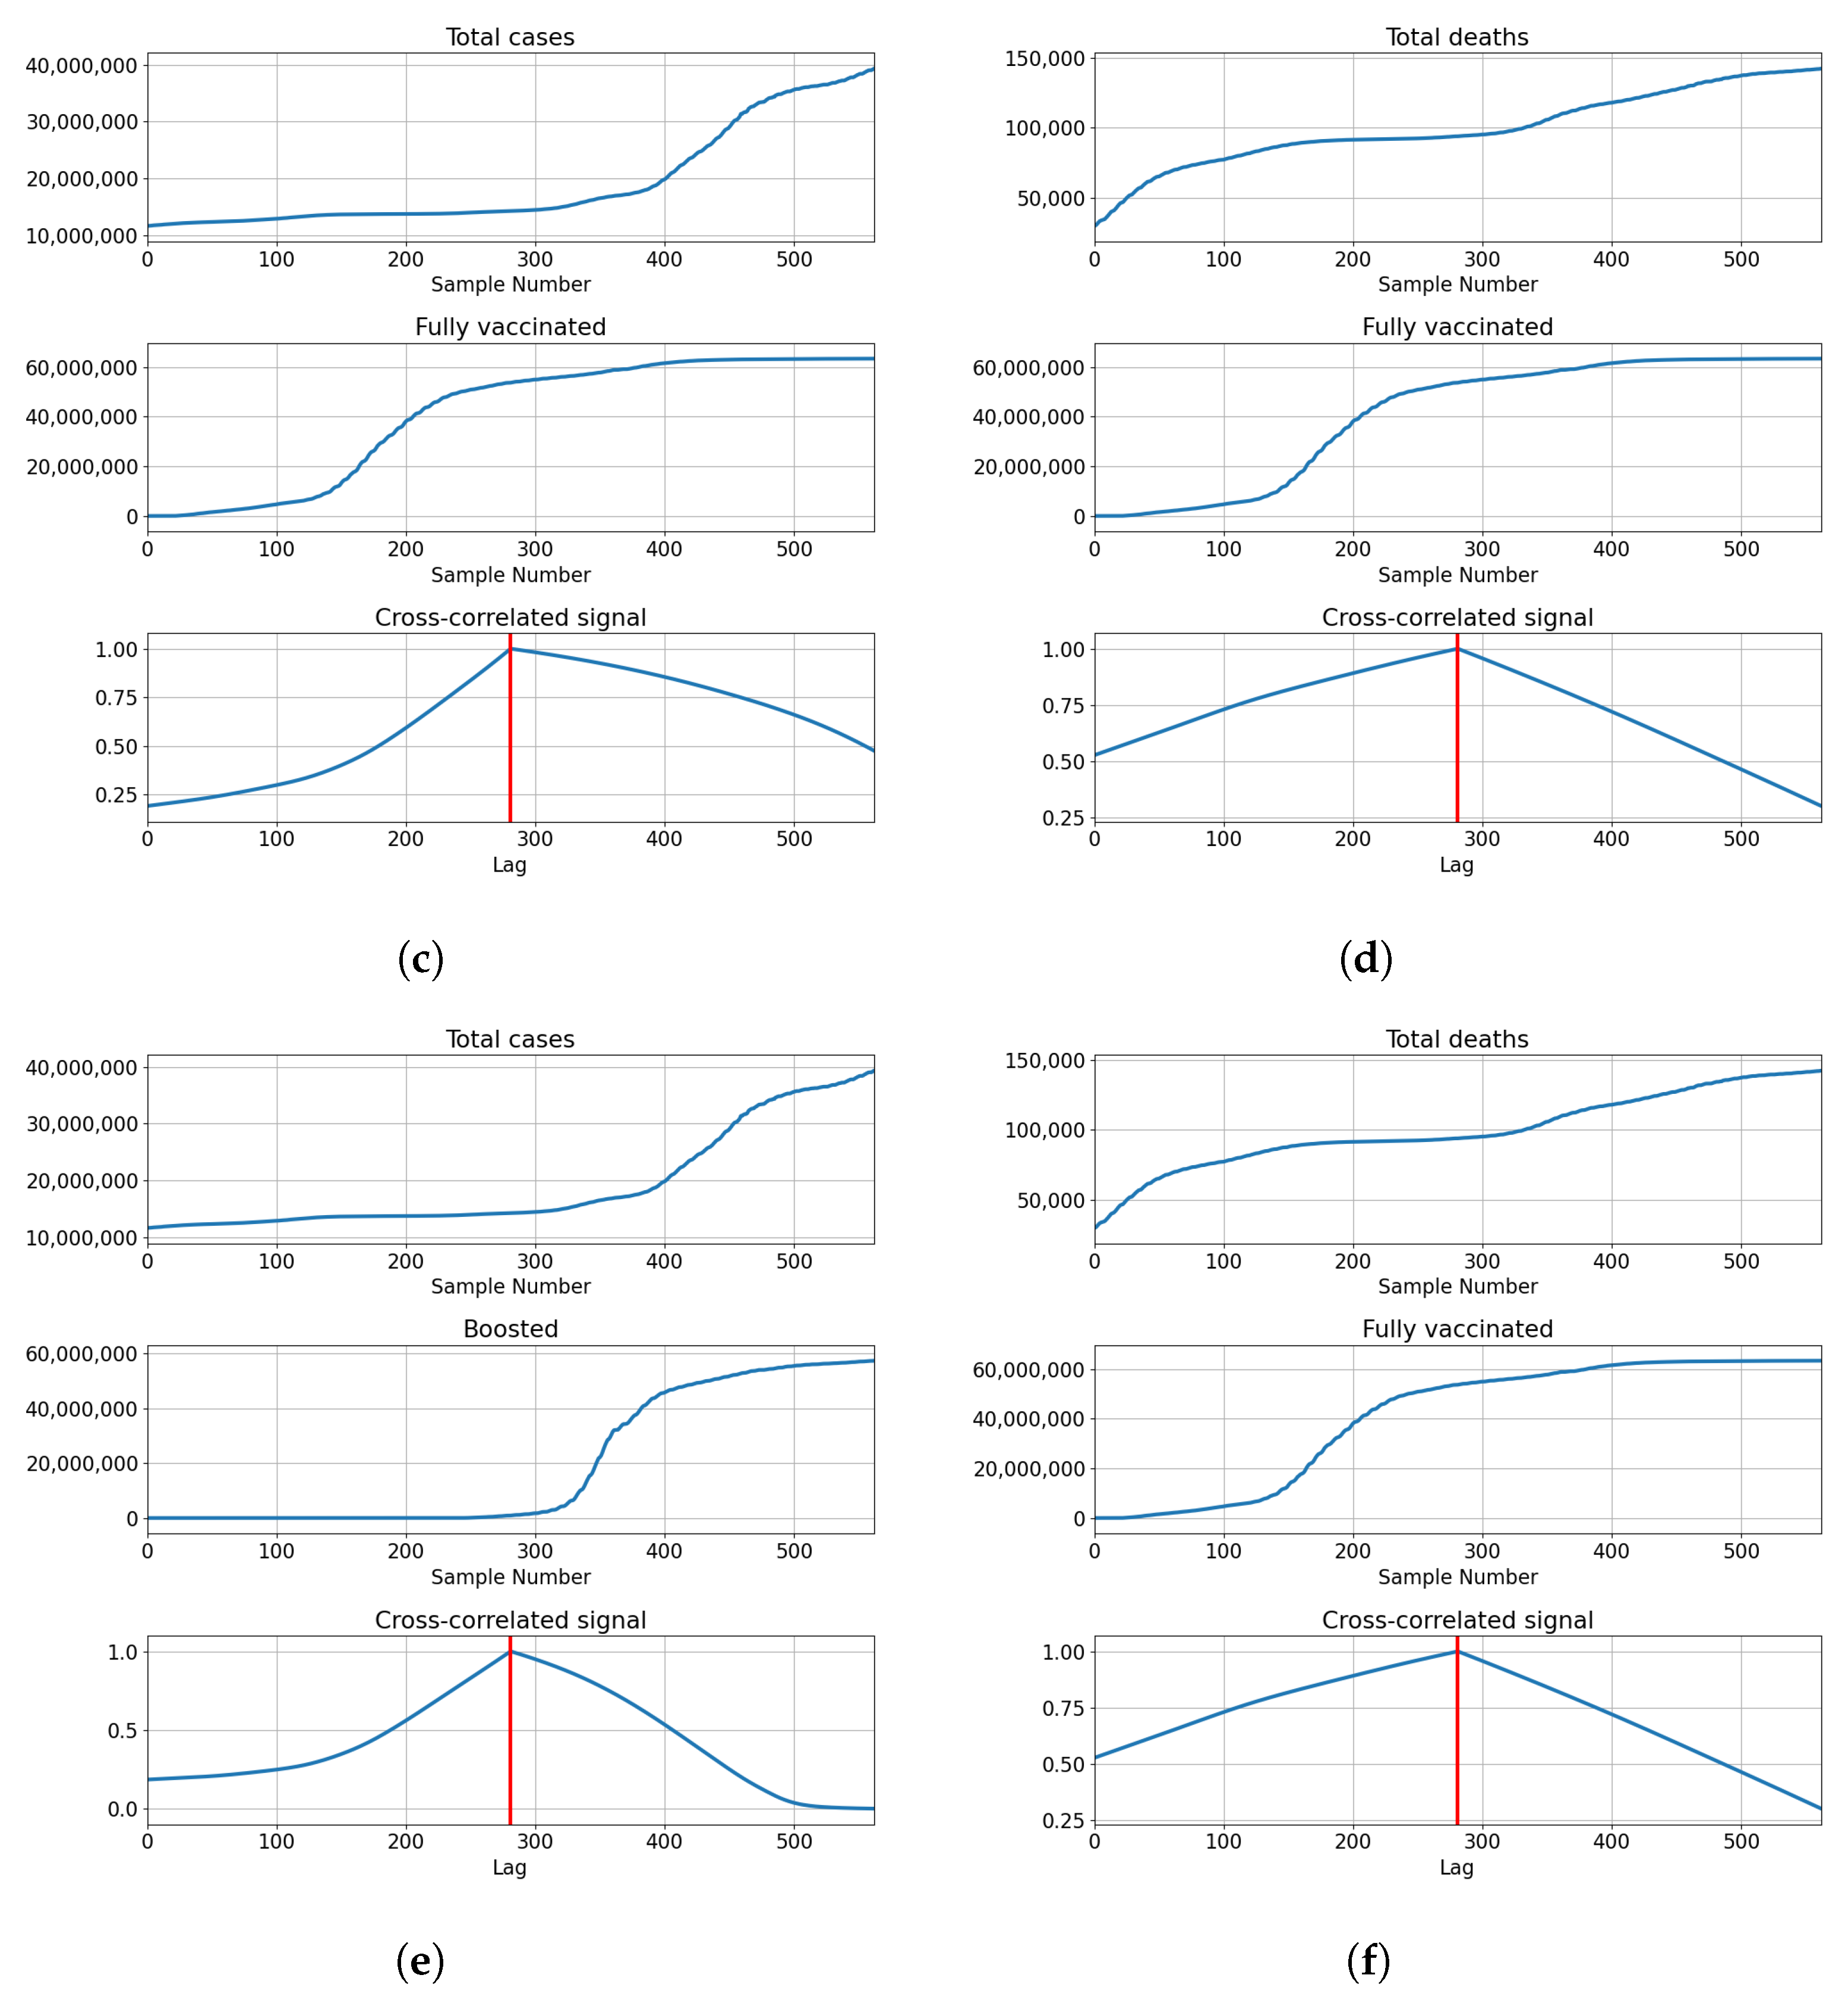
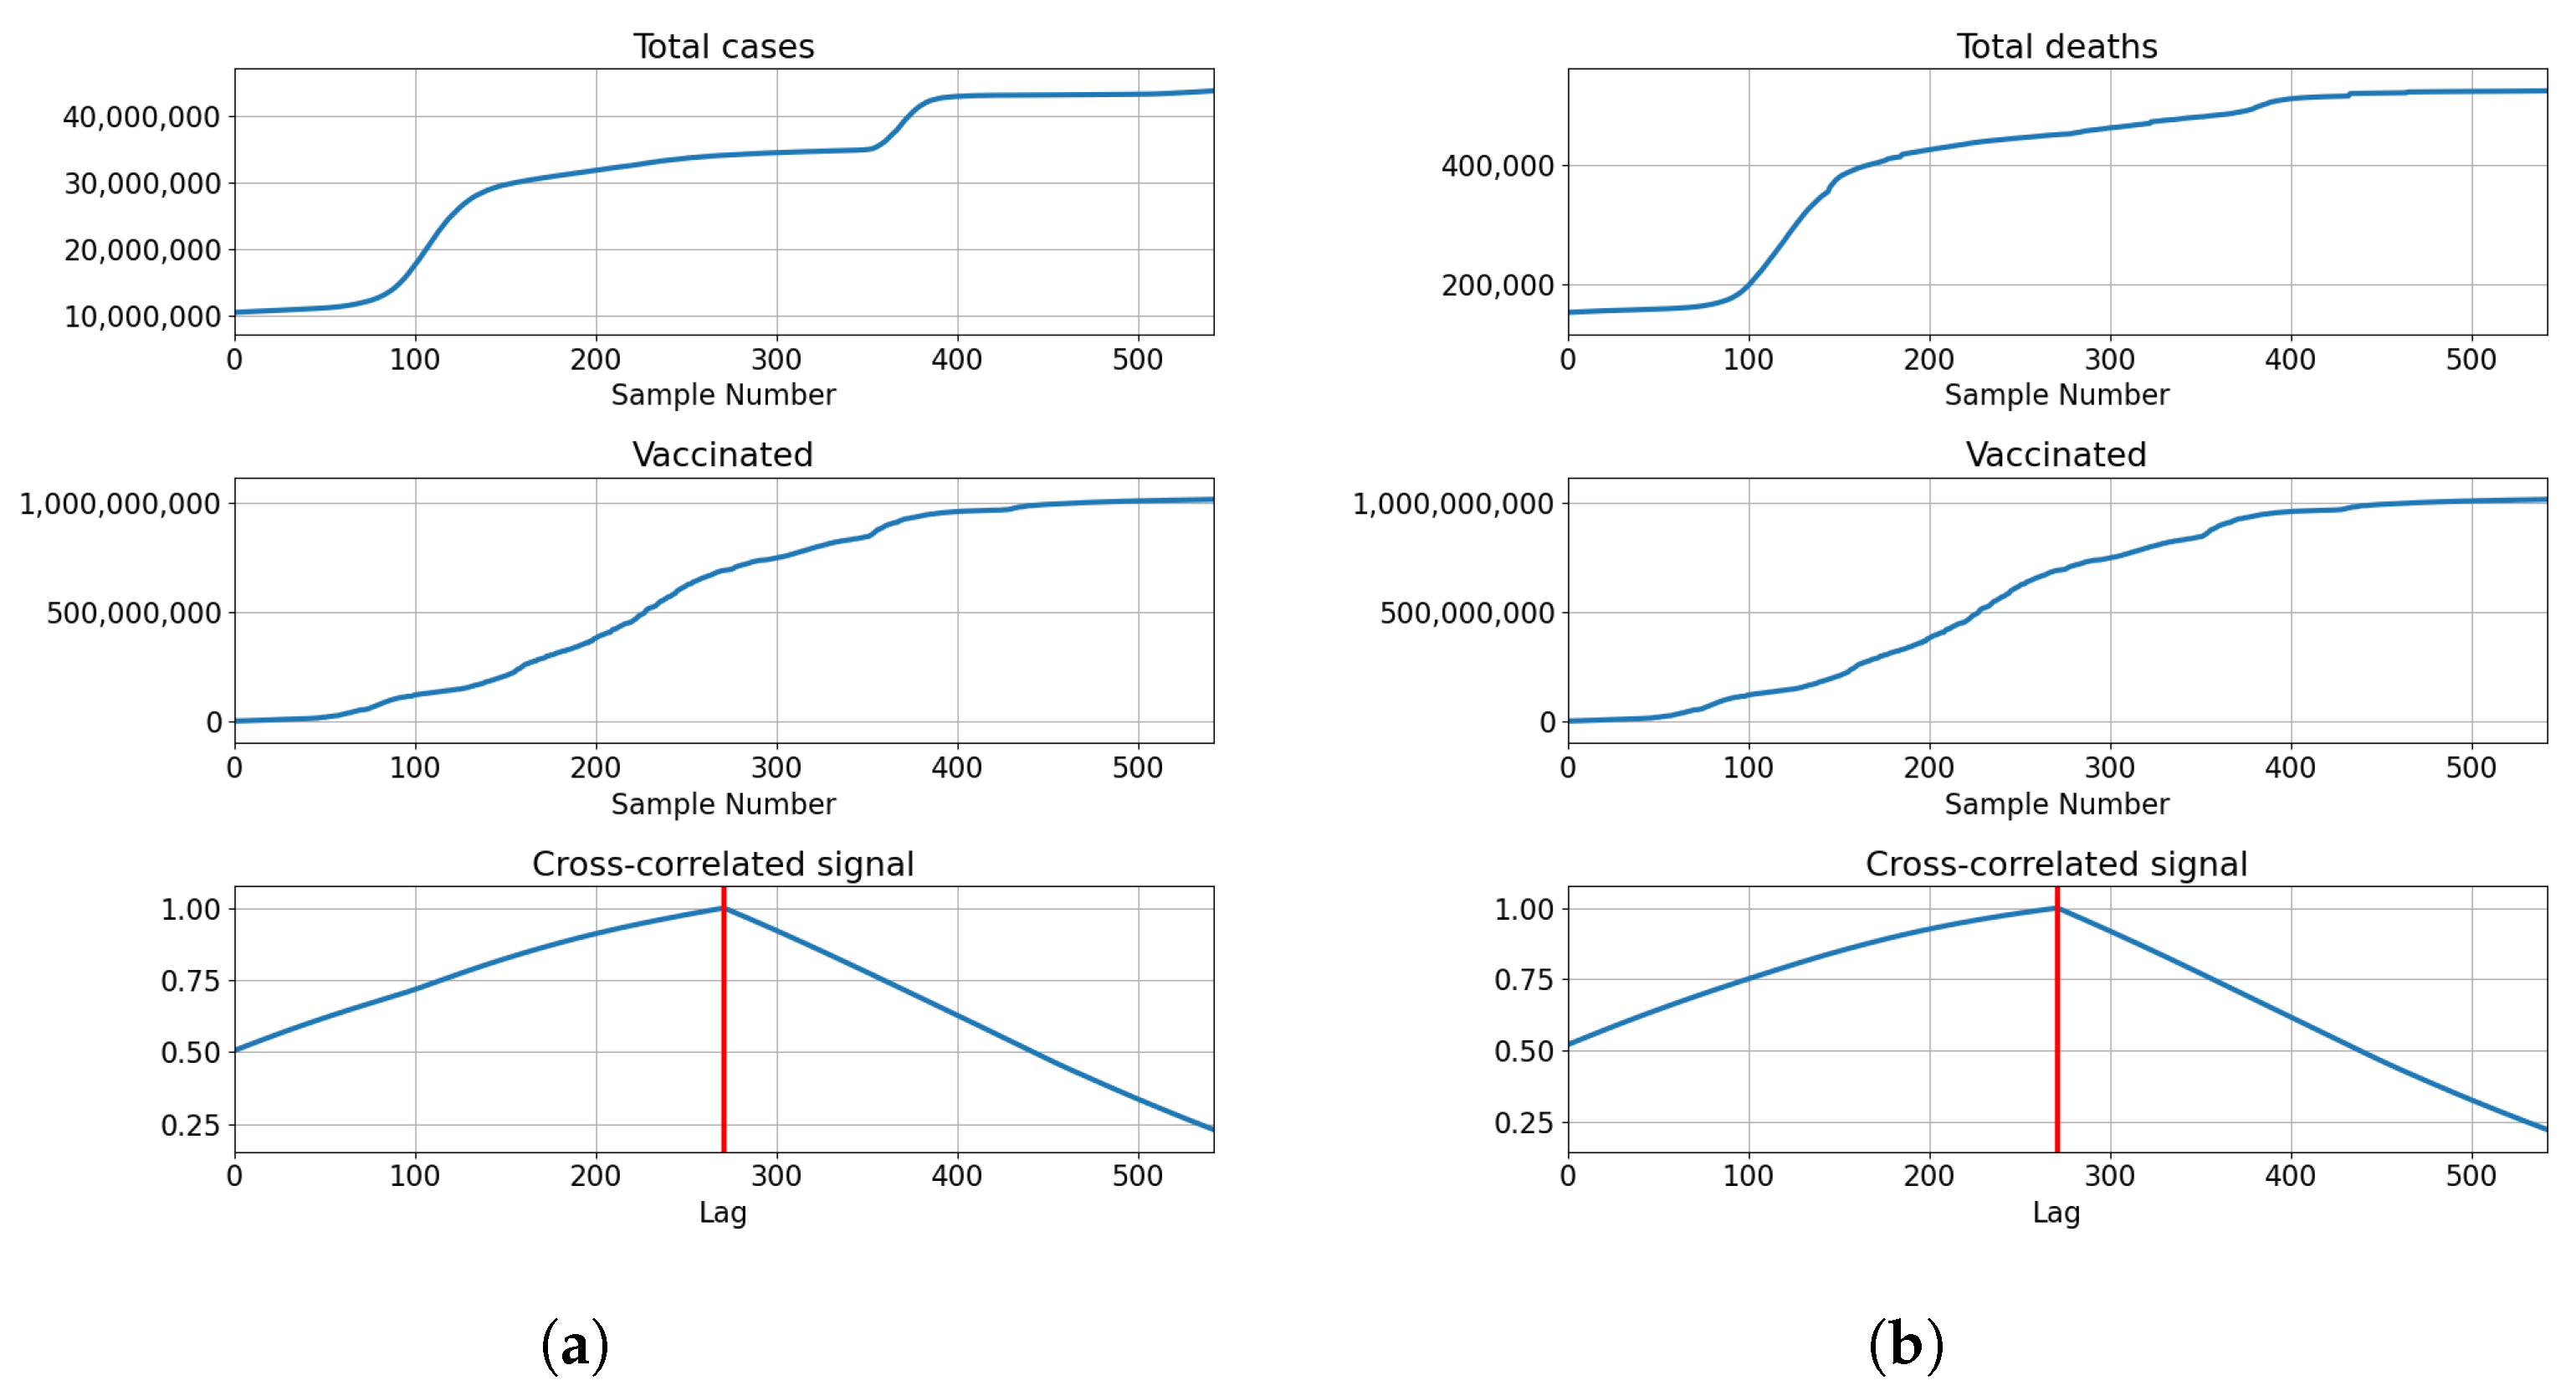
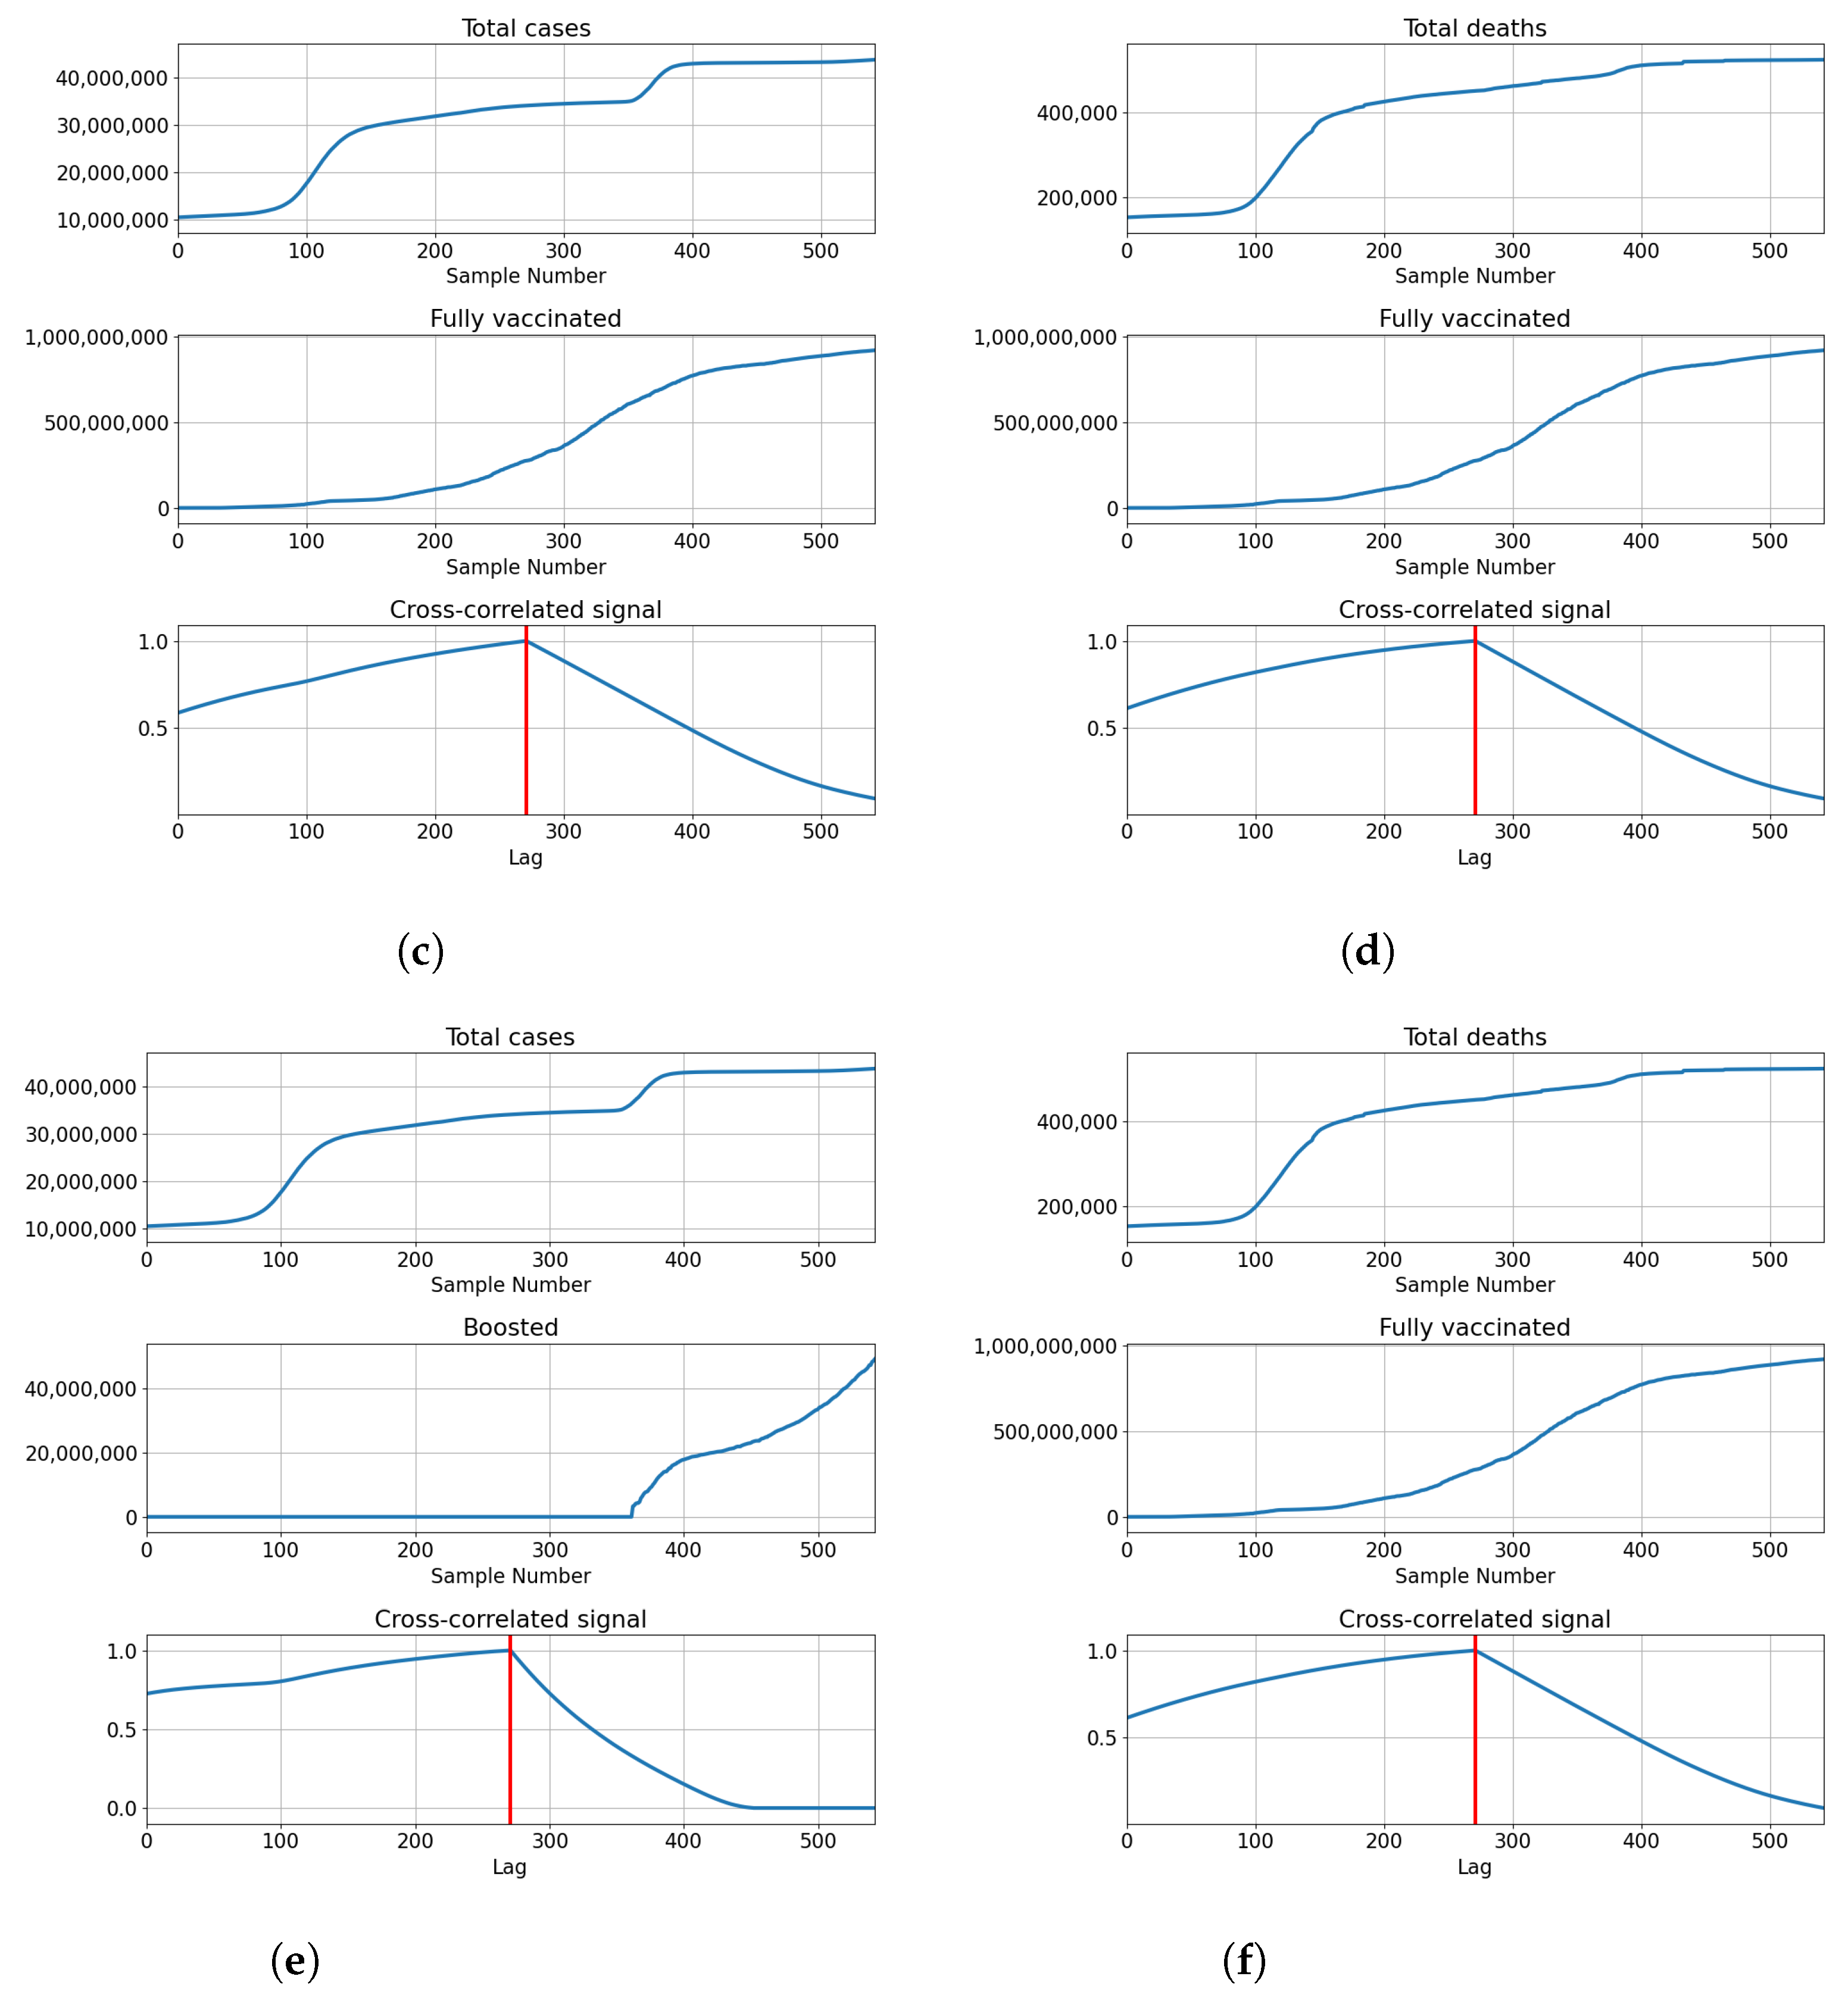
Cross-Correlation Analysis
2.2. Regression Methods
2.2.1. Linear Regression
2.2.2. LASSO
2.2.3. Logistic Regression
2.2.4. Multilayer Perceptron
2.2.5. Support Vector Regression
2.3. Evaluation
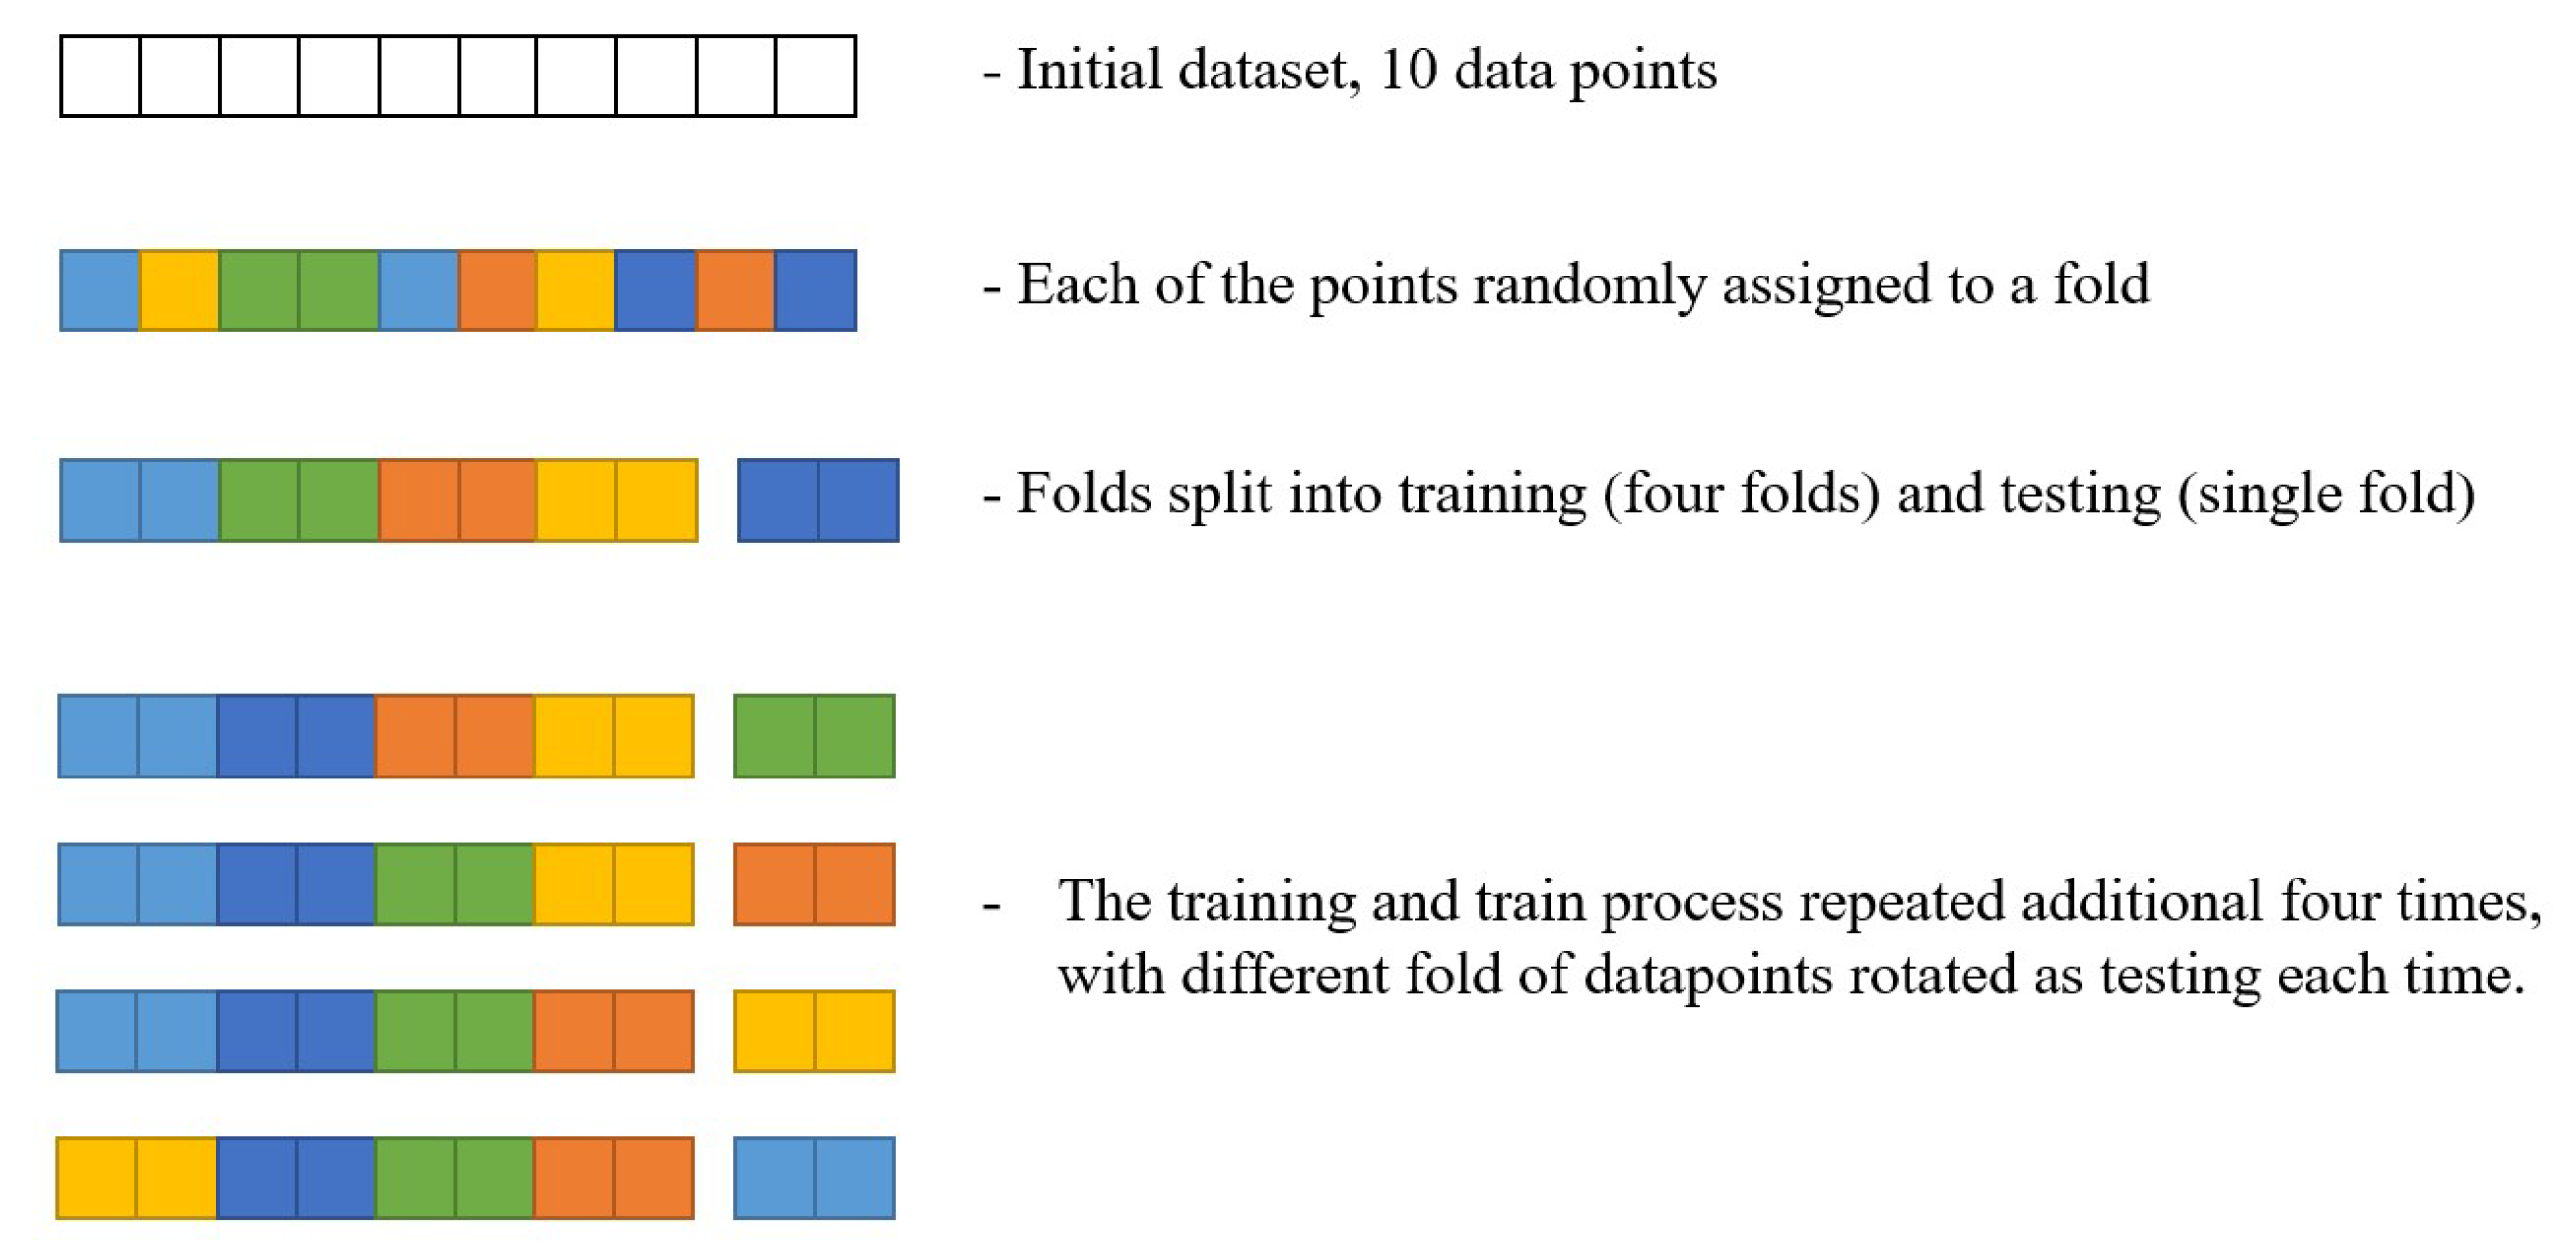
Cross-Validation
3. Results and Discussion
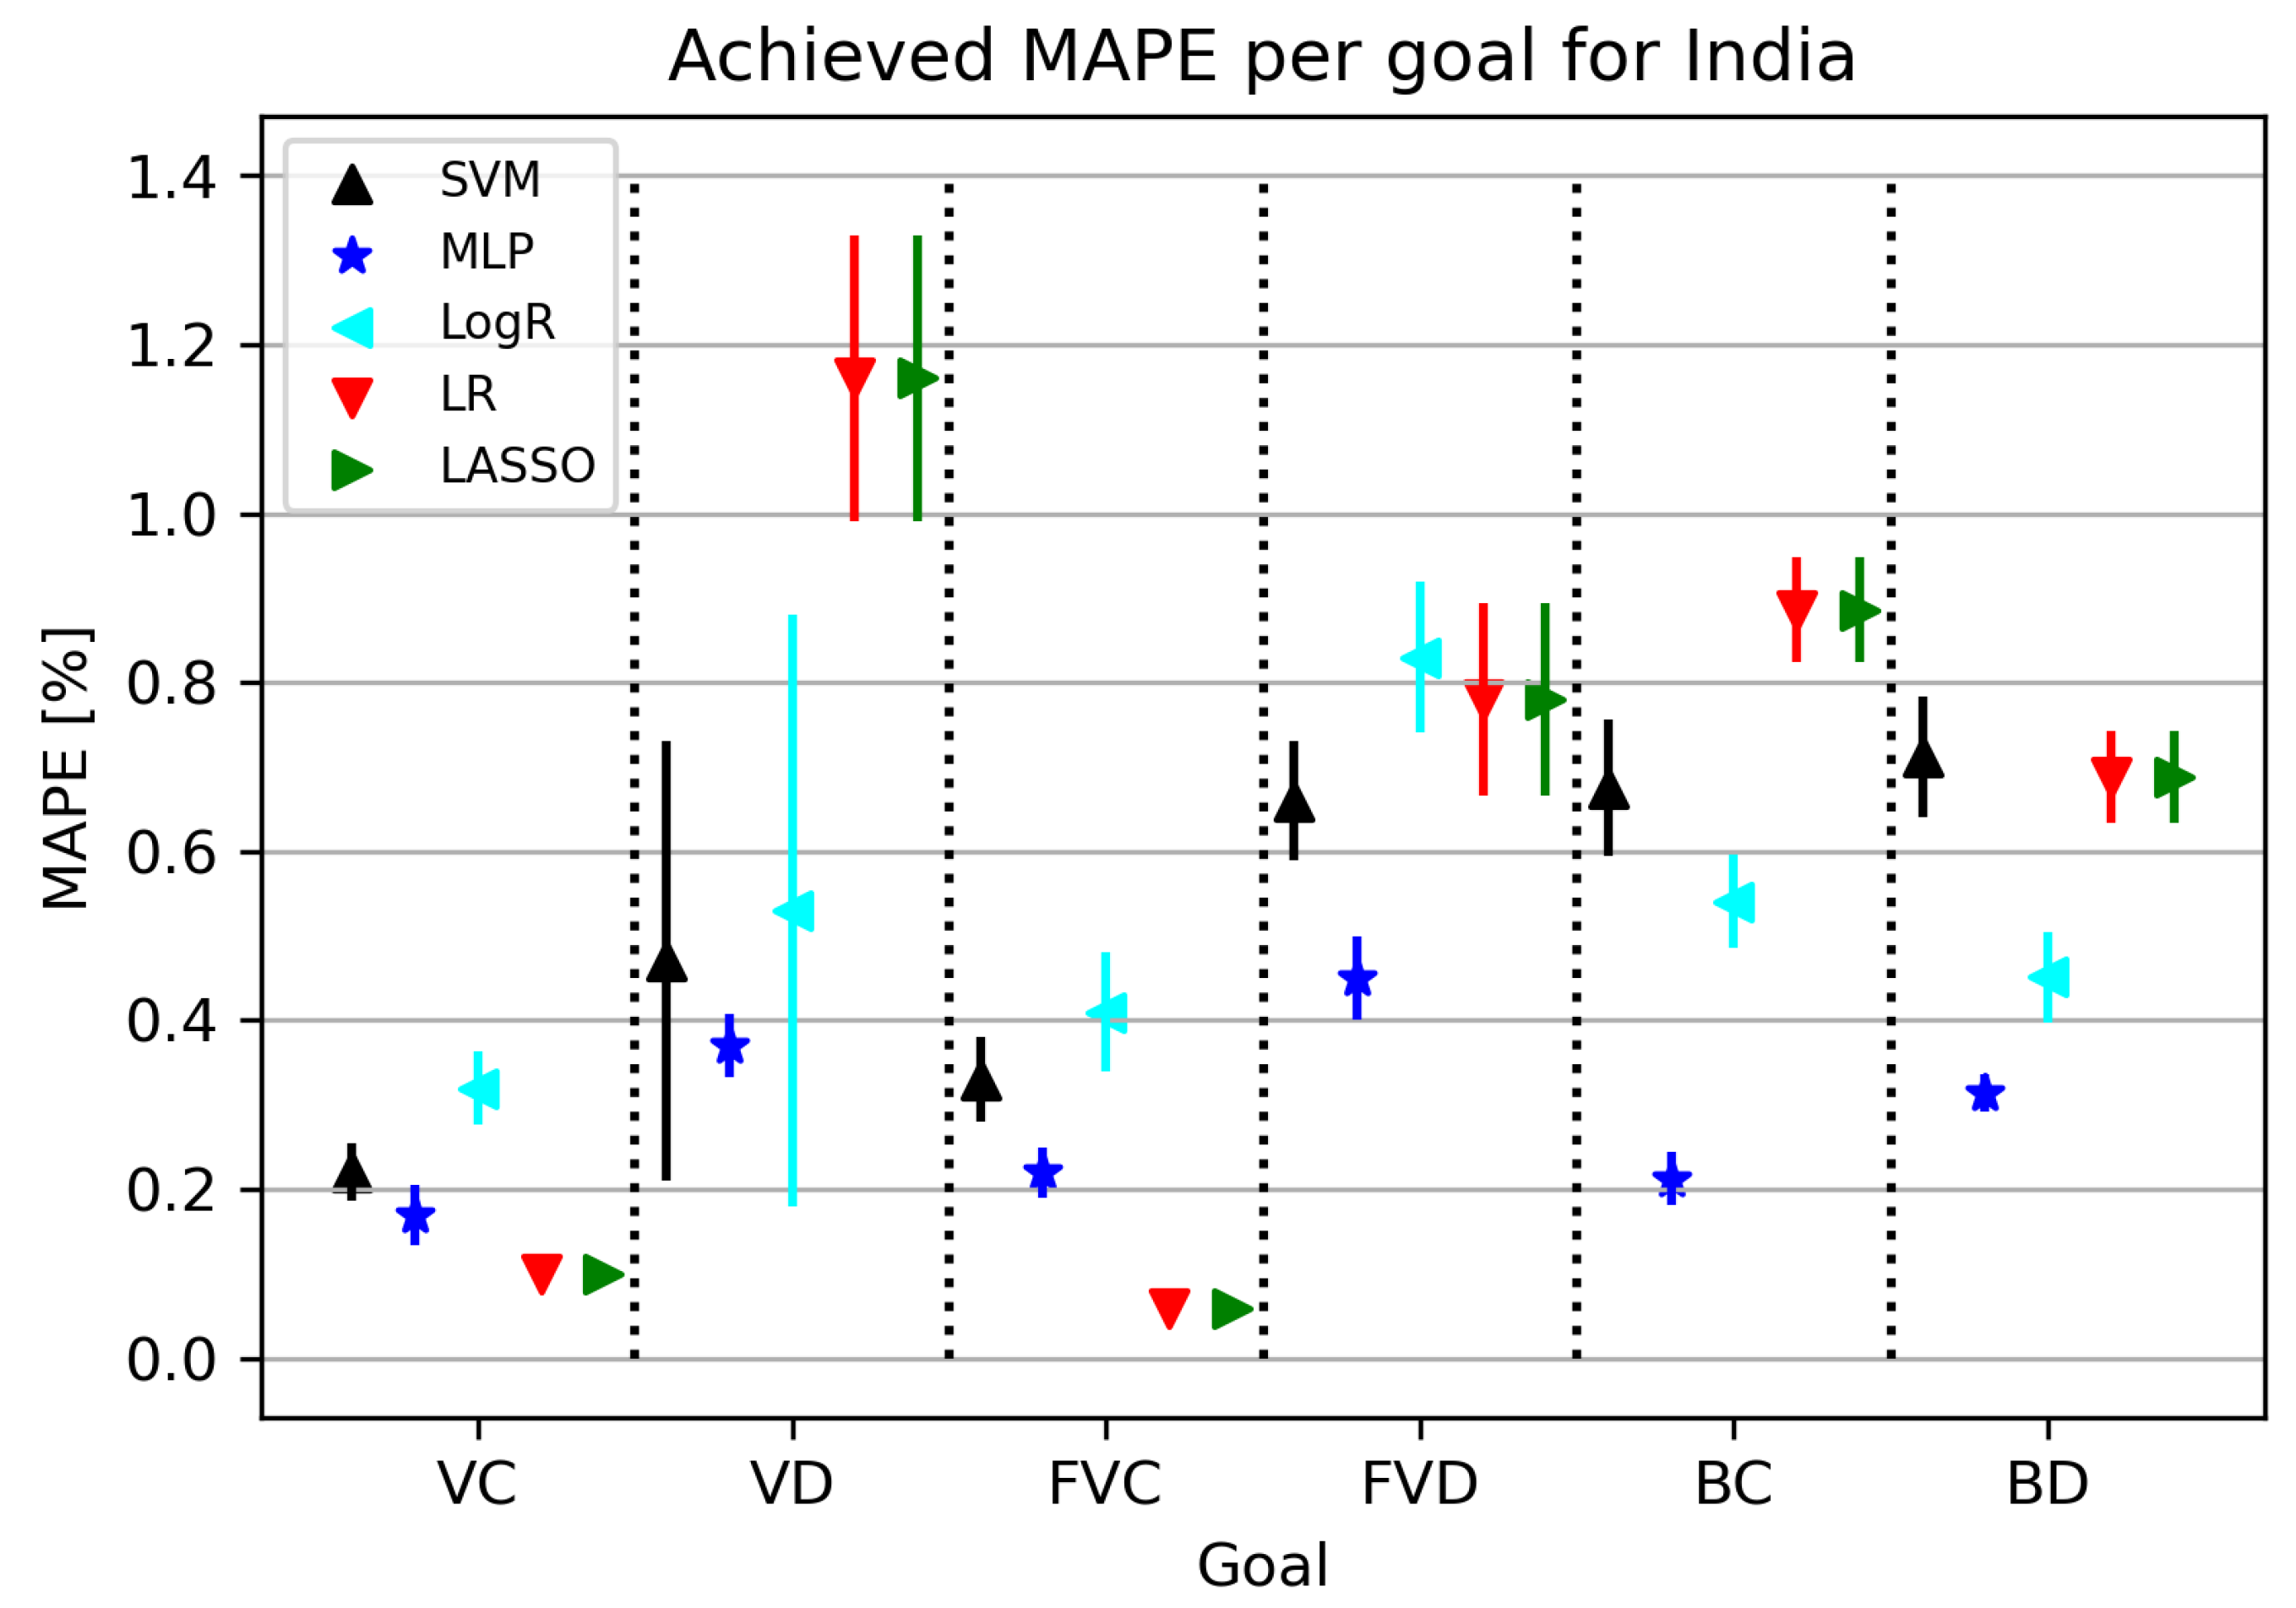
- Vaccinated Patients and Confirmed Patients (VC),
- Vaccinated Patients and Deceased Patients (VD),
- Fully Vaccinated Patients and Confirmed Patients (FVC),
- Fully Vaccinated Patients and Deceased Patients (FVD),
- Boosted Patients and Confirmed Patients (BC), and
- Boosted Patients and Deceased Patients (BD).
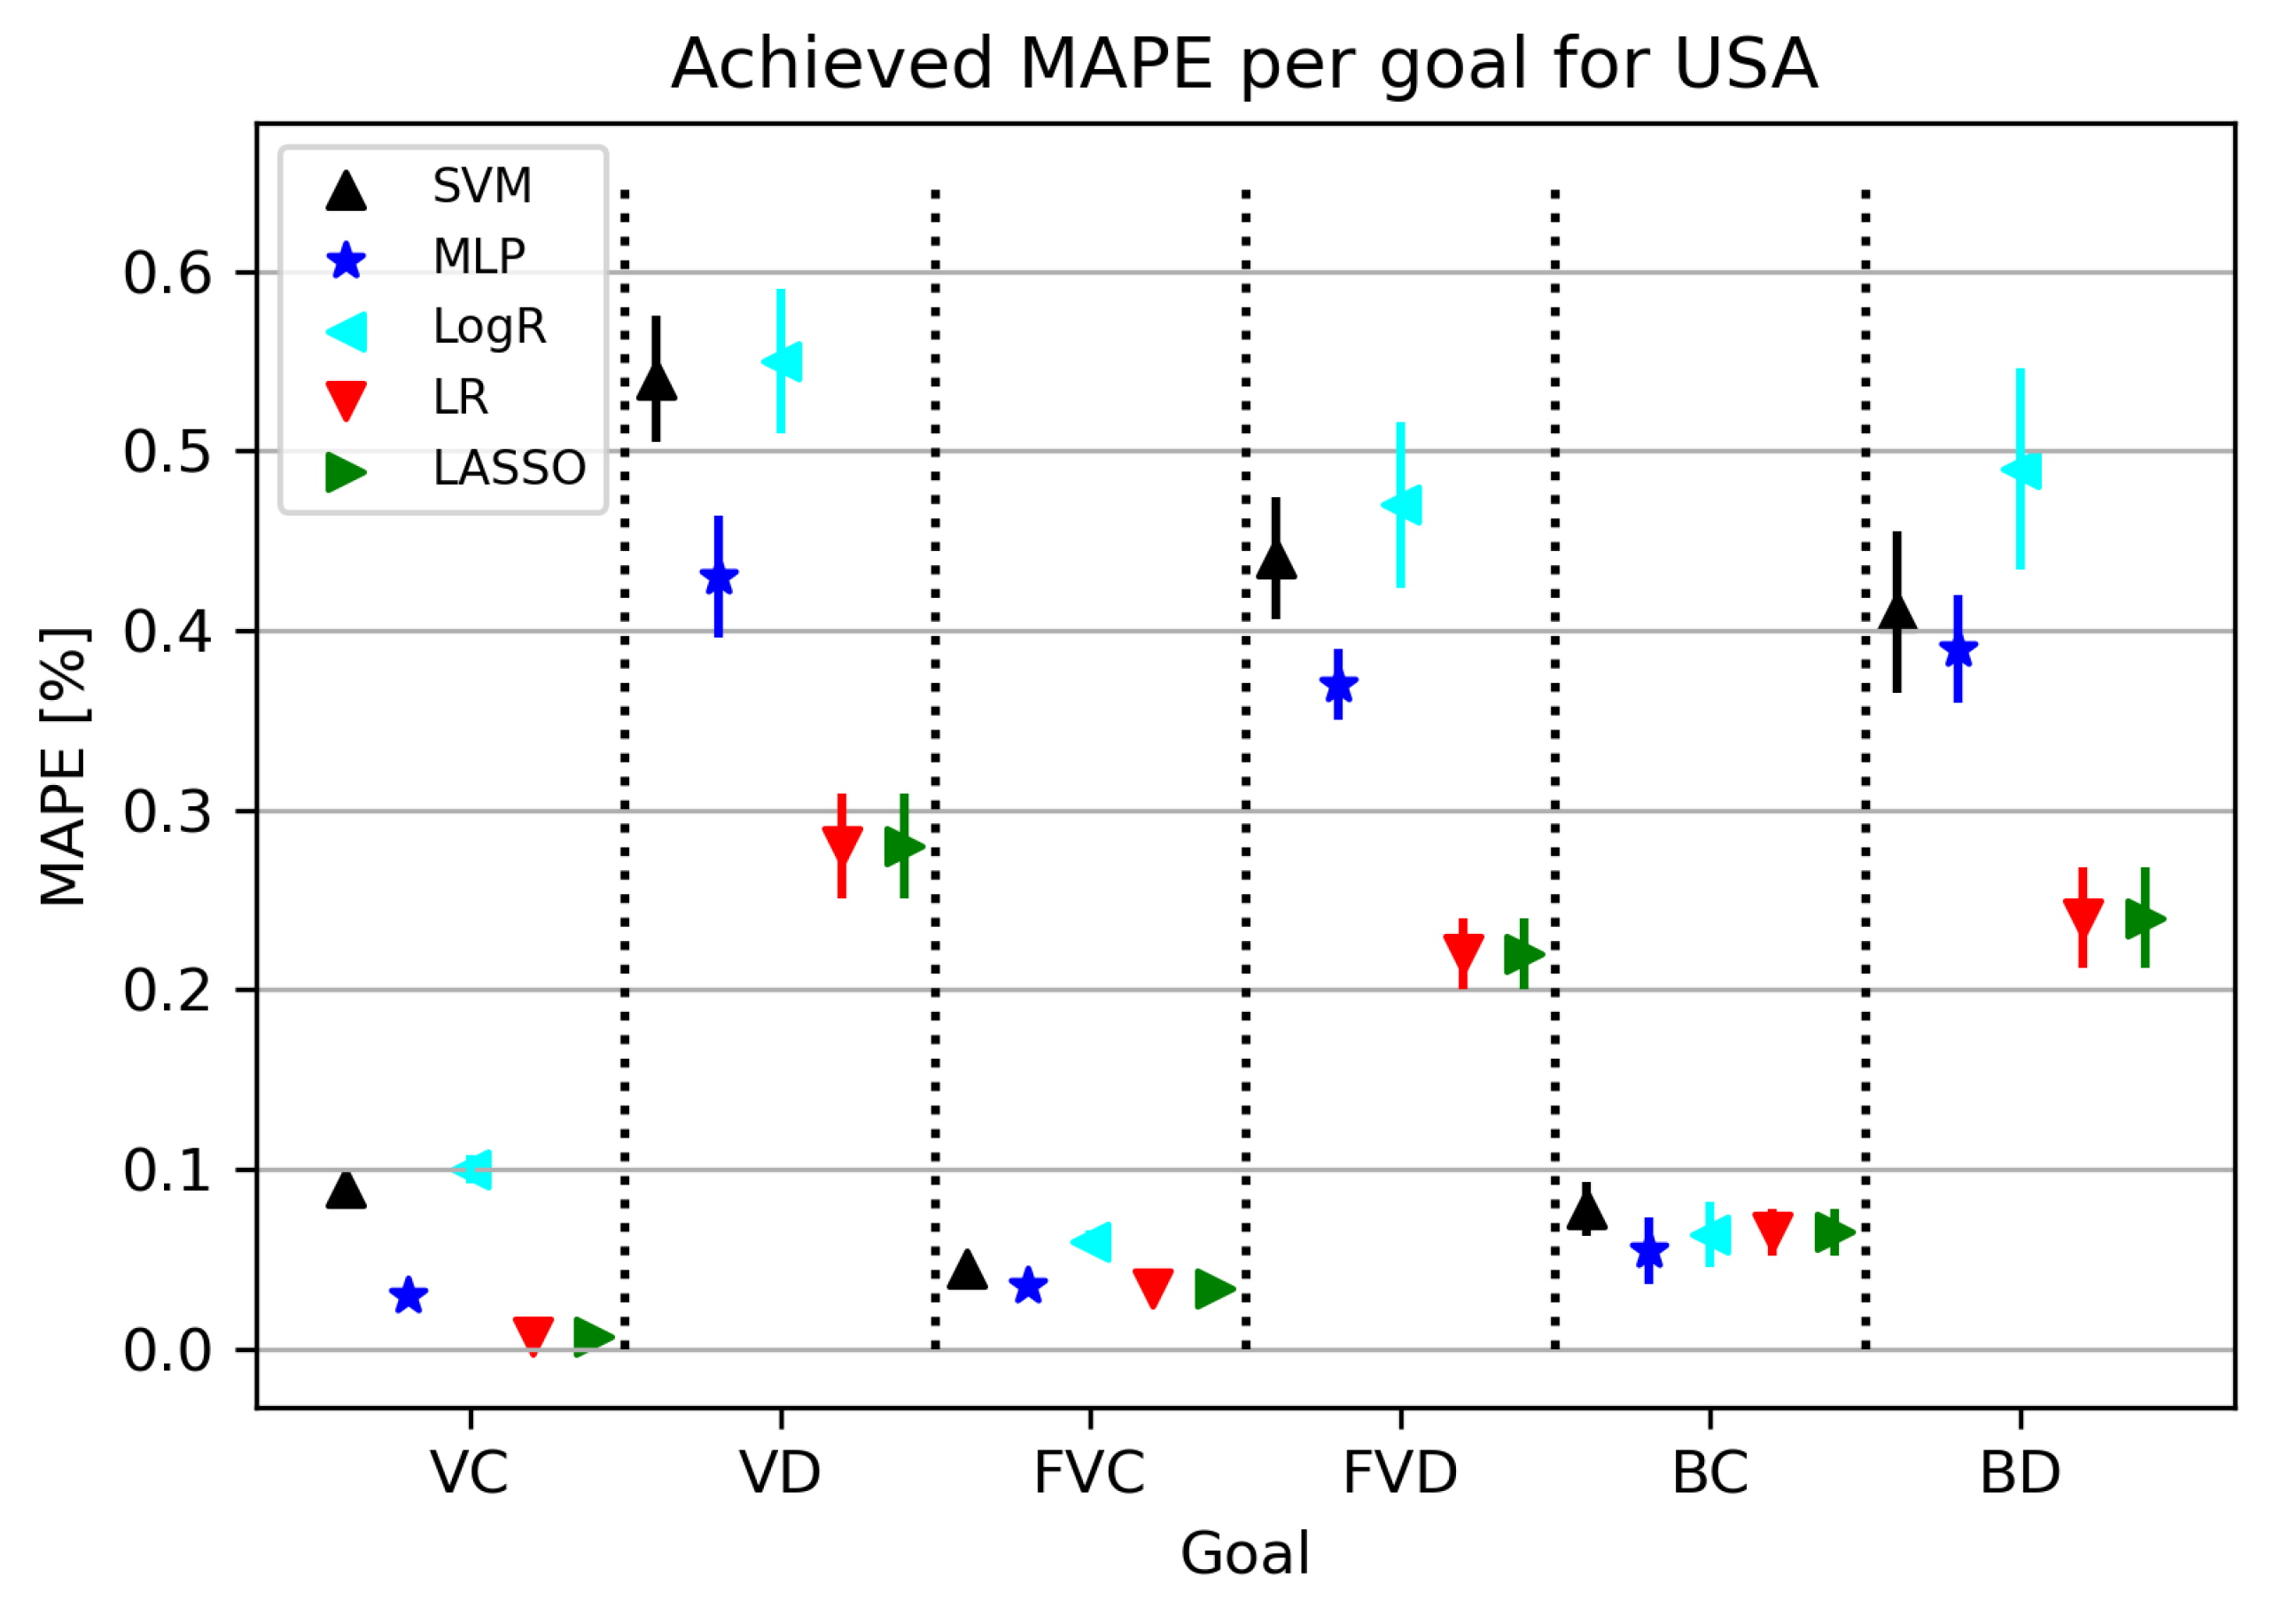
3.1. USA
3.1.1. Correlation Analysis Results
3.1.2. Regression Results
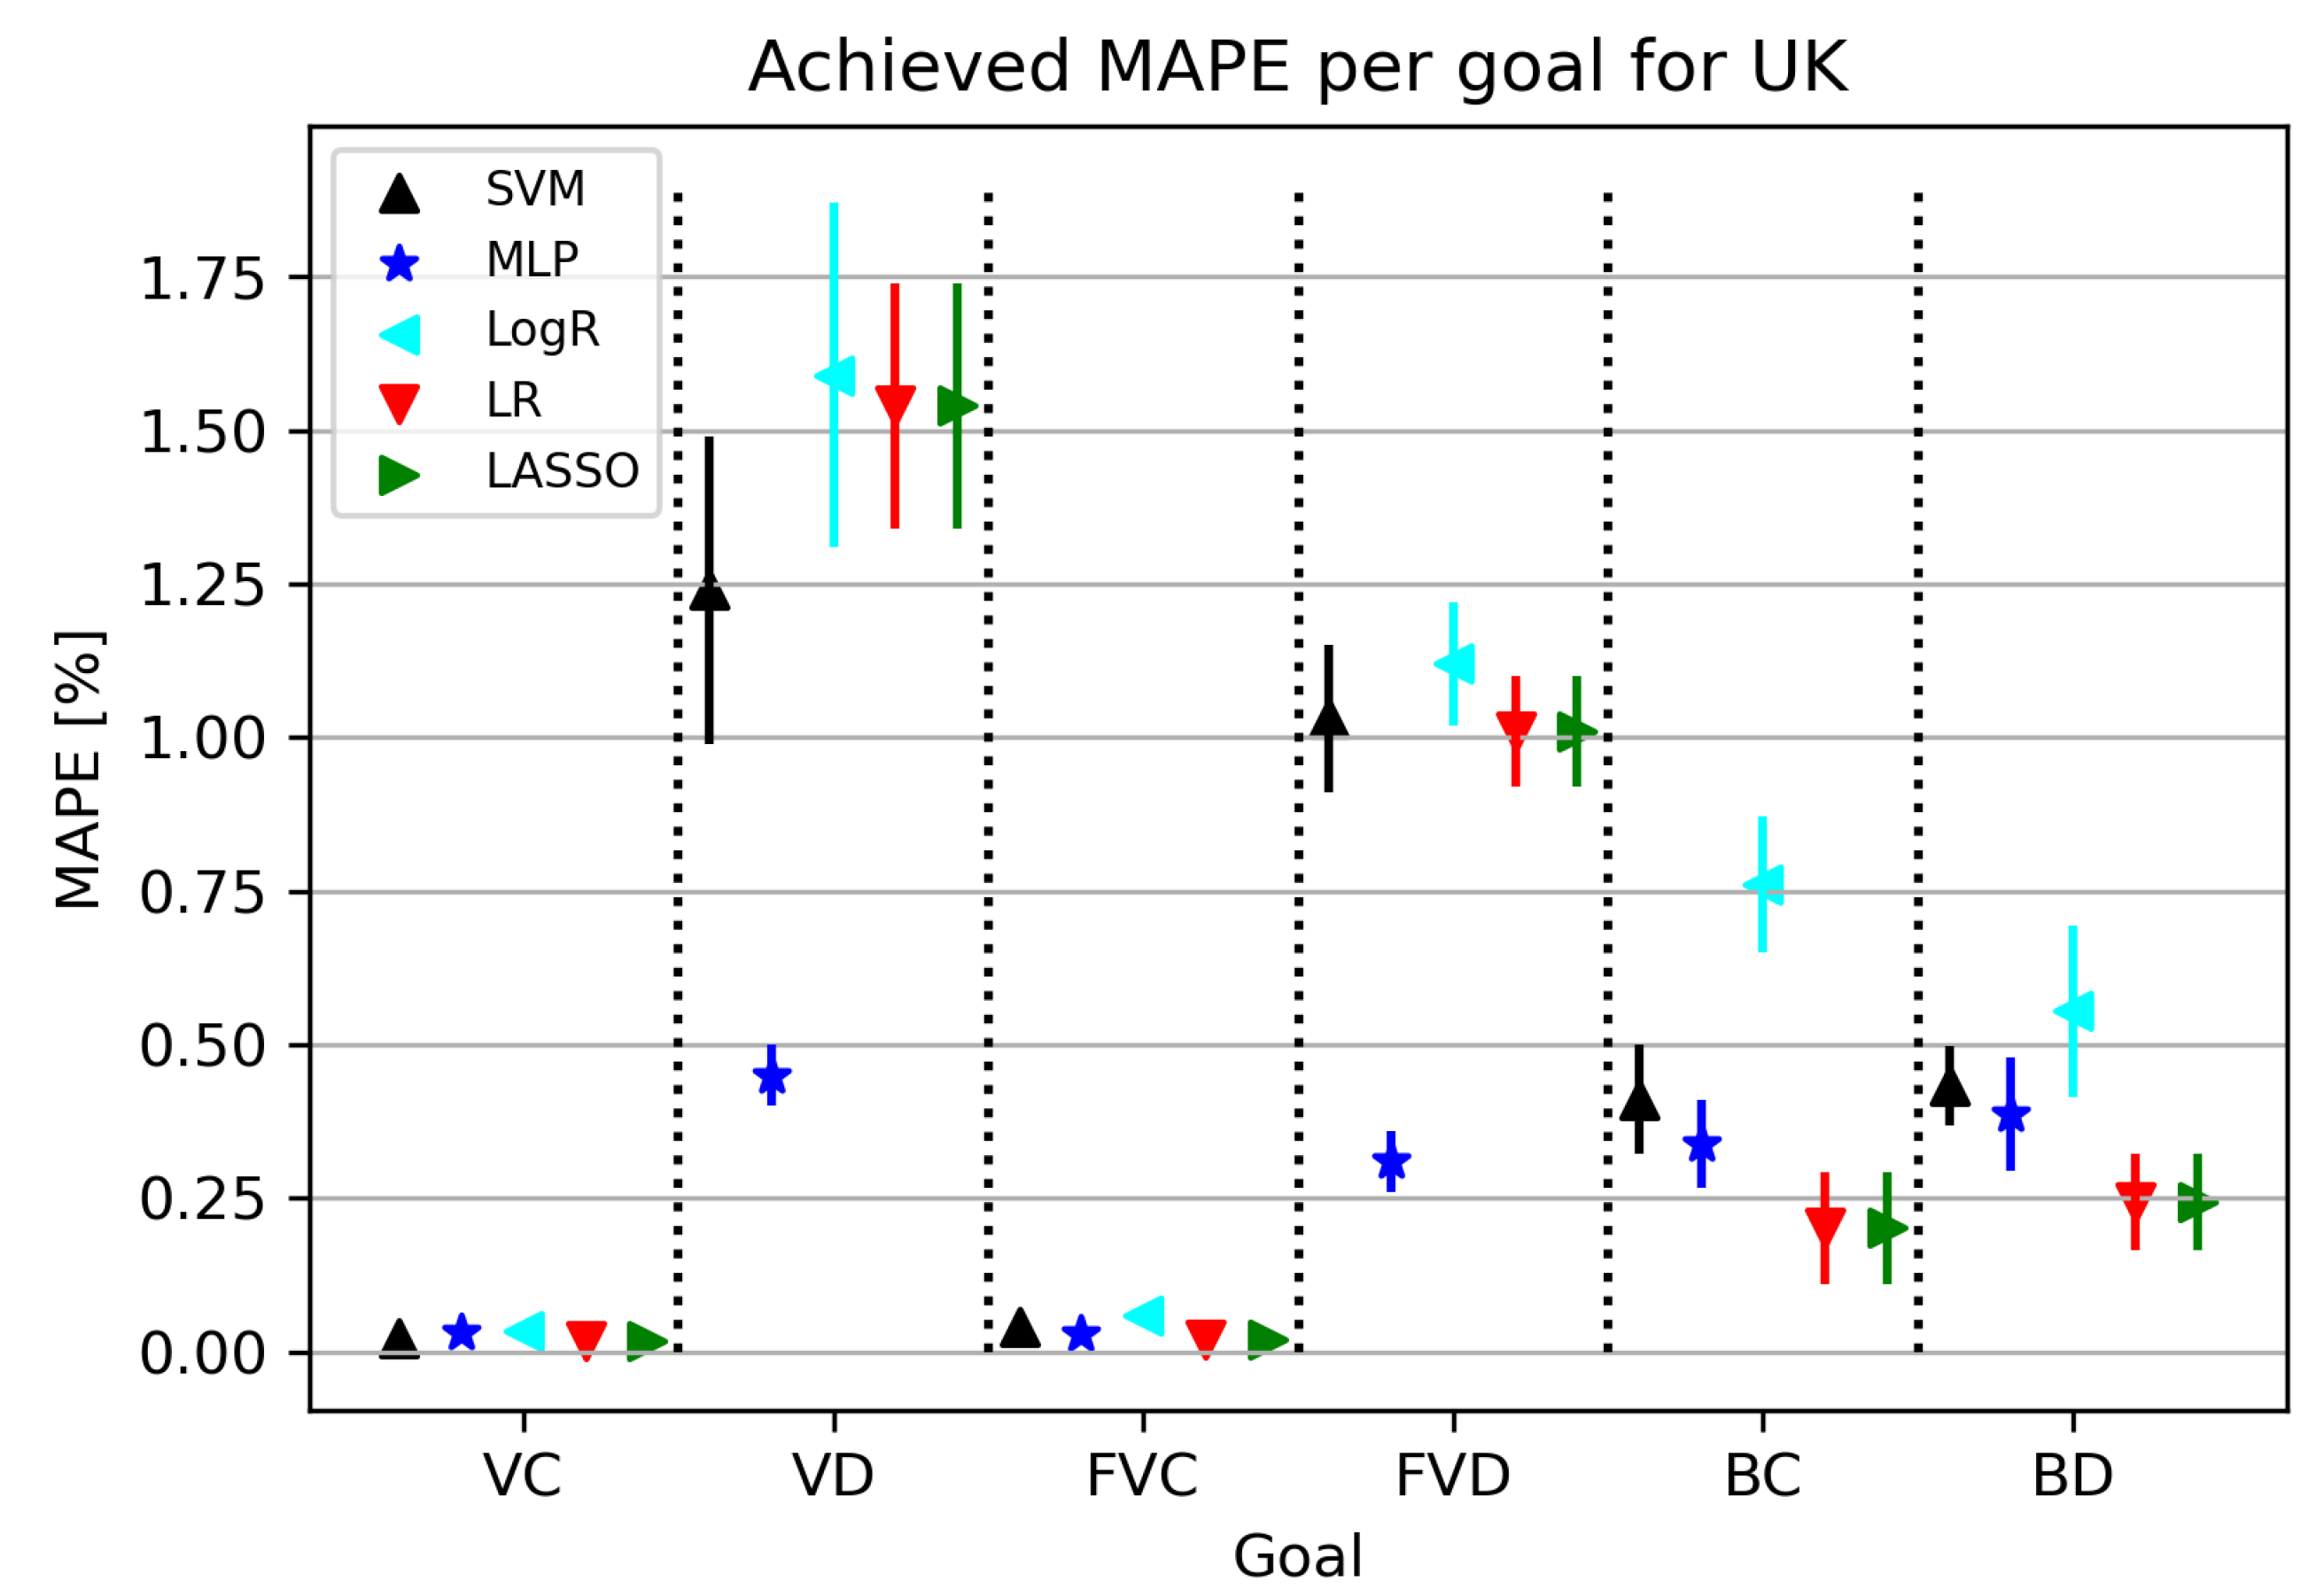
3.2. United Kingdom
3.2.1. Correlation Analysis Results
3.2.2. Regression Results
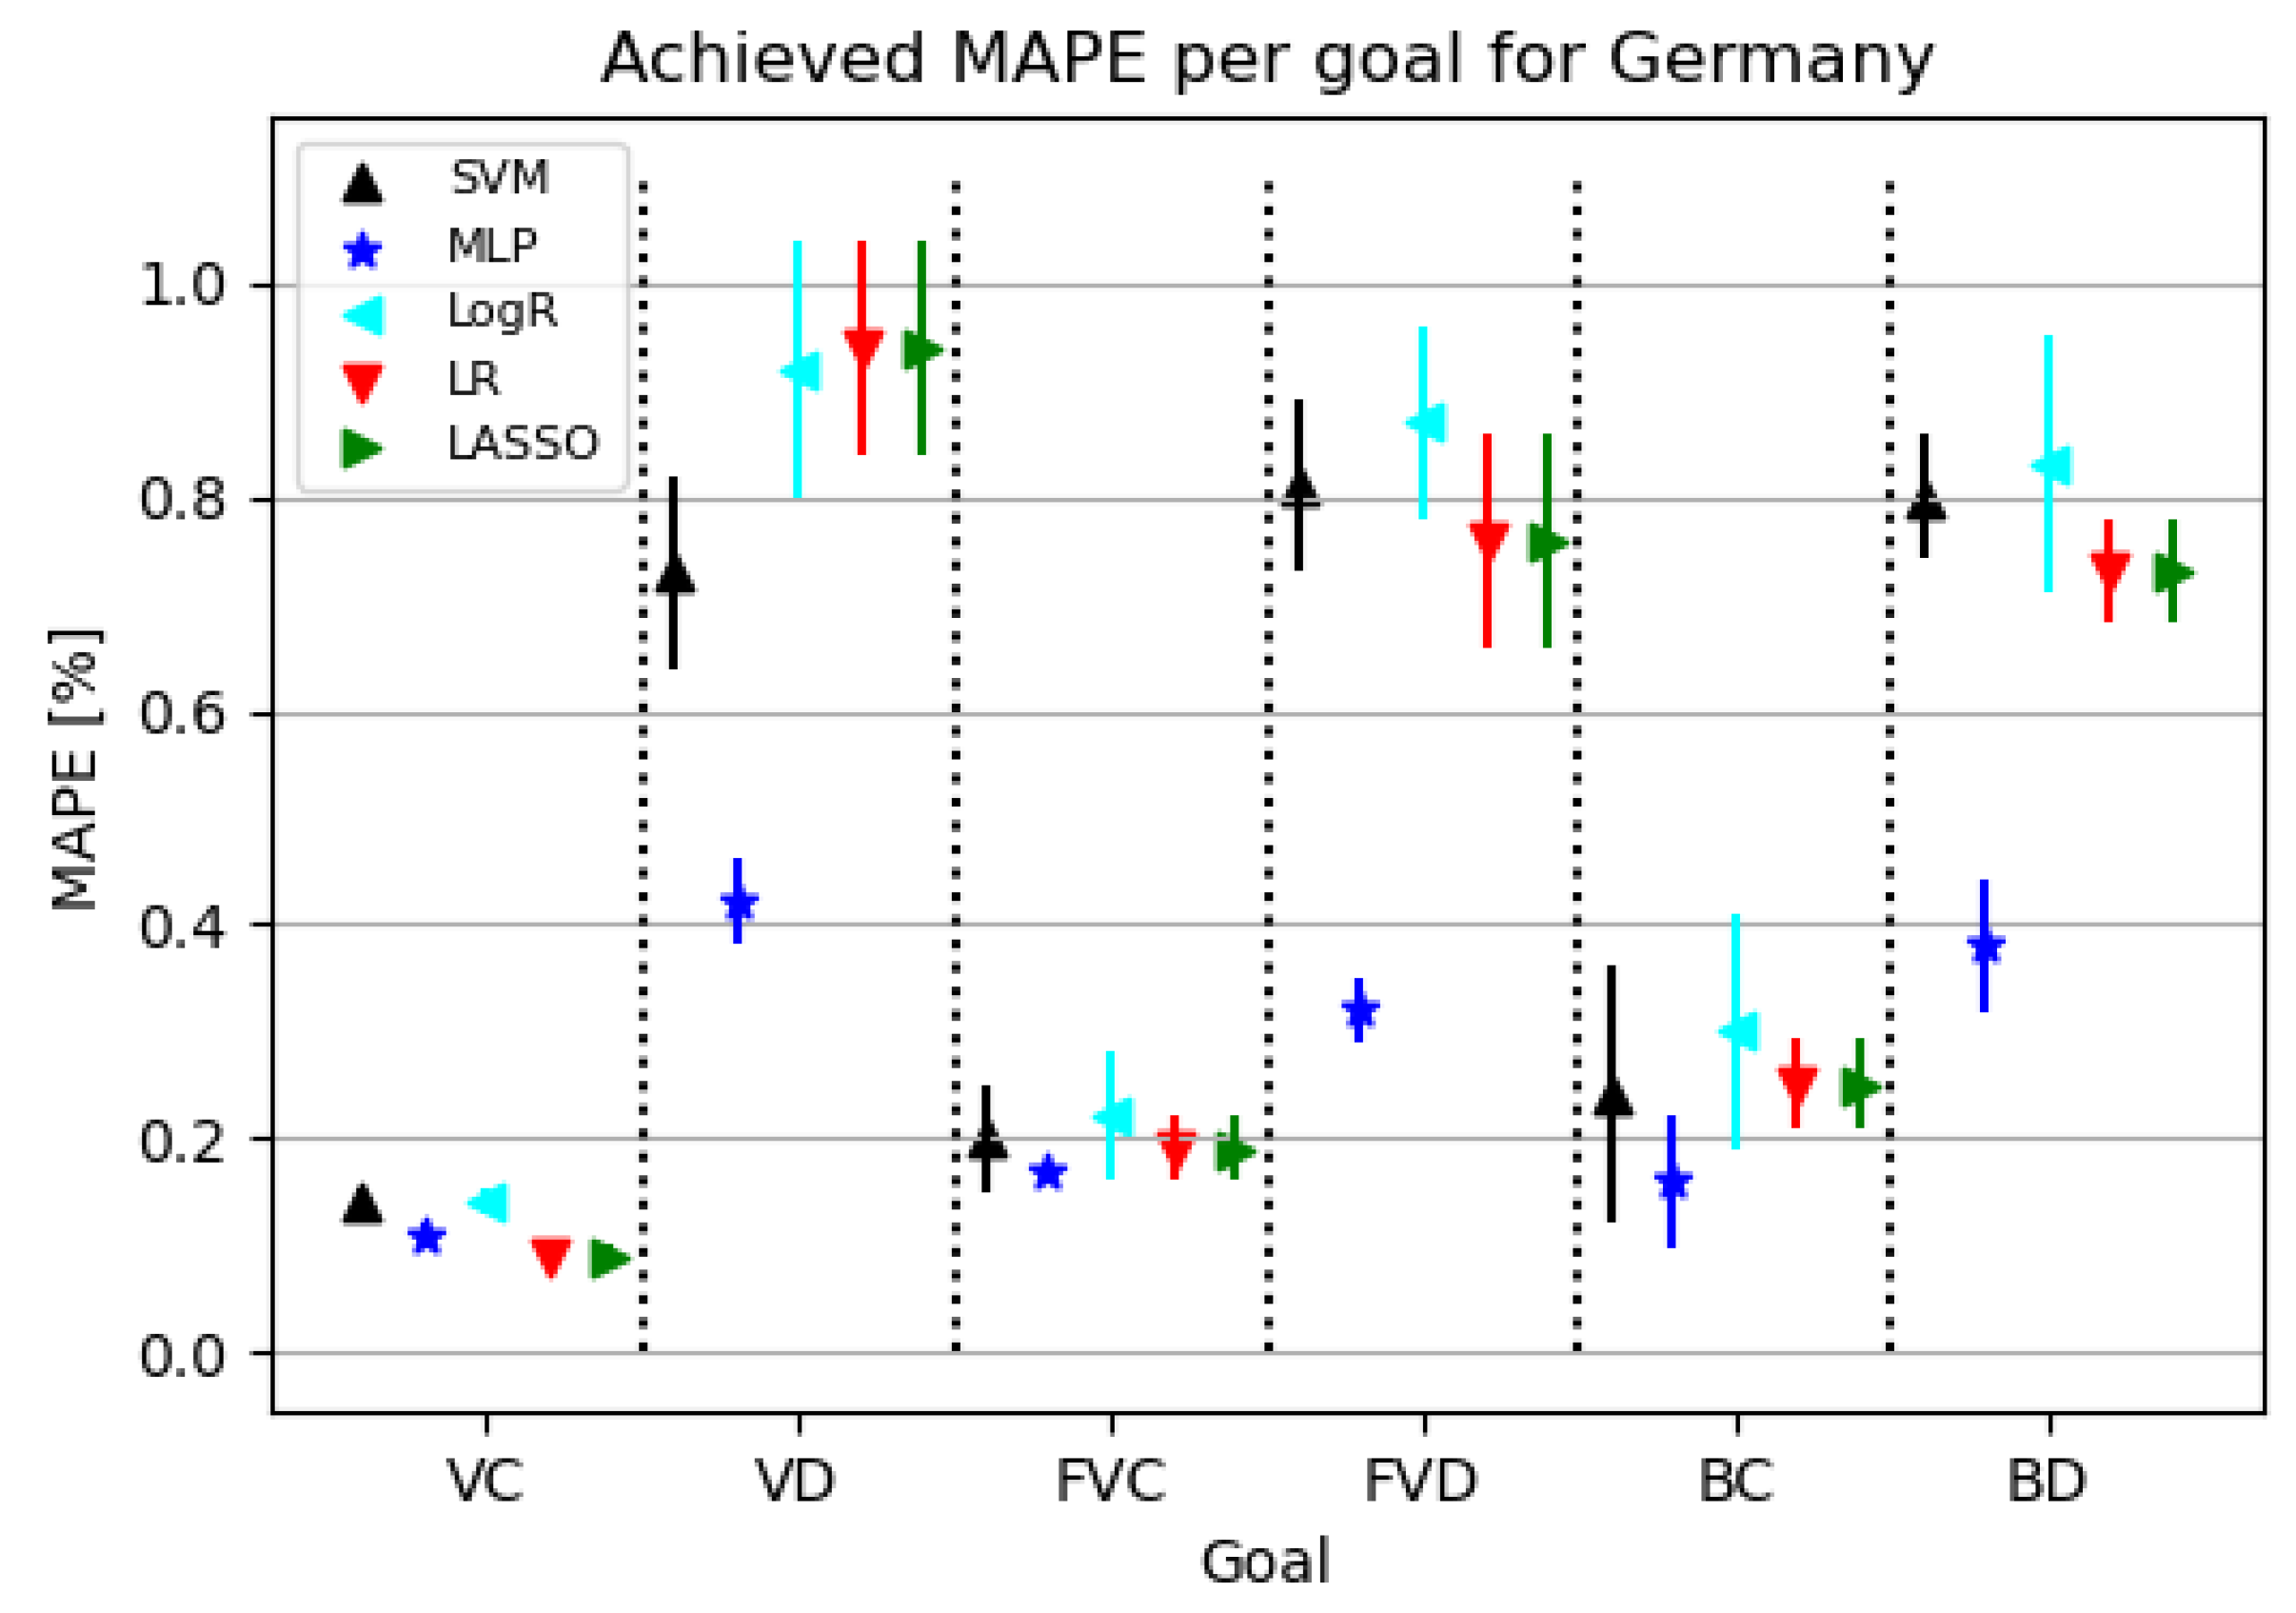
3.3. Germany
3.3.1. Correlation Analysis Results
3.3.2. Regression Results
3.4. India
3.4.1. Correlation Analysis Results
3.4.2. Regression Results
4. Conclusions
Author Contributions
Funding
Institutional Review Board Statement
Informed Consent Statement
Data Availability Statement
Acknowledgments
Conflicts of Interest
Abbreviations
| MLP | Multilayer Perceptron |
| SVR | Support Vector Regressor |
| FVC | Fully Vaccinated Patients—Confirmed Patients Data Pair |
| FVD | Fully Vaccinated Patients—Deceased Patients Data Pair |
| GER | Germany |
| IND | India |
| LASSO | Least Absolute Shrinkage and Selection Operator |
| LogR | Logistic Regression |
| LR | Linear Regression |
| MAPE | Mean Average Percentage Error |
| OWID | Our World in Data |
| UK | United Kingdom |
| USA | United States of America |
| VC | Vaccinated Patients—Confirmed Patients Data Pair |
| VD | Vaccinated Patients—Deceased Patients Data Pair |
| BC | Boosted Patients—Confirmed Patients Data Pair |
| BD | Boosted patients—Deceased patients Data Pair |
References
- Fauci, A.S.; Lane, H.C.; Redfield, R.R. COVID-19—Navigating the uncharted. N. Engl. J. Med. 2020, 382, 1268–1269. [Google Scholar] [CrossRef] [PubMed]
- Velavan, T.P.; Meyer, C.G. The COVID-19 epidemic. Trop. Med. Int. Health 2020, 25, 278. [Google Scholar] [CrossRef] [PubMed]
- Jebril, N. World Health Organization declared a pandemic public health menace: A systematic review of the coronavirus disease 2019 “COVID-19”. SSRN Electron. J. 2020, 3566298. [Google Scholar] [CrossRef]
- Cavanagh, G.; Wambier, C.G. Rational hand hygiene during the coronavirus 2019 (COVID-19) pandemic. J. Am. Acad. Dermatol. 2020, 82, e211. [Google Scholar] [CrossRef]
- Zhang, K.; Vilches, T.N.; Tariq, M.; Galvani, A.P.; Moghadas, S.M. The impact of mask-wearing and shelter-in-place on COVID-19 outbreaks in the United States. Int. J. Infect. Dis. 2020, 101, 334–341. [Google Scholar] [CrossRef]
- Chinazzi, M.; Davis, J.T.; Ajelli, M.; Gioannini, C.; Litvinova, M.; Merler, S.; Y Piontti, A.P.; Mu, K.; Rossi, L.; Sun, K.; et al. The effect of travel restrictions on the spread of the 2019 novel coronavirus (COVID-19) outbreak. Science 2020, 368, 395–400. [Google Scholar] [CrossRef]
- Lau, H.; Khosrawipour, V.; Kocbach, P.; Mikolajczyk, A.; Schubert, J.; Bania, J.; Khosrawipour, T. The positive impact of lockdown in Wuhan on containing the COVID-19 outbreak in China. J. Travel Med. 2020, 27, taaa037. [Google Scholar] [CrossRef]
- Tregoning, J.S.; Brown, E.S.; Cheeseman, H.M.; Flight, K.E.; Higham, S.L.; Lemm, N.M.; Pierce, B.F.; Stirling, D.C.; Wang, Z.; Pollock, K.M. Vaccines for COVID-19. Clin. Exp. Immunol. 2020, 202, 162–192. [Google Scholar] [CrossRef]
- Forni, G.; Mantovani, A. COVID-19 vaccines: Where we stand and challenges ahead. Cell Death Differ. 2021, 28, 626–639. [Google Scholar] [CrossRef]
- Yamey, G.; Schäferhoff, M.; Hatchett, R.; Pate, M.; Zhao, F.; McDade, K.K. Ensuring global access to COVID-19 vaccines. Lancet 2020, 395, 1405–1406. [Google Scholar] [CrossRef]
- Lurie, N.; Saville, M.; Hatchett, R.; Halton, J. Developing Covid-19 vaccines at pandemic speed. N. Engl. J. Med. 2020, 382, 1969–1973. [Google Scholar] [CrossRef] [PubMed]
- Wedlund, L.; Kvedar, J. New machine learning model predicts who may benefit most from COVID-19 vaccination. PJ Digit. Med. 2021, 4, 1. [Google Scholar] [CrossRef] [PubMed]
- Car, Z.; Baressi Šegota, S.; Andelić, N.; Lorencin, I.; Mrzljak, V. Modeling the spread of COVID-19 infection using a multilayer perceptron. Comput. Math. Methods Med. 2020, 2020, 5714714. [Google Scholar] [CrossRef] [PubMed]
- Rustam, F.; Reshi, A.A.; Mehmood, A.; Ullah, S.; On, B.W.; Aslam, W.; Choi, G.S. COVID-19 future forecasting using supervised machine learning models. IEEE Access 2020, 8, 101489–101499. [Google Scholar] [CrossRef]
- Mollalo, A.; Rivera, K.M.; Vahedi, B. Artificial neural network modeling of novel coronavirus (COVID-19) incidence rates across the continental United States. Int. J. Environ. Res. Public Health 2020, 17, 4204. [Google Scholar] [CrossRef]
- Gupta, A.; Gharehgozli, A. Developing a machine learning framework to determine the spread of COVID-19 in the USA using meteorological, social, and demographic factors. Int. J. Data Min. Model. Manag. 2020, 14, 89–109. [Google Scholar] [CrossRef]
- Onovo, A.; Atobatele, A.; Kalaiwo, A.; Obanubi, C.; James, E.; Gado, P.; Odezugo, G.; Ogundehin, D.; Magaji, D.; Russell, M. Using supervised machine learning and empirical Bayesian kriging to reveal correlates and patterns of COVID-19 disease outbreak in sub-Saharan Africa: Exploratory data analysis. MedRxiv 2020. [Google Scholar] [CrossRef]
- Bagabir, S.; Ibrahim, N.K.; Bagabir, H.; Ateeq, R. COVID-19 and Artificial Intelligence: Genome sequencing, drug development and vaccine discovery. J. Infect. Public Health 2022, 15, 289–296. [Google Scholar] [CrossRef]
- Bharadwaj, K.K.; Srivastava, A.; Panda, M.K.; Singh, Y.D.; Maharana, R.; Mandal, K.; Singh, B.M.; Singh, D.; Das, M.; Murmu, D.; et al. Computational intelligence in vaccine design against COVID-19. In Computational Intelligence Methods in COVID-19: Surveillance, Prevention, Prediction and Diagnosis; Springer: Berlin/Heidelberg, Germany, 2021; pp. 311–329. [Google Scholar]
- Ong, E.; Wong, M.U.; Huffman, A.; He, Y. COVID-19 coronavirus vaccine design using reverse vaccinology and machine learning. Front. Immunol. 2020, 11, 1581. [Google Scholar] [CrossRef]
- Keshavarzi Arshadi, A.; Webb, J.; Salem, M.; Cruz, E.; Calad-Thomson, S.; Ghadirian, N.; Collins, J.; Diez-Cecilia, E.; Kelly, B.; Goodarzi, H.; et al. Artificial intelligence for COVID-19 drug discovery and vaccine development. Front. Artif. Intell. 2020, 3, 65. [Google Scholar] [CrossRef]
- Mariappan, M.B.; Devi, K.; Venkataraman, Y.; Lim, M.K.; Theivendren, P. Using AI and ML to predict shipment times of therapeutics, diagnostics and vaccines in e-pharmacy supply chains during COVID-19 pandemic. Int. J. Logist. Manag. 2022; Epub ahead of print. [Google Scholar] [CrossRef]
- Tong, H.; Cao, C.; You, M.; Han, S.; Liu, Z.; Xiao, Y.; He, W.; Liu, C.; Peng, P.; Xue, Z.; et al. Artificial intelligence-assisted colorimetric lateral flow immunoassay for sensitive and quantitative detection of COVID-19 neutralizing antibody. Biosens. Bioelectron. 2022, 213, 114449. [Google Scholar] [CrossRef]
- Miner, A.S.; Laranjo, L.; Kocaballi, A.B. Chatbots in the fight against the COVID-19 pandemic. NPJ Digit. Med. 2020, 3, 1–4. [Google Scholar] [CrossRef] [PubMed]
- Shams, A.B.; Hoque Apu, E.; Rahman, A.; Sarker Raihan, M.M.; Siddika, N.; Preo, R.B.; Hussein, M.R.; Mostari, S.; Kabir, R. Web search engine misinformation notifier extension (SEMiNExt): A machine learning based approach during COVID-19 Pandemic. Healthcare 2021, 9, 156. [Google Scholar] [CrossRef] [PubMed]
- Mathieu, E.; Ritchie, H.; Ortiz-Ospina, E.; Roser, M.; Hasell, J.; Appel, C.; Giattino, C.; Rodés-Guirao, L. A global database of COVID-19 vaccinations. Nat. Hum. Behav. 2021, 5, 947–953. [Google Scholar] [CrossRef] [PubMed]
- COVID, C.; Team, V.B.C.I.; COVID, C.; Team, V.B.C.I.; COVID, C.; Team, V.B.C.I.; Birhane, M.; Bressler, S.; Chang, G.; Clark, T.; et al. COVID-19 Vaccine Breakthrough Infections Reported to CDC—United States, January 1–April 30, 2021. Morb. Mortal. Wkly. Rep. 2021, 70, 792. [Google Scholar]
- Krause, P.R.; Fleming, T.R.; Peto, R.; Longini, I.M.; Figueroa, J.P.; Sterne, J.A.; Cravioto, A.; Rees, H.; Higgins, J.P.; Boutron, I.; et al. Considerations in boosting COVID-19 vaccine immune responses. Lancet 2021, 398, 1377–1380. [Google Scholar] [CrossRef]
- Schafer, R.W.; Rabiner, L.R. Digital representations of speech signals. Proc. IEEE 1975, 63, 662–677. [Google Scholar] [CrossRef]
- Viel, C.; Viollet, S. Fast normalized cross-correlation for measuring distance to objects using optic flow, applied for helicopter obstacle detection. Measurement 2021, 172, 108911. [Google Scholar] [CrossRef]
- Friedman, J.; Hastie, T.; Tibshirani, R. The elements of Statistical Learning; Springer Series in Statistics; Springer: New York, NY, USA, 2001; Volume 1. [Google Scholar]
- Yao, L.; Fang, Z.; Xiao, Y.; Hou, J.; Fu, Z. An intelligent fault diagnosis method for lithium battery systems based on grid search support vector machine. Energy 2021, 214, 118866. [Google Scholar] [CrossRef]
- Li, G.; Wang, W.; Zhang, W.; Wang, Z.; Tu, H.; You, W. Grid search based multi-population particle swarm optimization algorithm for multimodal multi-objective optimization. Swarm Evol. Comput. 2021, 62, 100843. [Google Scholar] [CrossRef]
- Sun, Y.; Ding, S.; Zhang, Z.; Jia, W. An improved grid search algorithm to optimize SVR for prediction. Soft Comput. 2021, 25, 5633–5644. [Google Scholar] [CrossRef]
- Ghosal, S.; Sengupta, S.; Majumder, M.; Sinha, B. Linear Regression Analysis to predict the number of deaths in India due to SARS-CoV-2 at 6 weeks from day 0 (100 cases-March 14th 2020). Diabetes Metab. Syndr. Clin. Res. Rev. 2020, 14, 311–315. [Google Scholar] [CrossRef] [PubMed]
- Rath, S.; Tripathy, A.; Tripathy, A.R. Prediction of new active cases of coronavirus disease (COVID-19) pandemic using multiple linear regression model. Diabetes Metab. Syndr. Clin. Res. Rev. 2020, 14, 1467–1474. [Google Scholar] [CrossRef]
- Pedregosa, F.; Varoquaux, G.; Gramfort, A.; Michel, V.; Thirion, B.; Grisel, O.; Blondel, M.; Prettenhofer, P.; Weiss, R.; Dubourg, V.; et al. Scikit-learn: Machine learning in Python. J. Mach. Learn. Res. 2011, 12, 2825–2830. [Google Scholar]
- Araveeporn, A. The Higher-Order of Adaptive Lasso and Elastic Net Methods for Classification on High Dimensional Data. Mathematics 2021, 9, 1091. [Google Scholar] [CrossRef]
- Ghosh, P.; Azam, S.; Jonkman, M.; Karim, A.; Shamrat, F.J.M.; Ignatious, E.; Shultana, S.; Beeravolu, A.R.; De Boer, F. Efficient Prediction of Cardiovascular Disease Using Machine Learning Algorithms With Relief and LASSO Feature Selection Techniques. IEEE Access 2021, 9, 19304–19326. [Google Scholar] [CrossRef]
- Si, Y.; Kretsch, A.M.; Daigh, L.M.; Burk, M.J.; Mitchell, D.A. Cell-Free Biosynthesis to Evaluate Lasso Peptide Formation and Enzyme–Substrate Tolerance. J. Am. Chem. Soc. 2021, 143, 5917–5927. [Google Scholar] [CrossRef]
- Yazdi, M.; Golilarz, N.A.; Nedjati, A.; Adesina, K.A. An improved lasso regression model for evaluating the efficiency of intervention actions in a system reliability analysis. Neural Comput. Appl. 2021, 33, 7913–7928. [Google Scholar] [CrossRef]
- Connelly, L. Logistic regression. Medsurg Nurs. 2020, 29, 353–354. [Google Scholar]
- Nusinovici, S.; Tham, Y.C.; Yan, M.Y.C.; Ting, D.S.W.; Li, J.; Sabanayagam, C.; Wong, T.Y.; Cheng, C.Y. Logistic regression was as good as machine learning for predicting major chronic diseases. J. Clin. Epidemiol. 2020, 122, 56–69. [Google Scholar] [CrossRef]
- Chiappini, F.A.; Allegrini, F.; Goicoechea, H.C.; Olivieri, A.C. Sensitivity for Multivariate Calibration Based on Multilayer Perceptron Artificial Neural Networks. Anal. Chem. 2020, 92, 12265–12272. [Google Scholar] [CrossRef] [PubMed]
- Wang, H.; Moayedi, H.; Foong, L.K. Genetic algorithm hybridized with multilayer perceptron to have an economical slope stability design. Eng. Comput. 2020, 37, 3067–3078. [Google Scholar] [CrossRef]
- Wang, Y.; Li, Y.; Song, Y.; Rong, X. The influence of the activation function in a convolution neural network model of facial expression recognition. Appl. Sci. 2020, 10, 1897. [Google Scholar] [CrossRef]
- Ecer, F.; Ardabili, S.; Band, S.S.; Mosavi, A. Training multilayer perceptron with genetic algorithms and particle swarm optimization for modeling stock price index prediction. Entropy 2020, 22, 1239. [Google Scholar] [CrossRef]
- Chen, J.C.; Wang, Y.M. Comparing activation functions in modeling shoreline variation using multilayer perceptron neural network. Water 2020, 12, 1281. [Google Scholar] [CrossRef]
- Šegota, S.B.; Andelić, N.; Mrzljak, V.; Lorencin, I.; Kuric, I.; Car, Z. Utilization of multilayer perceptron for determining the inverse kinematics of an industrial robotic manipulator. Int. J. Adv. Robot. Syst. 2021, 18, 1729881420925283. [Google Scholar] [CrossRef]
- Bansal, N.; Defo, M.; Lacasse, M.A. Application of Support Vector Regression to the Prediction of the Long-Term Impacts of Climate Change on the Moisture Performance of Wood Frame and Massive Timber Walls. Buildings 2021, 11, 188. [Google Scholar] [CrossRef]
- Guo, X.; Zhou, W.; Shi, B.; Wang, X.; Du, A.; Ding, Y.; Tang, J.; Guo, F. An efficient multiple kernel support vector regression model for assessing dry weight of hemodialysis patients. Curr. Bioinform. 2021, 16, 284–293. [Google Scholar]
- Liantoni, F.; Agusti, A. Forecasting Bitcoin using Double Exponential Smoothing Method Based on Mean Absolute Percentage Error. JOIV Int. J. Informatics Vis. 2020, 4, 91–95. [Google Scholar] [CrossRef]
- Qiao, W.; Moayedi, H.; Foong, L.K. Nature-inspired hybrid techniques of IWO, DA, ES, GA, and ICA, validated through a k-fold validation process predicting monthly natural gas consumption. Energy Build. 2020, 217, 110023. [Google Scholar] [CrossRef]
- Lorencin, I.; Andelić, N.; Mrzljak, V.; Car, Z. Genetic algorithm approach to design of multi-layer perceptron for combined cycle power plant electrical power output estimation. Energies 2019, 12, 4352. [Google Scholar] [CrossRef]
- Marcot, B.G.; Hanea, A.M. What is an optimal value of k in k-fold cross-validation in discrete Bayesian network analysis? Comput. Stat. 2020, 36, 2009–2031. [Google Scholar] [CrossRef]


| Paper | Goal | Results | Drawbacks |
|---|---|---|---|
| [13] | Epidemiology curve metrics, globally | globally | Early in pandemic, low amount of data. |
| [14] | Epidemiology curve metrics, 10-day prediction | Early in pandemic, low amount of data. | |
| [15] | Incidence rates, USA | Getis-Ord Gi* (p < 0.05) | Only USA is explored. |
| [16] | Spread and influence modeling | ∼95% variance explained | Only focuses on LR and SVM method variants. |
| [17] | ROC | Prediction of increase | Only focussed on the sub-Saharan Africa region. |
| Country | Starting Date | Number of Data Points |
|---|---|---|
| Germany | 27 December 2020 | 564 |
| India | 16 January 2021 | 544 |
| United Kingdom | 10 January 2021 | 550 |
| United States | 13 December 2020 | 578 |
| Hyperparameter Name | Possible Values | Count |
|---|---|---|
| Fit Intercept | True, False | 2 |
| Normalize | True, False | 2 |
| Positive | True, False | 2 |
| Hyperparameter Name | Possible Values | Count |
|---|---|---|
| Regularization Parameter | 0.1, 0.3, 0.5, 0.7, 1.0 | 5 |
| Normalization | True, False | 2 |
| Fit Intercept | True, False | 2 |
| Positive | True, False | 2 |
| Hyperparameter Name | Possible Values | Count |
|---|---|---|
| Fit Intercept | True, False | 2 |
| Normalize | True, False | 2 |
| Positive | True, False | 2 |
| C | 0.1, 0.3, 0.5, 0.7, 1.0 | 5 |
| Solver | newton-cg, LBFGS, Liblinear, SAG, SAGA | 5 |
| Hyperparameter Name | Possible Values | Count |
|---|---|---|
| Hidden Layer Sizes | (50,
50, 50, 50), (50, 50, 50), (50, 50), (50), (25, 25, 25, 25), (25, 25, 25), (25, 25), (25), (10, 10, 10, 10), (10, 10, 10), (10, 10), (10), (5, 5, 5, 5), (5, 5, 5), (5, 5), (5), (50, 25, 10, 5), (25, 10, 5), (50, 25, 10), (25, 10) | 20 |
| Activation function | ReLU, Identity, Logistic, tanh | 4 |
| Solver | Adam, LBFGS | 2 |
| Learning Rate Type | Constant, Adaptive, Inversely Scaling | 3 |
| Initial Learning Rate | 0.1, 0.01, 0.5, 0.00001 | 4 |
| L2 Regularization Parameter | 0.01, 0.1, 0.001, 0.0001 | 4 |
| Hyperparameter Name | Possible Values | Count |
|---|---|---|
| Kernel | Linear, Poly, RBF, Sigmoid, Precomputed | 5 |
| Gamma | Scale, Auto | 2 |
| Degree | 1, 2, 3, 4, 5 | 5 |
| C | 0.1, 0.3, 0.5, 0.7, 1.0 | 5 |
| coef0 | 0.0, 0.1, 0.2, 0.3, 0.4, 0.5 | 6 |
| Goal | Method | MAPE | Hyperparameters | |
|---|---|---|---|---|
| VC | LR | 0.007894757 | 0.000182385 | ’fit_intercept’: True, ’normalize’: True, ’positive’: False |
| VD | LR | 0.272645679 | 0.030292848 | ’fit_intercept’: True, ’normalize’: False, ’positive’: False |
| FVC | LR | 0.022135412 | 0.002929293 | ’fit_intercept’: True, ’normalize’: True, ’positive’: False |
| FVD | LR | 0.238485828 | 0.020128384 | ’fit_intercept’: True, ’normalize’: True, ’positive’: False |
| BC | MLP | 0.054622943 | 0.018534421 | ’activation’: ’identity’, ’L2 Regularization’: 0.001, ’hidden_layer_sizes’: (25, 25, 25), ’learning_rate’: ’adaptive’, ’learning_rate_init’: 0.01, ’solver’: ’lbfgs’ |
| BD | LR | 0.239913949 | 0.027688232 | ’fit_intercept’: True, ’normalize’: False, ’positive’: False |
| Goal | Method | MAPE | Hyperparameters | |
|---|---|---|---|---|
| VC | LR | 0.019928482 | 0.017283747 | ’fit_intercept’: True, ’normalize’: True, ’positive’: True |
| VD | MLP | 0.448848236 | 0.517283746 | ’activation’: ’logistic’, ’L2 Regularization’: 0.001, ’hidden_layer_sizes’: (50, 50, 50, 50), ’learning_rate’: ’constant’, ’learning_rate_init’: 0.01, ’solver’: ’adam’ |
| FVC | LR | 0.021928348 | 0.017274727 | ’fit_intercept’: True, ’normalize’: False, ’positive’: True |
| FVD | MLP | 0.392838295 | 0.450293876 | ’activation’: ’logistic’, ’L2 Regularization’: 0.0001, ’hidden_layer_sizes’: 25, ’learning_rate’: ’adaptive’, ’learning_rate_init’: 0.5, ’solver’: ’adam’ |
| BC | LR | 0.202194939 | 0.090513952 | ’fit_intercept’: True, ’normalize’: False, ’positive’: True |
| BD | LR | 0.244092882 | 0.078351545 | ’fit_intercept’: True, ’normalize’: True, ’positive’: False |
| Goal | Method | MAPE | Hyperparameters | |
|---|---|---|---|---|
| VC | LR | 0.099382736 | 0.019283747 | ’fit_intercept’: False, ’normalize’: False, ’positive’: False |
| VD | MLP | 0.449293021 | 0.041937453 | ’activation’: ’logistic’, ’L2 Regularization’: 0.001, ’hidden_layer_sizes’: 25, ’learning_rate’: ’invscaling’, ’learning_rate_init’: 0.5, ’solver’: ’adam’ |
| FVC | MLP | 0.138294921 | 0.009283746 | ’activation’: ’tanh’, ’L2 Regularization’: 0.01, ’hidden_layer_sizes’: (25, 10), ’learning_rate’: ’invscaling’, ’learning_rate_init’: 0.5, ’solver’: ’lbfgs’ |
| FVD | MLP | 0.364042302 | 0.033928144 | ’activation’: ’tanh’, ’L2 Regularization’: 0.0001, ’hidden_layer_sizes’: 10, ’learning_rate’: ’invscaling’, ’learning_rate_init’: 0.5, ’solver’: ’adam’ |
| BC | MLP | 0.168827331 | 0.065944293 | ’activation’: ’identity’, ’L2 Regularization’: 0.0001, ’hidden_layer_sizes’: (10, 10), ’learning_rate’: ’adaptive’, ’learning_rate_init’: 0.01, ’solver’: ’adam’ |
| BD | MLP | 0.380012828 | 0.060623841 | ’activation’: ’logistic’, ’L2 Regularization’: 0.01, ’hidden_layer_sizes’: (25, 10, 5), ’learning_rate’: ’invscaling’, ’learning_rate_init’: 0.1, ’solver’: ’adam’ |
| Goal | Method | MAPE | Hyperparameters | |
|---|---|---|---|---|
| VC | LR | 0.089727374 | 0.012938482 | ’fit_intercept’:True, ’normalize’: False, ’positive’: False |
| VD | MLP | 0.391827932 | 0.039283742 | ’activation’: ’relu’, ’L2 Regularization’: 0.01, ’hidden_layer_sizes’: (10, 10, 10, 10), ’learning_rate’: ’invscaling’, ’learning_rate_init’: 0.01, ’solver’: ’adam’ |
| FVC | LR | 0.059982834 | 0.005674237 | ’fit_intercept’: True, ’normalize’: True, ’positive’: False |
| FVD | MLP | 0.446372182 | 0.059283875 | ’activation’: ’logistic’, ’L2 Regularization’: 0.0001, ’hidden_layer_sizes’: (25, 25, 25, 25), ’learning_rate’: ’adaptive’, ’learning_rate_init’: 0.5, ’solver’: ’adam’ |
| BC | MLP | 0.213498520 | 0.031304591 | ’activation’: ’tanh’, ’L2 Regularization’: 0.1, ’hidden_layer_sizes’: (50, 50), ’learning_rate’: ’adaptive’, ’learning_rate_init’: 0.1, ’solver’: ’lbfgs’ |
| BD | MLP | 0.314889279 | 0.028250913 | ’activation’: ’tanh’, ’L2 Regularization’: 0.01, ’hidden_layer_sizes’: (25, 25, 25), ’learning_rate’: ’invscaling’, ’learning_rate_init’: 0.5, ’solver’: ’adam’ |
Publisher’s Note: MDPI stays neutral with regard to jurisdictional claims in published maps and institutional affiliations. |
© 2022 by the authors. Licensee MDPI, Basel, Switzerland. This article is an open access article distributed under the terms and conditions of the Creative Commons Attribution (CC BY) license (https://creativecommons.org/licenses/by/4.0/).
Share and Cite
Baressi Šegota, S.; Lorencin, I.; Anđelić, N.; Musulin, J.; Štifanić, D.; Glučina, M.; Vlahinić, S.; Car, Z. Applying Regressive Machine Learning Techniques in Determination of COVID-19 Vaccinated Patients’ Influence on the Number of Confirmed and Deceased Patients. Mathematics 2022, 10, 2925. https://doi.org/10.3390/math10162925
Baressi Šegota S, Lorencin I, Anđelić N, Musulin J, Štifanić D, Glučina M, Vlahinić S, Car Z. Applying Regressive Machine Learning Techniques in Determination of COVID-19 Vaccinated Patients’ Influence on the Number of Confirmed and Deceased Patients. Mathematics. 2022; 10(16):2925. https://doi.org/10.3390/math10162925
Chicago/Turabian StyleBaressi Šegota, Sandi, Ivan Lorencin, Nikola Anđelić, Jelena Musulin, Daniel Štifanić, Matko Glučina, Saša Vlahinić, and Zlatan Car. 2022. "Applying Regressive Machine Learning Techniques in Determination of COVID-19 Vaccinated Patients’ Influence on the Number of Confirmed and Deceased Patients" Mathematics 10, no. 16: 2925. https://doi.org/10.3390/math10162925