Article

Gd3+ Doped CoFe2O4 Nanoparticles for Targeted Drug Delivery and Magnetic Resonance Imaging

1
Polymer Research Lab, School of Chemical and Materials Engineering (SCME), National University of Science and Technology (NUST), Islamabad 44000, Pakistan
2
Department of Pharmacy, Quaid-i-Azam University (QAU), Islamabad 45320, Pakistan
3
Department of Cardiology, King Edward Medical University, Lahore 54000, Pakistan
4
Islamabad Diagnostic Center, Islamabad 44000, Pakistan
5
Institute of Analytical Sciences-UMR 5280 CNRS, Claude Bernard University Lyon 1, 69622 Villeurbanne, France
6
The Laboratory of Automatic Control, Chemical and Pharmaceutical Engineering-UMR 5007 CNRS, Claude Bernard University Lyon 1, 69622 Lyon, France
*
Author to whom correspondence should be addressed.
Magnetochemistry 2021, 7(4), 47; https://doi.org/10.3390/magnetochemistry7040047
Submission received: 23 February 2021 / Revised: 24 March 2021 / Accepted: 26 March 2021 / Published: 30 March 2021
(This article belongs to the Special Issue Biomedical Application of Magnetic Nanoparticles in 2022)

Abstract

:
Nanoparticles of CoGdxFe2 − xO4 (x = 0%, 25%, 50%) synthesized via sol–gel auto combustion technique and encapsulated within a polymer (Eudragit E100) shell containing curcumin by single emulsion solvent evaporation technique were formulated in this study. Testing of synthesized nanoparticles was carried out by using different characterization techniques, to investigate composition, crystallinity, size, morphology, surface charge, functional groups and magnetic properties of the samples. The increased hydrophilicity resulted in sustained drug release of 90.6% and 95% for E1(CoGd0.25Fe1.75O4) and E2(CoGd0.50Fe1.5O4), respectively, over a time span of 24 h. The relaxivities of the best-chosen samples were measured by using a 3T magnetic resonance imaging (MRI) machine, and a high r2/r1 ratio of 43.64 and 23.34 for composition E1(CoGd0.25Fe1.75O4) and E2(CoGd0.50Fe1.5O4) suggests their ability to work as a better T2 contrast agent. Thus, these novel synthesized nanostructures cannot only enable MRI diagnosis but also targeted drug delivery.

1. Introduction

Inorganic nanoparticles (NPs) are widely examined for targeted drug delivery (TDD), early stage treatment and diagnosis of major diseases, such as cancer, for instance, for the past 20 years [1,2]. For time efficient and effective treatments, theranostic nanomaterials have been extensively used for clinical purposes. Such materials combine the functionalities of both diagnosis imaging and therapy into one single nanoscale entity [3,4]. Among these nano materials, the utilization of protein-based and polymer-coated magnetic nanoparticles (MNPs) [5,6] in biomedical applications, such as TDD, magnetic hyperthermia [7], magnetic separation [8], targeted imaging in vivo [9,10], magneto-control of subcellular signaling pathways [11], tracking of stem cells [12], magneto-responsive therapy [13] and magnetic resonance imaging (MRI) contrast agents (CAs), have attained serious consideration [14]. The long-term aim of diagnosing diseases is the advancement of imaging techniques having adequate sensitivity and specificity. Therefore, theranostic nanomaterials providing therapy and generating imaging signals when subjected under external stimuli are particularly of great demand [15]. Among all the imaging techniques used in biomedical field for diagnosis and molecular imaging purposes, MRI is the most powerful and versatile diagnostic tool because of its fundamental advantages, such as high spatial resolution, non-invasiveness, excellent soft tissue contrast and safety [16]. In most of the clinical applications, MRI CAs are used for enhancing contrast which in result boosts sensitivity and image quality for more accurate diagnosis.
MRI CAs are generally classified into two categories: paramagnetic metal ions based T1 CAs and superparamagnetic iron oxide (SPIONS) based T2 CAs. High spin paramagnetic metal ions or their complexes containing gadolinium (Gd3+) ions having unpaired electrons in their outer orbits give rise to magnetic dipoles when subjected under external magnetic field, due to a (700 times) larger magnetic moment of electron, as compared to that of a proton. These paramagnetic metal ions generate large fluctuating magnetic fields, resulting in the enhancement of proton relaxation if this fluctuation frequency has components close to the Larmor frequency. Such CAs are responsible of providing positive contrast in the case of T1 weighted MR image, while SPIONS based MR agents shorten the transverse (T2) relaxation time and show negative contrast on T2 weighted images [17]. The Food and Drug Administration (FDA) permitted the utilization of Gd3+ based contrast agents (GBCAs) for clinical purposes for about 30 years. However, later it was found that GBCAs contain harmful side effects, including impaired kidney function, fibrosis of skin, joints and internal organs caused due to leached free Gd3+ ions [18]. Moreover, GBCAs get excreted through the body via urine, thus hindering their use in high-resolution imaging application, which demands a long scan time [19]. Moreover, it has been confirmed that repeated exposure of GBCAs under MRI results in the accumulation of Gd3+ ions in human brain [20] and bones [21] and stay in the organs for years. Moreover, the capability for Gd3+ dechelation elevated the concerns over the safety of GBCAs. Consequently, in February 2018, the UK government suspended the licenses of Omniscan and Magnevist, two main commercial GBCAs, until further investigation [22]. Thus, there is a considerable need for new clinically applicable MRI CAs meeting the standards of traditional GBCAs.
In the need for the development of new contrast agents for MRI applications, SPIONS have been extensively explored. Nevertheless, CoFe2O4 NPs remain comparatively uninvestigated as MRI CAs, regardless of their outstanding performance in biomedical applications, including hyperthermia and drug delivery. Only a few reports are available describing the potential of CoFe2O4 NPs as potential T2 CAs. Ghasemian et al. submitted the development of CoZnFe2O4 MNPs coated with Dimercaptosuccinic acid (DMSA) to be appropriate for T2 contrast enhancement with relaxivity ratio of 50 at 1.5T [23]. Nidhin et al. also published CoFe2O4 NPs as suitable T2 CAs with r2/r1 ratio of 69 [24]. Piché et al. performed MRI phantom test on DMSA coated CoFe2O4 NPs and reported r2/r1 ratio of 65 at 9.4 T [25]. Wu et al. used multi-walled carbon nanotubes (MWCNT)/CoFe2O4 hybrids as effective theranostic agents for MRI and TDD with r2/r1 ratio of almost 28 [26].
In the present study, the synthesis, encapsulation and employment of novel Gd3+ doped CoFe2O4 MNPs for targeted drug delivery and MRI is reported. A simple sol–gel auto-combustion technique was used for preparing CoFe2O4 MNPs. Curcumin (anti-cancer drug) and CoGdxFe(2−x)O4 NPs were then encapsulated within a polymer shell, by oil-in-water (O/W) single emulsion, using solvent evaporation technique.

2. Results and Discussion

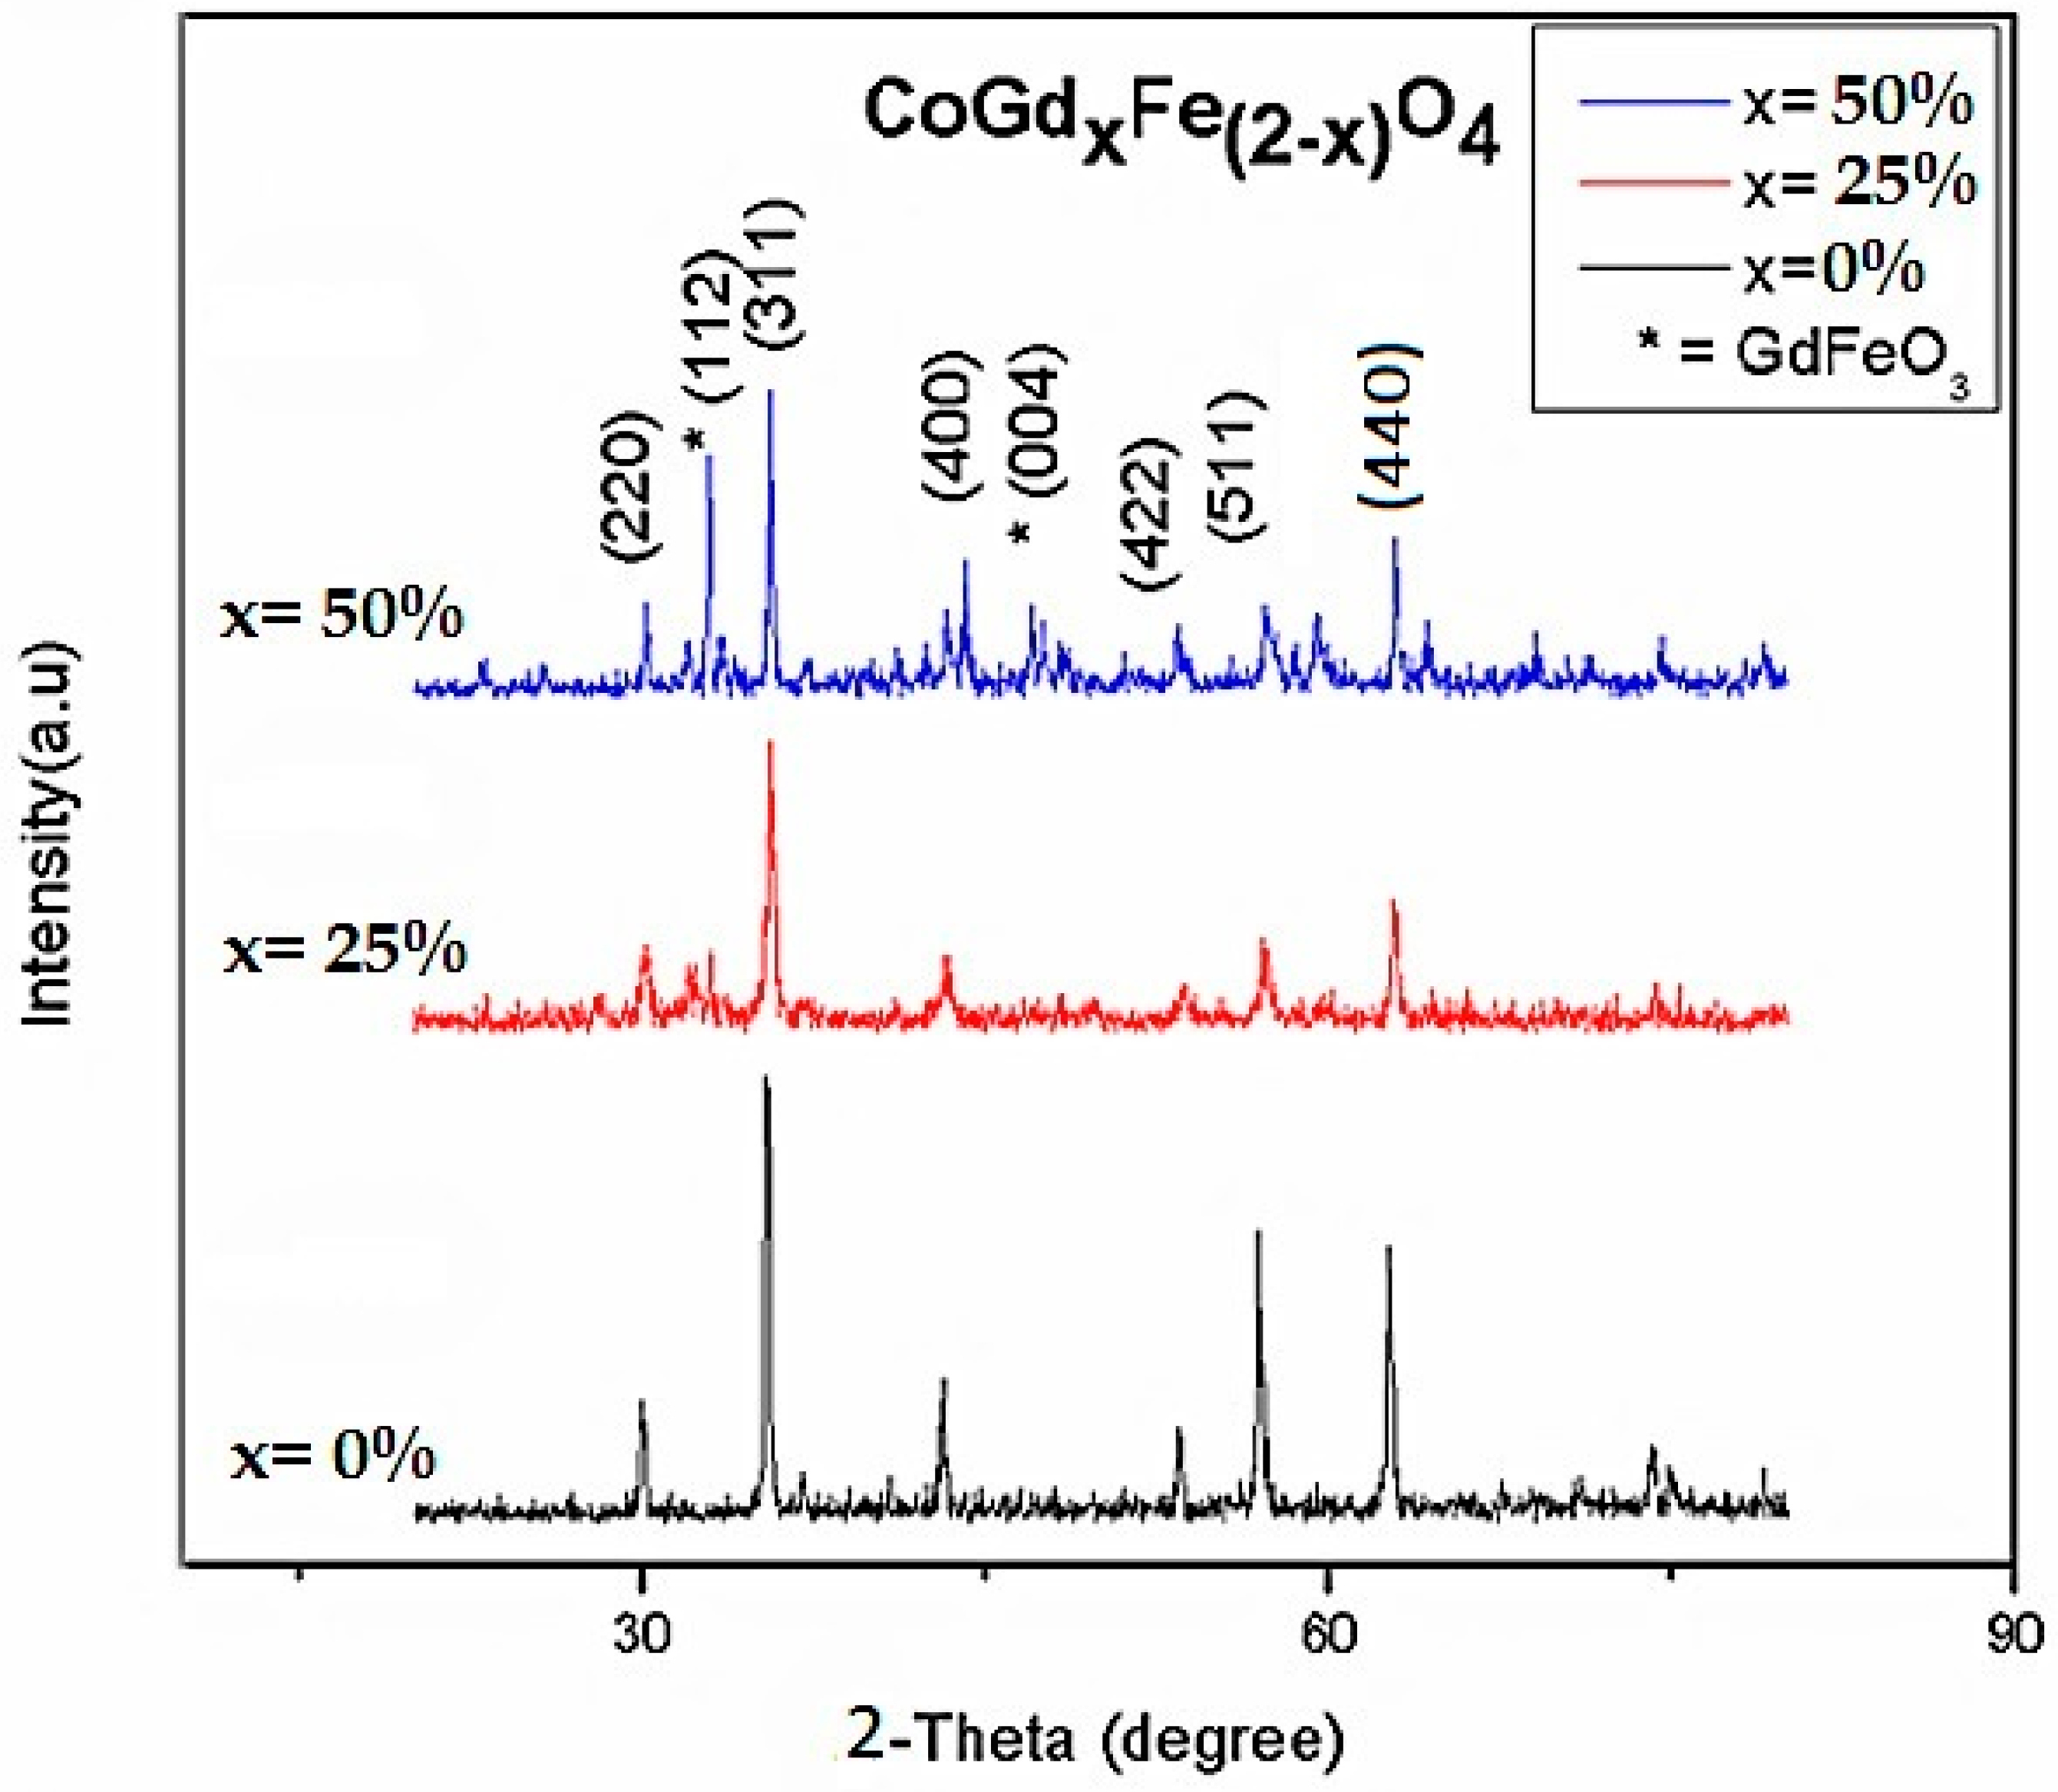
2.1. X-ray Diffraction (XRD)

The XRD patterns of synthesized CoGdxFe(2−x)O4 (x = 0%, 25%, 50%) MNPs calcined at 850 °C for 5 h are presented in the Figure 1. For CoGdxFe(2−x)O4 (x = 0%), the patterns can be indexed to single-phase cubic spinel crystal structure (Fd3m) of CoFe2O4 MNPs (JCPDS card 22-1086) with (220), (311), (400), (422), (511) and (440) diffraction peaks. The lack of any additional or impurity peak in XRD is proof of pure CoFe2O4 MNPs [27]. Moreover, in XRD pattern of CoGdxFe(2−x)O4 (x = 25%, 50%), the presence of secondary phase is visible, which is identified as peaks of GdFeO3, after comparing with JCPDS card 74-1476 data and the literature [28,29]. The crystallite sizes of CoGdxFe(2−x)O4 (x = 0%, 25%, 50%) calculated by using the Scherrer formula were 36.89, 36.90 and 36.92 nm, respectively. The increased peak intensity of secondary phase along with reduced crystallinity is observed with the increment in dopant concentration. The increase in crystallite size with increment in Gd3+ content agrees with the reported data and is due to the ionic radii difference of Gd3+(0.094 nm) and Fe2+ (0.067 nm) [30]. The bigger ionic radii of Gd3+ ions as that of Fe3+ and Co2+ ions result in expansion of the crystal structure, lattice strains and disordered lattice structure. Such improvements impede the growth of grain and therefore raise the lattice parameter [31], whereas the reduction in lattice parameter “a” is observed with the doping of large sized Gd3+ ions [32]. This is because rare-earth (RE) ions prefer to occupy octahedral sites [33]. The decrease of “a” can also be associated with the existence of Fe vacancies in samples [34].

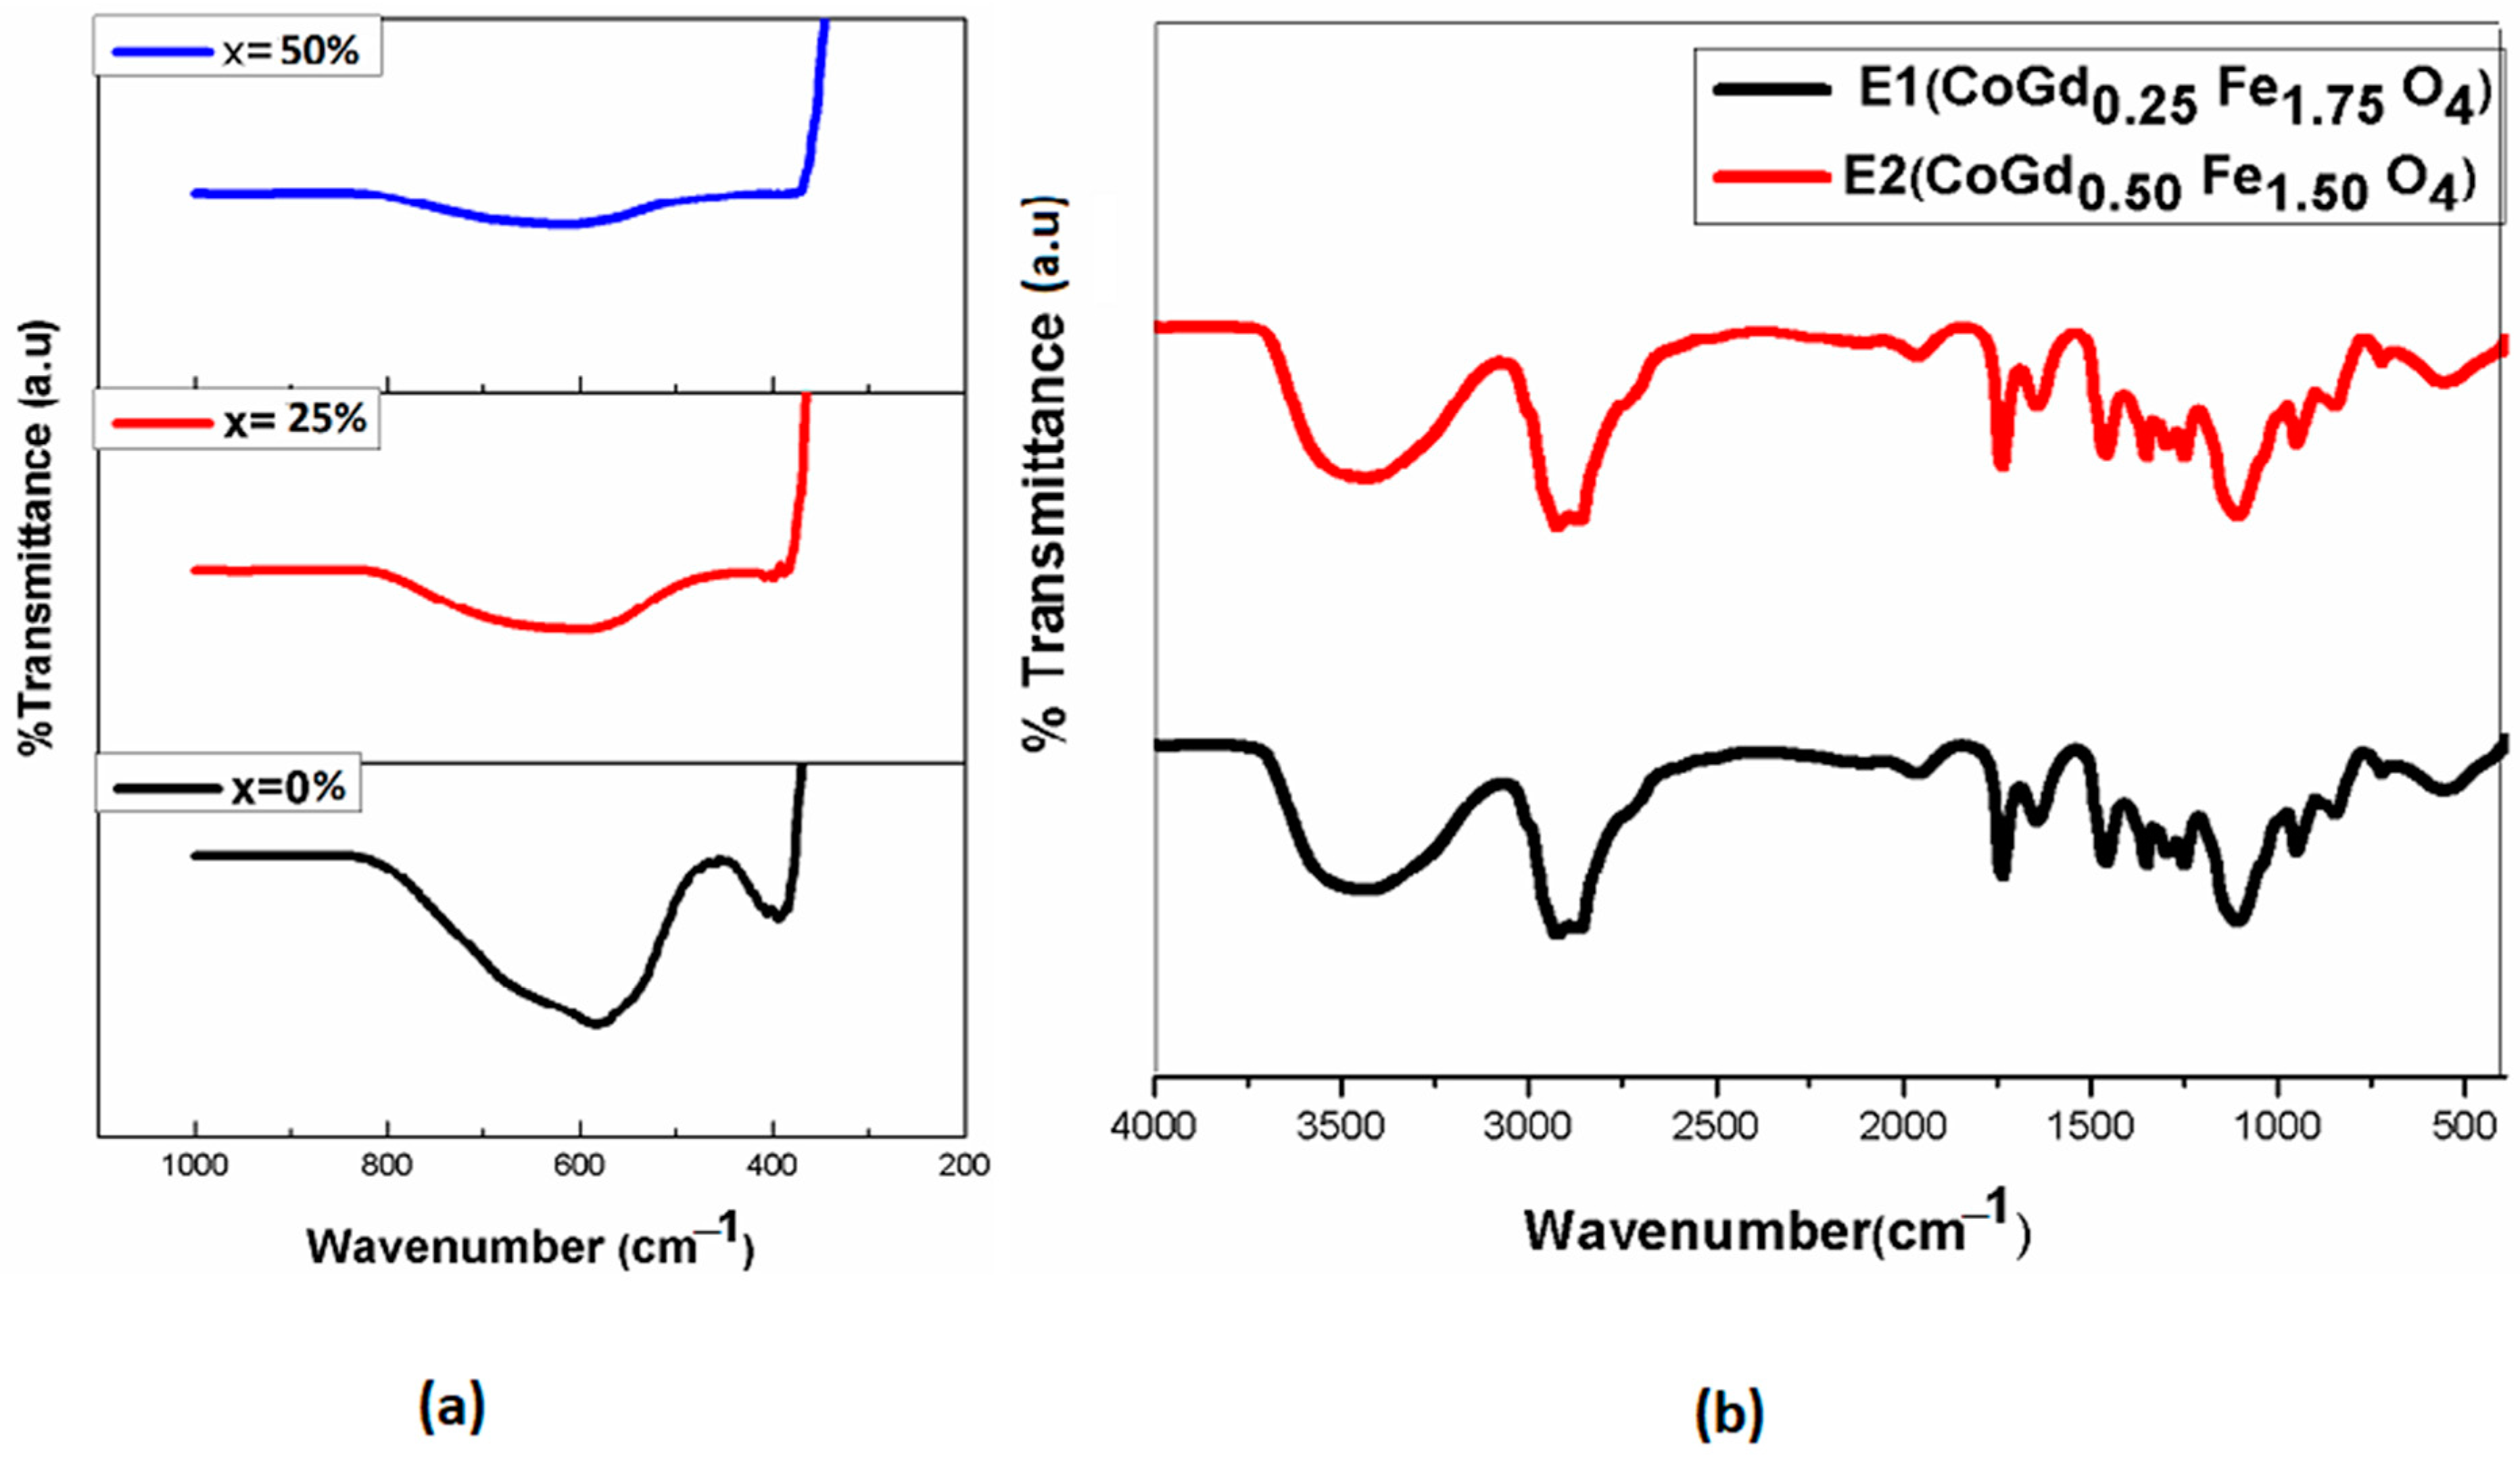
2.2. Functional Group Analysis by FTIR

Figure 2a shows the FTIR spectra of CoGdxFe(2−x)O4 (x = 0%, 25%, 50%) MNPs. The higher-frequency peak (ʋ1) represents the metal–oxygen vibration at the tetrahedral sub-lattice, and the lower-frequency peak (ʋ2) represents the intrinsic vibrations of metal–oxygen bond at the octahedral sites [35]. For CoGdxFe(2−x)O4 (x = 0%), the spectra shows absorption bands position at around 384 and 590 cm−1 for octahedral and tetrahedral sites, respectively. With the doping of Gd3+ ions in CoFe2O4, the positions of ʋ1 and ʋ2 bands shift towards higher frequencies, due to the lattice distortion with the addition of RE ions [27] and increased bond length at octahedral site [36]. Figure 2b shows the FTIR spectra of the best-chosen emulsions E1 and E2. The IR peaks are mostly shifted from their original position due to the specific interactions (most commonly due to hydrogen bonding) between the chemical entities of different components. Changes in the strength of these interactions are expected to cause the change of FTIR peak position and shape of the functional groups [37]. Figure 2b confirms the presence of functional groups of all the components used in emulsion formulation. For example, the peak at 556 cm−1 confirms the presence of CoGdxFe(2−x)O4 MNPs [38,39]. Similarly, the peak around 1110.5 cm−1 represents the functional groups of ether present in the drug, i.e., curcumin, the peaks at 1455.79 and 1733.13 cm−1 represent the CH bending and carbonyl group of polymer Eudragit E100, respectively [37,40]. The peak at 3432.16 cm−1 represents hydroxyl group stretching of curcumin [37], solvent (ethanol) or water used in the formation of organic phase. Hence, the FTIR spectra confirmed the compatibility of all the components used in emulsion formulation and its stability.

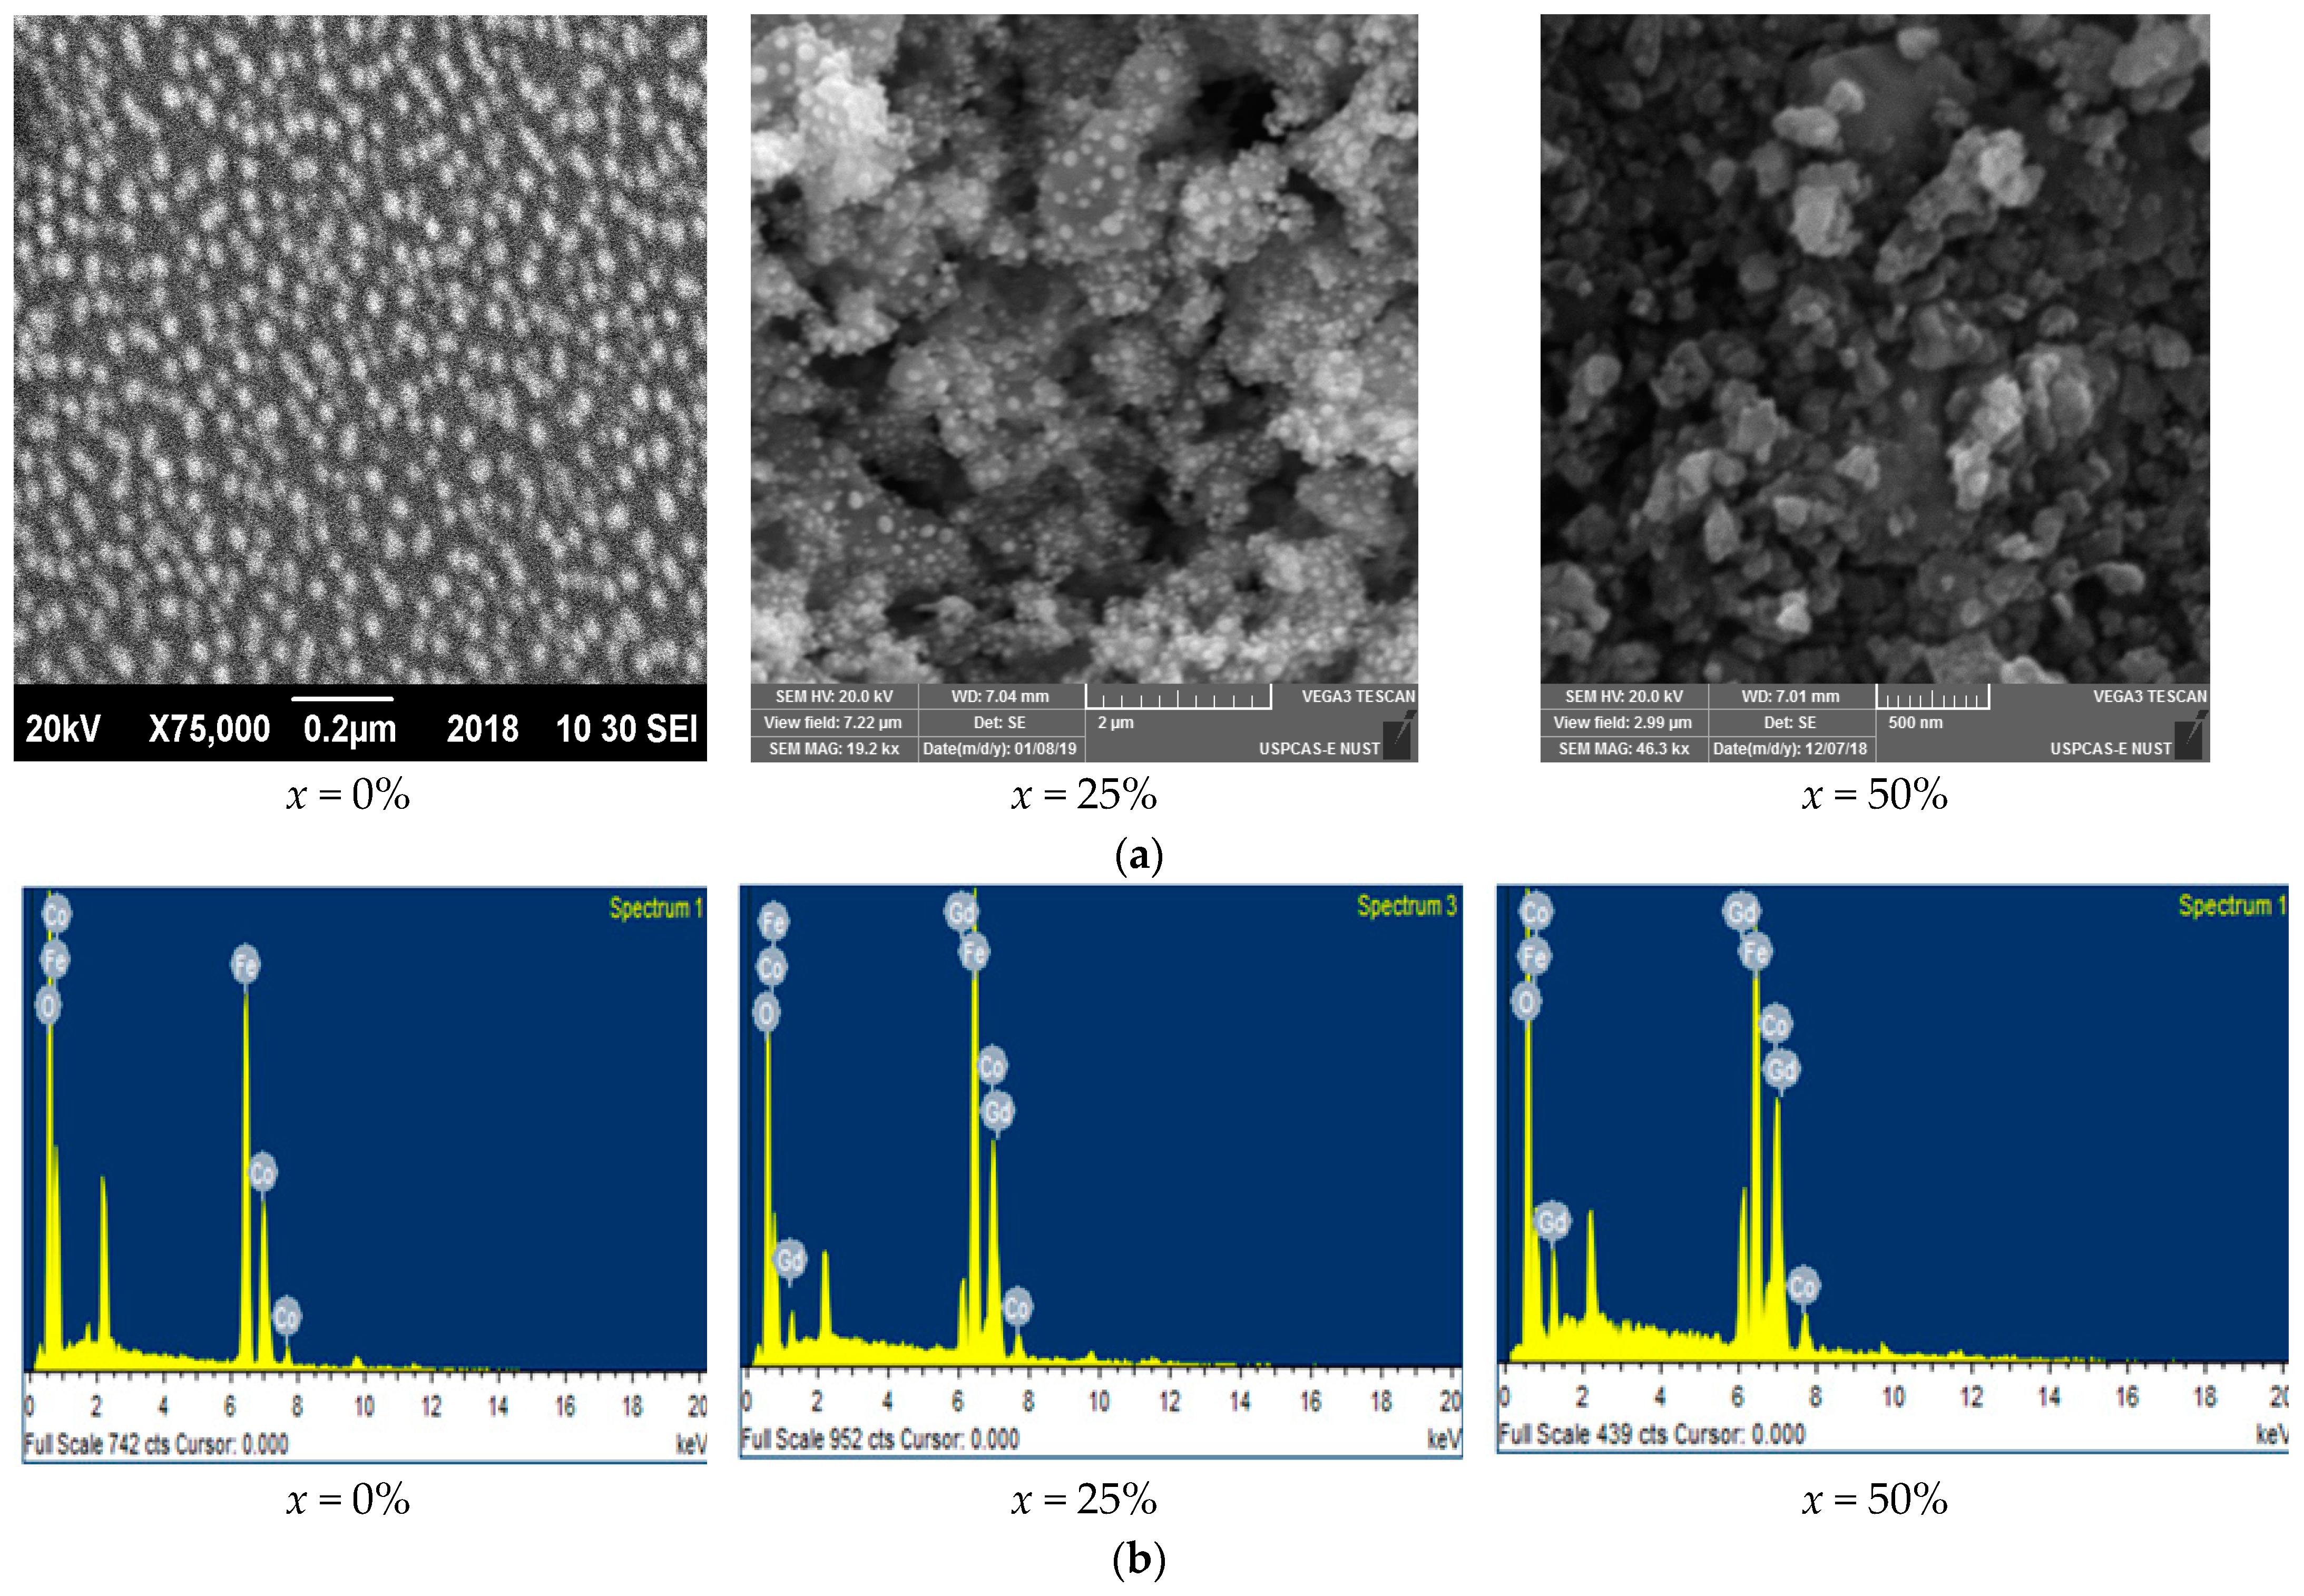
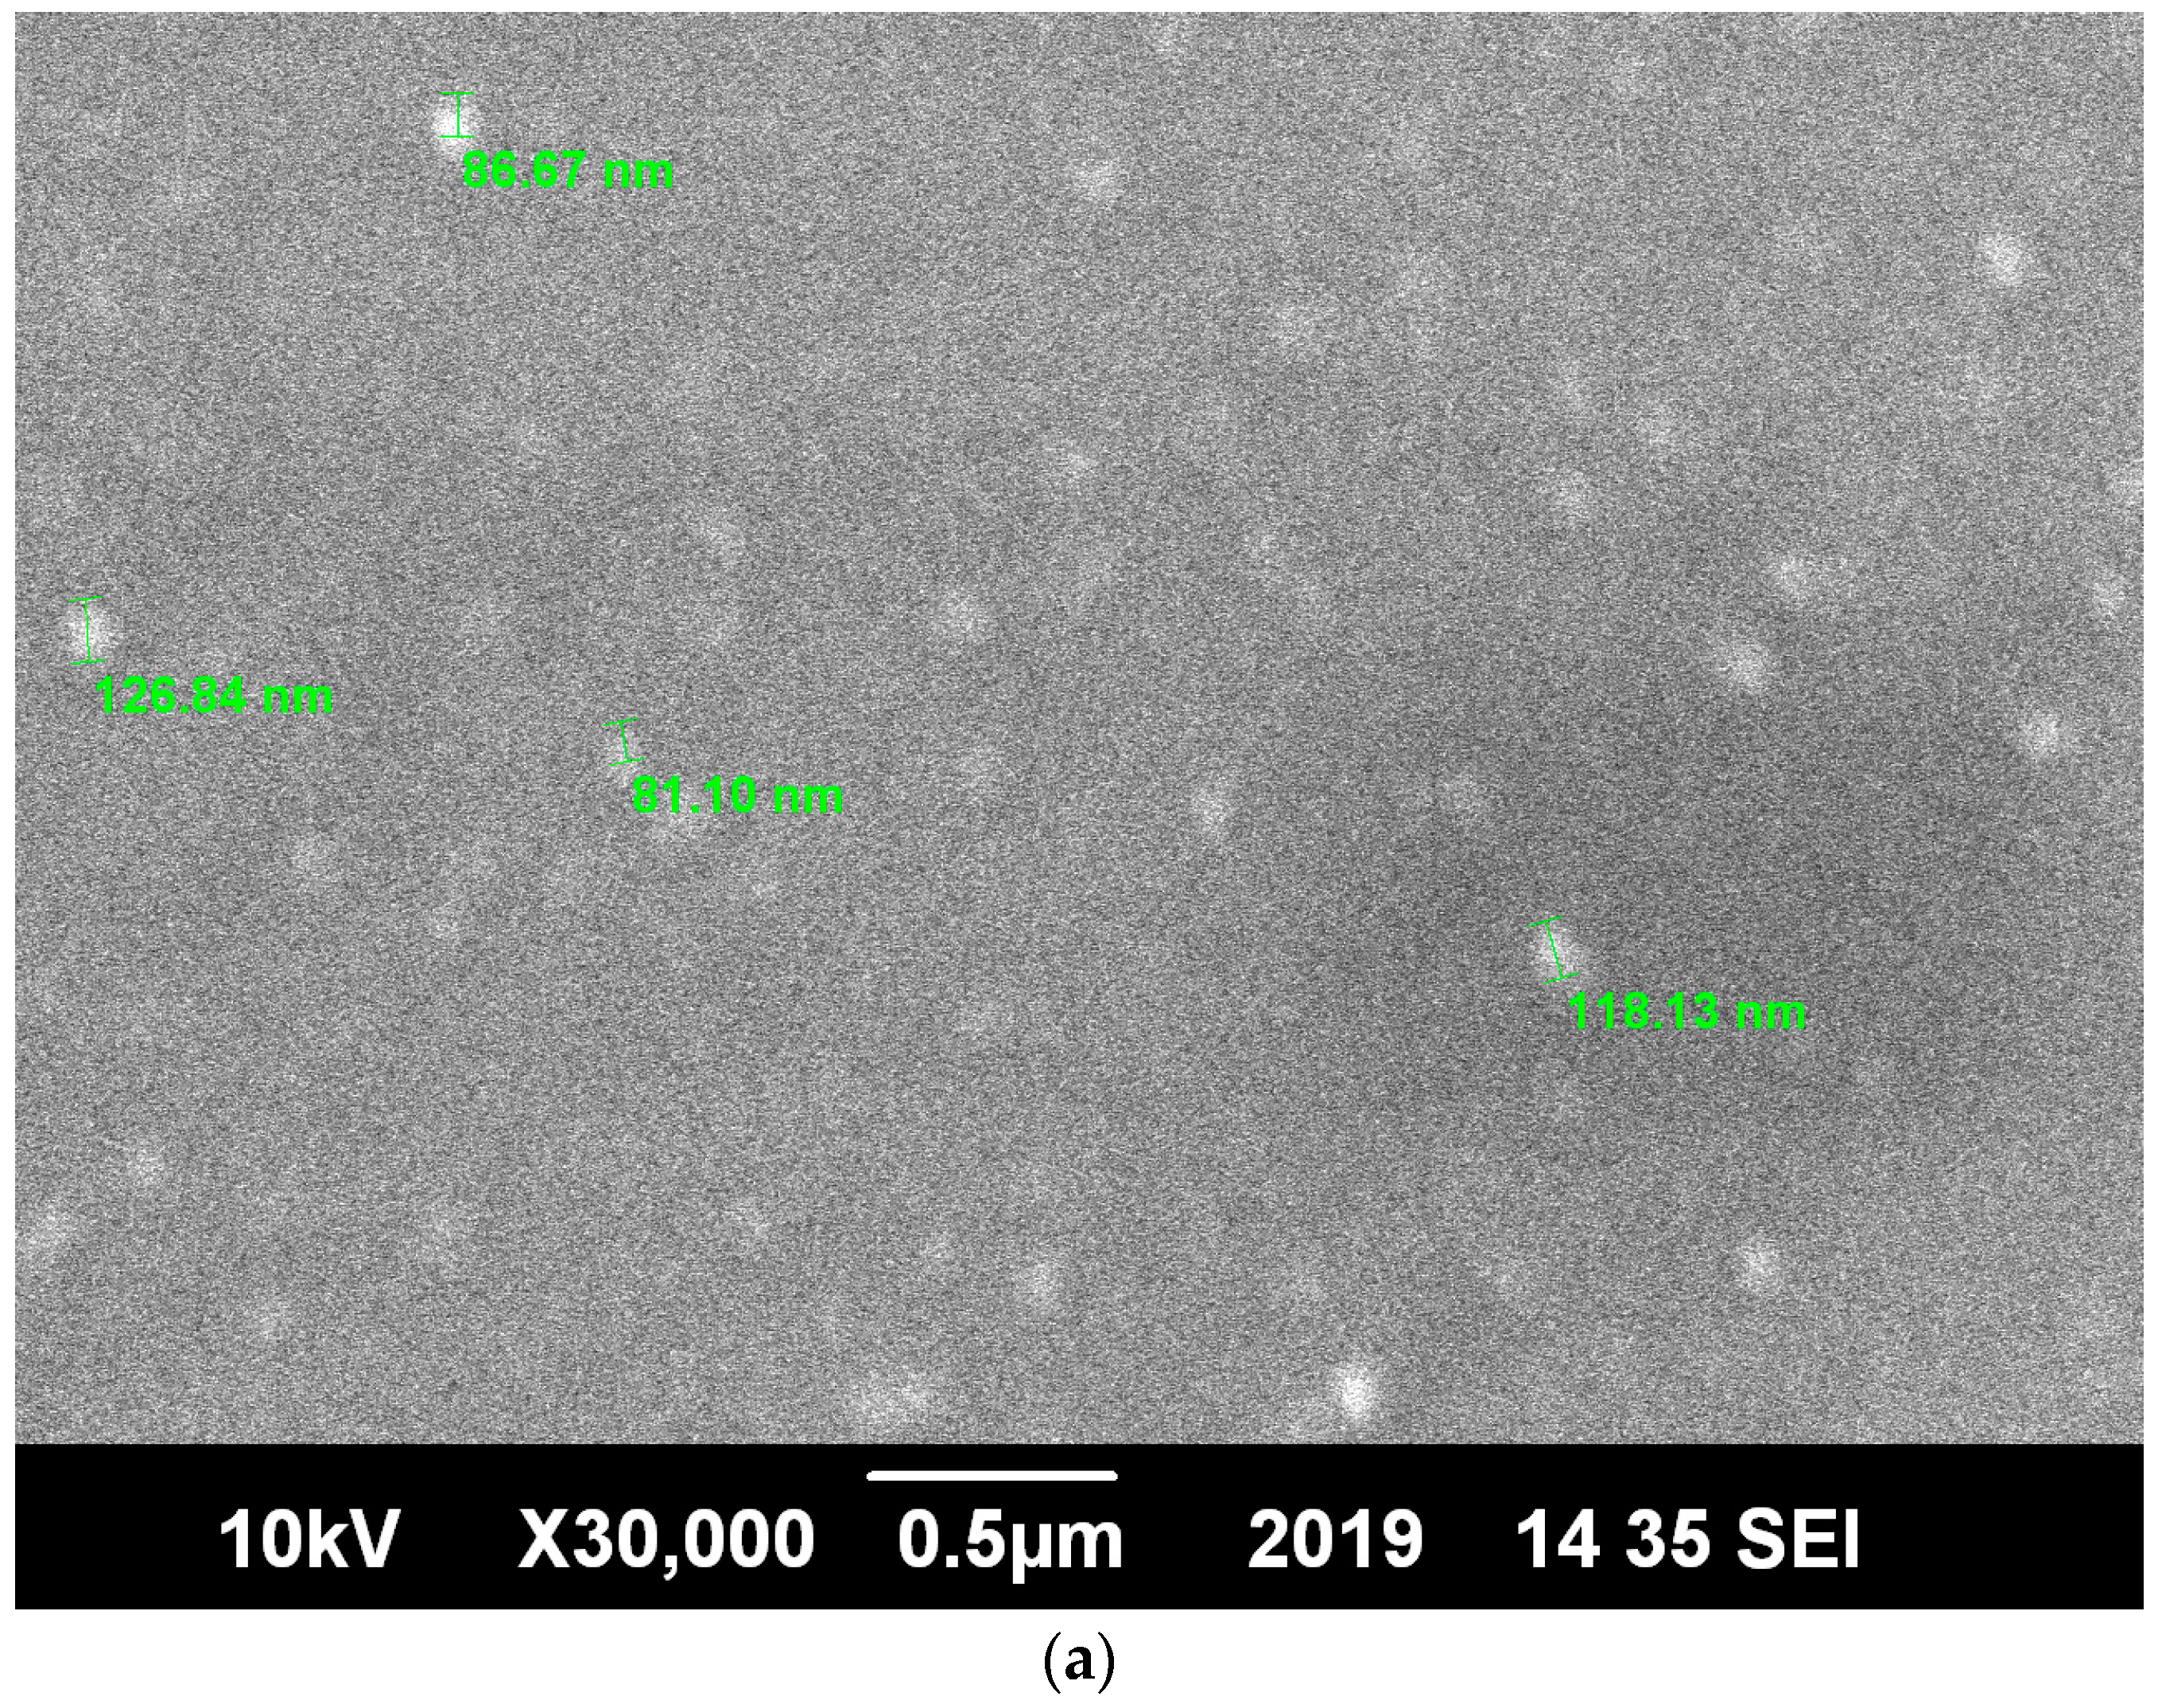
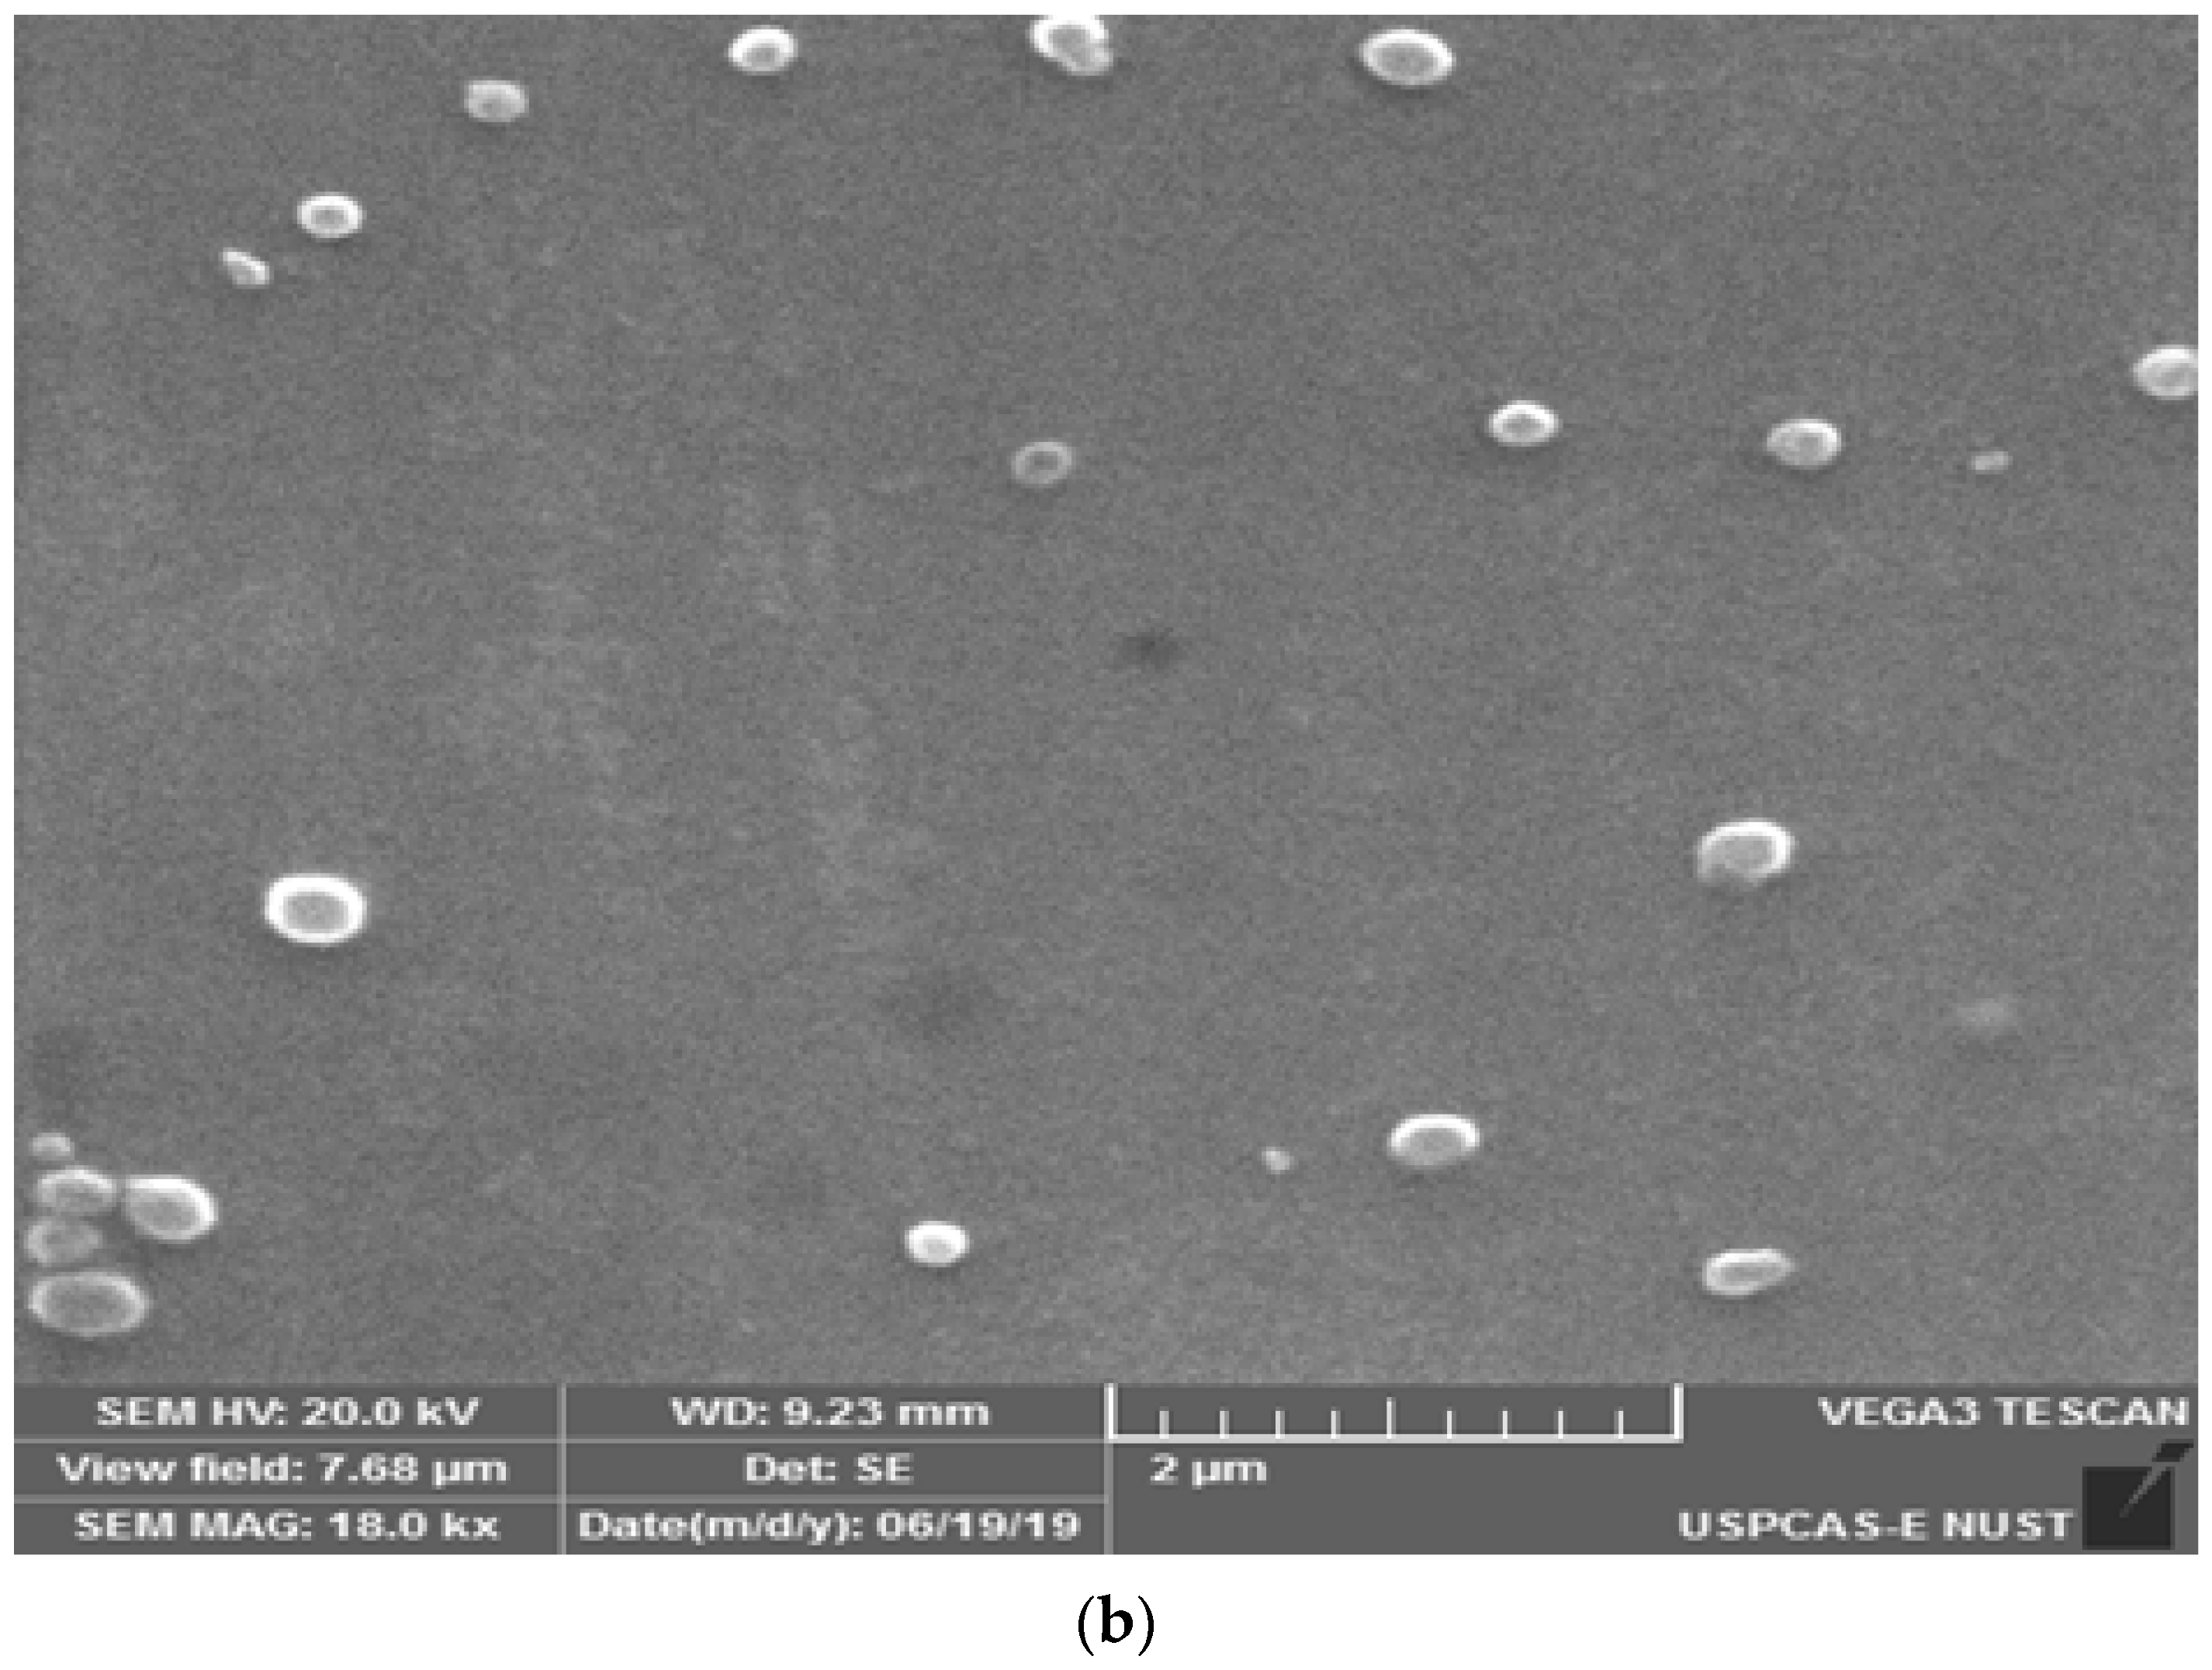
2.3. Particle Size Determination and Morphological Analysis by SEM

SEM images represent the morphology and grain size of the prepared samples. Figure 3a shows the SEM image of diluted CoGdxFe(2−x)O4 (x = 0%) and powdered CoGdxFe(2−x)O4 (x = 25%, 50%) samples. The particle size was found ranging from 22 to 46 nm of the synthesized samples. These SEM images also verify particle size increment with the increase in Gd3+ content which is in accordance to the reported data [30]. This can be explained based on ionic radius of the dopant used. Gd3+ has ionic size of 0.094 nm, which is greater, as compared to that of Fe2+ ions, resulting in increment of particle size [41]. Moreover, the magnetic forces present between the MNPs and high calcination temperature of 850 °C cause their agglomeration [30,42]. Figure 4a,b represents the micrographs of E1 and E2. The average particle size calculated for emulsions E1 and E2 was around 103.5 and 124 nm, respectively. The elemental composition of the synthesized samples was analyzed via EDS. Figure 3b confirms the presence of elements O, Fe, Co and Gd in the prepared samples, while the absence of any traceable impurities confirms the purity of the synthesized MNPs.

2.4. Magnetic Hysteresis Evaluation by Using VSM

Magnetic hysteresis loops of samples CoGdxFe(2−x)O4 (x = 0%, 25%, 50%) calcinated at 850 °C for 5 h are shown in Figure 5. The size, composition and morphology of the synthesized material have a great influence on its magnetic properties [43]. The reduction in saturation magnetization (Ms) and remanent magnetization (Mr) values with the increment in Gd3+ content supports the reported data. The reduction in Ms values can also be assigned to the increasing crystallite size of prepared samples with increasing Gd3+ content. It has been reported that the surface of ultrafine MNPs and spins are canted on their surfaces due to lack of balanced exchange interactions [44]. Hence, the surface of synthesized MNPs seems to have nonmagnetic layer. Moreover, the magnetic moments of RE ions can be seen only at very low temperature (less than 40 K) [45]. The arrival of RE ions thus appears to be replacing magnetic Fe3+ ions by non-magnetic RE ions at octahedral locations [46], resulting in a decrease of Ms values. The values of Ms, Mr and coercivity (Hc) are listed in Table 1.

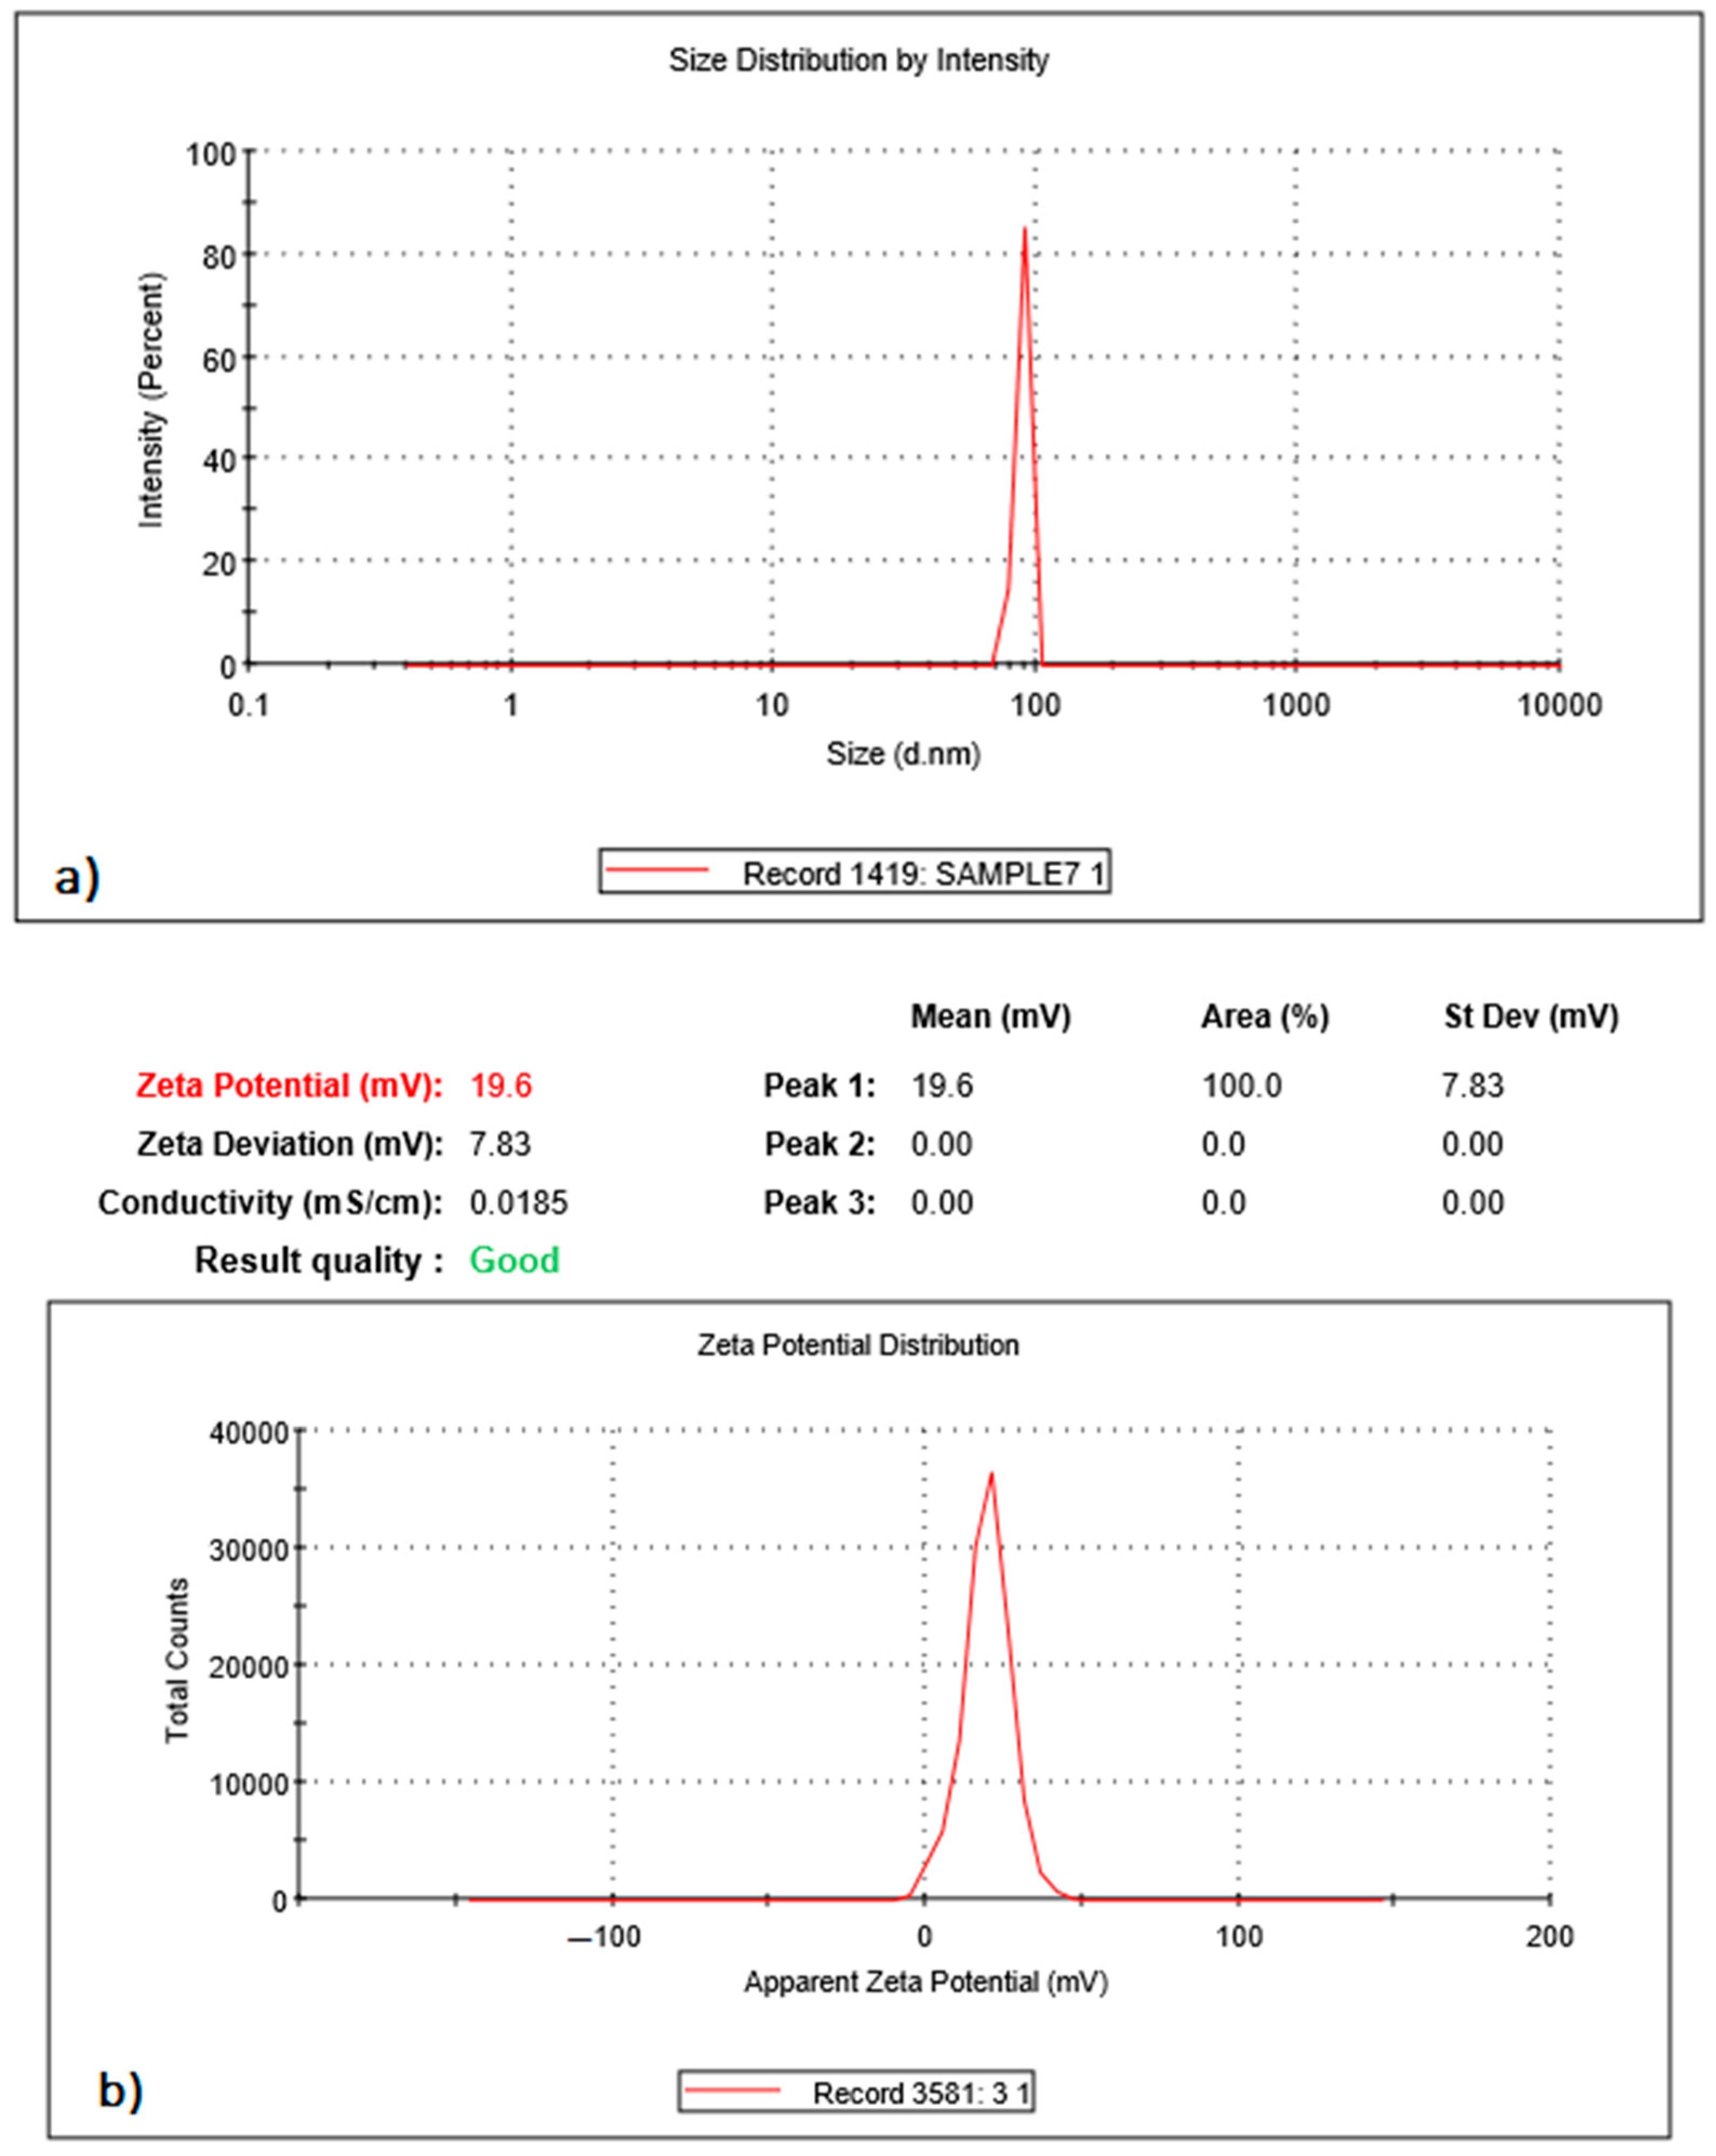
2.5. Hydrodynamic Size and Zeta Potential

The hydrodynamic size and zeta potential of the synthesized samples CoGdxFe(2−x)O4 (x = 0%, 25%, 50%) analyzed by Malvern Zetasizer were 89.4, 97.2 and 105 nm and +15, −18.8 and −12 mV, respectively. The sharp peaks shown in the Figure 6 confirm the presence of NPs of almost same size range. The average size of 103.9 nm and 125.9 nm and zeta potential of +19.6 ± 7.83 mV and +31.8 ± 6.36 mV was calculated for E1 and E2, respectively. The increased size confirms the successful drug loading and covering of polymer shell over the synthesized MNPs. This result supports the grain size obtained by SEM analysis of these emulsions. The positive charge on the emulsions is attributed to the cationic nature of the polymer used, i.e., Eudragit E100. The suspensions of formulations containing zeta potential values between +30 and −30 mV are believed to be stable. Zeta potential either positive or negative in surface loading than +30 and −30 mV is more prone to inhibit agglomeration in electrostatic stabilization emulsion [47]. The polydispersity index (PDI) of 0.397 and 0.456 for E1 and E2 confirms the stability of the emulsion. The PDI values less than 0.5 correspond to the polydispersity of uniformly dispersed samples. Meanwhile, PDI values greater than 0.7 indicate the presence of NPs having broad size distribution and are not suitable to be analyzed by using the dynamic light-scattering method [48,49,50].

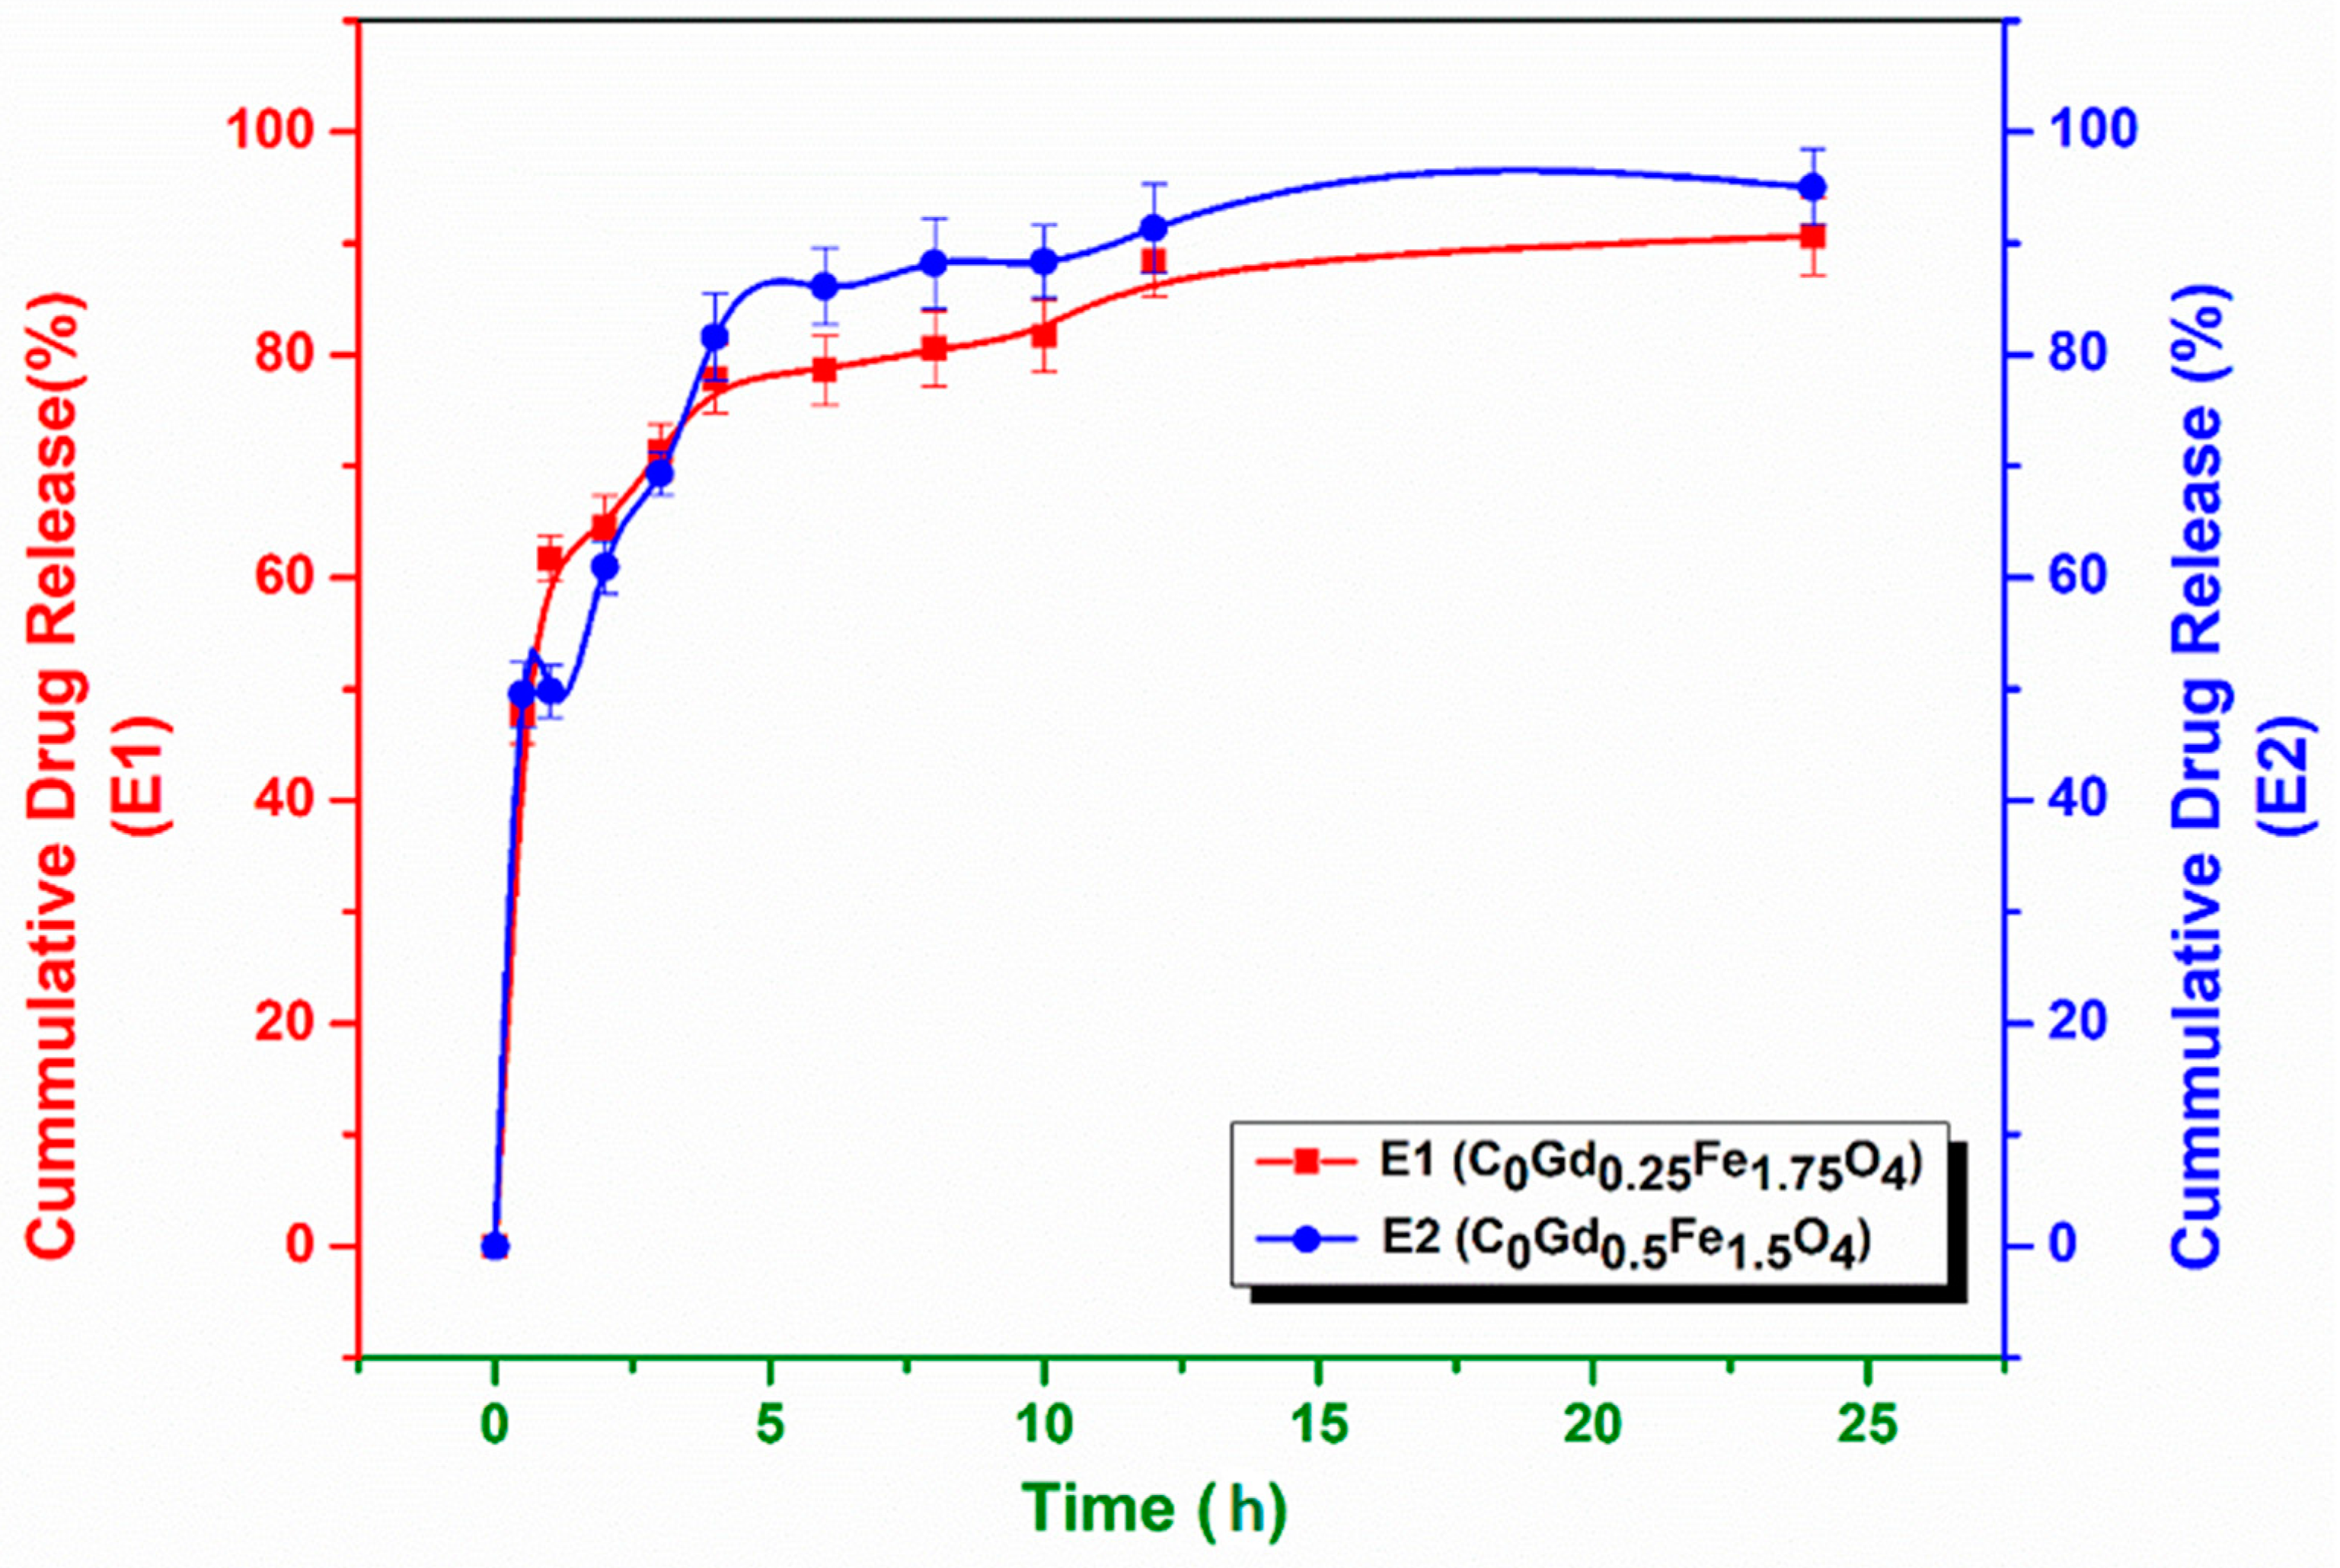
2.6. In Vitro Drug Release Study

2.6.1. Drug Release and Encapsulation Efficiency

A graphical representation of the drug-release study of the two best chosen emulsions is displayed in Figure 7. An instant and persistent release of 88.44% and 91.32% drug was observed in the first 12 h, which was then followed by a decelerate release of leftover drug over the next 12 h, with the total of 90.6% and 95.0% drug release over 24 h by E1 and E2, respectively. The rapid release of bursts can be attributed to the release of the drug at or nearby the surface of MNPs, due to its hydrophilic nature [51]. Diffusion of the drug inside the MNPs core in the dissolution media could lead to exponential delayed release [52]. The reason observed for the increased drug release in the case of E2 is its hydrophilicity. It was observed during this research that the hydrophilicity of E2 increased with the increased Gd+3 content, which, as a result proved to release more drug as compared to E1, having less Gd+3 content. The encapsulation-efficiency percentages of 87.7% and 74.52%, along with the loading-capacity percentages of 5.84% and 4.62% measured using Equations (1) and (2) for emulsion E1 and E2, respectively, are in accordance with the reported literature [53].

2.6.2. Application of Kinetic Models

Korsmeyer–Peppas Model

After confirmation from Higuchi model that drug release follows diffusive mechanism, Korsmeyer–Peppas model was applied for finding out the type of dissolution. It is achieved by calculating its exponent value “n” [54]. This value should be less than 0.5 and, in our case, it came out to be 0.186 and 0.263 for E1 and E2, respectively. The R2 values for this model are 0.9955 and 0.991 for E1 and E2, respectively, which are very close to 1. The predicted data are very close to those obtained experimentally which confirmed that the drug diffusion of the prepared formulations followed Korsemeyer–Peppas model.

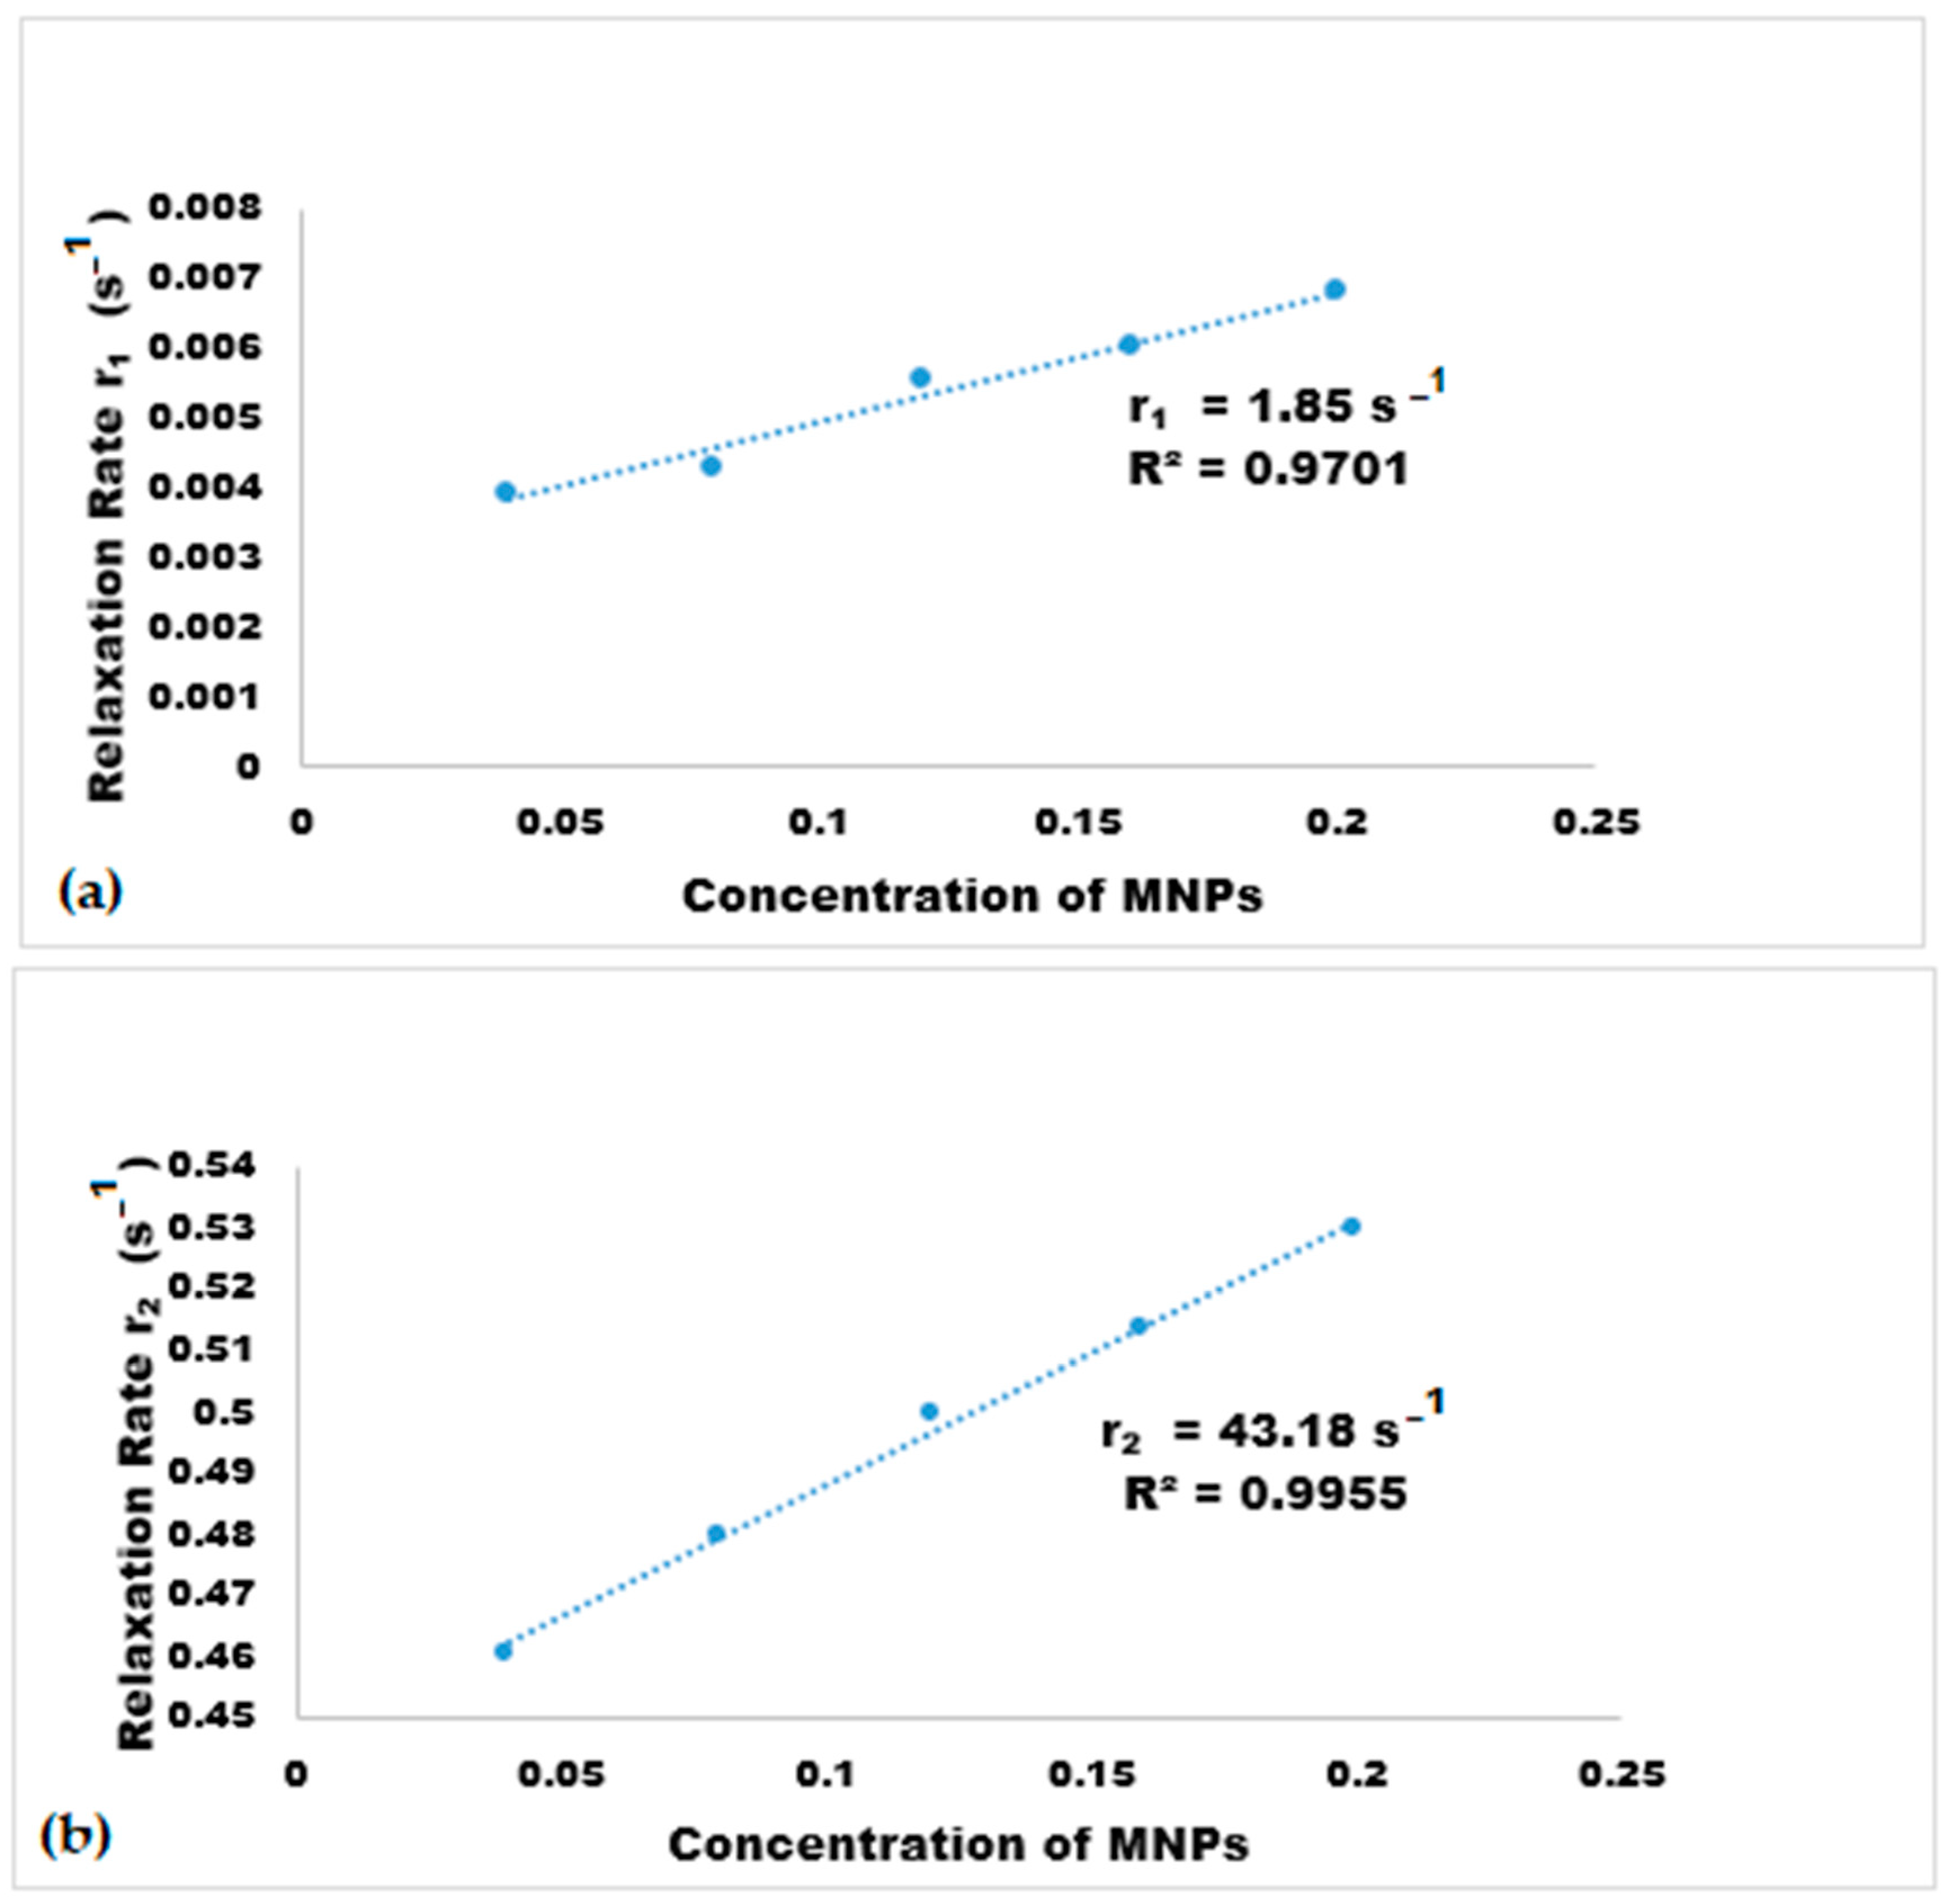
2.7. Magnetic Resonance Imaging (MRI)

The inverse relaxation times (1/T1 = r1, 1/T2 = r2) of the compositions E1 and E2 are shown in Figure 8 and Figure 9 respectively. For E1 the values of r1 and r2 are found to be 1.64 and 71.57 s−1, with a relaxivity ratio of 43.64. Whereas for E2 values of r1 and r2 are found to be 1.85 and 43.18 s−1, with a relativity ratio of 23.34. For the estimation of the utility of CAs in relaxation r1 or r2, the soothing ratio is a significant parameter: The more calming the agent is, the more efficient the agent can contrast T2 [25]. The relaxivity ratio higher than 10 generally suggests a good T2 imaging ability of CAs, while a relaxivity ratio less than 5 indicates the capability for T1 imaging [26,55,56]. The MRI contrast enhancement relies upon the particle size, magnetic properties, surface composition and charge of the material. Ms value is one of the most important factor that affect the relaxation of T2. [57]. Jun et al. indicated that Ms values depend upon the size and composition of MNPs [58]. Metal NPs, including Fe, Ni and Co, have higher Ms values than those for oxide NP. In accordance with the reasons explained above, both compositions confirmed their suitability to be used as T2 contrast agents. However, E1 displayed an r2/r1 ratio twice that of E2, which is because E1 has a high Ms value of 47.81 emu/g, as compared to 29.719 emu/g of E2. One of the reasons for higher r2 and relaxivity ratio can be the hydrophilicity factor. It was observed, during the synthesis, that the solubility of CoGdxFe(2−x)O4 in the solvent enhanced with the increment in the Gd3+ content in the sample. Moreover, E2 composition has higher value of positive charge and bigger size, as compared to E1, leading to low r2 and relaxivity ratio. Hydrophilicity plays an important role because this can affect the relaxivity to allow proximity of more water molecules to induce short spin–lattice relaxation time. The degree of hydration is strongly influenced by the nature of hydrophilic or hydrophobic coatings on MNPs and, thus, their capability of MRI [59].

3. Materials and Methods

3.1. Materials

Iron nitrate (Fe(NO3)3.9H2O), Cobalt nitrate (Co(NO3).6H2O), Gadolinium nitrate (Gd(NO3)3.6H2O), Citric acid (C6H8O7⋅H2O), Ammonia solution 32% (NH3.H2O), Tween 80, Curcumin, and hydrochloric acid 37% (HCl) were purchased from Sigma Aldrich while Eudragit E100 was purchased from Evonik industries, Germany.

3.2. Synthesis of CoGdxFe(2 − x)O4 (x = 0%, 25%, 50%) Magnetic Nanoparticles

A nominal composition of Gd3+ doped cobalt ferrites with general formula CoGdxFe(2−x)O4 where x = 0%, 25% and 50% were synthesized by using sol–gel auto-combustion technique. The aqueous solutions of metal nitrate salts, i.e., Fe(NO3)3.9H2O, Gd(NO3)3.6H2O and Co(NO3)2.6H2O and citric acid, were prepared, separately, by dissolving their stoichiometric quantities in deionized water. Then a 1:1.5 molar ratio of metal nitrates to citric acid was taken, and the solutions were then mixed.
After stirring magnetically for 1 h, the solution was neutralized by dropwise addition of aqueous ammonia and heated at 100 °C until the formation of gel. The gel then converted automatically into fluffy powder form upon self-ignition. This prepared powder was dried further, in oven, at 100 °C, for a few hours, for complete removal of moisture. Which was then ground by using mortar and pestle to get fine powder and calcined at 850 °C in a muffle furnace for 5 h.

3.3. Emulsion Formulation

Solvent evaporation technique was used to formulate O/W emulsions. Firstly, the organic phase was prepared by taking fixed amount of polymer, drug and MNPs in specific quantity of solvent in separate glass vials and sonicated in ultrasonication water bath for 10 min. These three solutions were then combined in one vial and again sonicated for 10 min. For aqueous phase, fixed amount of Tween® 80 was dissolved in deionized water, by stirring magnetically for about 30 min. Then, the organic phase was poured, dropwise, into aqueous phase in ultrasonication water bath, for 30 min, to form a uniform solution. At the end, the prepared emulsion was heated at 30 °C, for 15 min, in Rota vapor, to remove solvent from it. The emulsion obtained at the end was stored and further used for different characterizations.
For getting a uniform and stable emulsion, different parameters, such as concentration of polymer, drug, MNPs and volume of aqueous phase, were altered. For this purpose, Design Expert software was used, which generated a list of different formulations. From that list, the one formulation showing the best stability for over three months for both compositions, i.e., CoGd0.25Fe1.75O4 and CoGd0.50Fe1.5O4, was chosen for further characterizations and named as E1 and E2, respectively.

3.4. Characterizations

The structural analysis of all the samples were performed, using STOE Powder X-Ray diffractometer θ-θ between 2θ values ranging from 20° to 80°, at room temperature, using Cu Kα (λ = 1.5406 Å) radiation. The patterns were evaluated by X’pert Highscore software and plotted, using Origin software. For the investigation and confirmation of required functional groups in the synthesized samples, FTIR transmission spectra were taken, using PerkinElmer, SpectrumTM100 in a range from 300 to 1000 cm−1 for NPs and from 400 to 4000 cm−1 for emulsions. For morphological and elemental analysis, Scanning Electron Microscopy (SEM) and Energy Dispersive Spectroscopy (EDS) were performed, using Vega3 Tescan microscope (Czech Republic) connected with EDS apparatus of Oxford instrument. The diluted and powdered samples were firstly deposited on the glass substrate and dried at room temperature and then coated with gold, under vacuum, by cathodic sputtering. SEM images of the samples were obtained under an accelerating voltage of 15 kV. For investigation of magnetic behavior of MNPS, vibrating sample magnetometry (VSM) was performed, using Lake Shore 7407 calibrated with pure nickel as a calibration sample at room temperature with maximum applied field of 10kOe. The charge and average hydrodynamic size (Dh) of MNPs and emulsions was measured, using Zeta Sizer Nano ZS (Malvern Instruments, UK) by taking highly diluted dispersion of MNPs, by using distilled water as a dispersion medium, at 25 °C.

3.5. In Vitro Drug Release Kinetics

To study in vitro drug release kinetics of the emulsions, 5 mL from each prepared emulsion was taken and placed inside a dialysis membrane which was then dipped in conical flask containing 50 mL phosphate buffer solution (pH 7.4). This conical flask was then placed in a mechanical shaker for 24 h, at 37 ± 0.5 °C temperature, and 1 mL of sample was taken out after fixed time intervals from the buffer solution and replaced with fresh buffer solution, to keep the total volume constant. Ten samples were taken during a time interval of 24 h and analyzed by UV–Vis spectrometer model HALO DB-20 series. Similarly, for the measurement of drug-encapsulation efficiency and loading capacity, emulsions were centrifuged at 4500 rpm for 1.5 h. The supernatant was discarded, and the obtained pellet was centrifuged again for 1.5 h, at 4500 rpm, by adding ethanol. The supernatant was then used for UV–Vis analysis. The drug encapsulation efficiency and loading capacity was calculated by using Equations (1) and (2) [60], respectively, as given below.
E n c a p s u l a t i o n   e f f i c i e n c y   ( % ) = T o t a l   a m o u n t   o f   d r u g s   A m o u n t   o f   f r e e   d r u g T o t a l   a m o u n t   o f   d r u g ×   100
L o a d i n g   c a p a c i t y = T o t a l   a m o u n t   o f   d r u g F r e e   d r u g   i n   s u p e r n a t a n t T o t a l   a m o u n t   o f   d r i e d   n a n o p a r t i c l e s ×   100
Diffusion and dissolution of drug encapsulated within the polymer matrix was monitored and different kinetic models, i.e., Zero Order kinetics, First Order kinetics, Higuchi kinetics and Korsemeyer–Peppas kinetics models, were applied, using a software named “DD Solver 1.0” to analyze drug release [60]. The best fitted model was then selected depending upon the correlation coefficient (R2), which is a statistical measure of closeness of predicted data to experimental ones under the same conditions.

3.6. Magnetic Resonance Imaging (MRI) Analysis

The performance of the synthesized samples as MRI agents was evaluated by using clinical MRI system GE Optima MR450w 3.0T. For this purpose, the samples were prepared at different concentrations by using different TE and TR sequence. For T2 contrast, TR sequence of 5000 ms with varying TE of 14.27, 42.8, 76, 108, 131, 164 ms and for T1, fixed TE value of 10.64 ms with TR of 101 and 685 ms was used. Two glass vials, one containing water and one containing commercial Gd sample, respectively, were used as references for comparing the imaging ability of the formulated emulsions with that of water and Gd. After taking MRI images, a software named “Kpacs” was used for calculating the mean intensities of the samples by using mean Region of Interest (ROI) values of the respective samples and the relativity values of the samples were calculated, as well [61,62].

4. Conclusions

In this research, magnetic polymeric emulsion of Gd3+ doped CoFe2O4 MNPs, using Eudragit E100 (copolymer) and curcumin (anti-cancer drug), was formulated. The Gd3+ doped CoFe2O4 MNPs having single phase cubic structure uniform spherical morphology and enhanced magnetic properties were synthesized by sol–gel auto-combustion method. These MNPs were then encapsulated within a copolymer shell along with the drug curcumin by forming oil-in-water (O/W) emulsion, using solvent evaporation technique. The formulated emulsion showed spherical morphology with a zeta potential of +19.6 ± 7.8 mV and +31.8 ± 6.3 mV, indicating its stability. FTIR analysis confirmed the presence of all the major functional groups of the materials used for their formation. In vitro drug release study performed at pH of 7.4 pursued Korsemeyer–Peppas kinetic model, along with sustained and continuous drug release of 90.3% and 95.0% over a time span of 24 h and encapsulation efficiency of 88% and 76% for E1 and E2, respectively. The contrast enhancement ability of these nanostructures was confirmed by MRI analysis. Moreover, a r2/r1 ratio of 43.64 and 23.34 for E1 and E2, respectively, confirmed its ability to work as a better T2 contrast agent. Such synthesized nanostructures provide a successful route for bio-compatible and selective drug delivery and enhanced MRI, thereby promoting further research into the field.

Author Contributions

F.J. conceptualized, carried out the experimental work and drafted the original manuscript. N.M.A. designed and coordinated this research as a project supervisor. N.A. and M.I.A. assisted in drug release study. M.A.A. helped with the graphics. N.N. and H.S. helped in MRI testing. A.E. (Abdelhamid Errachid), N.L. and A.E. (Abdelhamid Elaissari) assisted in finalizing this manuscript. All authors have read and agreed to the published version of the manuscript.

Funding

This research has not received any external funding.

Data Availability Statement

The experimental data used to support the findings of this study are available for the readers.

Acknowledgments

Assistance from NUST Research Directorate is appreciated. Nasir M. Ahmad acknowledges the support of Higher Education Commission (HEC), NRPU Project Nos. 3526 and 6020.

Conflicts of Interest

The authors declare no conflict of interest.

References

  1. Michalet, X.; Pinaud, F.F.; Bentolila, L.A.; Tsay, J.M.; Doose, S.; Li, J.J.; Sundaresan, G.; Wu, A.M.; Gambhir, S.S.; Weiss, S. Quantum Dots for Live Cells, in Vivo Imaging, and Diagnostics. Science 2005, 307, 538–544. [Google Scholar] [CrossRef] [Green Version]
  2. Zhang, C.; Ni, D.; Liu, Y.; Yao, H.; Bu, W.; Shi, J. Magnesium silicide nanoparticles as a deoxygenation agent for cancer starvation therapy. Nat. Nanotechnol. 2017, 12, 378–386. [Google Scholar] [CrossRef]
  3. Cole, J.T.; Holland, N.B. Multifunctional nanoparticles for use in theranostic applications. Drug Deliv. Transl. Res. 2015, 5, 295–309. [Google Scholar] [CrossRef]
  4. Vega-Chacón, J.; Tarhini, M.; Lebaz, N.; Jafelicci, M.; Zine, N.; Errachid, A.; Elaissari, A. Protein-Silica Hybrid Submicron Particles: Preparation and Characterization. Chem. Afr. 2020, 3, 793–801. [Google Scholar] [CrossRef]
  5. Ranucci, E.; Manfredi, A. Polyamidoamines: Versatile Bioactive Polymers with Potential for Biotechnological Applications. Chem. Afr. 2019, 2, 167–193. [Google Scholar] [CrossRef] [Green Version]
  6. Badri, W.; Tarhini, M.; Lgourna, Z.; Lebaz, N.; Saadaoui, H.; Zine, N.; Errachid, A.; Elaissari, A. Preparation and Characterization of Glued Corn Flakes-Like Protein-Based Magnetic Particles. Chem. Afr. 2020, 3, 803–811. [Google Scholar] [CrossRef]
  7. Lee, J.-H.; Jang, J.; Choi, J.; Moon, S.H.; Noh, S.; Kim, J.; Kim, J.-G.; Kim, I.-S.; Park, K.I.; Cheon, J. Exchange-coupled magnetic nanoparticles for efficient heat induction. Nat. Nanotechnol. 2011, 6, 418–422. [Google Scholar] [CrossRef] [PubMed]
  8. Pan, Y.; Du, X.; Zhao, F.; Xu, B. Magnetic nanoparticles for the manipulation of proteins and cells. Chem. Soc. Rev. 2012, 41, 2912. [Google Scholar] [CrossRef]
  9. Chapman, S.; Dobrovolskaia, M.; Farahani, K.; Goodwin, A.; Joshi, A.; Lee, H.; Meade, T.; Pomper, M.; Ptak, K.; Rao, J.; et al. Nanoparticles for cancer imaging: The good, the bad, and the promise. Nano Today 2013, 8, 454–460. [Google Scholar] [CrossRef] [PubMed] [Green Version]
  10. Tarhini, M.; Vega-Chacón, J.; Jafelicci, M.; Zine, N.; Errachid, A.; Fessi, H.; Elaissari, A. Structured Magnetic Core/Silica Internal Shell Layer and Protein Out Layer Shell (BSA@SiO2@SME): Preparation and Characterization. Chem. Afr. 2020, 3, 127–134. [Google Scholar] [CrossRef] [Green Version]
  11. Cho, M.H.; Lee, E.J.; Son, M.; Lee, J.-H.; Yoo, D.; Kim, J.; Park, S.W.; Shin, J.-S.; Cheon, J. A magnetic switch for the control of cell death signalling in in vitro and in vivo systems. Nat. Mater. 2012, 11, 1038–1043. [Google Scholar] [CrossRef]
  12. Bulte, J.W.M.; Douglas, T.; Witwer, B.; Zhang, S.-C.; Strable, E.; Lewis, B.K.; Zywicke, H.; Miller, B.; van Gelderen, P.; Moskowitz, B.M.; et al. Magnetodendrimers allow endosomal magnetic labeling and in vivo tracking of stem cells. Nat. Biotechnol. 2001, 19, 1141–1147. [Google Scholar] [CrossRef]
  13. Della Rocca, J.; Liu, D.; Lin, W. Nanoscale Metal–Organic Frameworks for Biomedical Imaging and Drug Delivery. Acc. Chem. Res. 2011, 44, 957–968. [Google Scholar] [CrossRef] [PubMed] [Green Version]
  14. Huang, G.; Zhang, K.-L.; Chen, S.; Li, S.-H.; Wang, L.-L.; Wang, L.-P.; Liu, R.; Gao, J.; Yang, H.-H. Manganese-iron layered double hydroxide: A theranostic nanoplatform with pH-responsive MRI contrast enhancement and drug release. J. Mater. Chem. B 2017, 5, 3629–3633. [Google Scholar] [CrossRef]
  15. James, M.L.; Gambhir, S.S. A Molecular Imaging Primer: Modalities, Imaging Agents, and Applications. Physiol. Rev. 2012, 92, 897–965. [Google Scholar] [CrossRef] [Green Version]
  16. Terreno, E.; Castelli, D.D.; Viale, A.; Aime, S. Challenges for Molecular Magnetic Resonance Imaging. Chem. Rev. 2010, 110, 3019–3042. [Google Scholar] [CrossRef] [PubMed]
  17. Niu, D.; Luo, X.; Li, Y.; Liu, X.; Wang, X.; Shi, J. Manganese-Loaded Dual-Mesoporous Silica Spheres for Efficient T1- and T2-Weighted Dual Mode Magnetic Resonance Imaging. ACS Appl. Mater. Interfaces 2013, 5, 9942–9948. [Google Scholar] [CrossRef]
  18. Lu, Y.; Xu, Y.-J.; Zhang, G.-B.; Ling, D.; Wang, M.-Q.; Zhou, Y.; Wu, Y.-D.; Wu, T.; Hackett, M.J.; Hyo Kim, B.; et al. Iron oxide nanoclusters for T 1 magnetic resonance imaging of non-human primates. Nat. Biomed. Eng. 2017, 1, 637–643. [Google Scholar] [CrossRef] [PubMed]
  19. Lee, N.; Hyeon, T. Designed synthesis of uniformly sized iron oxide nanoparticles for efficient magnetic resonance imaging contrast agents. Chem. Soc. Rev. 2012, 41, 2575–2589. [Google Scholar] [CrossRef] [PubMed]
  20. Kanda, T.; Fukusato, T.; Matsuda, M.; Toyoda, K.; Oba, H.; Kotoku, J.; Haruyama, T.; Kitajima, K.; Furui, S. Gadolinium-based Contrast Agent Accumulates in the Brain Even in Subjects without Severe Renal Dysfunction: Evaluation of Autopsy Brain Specimens with Inductively Coupled Plasma Mass Spectroscopy. Radiology 2015, 276, 228–232. [Google Scholar] [CrossRef] [PubMed]
  21. White, G.W.; Gibby, W.A.; Tweedle, M.F. Comparison of Gd(DTPA-BMA) (Omniscan) Versus Gd(HP-DO3A) (ProHance) Relative to Gadolinium Retention in Human Bone Tissue by Inductively Coupled Plasma Mass Spectroscopy. Investig. Radiol. 2006, 41, 272–278. [Google Scholar] [CrossRef] [PubMed] [Green Version]
  22. Gadolinium-Containing Contrast Agents: Removal of Omniscan and iv Magnevist, Restrictions to the Use of Other Linear Agents—GOV.UK. Available online: https://www.gov.uk/drug-safety-update/gadolinium-containing-contrast-agents-removal-of-omniscan-and-iv-magnevist-restrictions-to-the-use-of-other-linear-agents (accessed on 14 December 2017).
  23. Ghasemian, Z.; Shahbazi-Gahrouei, D.; Manouchehri, S. Cobalt Zinc Ferrite Nanoparticles as a Potential Magnetic Resonance Imaging Agent: An In vitro Study. Avicenna J. Med. Biotechnol. 2015, 7, 64–68. [Google Scholar]
  24. Nidhin, M.; Nazeer, S.S.; Jayasree, R.S.; Kiran, M.S.; Nair, B.U.; Sreeram, K.J. Flower shaped assembly of cobalt ferrite nanoparticles: Application as T2 contrast agent in MRI. RSC Adv. 2013, 3, 6906–6912. [Google Scholar] [CrossRef]
  25. Piché, D.; Tavernaro, I.; Fleddermann, J.; Lozano, J.G.; Varambhia, A.; Maguire, M.L.; Koch, M.; Ukai, T.; Hernández Rodríguez, A.J.; Jones, L.; et al. Targeted T1 Magnetic Resonance Imaging Contrast Enhancement with Extraordinarily Small CoFe2O4 Nanoparticles. ACS Appl. Mater. Interfaces 2019, 11, 6724–6740. [Google Scholar] [CrossRef] [Green Version]
  26. Wu, H.; Liu, G.; Wang, X.; Zhang, J.; Chen, Y.; Shi, J.; Yang, H.; Hu, H.; Yang, S. Solvothermal synthesis of cobalt ferrite nanoparticles loaded on multiwalled carbon nanotubes for magnetic resonance imaging and drug delivery. Acta Biomater. 2011, 7, 3496–3504. [Google Scholar] [CrossRef] [PubMed]
  27. Pervaiz, E.; Gul, I.H. Structural, Electrical and Magnetic Studies of Gd 3+ Doped Cobalt Ferrite Nanoparticles. Int. J. Curr. Eng. Technol. 2012, 2, 377–387. [Google Scholar]
  28. The International Centre for Diffraction Data—ICDD. Available online: http://www.icdd.com/ (accessed on 30 May 2019).
  29. Ahmed, M.A.; Ateia, E.; El-Dek, S.I. Rare earth doping effect on the structural and electrical properties of Mg–Ti ferrite. Mater. Lett. 2003, 57, 4256–4266. [Google Scholar] [CrossRef]
  30. Lin, Q.; Lin, J.; He, Y.; Wang, R.; Dong, J. The Structural and Magnetic Properties of Gadolinium Doped CoFe2O4 Nanoferrites. J. Nanomater. 2015, 2015, 1–6. [Google Scholar] [CrossRef] [Green Version]
  31. Ahmed, M.A.; Okasha, N.; El-Sayed, M.M. Enhancement of the physical properties of rare-earth-substituted Mn–Zn ferrites prepared by flash method. Ceram. Int. 2007, 33, 49–58. [Google Scholar] [CrossRef]
  32. Tanbir, K.; Ghosh, M.P.; Singh, R.K.; Kar, M.; Mukherjee, S. Effect of doping different rare earth ions on microstructural, optical, and magnetic properties of nickel–cobalt ferrite nanoparticles. J. Mater. Sci. Mater. Electron. 2020, 31, 435–443. [Google Scholar] [CrossRef]
  33. Gong, Z.; Yang, J.; Zhu, H.; Yan, D.; Liu, C.; Xu, C.; Liu, Y. The synergistically improved afterglow and magnetic resonance imaging induced by Gd 3+ doping in ZGGO:Cr 3+ nanoparticles. Mater. Res. Bull. 2019, 113, 122–132. [Google Scholar] [CrossRef]
  34. Meng, Y.Y.; Liu, Z.W.; Dai, H.C.; Yu, H.Y.; Zeng, D.C.; Shukla, S.; Ramanujan, R.V. Structure and magnetic properties of Mn(Zn)Fe2−xRExO4 ferrite nano-powders synthesized by co-precipitation and refluxing method. Powder Technol. 2012, 229, 270–275. [Google Scholar] [CrossRef]
  35. Manikandan, V.; Vanitha, A.; Ranjith Kumar, E.; Chandrasekaran, J. Effect of sintering temperature on Structural and Dielectric properties of Sn substituted CuFe2O4 Nanoparticles. J. Magn. Magn. Mater. 2017, 423, 250–255. [Google Scholar] [CrossRef]
  36. Nikumbh, A.K.; Pawar, R.A.; Nighot, D.V.; Gugale, G.S.; Sangale, M.D.; Khanvilkar, M.B.; Nagawade, A.V.; Nikumbh, A.K.; Pawar, R.A.; Nighot, D.V.; et al. Structural, electrical, magnetic and dielectric properties of rare-earth substituted cobalt ferrites nanoparticles synthesized by the co-precipitation method. J. Magn. Magn. Mater. 2014, 355, 201–209. [Google Scholar] [CrossRef]
  37. Wegiel, L.A.; Zhao, Y.; Mauer, L.J.; Edgar, K.J.; Taylor, L.S. Curcumin amorphous solid dispersions: The influence of intra and intermolecular bonding on physical stability. Pharm. Dev. Technol. 2014, 19, 976–986. [Google Scholar] [CrossRef] [PubMed]
  38. Sagayaraj, R.; Aravazhi, S.; Selva kumar, C.; Senthil kumar, S.; Chandrasekaran, G. Tuning of ferrites (CoxFe3-xO4) nanoparticles by co-precipitation technique. SN Appl. Sci. 2019, 1, 271. [Google Scholar] [CrossRef] [Green Version]
  39. Amiri, S.; Shokrollahi, H. Magnetic and structural properties of RE doped Co-ferrite (REåNd, Eu, and Gd) nano-particles synthesized by co-precipitation. J. Magn. Magn. Mater. 2013, 345, 18–23. [Google Scholar] [CrossRef]
  40. Li, J.; Lee, I.W.; Shin, G.H.; Chen, X.; Park, H.J. Curcumin-Eudragit® E PO solid dispersion: A simple and potent method to solve the problems of curcumin. Eur. J. Pharm. Biopharm. 2015, 94, 322–332. [Google Scholar] [CrossRef]
  41. Jiang, J.; Yang, Y.-M. Effect of Gd substitution on structural and magnetic properties of Zn–Cu–Cr ferrites prepared by novel rheological technique. Mater. Sci. Technol. 2009, 25, 415–418. [Google Scholar] [CrossRef]
  42. Rahman, M.T.; Vargas, M.; Ramana, C.V. Structural characteristics, electrical conduction and dielectric properties of gadolinium substituted cobalt ferrite. J. Alloys Compd. 2014, 617, 547–562. [Google Scholar] [CrossRef]
  43. Tadic, M.; Kopanja, L.; Panjan, M.; Lazovic, J.; Tadic, B.V.; Stanojevic, B.; Motte, L. Rhombohedron and plate-like hematite (α-Fe2O3) nanoparticles: Synthesis, structure, morphology, magnetic properties and potential biomedical applications for MRI. Mater. Res. Bull. 2021, 133, 111055. [Google Scholar] [CrossRef]
  44. Ahmed, M.A.; Azab, A.A.; El-Khawas, E.H. Structural, magnetic and electrical properties of Bi doped LaFeO3 nano-crystals, synthesized by auto-combustion method. J. Mater. Sci. Mater. Electron. 2015, 26, 8765–8773. [Google Scholar] [CrossRef]
  45. Nellis, W.J.; Legvold, S. Thermal Conductivities and Lorenz Functions of Gadolinium, Terbium, and Holmium Single Crystals. Phys. Rev. 1969, 180, 581–590. [Google Scholar] [CrossRef]
  46. Fu, J.; Zhang, J.; Peng, Y.; Zhao, J.; Tan, G.; Mellors, N.J.; Xie, E.; Han, W. Unique magnetic properties and magnetization reversal process of CoFe2O4 nanotubes fabricated by electrospinning. Nanoscale 2012, 4, 3932. [Google Scholar] [CrossRef]
  47. Ahmed, N.; Michelin-Jamois, M.; Fessi, H.; Elaissari, A. Modified double emulsion process as a new route to prepare submicron biodegradable magnetic/polycaprolactone particles for in vivo theranostics. Soft Matter 2012, 8, 2554. [Google Scholar] [CrossRef]
  48. Tyagi, Y.; Satheesh Madhav, N.V. Smart innovative approach for designing fluvoxamine loaded bio-nanosuspension for the management of depression. Int. J. Appl. Pharm. 2019, 11, 191–197. [Google Scholar] [CrossRef]
  49. Danaei, M.; Dehghankhold, M.; Ataei, S.; Hasanzadeh Davarani, F.; Javanmard, R.; Dokhani, A.; Khorasani, S.; Mozafari, M. Impact of Particle Size and Polydispersity Index on the Clinical Applications of Lipidic Nanocarrier Systems. Pharmaceutics 2018, 10, 57. [Google Scholar] [CrossRef] [PubMed] [Green Version]
  50. Mikulcová, V.; Kašpárková, V.; Humpolíček, P.; Buňková, L. Formulation, Characterization and Properties of Hemp Seed Oil and Its Emulsions. Molecules 2017, 22, 700. [Google Scholar] [CrossRef]
  51. Esmaeili, F.; Atyabi, F.; Dinarvand, R. Preparation of PLGA nanoparticles using TPGS in the spontaneous emulsification solvent diffusion method. J. Exp. Nanosci. 2007, 2, 183–192. [Google Scholar] [CrossRef]
  52. Mu, L.; Feng, S.S. PLGA/TPGS Nanoparticles for Controlled Release of Paclitaxel: Effects of the Emulsifier and Drug Loading Ratio. Pharm. Res. 2003, 20, 1864–1872. [Google Scholar] [CrossRef]
  53. Dastagiri Reddy, Y.; Dhachinamoorthi, D.; Chandra Sekhar, K.B. Formulation and in vitro evaluation of antineoplastic drug loaded nanoparticles as drug delivery system. Afr. J. Pharm. Pharmacol. 2013, 7, 1592–1604. [Google Scholar] [CrossRef] [Green Version]
  54. Soliman, W.E.; Shehata, T.M.; Mohamed, M.E.; Younis, N.S.; Elsewedy, H.S. Enhancement of Curcumin Anti-Inflammatory Effect via Formulation into Myrrh Oil-Based Nanoemulgel. Polymers 2021, 577. [Google Scholar] [CrossRef] [PubMed]
  55. Anderson, D.; Anderson, T.; Fahmi, F. Advances in Applications of Metal Oxide Nanomaterials as Imaging Contrast Agents. Phys. Status Solidi 2019, 216, 1801008. [Google Scholar] [CrossRef]
  56. Ahmad, A.; Bae, H.; Rhee, I. Highly stable silica-coated manganese ferrite nanoparticles as high-efficacy T2 contrast agents for magnetic resonance imaging. AIP Adv. 2018, 8. [Google Scholar] [CrossRef] [Green Version]
  57. Tong, S.; Hou, S.; Zheng, Z.; Zhou, J.; Bao, G. Coating optimization of superparamagnetic iron oxide nanoparticles for high T2 relaxivity. Nano Lett. 2010, 10, 4607–4613. [Google Scholar] [CrossRef] [Green Version]
  58. Jun, Y.W.; Huh, Y.M.; Choi, J.S.; Lee, J.H.; Song, H.T.; Kim, S.; Yoon, S.; Kim, K.S.; Shin, J.S.; Suh, J.S.; et al. Nanoscale Size Effect of Magnetic Nanocrystals and Their Utilization for Cancer Diagnosis via Magnetic Resonance Imaging. J. Am. Chem. Soc. 2005, 127, 5732–5733. [Google Scholar] [CrossRef] [PubMed]
  59. Banerjee, A.; Blasiak, B.; Pasquier, E.; Tomanek, B.; Trudel, S. Synthesis, characterization, and evaluation of PEGylated first-row transition metal ferrite nanoparticles as: T 2 contrast agents for high-field MRI. RSC Adv. 2017, 7, 38125–38134. [Google Scholar] [CrossRef] [Green Version]
  60. Khizar, S.; Ahmad, N.M.; Ahmed, N.; Manzoor, S.; Elaissari, A. Encapsulation of doxorubicin in magnetic-polymer hybrid colloidal particles of Eudragit E100 and their hyperthermia and drug release studies. Polym. Adv. Technol. 2020, 31, 1732–1743. [Google Scholar] [CrossRef]
  61. Just, M.; Thelen, M. Tissue characterization with T1, T2, and proton density values: Results in 160 patients with brain tumors. Radiology 1988, 169, 779–785. [Google Scholar] [CrossRef]
  62. Yamada, S.; Matsuzawa, T.; Yamada, K.; Yoshioka, S.; Ono, S.; Hishinuma, T. A Modified Signal Intensity Equation of Carr-Purcell-Meiboom-Gill Pulse Sequence for MR Imaging. Tohoku J. Exp. M 1989, 158, 203–209. [Google Scholar] [CrossRef] [Green Version]
Figure 1. Indexed XRD pattern of CoGdxFe(2−x)O4 (x = 0%, 25%, 50%) synthesized via sol–gel auto combustion technique
Magnetochemistry 07 00047 g001
Figure 2. Fourier transform infrared (FTIR) analysis spectra of (a) CoGdxFe(2−x)O4 (x = 0%, 25%, 50%) and (b) emulsions E1 and E2.
Magnetochemistry 07 00047 g002
Figure 3. (a) Scanning electron microscopy images of CoGdxFe(2−x)O4 (x = 0%, x = 25%, x = 50%) samples synthesized via sol–gel auto combustion technique. (b) EDS analysis of samples CoGdxFe(2−x)O4 (x = 0%, x = 25%, x = 50%) showing elemental composition of the materials.
Magnetochemistry 07 00047 g003
Figure 4. Scanning electron microscopy images of the prepared emulsions (a) E1 and (b) E2.
Magnetochemistry 07 00047 g004aMagnetochemistry 07 00047 g004b
Figure 5. Magnetization curves of samples CoGdxFe(2−x) O4 (x = 0%, 25%, 50%) nanoparticles obtained at room temperature.
Magnetochemistry 07 00047 g005
Figure 6. (a) Hydrodynamic size of CoGdxFe(2−x)O4 (x = 0%). (b) Zeta potential of emulsion E1 (measured using distilled water as dispersion medium, at 25 °C).
Magnetochemistry 07 00047 g006
Figure 7. Comparison of drug-release profile of E1 and E2 observed over a time span of 24 h.
Magnetochemistry 07 00047 g007
Figure 8. (a) Graph of relaxation rate (r1) vs. concentration of magnetic nanoparticles (MNPs) for E1. (b) Graph of relaxation rate (r2) vs. concentration of MNPs for E1.
Magnetochemistry 07 00047 g008
Figure 9. (a) Graph of relaxation rate (r1) vs. concentration of MNPs for E2. (b) Graph of relaxation rate (r2) vs. concentration of MNPs for E2.
Magnetochemistry 07 00047 g009
Table 1. Calculated parameters of the synthesized samples.
CompositionCoFe2O4CoGd0.25Fe1.75O4CoGd0.50Fe1.50O4
Crystallite size (nm)36.8936.9036.92
Lattice constant (a)8.4118.3808.3436
Ms (emu/g)81.8647.8129.719
Hc (Oe)1317.53649.99659.53
Mr (emu/g)43.4422.8814.21
Hydrodynamic Size (nm)89.497.2105
Zeta Potential (mV)+15−18.8−12
Publisher’s Note: MDPI stays neutral with regard to jurisdictional claims in published maps and institutional affiliations.

