
Characterization of the Compressive Load on a Lithium-Ion Battery for Electric Vehicle Application


Department of Energy Technology, Aalborg University, DK-9220 Aalborg, Denmark
*
Author to whom correspondence should be addressed.
Machines 2021, 9(4), 71; https://doi.org/10.3390/machines9040071
Submission received: 20 February 2021
/
Revised: 17 March 2021
/
Accepted: 18 March 2021
/
Published: 25 March 2021
(This article belongs to the Section Vehicle Engineering)
Abstract
:Lithium-ion batteries are being implemented in different large-scale applications, including aerospace and electric vehicles. For these utilizations, it is essential to improve battery cells with a great life cycle because a battery substitute is costly. For their implementation in real applications, lithium-ion battery cells undergo extension during the course of discharging and charging. To avoid disconnection among battery pack ingredients and deformity during cycling, compacting force is exerted to battery packs in electric vehicles. This research used a mechanical design feature that can address these issues. This investigation exhibits a comprehensive description of the experimental setup that can be used for battery testing under pressure to consider lithium-ion batteries’ safety, which could be employed in electrified transportation. Besides, this investigation strives to demonstrate how exterior force affects a lithium-ion battery cell’s performance and behavior corresponding to static exterior force by monitoring the applied pressure at the dissimilar state of charge. Electrochemical impedance spectroscopy was used as the primary technique for this research. It was concluded that the profiles of the achieved spectrums from the experiments seem entirely dissimilar in comparison with the cases without external pressure. By employing electrochemical impedance spectroscopy, it was noticed that the pure ohmic resistance, which is related to ion transport resistance of the separator, could substantially result in the corresponding resistance increase.
1. Introduction
The effect of externally and internally mechanical stresses on lithium-ion batteries’ electrochemical performance was studied [1]. Focused attention was paid to the dependency of the ion transport inside the separator against the stress condition. It was concluded that external pressure on the battery cell brings about stresses [1].
The impact of pressure utilization throughout the procurement of LiCoO2 cathodes and compound flaky synthetic graphite anodes on their electrochemical performance in Li intercalation and de-intercalation processes was investigated [2] by employing electrochemical impedance spectroscopy, chronopotentiometry, and voltammetry. It was concluded the utilization of pressure throughout the procurement of LiCoO2 and graphite had opposed impacts on their performance [2].
Stress development in lithium-ion compound electrodes throughout electrochemical cycling and consequential interior pressures on the cell casing was investigated [3]. A model was introduced to determine the internal pressure produced in a spirally wound battery casing attributable to the electrode stress throughout discharge and charge cycling [3].
The reasons for the abrupt degradation of useable capacity were investigated with the help of supplementary procedures, including computed tomography and electrochemical studies [4]. The acquired outcomes indicate collectively inharmonious aging as a primary factor for the abrupt degradation of battery cell capacity, which consequently is caused by dissimilarities in regional compression [4].
The thickness variation of a commercial pouch-type battery cell was studied at numerous sizes [5]. The shifts of the single separate electrode materials were scrutinized by dilatometry. It was concluded that the cathode cooperates considerably to the thickness variation of the battery and enlarges directly by the delithiated capacity with about two percent [5].
In total, 24 giant capacity lithium-ion battery cells with great silicon content were cycle under seven dissimilar cycling situations to investigate the consequence of dissimilar stimulus on the life cycle of Si-anode full battery cells [6]. The impact of different factors was considered, such as the discharge current, depth of discharge, and ambient temperature. The pressure development was observed through battery lifetime and demonstrated identical behavior throughout all cycling states. By decreasing the capacity retention, an irreversible pressure growth occurs. An understandable interdependence could be distinguished among pressure behavior and the capacity retention of the Si-alloy cells. The aforementioned indicates some correspondence among the principal aging mechanism between their irreversible pressure increase and Si-alloy cells [6].
The impacts of exterior compacting on the aging and performance of single-layer lithium-ion pouch cells were researched using a spring-loaded structure. In addition, the coupling between mechanics and electrochemistry was demonstrated [7]. Four different pressure were applied to the battery to investigate the effect of different pressure from 0.66 to 1.98 MPa on new battery cells’ impedance. Moreover, the impedance was characterized at different pressure levels. After cycling the new battery cells, the aged cells were investigated for impedance increase and capacity fade. The impact of pressure distribution was simulated [7]. The outcomes demonstrated that the mass transport and kinetic resistance raised with pressure in a new battery cell. The most appropriate and beneficial pressure was determined around 1.3 MPa to decrease cyclable-lithium loss throughout cycling. Aging pressure influences the charge transfer resistance of the cell’s ohmic resistance and both graphite and nickel manganese cobalt (NMC) electrodes. It was concluded that pressure distribution causes current distribution, whereas the increased current throughput at lesser pressures does not speed up its aging [7].
An experimental setup was designed and constructed to determine the electrical performance of NMC based 25 Ah lithium-ion battery cells for various applied pressures [8]. The temperature range was considered between 0–45 °C. External pressure influences the voltage and capacity of the cell. It was seen that raised pressure increased the cell capacity and voltage during charge and decreased it during discharge. The impedance rises, which were the most considerable parameters, demonstrated bulk transport variation for active materials with applied pressure. The cells’ power capability and greater capacity were mainly seen when there is no external pressure condition [8]. A summary of the lithium-ion battery cells’ electrical performance for different applied pressure is shown in Table 1.
An experiment was accomplished to specify the influence of external pressure on different electrical parameters such as galvanostatic electrochemical impedance spectroscopy, capacity variation, voltage, and current for a pouch cell [9]. Outcomes demonstrated that the external static pressure does not influence ohmic contribution. Nevertheless, it could improve ion diffusion for pressure between 0.125 MPa and 1 MPa. It was observed that lithium-ion pouch cells produced dynamic pressure during discharge and charge processes near 50% state of charge, which agreed with the capacity change. Besides, it was seen that the pressure speed was affected by the current rate. The current rate does not influence the dynamic pressure in a charged condition. Nevertheless, the voltage was influenced among 35–65% state of charge [9]. A summary of the influence of external pressure on various electrical parameters is shown in Table 2.
The impacts of mechanical stress on commercial lithium-ion battery life were studied by observing the capacity and stack pressure of constrained lithium-ion pouch cells during charging and discharging [10]. It was found that stack stress is a dynamic amount. The stress was oscillating with discharge and charge. It was seen that it gradually raised irreversibly during a long period with charging and discharging. Changes in primary stack pressure were shown as a significant parameter that the manufacturer could control. It was observed that by changing the primary stack pressure, the cells experience various stress evolution over their lifetime. It was concluded that battery cells that were manufactured with more significant stack pressure demonstrated lower cycle lives [10].
The effect of compressive pressure on battery degradation was investigated. Battery cells were cycled 1200 times under 0.5 psi and 15 psi compressive pressure loads [11]. It was seen that capacity fade for 0.5 and 15 psi pressure loads were 11.0%, 8.8%, and 8.4%. Correspondent power fade demonstrated an opposite trend compared to the capacity fade. This contradictory behavior was found to be pertaining to the separator creep and wettability rise in the cell after pressure load was applied. The investigation determined the progress of compressive loads over numerous cycles, and it was concluded that pressure raises with cycling [11].
An overview of mechanical stresses on lithium-ion batteries is presented in Section 2. The novelties of this study is demonstrated in Section 3. The procedures and experimental configuration in this investigation are presented in Section 4. Following the introduction of the outcomes attributable to applying cycling and force, an explanation of the outcomes was summarized in Section 5. Eventually, the main conclusion was outlined in Section 6.
2. Overview of Mechanical Stresses on Lithium-Ion Batteries
Shocks and mechanical vibrations are accompanied by lithium-ion batteries, especially in mobile applications. The lithium-ion battery cells’ mechanical properties and performance in mobile applications, especially electric vehicles, are affected by the shocks and mechanical vibrations. Notwithstanding, the impacts of vibration on the performance, degradation, life cycle, and thermal properties of lithium-ion batteries and components are unknown.
The lithium-ion batteries’ performance and mechanical properties could be severely affected by the acceleration inertia, road irregularity, and abrupt crash. In recent years, the effect of mechanical vibration on lithium-ion batteries has attracted more and more consideration from researchers [12]. The research was presented to specify the durability of commercially available battery cells and determines both the mechanical and electrical vibration-induced degradation via quantifying alterations in battery cell natural frequency, impedance, and capacity. Besides, the influence of the in-pack orientation and cell state of charge was evaluated. The focus of attention of disclosed experimental outcomes was the potential for essential mechanical and electrical properties in the battery cell to diverge, attributable to vibration energy utilization, which is accomplished with a regular road vehicle life [12].
The vibration was evaluated and characterized for three dissimilar commercially available electric vehicles [13]. For every vehicle, a durability outline was arranged to imitate the vibration energy, to which the battery pack was exposed throughout a definite service life in Europe. It was concluded that the battery packs might appropriately be caused to undergo vibration outside the current assessment scope of available standards. Moreover, while the majority of instructions suggest a specific experiment instruction for both axes of the battery pack, quantified data from all-electric vehicles emphasize that these axes undergo dissimilar loads and consequently should have customized experiment profiles specified for them. Eventually, suppose the claim is accurate that electric vehicles would function further in rural and urban environments. In that case, the results recommend that the battery assembling would be caused to experience more oversized peak loads in vibration than a corresponding vehicle driven over a conventional European road surface [13].
The underpinning theory and experiential approach used while employing the impulse excitation method to determine the mode shapes and natural frequencies of a commercially available 25 Ah Pouch Cell were investigated [14]. Experimental outcomes were demonstrated at five various amounts of state of charge and for 15 cells. The outcomes demonstrate that regardless of the cell energy, the identical four modes of vibration, including bending and torsion, occur in a certain frequency range. The aforementioned is higher than the frequency range, which generally belonging to road-induced vibration. Besides, the outcomes demonstrate that the cell’s natural frequencies of damping and vibration do not change with varying amounts of state of charge [14].
The lithium-ion battery module’s vibration experiments, which were employed for an electric vehicle, were investigated regarding open-circuit voltage [15]. The wettability of the battery cell’s negative and positive plates was altered in the electrolyte during the vibrating process, remaining for a course long enough following vibration, the battery keeps its wettability constant, and its discharge capacity was partially regained. The outcomes exhibited that the construction of the lithium-ion battery module stays fixed. Besides, the temperature and voltage stay steady in the vibrating process. After and before the vibration process, no evident variation was seen in the battery module’s Alternating Current (AC) internal resistance. The conductivity of the battery’s active particles was considerably decreased, resulting in a decline in charge capacity and a rise in Direct Current (DC) internal resistance of the battery module [15].
A numerical model was developed to vibration hybrid electric vehicle battery packs to allow possible forced feedback simulations for the effects of changes [16]. Two essential classifications for variations were considered, which influence their structural feedback considerably. These types are the random, small structural difference between a battery pack’s cells and the prestress. A creative parametric decreased order model formulation was derived by using three principal monitoring. The first one was the stiffness matrix, which could be parameterized for dissimilar quantities of prestress. The second one was the mode configurations of a battery pack. Finally, the third one was the structure keeping each cell, which has vibratory movement. A numerical exemplification of a battery pack with pouch cells was represented to show that the parametric decreased order model catches the effects of both structural variations and prestress on battery packs. In addition, the parametric decreased order model was validated numerically [16].
The effect of mechanical stress, including shocks and vibrations, on lithium-ion cells was investigated [17]. Consequently, real-world loads and standard experiments were employed to stress lithium-ion cells. Standards for mechanical shocks and vibrations on cell level were itemized and compared concerning frequency range and peak acceleration. In the most conventional experiments, the sine sweep vibrations were selected to stress cylindrical and pouch cells. This investigation emphasizes the dissimilarity among load profiles, which was suggested through standards and mechanical stress in practical applications. With the intention of understanding the impact of mechanical stress happening in practical utilization, a long-term vibrational experiment with accelerations and adapted frequencies was performed and designed. For every experimentation profile and cell configuration, two cells served as references. Two cells were stressed in the z-direction and two cells in the y-direction. The pouch cells displayed no failure or degradation in any of the experimentations. The researched 18,650 cells failed the lengthy and shock vibrational experiments because the jelly roll. The mandrel were especially not secured tightly. The cylindrical cells’ identified failures were not straightly transmittable to other cells or cells accompanied by a rigid casing generally. The research disclosed that the mechanical layout of a cell’s elements, the direction of movement, and the load outline must be contemplated while the cells’ stability is assessed [17].
A single-axis acceleration experiment technique, which is more reliable and quicker, was suggested by transforming the vibration record into power spectrum density, supporting the correspondence among the experiment time and acceleration factor and proposing a driving interval conversion method commensurate with the experiment time [18]. Moreover, while running the single-axis acceleration experiment, the vibration record in four locations was determined symmetrically; afterward, through virtual destruction investigation, a technique that implements the strictest vibration record was suggested [18].
The reliability of a lithium-ion battery pack was estimated, including the cell-voltage-sensing, the intensity of the electrical interconnection, cell-module-voltage-sensing apparatuses, and the solidity of the module assembly via individual electrical and mechanical examination approaches [19,20]. Mixed environmental experiment procedures were applied, employing the acceleration method to approximate the electrical durability and mechanical durability of the lithium-ion battery pack, which was developed to acquire severer reliability at the advancement step. By comparing both accelerated and segregated combined environmental examinations, it was noticed that the advanced battery pack demonstrates exceptional characteristics regarding electrical durability and mechanical durability. It has been a consensus between automakers, which the aluminum-laminated cell packaging is frailer than other challenging cell arrangements such as prismatic and cylindrical concerning electrical durability and mechanical durability. It was concluded that a long-lasting battery pack could be constructed by employing cells with aluminum-laminated packaging [19,20].
The effect of vibration on the electrical performance of lithium-ion battery cells was evaluated. The outcomes demonstrated that the standard deviation and average dimension of DC resistance raised at the 0.05 and 0.1 importance level, accordingly. Moreover, a considerable decline in cell capacity and a negligible decline in consistency was noticed after the vibration experiment [21].
A process was defined to develop random power spectral density outlines, which were indicative of UK customer electric vehicle procedure using vibration measurements for handling vibration permanence assessments of sub-floor seated rechargeable energy storage systems [22]. The investigation also introduced an essential evaluation of current random vibration experiment methods accessible to engineers to validate the mechanical performance of electric vehicle rechargeable energy storage systems by evaluating fatigue damage spectrum and the shock feedback spectrum [22].
A model was designed to simulate the disorderly vibrations energy accumulation and gather the changed electric energy in the battery cell, which planned to provide the brightness at the dim time [23]. Life cycle experiments were performed to disclose the impact of dissimilar cut-off voltages and charging current rates on the aging mechanism of batteries [24].
An investigation was accomplished to specify commercially accessible battery cells’ durability and calculate mechanical and electrical vibration-induced degradation. This was done by calculating variations in battery cell natural frequency, impedance, and capacity. Besides, the influence of the in-pack orientation and battery cell state of charge was evaluated [25]. An investigation was demonstrated that presents the impact of the variation in electrical properties of vibration that several aged battery cells could have on the control strategy, which were used through the battery cell management system of a hybrid electric vehicle [26].
An investigation was accomplished to find out that both the mechanical properties and electrical performance of the lithium-ion cells were comparatively unchanged when encountered vibration power, which corresponds to a typical vehicle life [27]. The mechanical frequency feedback function was studied as a non-destructive technique to quantify parameters, including damping and stiffness of pouch cells and their correspondence with the temperature, state of health, and the state of charge of the battery cell [27].
Standard vibration requirements were compared with vibration magnitude in an electric vehicle for lithium-ion batteries by employing an energy spectral density study [28]. An approach was characterized for dynamic optimization and investigation of an electric vehicle suspension system by employing the motor in-wheel technology [29]. A procedure was determined to construct unpredictable energy spectral density profiles, which were characteristic of one hundred thousand miles of UK customer electric vehicle application employing vibration dimensions from three electric vehicles, for taking vibration durability assessments of underfloor installed rechargeable power storage systems [24]. The different international regulations and standards for safety analysis of lithium-ion batteries in automotive utilization under different abusive environments were reviewed [30]. Mechanical design and strategic placement methodology of a robust battery pack for electric vehicle applications were reviewed [31].
3. The Novelties of This Work
The previous studies and achievements, which are discussed, are restricted to specific sections of lithium-ion batteries. The connection between force generation and coulombic efficiency and capacity change throughout charge and discharge under several currents was not clearly described. Unfortunately, less attention was paid to the characterization and study of the effect of external compressive loads on prismatic lithium-ion batteries’ performance for electric vehicles application. Almost all of the previous investigations studied cylindrical and commercial pouch cells.
This investigation suggests a principal method with the intention of characterization of the compressive load on a prismatic lithium-ion battery for electric vehicles application. In addition, determination of the effect of external force on the performance and behavior of a prismatic lithium-ion battery cell was investigated. Initially, the primary aim was to present the impedance properties variation in external static force conditions for the prismatic lithium-ion battery cell. The influence of external force on the battery cell performance at the dissimilar state of charge is crucial that, up to the present time, it has not yet been entirely investigated and comprehended. This investigation’s primary purpose was to quantify and determine battery state of charge impacts on lithium-ion cell performance due to cycling under force by using electrochemical impedance spectroscopy. In addition, the impact of external force on the impedance change with cycling was studied.
4. Experimental Procedure
4.1. Pressure Setup
A test rig for the dynamic force experiments on the batteries was designed. A mechanical load structure was needed to apply several external forces on the battery cells. The battery cell could be loaded by using different methods. It should be noted that the applied force on the battery cell surface should be unified and equalized. In addition, the external pressure should be static and uniaxial pressure in the normal direction to the battery cell.
The compressive force that should be applied to the compressed battery cells is 8 kN. There are different methods to ensure that a uniform load is applied to the battery surface (15 cm × 10 cm). For example, they can sit between plates. During cycling the battery, mostly when the batteries are aged, a dynamic pressure appears because of battery expansion. This dynamic pressure can be measured precisely by a pressure sensor. In this situation, keeping the mechanical load distributed evenly along the battery cells’ craggy faces would be challenging.
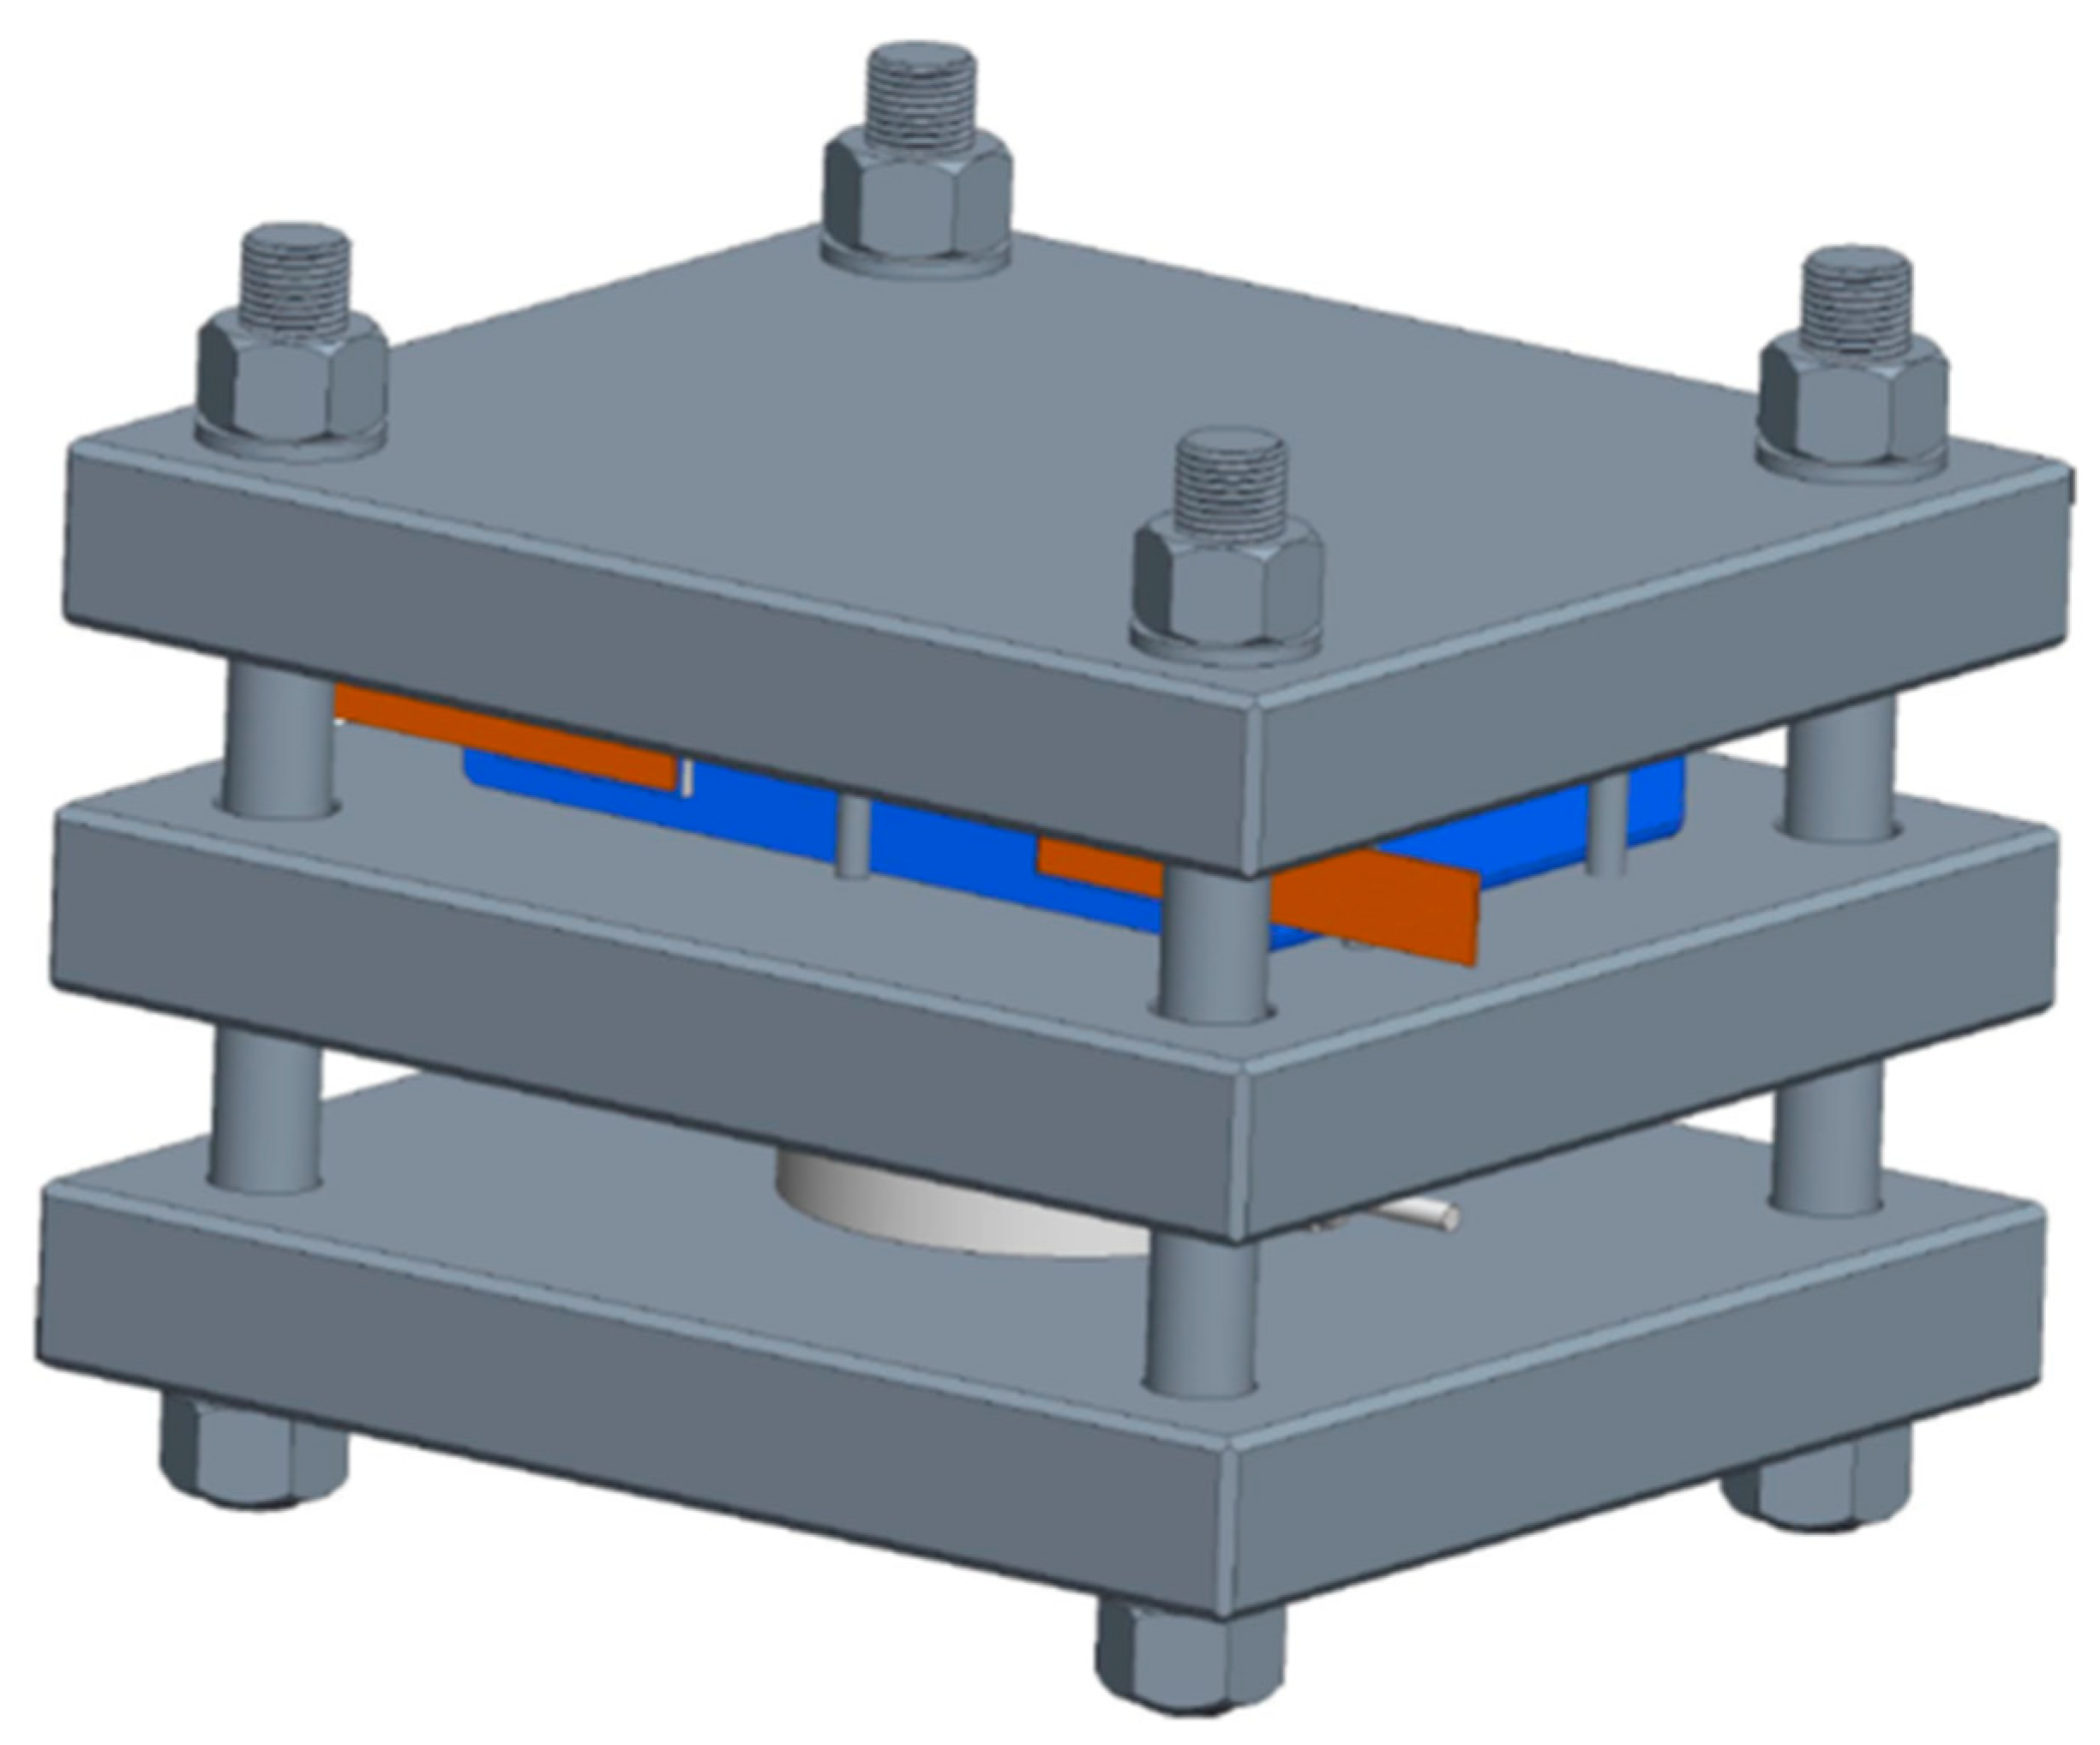
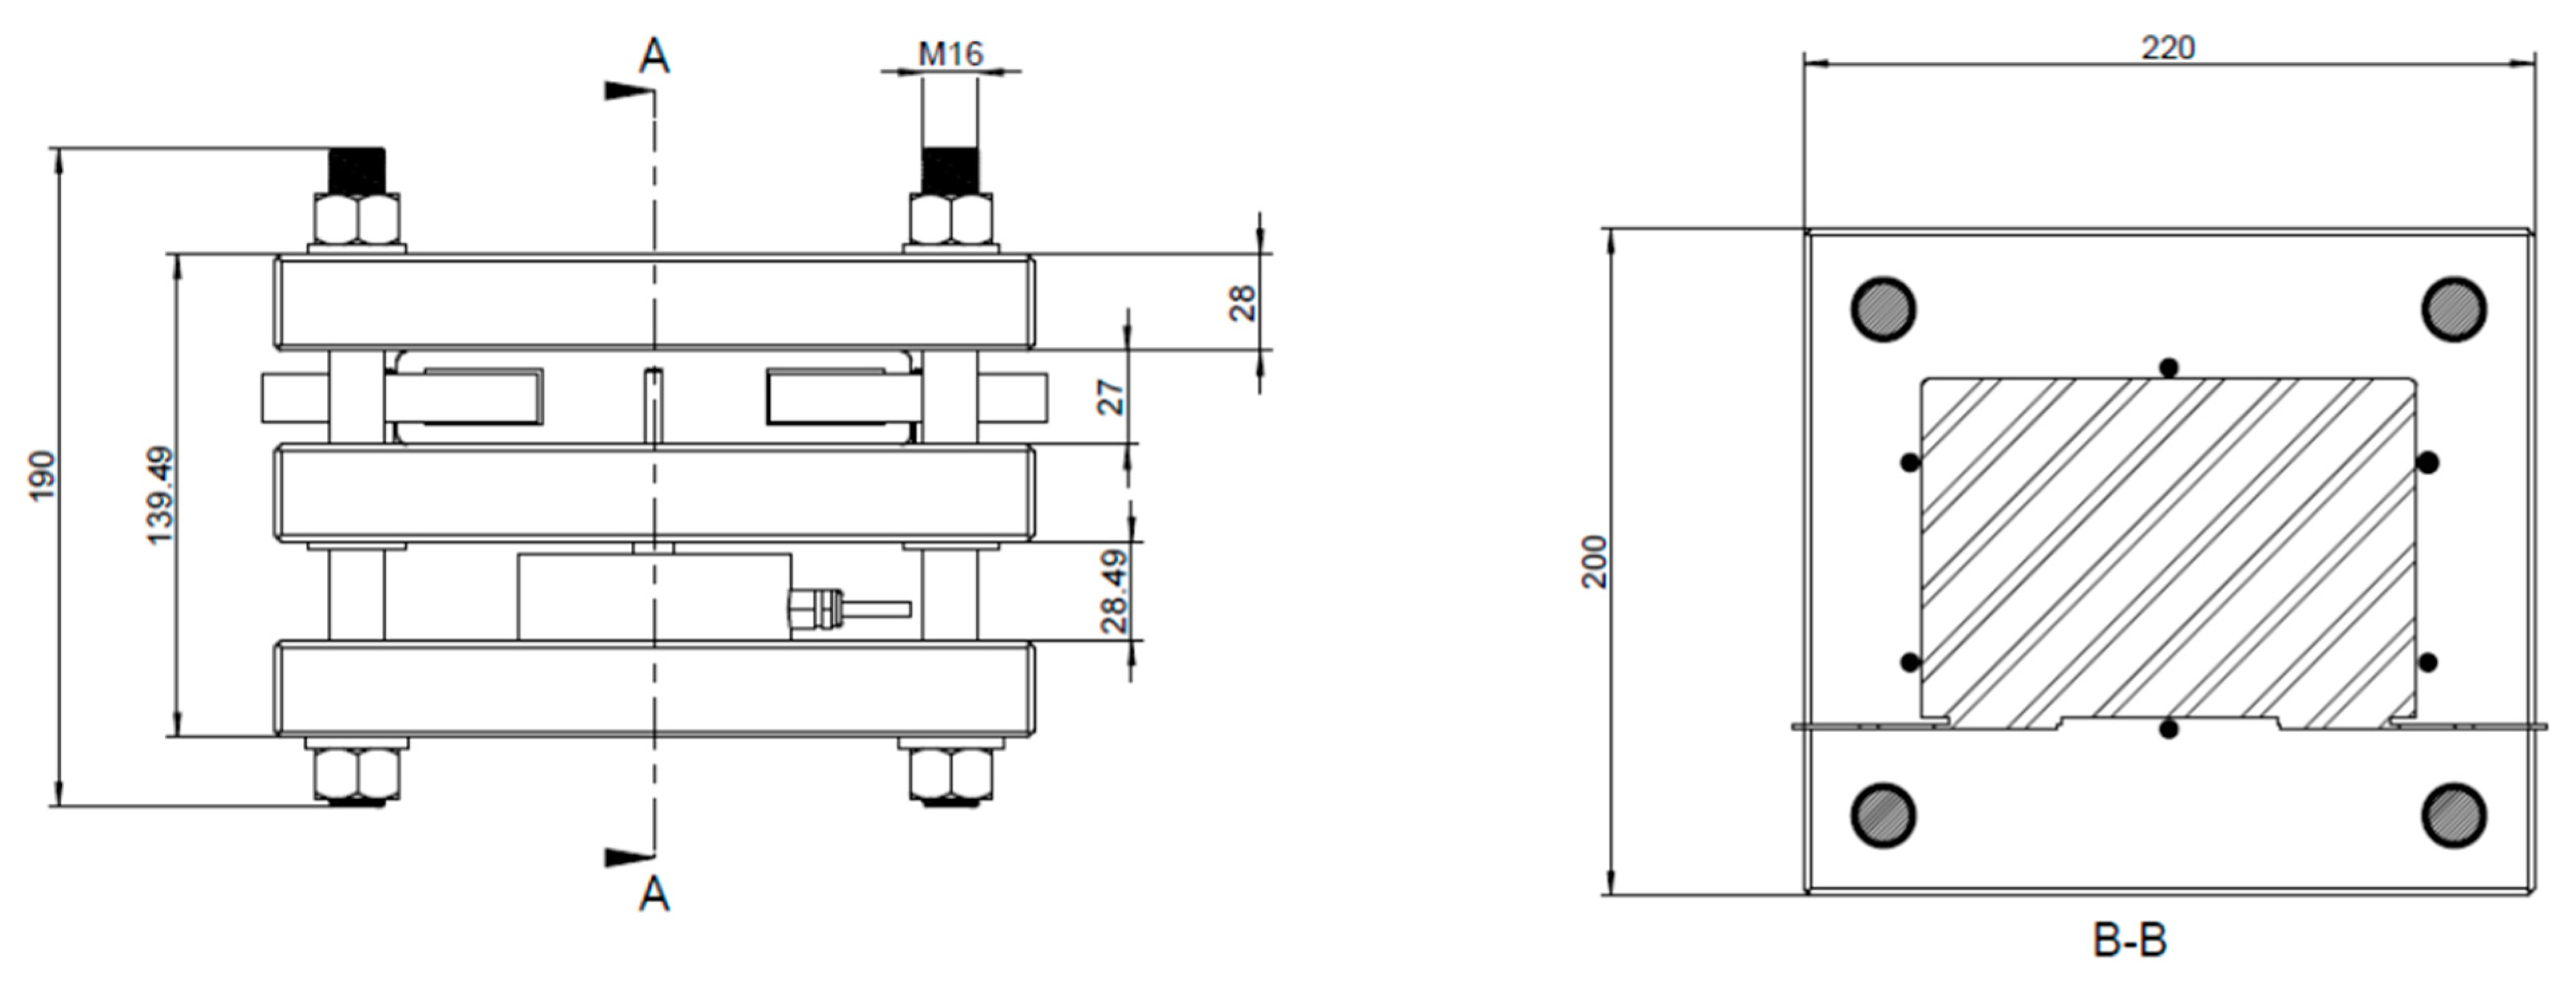
A comprehensive clarification of the technical requirements should be accomplished. Nevertheless, there were still open questions to determine which solution could be suitable for the experiments according to different impressions about the setup. In case of an automatic force adjustment during the tests, it required a solution with an automatic drive (e.g., E-Motor or pneumatic cylinder), but it would require much more installation space. One rod would transfer the compression force to the sample instead of the four screws in the first solution. The advantage of that solution would be a more precise adjustment of the force and the possibility of controlling the force during the tests. However, the setup would need much more installation space, and it needs to be fixed in a frame, including the drive. The other problem is that such a setup could not be placed inside a battery cycler’s chamber. Finally, a standard design and its components were suggested, which is shown in Figure 1 and Figure 2. The dimension of different components of the experimental setup is illustrated in Figure 3.
As can be seen in the drawing, the sample (battery) is placed between two plates, which are connected by four screws. This setup requires a manual adjustment of the compression force by a screw-wrench. An advantage is that this is very compact because of its installation space. It would be possible to add force sensors between the screws and the screw nuts to measure the compression forces. Integration of the force sensor in the plate itself would be an option as well.
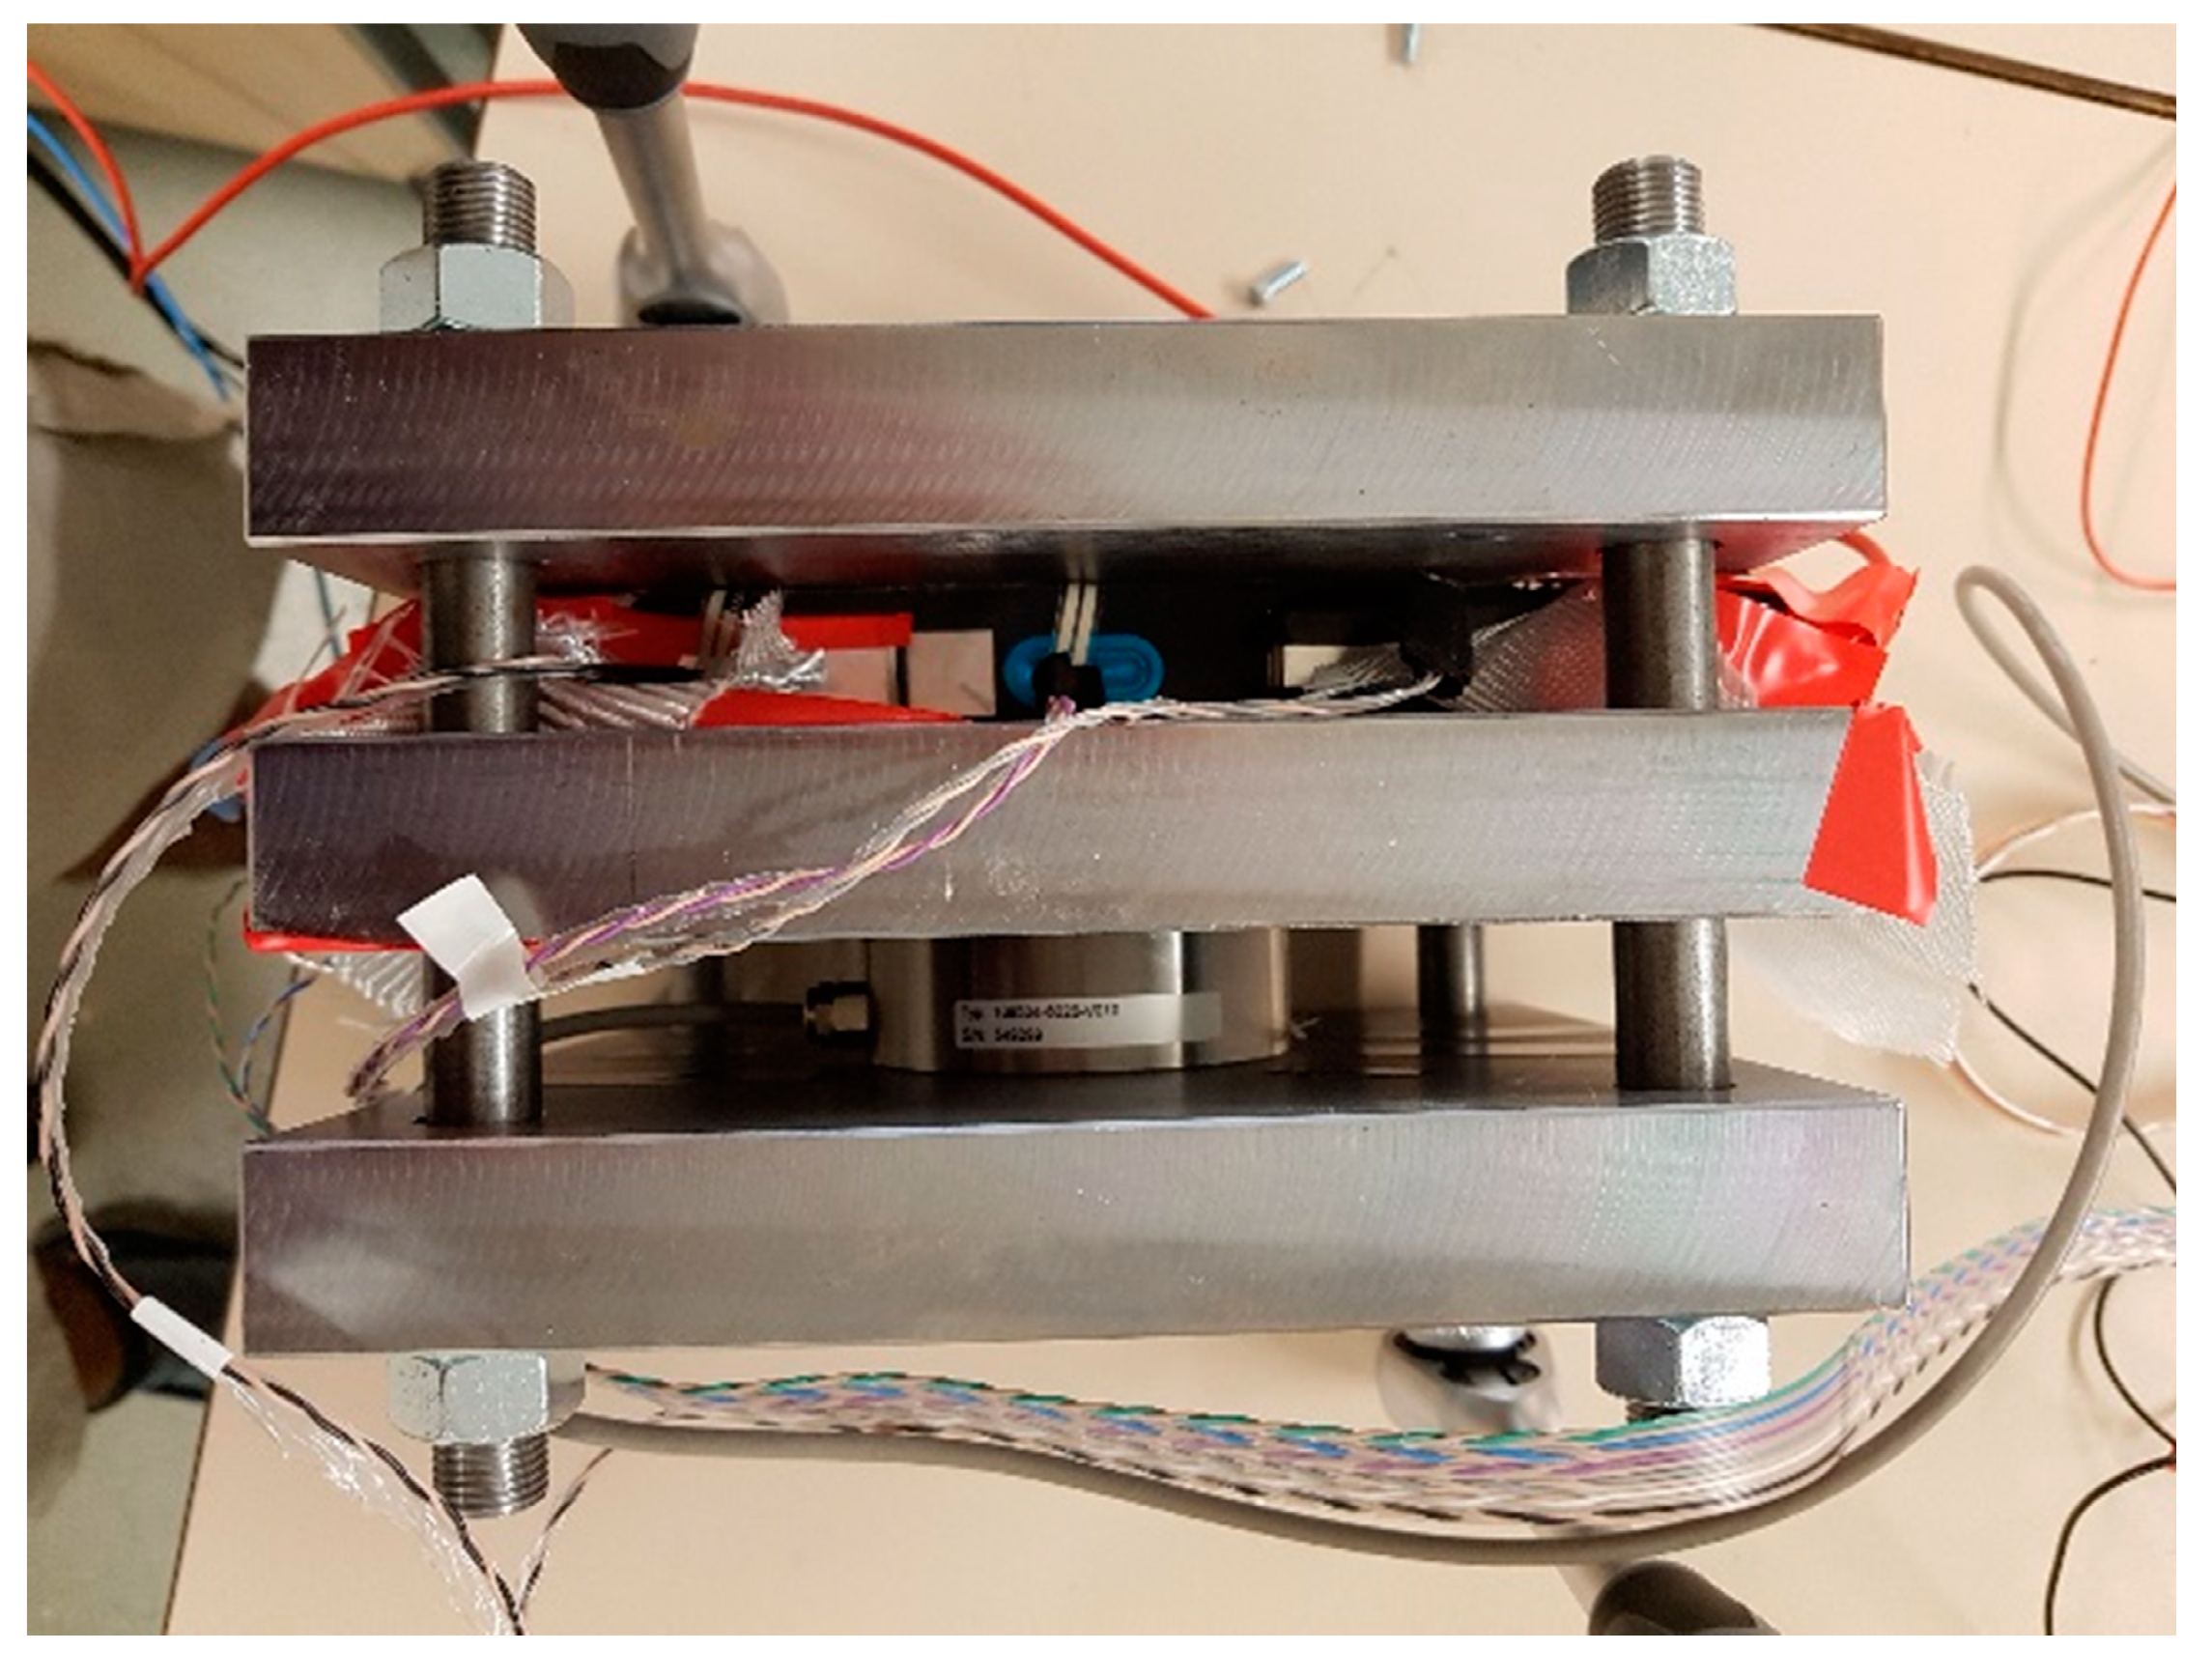
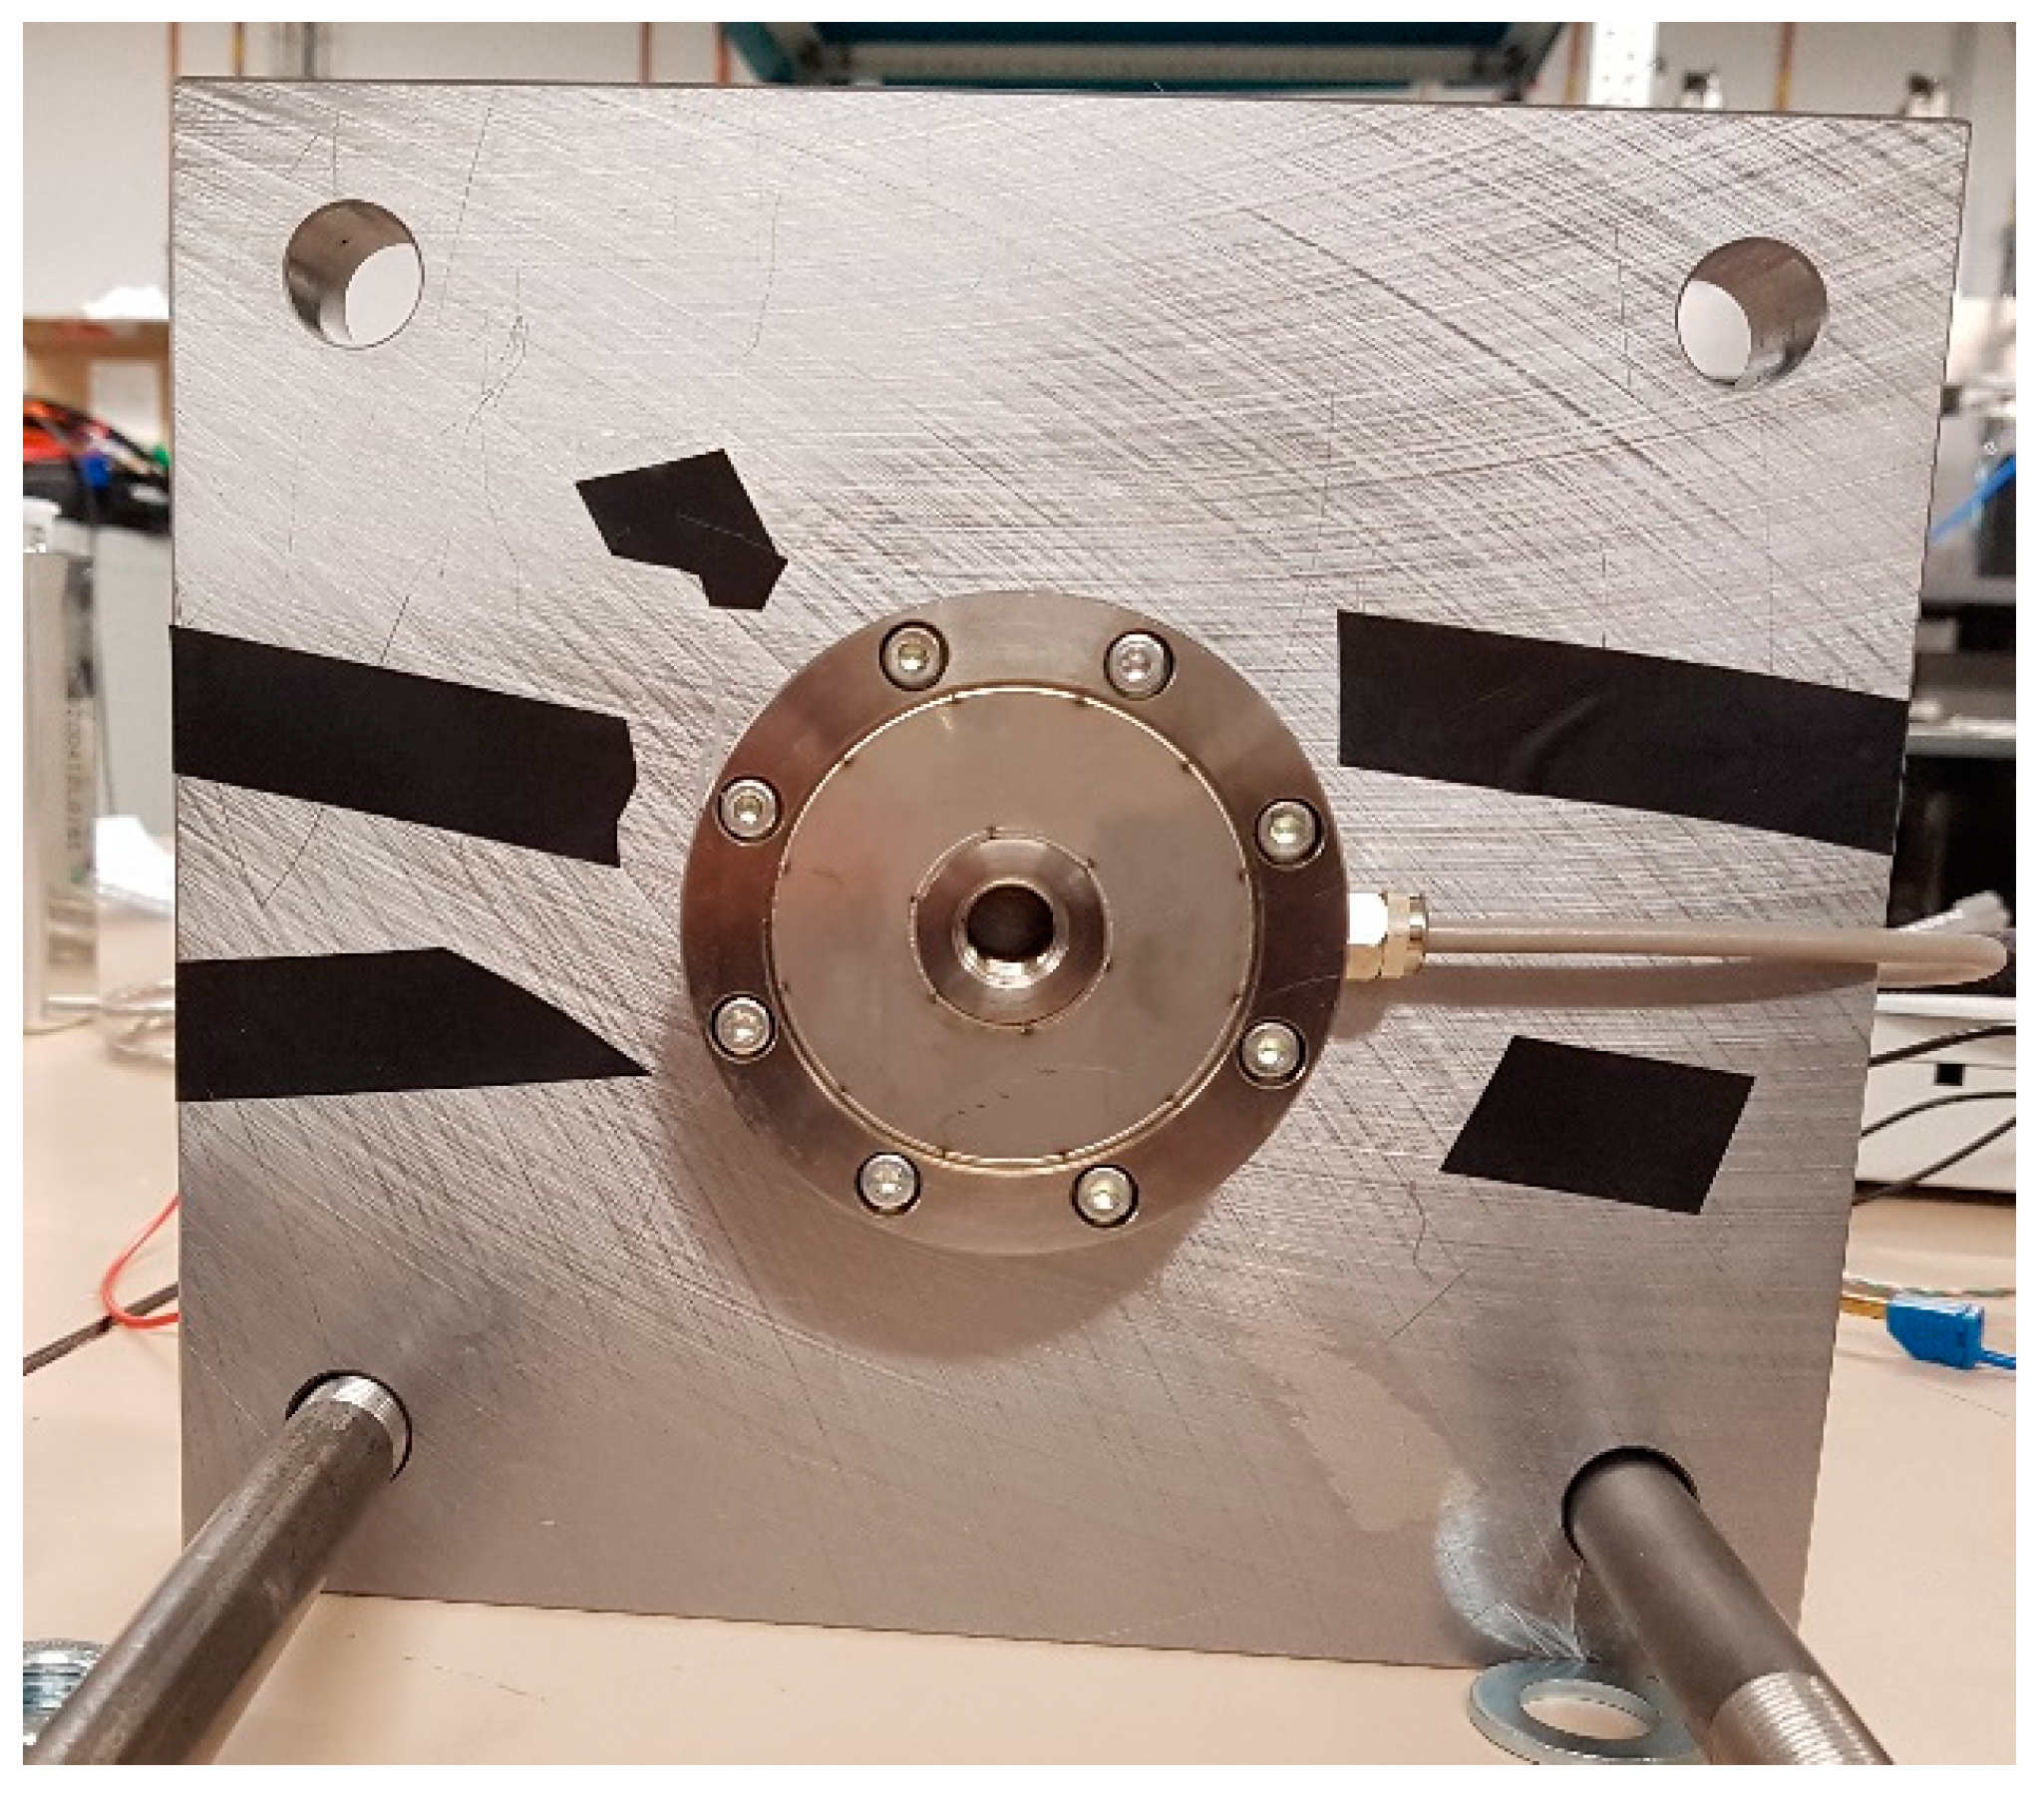
The top view of the constraint setup is illustrated in Figure 4. As can be seen, the constraint setup contains the battery cell in a series along with a load cell. A cast-iron plate is located among the load cell and battery cell to distribute the pressure equally alongside the battery cell’s even surface. The battery cell and load cell construction are then clamped down among two plates and attached together with bolts and nuts.
4.2. Flexiforce Pressure Sensor
The last technical point would be to discover what pressure range was required for a sensor. As mentioned, a pressure sensor able to deliver real-time dynamic force signals was needed. The area of the sample is 150 cm2. The sample is a lithium-ion battery cell. The width is about 2.5 cm. The force was around 8.0 kN, and the dynamic force resulting from the battery during cycling should be measured.
It should be noted that the battery expands during charge and compresses during discharge. The force variation stemming from the dynamics of the sample was expected to be in the order of some dozens of Newton. Therefore, the resolution should be around 10 N. Either one sensor or more sensors can be used on the 150 cm2 area. Of course, more sensors would give us the chance to capture the pressure distribution.
A system was needed to measure the force between some different areas. The Tekscan system could undoubtedly measure the contact forces and distribution with over 2000 points in a single sensing array. The system is called IScan, which is a unique solution from Tekscan. The IScan system is a complete package that includes electronics, data collection software, and standard sensors. These designs were not feasible due to the wires on the side and the need for an exact fit then an appropriate Tekscan pressure sensor was selected.
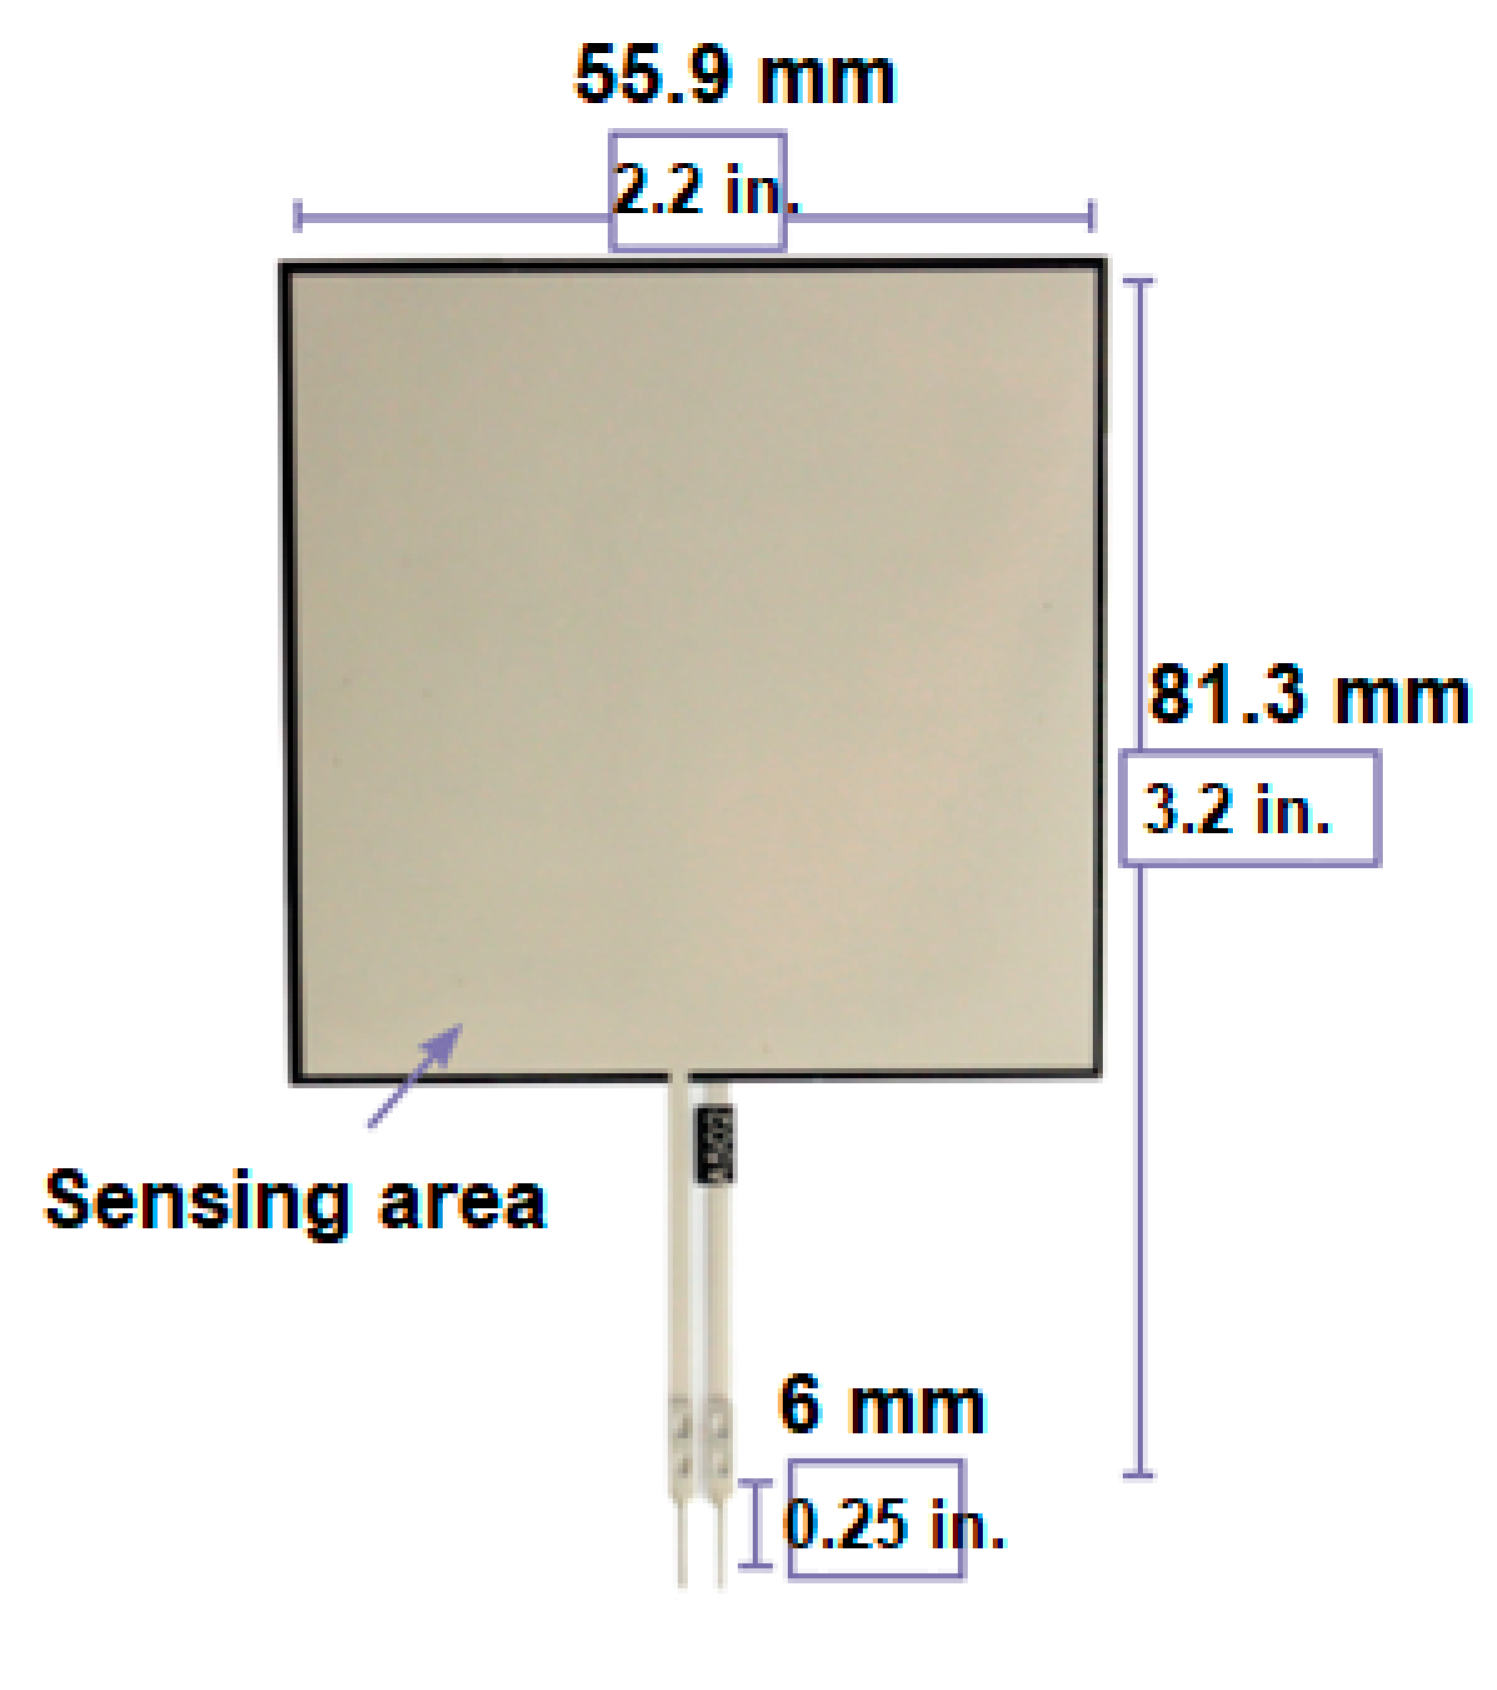
A standard design was selected to use in the application. These are all square which can be trimmed on the side opposite the connection Table These are the models A502. The Flexiforce A502 probably covers the best area for all with a 165 × 165 mm2 area matrix. It should be noticed that there is some extra area on the sides for the wires, which cannot be trimmed. The Flexiforce pressure sensor is shown in Figure 5.
A simple arrangement for six Flexiforce sensors was needed. Because there should be enough room to take the wires from the center without increasing the thickness, and a shim or spacer material of about 80–100 microns thick should also be considered around all the sensors. The product is called Flexiforce and was connected up to a voltmeter and set up to measure resistance change proportional to force for each sensing point. The electronics are 8 bit, and the 5211–200 (1400 kPa) resolution would be 1400/256 or 5 kPa. Either one sensor or many sensors could be used on the 150 cm2 area. Of course, many sensors would give us the chance to capture the pressure distribution. Therefore, six sensors were used. Six Flexiforce A502 pressure sensors installed on the battery cell surface are illustrated in Figure 6.
4.3. Strain Gage Load Cell (Type 4576A)
In addition to the Flexiforce A502, a strain gauge load cell was selected. Load cell type 4576A from KISTLER works via strain gauge technology. The measurement section includes an applied strain gauge full bridge that transforms the influencing energy to an electrical signal. The strain gage load cell, which was mounted on the plate, is illustrated in Figure 7.
4.4. Calibration
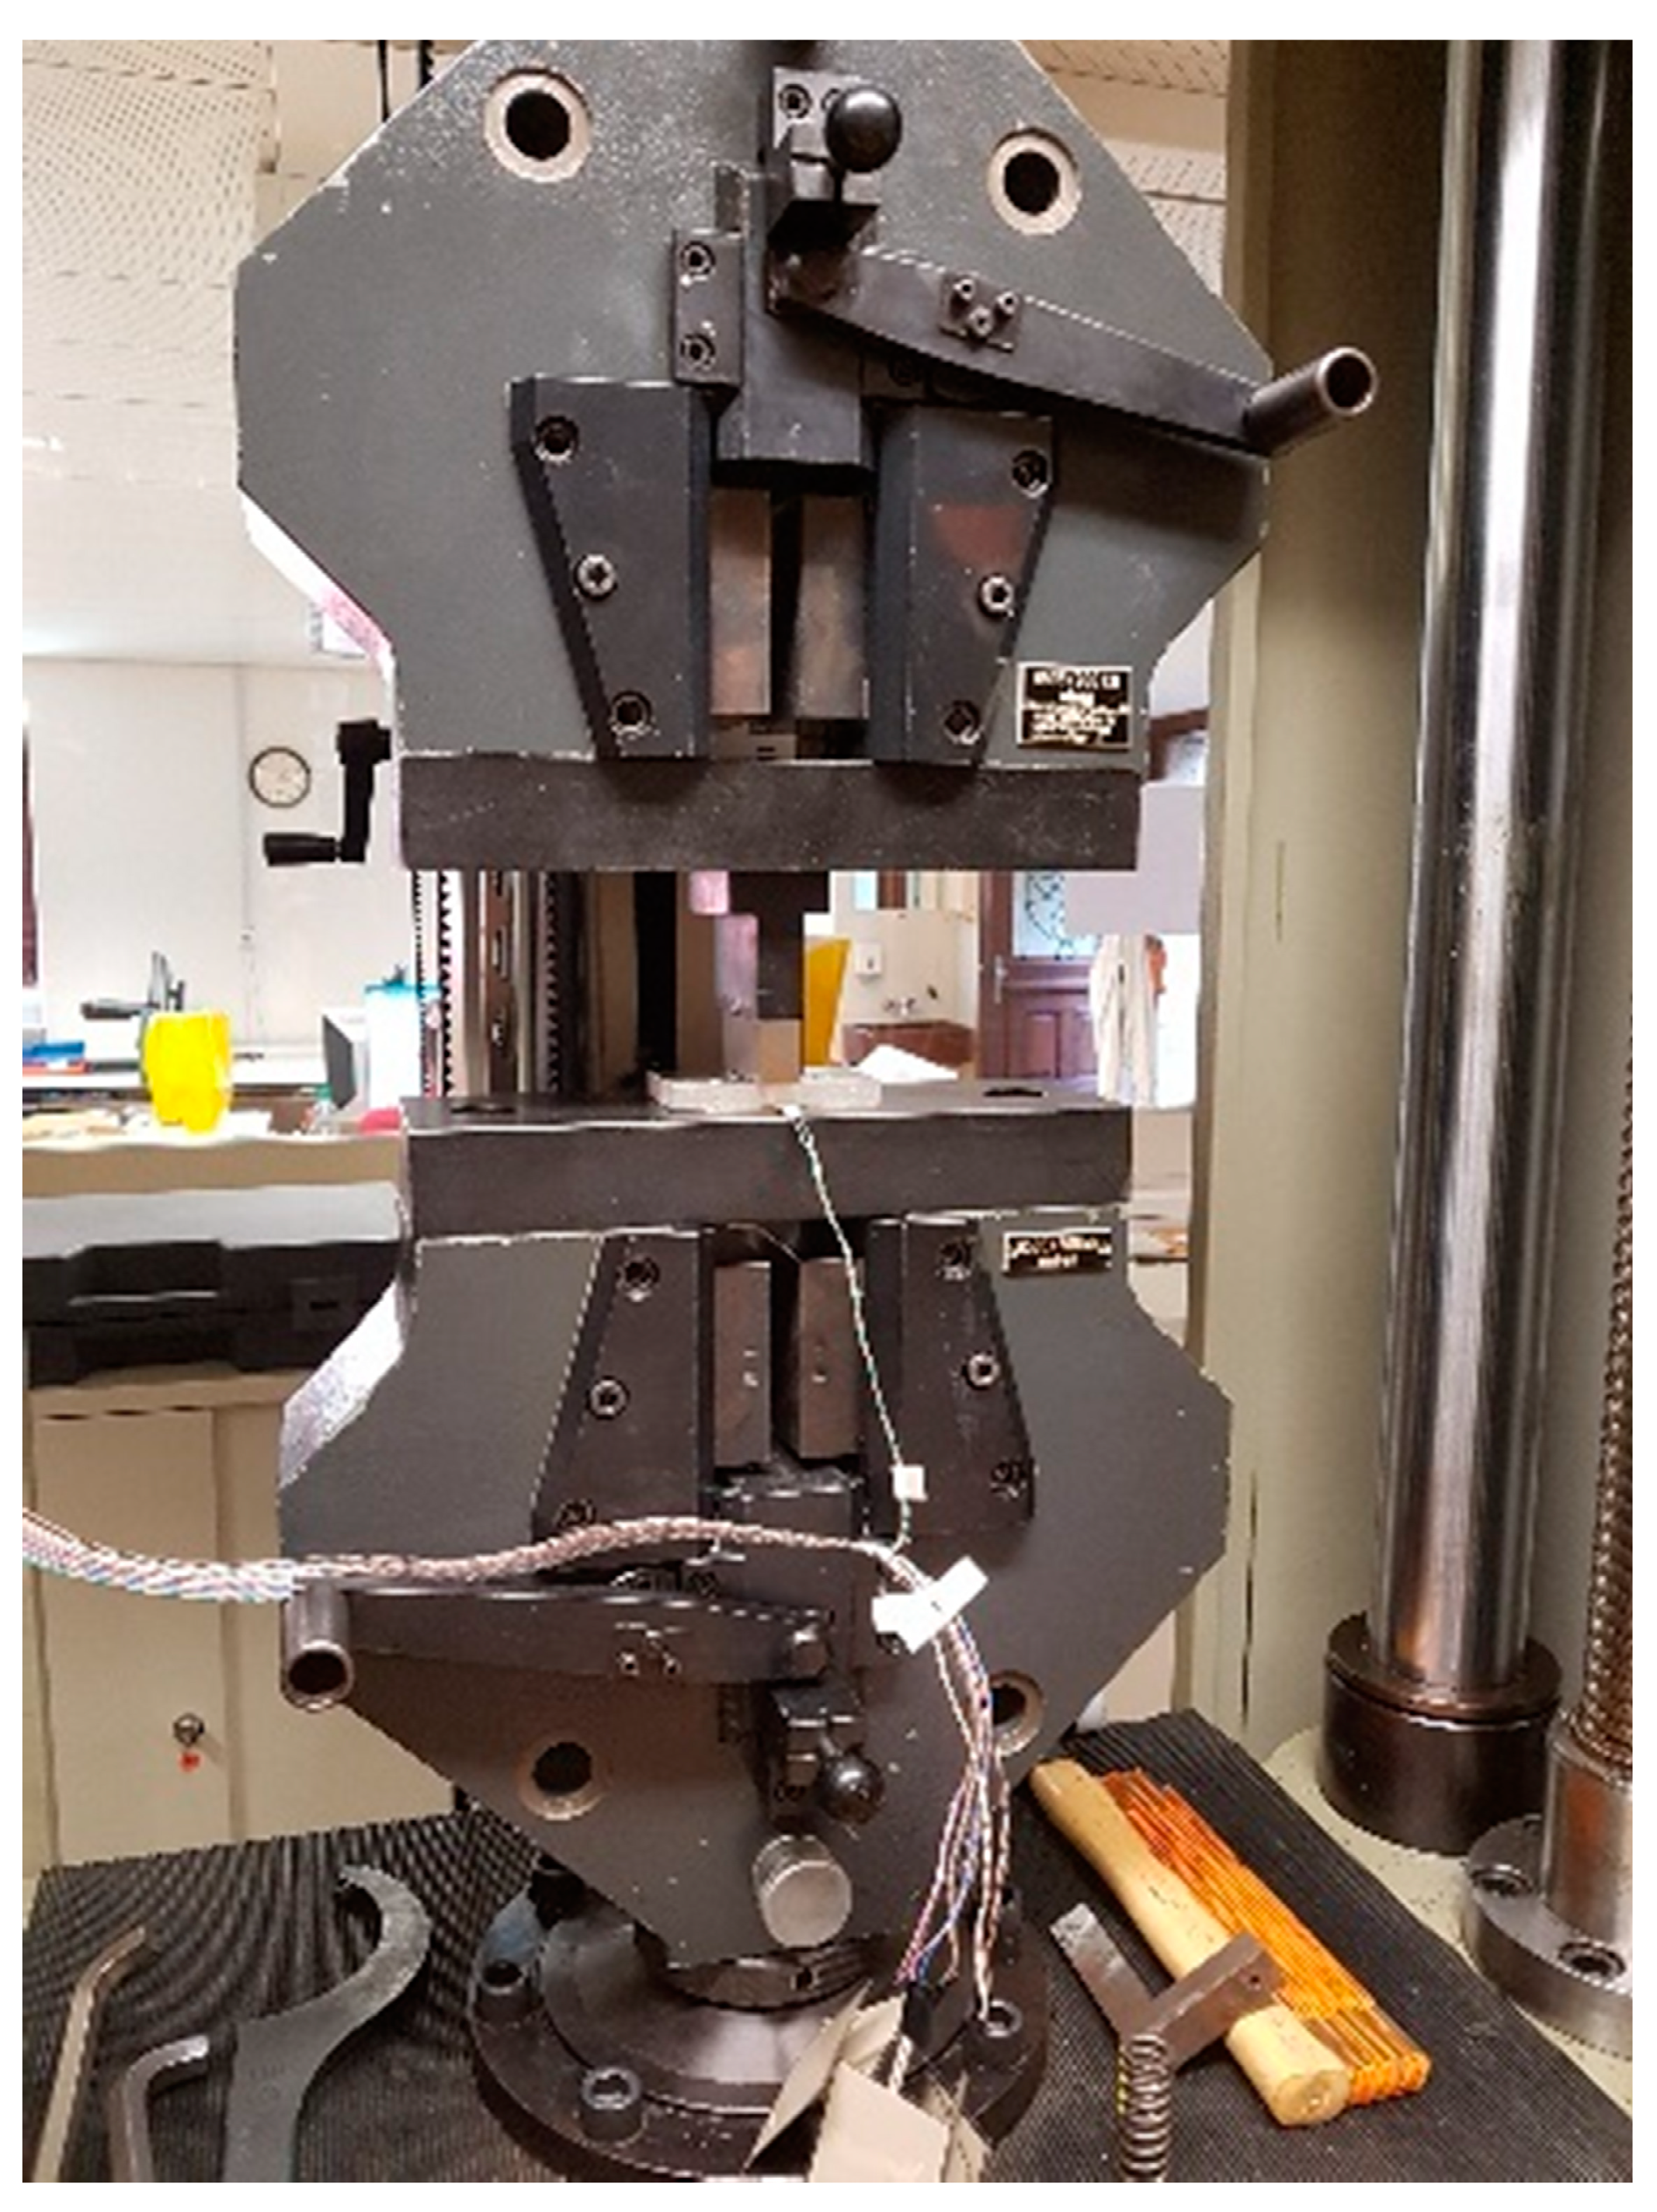
Previous to installing the Flexiforce A502 pressure sensor and the strain gauge load cell type 4576A, a regulated mechanical load was exerted using a compacting testing machine. These experiments were accomplished with the purpose of calibrating the pressure sensors and strain gauge load cell.
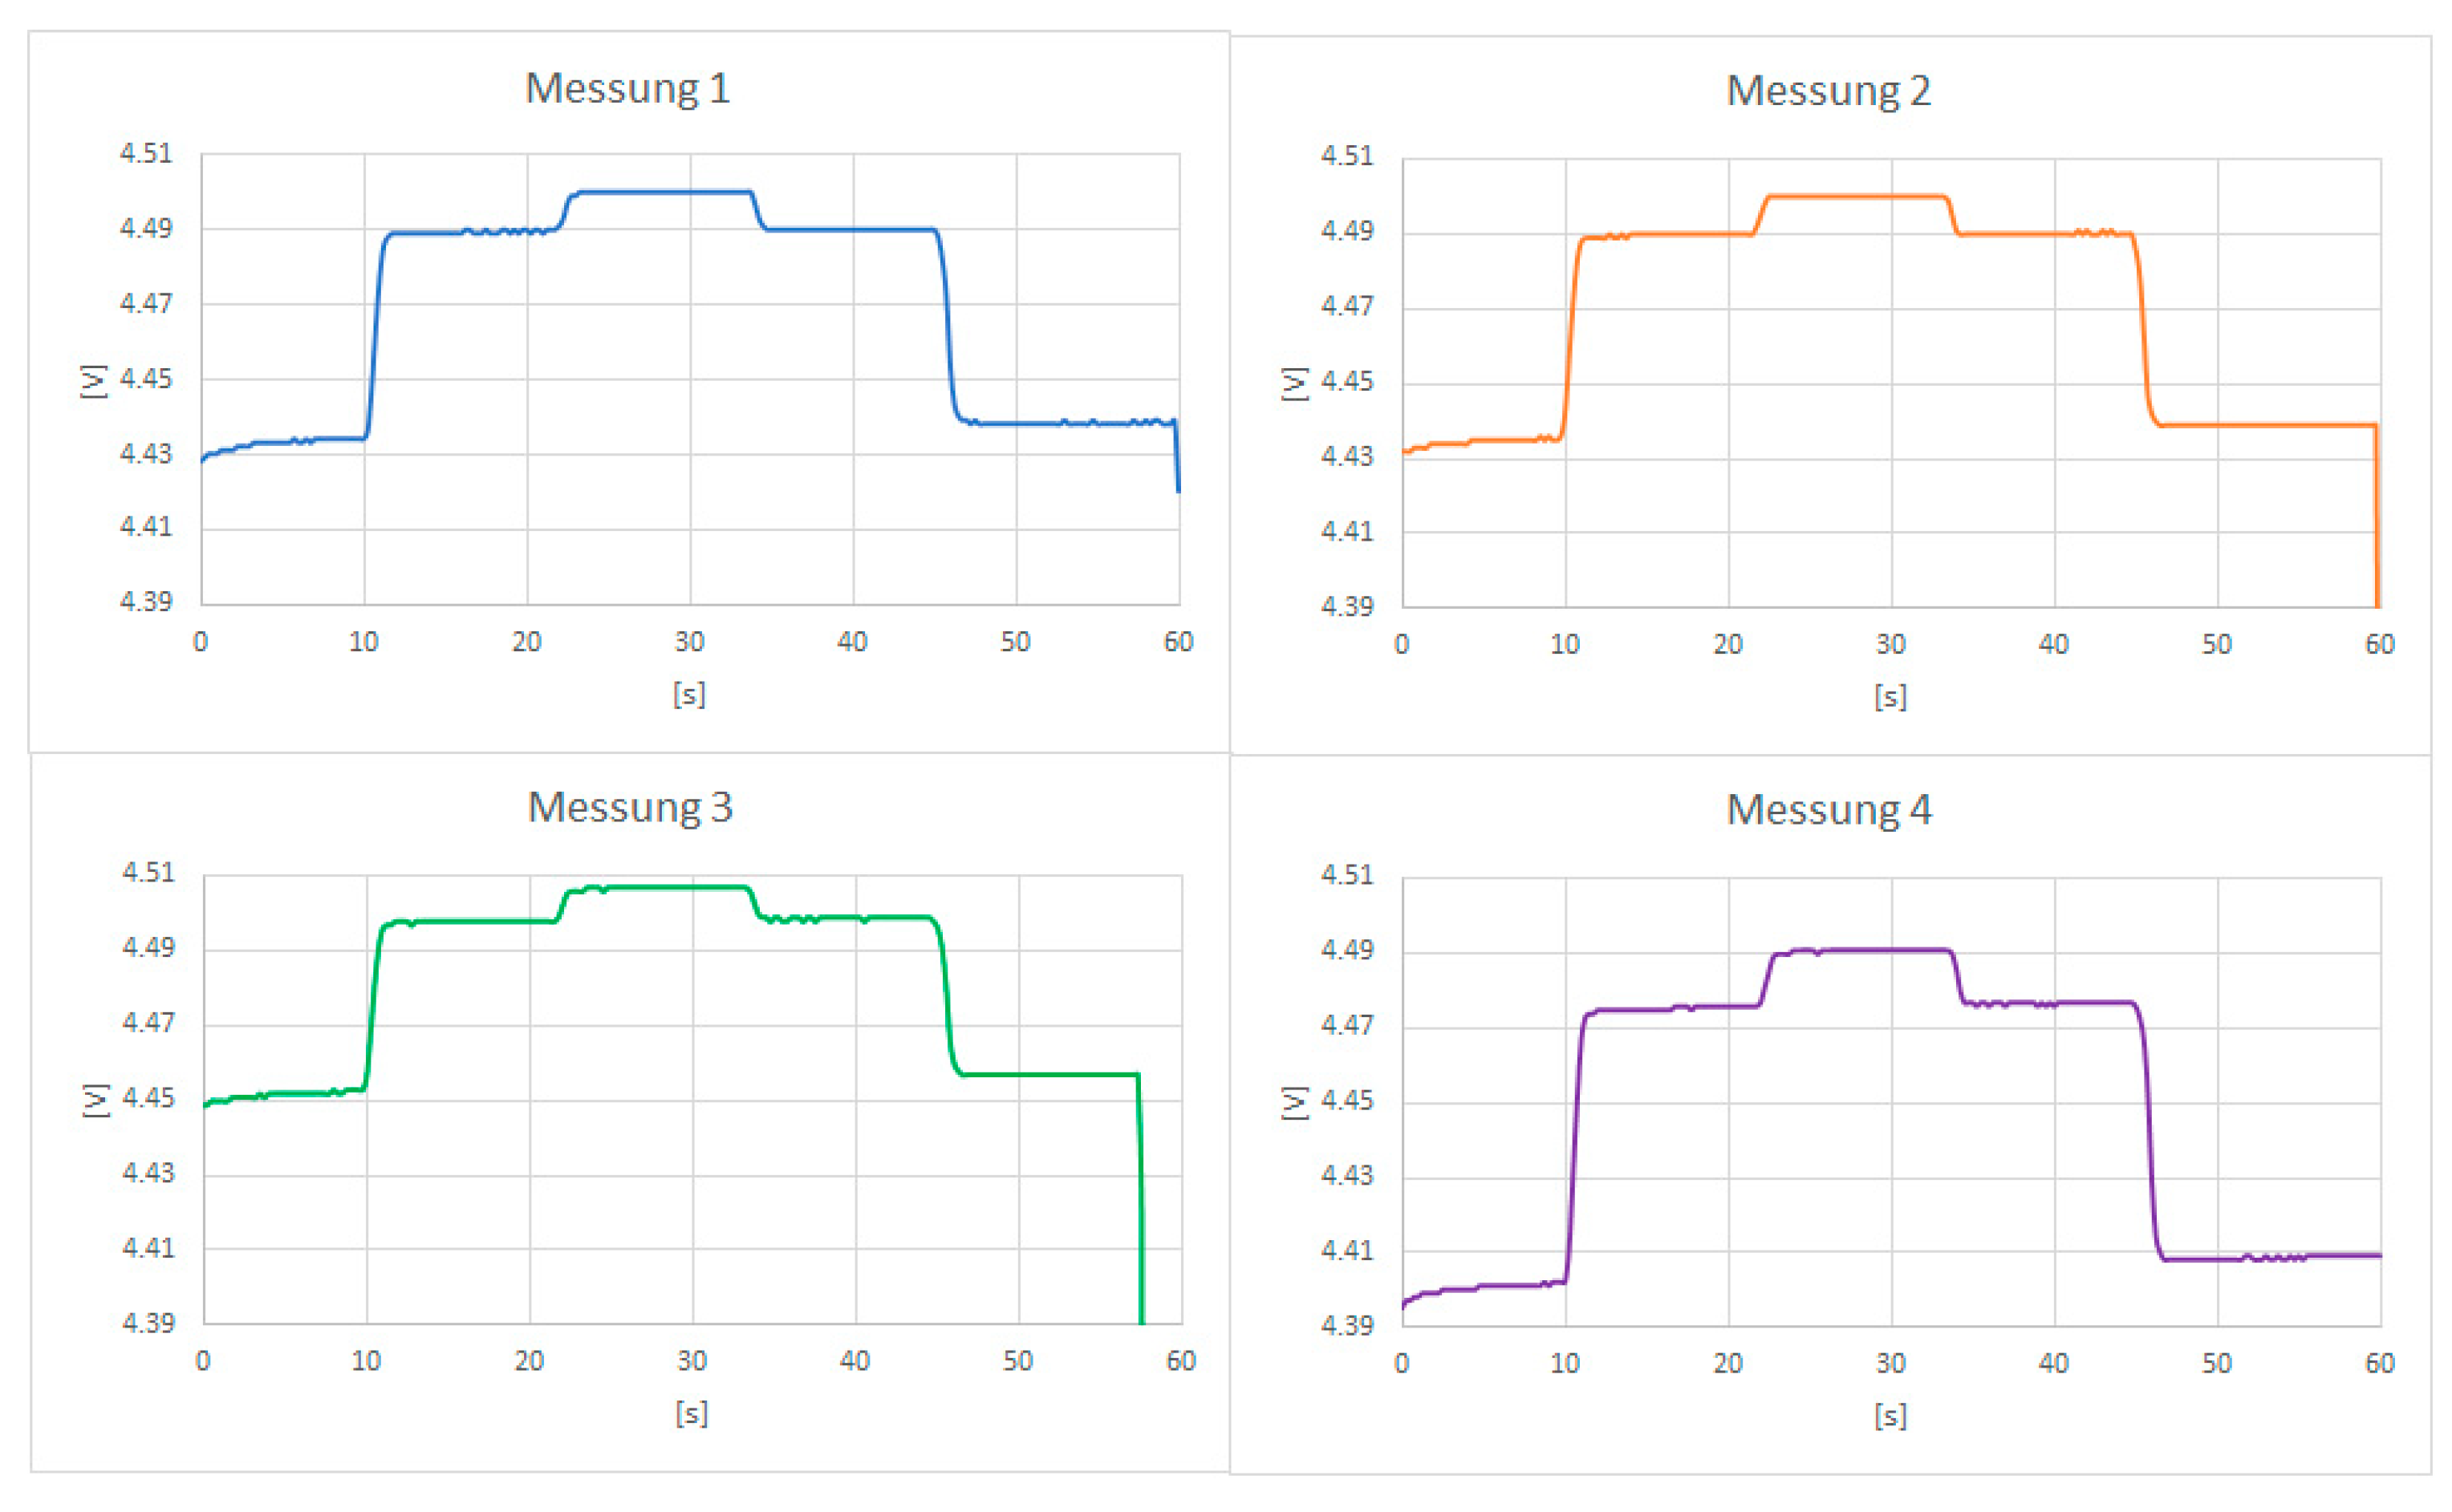
After the primary mechanical load was exerted, the nuts were slowly secured in their location. A thread-locking was added to stop the nuts from detachment and loosening throughout the battery cell cycle. Compacting testing machine and sensors for calibration is illustrated in Figure 8. The output voltage from compacting testing machine for Flexiforce A502 pressure sensors is shown in Figure 9. Calibration data for Flexiforce A502 pressure sensors and the strain gauge load cell type 4576A are demonstrated in Table 3.
5. Result and Discussion
5.1. Test Matrix
An external force was applied to the battery cell to imitate the force in a constructed automotive pack. The battery cell was sandwiched among two cast iron plates, each weighing about 20 kg to obtain a homogenous force distribution. The dimension of the plate is 200 × 220 cm2, as shown in Figure 3. The setup is comprised of a battery cell, plate, and pressure sensors (see Figure 4).
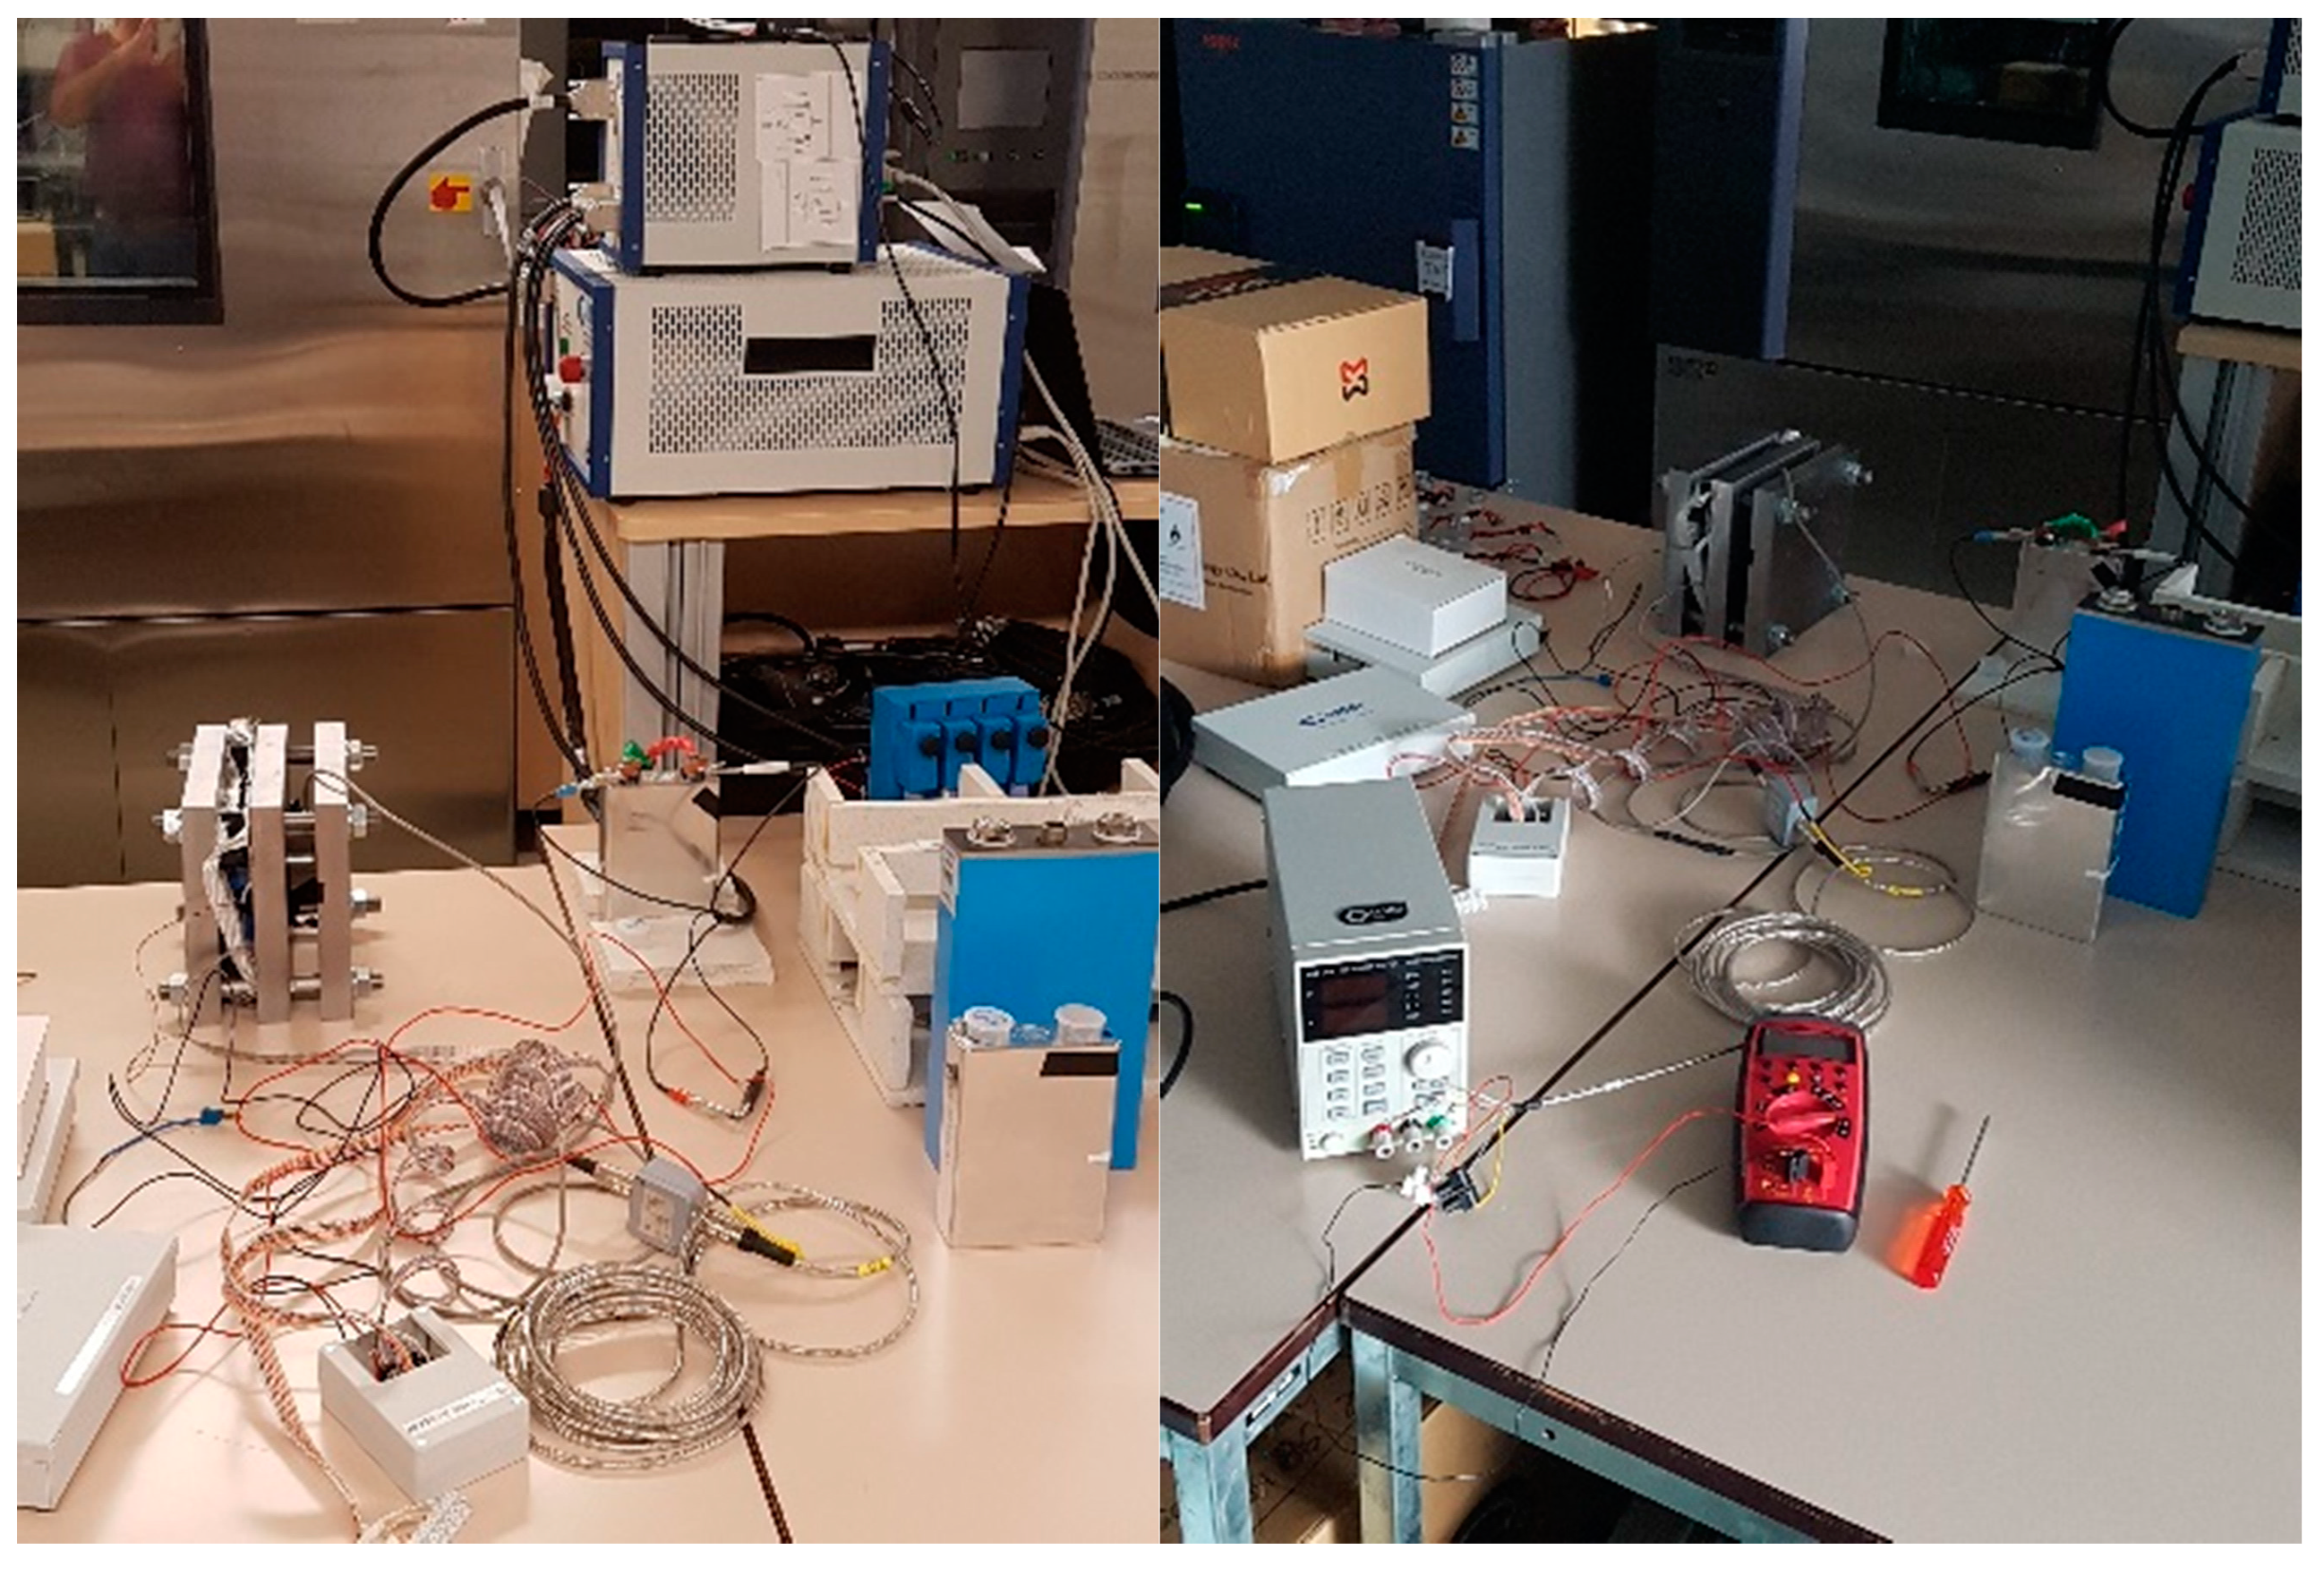
The needed force was gained by fastening the M8 bolts placed at each corner of the iron plates. Therefore, any fault of force on the battery cell surface was quantified and adjusted using the M8 bolts, which were located on the iron plates. The electrochemical impedance spectroscopy equipment and measuring devices which were linked to the setup are illustrated in Figure 10. For cycling experiments by the battery cycler, the entire setup was located inside a temperature chamber to maintain the temperature fixed at 25 °C.
Strong packaging is needed for safety and performance features mostly attributable to their small mechanical steadiness to prevent stratification during battery operation. External forces influence the behavior of the batteries. Therefore, in this investigation, the battery cell was cycled and characterized with externally applied force.
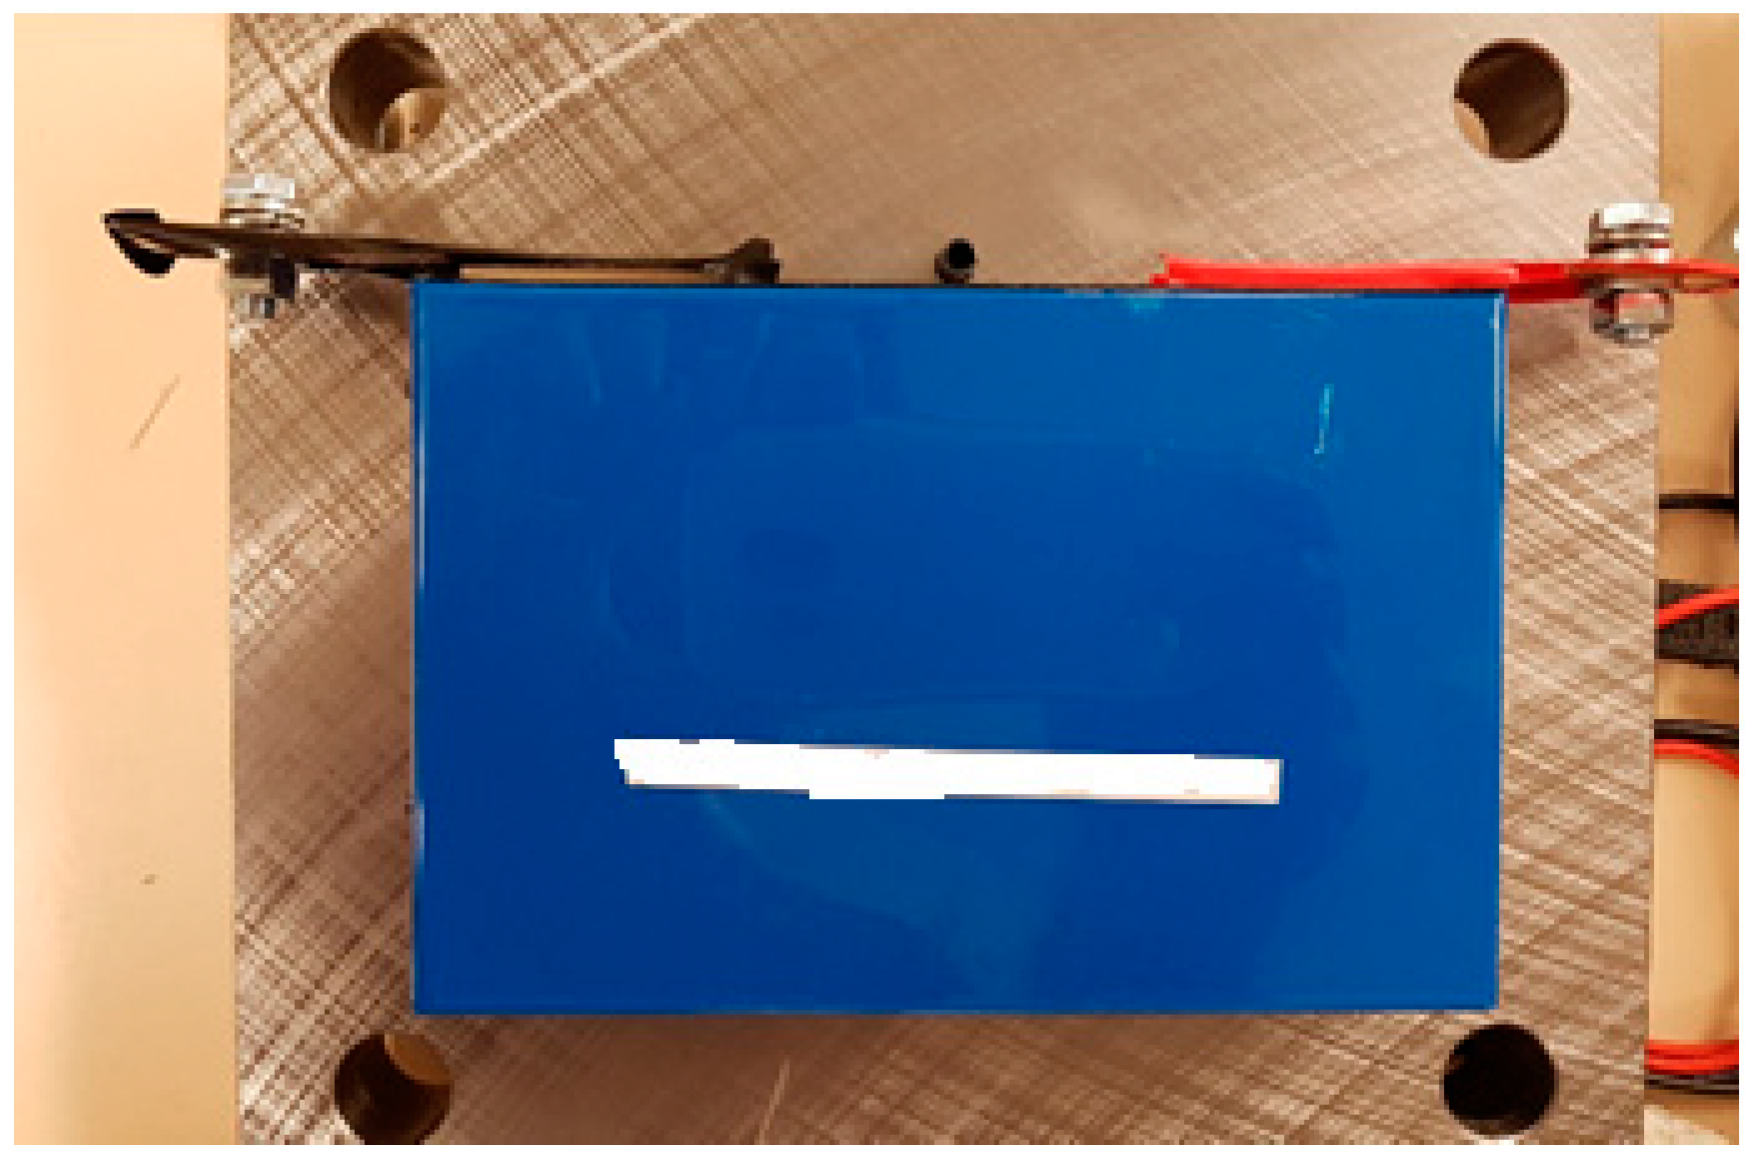
A prismatic lithium-ion power battery cell with a size of 150 × 100 × 27 mm3 and a nominal capacity of 51 Ah was used. The maximum and minimum voltages are 4.2 V and 2.8 V, respectively. The investigated battery cell is illustrated in Figure 11.
FlexiForce A502 sensors were selected. More specifically, two 8-pack FlexiForce A502 sensors were provided, which would create enough room for performing the first experiments under pressure. Each sensor was connected to a homemade system to read out the Vout independently. The sensors were calibrated individually using an external pressure sensing unit. Electrical and mechanical data were gathered every 10 min. The electrochemical impedance spectroscopy measurements were done at room temperature. The battery cells were pressed among the two insulating plates at specific pressure throughout the electrochemical impedance spectroscopy experiment. Pressure sequences were increased slowly and gradually, and a 24 h rest period was considered between each experiment to stay away from the irreversible destruction of the battery cells.
Electrochemical impedance spectroscopy was accomplished with a 0.6 Amp root-mean-square sinusoidal current and in the frequency range between 100 mHz and 10 kHz. These measurements were accomplished at room temperature and different state of charge. The electrochemical impedance spectroscopy procedure, which was accomplished by the Gamry, is listed here:
- Electrochemical impedance spectroscopy at actual state of charge (50%)
- Charge until state of charge 100%
- Electrochemical impedance spectroscopy at state of charge 100%
- Discharge of the battery cell at 10% steps (electrochemical impedance spectroscopy at each state of charge, from 100% to 20%)
- Charge the cell to 50%
5.2. Electrochemical Impedance Spectroscopy Measurement
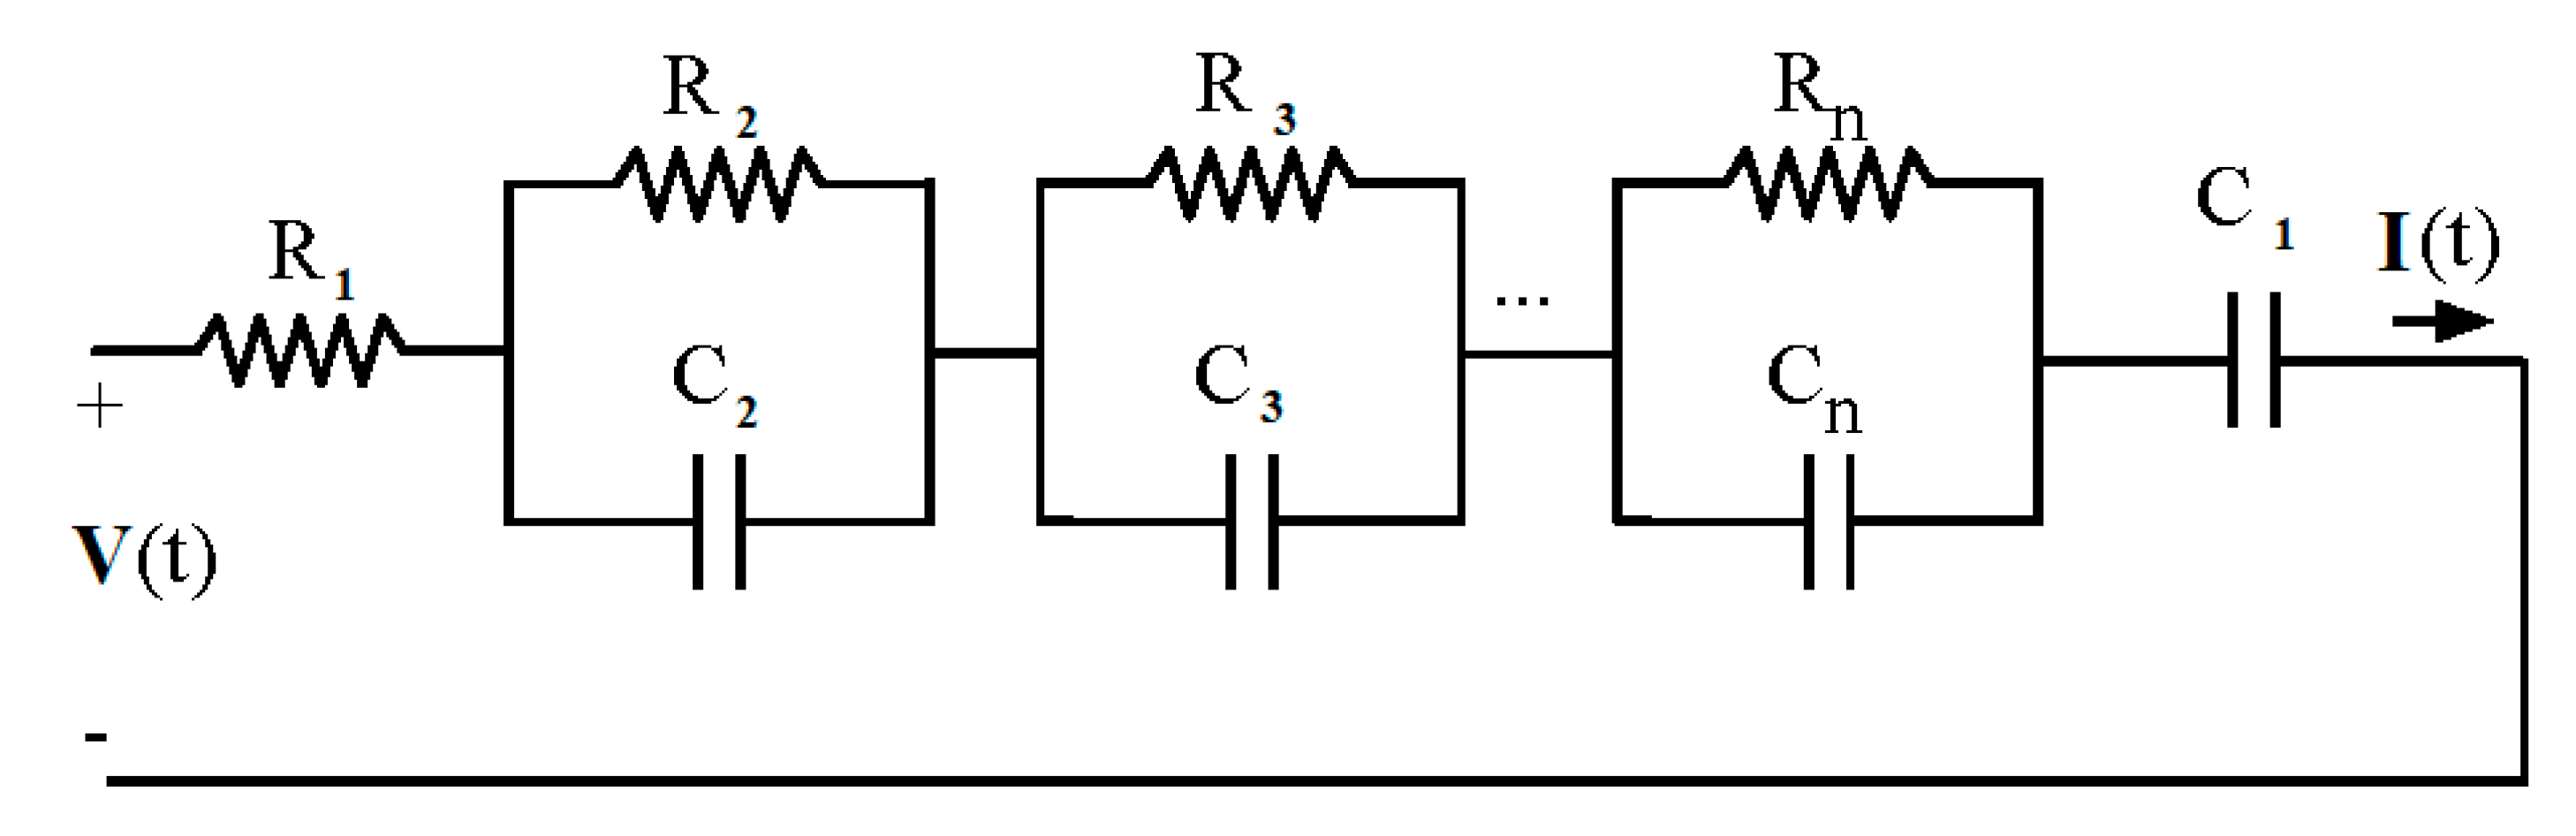
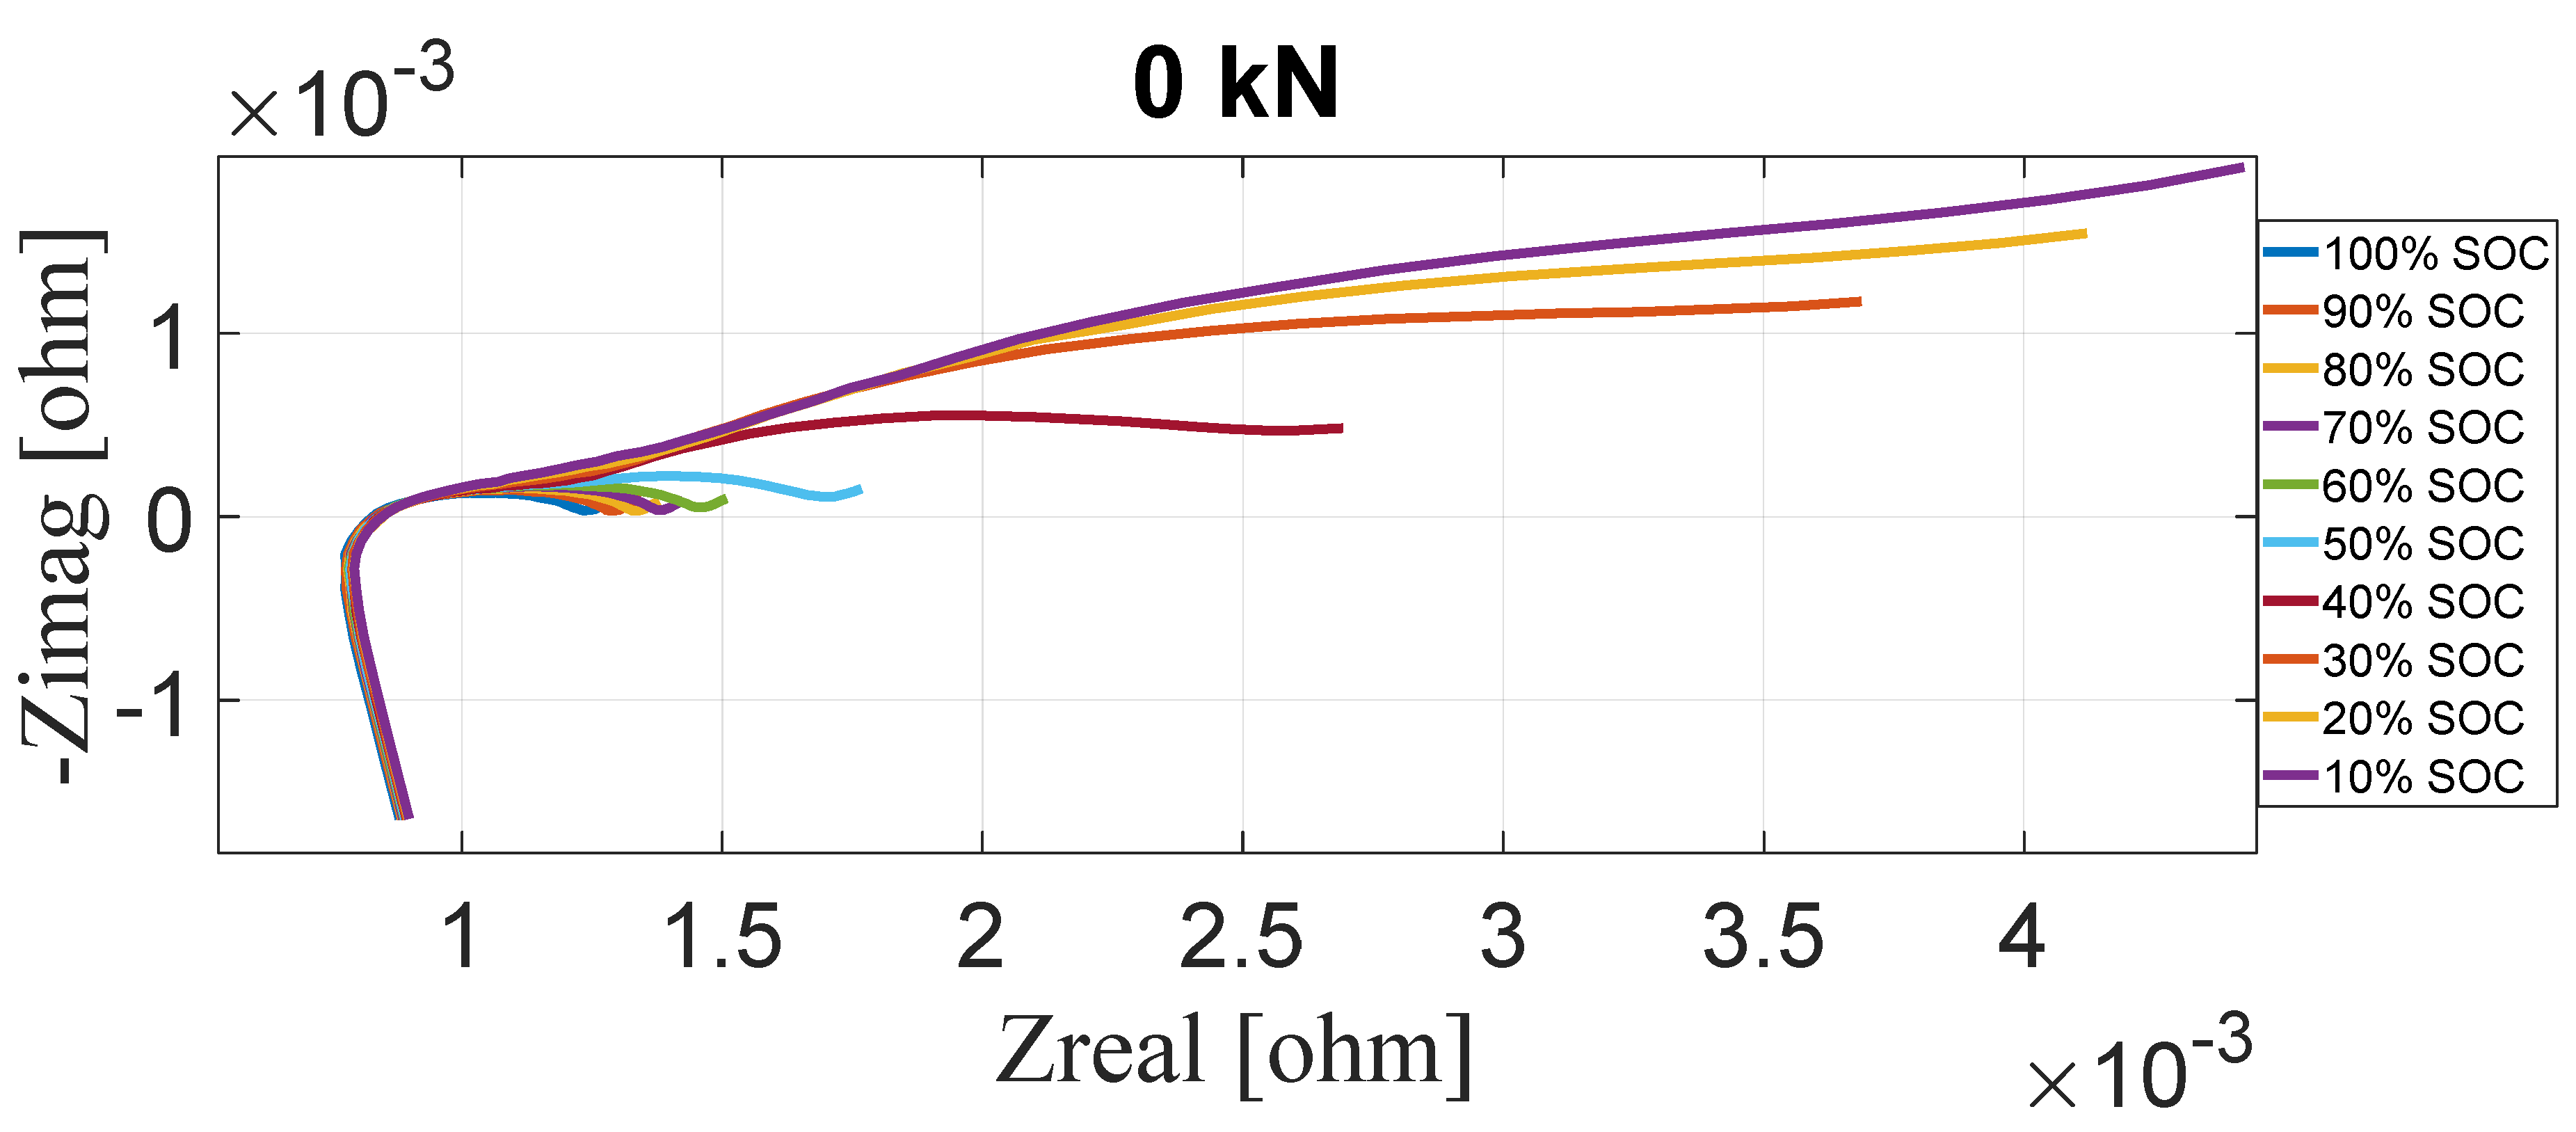
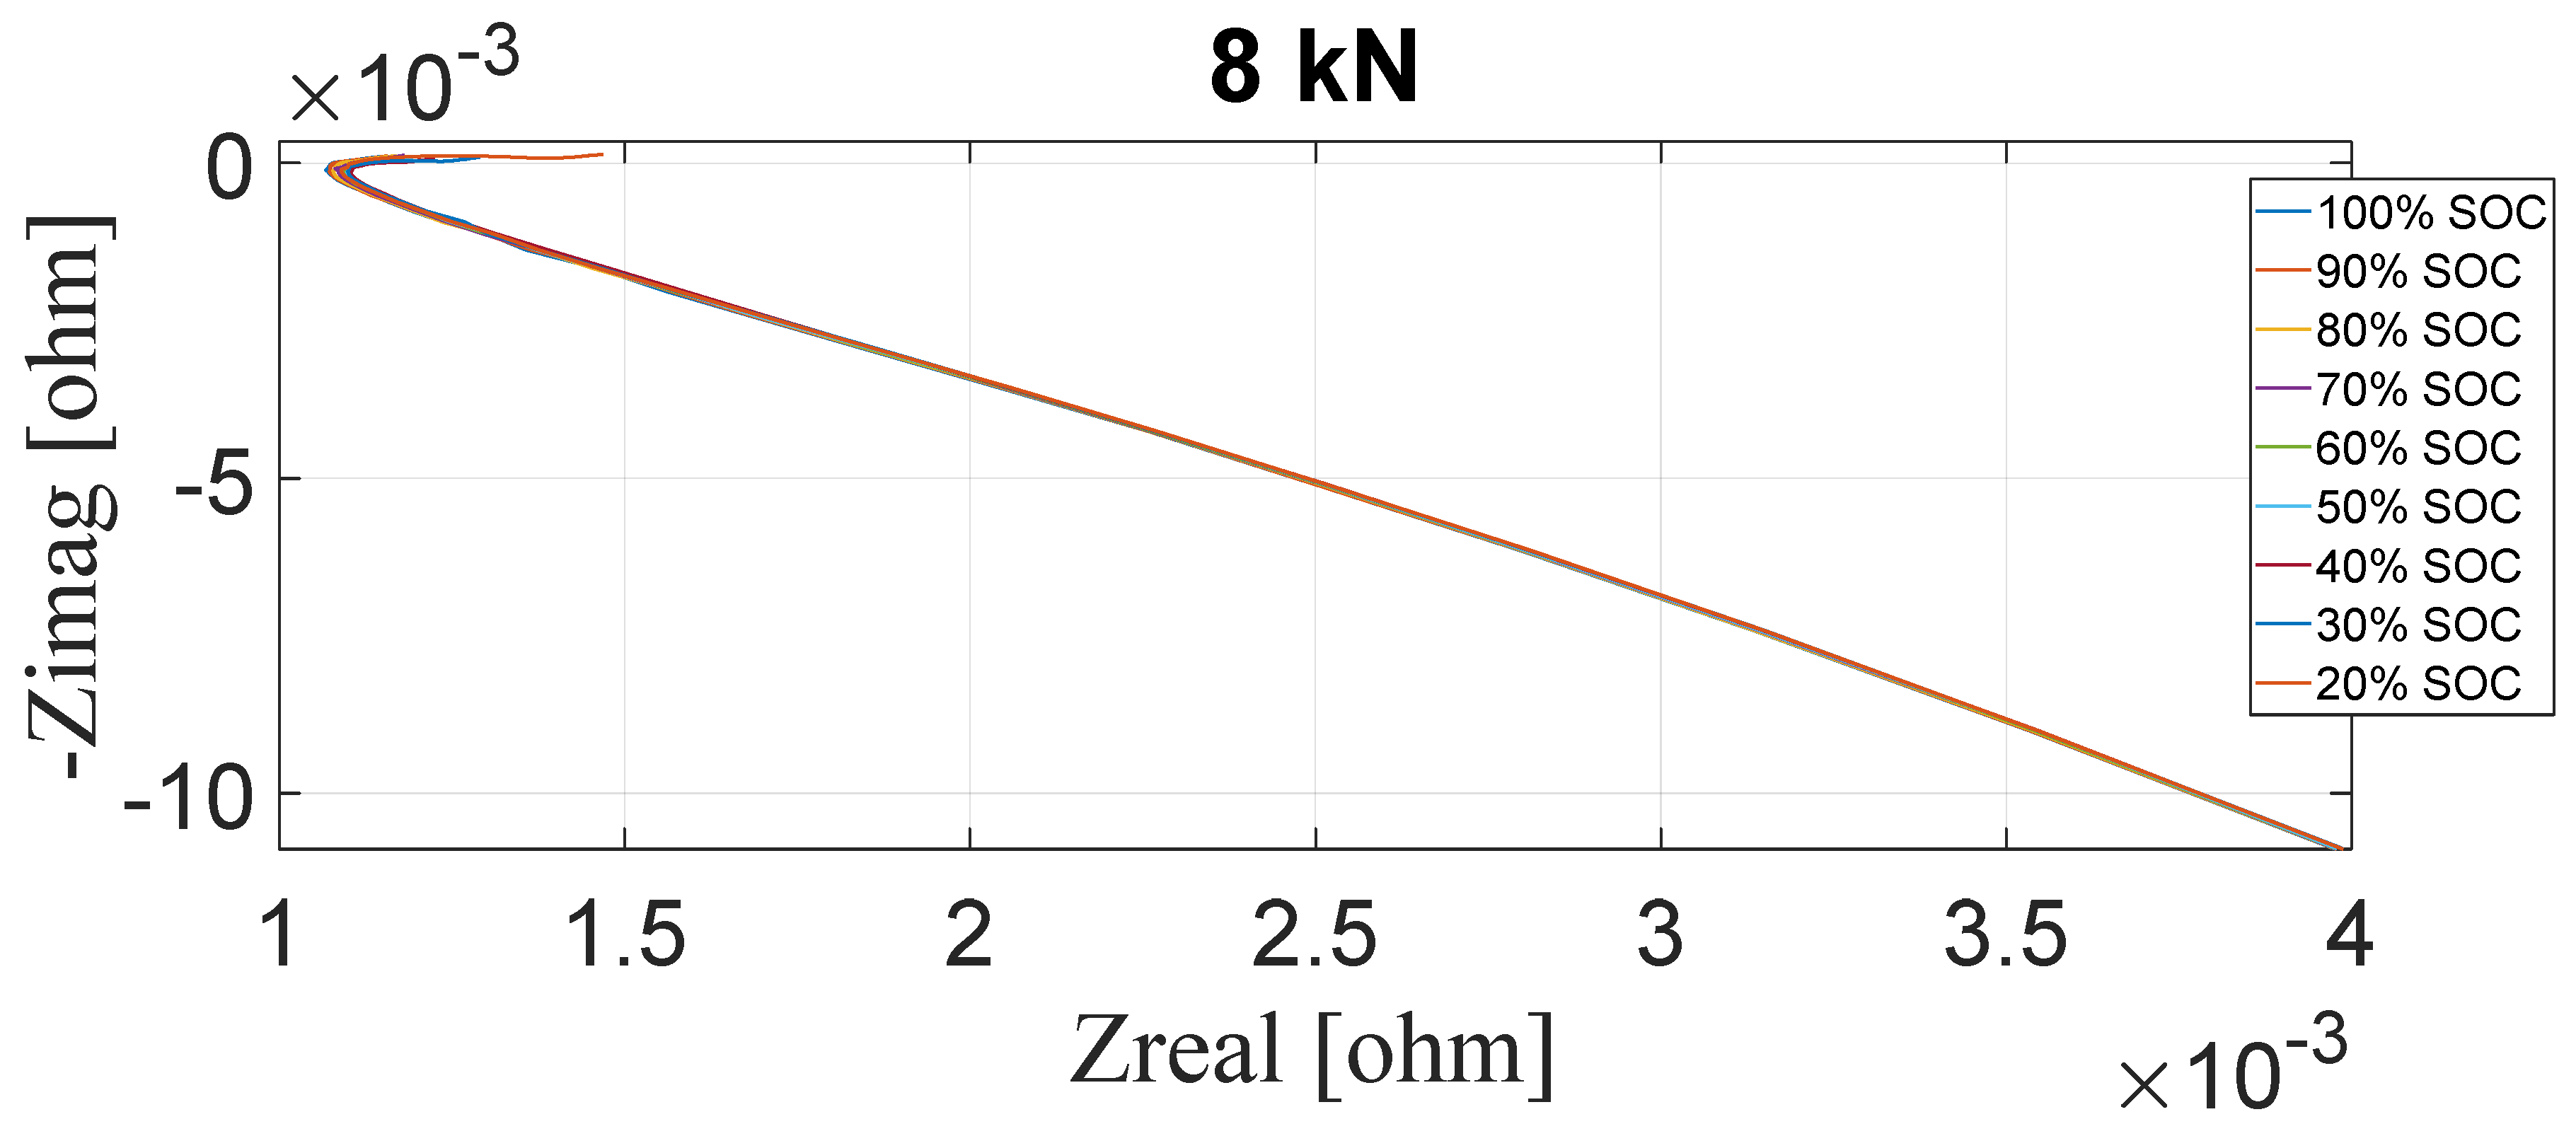
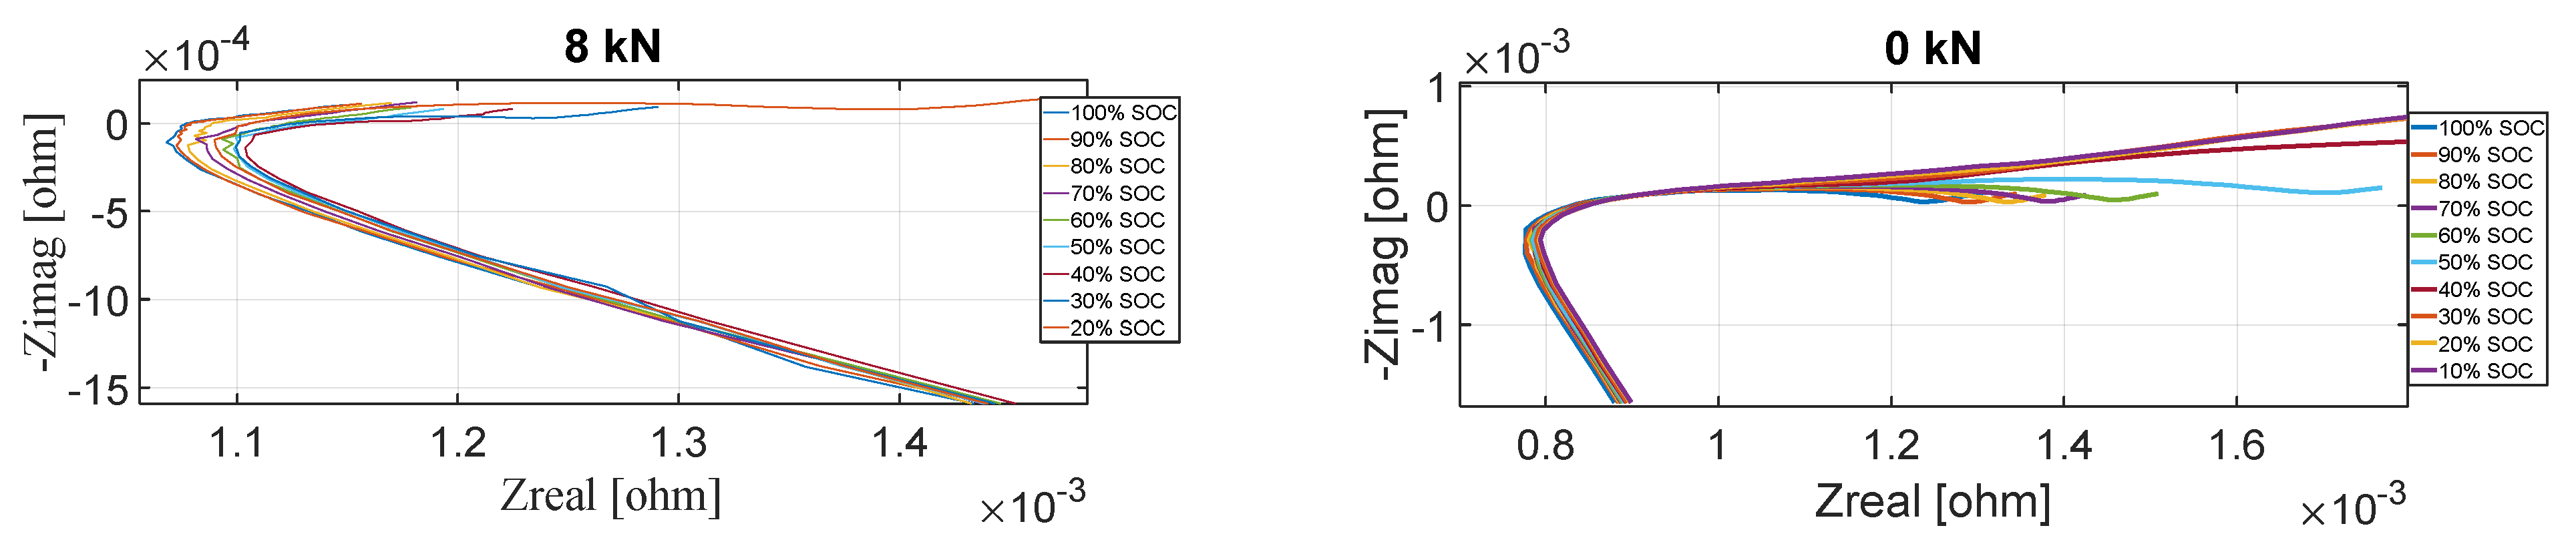
Figure 12 demonstrates the equivalent circuit diagram. Different quantities of resistor (R)–capacitor (C) networks were used. Parameters of different equivalent circuit models of the battery are shown in Table 4. Figure 13 demonstrates the feedback of impedance experiments in the Nyquist plane for the battery cell at different state of charge in the absence of external pressure. Figure 14 demonstrates electrochemical impedance spectroscopy results of Li-ion battery cell under an external static force equal to eight kN for different state of charge (SOC). The value, as mentioned earlier, is representative of real automotive conditions. The profile of these spectrums appears different compared to the case without external pressure. The figure could be divided into two sections. In the first section, there is a significant value, which is the amount of crossing with the real axis (R1), and it appertains to the aggregate of inner ohmic resistances of the separator, electrolyte, cabling, and current collector. The arc might correspond to the interface among the active material and electrolyte or the solid electrolyte interface. It could also represent the charge transmission mechanism at the electrolyte-electrode interface. The second section corresponds to lithium-ion transmission, which is mostly attributable to relocation and diffusion phenomena [32,33]. For a better view of the results, zooming in on the electrochemical impedance spectroscopy results for both cases (Figure 15). The most considerable change was seen in the Warburg tail.
It is essential to comprehend the solid constraint’s fixed thickness character to comprehend the restrained battery cell’s stress development plots. The constraint, which is illustrated in Figure 4, restrains the battery cell from keeping a fixed thickness so that stress and not thickness are free to expand. Consequently, stress evolution is relevant to the cell thickness variations that would happen in the nonattendance of a solid constraint, accompanied by the quantified stress alteration being identical to the exerted stress essential to invert the battery cell thickness alteration. The fixed thickness scheme contributes an okay explanation of batteries, which are mainly located in solid constraints.
In this investigation, two critical parameters were employed to study the achieved data from electrochemical impedance spectroscopy measurements. The initial parameter is R1, which is the amount on the real axis with the axis’s impedance spectrum intersection. This resistance is commonly named the ohmic contributions. The secondary parameter is R2, which is the amount of battery impedance on the real axis while the negative imaginary section reaches a local minimum after a local maximum. R2 is usually referred to as the battery cell’s total resistance because it contains electrochemical impedances and ohmic resistance [34].
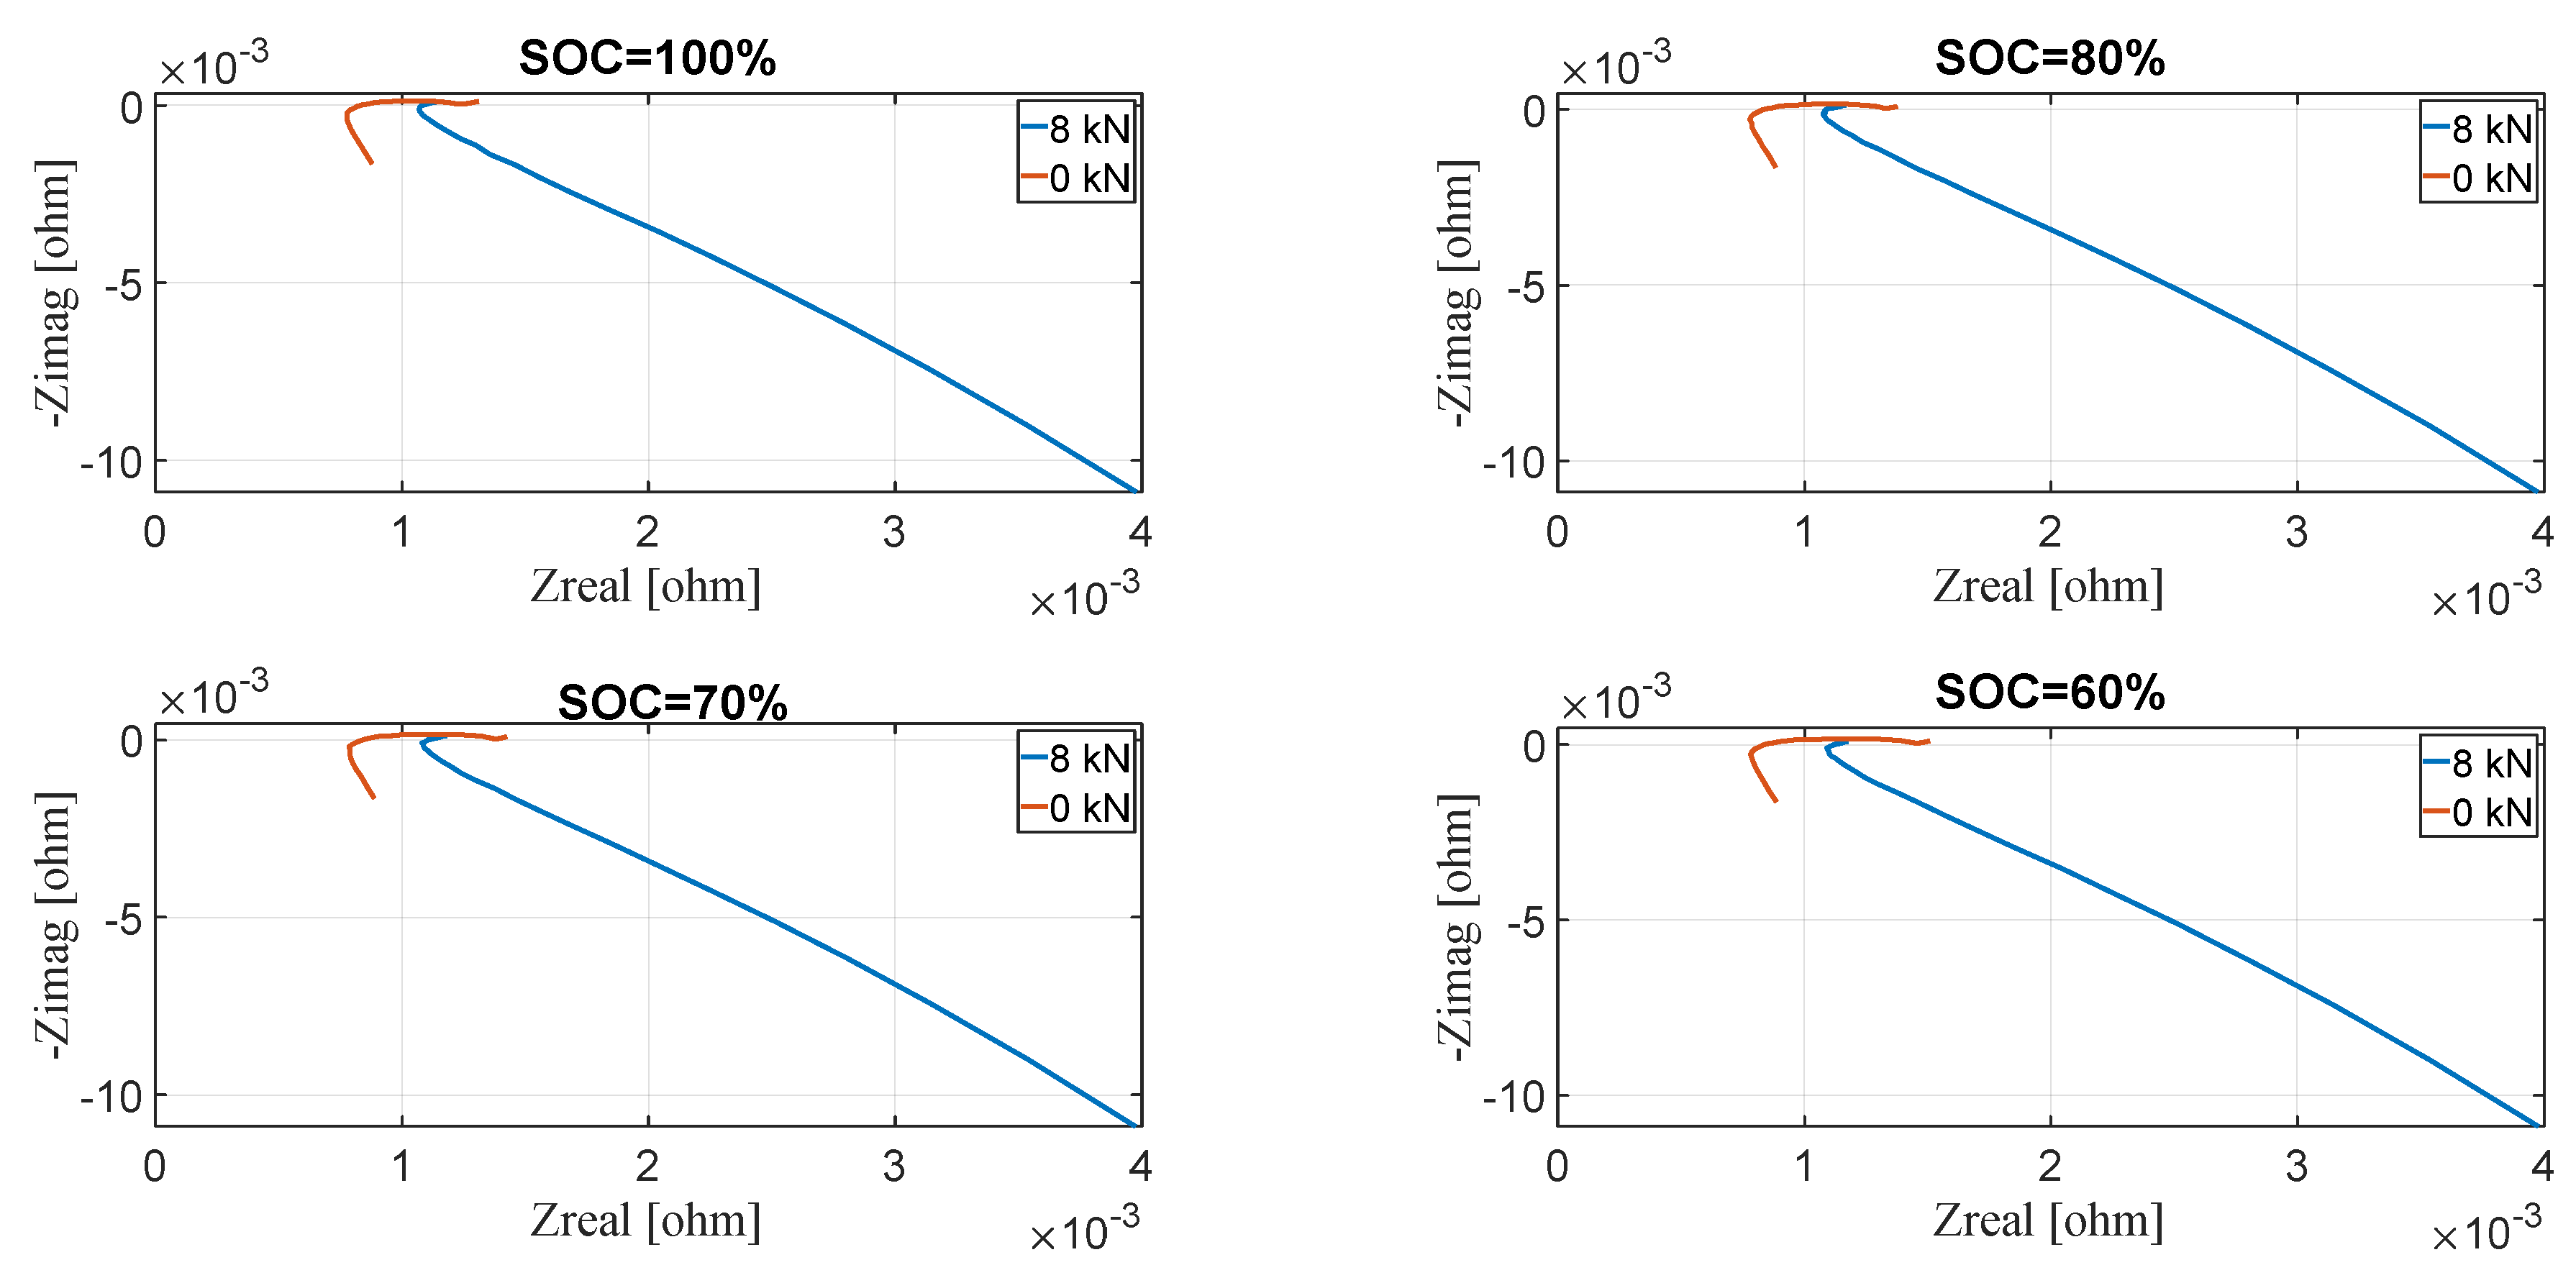
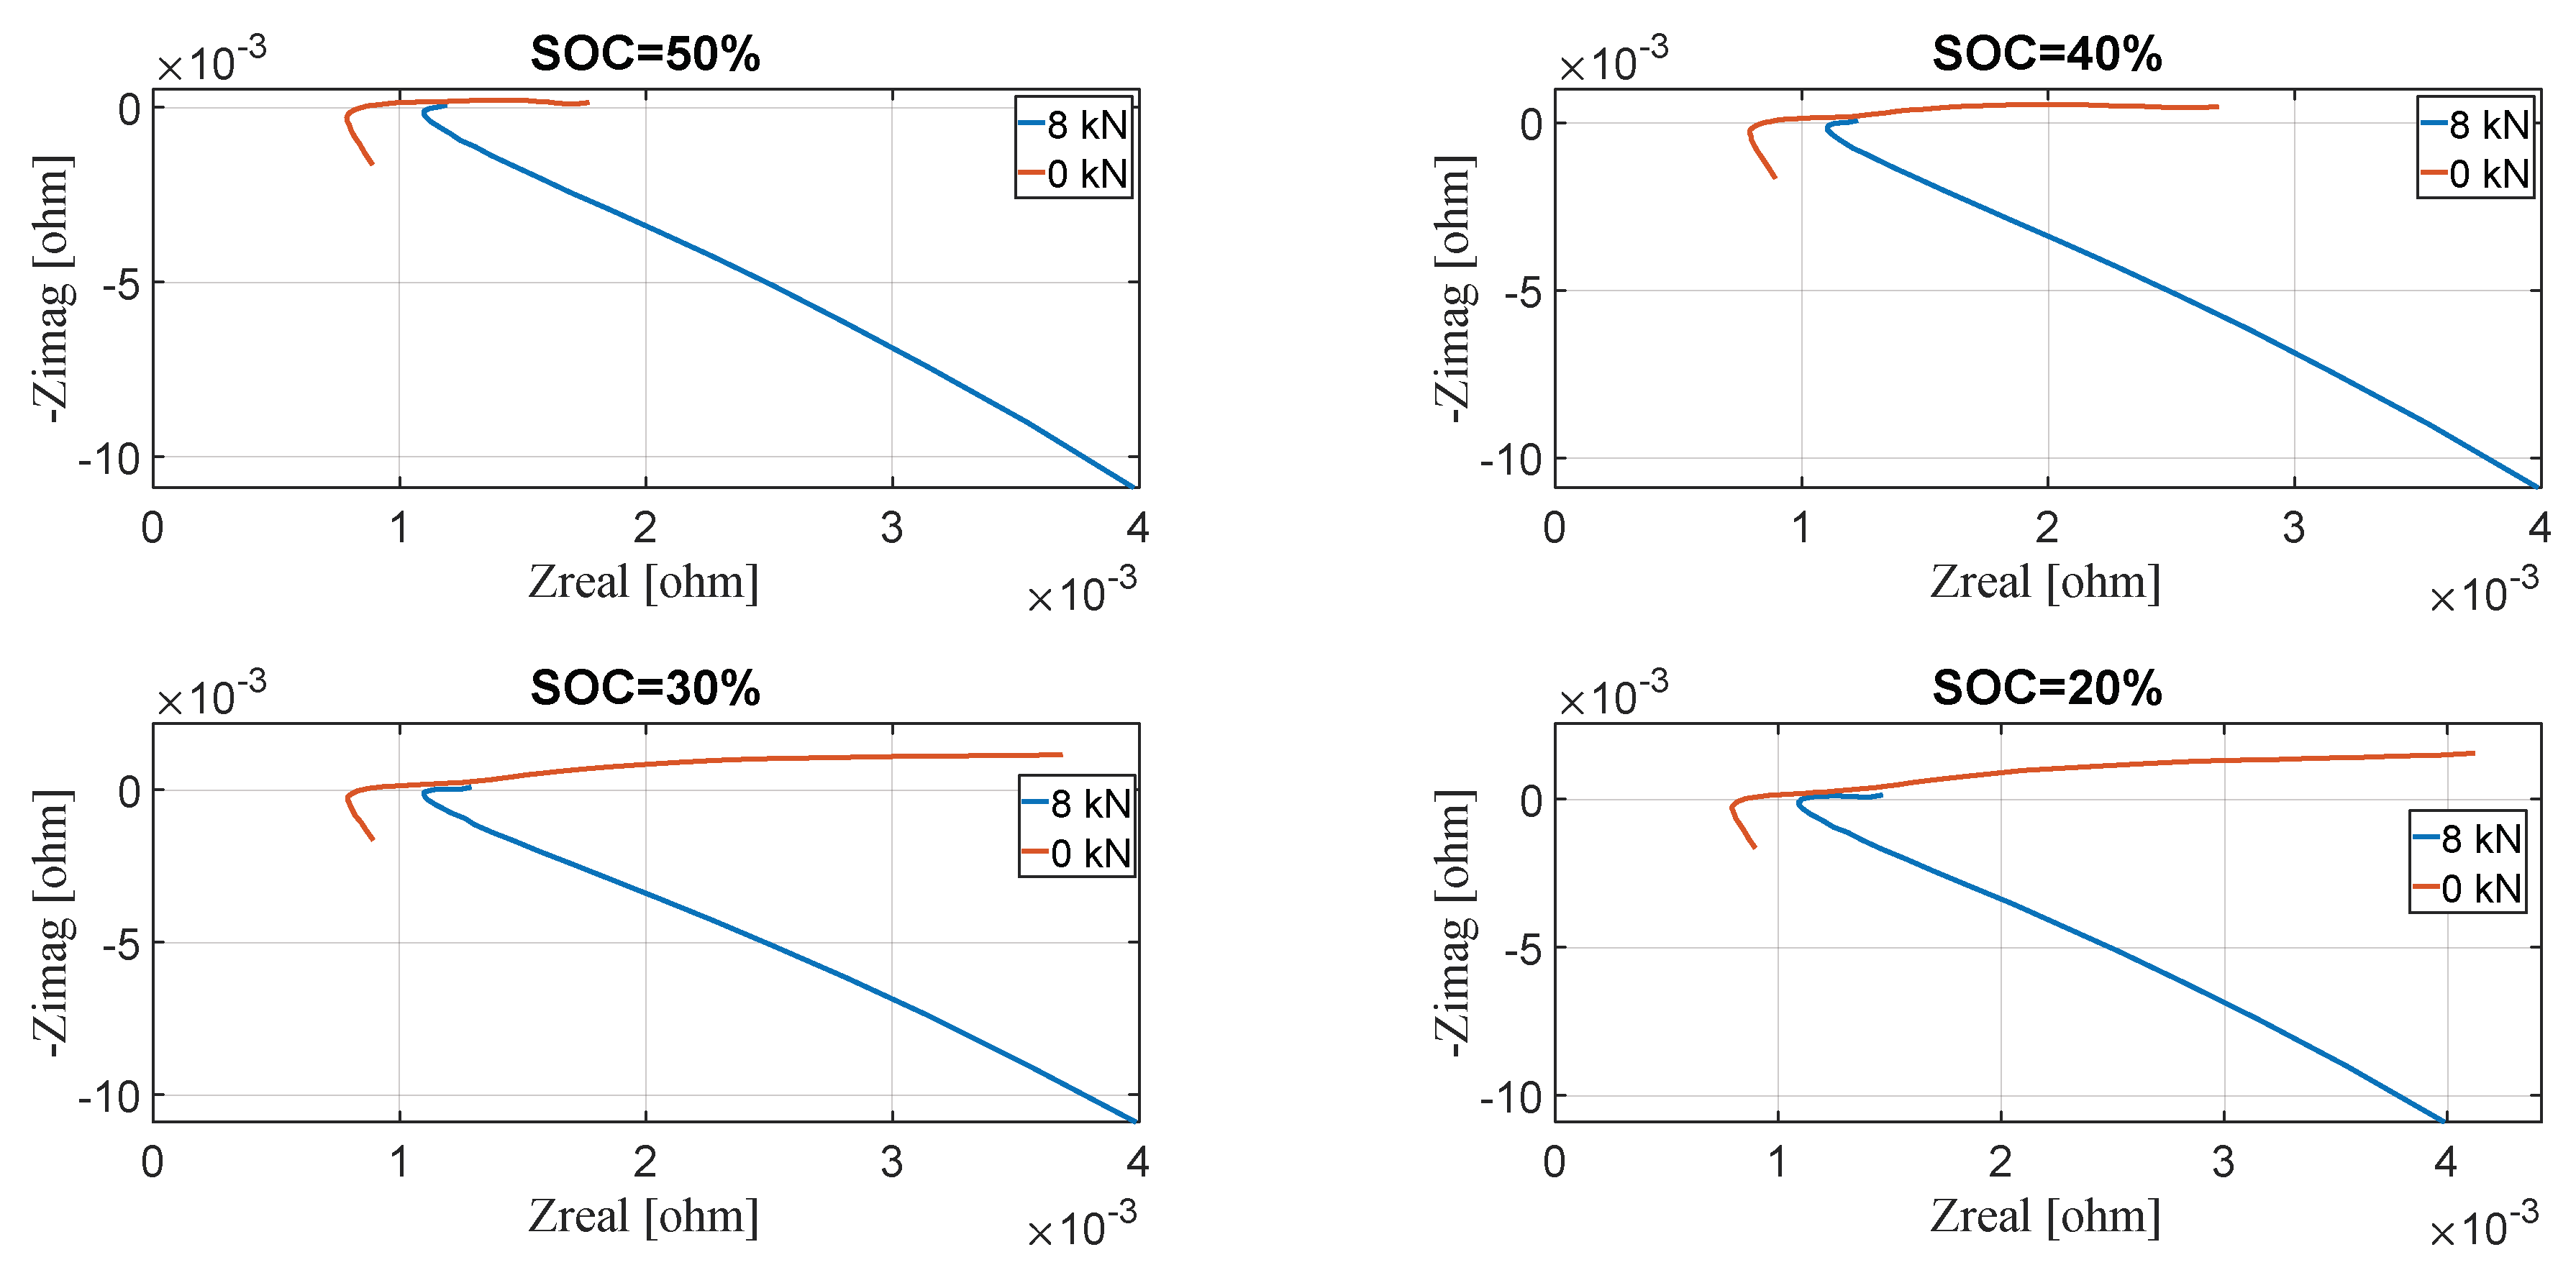
Comparison of electrochemical impedance spectroscopy results at a different state of charge in the present and absence of external pressure for the battery cell in the Nyquist plane is illustrated in Figure 16. As could be seen from the figures by increasing the external force, R1 increased with external force at the investigated temperature. Notwithstanding, R2 decreased as external force rose at the investigated temperature. The aforementioned demonstrated that external force altered the bulk transmission characteristics of the battery cell’s active materials [34].
A considerable change was seen for R1. Accordingly, the external static force appeared to significantly influence the separator, electrolyte, cabling, and current collector properties. Consequently, it could be assumed that this amount was influenced by external pressure. Figure 14 demonstrates that the diffusion part moves left when decreasing the state of charge in load condition. This movement appears to begin from the commencement of different sections for the dissimilar state of charge. It could be concluded that the external pressure in this experiment could increase the ion diffusion in the electrode [35].
5.3. Impact of External Pressure on Performance
Figure 15 characterizes lithium-ion battery impedance with and without external force for a new lithium-ion battery in a Nyquist plot. An overall growth of impedance accompanied by the external force could be seen. The big frequency resistance, which is the intercept with the real axis, was considerably influenced by the external force. This finding was in agreement with preceding investigations. The semi-circle diameter, nevertheless, and the protraction of diffusion tail enhancement accompanied by the external force, demonstrated that the mass transport and interfacial kinetics of the electrochemical reaction was preventable with external force. This finding was in agreement with preceding investigations [7,8,36]. Variation in the big frequency resistance of the lithium-ion battery with external force might be brought about through discrepancy in the contact resistance amongst various ingredients of the lithium-ion battery. In addition, it can be caused by compression of the electrodes and separator deformation [7]. The double layer capacitance enhanced as the time charge transfer resistance lessened. The aforementioned led to a lesser semicircle in the Nyquist plot. The aforementioned outcomes were in agreement with previous studies [36,37,38] that illustrated how separator creeps arose when while external compressive loads were applied.
5.4. Influence of State of Charge
This section studies how Galvanostatic electrochemical impedance spectroscopy evolves over the state of charge, when an external compressive load is applied. The impedance following and prior to applying external compressive load in Nyquist plane at different state of charge ranging from 20% to 100% is presented in Figure 16. An alteration of impedance was recognized simultaneously as external compressive load was applied to the lithium-ion battery. There was a negligible variation of Ohmic resistance while external compressive load was applied at different state of charge. The corresponding minor variation did not depend on state of charge level. It can be observed that ohmic contributions did not change with states of charge. As the investigated prismatic lithium-ion battery cell was new, ohmic contributions may represent solid electrolyte interfaces. A considerable change was seen in the low frequency regions, specifically at lower states of charge. The aforementioned may be corresponds to the transport of lithium-ion principally attributable to migration phenomena and diffusion.
6. Conclusions
Usually, for the implementation of lithium-ion cells in different applications, they experience expansion during charging and discharging cycles. Pressure loads are applied to battery cells in automotive battery packs to avoid contact loss among battery pack ingredients and misshaping during operation. Notwithstanding, robust packaging is essential for safety and performance standards because of their small mechanical stability, which could be the reason that they are compressed in the battery pack. A Tekscan Flexiforce pressure sensor was installed among the upper-pressure plate and battery and also among the lower pressure plate and battery. Many thanks to this novel and dedicated setup, the fastening of four screws enable controlling the battery’s applied pressure. It should be noted that before fastening the nuts, a regulated mechanical load was exerted by using a compacting testing machine for calibration. A test rig was designed and made, and different experiments were accomplished to study the impacts of external pressure on the performance and behavior of a lithium-ion battery cell at different states of charge. Electrochemical impedance spectroscopy measurements were accomplished with a 0.6 Amp RMS sinusoidal current and in the frequency range of 100 MHz to 10 kHz. Impedance spectra were measured at different states of charge. Electrochemical impedance spectroscopy was performed at room temperature. The experimental results from this investigation that was achieved on the individual cell, which could help understand how the behavior of an electric vehicle pack is influenced by external pressure. Besides, the results can be used to improve the performance, design, and life. cycle of automotive battery packs. The acquired outcomes could be advantageous for improving a battery pack’s configuration for aeronautic and automotive utilizations. It was concluded that external pressure has a significant influence on R1 and R2. Influence of states of charge on the electrochemical impedance spectroscopy was investigated when an external compressive load was applied to the prismatic lithium-ion battery cell. A substantial change was observed in the low frequency region specifically at lower state of charge. Future investigations should assess the impacts of external pressure on the battery cell’s life cycle and coulombic efficiency. In addition, the compacting battery’s stress plots as a function of time for battery cells under dissimilar stack forces should be investigated. Therefore, the dynamic force creation throughout the cycle and its dependence on the current rates should be studied at different current magnitudes. Finally, the effect of external force on the battery coulombic efficiency should be investigated. In addition, the effect of vibration on the performance of lithium-ion pouch cells will be studied. The connection between force generation and coulombic efficiency and capacity change throughout charge and discharge under several currents can be considered in future research.
Author Contributions
S.S.M. proposed the idea of the paper; S.S.M. wrote the paper; E.S. provided suggestions on the content and structure of the paper; S.K.K. and E.S. has been reviewing the draft manuscripts. All authors have read and agreed to the published version of the manuscript.
Funding
This research received no external funding.
Institutional Review Board Statement
Not applicable.
Informed Consent Statement
Not applicable.
Data Availability Statement
Not applicable.
Conflicts of Interest
The authors declare no conflict of interest.
References
- Behrou, R.; Maute, K.; Smith, K. Numerical Simulation of Pressure Management Strategies for Lithium-Ion Pouch Cells. 2014. Available online: https://scholar.colorado.edu/concern/conference_proceedings/r494vk876 (accessed on 24 March 2021).
- Gnanaraj, J.; Cohen, Y.S.; Levi, M.; Aurbach, D. The effect of pressure on the electroanalytical response of graphite anodes and LiCoO2 cathodes for Li-ion batteries. J. Electroanal. Chem. 2001, 516, 89–102. [Google Scholar] [CrossRef]
- Nadimpalli, S.P.V.; Sethuraman, V.A.; Abraham, D.P.; Bower, A.F.; Guduru, P.R. Stress Evolution in Lithium-Ion Composite Electrodes during Electrochemical Cycling and Resulting Internal Pressures on the Cell Casing. J. Electrochem. Soc. 2015, 162, A2656–A2663. [Google Scholar] [CrossRef] [Green Version]
- Bach, T.C.; Schuster, S.F.; Fleder, E.; Müller, J.; Brand, M.J.; Lorrmann, H.; Jossen, A.; Sextl, G. Nonlinear aging of cylindrical lithium-ion cells linked to heterogeneous compression. J. Energy Storage 2016, 5, 212–223. [Google Scholar] [CrossRef]
- Rieger, B.; Schlueter, S.; Erhard, S.V.; Schmalz, J.; Reinhart, G.; Jossen, A. Multi-scale investigation of thickness chang-es in a commercial pouch type lithium-ion battery. J. Energy Storage 2016, 6, 213–221. [Google Scholar] [CrossRef]
- De Sutter, L.; Berckmans, G.; Marinaro, M.; Smekens, J.; Firouz, Y.; Wohlfahrt-Mehrens, M.; Van Mierlo, J.; Omar, N. Comprehensive Aging Analysis of Volumetric Constrained Lithium-Ion Pouch Cells with High Concentration Silicon-Alloy Anodes. Energies 2018, 11, 2948. [Google Scholar] [CrossRef] [Green Version]
- Mussa, A.S.; Klett, M.; Lindbergh, G.; Lindström, R.W. Effects of external pressure on the performance and ageing of single-layer lithium-ion pouch cells. J. Power Source 2018, 385, 18–26. [Google Scholar] [CrossRef]
- Barai, A.; Guo, Y.; McGordon, A.; Jennings, P. A study of the effects of external pressure on the electrical performance of a lithium-ion pouch cell. In Proceedings of the 2013 International Conference on Connected Vehicles and Expo (ICCVE), Las Vegas, NV, USA, 2–6 December 2013; pp. 295–299. [Google Scholar] [CrossRef] [Green Version]
- Zhang, Y.C.; Briat, O.; Delétage, J.-Y.; Martin, C.; Gager, G.; Vinassa, J.-M. Characterization of external pressure effects on lithium-ion pouch cell. In Proceedings of the 2018 IEEE International Conference on Industrial Technology (ICIT), Lyon, France, 20–22 February 2018; pp. 2055–2059. [Google Scholar] [CrossRef]
- Cannarella, J.; Arnold, C.B. Stress evolution and capacity fade in constrained lithium-ion pouch cells. J. Power Source 2014, 245, 745–751. [Google Scholar] [CrossRef]
- Barai, A.; Tangirala, R.; Uddin, K.; Chevalier, J.; Guo, Y.; McGordon, A.; Jennings, P. The effect of external compressive loads on the cycle lifetime of lithium-ion pouch cells. J. Energy Storage 2017, 13, 211–219. [Google Scholar] [CrossRef] [Green Version]
- Lee, J.; Yeo, J.; Jang, M.; Yoon, J.; Kang, D.M. Mechanical durability and electrical durability of an alumini-um-laminated lithium-ion polymer battery pack for a hybrid electric vehicle. J. Automob. Eng. 2010, 224, 765–773. [Google Scholar] [CrossRef]
- Michael, J.; Marco, J. Characterising the in-vehicle vibration inputs to the high voltage battery of an electric vehi-cle. J. Power Source 2014, 245, 510–519. [Google Scholar]
- Hooper, J.M.; Marco, J. Experimental modal analysis of lithium-ion pouch cells. J. Power Source 2015, 285, 247–259. [Google Scholar] [CrossRef] [Green Version]
- Wang, H.; Tao, Z.; Fu, Y.; Li, W.; Cai, Y. Analysis on Vibration of Li-ion Battery Module Used for Electric Vehicle. DEStech Trans. Mater. Sci. Eng. 2017, 3–5. [Google Scholar] [CrossRef]
- Hong, S.-K.; Epureanu, B.I.; Castanier, M.P. Parametric reduced-order models of battery pack vibration including structural variation and prestress effects. J. Power Source 2014, 261, 101–111. [Google Scholar] [CrossRef]
- Brand, M.J.; Schuster, S.F.; Bach, T.; Fleder, E.; Stelz, M.; Gläser, S.; Müller, J.; Sextl, G.; Jossen, A. Effects of vibrations and shocks on lithium-ion cells. J. Power Source 2015, 288, 62–69. [Google Scholar] [CrossRef]
- Choi, Y.; Jung, D.; Ham, K.; Bae, S. A study on the accelerated vibration endurance tests for battery fixing bracket in electrically driven vehicles. Procedia Eng. 2011, 10, 851–856. [Google Scholar] [CrossRef] [Green Version]
- Somerville, L.; Hooper, J.M.; Marco, J.; McGordon, A.; Lyness, C.; Walker, M.; Jennings, P. Impact of vibration on the surface film of lithium-ion cells. Energies 2017, 10, 741. [Google Scholar] [CrossRef] [Green Version]
- Pham, H.L.; Adams, D.E.; Dietz, J.E.; Sharp, N.D. Lithium-Ion Battery Cell Health Monitoring Using Vibration Diagnostic Test, IMECE2013-63962. 2013; pp. 1–10. Available online: https://www.osti.gov/servlets/purl/1107247 (accessed on 24 March 2021).
- Zhang, L. Applied sciences Effects of Vibration on the Electrical Performance of Lithium-Ion Cells Based on Mathemat-ical Statistics. Appl. Sci. 2017, 7, 802. [Google Scholar] [CrossRef] [Green Version]
- Hooper, J.M.; Marco, J. EVS29 Symposium Defining a Representative Vibration Durability Test for Electric Vehicle (EV) Rechargeable Energy Storage Systems (RESS). World Electr. Veh. J. 2016, 8, 327–338. [Google Scholar] [CrossRef] [Green Version]
- Shevtsov, S.; Chang, S.H. Modeling of vibration energy harvesting system with power PZT stack loaded on Li-Ion battery. Int. J. Hydrogen Energy 2016, 41, 2618–12625. [Google Scholar] [CrossRef]
- Gao, Y.; Jiang, J.; Zhang, C.; Zhang, W.; Ma, Z.; Jiang, Y. Lithium-ion battery aging mechanisms and life model under different charging stresses. J. Power Source 2017, 356, 103–114. [Google Scholar] [CrossRef]
- Hooper, J.M.; Marco, J.; Chouchelamane, G.H.; Lyness, C. Vibration Durability Testing of Nickel Manganese Cobalt Oxide (NMC) Lithium-Ion 18,650 Battery Cells. Energies 2016, 9, 52. [Google Scholar] [CrossRef]
- Bruen, T.; Hooper, J.M.; Marco, J.; Gama, M.; Chouchelamane, G.H. Analysis of a Battery Management System (BMS) Control Strategy for Vibration Aged Nickel Manganese Cobalt Oxide (NMC) Lithium-Ion 18650 Battery Cells. Energies 2016, 9, 255. [Google Scholar] [CrossRef] [Green Version]
- Popp, H.; Glanz, G.; Alten, K.; Gocheva, I.; Berghold, W.; Bergmann, A. Mechanical Frequency Response Analysis of Lithium-Ion Batteries to Disclose Operational Parameters. Energies 2018, 11, 541. [Google Scholar] [CrossRef] [Green Version]
- Lang, J.F.; Kjell, G. Comparing vibration measurements in an electric vehicle with standard vibration requirements for Li-ion batteries using power spectral density analysis. Int. J. Electr. Hybrid Veh. 2015, 7, 272–286. [Google Scholar] [CrossRef]
- Gonçalves, H.; Meireles, J.; Martins, J. Vibration analysis of integrated systems to electric vehicles. In Proceedings of the 5th International Operational Modal Analysis Conference, Guimarães, Portugal, 13–15 May 2013. [Google Scholar]
- Ruiz, V.; Pfrang, A.; Kriston, A.; Omar, N.; Bossche, P.V.D.; Boon-Brett, L. A review of international abuse testing standards and regulations for lithium ion batteries in electric and hybrid electric vehicles. Renew. Sustain. Energy Rev. 2018, 81, 1427–1452. [Google Scholar] [CrossRef]
- Arora, S.; Shen, W.; Kapoor, A. Review of mechanical design and strategic placement technique of a robust battery pack for electric vehicles. Renew. Sustain. Energy Rev. 2016, 60, 1319–1331. [Google Scholar] [CrossRef]
- Vetter, J.; Novák, P.; Wagner, M.; Veit, C.; Möller, K.-C.; Besenhard, J.; Winter, M.; Wohlfahrt-Mehrens, M.; Vogler, C.; Hammouche, A. Ageing mechanisms in lithium-ion batteries. J. Power Source 2005, 147, 269–281. [Google Scholar] [CrossRef]
- Andre, D.; Meiler, M.; Steiner, K.; Wimmer, C.; Soczka-Guth, T.; Sauer, D.U. Characterization of high-power lithi-um-ion batteries by electrochemical impedance spectroscopy. I. Experimental investigation. J. Power Source 2011, 196, 5334–5341. [Google Scholar] [CrossRef]
- Waag, W.; Käbitz, S.; Sauer, D.U. Experimental investigation of the lithium-ion battery impedance characteristic at various conditions and aging states and its influence on the application. Appl. Energy 2013, 102, 885–897. [Google Scholar] [CrossRef]
- Fu, R.; Xiao, M.; Choe, S.-Y. Modeling, validation and analysis of mechanical stress generation and dimension changes of a pouch type high power Li-ion battery. J. Power Source 2013, 224, 211–224. [Google Scholar] [CrossRef]
- Cannarella, J.; Arnold, C.B. Ion transport restriction in mechanically strained separator membranes. J. Power Source 2013, 226, 149–155. [Google Scholar] [CrossRef]
- Barreras, J.V. Practical Methods in Li-Ion Batteries: For Simplified Modeling, Battery Electric Vehicle Design, Battery Management System Testing and Balancing System Control. Ph.D. Thesis, Aalborg University, Aalborg, Denmark, 2017. [Google Scholar]
- Marcinek, M.; Syzdek, J.; Marczewski, M.; Piszcz, M.; Niedzicki, L.; Kalita, M.; Plewa-Marczewska, A.; Bitner, A.; Wieczorek, P.; Trzeciak, T.; et al. Electrolytes for Li-ion transport—Review. Solid State Ion. 2015, 276, 107–126. [Google Scholar] [CrossRef]
Figure 1.
3D design of the experimental setup.

Figure 2.
Different components of the 3D design of the experimental setup.

Figure 3.
Dimension of different components of the setup.

Figure 4.
Top view of the constraint setup.

Figure 5.
The Flexiforce A502 pressure sensor.

Figure 6.
Installed Flexiforce A502 pressure sensors.

Figure 7.
Mounted strain gage load cell.

Figure 8.
Compacting testing machine and sensors for calibration.

Figure 9.
Output voltage from compacting testing machine.

Figure 10.
The electrochemical impedance spectroscopy equipment and measuring devices.

Figure 11.
The investigated battery cell.

Figure 12.
The equivalent circuit diagram with different quantities of resistor (R) and capacitor (C) networks.
Figure 12.
The equivalent circuit diagram with different quantities of resistor (R) and capacitor (C) networks.

Figure 13.
The feedback of impedance experiments at dissimilar state of charge in the absence of external pressure for different state of charge (SOC).
Figure 13.
The feedback of impedance experiments at dissimilar state of charge in the absence of external pressure for different state of charge (SOC).

Figure 14.
Electrochemical impedance spectroscopy results under external static force equal to 8 Kn.
Figure 14.
Electrochemical impedance spectroscopy results under external static force equal to 8 Kn.

Figure 15.
Zooming of the electrochemical impedance spectroscopy results.

Figure 16.
Comparison of electrochemical impedance spectroscopy results at different state of charge in the absence and present of external pressure in the Nyquist plane.
Figure 16.
Comparison of electrochemical impedance spectroscopy results at different state of charge in the absence and present of external pressure in the Nyquist plane.


Table 1.
A summary of the electrical performance of the lithium-ion battery cells for different applied pressure [8] (T: Temperature (°C)).
Table 1.
A summary of the electrical performance of the lithium-ion battery cells for different applied pressure [8] (T: Temperature (°C)).
| Test | T (°C) | External Pressure | Investigated Parameters | Effect on Voltage | Effect on Internal Impedance | Effect on Power | Effect on Capacity |
|---|---|---|---|---|---|---|---|
| Pulse power/Discharging | 45 | 0, 0.2, 0.4, 0.8 | Increasing pressure | Decreasing | Increasing | Decreasing | Decreasing |
| 25 | 0, 0.4, 0.8 | Increasing pressure | Decreasing | Increasing | Decreasing | Decreasing | |
| 0.2 | Increasing pressure | Increasing | |||||
| Pulse power/Charging | 45 | 0, 0.2, 0.4, 0.8 | Increasing pressure | Increasing | Increasing | ||
| 25 | 0, 0.4, 0.8 | Increasing pressure | Increasing | Increasing | |||
| 0.2 | Increasing pressure | Decreasing | |||||
| Capacity | 45 | 0, 0.2, 0.4, 0.8 | Increasing pressure | Mixed | Decreasing | ||
| 25 | 0, 0.2, 0.4, 0.8 | Increasing pressure | Mixed | Decreasing | |||
| 0 | 0, 0.2, 0.4, 0.8 | Increasing pressure | Mixed | Decreasing | |||
| Electrochemical impedance spectroscopy | 25 | 0, 0.2, 0.4, 0.8 | Increasing pressure | ||||
| 25 | 0, 0.2, 0.4, 0.8 | Increasing pressure | |||||
| 25 | 0, 0.2, 0.4, 0.8 | Increasing pressure |
Table 2.
A summary of the influence of external pressure on various electrical parameters [9].
Table 2.
A summary of the influence of external pressure on various electrical parameters [9].
| Test | Electrochemical Impedance Spectroscopy |
|---|---|
| Temperature (°C) | 25 |
| Pressure (kN) | 0, 3.675, 7.35, 14.7, 22.05, 29.4 |
| Investigated parameters | Increasing pressure |
| Effect on electrolyte | Negligible impact |
| Effect on separator | Negligible impact |
| Effect on current collector | Negligible impact |
| Effect on cabling properties | Negligible impact |
| Effect on ion diffusion in electrode | Increasing |
| Effect on ohmic contributions | Negligible impact |
Table 3.
Calibration Flexiforce A502 pressure sensor and the strain gage load cell type 4576A.
| Attempt | 1 | 2 | 3 | 4 | |
|---|---|---|---|---|---|
| Force (KN) | Voltage (V) | ||||
| Load cell | 1.5 | 0.4759 | 0.7404 | 0.7505 | 0.7525 |
| 5 | 1.568 | 1.904 | 1.906 | 1.905 | |
| 8 | 2.452 | 2.785 | 2.784 | 2.783 | |
| 5 | 1.592 | 1.918 | 1.916 | 1.915 | |
| 1.5 | 0.494 | 0.7428 | 0.7449 | 0.7448 | |
| Sensor 1 | 1.5 | 4.89 | 4.9 | 4.909 | |
| 5 | 4.96 | 4.968 | 4.969 | ||
| 8 | 4.98 | 4.979 | 4.98 | ||
| 5 | 4.96 | 4.969 | 4.97 | ||
| 1.5 | 4.91 | 4.912 | 4.913 | ||
| Sensor 2 | 1.5 | 4.909 | 4.912 | 4.913 | |
| 5 | 4.971 | 4.971 | 4.972 | ||
| 8 | 4.981 | 4.982 | 4.982 | ||
| 5 | 4.972 | 4.973 | |||
| 1.5 | 4.916 | 4.916 | 4.921 | ||
| Sensor 3 | 1.5 | 4.924 | 4.931 | 4.933 | |
| 5 | 4.974 | 4.975 | 4.976 | ||
| 8 | 4.983 | 4.989 | 4.984 | ||
| 5 | 4.976 | 4.976 | 4.977 | ||
| 1.5 | 4.933 | 4.936 | 4.937 | ||
| Sensor 4 | 1.5 | 4.898 | 4.908 | 4.91 | |
| 5 | 4.967 | 4.968 | 4.969 | ||
| 8 | 4.979 | 4.98 | 4.98 | ||
| 5 | 4.69 | 4.97 | 4.97 | ||
| 1.5 | 4.911 | 4.914 | 4.915 | ||
| Sensor 5 | 1.5 | 4.938 | 4.944 | 4.946 | |
| 5 | 4.979 | 4.98 | 4.981 | ||
| 8 | 4.987 | 4.987 | 4.987 | ||
| 5 | 4.981 | 4.981 | 4.981 | ||
| 1.5 | 4.946 | 4.948 | 4.949 | ||
| Sensor 6 | 1.5 | 4.926 | 4.933 | 4.934 | |
| 5 | 4.974 | 4.975 | 4.975 | ||
| 8 | 4.983 | 4.983 | 4.983 | ||
| 5 | 4.976 | 4.976 | 4.976 | ||
| 1.5 | 4.935 | 4.937 | 4.938 | ||
Table 4.
Parameters of different equivalent circuit models of the battery. (R: resistor, C: capacitor).
Table 4.
Parameters of different equivalent circuit models of the battery. (R: resistor, C: capacitor).
| 2 RC | 3 RC | 4 RC | 5 RC | 6 RC | 7 RC | |
|---|---|---|---|---|---|---|
| R1 (ohm) | 2.06 × 10⁻² | 2.05 × 10⁻² | 2.05 × 10⁻² | 2.05 × 10⁻² | 2.05 × 10⁻² | 8.87 × 10⁻⁴ |
| R2 (ohm) | 3.90 × 10⁻³ | 1.83 × 10⁻³ | 6.43 × 10⁻³ | 1.71 × 10⁻³ | 7.76 × 10⁻³ | 1.04 × 10⁻³ |
| R3 (ohm) | 9.03 × 10⁻³ | 7.97 × 10⁻³ | 7.60 × 10⁻³ | 3.03 × 10⁻³ | 1.08 × 10⁻³ | 8.50 × 10⁻⁵ |
| R4 (ohm) | 0 | 4.67 × 10⁻³ | 1.85 × 10⁻³ | 9.08 × 10⁻⁴ | 1.20 × 10⁻³ | 8.77 × 10⁻³ |
| R5 (ohm) | 0 | 0 | 1.21 × 10⁻³ | 1.34 × 10⁻¹ | 5.43 × 10⁻⁴ | 1.12 × 10⁻⁴ |
| R6 (ohm) | 0 | 0 | 0 | 7.76 × 10⁻³ | 4.98 × 10⁻³ | 3.76 × 10⁻⁴ |
| R7 (ohm) | 0 | 0 | 0 | 0 | 1.95 × 10⁻³ | 3.09 × 10⁻⁴ |
| R8 (ohm) | 0 | 0 | 0 | 0 | 0 | 5.91 × 10⁻⁵ |
| C1 (F) | 212.2 | 8.655 | 539.5 | 5.948 | 1.55 × 10⁻¹ | 2.91 × 10+4 |
| C2 (F) | 1.63 × 10⁻¹ | 1.55 × 10⁻¹ | 1.55 × 10⁻¹ | 582.8 | 224 | 1.68 × 10+3 |
| C3 (F) | 0 | 340.7 | 4.915 | 199.9 | 9.212 | 1.55 × 10+5 |
| C4 (F) | 0 | 0 | 203.4 | 1.71 × 10+3 | 16.44 | 1.86 × 10+4 |
| C5 (F) | 0 | 0 | 0 | 1.55 × 10⁻¹ | 596.8 | 56.67 |
| C6 (F) | 0 | 0 | 0 | 0 | 4.10 × 10+3 | 7.248 |
| C7 (F) | 0 | 0 | 0 | 0 | 0 | 37.84 |
Publisher’s Note: MDPI stays neutral with regard to jurisdictional claims in published maps and institutional affiliations. |
© 2021 by the authors. Licensee MDPI, Basel, Switzerland. This article is an open access article distributed under the terms and conditions of the Creative Commons Attribution (CC BY) license (http://creativecommons.org/licenses/by/4.0/).
Share and Cite
MDPI and ACS Style
Madani, S.S.; Schaltz, E.; Kær, S.K. Characterization of the Compressive Load on a Lithium-Ion Battery for Electric Vehicle Application. Machines 2021, 9, 71. https://doi.org/10.3390/machines9040071
AMA Style
Madani SS, Schaltz E, Kær SK. Characterization of the Compressive Load on a Lithium-Ion Battery for Electric Vehicle Application. Machines. 2021; 9(4):71. https://doi.org/10.3390/machines9040071
Chicago/Turabian StyleMadani, Seyed Saeed, Erik Schaltz, and Søren Knudsen Kær. 2021. "Characterization of the Compressive Load on a Lithium-Ion Battery for Electric Vehicle Application" Machines 9, no. 4: 71. https://doi.org/10.3390/machines9040071
Note that from the first issue of 2016, this journal uses article numbers instead of page numbers. See further details here.