Article

Effect of Gd3+, La3+, Lu3+ Co-Doping on the Morphology and Luminescent Properties of NaYF4:Sm3+ Phosphors

by
Viktor G. Nosov
1,
Anna A. Betina
1,
Tatyana S. Bulatova
1,
Polina B. Guseva
1,
Ilya E. Kolesnikov
1,
Sergey N. Orlov
1,2,3,
Maxim S. Panov
1,4,
Mikhail N. Ryazantsev
1,5,
Nikita A. Bogachev
1,
Mikhail Yu Skripkin
1,* and
Andrey S. Mereshchenko
1,*
1
Saint-Petersburg State University, 7/9 Universitetskaya Emb., 199034 St. Petersburg, Russia
2
Federal State Unitary Enterprise “Alexandrov Research Institute of Technology”, 72 Koporskoe Shosse, 188540 Sosnovy Bor, Russia
3
Institute of Nuclear Industry, Peter the Great St. Petersburg Polytechnic University (SPbSU), 29, Polytechnicheskaya Street, 195251 St. Petersburg, Russia
4
Center for Biophysical Studies, Saint Petersburg State Chemical Pharmaceutical University, 14 Professor Popov Str., Lit. A, 197022 St. Petersburg, Russia
5
Nanotechnology Research and Education Centre RAS, Saint Petersburg Academic University, 8/3 Khlopina Street, 194021 St. Petersburg, Russia
*
Authors to whom correspondence should be addressed.
Materials 2023, 16(6), 2157; https://doi.org/10.3390/ma16062157
Submission received: 11 February 2023 / Revised: 3 March 2023 / Accepted: 6 March 2023 / Published: 7 March 2023

Abstract

:
The series of luminescent NaYF4:Sm3+ nano- and microcrystalline materials co-doped by La3+, Gd3+, and Lu3+ ions were synthesized by hydrothermal method using rare earth chlorides as the precursors and citric acid as a stabilizing agent. The phase composition of synthesized compounds was studied by PXRD. All synthesized materials except ones with high La3+ content (where LaF3 is formed) have a β-NaYF4 crystalline phase. SEM images demonstrate that all particles have shape of hexagonal prisms. The type and content of doping REE significantly effect on the particle size. Upon 400 nm excitation, phosphors exhibit distinct emission peaks in visible part of the spectrum attributed to 4G5/26HJ transitions (J = 5/2–11/2) of Sm3+ ion. Increasing the samarium (III) content results in concentration quenching by dipole–dipole interactions, the optimum Sm3+concentration is found to be of 2%. Co-doping by non-luminescent La3+, Gd3+ and Lu3+ ions leads to an increase in emission intensity. This effect was explained from the Sm3+ local symmetry point of view.

1. Introduction

Lanthanide-doped inorganic materials have been attracting much attention from scientists for several decades. These materials have promising applications in medicine and technology as materials for optical devices, sensing, tumor therapy, bioimaging, drug delivery, anti-counterfeiting, optical thermometry, etc. [1,2,3,4,5,6,7,8,9].
The optical properties of these materials depend on the particles’ size and morphology, crystal symmetry, type, and concentration of rare earth ions in the host matrix [10,11,12,13,14,15,16]. Sodium yttrium fluoride is one of the best host matrices for luminescent rare earth-doped inorganic materials because this matrix has only low-frequency vibrational modes, and therefore does not quench the luminescence. In addition, NaYF4 possesses chemical inertness, low toxicity, and the possibility to combine magnetic, optical, and radioactive properties of lanthanide ions that opens the way to prepare new theranostic agents for non-invasive therapy [17,18,19,20,21,22]. As a co-dopant, lanthanide ions play several key roles in photoluminescent materials: they may absorb light as sensitizers or emit photons as luminescence activators as well as transfer energy from the sensitizer to activator [13,14,23,24,25]. At the same time, the addition of non-luminescent dopants (e.g., alkali, alkali earth, some p-, d- and f-metal ions) in host matrix doped with luminescent ions is known to enhance the luminescence intensity [11,26,27,28]. This effect is assumed to be caused by several factors: structural changes in the crystal lattice upon doping (e.g., formation of ionic vacancies) and modification of the crystal field surrounding Ln3+ activators [28,29,30]. Yet, generally, it is still early to believe that the mechanism of the co-doping effect on luminescence is fully explained because there is no model to predict the impact of any dopant ions on the optical properties of such doped materials. We presumed that this is caused by the deficiency of studies. For example, to the best of our knowledge, the non-luminescent dopants are mainly chosen from non-lanthanide elements. This approach neglects the fundamentally interesting details of the mutual effect of ions on similar electronic structures. Previously we have reported the particle size and shape dependence on the nature of the doping lanthanide (III) ions NaYF4:Ln3+ series and described the correlation between the obtained nanoparticle morphologies and the type and content of doping ions [10]. We found that the average diameter of particles reaches the least value for Sm3+, Eu3+, and Gd3+ doped materials. We have studied NaYF4:Eu3+ particles co-doped with Gd3+ ions [11] and revealed that Gd3+ doping results in particle size reduction as well as the increase in emission intensity and 5D0 lifetime of europium (III). We have obtained a similar effect of simultaneous size reduction and luminescence intensity enhancement for gadolinium ion-doped materials for NaYF4:Yb3+, Tm3+/Er3+ up-conversion microcrystalline materials [16]. Further investigations of up-conversion materials based on NaYF4 doped with erbium, ytterbium and co-doped with lutetium ions showed that the addition of optical inactive Lu3+ results in both increasing particles size and luminescence intensity [31]. In order to find out whether the luminescence intensity enhancement is the common trend upon doping with gadolinium or other non-luminescent lanthanide ions, we intended to study samarium-containing down-conversion phosphors in the current work.
Samarium compounds are of interest in medicine and the production of functional nanoparticles. For example, the decay energy of the samarium 153Sm nuclide allows using this isotope for cancer therapy and SPECT imaging [32,33]. Sm3+ ions are also known to be used as a part of optically active materials because of their orange luminescence, originating from the 4G5/26HJ/2 (J = 5, 7, and 9) transitions [14,34,35,36,37]. Nevertheless, the works devoted to the co-dopant effect on samarium-doped compounds as a way to control the luminescence properties of these materials are limited, and this effect should be studied in detail.
In this present study, we reported the effect of rare earth doping concentration on the morphology, structure, and luminescence properties of the series of NaYF4 compounds doped with Sm3+ and co-doped with non-luminescent La3+, Gd3+, and Lu3+ ions and proposed the theoretical explanations of such effects.

2. Materials and Methods

Anhydrous chlorides of the rare earth elements (YCl3, SmCl3, LaCl3, GdCl3, LuCl3, 99.999%) were purchased from Chemcraft (Kaliningrad, Russia), KBr, NaOH, NH4F, citric acid, and ethanol were purchased from Sigma-Aldrich Pty Ltd. (Darmstadt, Germany), and used without additional purification.
Microcrystalline β-NaYF4 samples co-doped with Sm3+, La3+, Gd3+, and Lu3+ were synthesized using the hydrothermal method using citric acid as a stabilizing agent, described previously [11,16]. Rare earth chlorides taken in stoichiometric amounts (total amount of rare earth chlorides was 0.75 mmol) with 3 mmol of citric acid were dissolved in distilled water to obtain 5 mL solution in total. Then, 2.5 mL of an aqueous solution containing 9 mmol of NaOH was added to the reaction mixture. After vigorous stirring for 30 min, 8 mL of aqueous solution containing 11 mmol of NaOH and 11 mmol of NH4F was added into the above solution. The solution was maintained after vigorous stirring for 30 min at room temperature before being transferred to a Teflon-lined autoclave with an internal volume of 20 mL and heated for 17h at the temperature of 180 °C. After that, the precipitate was separated from the reaction mixture by centrifugation, washed with ethanol and deionized water, and dried at 60 °C for 24 h. The desired microcrystalline materials were obtained in the form of white powders.
In this work, we synthesized and studied four series of luminescent powders: NaY1-xSmxF4 (x = 0–0.4) and NaY0.98−ySm0.2LnyF4 (Ln = La, Gd, Lu; y = 0–0.6). Among NaY1−xSmxF4 series, materials containing 2% (x = 0.02) of Sm3+ demonstrated the highest luminescence intensity (discussed below in the Results and Discussion section). Therefore, to follow the effect of Ln3+ (Ln = La, Gd, Lu) co-doping on the luminescence properties, we kept the concentration of Sm3+ equal to 2% in the NaY0.98−ySm0.2LnyF4 series. The relative content of the rare earth elements in the synthesized compounds was confirmed by energy-dispersive X-ray spectroscopy. The particles’ morphology was characterized using scanning electron microscopy (SEM) on a Zeiss Merlin electron microscope (Zeiss, Oberkochen, Germany) using an energy-dispersive X-ray spectroscopy (EDX) module (Oxford Instruments INCAx-act, Oxford, UK). powder X-ray diffraction (PXRD) measurements were performed on a D2 Phaser (Bruker, Billerica, MA, USA) X-ray diffractometer using Cu Ka radiation (λ = 1.54056 Å). To carry out quantitative photoluminescence studies, the synthesized samples (20 mg) and potassium bromide (300 mg) were pressed into pellets (diameter 13 mm). The luminescence spectra were recorded on Fluorolog-3 fluorescence spectrometer (Horiba Jobin Yvon, Kyoto, Japan). Lifetime measurements were performed using the same spectrometer using a pulsed Xe lamp (pulse duration 3 µs).

3. Results and Discussion

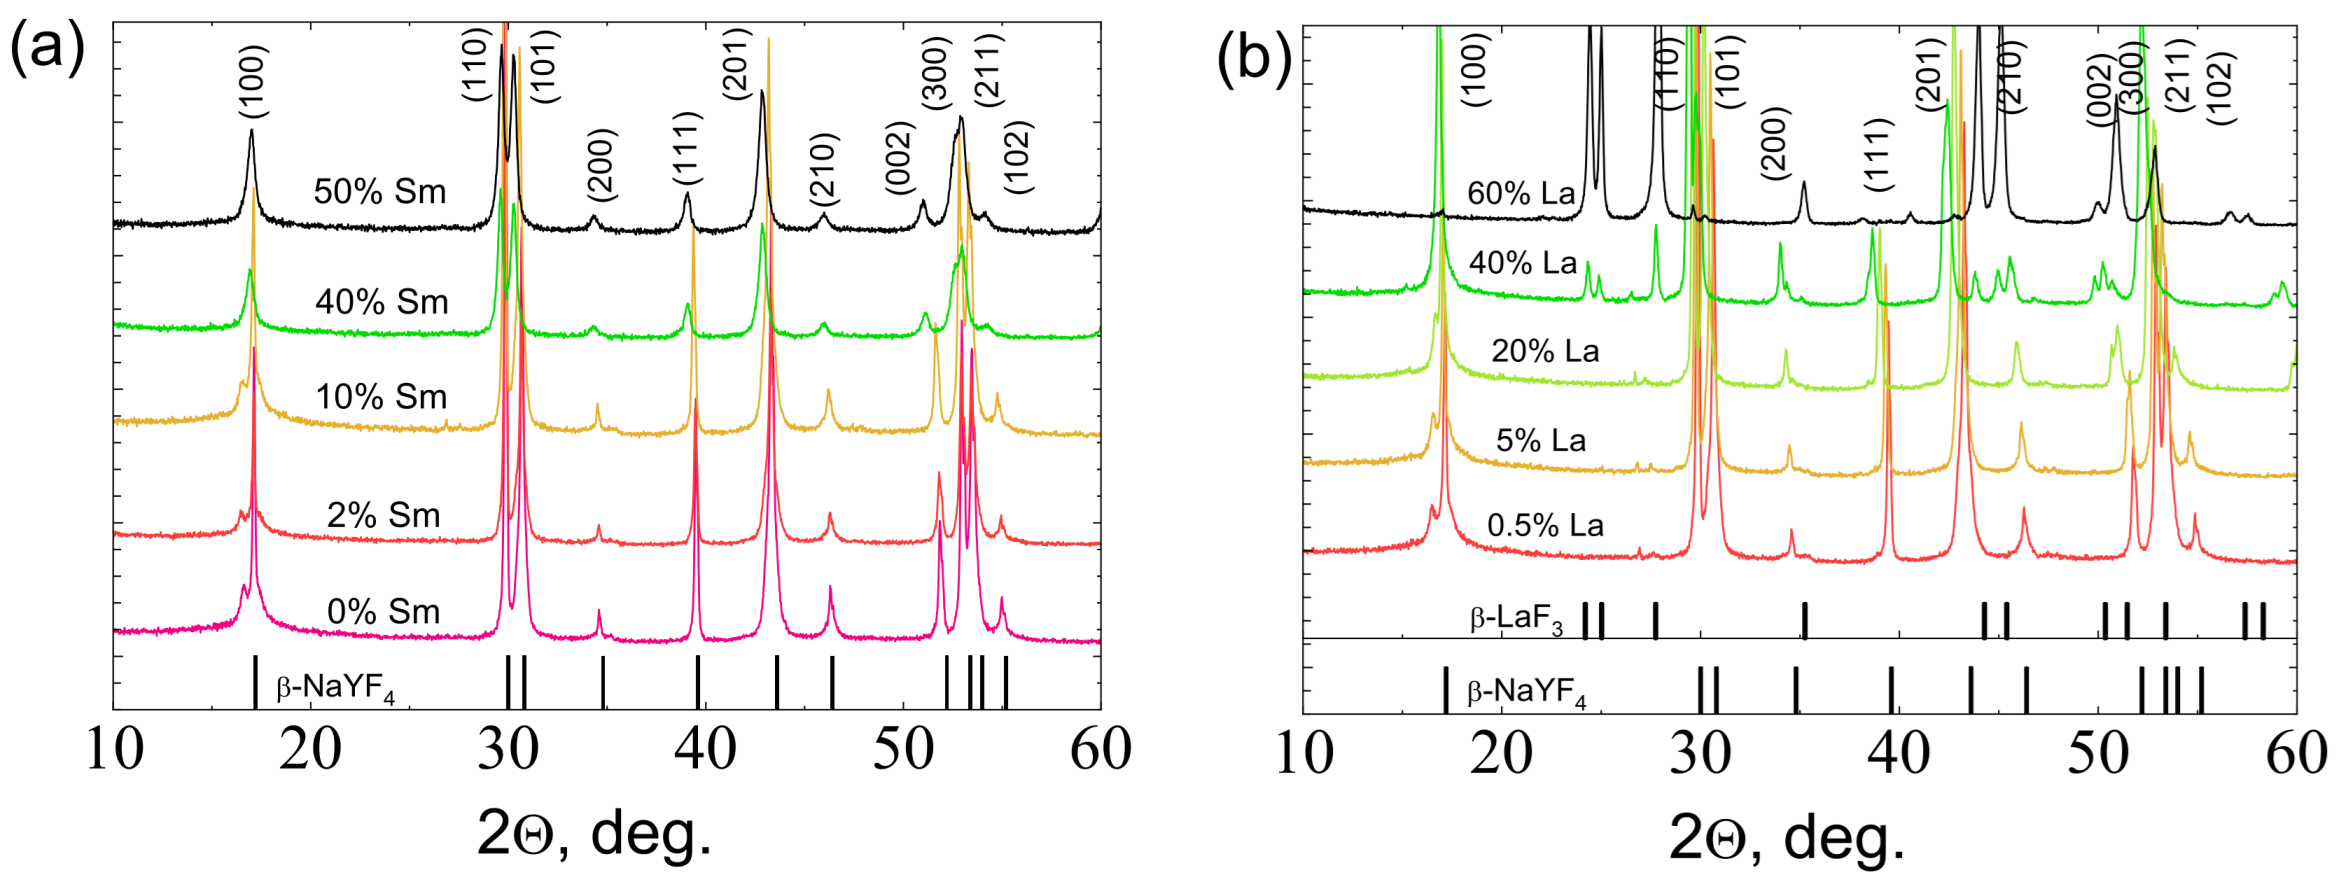
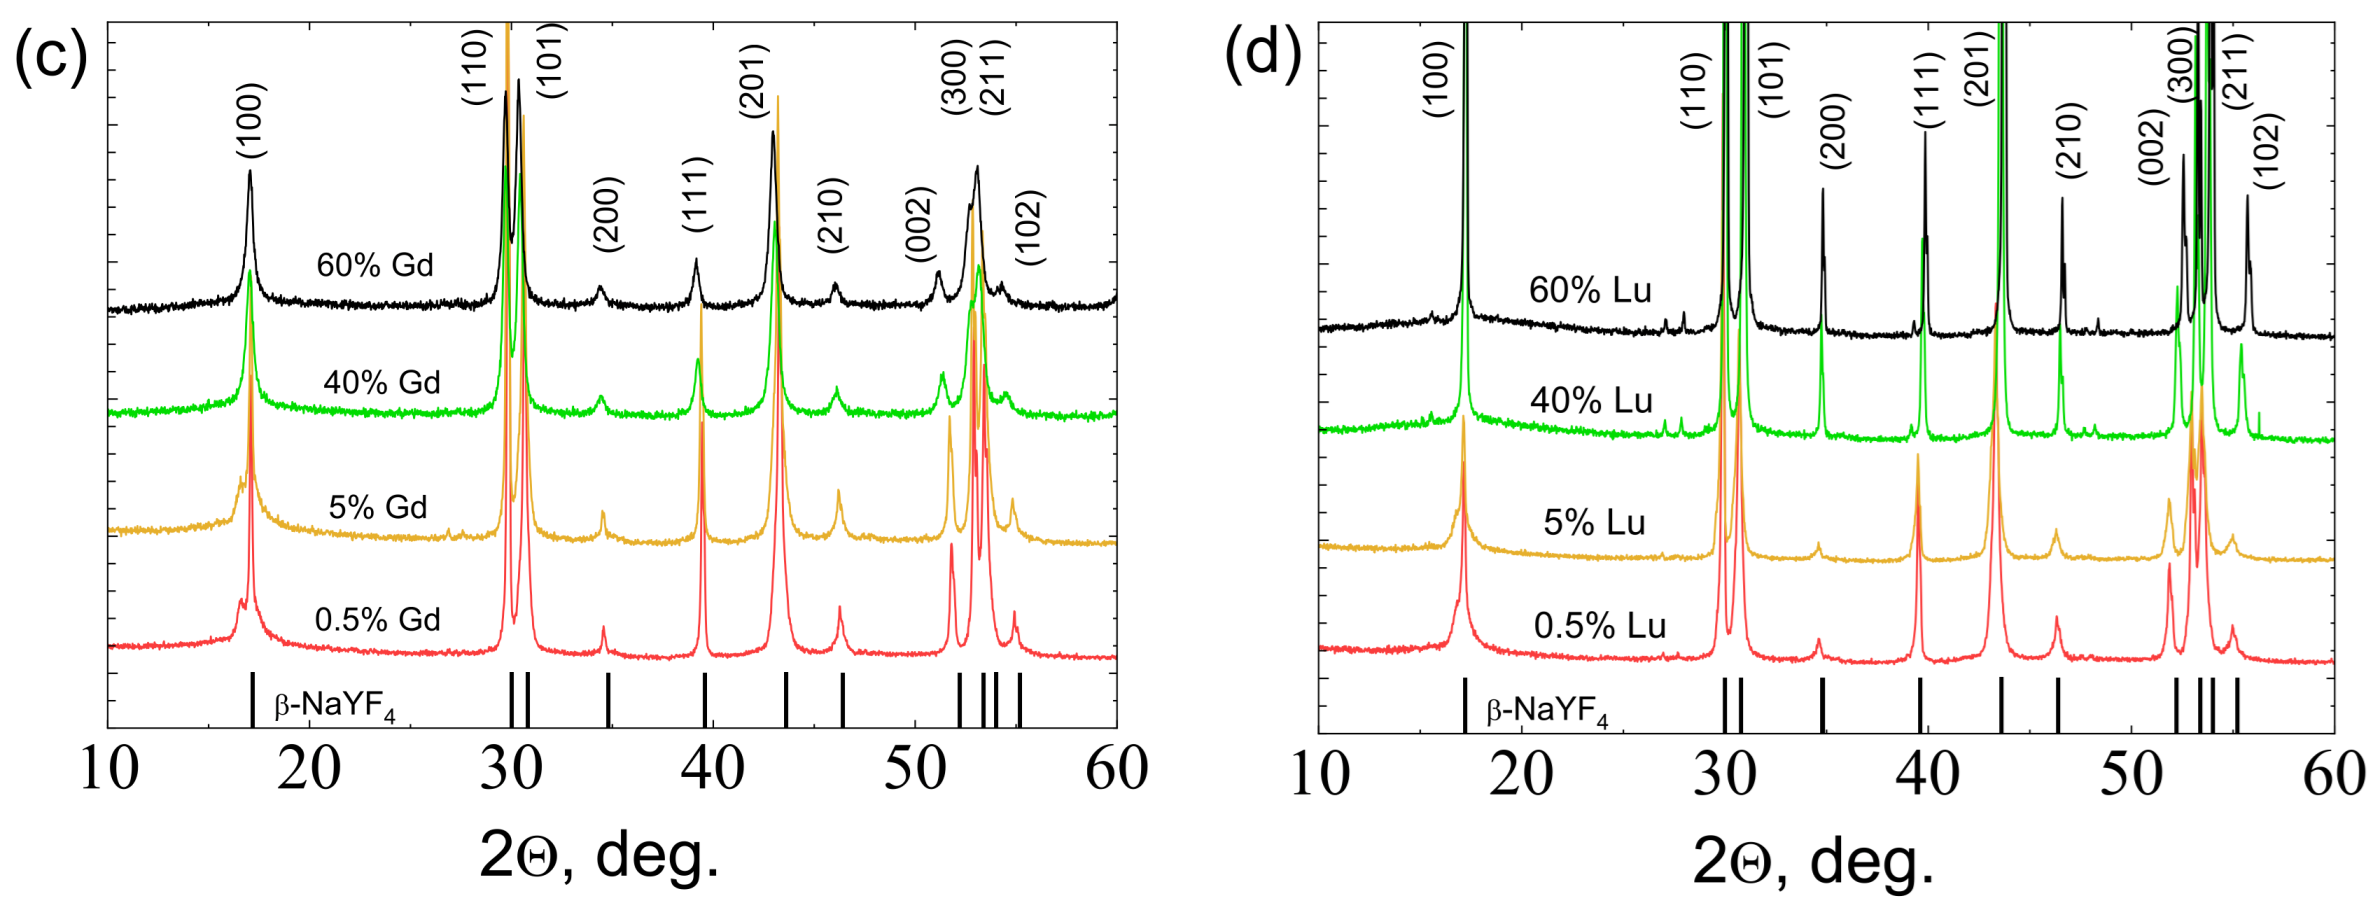
3.1. Crystal Structure
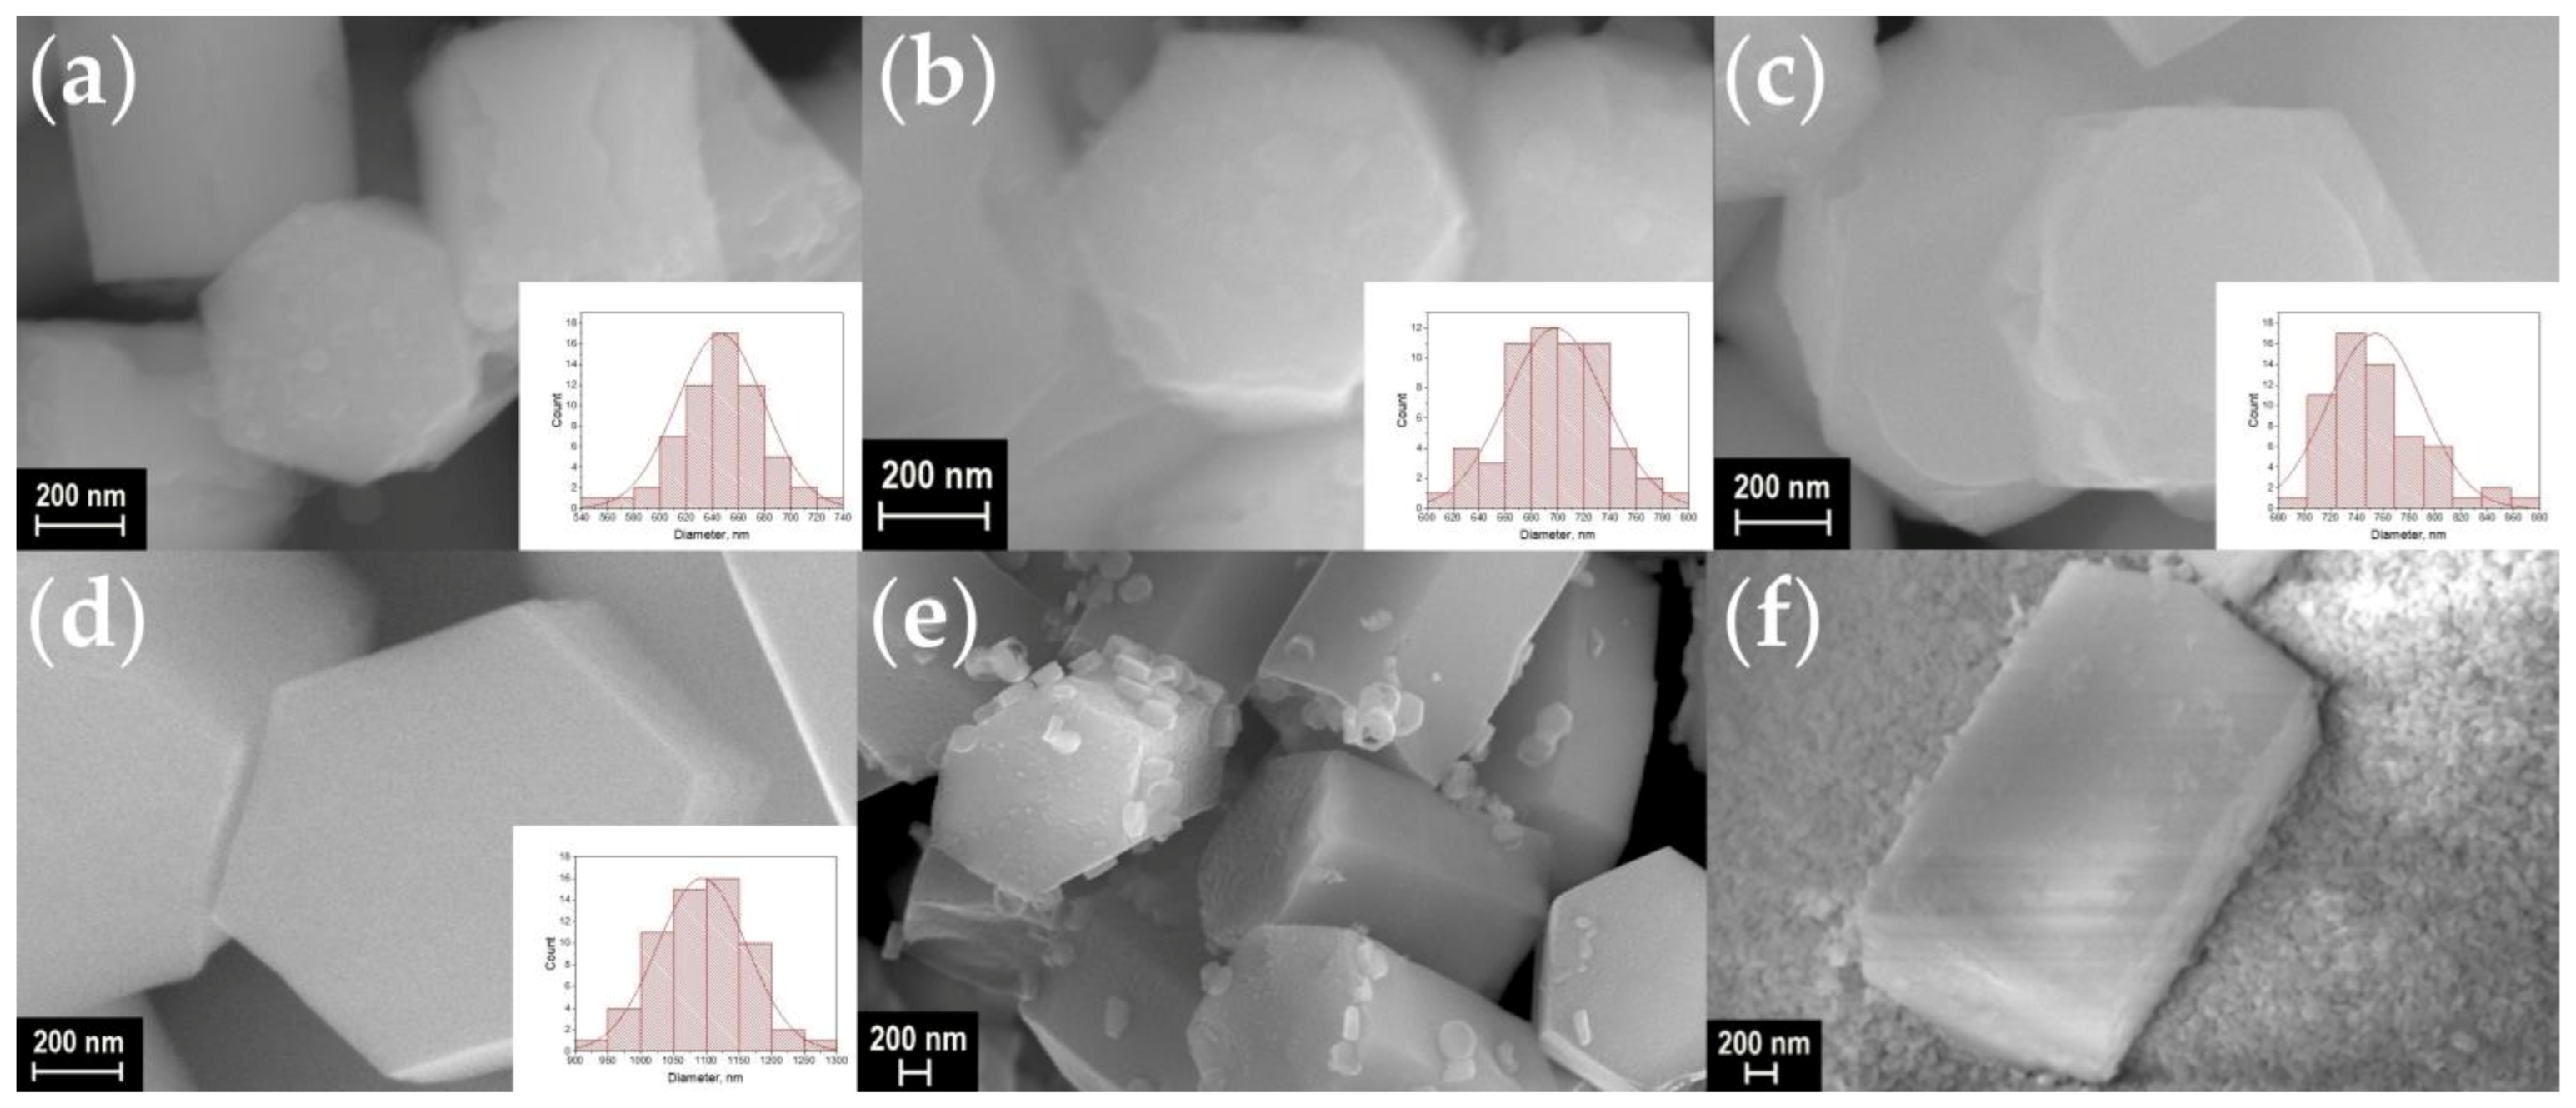
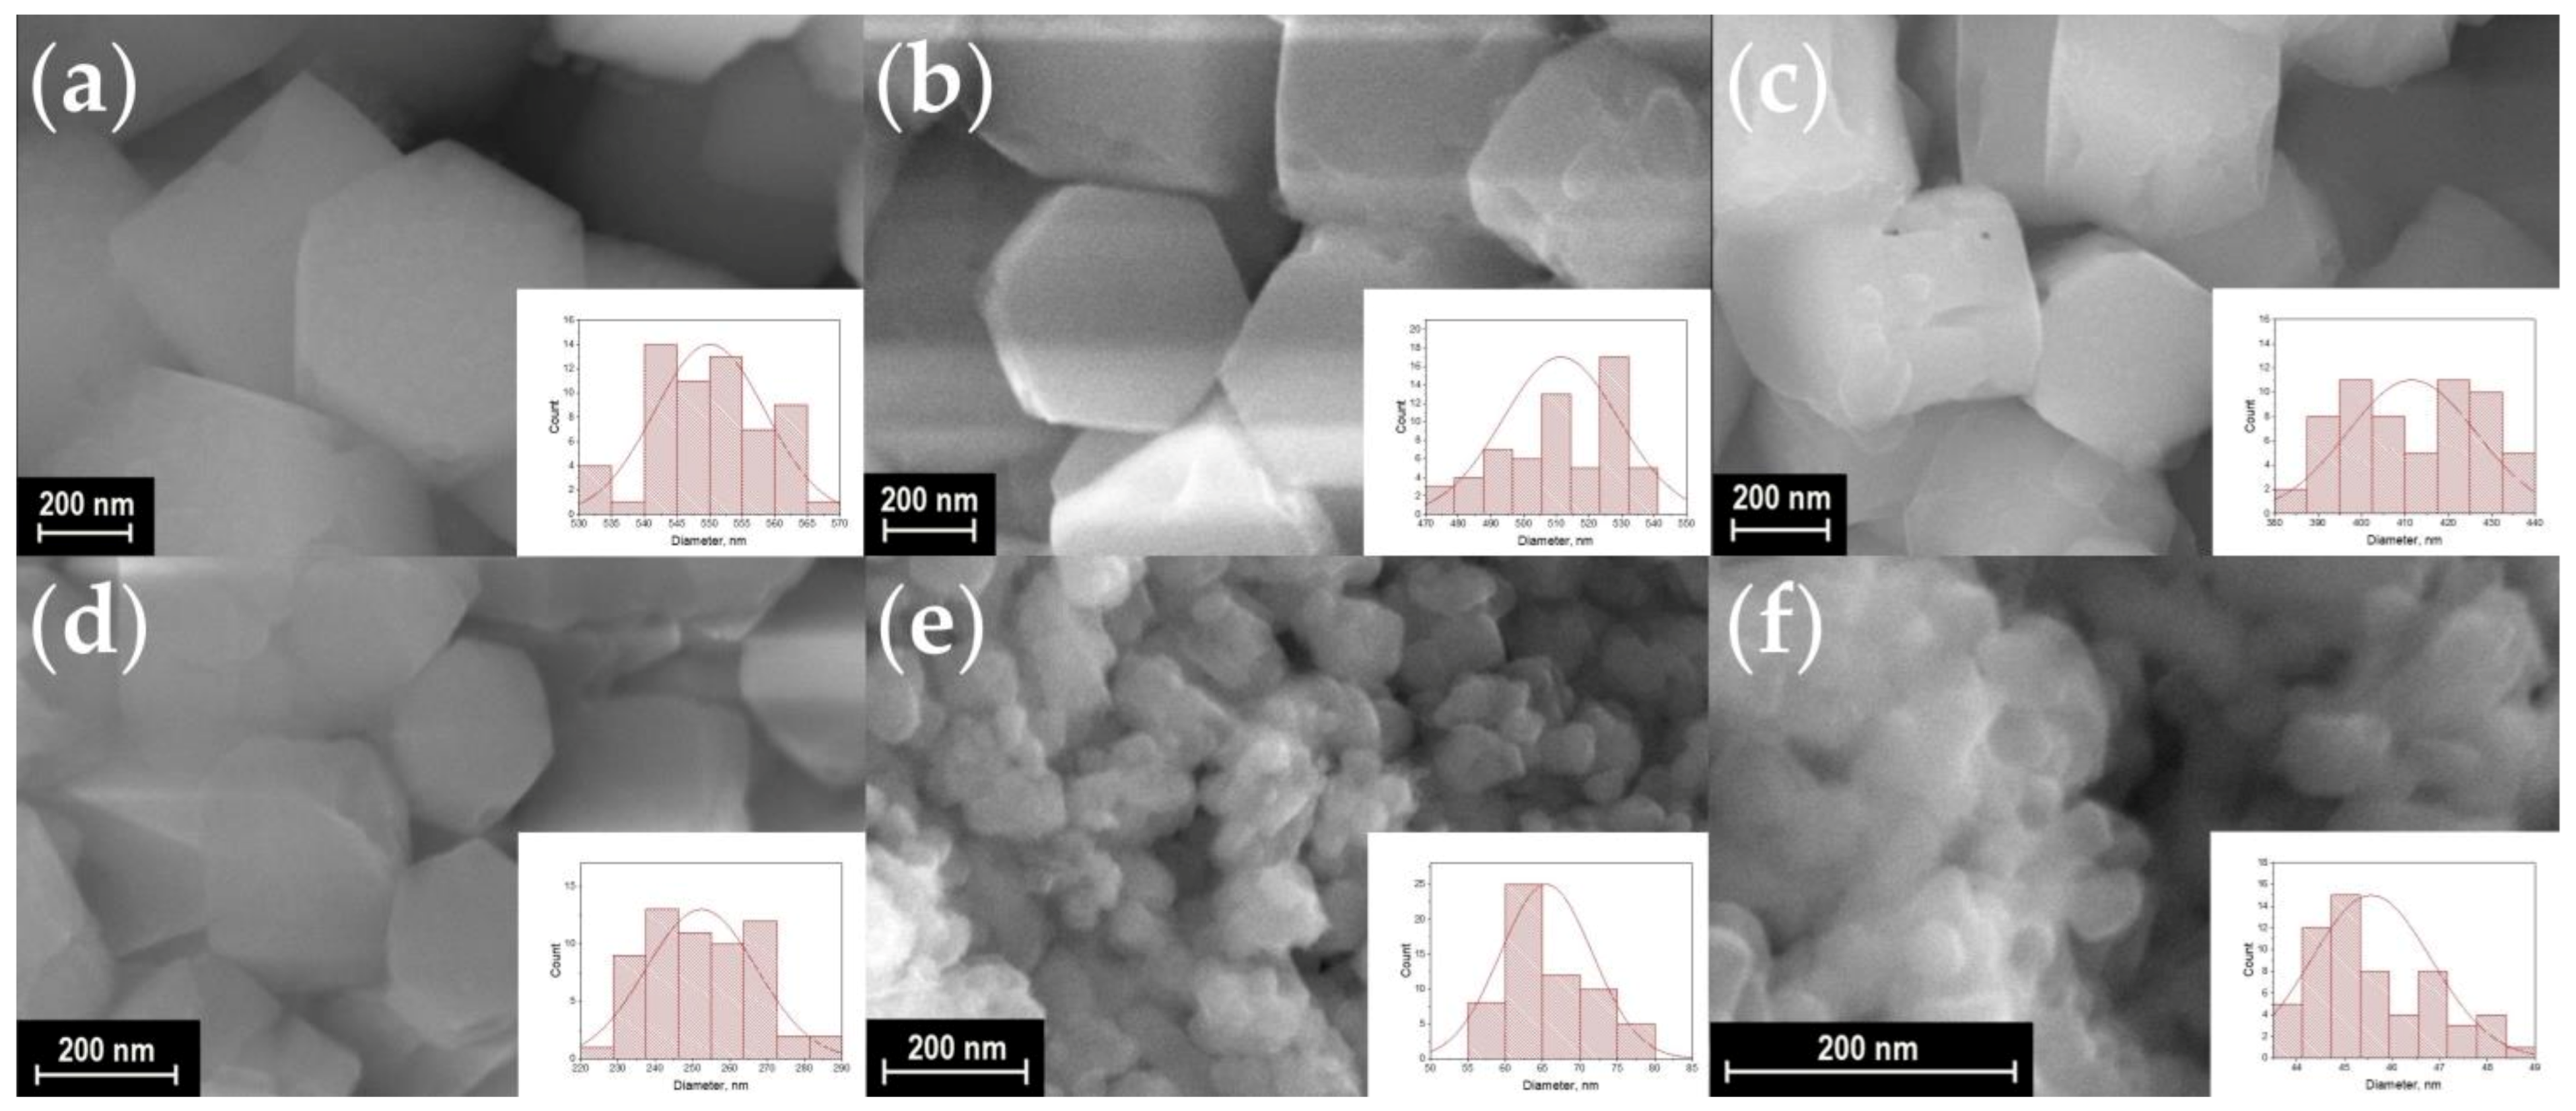
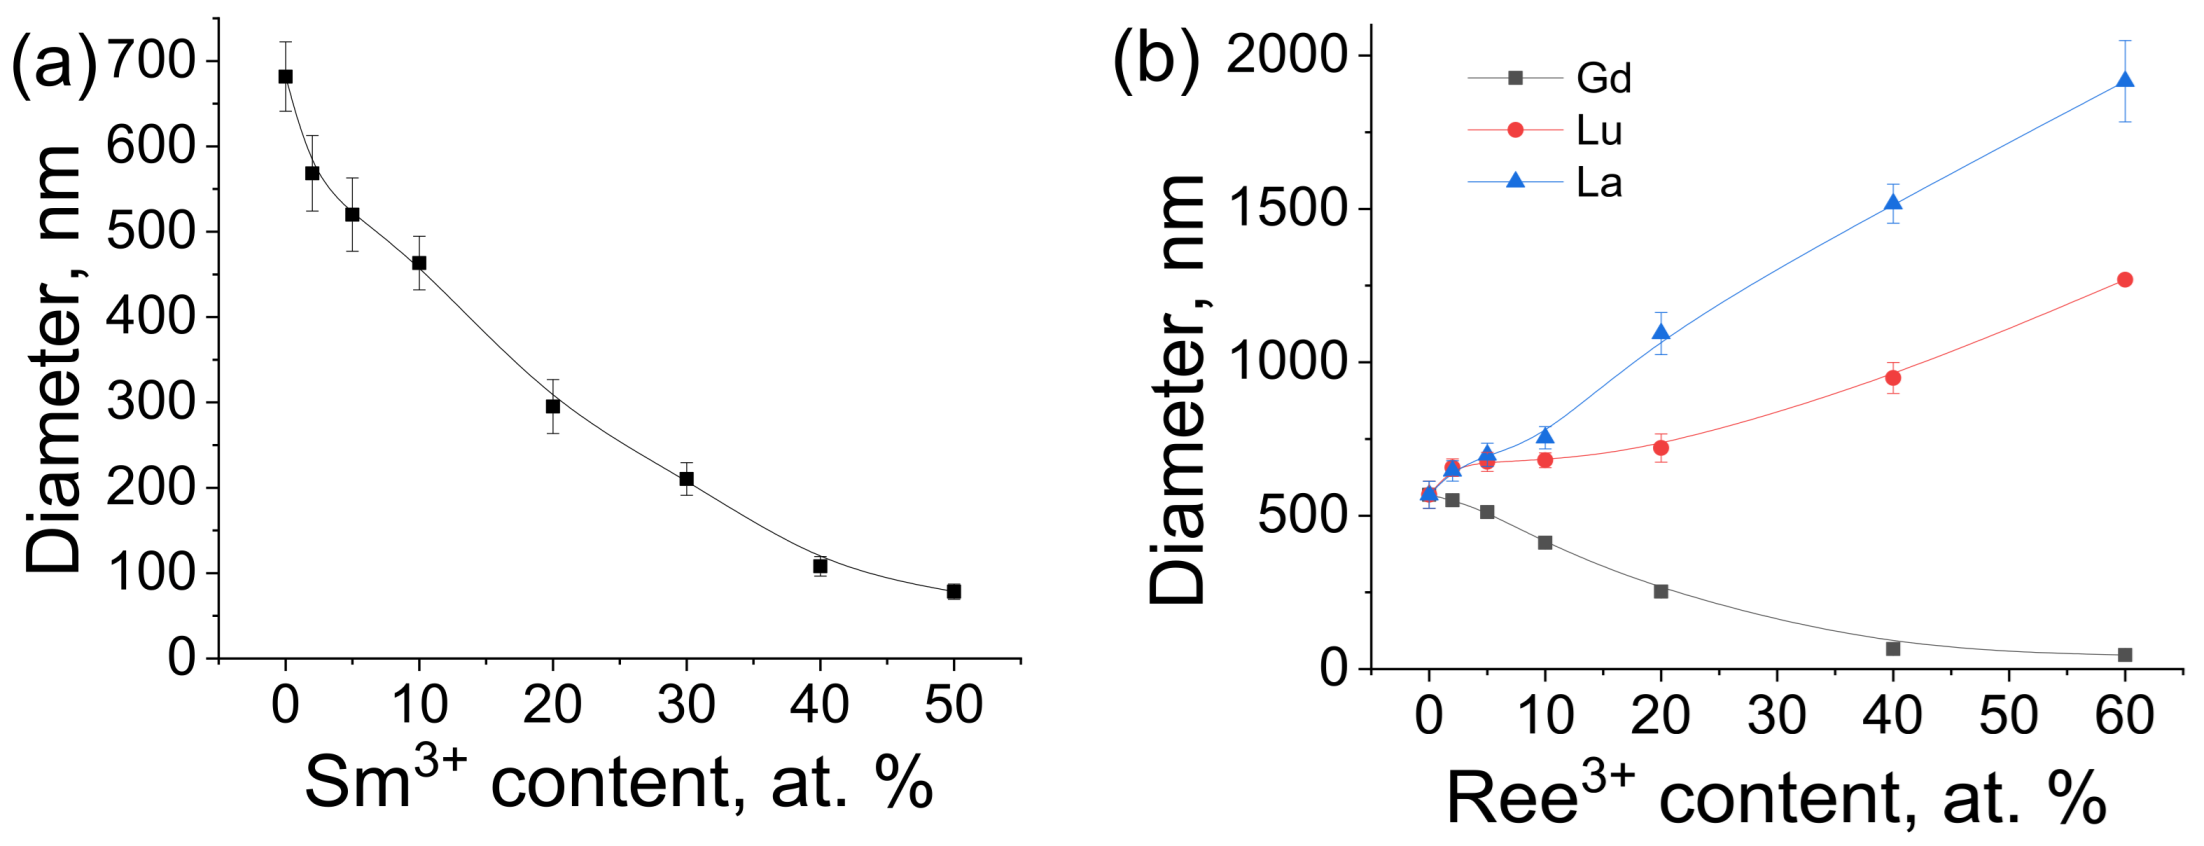
The powder X-ray diffraction (PXRD) patterns are shown in Figure 1a–d). Analysis of PXRD patterns demonstrates that all synthesized materials of three series (NaY1−xSmxF4, NaY0.98−xSm0.02GdxF4 and NaY0.98−xSm0.02LuxF4) have the same crystalline phase, which corresponds to the hexagonal β-NaYF4 (JCPDS No. 16-0334). Additional diffraction peaks corresponding to the impurities are not observed. In opposition to the abovementioned series, we have found that substitution of yttrium by the lanthanum ions in NaY0.98−xSm0.2LaxF4 series results in the formation of either β-NaYF4 or LaF3 (JCPDS No. 32-0483) crystalline phases depending on the lanthanum content. Thus, at the lanthanum content less 20 at.% and less, only β-NaYF4 crystalline phase is formed similarly to other series. At the lanthanum content of 40 at.%, β-NaYF4 or LaF3 phases coexist. At the content of lanthanum of the 60 at.%, compounds precipitate exclusively in a form of LaF3 phase.
Unit cell parameters were refined using UnitCell software [38]. This program can retrieve unit cell parameters from diffraction data using a method of least squares from the positions of the indexed diffraction maxima of the PXRD patterns (Pawley method [39]). The uncertainties of unit cell parameters are shown in parenthesis in Tables S1–S4, Supplementary Materials. The dependence of refined unit cell volumes on the sample composition is shown in Figure 2. Unit cell volume linearly depends on dopant concentration, therefore, Vegard’s law [40] obeys the studied systems; hence, Ln3+ (Ln = Sm, Gd, Lu, La) ions isomorphically substitutes Y3+ ions in the β-NaYF4 structure. For compounds NaY1−xSmxF4, the increase in Sm3+ content leads to unit cell volumes increase due to a higher ionic radius of Sm3+ ions (1.132 Å, the coordination number is nine) than the ionic radius of Y3+ ions (1.075 Å) [41]. Similarly, the doping of NaY0.98Sm0.2F4 by lanthanide (III) ions with higher ionic radius than Y3+ ions (Gd3+: 1.107 Å; La3+: 1.216 Å) results in increasing the unit cell volumes. Moreover, for the NaY0.98−xSm0.02LaxF4 series, unit cell volume increases significantly faster than for the NaY0.98−xSm0.02GdxF4 one because La3+ ions have a larger ionic radius than Gd3+. Meanwhile, the unit cell volumes for NaY0.98−xSm0.02LuxF4 series decrease upon lutetium concentration rise, which can be similarly explained by the lower ionic radius of Lu3+ ions (1.032 Å) than the ionic radius of Y3+ ions.

3.2. Morphology

A scanning electron microscope (SEM) was used to observe the shape and size of the particles in synthesized materials. SEM images of the synthesized materials are shown in Figure 3, Figure 4, Figure 5 and Figure 6. The particles have the shape of hexagonal prisms. The particle diameter was obtained from SEM images, the particle size distribution is shown in the inserts of Figure 3, Figure 4, Figure 5 and Figure 6. The average diameter of the particle was calculated from this distribution and is given in the legends in Figure 3, Figure 4, Figure 5 and Figure 6. The particle size strongly depends on the sample composition ranging from 46 to 1916 nm. In the NaY1−xSmxF4 series, the size reduction is observed upon increasing the samarium content, Figure 3 and Figure 7. Thus, the NaYF4 particles have an average size of 682 ± 41 nm, whereas NaY0.5Sm0.5F4 particles are significantly smaller, 78 ± 9 nm. In the NaY0.98−xSm0.02LnxF4 (Ln = La, Gd, Lu) series (Figure 3b, Figure 4, Figure 5 and Figure 6), the substitution of the yttrium ion by the lanthanum and lutetium ions results in particle size increase, whereas particle size reduction is observed upon gadolinium doping, Figure 7. This observation can be explained by the mechanism of crystal growth [10]. We assume that the particle size is determined by nucleation and crystal growth rates. If the nucleation rate is larger than the crystal growth rate, small single crystals are formed. In the opposite case, when nucleation is slow, but crystal growth is fast, large single crystals are formed. The crystal growth rate is significantly affected by the Cit3− and Na+ adsorption on (1010) and (0001) facets, respectively [17,42]: adsorption of the ions on the grain facets slows down crystal growth [42,43], therefore, higher adsorption of ions on the crystal nuclei results in lower particle size. The ionic radius decreases in the row La3+-Sm3+-Gd3+-Y3+-Lu3+, therefore, surface charge density increases in this order. Nucleation is faster for ions with larger ionic radius, which means that this process slows down in the row La3+-Sm3+-Gd3+-Y3+-Lu3+. Adsorption of Cit3− and Na+ ions is more pronounced for the particles with higher surface charge density increasing from La3+ to Lu3+. Therefore, the observed particle size reduction upon substitution of the yttrium ion to La3+, Sm3+, and Gd3+ ions is dominated by the decrease in crystal growth rate due to the adsorption of Na+ and Cit3− ions inhibiting crystal growth. We assume that from Gd to Lu, the crystal growth rate changes insignificantly because the large amount of Na+ and Cit3− ions covers the crystal grain surface, and additional Na+ and Cit3− adsorption is not favorable anymore. At the same time, the nucleation rate monotonically decreases from La3+ to Lu3+, which explains the particle size growth upon substitution of the yttrium by lutetium ions. We found that co-doping of the large amounts of La3+ ions results in the formation of the two types of hexagonal particles of significantly different sizes (Figure 4e,f). Thus, the NaY0.58Sm0.02La0.4F4 compound consists of large (1517 ± 64 nm) and small (254 ± 16 nm) particles. The average size of the NaY0.38Sm0.02La0.6F4 sample also contains two sorts of particles with an average size of 1916 ± 132 and 102 ± 9 nm. The fraction of the smaller particles significantly increases from 40 to 60 at.% La3+, therefore, according to PXRD data, we assume that larger particles correspond to β-NaLnF4 and smaller particles are attributed to the LnF3 crystalline phase.

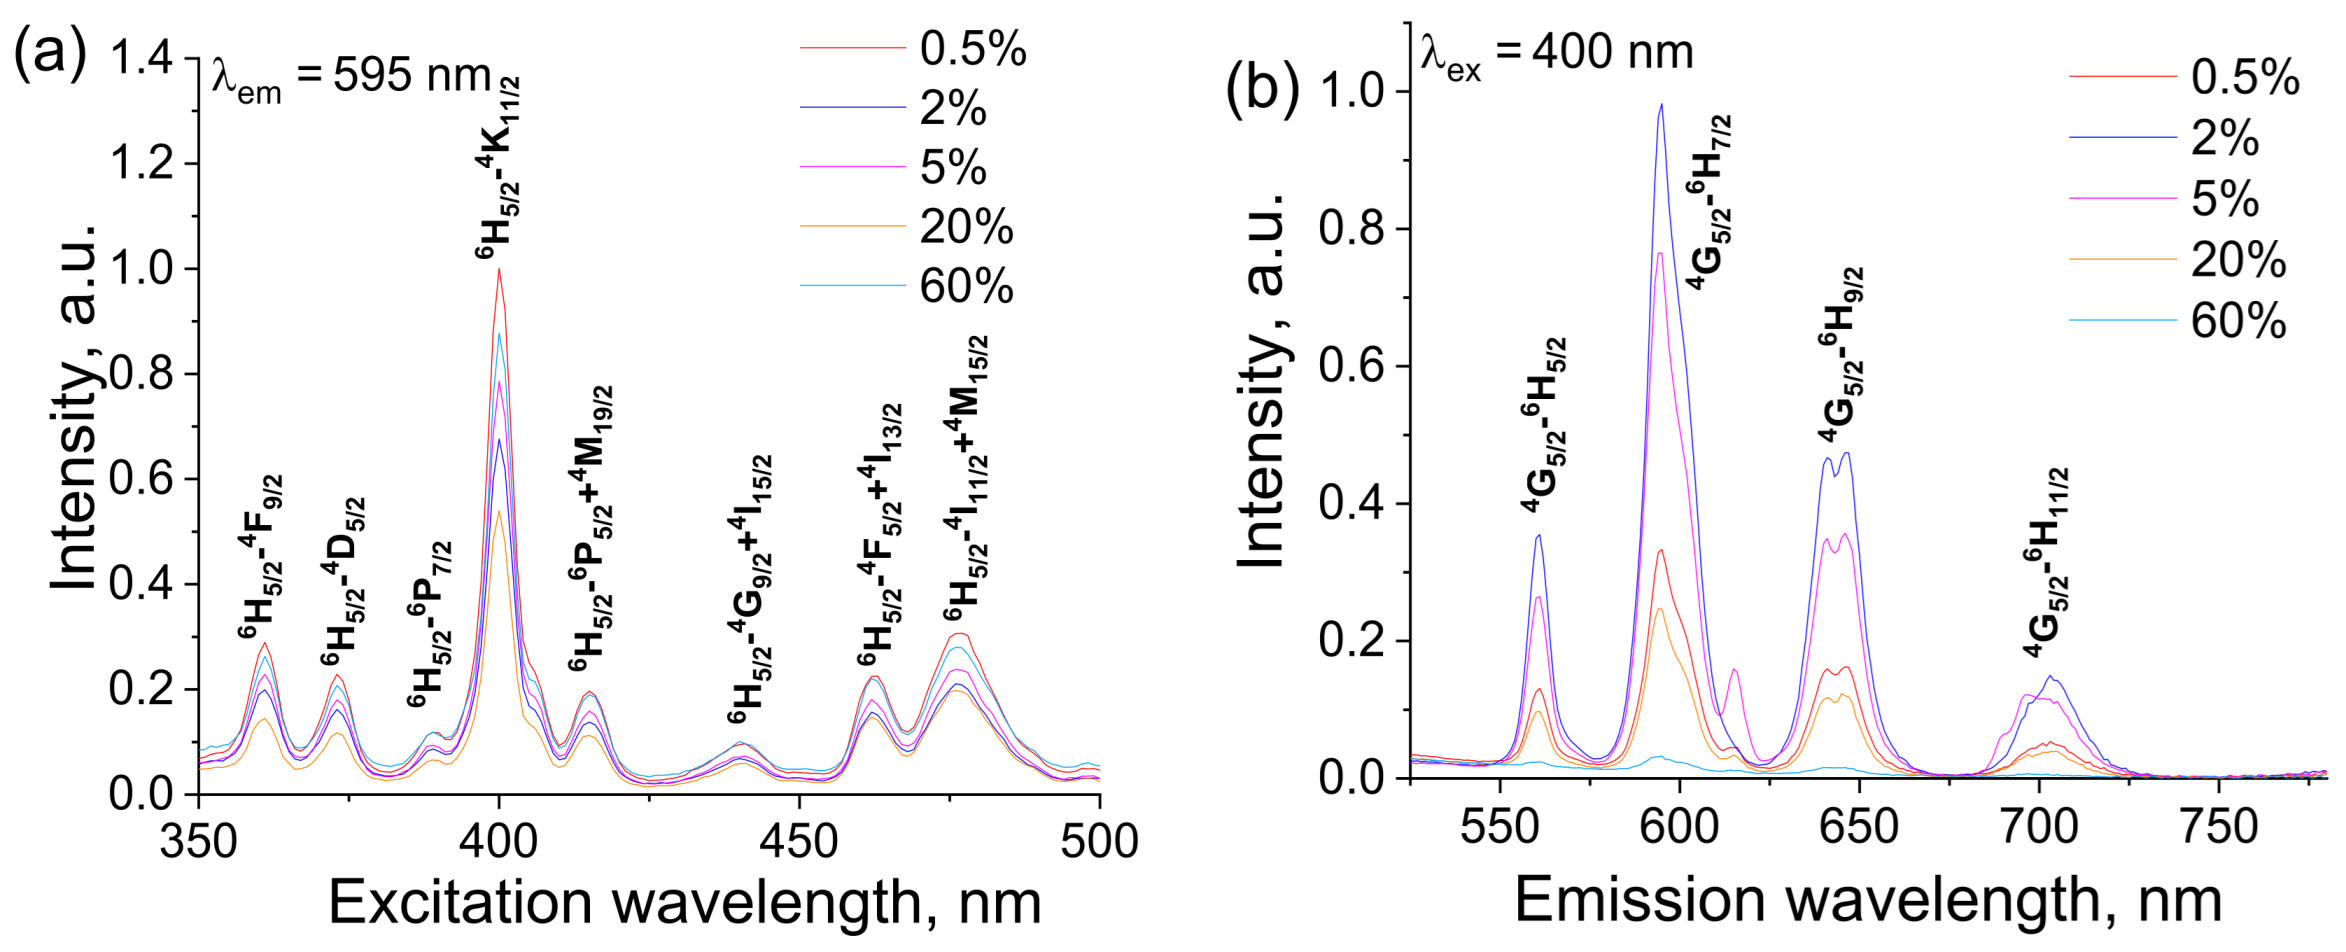
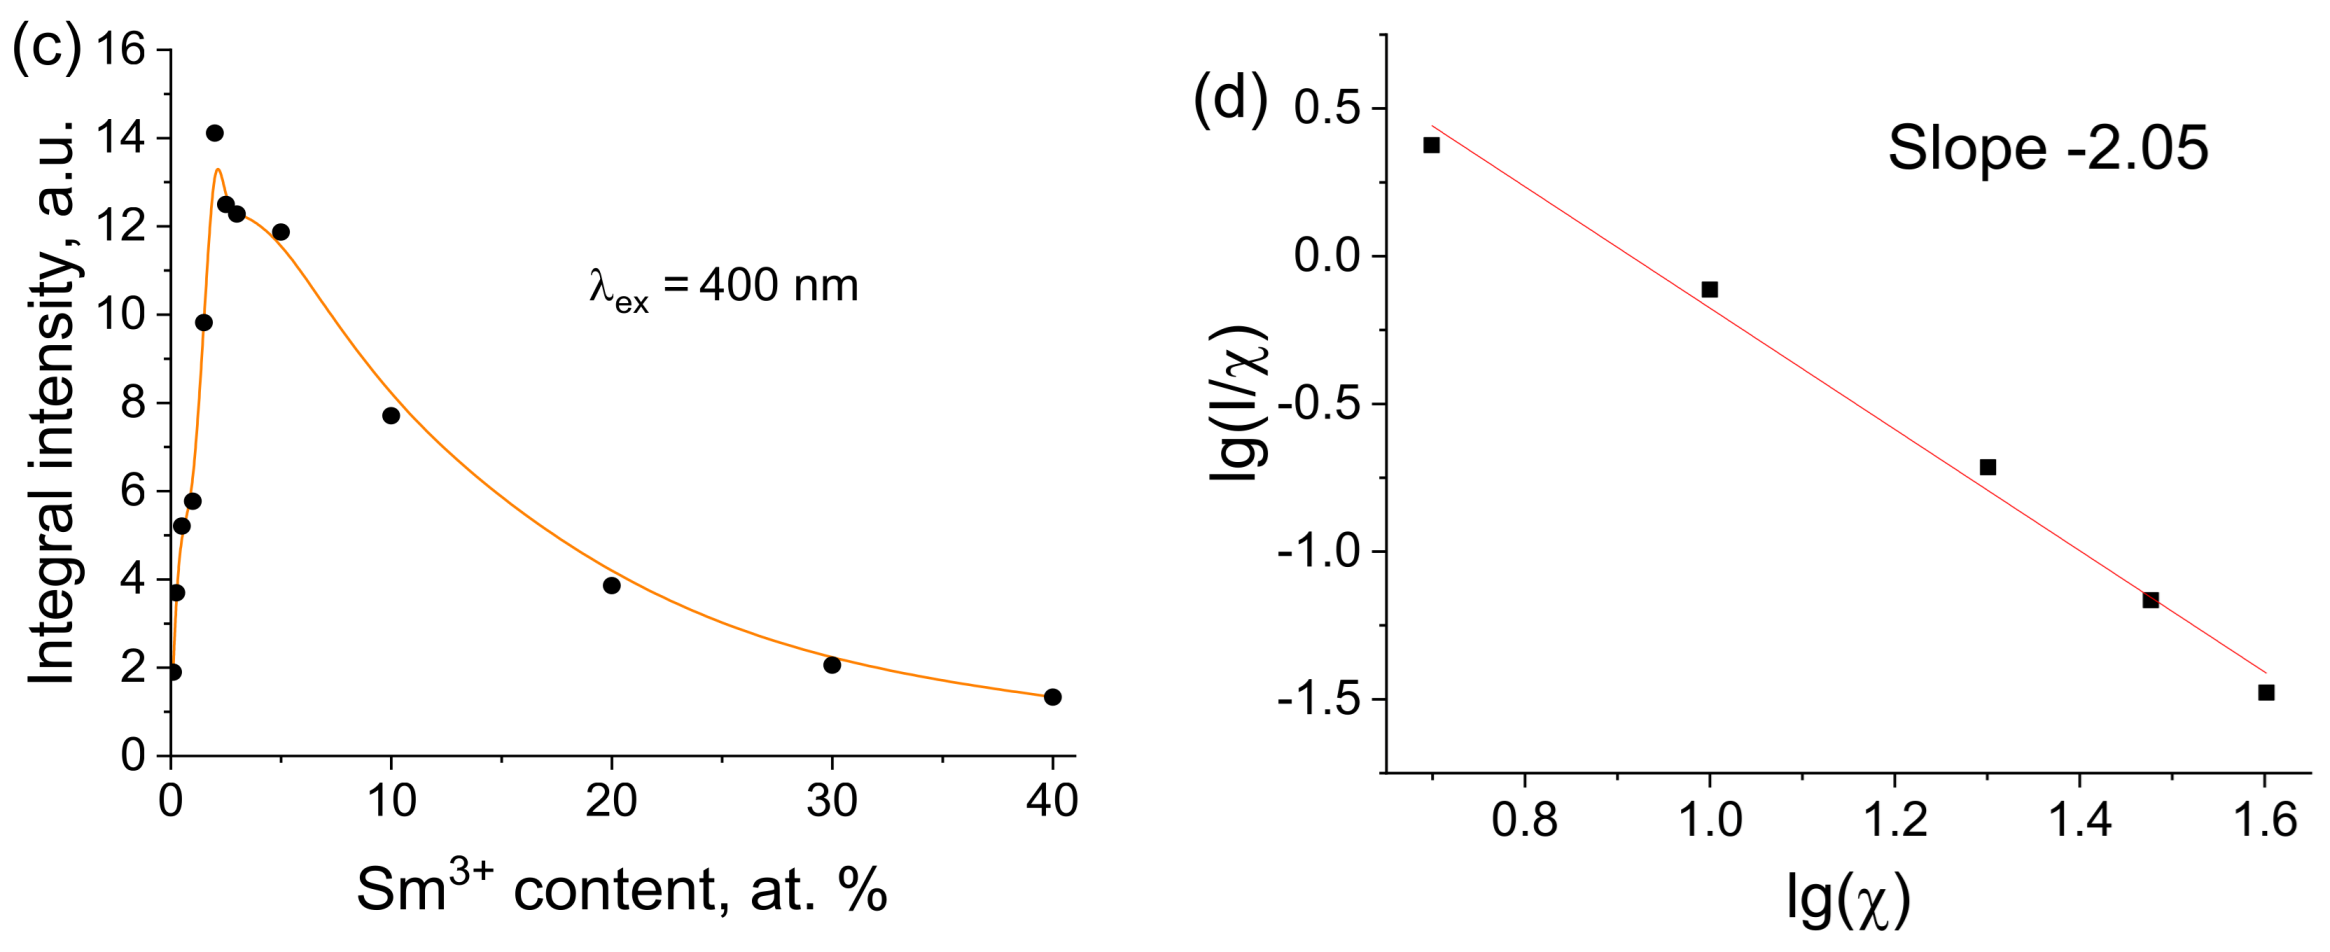
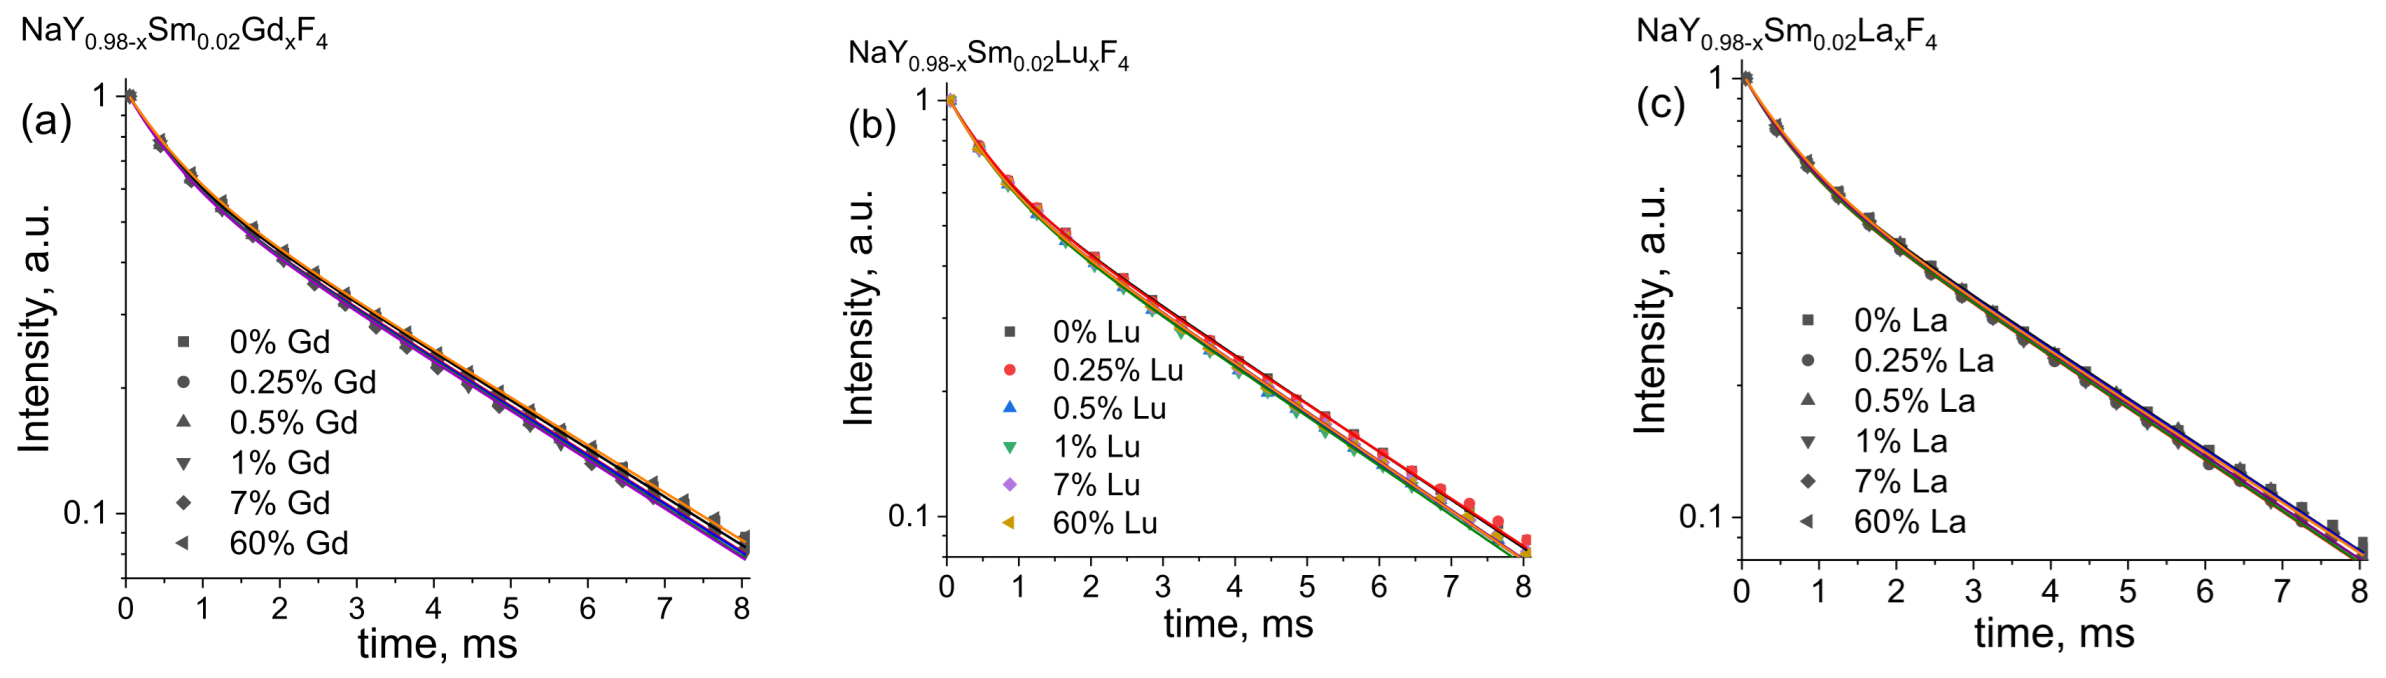
3.3. Luminescence Properties

Excitation spectra of NaY1−xSmxF4 samples monitored at the 5G5/26H7/2 (595 nm) transition were in the spectral range of 350–500 nm, Figure 8a. One can see that spectra consist of sharp peaks attributed to the f-f electron transitions of the Sm3+ ion: 6H5/24F9/2 (361 nm), 6H5/24D5/2 (373 nm), 6H5/26P7/2 (389 nm), 6H5/24K11/2 (400 nm), 6H5/26P5/2 + 4M19/2 (415 nm), 6H5/24G9/2 + 4I15/2 (440 nm), 6H5/24F5/2 + 4I13/2 (462 nm) and 6H5/24I11/2 + 4M15/2 (476 nm). The 6H5/24K11/2 transition centered at 400 nm is dominated in the obtained spectra. Figure 8b presents emission spectra of NaY1−xSmxF4 concentration series upon 400 nm excitation into the 6H5/24K11/2 band. Emission spectra included lines corresponding to transitions from excited 4G5/2 to lower 6HJ levels: 4G5/26H5/2 (561 nm), 5G5/26H7/2 (595 nm), 4G5/26H9/2 (641, 646 nm) and 4G5/26H11/2 (703 nm). The most prominent transition in the spectra was the 5G5/26H7/2 transition. Analysis of the emission spectra has demonstrated that the spectral shape excitation and emission spectra do not depend on the Sm3+ content, whereas the Sm3+ doping concentration significantly affected the emission intensity, Figure 8a,b. The concentration dependence of integral intensities of the 5G5/26H7/2 emission band is presented in Figure 8c. The emission intensity non-monotonically depends on the Sm3+ concentration reaching the maximum at the Sm3+ content of 2 at.% (x = 0.02). Such type of concentration dependence can be explained by the two competitive effects in phosphors upon Sm3+ concentration rise [44,45]. Thus, the rise of the number of luminescent sites results in radiative emission probability increase and, as a result, the emission intensity increase. At the same time, upon Sm3+ concentration rise, the distance between Sm3+ ions decreases resulting in the nonradiative processes probability increase, which leads to the emission quenching. If doping ions occupy a single crystallographic position in the host, the energy transfer mechanism is determined by the critical energy transfer distance (Rc). This distance can be calculated by the following formula [46]:
R c = 2 3 V 4 π χ c N 1 3 ,
where χ c is a critical concentration of luminescent ion (0.02), V is unit cell volume for NaY0.98Sm0.02F4 (109.64 Å3), N —number of cation sites in crystal structure (1.5 for β-NaYF4 [47]). Using these parameters, the critical energy transfer distance R c in NaY1−xSmxF4 is calculated to be of 19.11 Å. According to Blasse theory [46], when R c > 5 Å, the main contribution to non-radiative energy transfer occurs by the multipole–multipole interactions. At high samarium (III) concentration, the probability of radiative emission is constant; therefore, the energy transfer between Sm3+ ions in the NaYF4 host is dominated by the multipole–multipole interactions. For the determination of interaction type, Van Uitert [48] proposed an equation, which later was modified by Ozawa and Jaffe [49]:
I χ = k 1 + β χ θ 3 ,
where I is integral intensity, χ is the concentration of the luminescent ion. Assuming that β χ θ 3 ≫ 1, one can build the linearized coordinates lg I χ lg χ (Figure 8d). Linear fitting of dependence in these coordinates gives the value θ 3 = 2.05. It is known that dipole–dipole, dipole–quadrupole, and quadrupole–quadrupole interactions correspond to θ values of 6, 8, and 10, respectively [50]. For NaY1−xSmxF4, θ = 6, therefore nonradiative energy transfer between samarium (III) ions in the NaYF4 host is caused by dipole–dipole interactions.
Luminescence decay curves of NaY1−xSmxF4 phosphors monitored at 595 nm (5G5/26H7/2 transition) upon 400 nm excitation are presented in Figure 9a. All experimental decay curves displayed non-single exponential behavior and, therefore, bi-exponential models were applied for fitting (Equation (3)). The best-fit parameters are given in Table S5 (Supplementary Materials). Bi-exponential decay of small-sized materials is usually explained by the presence of two types of luminescent ions situated in the volume and on the surface of the particles, which have different decay times [51,52]. Sm3+ ions situated on the surface display lower lifetimes due to a higher probability of quenching.
I t = A 1 e t τ 1 + A 2 e t τ 2 ,
where A1 and A2 are pre-exponential constants, and τ1 and τ2 are fitting lifetimes.
Average luminescence lifetime (τav), which corresponds to the 5G5/2 level lifetime, was calculated according to the following equation to simplify comparison [53,54]:
τ av = A 1 τ 1 2 + A 2 τ 2 2 A 1 τ 1 + A 2 τ 2 ,
The Sm3+ concentration dependence of the obtained lifetimes is shown in Figure 9b. One can see a monotonic decrease in the lifetimes from 4.3 ms to 0.4 ms along with the increase in samarium concentration. Such behavior is most likely linked to the growth of the nonradiative decay rate due to the increase in spatial energy migration followed by further quenching of impurities.
Further studies were devoted to the co-doping effect of non-luminescent Gd3+, Lu3+, and La3+ ions on the luminescence properties of NaYF4: Sm3+ powders. As was demonstrated earlier, Sm3+ optimum concentration is 2%, so this samarium concentration was used for samples with Gd3+, Lu3+, and La3+ co-doping. Emission spectra of NaY0.98−xSm0.02LnxF4 (Ln = Gd, Lu, La) compounds upon 400 nm excitation, Figure 10a–c. One can notice that Gd3+, Lu3+, and La3+ co-doping affect only the emission intensity and alternate neither the positions of the emission bands corresponding to 4G5/2-6HJ transitions nor their relative intensities. In order to estimate this effect, the integral emission intensities corresponding to the most intense 5G5/26H7/2 transition of Sm3+ ions (595 nm) were calculated and plotted in Figure 10d–f relative to the NaY0.98Sm0.02F4 sample. We found that co-doping by the abovementioned rare earth ions results in an increase in the luminescence intensities. Thus, the substitution of Y3+ ion by Gd3+ results in the most emission enchantment up to 2.4 times, Figure 10d. The maximum emissions intensities are observed for the Gd3+ content of 0.5 and 10 at.% corresponding to the increase in the luminescence intensity at 2.4, and 2.2 times, respectively. The co-doping of NaY0.98Sm0.02F4 compound by Lu3+ ion results in emission enchantment up to 2.1 times, the maximum effect is observed for the lutetium content of 1 at.%, Figure 10e. The least prominent effect is observed for co-doping of NaY0.98Sm0.02F4 materials by La3+ ion, where the emission enchantment is barely noticeable, Figure 10f. Therefore, it is difficult to mention the precise position of the La3+ concentration corresponding to the largest effect. To reveal the mechanism of the luminescence enhancement effect by Gd3+, Lu3+, and La3+ co-doping, the luminescence kinetics was studied for the samples with various concentrations of co-doping ions. Luminescence decay curves of NaY0.98−xSm0.02LnxF4 (Ln = Gd, Lu, La) phosphors monitored at 595 nm (5G5/26H7/2 transition) upon 400 nm excitation are presented in Figure 11. All experimental decay curves displayed non-single exponential behavior and two exponential models were applied for fitting (Equation (3)). The best-fit parameters are given in Tables S6–S8 (Supplementary Materials). The average luminescence lifetimes, which correspond to the 5G5/2 level lifetimes, were calculated using Equation (4) and given in Table 1. We revealed that co-doping of NaY0.98Sm0.02F4 by Gd3+, Lu3+, and La3+ does not result in a change in the 5G5/2 excited state lifetime. Therefore, the substitution of yttrium ions by gadolinium, lutetium, and lanthanum ions does not change the probability of the 4G5/2-6HJ radiative transition.
Emission enhancement resulting from Gd3+, Lu3+, and La3+ co-doping of NaY0.98Sm0.02F4 materials, in principle, can be caused by the absorption and/or emission probability increase. However, in the second case, excited state lifetimes must change, which is not observed in our experiments. Therefore, one can conclude, that doping by Ln3+ ions results in changing only extinction coefficients due to the changing probability of symmetry forbidden 6H5/24K11/2 transition. Luminescence intensity enhancement resulted from co-doping of Eu3+-containing materials by non-luminescent ions such as Bi3+, Gd3+, alkali, and alkali earth metal ions was reported previously [11,26,27,55,56,57,58,59,60,61,62,63,64]. The observed effect was explained by structure distortion due to the difference between radii of substituted and doping ions resulting in the increase in the emission and absorption probabilities. In our case, Gd3+, Lu3+, and La3+ co-doping of NaY0.98Sm0.02F4 materials at low concentrations of the dopant results in symmetry lowering of Sm3+ local environment that leads to an increase in the absorption probability and, obviously, extinction coefficients [57,65]. Indeed, the maximum emission effect is observed when about 1% yttrium ions are substituted with gadolinium or lutetium ions. Meanwhile, compounds containing a significant amount of gadolinium ions also demonstrate larger emission intensity than NaY0.98Sm0.02F4. A similar effect was observed by Martins and co-workers [66] where co-doping of Y2O3: Eu3+ by Gd3+ ions resulted in an increase in the emission intensity. They explain this phenomenon of partial absorption by the host Gd2O3 matrix followed by the energy transfer to Gd3+ ion, and then from Gd3+ to Eu3+ ion. It is known, that the β-NaYF4 host absorbed light at 200–450 nm [7]. Most probably, the addition of Gd3+ ion results in the more prominent absorption of β-NaYF4: Gd3+ matrix at the same range of UV spectrum. We propose that 400 nm excitation of NaY0.98−xSm0.02GdxF4 promotes β-NaYF4: Gd3+ host matrix into the excited state (in parallel with 6H5/24K11/2 transition of Sm3+ ion) followed by energy transfer from the host matrix to Sm3+ ions, which results in increases in luminescence intensities relative to NaY0.98Sm0.02F4.

4. Conclusions

In the present work, four series of NaYF4 particles doped with Sm3+, Gd3+, Lu3+, and La3+ ions, NaY1−xSmxF4 (x = 0–0.5) and NaY0.98−ySm0.02LnyF4 (Ln = Gd, Lu, La; y = 0–0.6), were synthesized by a hydrothermal method at a temperature of 180 °C using citric acid as a stabilizing agent. Analysis of PXRD patterns demonstrated that NaY1−xSmxF4 and NaY0.98−xSm0.02LnxF4 (Ln = Lu, Gd) have similar crystal structures corresponding to the hexagonal β-NaYF4. For the NaY0.98−xSm0.2LaxF4 series, the β-NaYF4 crystalline phase is dominated at La3+ content up to 20%. At higher La3+ concentrations, the solid solutions are formed as a LaF3 crystalline phase. Among the β-NaYF4 phase, unit cell volumes linearly depend on dopant concentration, which demonstrates that Sm3+, Gd3+, Lu3+, and La3+ ions isomorphically substitute Y3+ ions in the β-NaYF4 structure. Sm3+, Gd3+, and La3+ doping results in unit cell volumes increase because the Y3+ ion has a smaller ionic radius (1.075 Å) than Sm3+ (1.132 Å) and Gd3+ (1.107 Å) ions. The substitution of Y3+ ions by smaller Lu3+ ions (1.032 Å) leads to unit cell volume reduction. According to SEM data, particles of all synthesized compounds have the shape of hexagonal prisms and sizes ranging from 46 to 1916 nm depending on the sample composition. In the NaY1−xSmxF4 series, the substitution of Y3+ by Sm3+ ions leads to the particle size reduction from 682 nm (NaYF4) down to 78 nm (NaY0.5Sm0.5F4). Co-doping of NaY0.98Sm0.02F4 by La3+ and Lu3+ ions results in particle size increases due to faster growth (for La3+) and slower nucleation (for Lu3+) [10]. In contrast to La3+ and Lu3+, co-doping of these materials by Gd3+ ions leads to particle size reduction because the lowest growth/nucleation rates are characteristic of Gd3+. All synthesized compounds demonstrate photoluminescence under 400 nm excitation (6H5/24K11/2 transition in Sm3+). Experimental Sm3+ optimal doping concentration in β-NaYF4 host is 2%. Further increasing of Sm3+ concentration leads to strong quenching due to dipole–dipole interactions between Sm3+ ions. We demonstrated that co-doping by different non-luminescent Ln3+ ions (where Ln is not only Gd, but also La and Lu) in low dopant concentration (in the range from 0 to 10 at.%) results in increasing luminescent intensities. Co-doping of NaY0.98Sm0.02F4 by Gd3+, Lu3+, and La3+ ions does not lead to the change in 4G5/2 excited state lifetimes, therefore co-doping by non-luminescent ions leads to increase in absorption probability due to the Sm3+ local symmetry distortion. Therefore, we discovered that enhancement of luminescence intensity as a result of co-doping by non-luminescent Gd3+, Lu3+, and La3+ ions is a general phenomenon and can be applied to improve the optical properties of a wide range of inorganic REE-containing phosphors.

Supplementary Materials

The following supporting information can be downloaded at: https://www.mdpi.com/article/10.3390/ma16062157/s1, Table S1: Unit cell parameters of the NaY(1−x)SmxF4 samples; Table S2: Unit cell parameters of the NaY(0.98−x)Sm0.02LaxF4 samples; Table S3: Unit cell parameters of the NaY(0.98−x)Sm0.02GdxF4 samples; Table S4: Unit cell parameters of the NaY(0.98−x)Sm0.02LuxF4 samples; Table S5: Pre-exponential constants, fitting lifetimes, and average luminescence lifetimes of NaY(1−x)SmxF4 powders; Table S6: Pre-exponential constants, fitting lifetimes and average luminescence lifetimes of NaY(0.98−x)Sm0.02GdxF4 powders; Table S7: Pre-exponential constants, fitting lifetimes and average luminescence lifetimes of NaY(0.98−x)Sm0.02LuxF4 powders; Table S8: Pre-exponential constants, fitting lifetimes and average luminescence lifetimes of NaY(0.98−x)Sm0.02LaxF4 powders.

Author Contributions

Conceptualization, A.S.M.; methodology, A.A.B., T.S.B. and A.S.M.; formal analysis, A.A.B., T.S.B., V.G.N., I.E.K. and A.S.M.; investigation, P.B.G., A.A.B., T.S.B. and A.S.M.; resources, N.A.B., M.Y.S. and A.S.M.; data curation, I.E.K., A.A.B., T.S.B. and A.S.M.; writing—original draft preparation, N.A.B., V.G.N. and A.S.M.; writing—review and editing, N.A.B., V.G.N., S.N.O., M.S.P., M.N.R. and A.S.M.; visualization, A.A.B., T.S.B. and A.S.M.; supervision, A.S.M.; project administration, N.A.B., M.Y.S. and A.S.M.; funding acquisition, A.S.M. All authors have read and agreed to the published version of the manuscript.

Funding

This research was funded by the Fellowship of the President of Russia MD-1191.2022.1.3.

Institutional Review Board Statement

Not applicable.

Informed Consent Statement

Not applicable.

Data Availability Statement

The data presented in this study are available in this article.

Acknowledgments

The measurements were performed in the Research Park of Saint Petersburg State University (Magnetic Resonance Research Centre, Chemical Analysis and Materials Research Centre, Cryogenic Department, Interdisciplinary Resource Centre for Nanotechnology, Centre for X-ray Diffraction Studies, Centre for Optical and Laser Materials Research, Thermogravimetric and Calorimetric Research Centre, and Centre for Innovative Technologies of Composite Nanomaterials). This article was published in commemoration of the 300th anniversary of St Petersburg State University’s founding.

Conflicts of Interest

The authors declare no conflict of interest.

References

  1. Jaque, D.; Maestro, L.M.; del Rosal, B.; Haro-Gonzalez, P.; Benayas, A.; Plaza, J.L.; Rodríguez, E.M.; Solé, J.G. Nanoparticles for Photothermal Therapies. Nanoscale 2014, 6, 9494–9530. [Google Scholar] [CrossRef]
  2. Du, K.; Feng, J.; Gao, X.; Zhang, H. Nanocomposites Based on Lanthanide-Doped Upconversion Nanoparticles: Diverse Designs and Applications. Light Sci. Appl. 2022, 11, 222. [Google Scholar] [CrossRef]
  3. Cao, C.; Liu, Q.; Shi, M.; Feng, W.; Li, F. Lanthanide-Doped Nanoparticles with Upconversion and Downshifting Near-Infrared Luminescence for Bioimaging. Inorg. Chem. 2019, 58, 9351–9357. [Google Scholar] [CrossRef]
  4. Ansari, A.A.; Labis, J.P.; Khan, A. Biocompatible NaYF4:Yb,Er Upconversion Nanoparticles: Colloidal Stability and Optical Properties. J. Saudi Chem. Soc. 2021, 25, 101390. [Google Scholar] [CrossRef]
  5. Liu, L.; Cheng, L.; Xu, S.; Qi, X.; Liu, Z.; Zhang, X.; Chen, B.; Hua, R. Study on Optical Temperature Sensing Properties of β-NaYF4:Tm3+/Yb3+ Nanoparticles. Mater. Res. Bull. 2018, 106, 353–356. [Google Scholar] [CrossRef]
  6. Tong, L.; Li, X.; Hua, R.; Cheng, L.; Sun, J.; Zhang, J.; Xu, S.; Zheng, H.; Zhang, Y.; Chen, B. Optical Temperature Sensing Properties of Yb3+/Tm3+ Co-Doped NaLuF4 Crystals. Curr. Appl. Phys. 2017, 17, 999–1004. [Google Scholar] [CrossRef]
  7. Namagal, S.; Jaya, N.V.; Muralidharan, M.; Sumithra, S. Optical and Magnetic Properties of Pure and Er, Yb-Doped β-NaYF4 Hexagonal Plates for Biomedical Applications. J. Mater. Sci. Mater. Electron. 2020, 31, 11398–11410. [Google Scholar] [CrossRef]
  8. Ge, X.; Liu, J.; Sun, L. Controlled Optical Characteristics of Lanthanide Doped Upconversion Nanoparticles for Emerging Applications. Dalton Trans. 2017, 46, 16729–16737. [Google Scholar] [CrossRef] [PubMed]
  9. Dong, H.; Du, S.-R.; Zheng, X.-Y.; Lyu, G.-M.; Sun, L.-D.; Li, L.-D.; Zhang, P.-Z.; Zhang, C.; Yan, C.-H. Lanthanide Nanoparticles: From Design toward Bioimaging and Therapy. Chem. Rev. 2015, 115, 10725–10815. [Google Scholar] [CrossRef] [PubMed]
  10. Bogachev, N.A.; Betina, A.A.; Bulatova, T.S.; Nosov, V.G.; Kolesnik, S.S.; Tumkin, I.I.; Ryazantsev, M.N.; Skripkin, M.Y.; Mereshchenko, A.S. Lanthanide-Ion-Doping Effect on the Morphology and the Structure of NaYF4:Ln3+ Nanoparticles. Nanomaterials 2022, 12, 2972. [Google Scholar] [CrossRef]
  11. Kolesnikov, I.E.; Vidyakina, A.A.; Vasileva, M.S.; Nosov, V.G.; Bogachev, N.A.; Sosnovsky, V.B.; Skripkin, M.Y.; Tumkin, I.I.; Lähderanta, E.; Mereshchenko, A.S. The Effect of Eu3+ and Gd3+ co-Doping on the Morphology and Luminescence of NaYF4:Eu3+, Gd3+ phosphors. New J. Chem. 2021, 45, 10599–10607. [Google Scholar] [CrossRef]
  12. He, L.; Zou, X.; He, X.; Lei, F.; Jiang, N.; Zheng, Q.; Xu, C.; Liu, Y.; Lin, D. Reducing Grain Size and Enhancing Luminescence of NaYF4:Yb3+, Er3+ Upconversion Materials. Cryst. Growth Des. 2018, 18, 808–817. [Google Scholar] [CrossRef]
  13. Chen, B.; Qiao, X.; Peng, D.; Fan, X. Enhanced Luminescence of NaY0.6-XCe0.1Gd0.3EuxF4 Nanorods by Energy Transfers between Ce3+, Gd3+, and Eu3+. J. Phys. Chem. C 2014, 118, 30197–30201. [Google Scholar] [CrossRef]
  14. Ding, M.; Li, Y.; Chen, D.; Lu, H.; Xi, J.; Ji, Z. Hexagonal Crown-Capped NaYF4:Ce3+/Gd3+/Dy3+ Microrods: Formation Mechanism, Energy Transfer and Luminescence Properties. J. Alloys Compd. 2016, 658, 952–960. [Google Scholar] [CrossRef]
  15. Dong, J.; Liu, Y.; Yang, J.; Wu, H.; Yang, C.; Gan, S. Monodisperse Na0.39Y0.61F2.35:Ln3+ (Ln = Dy, Tb, Eu) and NaYF4 Nano-/Micromaterials: Controllable Morphology, Porous Structure, Tunable Multicolor and Energy Transfer. J. Lumin. 2019, 207, 397–407. [Google Scholar] [CrossRef]
  16. Vidyakina, A.A.; Kolesnikov, I.E.; Bogachev, N.A.; Skripkin, M.Y.; Tumkin, I.I.; Lähderanta, E.; Mereshchenko, A.S. Gd3+-Doping Effect on Upconversion Emission of NaYF4: Yb3+, Er3+/Tm3+ Microparticles. Materials 2020, 13, 3397. [Google Scholar] [CrossRef]
  17. Sun, C.; Schäferling, M.; Resch-Genger, U.; Gradzielski, M. Solvothermal Synthesis of Lanthanide-doped NaYF4 Upconversion Crystals with Size and Shape Control: Particle Properties and Growth Mechanism. ChemNanoMat 2021, 7, 174–183. [Google Scholar] [CrossRef]
  18. Zhu, W.; Wei, Z.; Han, C.; Weng, X. Nanomaterials as Promising Theranostic Tools in Nanomedicine and Their Applications in Clinical Disease Diagnosis and Treatment. Nanomaterials 2021, 11, 3346. [Google Scholar] [CrossRef]
  19. Choi, J.; Kim, S.Y. Synthesis of Near-Infrared-Responsive Hexagonal-Phase Upconversion Nanoparticles with Controllable Shape and Luminescence Efficiency for Theranostic Applications. J. Biomater. Appl. 2022, 37, 646–658. [Google Scholar] [CrossRef]
  20. Zhou, J.; Yu, M.; Sun, Y.; Zhang, X.; Zhu, X.; Wu, Z.; Wu, D.; Li, F. Fluorine-18-Labeled Gd3+/Yb3+/Er3+ Co-Doped NaYF4 Nanophosphors for Multimodality PET/MR/UCL Imaging. Biomaterials 2011, 32, 1148–1156. [Google Scholar] [CrossRef]
  21. Zhang, Q.; O’Brien, S.; Grimm, J. Biomedical Applications of Lanthanide Nanomaterials, for Imaging, Sensing and Therapy. Nanotheranostics 2022, 6, 184–194. [Google Scholar] [CrossRef] [PubMed]
  22. Cheng, L.; Wang, C.; Liu, Z. Upconversion Nanoparticles and Their Composite Nanostructures for Biomedical Imaging and Cancer Therapy. Nanoscale 2013, 5, 23–37. [Google Scholar] [CrossRef] [PubMed]
  23. Wang, Y.; Song, M.; Xiao, L.; Li, Q. Upconversion Luminescence of Eu3+ and Sm3+ Single-Doped NaYF4 and NaY(MoO4)2. J. Lumin. 2021, 238, 118203. [Google Scholar] [CrossRef]
  24. Chen, G.; Qiu, H.; Prasad, P.N.; Chen, X. Upconversion Nanoparticles: Design, Nanochemistry, and Applications in Theranostics. Chem. Rev. 2014, 114, 5161–5214. [Google Scholar] [CrossRef]
  25. DaCosta, M.V.; Doughan, S.; Han, Y.; Krull, U.J. Lanthanide Upconversion Nanoparticles and Applications in Bioassays and Bioimaging: A Review. Anal. Chim. Acta 2014, 832, 1–33. [Google Scholar] [CrossRef]
  26. Cao, R.; Liao, C.; Xiao, F.; Zheng, G.; Hu, W.; Guo, Y.; Ye, Y. Emission Enhancement of LiLaMo2O8:Eu3+ Phosphor by Co-Doping with Bi3+ and Sm3+ Ions. Dye. Pigment. 2018, 149, 574–580. [Google Scholar] [CrossRef]
  27. Lu, J.; Mu, Z.; Zhu, D.; Wang, Q.; Wu, F. Luminescence Properties of Eu3+ Doped La3Ga5GeO14 and Effect of Bi3+ Co-Doping. J. Lumin. 2018, 196, 50–56. [Google Scholar] [CrossRef]
  28. Li, Y.; Liu, C.; Zhang, P.; Huang, J.; Ning, H.; Xiao, P.; Hou, Y.; Jing, L.; Gao, M. Doping Lanthanide Nanocrystals with Non-Lanthanide Ions to Simultaneously Enhance Up- and Down-Conversion Luminescence. Front. Chem. 2020, 8, 832. [Google Scholar] [CrossRef]
  29. Lei, L.; Chen, D.; Xu, J.; Zhang, R.; Wang, Y. Highly Intensified Upconversion Luminescence of Ca2+-Doped Yb/Er:NaGdF4 Nanocrystals Prepared by a Solvothermal Route. Chem. Asian J. 2014, 9, 728–733. [Google Scholar] [CrossRef] [PubMed]
  30. Sun, Y.; Bi, H.; Wang, T.; Sun, L.; Li, Z.; Song, H.; Sun, F.; Zhou, H.; Zhou, G.; Hu, J. Upconversion Luminescence Enhancement of β-NaYF4: Er3+/Ho3+ by Introducing Ca2+ and Multicolor Tuning by 980 Nm Pulse Excited. Mater. Sci. Eng. B Solid State Mater. Adv. Technol. 2020, 261, 114674. [Google Scholar] [CrossRef]
  31. Vidyakina, A.A.; Zheglov, D.A.; Oleinik, A.V.; Freinkman, O.V.; Kolesnikov, I.E.; Bogachev, N.A.; Skripkin, M.Y.; Mereshchenko, A.S. Microcrystalline Anti-Stokes Luminophores NaYF4 Doped with Ytterbium, Erbium, and Lutetium Ions. Russ. J. Gen. Chem. 2021, 91, 844–849. [Google Scholar] [CrossRef]
  32. Sadler, A.W.E.; Hogan, L.; Fraser, B.; Rendina, L.M. Cutting Edge Rare Earth Radiometals: Prospects for Cancer Theranostics. EJNMMI Radiopharm. Chem. 2022, 7, 21. [Google Scholar] [CrossRef] [PubMed]
  33. van de Voorde, M.; Duchemin, C.; Heinke, R.; Lambert, L.; Chevallay, E.; Schneider, T.; van Stenis, M.; Cocolios, T.E.; Cardinaels, T.; Ponsard, B.; et al. Production of Sm-153 With Very High Specific Activity for Targeted Radionuclide Therapy. Front. Med. 2021, 8, 675221. [Google Scholar] [CrossRef] [PubMed]
  34. Dutta, D.P.; Ningthoujam, R.S.; Tyagi, A.K. Luminescence Properties of Sm3+ Doped YPO4: Effect of Solvent, Heat-Treatment, Ca2+/W6+-Co-Doping and Its Hyperthermia Application. AIP Adv. 2012, 2, 042184. [Google Scholar] [CrossRef]
  35. Gao, D.; Liu, S.; Li, Y.; Cheng, L.; Zhang, X.; Zhang, J.; Xu, S.; Li, X.; Cao, Y.; Wang, Y.; et al. Auto-Combustion Synthesis of Sm3+-Doped NaYF4 Phosphors: Concentration Quenching, Optical Transition and Luminescent Properties. Mater. Chem. Phys. 2023, 297, 127388. [Google Scholar] [CrossRef]
  36. Singh, V.; Yadav, A.; Annapurna Devi, C.B.; Rao, A.S.; Singh, N. Luminescence Properties of Sm3+ Doped LaP3O9 Phosphors. Optik 2021, 242, 167264. [Google Scholar] [CrossRef]
  37. Kolesnikov, I.E.; Golyeva, E.V.; Kurochkin, M.A.; Kolesnikov, E.Y.; Lähderanta, E. Concentration Series of Sm3+-Doped YVO4 Nanoparticles: Structural, Luminescence and Thermal Properties. J. Lumin. 2020, 219, 116946. [Google Scholar] [CrossRef]
  38. Holland, T.J.B.; Redfern, S.A.T. Unit Cell Refinement from Powder Diffraction Data: The Use of Regression Diagnostics. Mineral. Mag. 1997, 61, 65–77. [Google Scholar] [CrossRef]
  39. Pawley, G.S. Unit-Cell Refinement from Powder Diffraction Scans. J. Appl. Crystallogr. 1981, 14, 357–361. [Google Scholar] [CrossRef]
  40. Denton, A.R.; Ashcroft, N.W. Vegard’s Law. Phys. Rev. A 1991, 43, 3161–3164. [Google Scholar] [CrossRef]
  41. Shannon, R.D. Revised Effective Ionic Radii and Systematic Studies of Interatomic Distances in Halides and Chalcogenides. Acta Crystallogr. Sect. A 1976, 32, 751–767. [Google Scholar] [CrossRef]
  42. Wang, C.; Cheng, X. Controlled Hydrothermal Growth and Tunable Luminescence Properties of β-NaYF4:Yb3+/Er3+ microcrystals. J. Alloys Compd. 2014, 617, 807–815. [Google Scholar] [CrossRef]
  43. Wang, M.; Huang, Q.L.; Hong, J.M.; Chen, X.T.; Xue, Z.L. Controlled Synthesis and Characterization of Nanostructured EuF3 with Different Crystalline Phases and Morphologies. Cryst. Growth Des. 2006, 6, 2169–2173. [Google Scholar] [CrossRef]
  44. Kolesnikov, I.E.; Kalinichev, A.A.; Kurochkin, M.A.; Golyeva, E.V.; Terentyeva, A.S.; Kolesnikov, E.Y.; Lähderanta, E. Structural, Luminescence and Thermometric Properties of Nanocrystalline YVO4: Dy3+ Temperature and Concentration Series. Sci. Rep. 2019, 9, 2043. [Google Scholar] [CrossRef] [PubMed] [Green Version]
  45. Kolesnikov, I.E.; Mamonova, D.V.; Lähderanta, E.; Kurochkin, A.V.; Mikhailov, M.D. The Impact of Doping Concentration on Structure and Photoluminescence of Lu2O3:Eu3+ Nanocrystals. J. Lumin. 2017, 187, 26–32. [Google Scholar] [CrossRef]
  46. Blasse, G. Energy Transfer in Oxidic Phosphors. Phys. Lett. A 1968, 28, 444–445. [Google Scholar] [CrossRef]
  47. Krämer, K.W.; Biner, D.; Frei, G.; Güdel, H.U.; Hehlen, M.P.; Lüthi, S.R. Hexagonal Sodium Yttrium Fluoride Based Green and Blue Emitting Upconversion Phosphors. Chem. Mater. 2004, 16, 1244–1251. [Google Scholar] [CrossRef]
  48. van Uitert, L.G. Characterization of Energy Transfer Interactions between Rare Earth Ions. J. Electrochem. Soc. 1967, 114, 1048. [Google Scholar] [CrossRef]
  49. Ozawa, L.; Jaffe, P.M. The Mechanism of the Emission Color Shift with Activator Concentration in +3 Activated Phosphors. J Electrochem. Soc. 1971, 118, 1678. [Google Scholar] [CrossRef]
  50. Naik, R.; Prashantha, S.C.; Nagabhushana, H.; Sharma, S.C.; Nagabhushana, B.M.; Nagaswarupa, H.P.; Premkumar, H.B. Low Temperature Synthesis and Photoluminescence Properties of Red Emitting Mg2SiO4:Eu3+ Nanophosphor for near UV Light Emitting Diodes. Sens. Actuators B Chem. 2014, 195, 140–149. [Google Scholar] [CrossRef]
  51. Miao, J.; Su, J.; Wen, Y.; Rao, W. Preparation, Characterization and Photoluminescence of Sm3+ Doped NaGdF4 Nanoparticles. J. Alloys Compd. 2015, 636, 8–11. [Google Scholar] [CrossRef]
  52. Singh, N.S.; Ningthoujam, R.S.; Luwang, M.N.; Singh, S.D.; Vatsa, R.K. Luminescence, Lifetime and Quantum Yield Studies of YVO4:Ln3+ (Ln3+ = Dy3+, Eu3+) Nanoparticles: Concentration and Annealing Effects. Chem. Phys. Lett. 2009, 480, 237–242. [Google Scholar] [CrossRef]
  53. Wu, Y.; Lin, S.; Shao, W.; Zhang, X.; Xu, J.; Yu, L.; Chen, K. Enhanced Up-Conversion Luminescence from NaYF4:Yb,Er Nanocrystals by Gd3+ Ions Induced Phase Transformation and Plasmonic Au Nanosphere Arrays. RSC Adv. 2016, 6, 102869–102874. [Google Scholar] [CrossRef]
  54. Shi, F.; Zhao, Y. Sub-10 Nm and Monodisperse β-NaYF4:Yb,Tm,Gd Nanocrystals with Intense Ultraviolet Upconversion Luminescence. J. Mater. Chem. C Mater. 2014, 2, 2198–2203. [Google Scholar] [CrossRef]
  55. Li, J.G.; Li, X.; Sun, X.; Ishigaki, T. Monodispersed Colloidal Spheres for Uniform Y2O3:Eu3+ Red-Phosphor Particles and Greatly Enhanced Luminescence by Simultaneous Gd3+ Doping. J. Phys. Chem. C 2008, 112, 11707–11716. [Google Scholar] [CrossRef]
  56. Kumari, P.; Manam, J. Enhanced Red Emission on Co-Doping of Divalent Ions (M2+ = Ca2+, Sr2+, Ba2+) in YVO4:Eu3+ Phosphor and Spectroscopic Analysis for Its Application in Display Devices. Spectrochim. Acta A Mol. Biomol. Spectrosc. 2016, 152, 109–118. [Google Scholar] [CrossRef] [PubMed]
  57. Kumar, D.; Sharma, M.; Pandey, O.P. Effect of Co-Doping Metal Ions (Li+, Na+ and K +) on the Structural and Photoluminescent Properties of Nano-Sized Y2O3:Eu3+ Synthesized by Co-Precipitation Method. Opt. Mater. 2014, 36, 1131–1138. [Google Scholar] [CrossRef]
  58. Han, L.; Wang, Y.; Zhang, J.; Wang, Y. Enhancement of Red Emission Intensity of Ca9Y(VO4)7:Eu3+ Phosphor via Bi Co-Doping for the Application to White LEDs. Mater. Chem. Phys. 2013, 139, 87–91. [Google Scholar] [CrossRef]
  59. Xie, A.; Yuan, X.; Hai, S.; Wang, J.; Wang, F.; Li, L. Enhancement Emission Intensity of CaMoO4: EEu3+, Na+ Phosphor via Bi Co-Doping and Si Substitution for Application to White LEDs. J. Phys. D Appl. Phys. 2009, 42, 105107. [Google Scholar] [CrossRef]
  60. Ajmal, M.; Atabaev, T.S. Facile Fabrication and Luminescent Properties Enhancement of Bimodal Y2O3:Eu3+ Particles by Simultaneous Gd3+ Codoping. Opt. Mater. 2013, 35, 1288–1292. [Google Scholar] [CrossRef]
  61. Singh, B.P.; Parchur, A.K.; Ningthoujam, R.S.; Ansari, A.A.; Singh, P.; Rai, S.B. Enhanced Photoluminescence in CaMoO4:Eu3+ by Gd3+ Co-Doping. Dalton Trans. 2014, 43, 4779–4789. [Google Scholar] [CrossRef] [PubMed]
  62. Dhananjaya, N.; Nagabhushana, H.; Nagabhushana, B.M.; Rudraswamy, B.; Shivakumara, C.; Narahari, K.; Chakradhar, R.P.S. Enhanced Photoluminescence of Gd2O3:Eu3+ Nanophosphors with Alkali (M = Li+, Na+, K+) Metal Ion Co-Doping. Spectrochim. Acta A Mol. Biomol. Spectrosc. 2012, 86, 8–14. [Google Scholar] [CrossRef] [PubMed]
  63. Li, G.; Cao, Q.; Li, Z.; Huang, Y.; Jiang, H. Solution Combustion Synthesis and Luminescence Properties of (Y,Gd)Al3(BO3)4:Eu3+ Phosphors. J. Rare Earths 2010, 28, 709–712. [Google Scholar] [CrossRef]
  64. Wang, C.; Yan, B. Sol-Gel Synthesis and Photoluminescence of RE3BO6: Eu3+/Tb3+ (RE = Y, Gd) Microcrystalline Phosphors from Hybrid Precursors. J. Non-Cryst. Solids 2008, 354, 962–969. [Google Scholar] [CrossRef]
  65. Li, D.; Qin, W.; Zhang, P.; Wang, L.; Lan, M.; Shi, P. Efficient Luminescence Enhancement of Gd2O3:Ln3+ (Ln = Yb/Er, Eu) NCs by Codoping Zn2+ and Li+ Inert Ions. Opt. Mater. Express 2017, 7, 329. [Google Scholar] [CrossRef]
  66. Martins, F.C.B.; Firmino, E.; Oliveira, L.S.; Dantas, N.O.; Almeida Silva, A.C.; Barbosa, H.P.; Rezende, T.K.L.; Sousa Góes, M.; Coutos dos Santos, M.A.; Cappa de Oliveira, L.F.; et al. Development of Y2O3:Eu3+ Materials Doped with Variable Gd3+ Content and Characterization of Their Photoluminescence Properties under UV Excitation. Mater Chem. Phys. 2022, 277, 125498. [Google Scholar] [CrossRef]
Figure 1. PXRD patterns of (a) NaY1−xSmxF4, (b) NaY0.98−xSm0.02LaxF4, (c) NaY0.98−xSm0.02GdxF4, and (d) NaY0.98−xSm0.02LuxF4.
Materials 16 02157 g001aMaterials 16 02157 g001b
Figure 2. The dependence of unit cell volumes of NaY1−xSmxF4 on the Sm3+ content (a) and NaY0.98−xSm0.02LnxF4 (Ln = La, Gd, Lu) samples on the Ln3+ content (b).
Materials 16 02157 g002
Figure 3. SEM images of the samples NaY1−xSmxF4 (ah): x = 0, 2, 5, 10, 20, 30, 40, and 50 at.% of Sm3+. Particle size distribution of the samples is shown in the insets. The average diameter of particles is equal to about 682 ± 41, 568 ± 44, 520 ± 43, 463 ± 31, 295 ± 32, 210 ± 19, 108 ± 11, and 78 ± 9 nm for the Sm3+ concentration of 0, 2, 5, 10, 20, 30, 40, and 50 at.%, respectively.
Materials 16 02157 g003
Figure 4. SEM images of the samples NaY0.98−xSm0.02LaxF4 (af): x = 2, 5, 10, 20, 40, and 60 at.% La. Particle size distribution of the samples is shown in the insets. The average diameter of particles is equal to about 646 ± 33, 698 ± 38, 754 ± 36, 1094 ± 69, 1517 ± 64 (254 ± 16 for small particles) and 1916 ± 132 (102 ± 9 for small particles) nm for the La3+ concentration of 2, 5, 10, 20, 40, and 60 at.%, respectively.
Materials 16 02157 g004
Figure 5. SEM images of the samples NaY0.98−xSm0.02GdxF4 (af): x = 2, 5, 10, 20, 40, and 60 at.% Gd, respectively. Particle size distribution of the samples is shown in the insets. The average diameter of particles is equal to about 550 ± 9, 511 ± 18, 412 ± 15, 252 ± 15, 66 ± 6, and 46 ± 2 nm for the Gd3+ concentration of 2, 5, 10, 20, 40, and 60 at.%, respectively.
Materials 16 02157 g005
Figure 6. SEM images of the samples NaY0.98−xSm0.02LuxF4 (af): x = 2, 5, 10, 20, 40, and 60 at.% Lu, respectively. Particle size distribution of the samples is shown in the insets. The average diameter of particles is equal to about, 657 ± 29, 676 ± 31, 681 ± 24, 721 ± 46, 949 ± 50, and 1283 ± 13 nm for the Lu3+ concentration of 2, 5, 10, 20, 40, and 60 at.%, respectively.
Materials 16 02157 g006
Figure 7. The effect of dopant nature and concentration on NaY1−xSmxF4 (a) NaY0.98−xSm0.02LnxF4 (b) particle size.
Materials 16 02157 g007
Figure 8. The luminescence excitation (a) emission (b) spectra of NaY1-xSmxF4 concentration series; dependence of integral intensities of 5G5/26H7/2 emission band on Sm3+ concentration (c), logarithmic plot NaY1−xSmxF4 of emission integral intensity dependence on dopant concentration fitted to the linear function (d).
Materials 16 02157 g008aMaterials 16 02157 g008b
Figure 9. (a) Luminescence decay curves of NaY1−xSmxF4 phosphors monitored at 595 nm upon 400 nm excitation; and (b) doping concentration effect on 5G5/2 level lifetime. Experimental values and best biexponential fits are shown as dots and lines, respectively.
Materials 16 02157 g009
Figure 10. The emission spectra of synthesized compounds NaY0.98−xSm0.02LnxF4 (Ln = Gd, Lu, La on (ac), respectively), upon 400 nm excitation; dependence of integral intensities of 5G5/26H7/2 emission band (595 nm) on Gd3+ (d), Lu3+ (e), and La3+ (f) content) relative to the NaY0.98Sm0.02F4 sample.
Materials 16 02157 g010
Figure 11. Luminescence decay curves of NaY0.98−xSm0.02LnxF4 (Ln = Gd, Lu, La on the panels (ac), respectively), phosphors monitored at 595 nm upon 400 nm excitation. Experimental values and best biexponential fits are shown as dots and lines, respectively.
Materials 16 02157 g011
Table 1. Lifetimes of 4G5/2 excitation state of Sm3+ ion in NaY0.98-xSm0.02LnxF4 (Ln = Gd, Lu, La).
Ln3+Content, at.%Ln3+ = Gd3+Ln3+ = Lu3+Ln3+ = La3+
τav, msτav, msτav, ms
03.54 ± 0.053.54 ± 0.053.54 ± 0.05
0.253.51 ± 0.053.58 ± 0.053.46 ± 0.05
0.53.50 ± 0.053.46 ± 0.053.55 ± 0.05
13.47 ± 0.053.42 ± 0.053.46 ± 0.05
73.46 ± 0.053.46 ± 0.053.47 ± 0.05
603.58 ± 0.053.45 ± 0.053.53 ± 0.05
Disclaimer/Publisher’s Note: The statements, opinions and data contained in all publications are solely those of the individual author(s) and contributor(s) and not of MDPI and/or the editor(s). MDPI and/or the editor(s) disclaim responsibility for any injury to people or property resulting from any ideas, methods, instructions or products referred to in the content.

