
Enhanced Photoluminescence of R6G Dyes from Metal Decorated Silicon Nanowires Fabricated through Metal Assisted Chemical Etching

 , , ,
, , ,  and
and 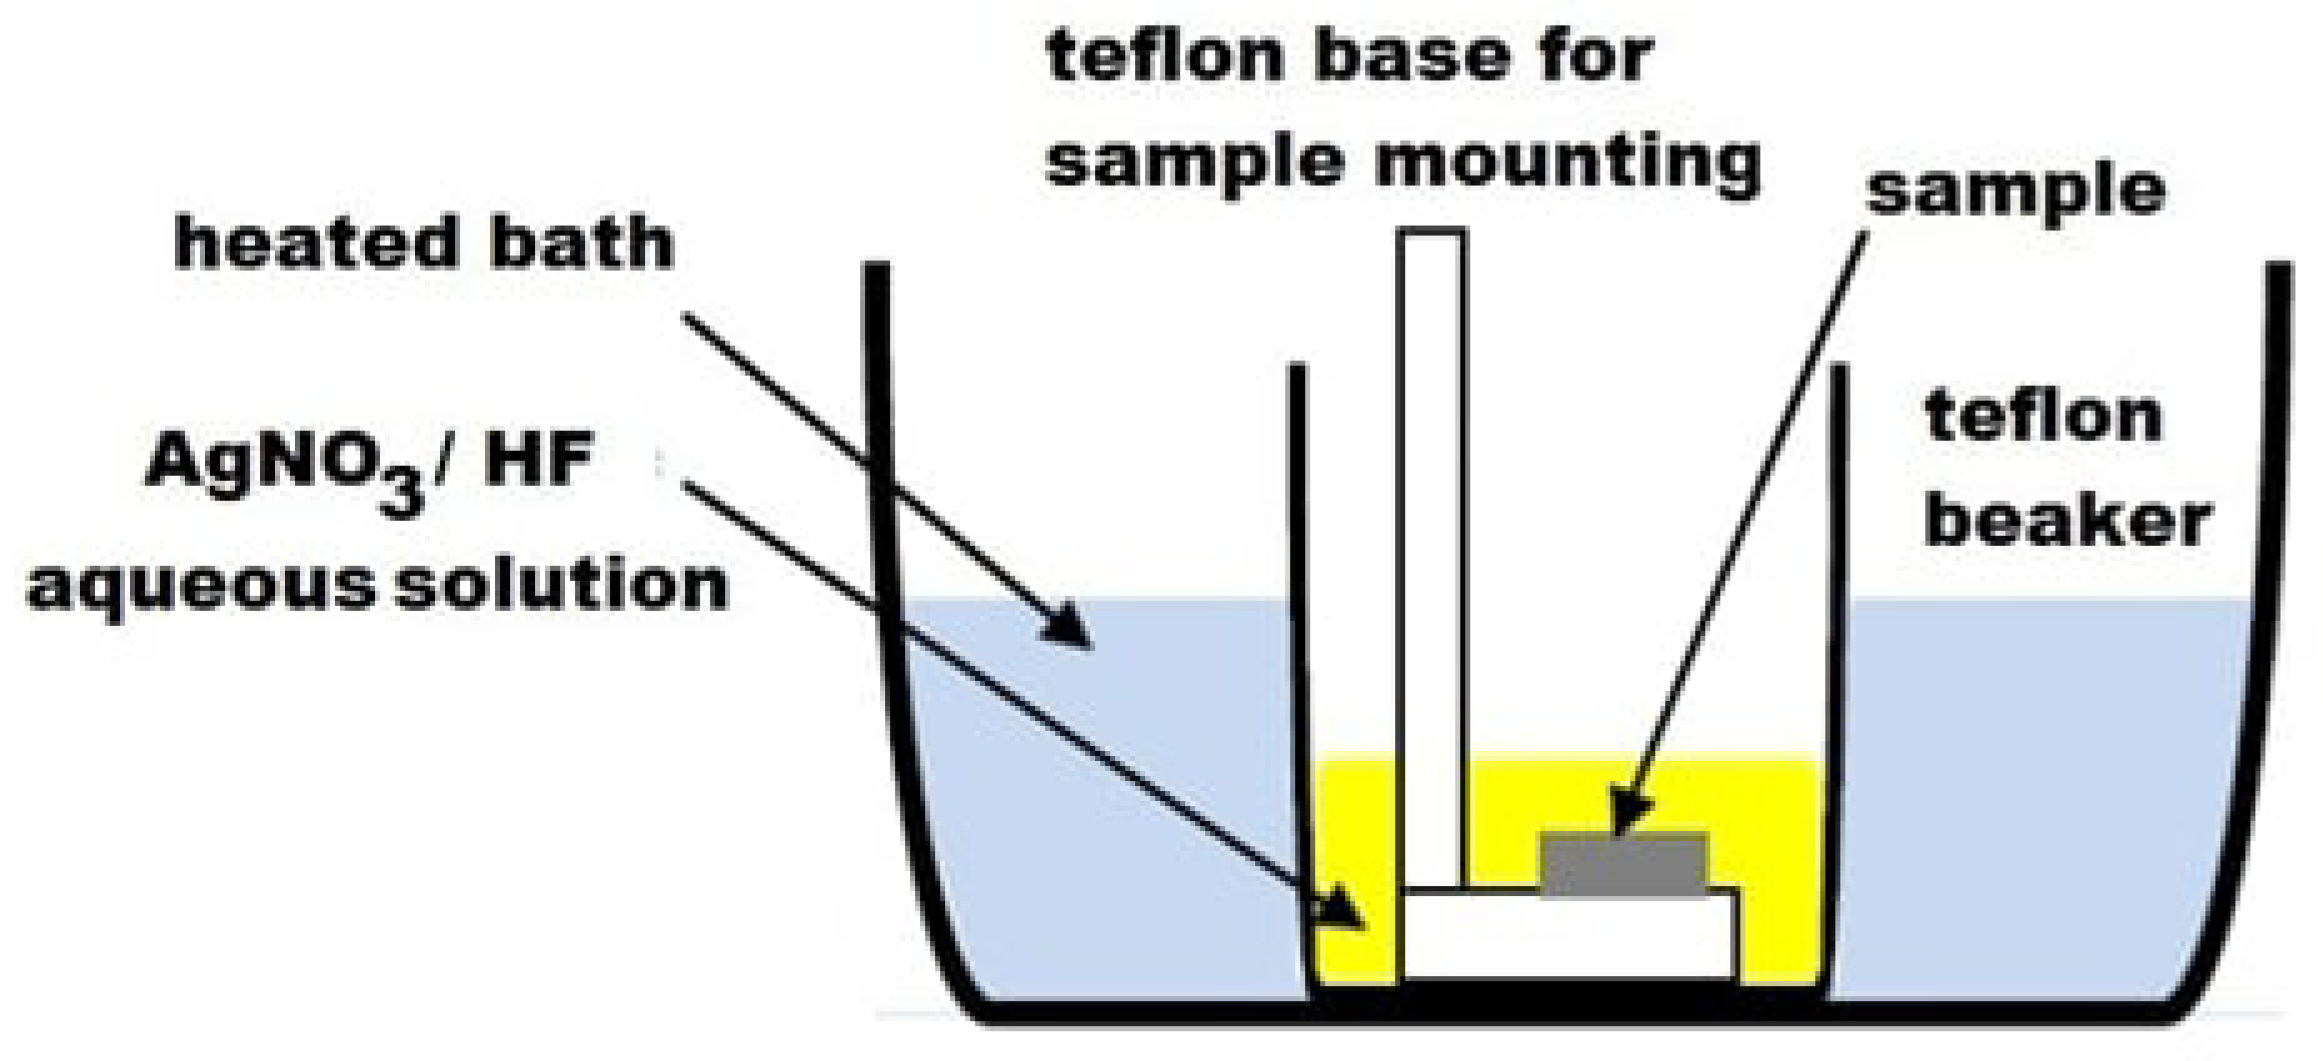
Abstract
:1. Introduction
2. Materials and Methods
2.1. Materials
2.2. Methods
3. Results
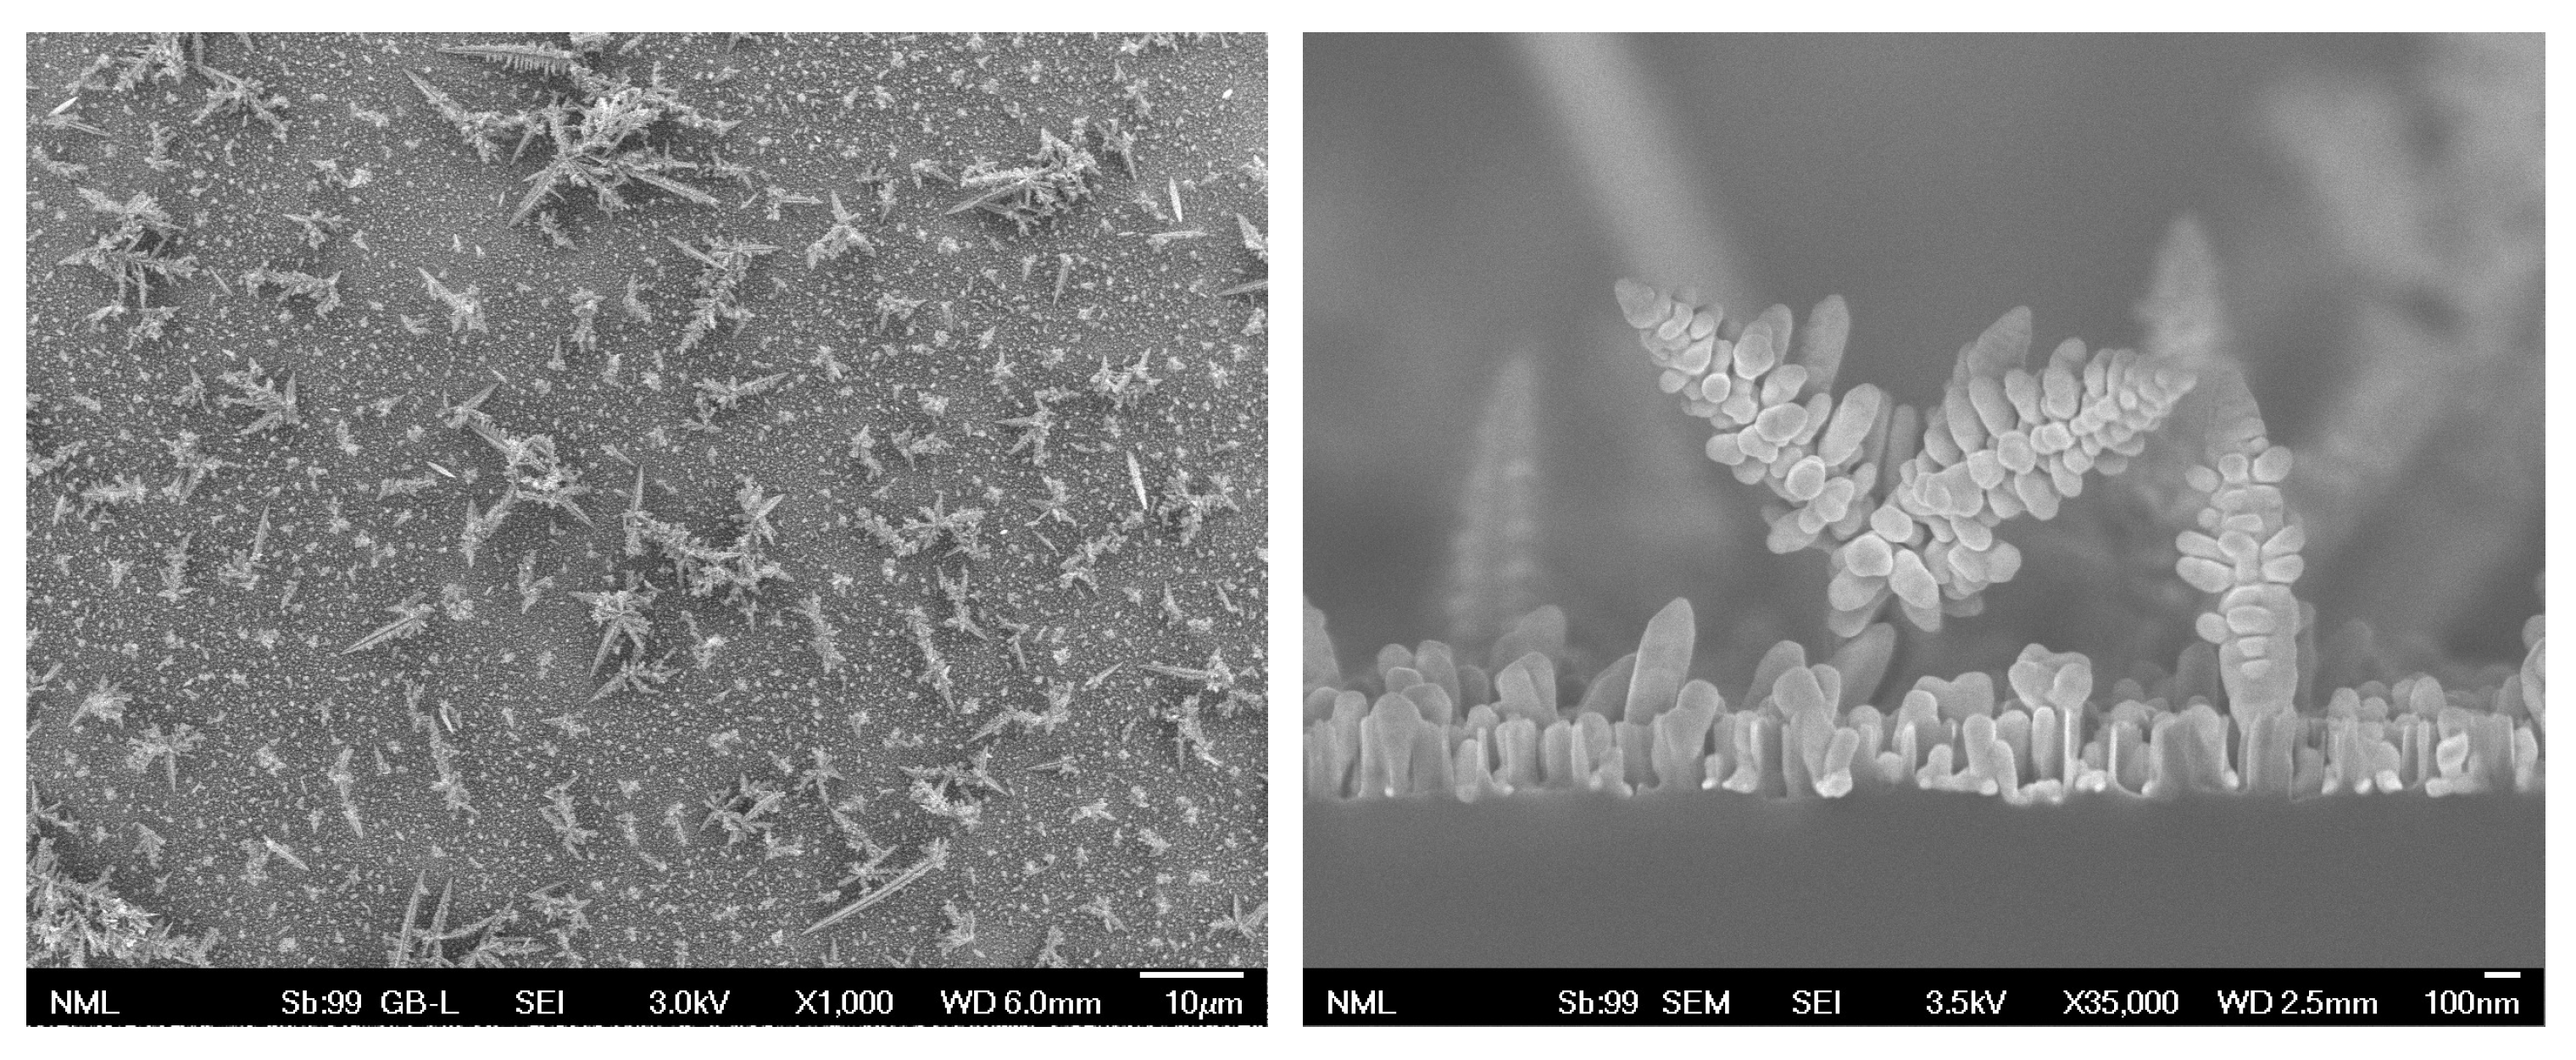
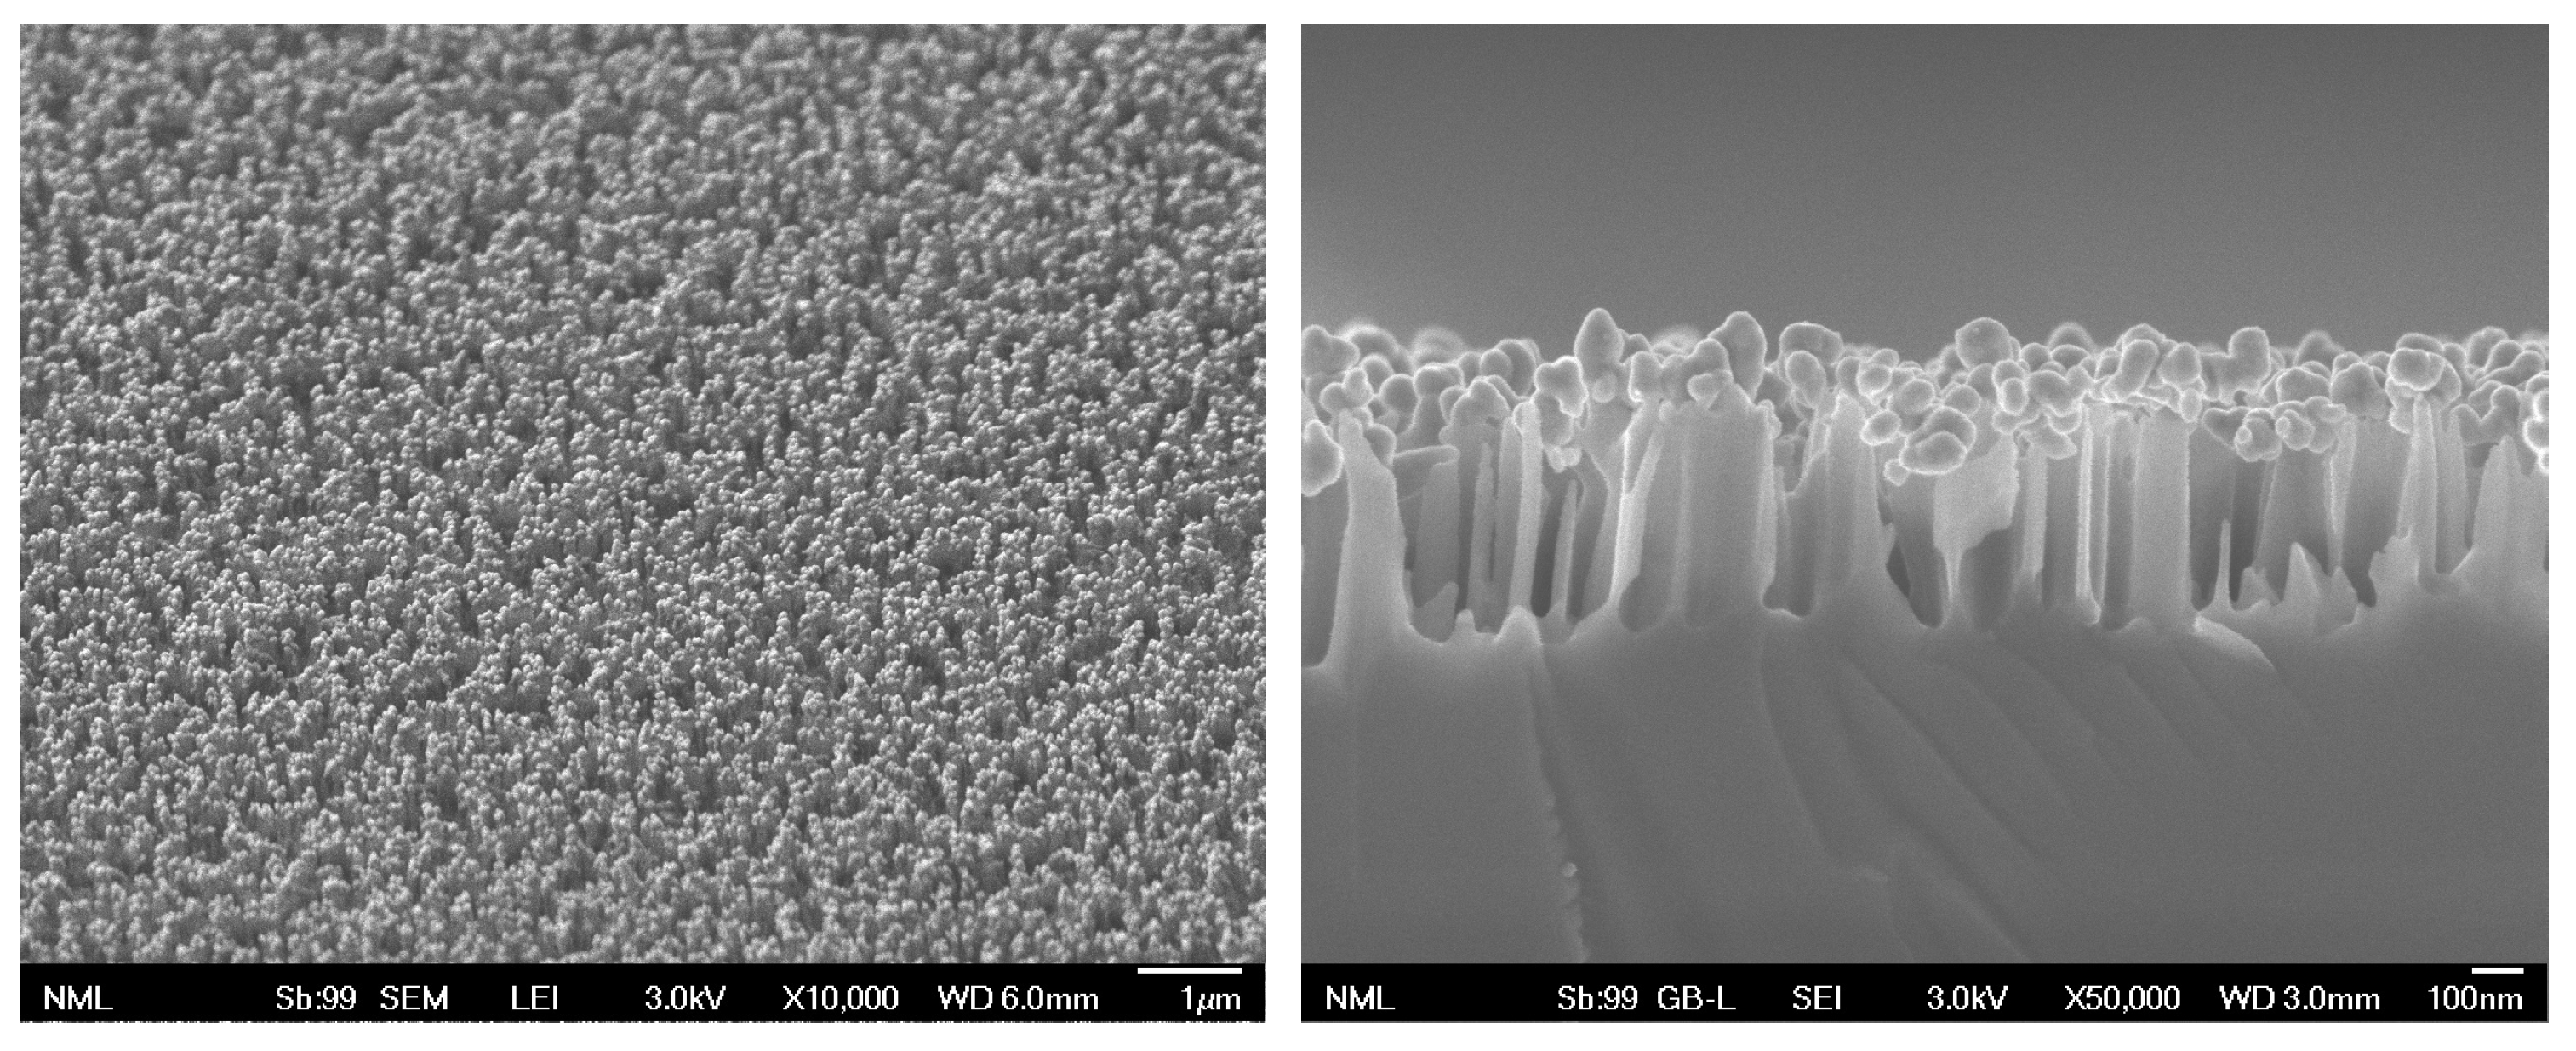
3.1. Structural Characterization
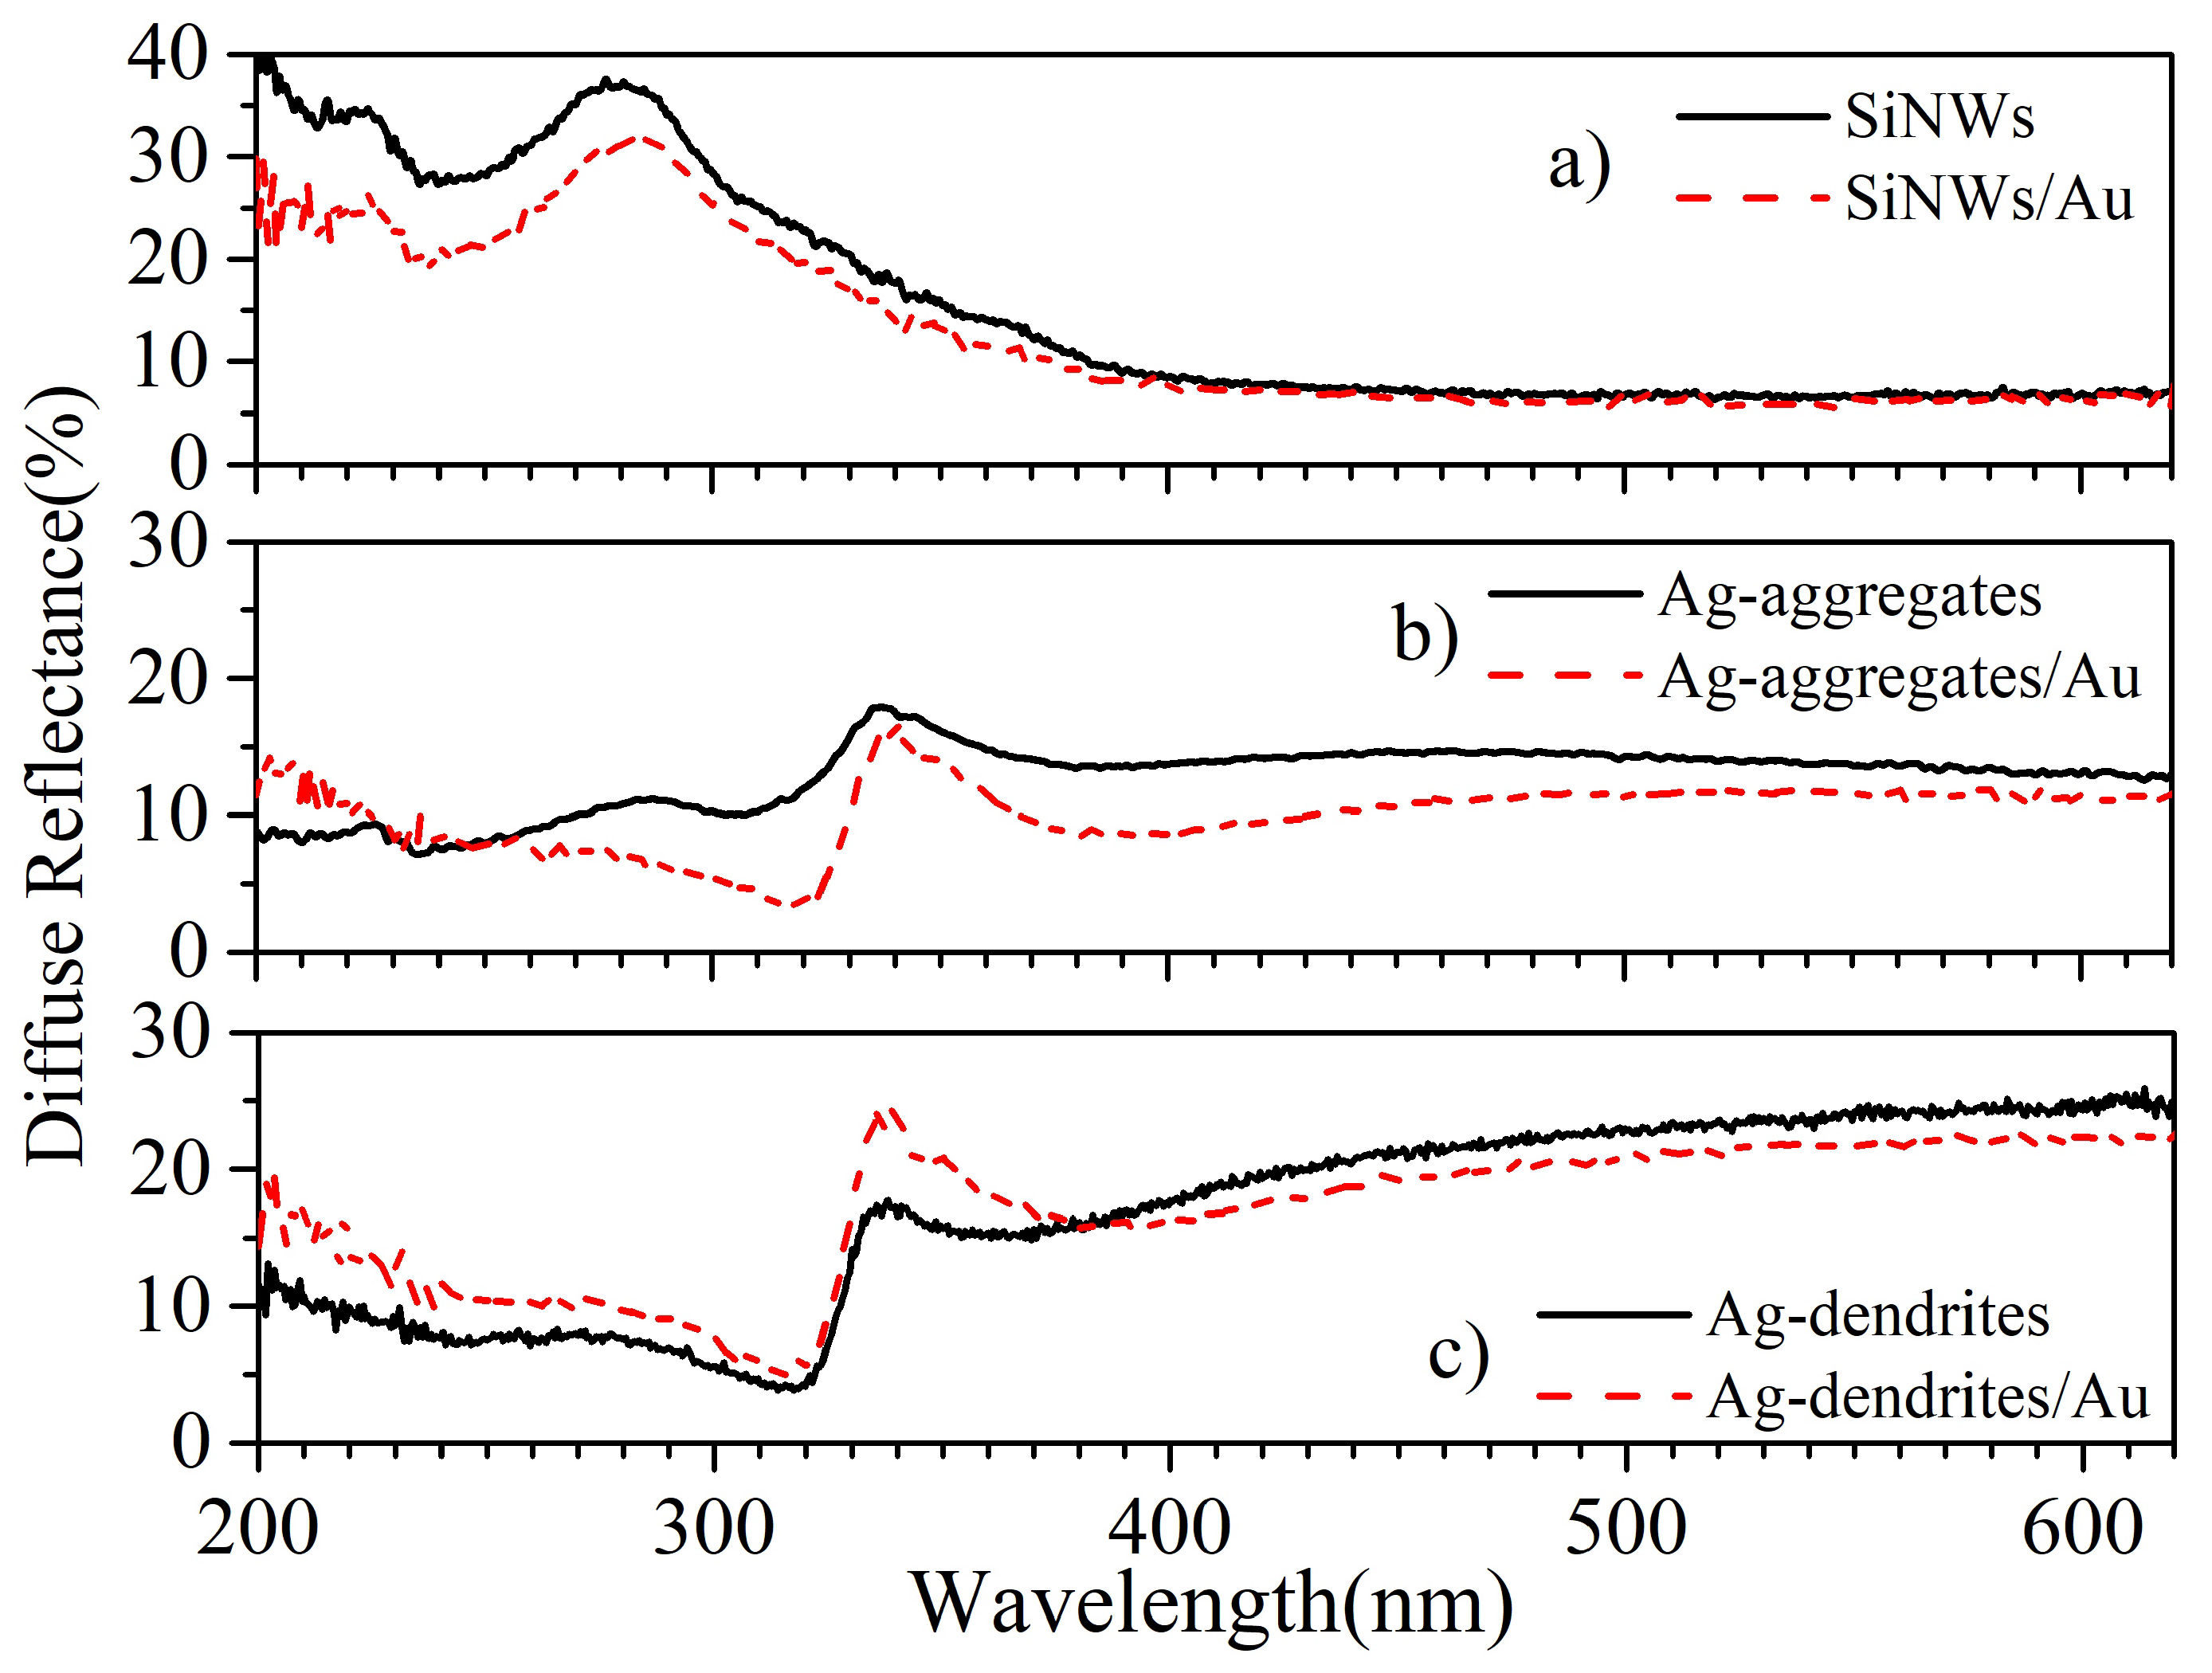
3.2. Diffuse Reflectance Measurements
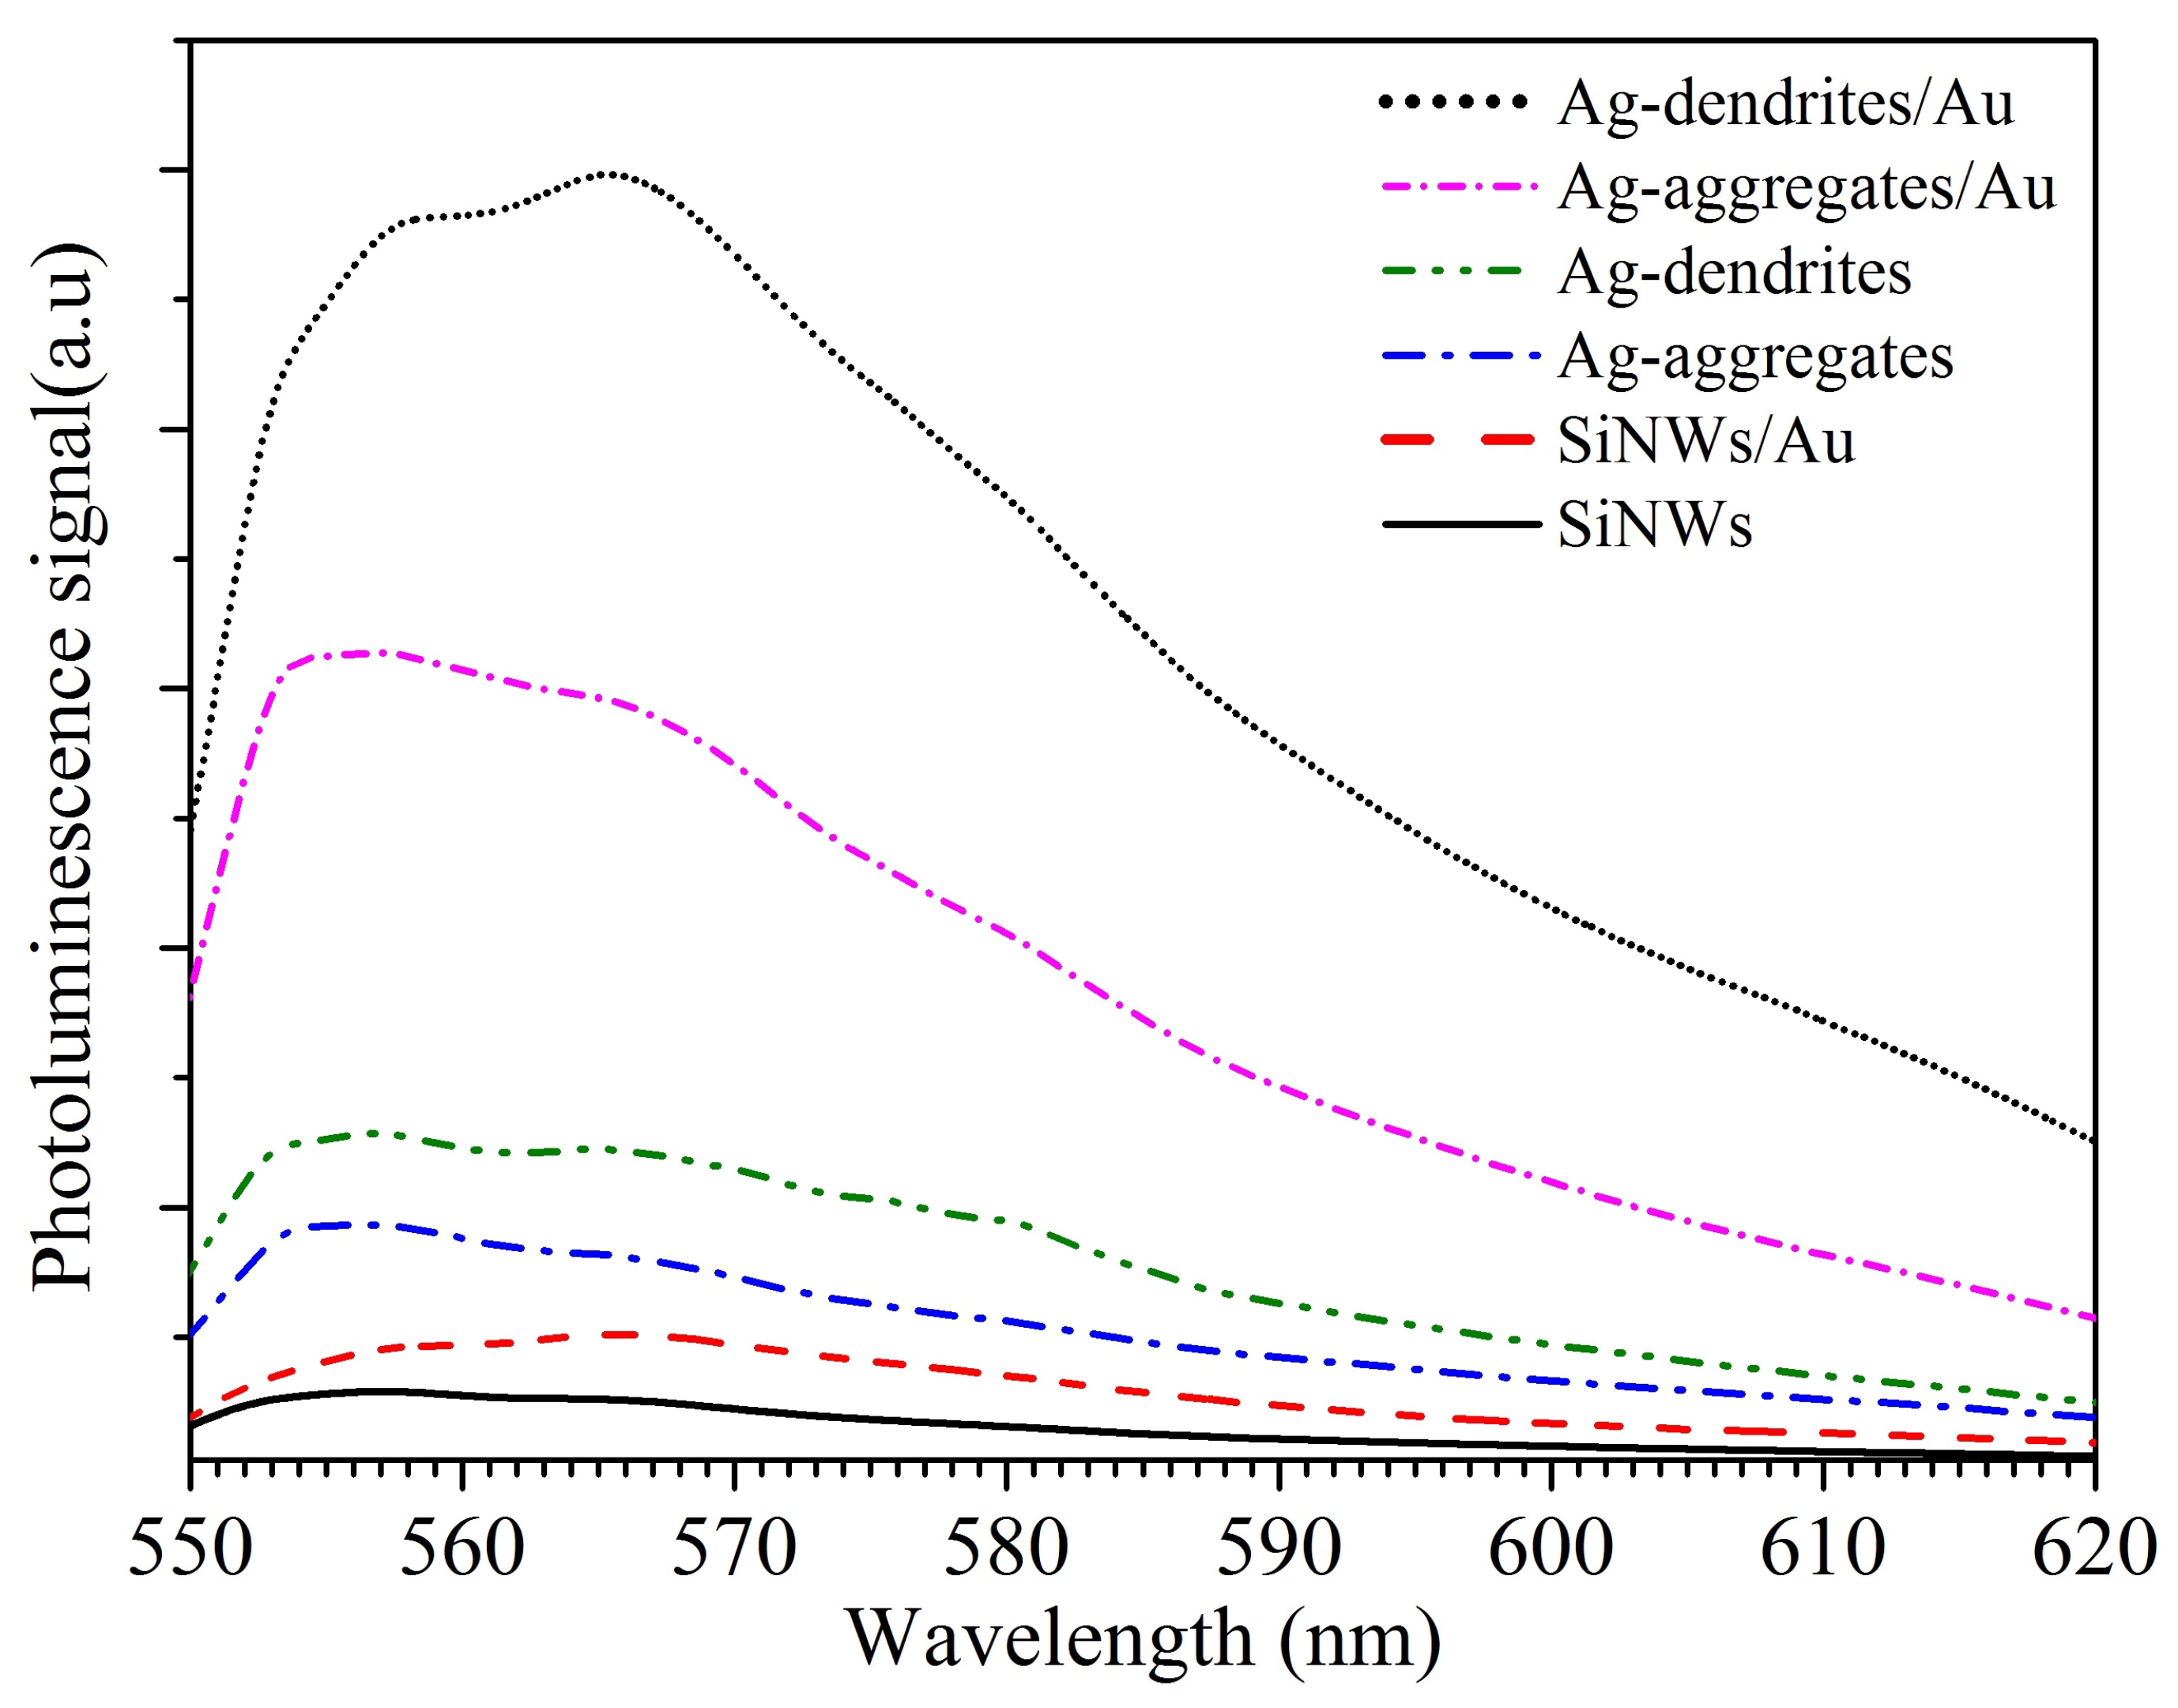
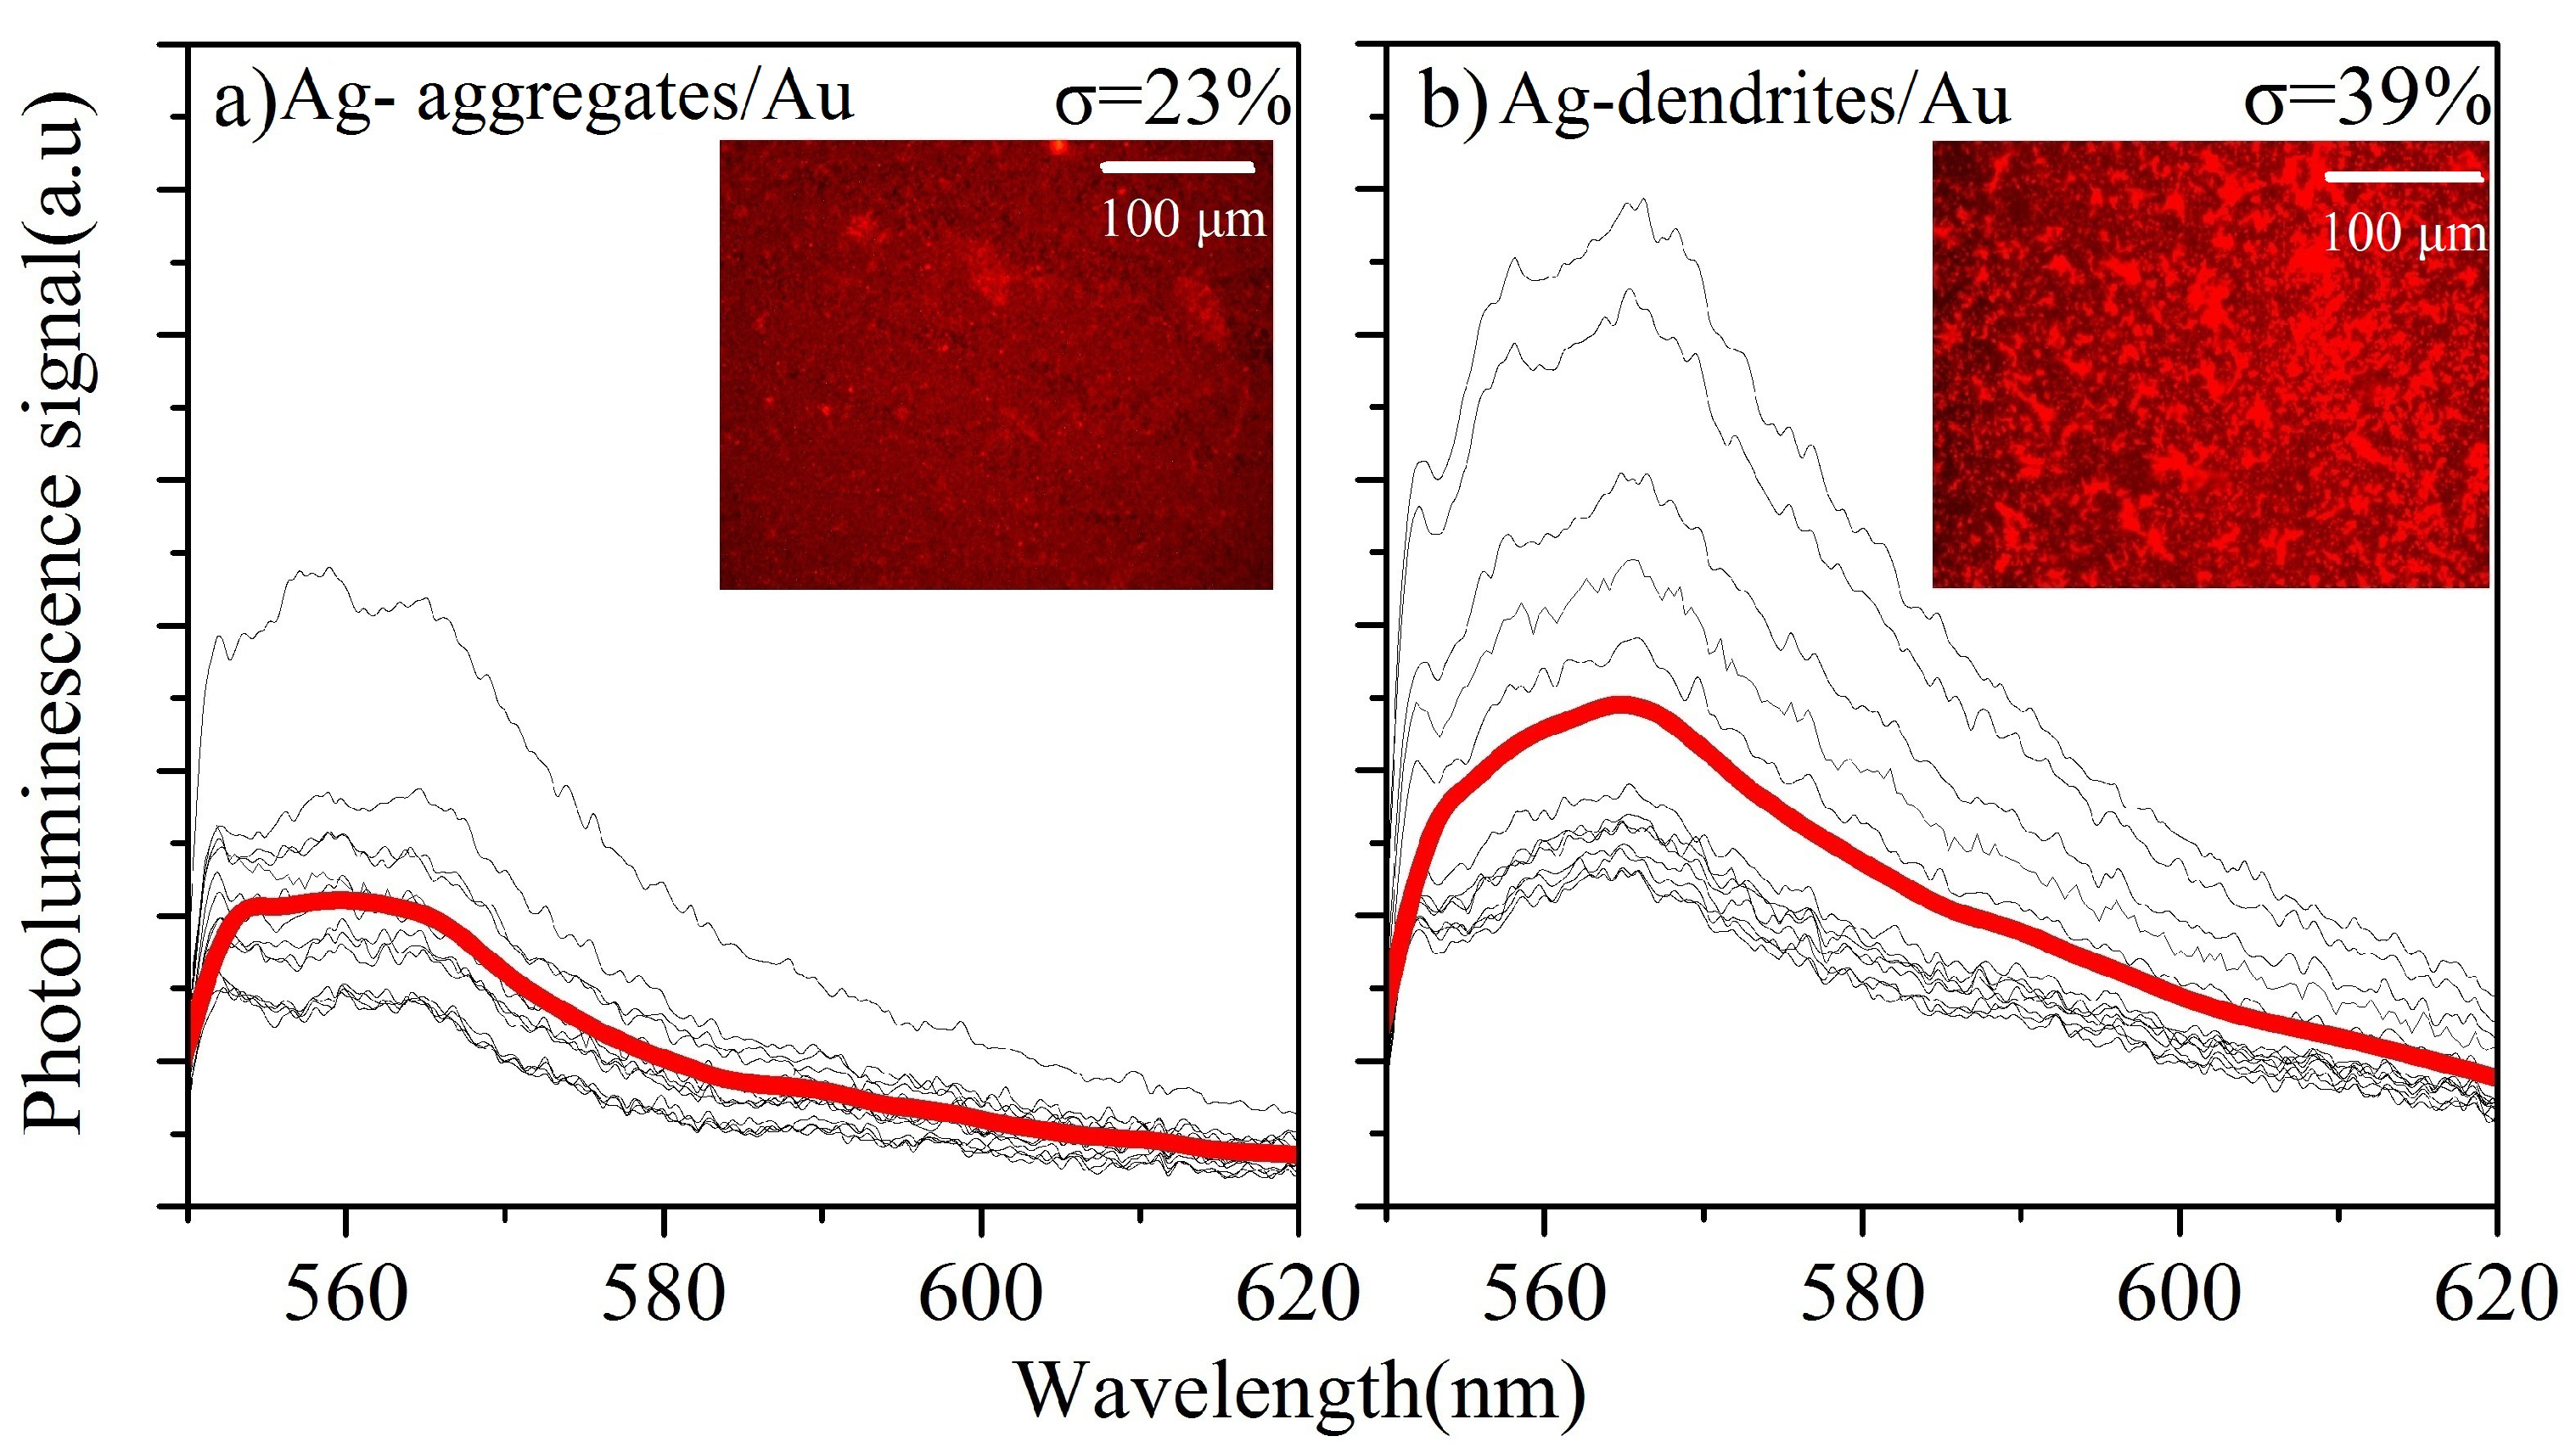
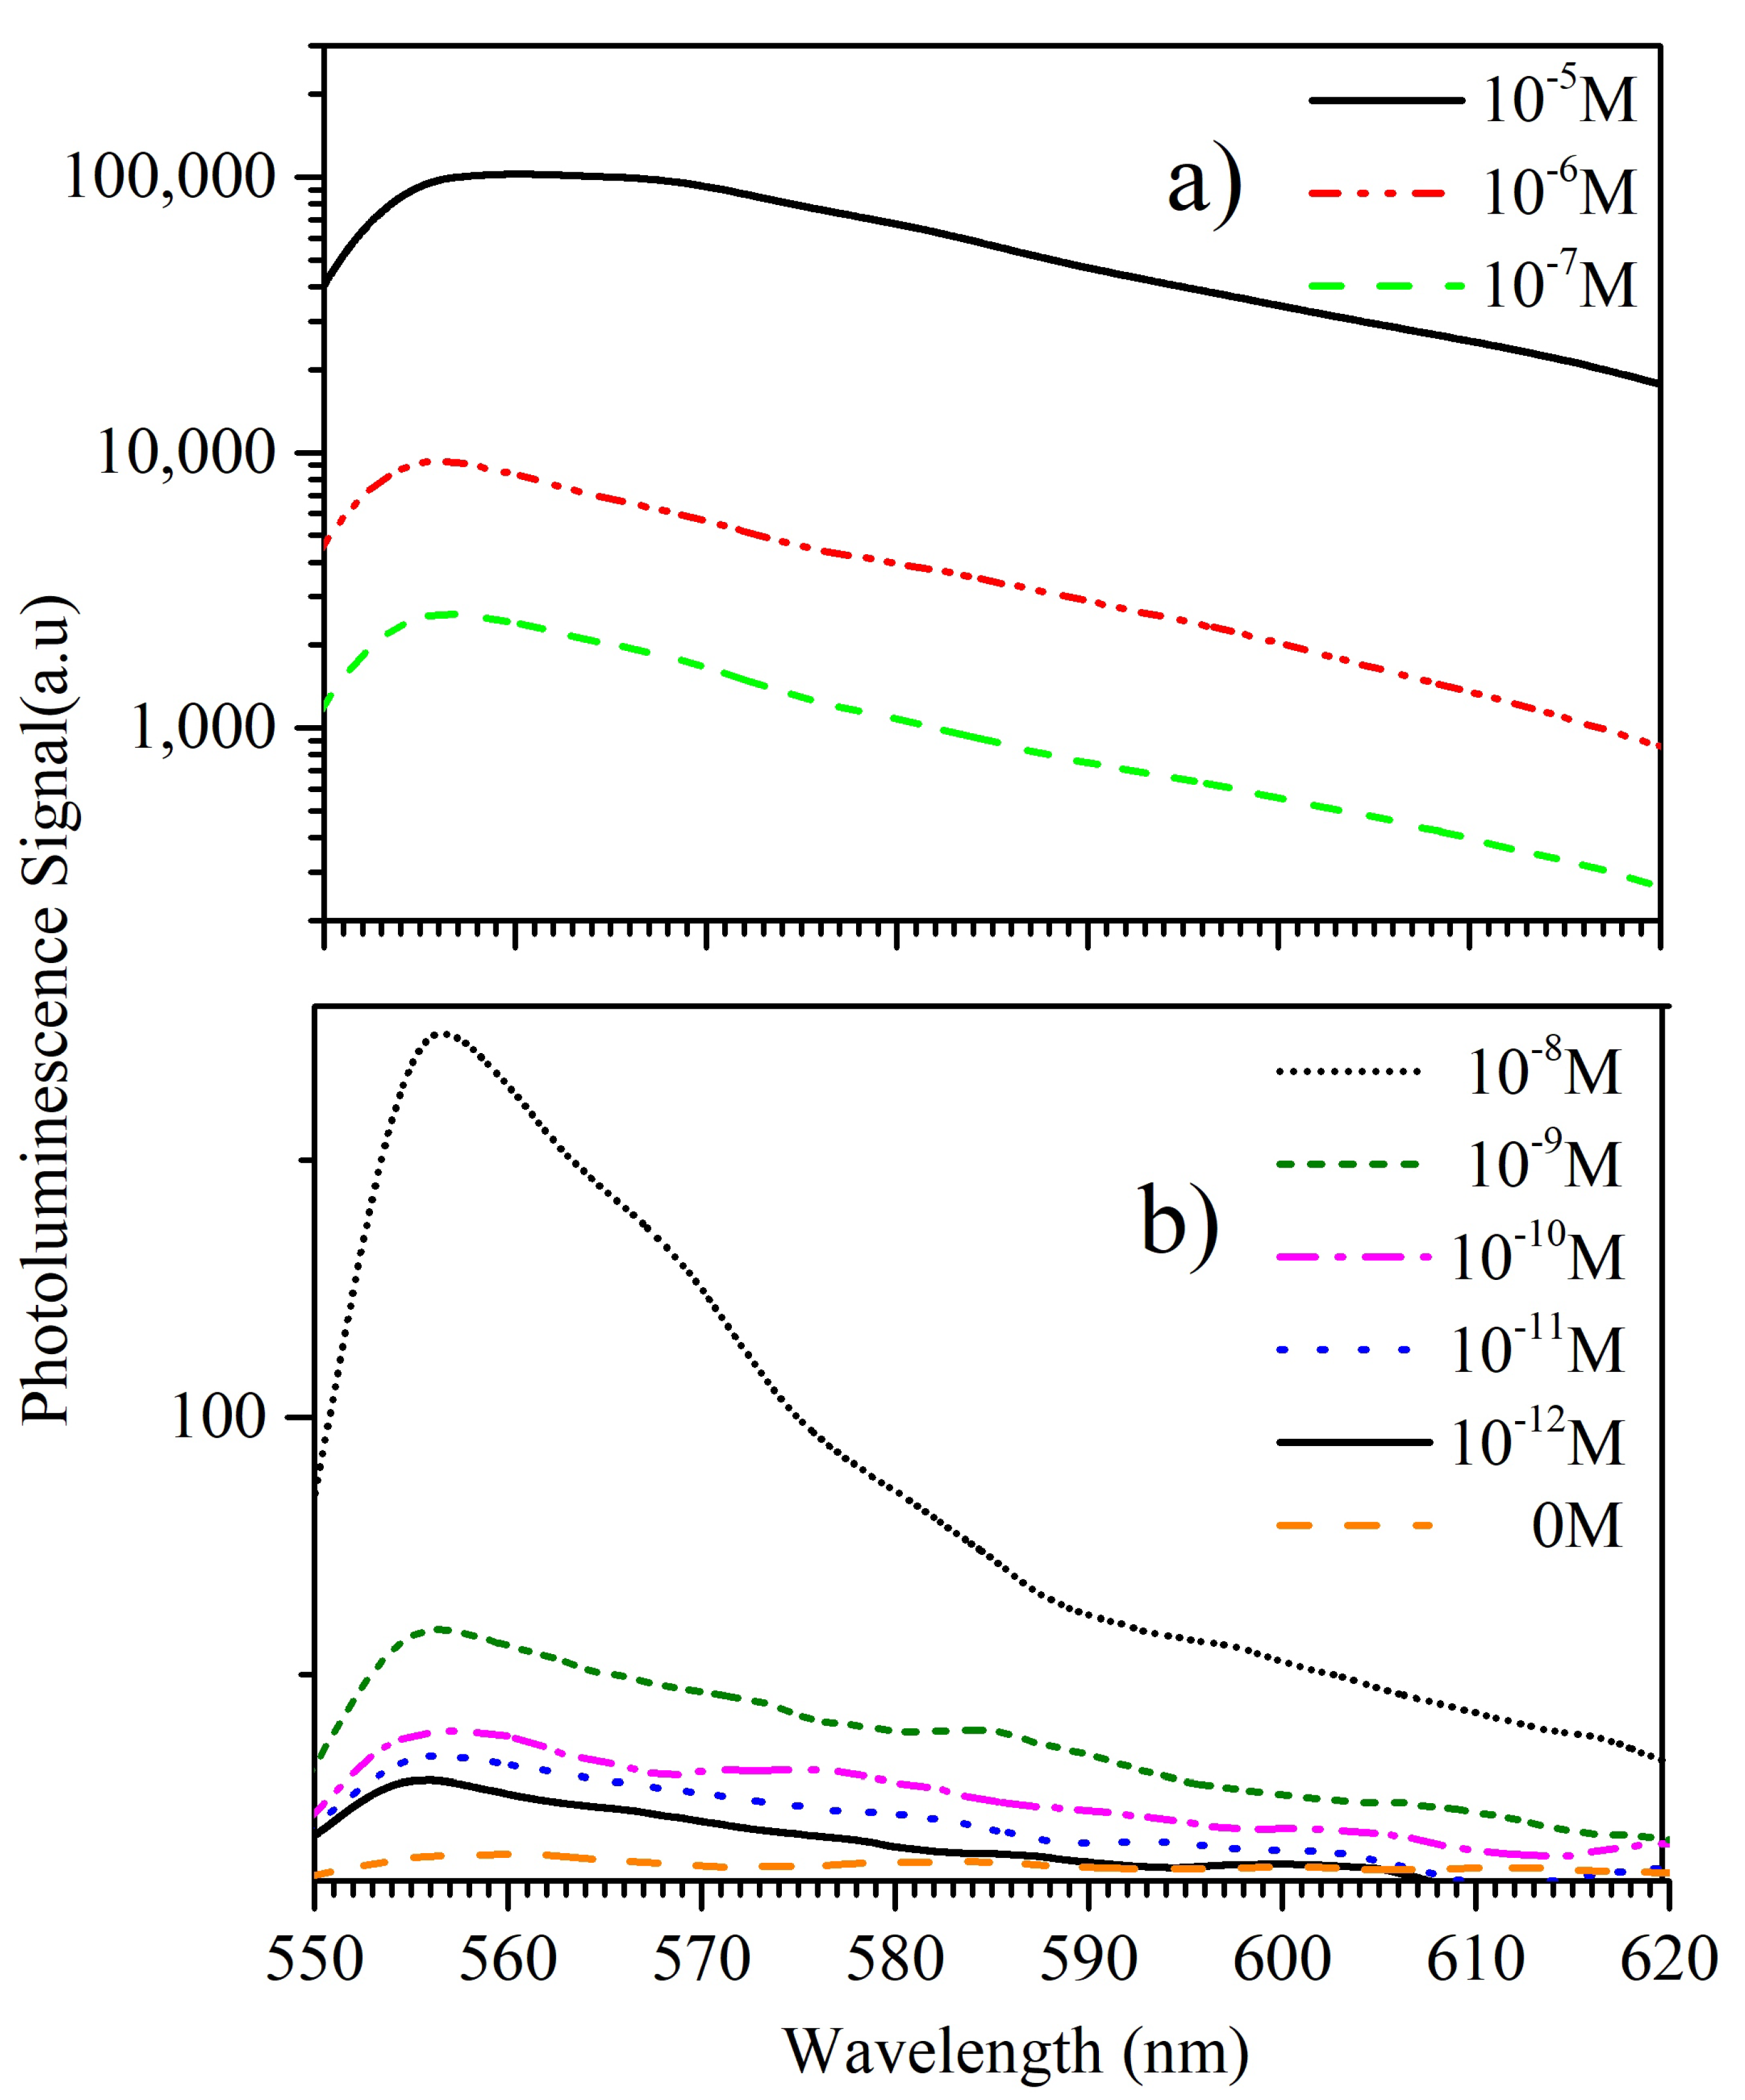
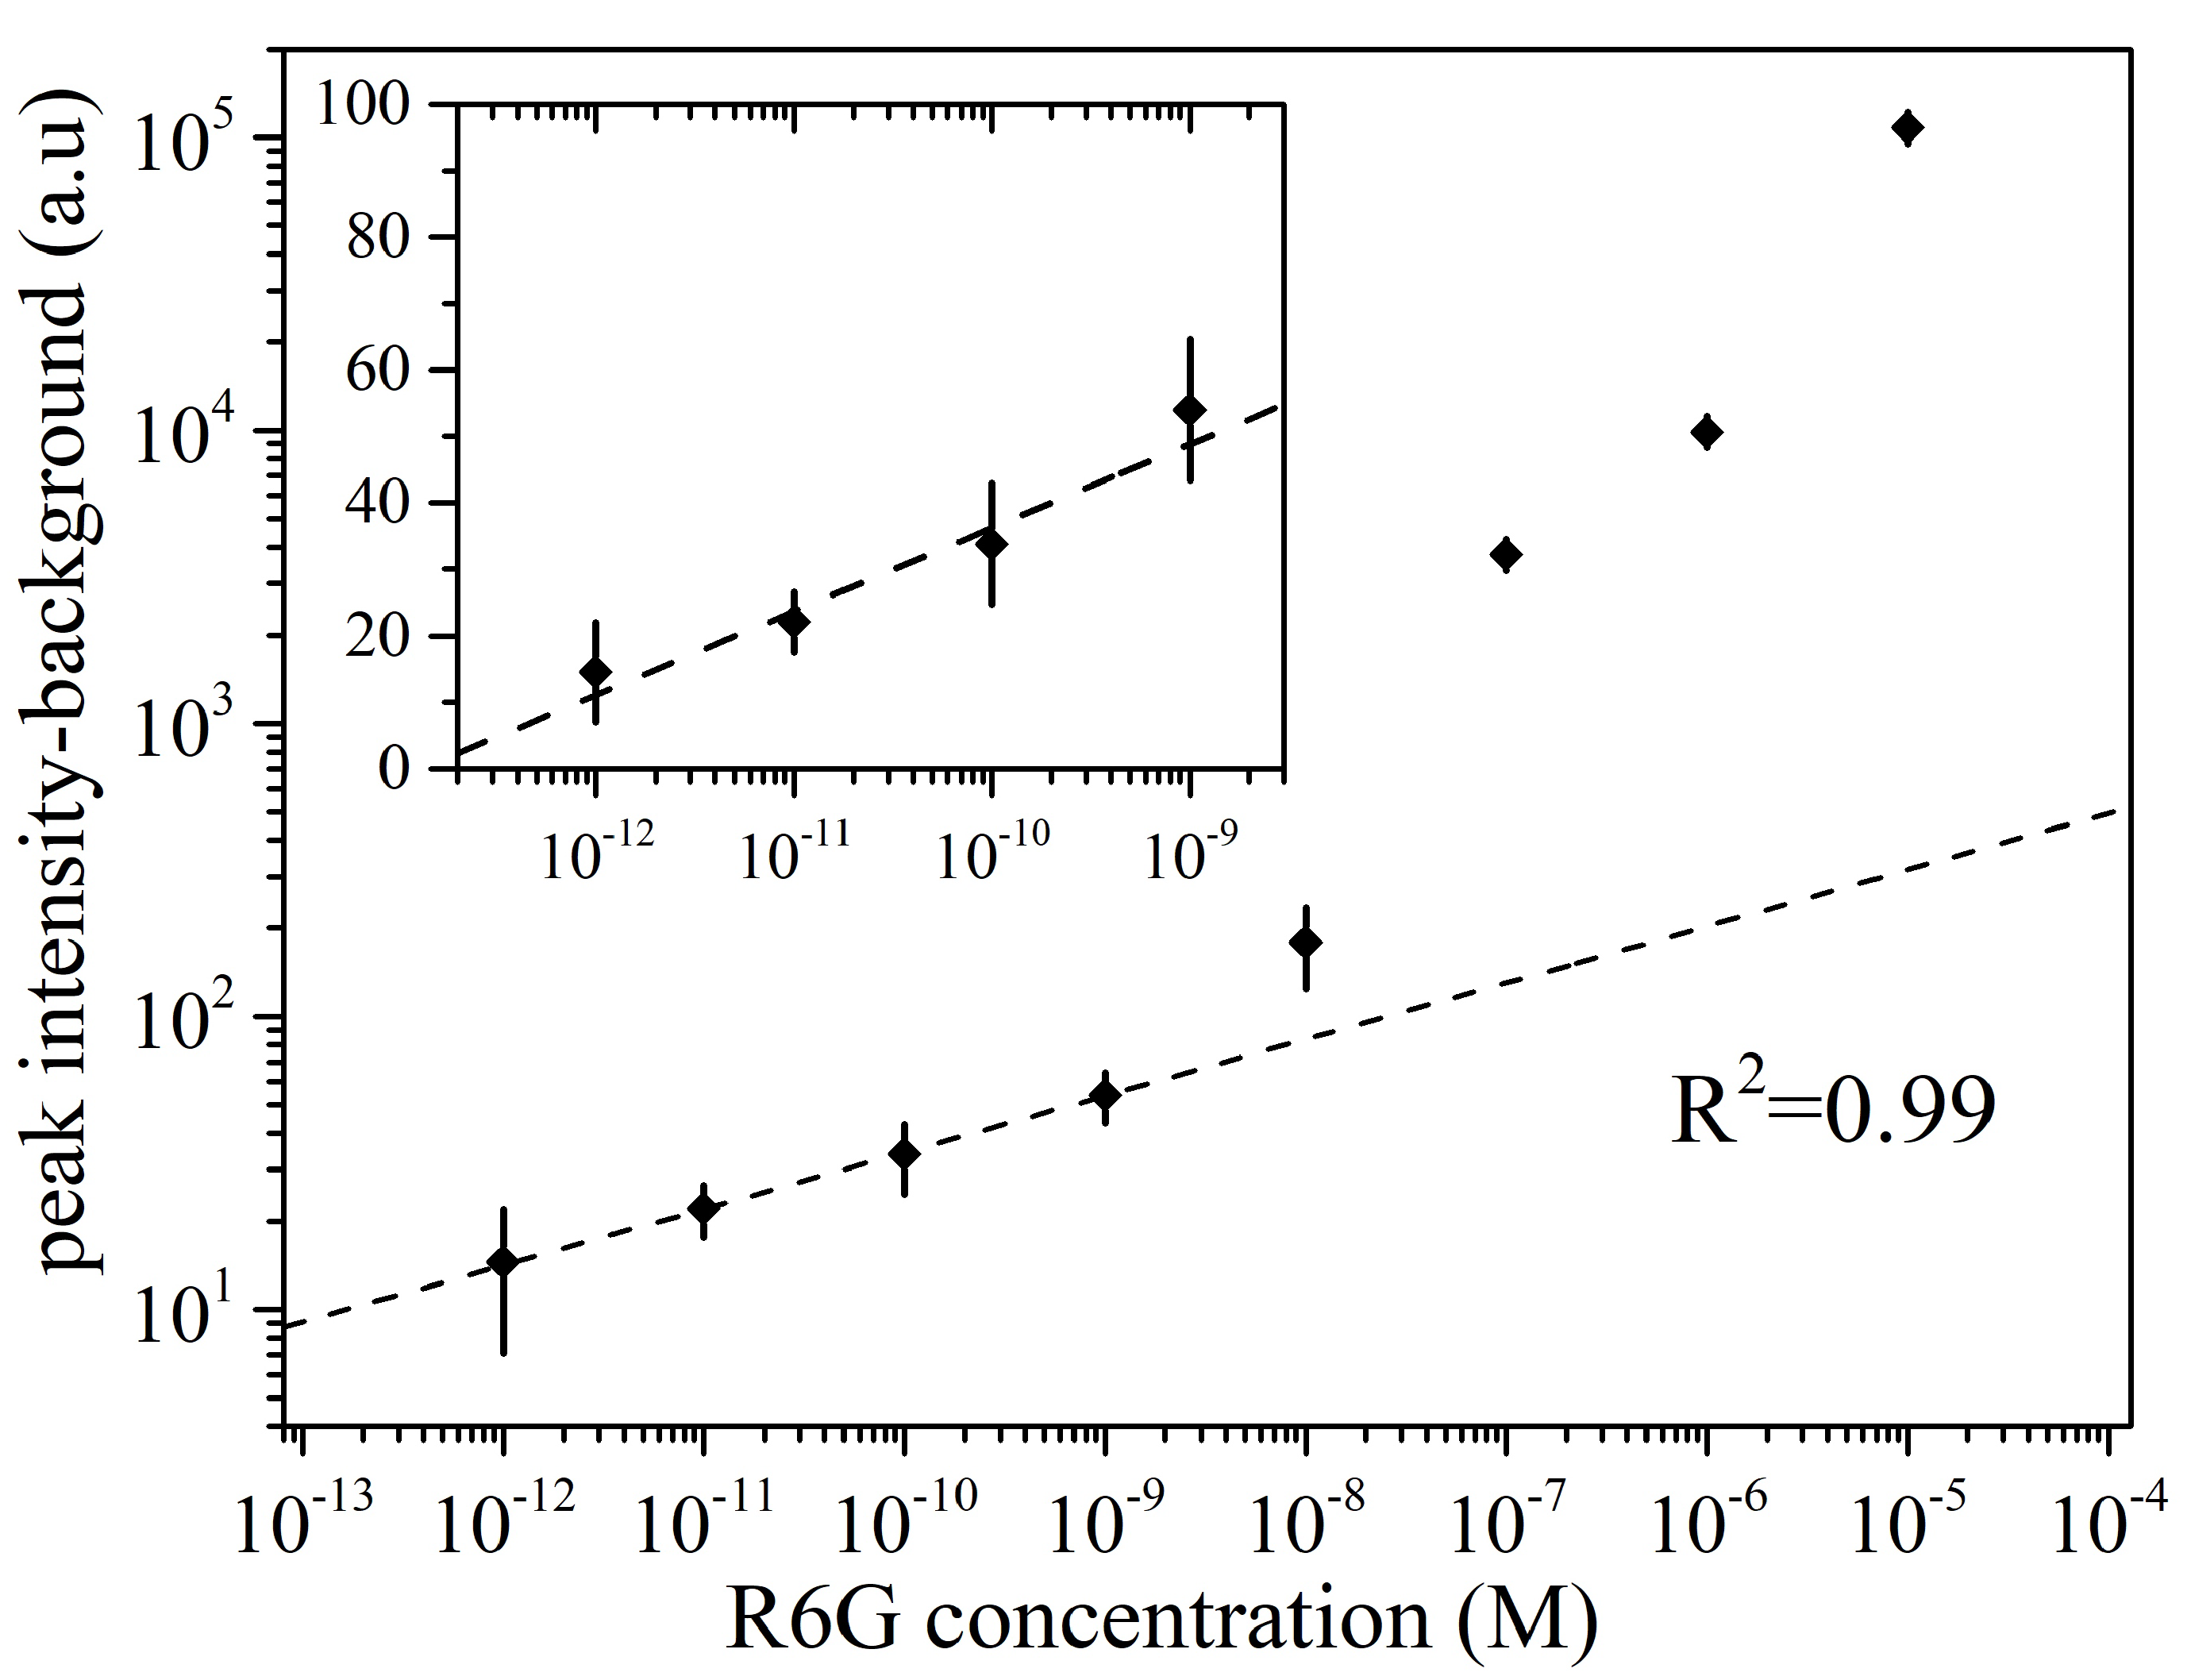
3.3. Photoluminescence Measurements
4. Discussion
5. Conclusions
Supplementary Materials
Author Contributions
Funding
Institutional Review Board Statement
Informed Consent Statement
Data Availability Statement
Acknowledgments
Conflicts of Interest
References
- Martínez-Hernández, M.E.; Rivero, P.J.; Goicoechea, J.; Arregui, F.J. Trends in the Implementation of Advanced Plasmonic Materials in Optical Fiber Sensors (2010–2020). Chemosensors 2021, 9, 64. [Google Scholar] [CrossRef]
- Taylor, A.B.; Zijlstra, P. Single-Molecule Plasmon Sensing: Current Status and Future Prospects. ACS Sens. 2017, 2, 1103–1122. [Google Scholar] [CrossRef]
- Abdulhalim, I. Plasmonic Sensing Using Metallic Nano-Sculptured Thin Films. Small 2014, 10, 3499–3514. [Google Scholar] [CrossRef]
- Pan, M.; Yang, J.; Liu, K.; Yin, Z.; Ma, T.; Liu, S.; Xu, L.; Wang, S. Noble Metal Nanostructured Materials for Chemical and Biosensing Systems. Nanomaterials 2020, 10, 209. [Google Scholar] [CrossRef] [PubMed]
- Zhang, Z.; Wanga, H.; Chena, Z.; Wang, X.; Chooc, J.; Chena, L. Plasmonic colorimetric sensors based on etching and growth of noble metal nanoparticles: Strategies and applications. Biosens. Bioelectron. 2018, 114, 52–65. [Google Scholar] [CrossRef] [PubMed]
- Loiseau, A.; Asila, V.; Boitel-Aullen, G.; Lam, M.; Salmain, M.; Boujday, S. Silver-Based Plasmonic Nanoparticles for and Their Use in Biosensing. Biosensors 2019, 9, 78. [Google Scholar] [CrossRef]
- Gopinath, S.C.B. Biosensing applications of surface plasmon resonance-based Biacore technology. Sens. Act. B Chem. 2010, 150, 722–733. [Google Scholar] [CrossRef]
- Doane, T.L.; Burda, C. The unique role of nanoparticles in nanomedicine: Imaging, drug delivery, and therapy. Chem. Soc. Rev. 2012, 41, 2885–2911. [Google Scholar] [CrossRef]
- Shen, W.; Tang, J.; Yang, R.; Cong, H.; Bao, X.; Wang, Y.; Wang, X.; Huang, Z.; Liu, J.; Huang, L. Enhanced efficiency of polymer solar cells by incorporated Ag-SiO2 core-shell nanoparticles in the active layer. RSC Adv. 2013, 4, 4379–4386. [Google Scholar] [CrossRef]
- Shen, W.; Tang, J.; Wang, Y.; Liu, J.; Huang, L.; Chen, W.; Yang, L.; Wang, W.; Wang, Y.; Yang, R. Strong enhancement of photoelectric conversion efficiency of co-hybridized polymer solar cell by silver nanoplates and core-shell nanoparticles. ACS Appl. Mater. Inter. 2017, 9, 5358–5365. [Google Scholar] [CrossRef]
- Mallick, K.; Witcomb, M.; Scurrell, M. Silver nanoparticle catalysed redox reaction: An electron relay effect. Mater. Chem. Phys. 2006, 97, 283–287. [Google Scholar] [CrossRef]
- Yu, H.; Peng, Y.; Yang, Y.; Li, Z.-Y. Plasmon-enhanced light–matter interactions and applications. Comput. Mater. 2019, 5, 45. [Google Scholar] [CrossRef]
- Klimov, V. Nanoplasmonics; Pan Stanford Publishing: Singapore, 2014. [Google Scholar]
- Kreibig, U.; Vollmer, M. Optical Properties of Metal Clusters; Springer: New York, NY, USA, 1995. [Google Scholar]
- Langer, J.; de Aberasturi, D.J.; Aizpurua, J.; Alvarez-Puebla, R.A.; Auguié, B.; Baumberg, J.J.; Bazan, G.C.; Bell, S.E.J.; Boisen, A.; Brolo, A.G.; et al. Present and Future of Surface-Enhanced Raman Scattering. ACS Nano 2020, 14, 28–117. [Google Scholar] [CrossRef] [PubMed]
- Kochylas, I.; Gardelis, S.; Likodimos, V.; Giannakopoulos, K.P.; Falaras, P.; Nassiopoulou, A.G. Improved Surface-Enhanced-Raman Scattering Sensitivity Using Si Nanowires/Silver Nanostructures by a Single Step Metal-Assisted Chemical Etching. Nanomaterials 2021, 11, 1760. [Google Scholar] [CrossRef] [PubMed]
- Zhang, J.; Malicka, J.; Gryczynski, I.; Lakowicz, J.R. Surface-enhanced fluorescence of fluorescein-labeled oligonucleotides capped on silver nanoparticles. J. Phys. Chem. B 2005, 109, 7643–7648. [Google Scholar] [CrossRef] [PubMed]
- Jeong, Y.; Kook, Y.-M.; Lee, K.; Koh, W.-G. Metal enhanced fluorescence (MEF) for biosensors: General approaches and a review of recent developments. Biosens. Bioelectron. 2018, 111, 102–116. [Google Scholar] [CrossRef]
- Lakowicz, J.R. Principles of Fluorescence Spectroscopy; Springer: Boston, MA, USA, 2006. [Google Scholar]
- Huang, L.; Wan, J.; Wei, X.; Liu, Y.; Huang, J.; Sun, X.; Zhang, R.; Gurav, D.D.; Vedarethinam, V.; Li, Y.; et al. Plasmonic silver nanoshells for drug and metabolite detection. Nat. Commun. 2017, 8, 220. [Google Scholar] [CrossRef] [PubMed]
- Sun, Y.; Xia, Y. Shape-controlled synthesis of gold and silver nanoparticles. Science 2002, 298, 2176–2179. [Google Scholar] [CrossRef]
- Skrabalak, S.E.; Au, L.; Li, X.; Xia, Y. Facile synthesis of Ag nanocubes and nanocages. Nat. Protoc. 2007, 2, 2182–2190. [Google Scholar] [CrossRef]
- Xia, X.; Zeng, J.; Zhang, Q.; Moran, C.H.; Xia, Y. Recent developments in shape-controlled synthesis of silver Nanocrystals. J. Phys. Chem. C Nanomater. Interfaces 2012, 116, 21647–21656. [Google Scholar] [CrossRef] [Green Version]
- Luo, Z.; Zheng, K.; Xie, J. Engineering ultrasmall water-soluble gold and silver nanoclusters for biomedical applications. Chem. Commun. 2014, 50, 5143–5155. [Google Scholar] [CrossRef] [PubMed]
- Dıez, I.; Ras, R.H.A. Fluorescent silver nanoclusters. Nanoscale 2011, 3, 1963. [Google Scholar] [CrossRef]
- Yang, J.; Jiang, Z. Facile fabrication of dendritic silver structures and their surface enhanced Raman spectroscopic properties. J. Chem. Sci. 2015, 127, 173–176. [Google Scholar] [CrossRef]
- Huang, H.J.; Shiao, M.-H.; Lin, Y.-W.; Lin, B.-J.; Su, J.; Lin, Y.-S.; Chang, H.-W. Au@Ag Dendritic Nanoforests for Surface-Enhanced Raman Scattering Sensing. Nanomaterials 2021, 11, 1736. [Google Scholar] [CrossRef] [PubMed]
- Chen, X.; Cui, C.-H.; Guo, Z.; Liu, J.-H.; Huang, X.-J.; Yu, S.-H. Unique Heterogeneous Silver–Copper Dendrites with a Trace Amount of Uniformly Distributed Elemental Cu and Their Enhanced SERS Properties. Small 2011, 7, 858–863. [Google Scholar] [CrossRef] [PubMed]
- Zhu, J.J.; Liao, X.H.; Zhao, X.N.; Chen, H.Y. Preparation of silver nanorods by electrochemical methods. Mater. Lett. 2001, 49, 91–95. [Google Scholar] [CrossRef]
- Sun, Y.; Yin, Y.; Mayers, B.T.; Herricks, T.; Xia, Y. Uniform silver nanowires synthesis by reducing AgNO3 with ethylene glycol in the presence of seeds and poly(vinyl pyrrolidone). Chem. Mater. 2002, 14, 4736–4745. [Google Scholar] [CrossRef]
- Pilot, R.; Massari, M. Silver nanoparticle aggregates: Wavelength dependence of their SERS properties in the first transparency window of biological tissues. Chem. Phys. Imp. 2021, 2, 100014. [Google Scholar] [CrossRef]
- Huang, K.; Huang, X.; Nogami, J. Isolated and assembled silver aggregates on the Si(001) surface: The initial stage of film formation. Phys. Chem. Chem. Phys. 2021, 23, 4161–4166. [Google Scholar] [CrossRef]
- Ozbay, E. Plasmonics: Merging photonics and electronics at nanoscale dimensions. Science 2006, 311, 189. [Google Scholar] [CrossRef]
- Wang, Y.; Wang, X.; Ma, W.; Lu, R.; Zhou, W.; Gao, H. Recent Developments in Rhodamine-Based Chemosensors: A Review of the Years 2018–2022. Chemosensors 2022, 10, 399. [Google Scholar] [CrossRef]
- Li, J.-F.; Li, C.-Y.; Aroca, R.F. Plasmon-enhanced fluorescence spectroscopy. Chem. Soc. Rev. 2017, 46, 3962. [Google Scholar] [CrossRef] [PubMed]
- Polte, J. Fundamental growth principles of colloidal metal nanoparticles—A new perspective. CrystEngComm 2015, 17, 6809–6830. [Google Scholar] [CrossRef]
- Shvalya, V.; Filipič, G.; Zavašnik, J.; Abdulhalim, I.; Cvelbar, U. Surface-enhanced Raman spectroscopy for chemical and biological sensing using nanoplasmonics: The relevance of interparticle spacing and surface morphology. Appl. Phys. Rev. 2020, 7, 031307. [Google Scholar] [CrossRef]
- Tang, H.; Zhu, C.; Meng, G.; Wu, N. Review—Surface-Enhanced Raman Scattering Sensors for Food Safety and Environmental Monitoring. J. Electr. Soc. 2018, 165, B3098–B3118. [Google Scholar] [CrossRef]
- Fothergill, S.M.; Joyce, C.; Xie, F. Metal enhanced fluorescence biosensing: From ultra-violet towards second near-infrared window. Nanoscale 2018, 10, 20914. [Google Scholar] [CrossRef] [PubMed]
- Pasparakis, G. Recent developments in the use of gold and silver nanoparticles in biomedicine. WIREs Nanomed. Nanobiotechnol. 2022, 14, e1817. [Google Scholar] [CrossRef]
- Verma, S.; Rao, B.T.; Sathe, V.; Bhartiya, S.; Patel, H.S.; Kaul, R.; Singh, B. Optical and surface enhanced Raman scattering responses of densely packed Ag-Au alloy nanoparticle films of varied composition and thickness. J. Alloys Compd. 2018, 753, 395–406. [Google Scholar] [CrossRef]
- Fan, M.; Lai, F.-J.; Chou, H.-L.; Lu, W.-T.; Hwang, B.-J.; Brolo, A.G. Surface-enhanced Raman scattering (SERS) from Au:Ag bimetallic nanoparticles: The effect of the molecular probe. Chem. Sci. 2013, 4, 509. [Google Scholar] [CrossRef]
- Gambucci, M.; Cambiotti, E.; Sassi, P.; Latterini, L. Multilayer Gold-Silver Bimetallic Nanostructures to Enhance SERS Detection of Drugs. Molecules 2020, 25, 3405. [Google Scholar] [CrossRef]
- Pawar, S.; Teja, B.R.; Nagarjuna, R.; Ganesan, R.; Nag, A. Probing the surface composition effect of silver-gold alloy in SERS efficiency. Colloids Surf. A Phys. Eng. Asp. 2019, 578, 123638. [Google Scholar] [CrossRef]
- Lin, S.; Lin, X.; Han, S.; He, L.; Zhao, H.; Zhang, J.; Hasi, W.; Wang, L. Width and length dependent SERS performance of core-shell Au@ Ag nanorod self-assembled monolayers. J. Alloys Compd. 2019, 805, 318–326. [Google Scholar] [CrossRef]
- Qi, Y.; Xing, T.; Zhao, J.; Weng, G.J.; Li, J.J.; Zhu, J.; Zhao, J.W. Tuning the surface enhanced Raman scattering performance of anisotropic Au core-Ag shell hetero-nanostructure: The effect of core geometry. J. Alloys Compd. 2019, 776, 934–947. [Google Scholar] [CrossRef]
- Yin, H.J.; Chen, Z.Y.; Zhao, Y.M.; Lv, M.Y.; Shi, C.A.; Wu, Z.L.; Zhang, X.; Liu, L.; Wang, M.L.; Xu, H.J. Ag@Au core-shell dendrites: A stable, reusable and sensitive surface enhanced Raman scattering substrate. Sci. Rep. 2015, 5, 14502. [Google Scholar] [CrossRef] [PubMed]
- Liao, W.; Liu, K.; Chen, Y.; Hua, J.; Gan, Y. Au–Ag bimetallic nanoparticles decorated silicon nanowires with fixed and dynamic hot spots for ultrasensitive 3D SERS sensing. J. Alloys Compd. 2021, 868, 159136. [Google Scholar] [CrossRef]
- Wang, X.; Ma, G.; Li, A.; Yu, J.; Yang, Z.; Lin, J.; Li, A.; Hanb, X.; Guo, L. Composition-adjustable Ag–Au substitutional alloy microcages enabling tunable plasmon resonance for ultrasensitive SERS. Chem. Sci. 2018, 9, 4009–4015. [Google Scholar] [CrossRef]
- Faro, M.J.L.; D’Andrea, C.; Leonardi, A.A.; Morganti, D.; Irrera, A.; Fazio, B. Fractal Silver Dendrites as 3D SERS Platform for Highly Sensitive Detection of Biomolecules in Hydration Conditions. Nanomaterials 2019, 9, 1630. [Google Scholar] [CrossRef]
- Shao, Y.; Li, S.; Niu, Y.; Wang, Z.; Zhang, K.; Mei, L.; Hao, Y. Three-Dimensional Dendritic Au–Ag Substrate for On-Site SERS Detection of Trace Molecules in Liquid Phase. Nanomaterials 2022, 12, 2002. [Google Scholar] [CrossRef]
- Han, H.; Huang, Z.; Lee, W. Metal-assisted chemical etching of silicon and nanotechnology applications. Nano Today 2014, 9, 271–304. [Google Scholar] [CrossRef]
- Leontis, I.; Botzakaki, M.A.; Georga, S.N.; Nassiopoulou, A.G. Study of Si Nanowires Produced by Metal-Assisted Chemical Etching as a Light-Trapping Material in n-type c-Si Solar Cells. ACS Omega 2018, 3, 10898–10906. [Google Scholar] [CrossRef]
- Leontis, I.; Botzakaki, M.A.; Georga, S.N.; Nassiopoulou, A.G. High capacitance density MIS capacitor using Si nanowires by MACE and ALD alumina dielectric. J. Appl. Phys. 2016, 119, 244508. [Google Scholar] [CrossRef]
- Srivastava, S.K.; Kumar, D.; Schmitt, S.W.; Sood, K.N.; Christiansen, S.H.; Singh, P.K. Large area fabrication of vertical silicon nanowire arrays by silver-assisted single-step chemical etching and their formation kinetics. Nanotechnology 2014, 25, 175601. [Google Scholar] [CrossRef] [PubMed]
- Green, M.A. Self-consistent optical parameters of intrinsic silicon at 300 K including temperature coefficients. Sol. Energy Mater. Sol. Cells 2008, 92, 1305–1310. [Google Scholar] [CrossRef]
- Johnson, P.B.; Christy, R.W. Optical Constants of the Noble Metals. Phys. Rev. B 1972, 6, 4370. [Google Scholar] [CrossRef]
- Wu, K.; Rindzevicius, T.; Schmidt, M.S.; Mogensen, K.B.; Xiao, S.; Boisen, A. Plasmon resonances of Ag capped Si nanopillars fabricated using mask-less lithography. Opt. Exp. 2015, 23, 12965. [Google Scholar] [CrossRef] [PubMed]
- Sugiarto, I.T.; Isnaeni; Putri, K.Y. Analysis of dual peak emission from Rhodamine 6G organic dyes using photoluminescence. J. Phys. Conf. Ser. 2017, 817, 012047. [Google Scholar] [CrossRef]
- Zehentbauer, F.M.; Moretto, C.; Stephen, R.; Thevar, T.; Gilchrist, J.R.; Pokrajac, D.; Richard, K.L.; Kiefer, J. Fluorescence spectroscopy of Rhodamine 6G: Concentration and solvent effects. Spectrochim. Acta A Mol. Biomol. Spectrosc. 2014, 121, 147–151. [Google Scholar] [CrossRef]
- Yang, S.; Dai, X.; Stogin, B.B.; Wong, T.-S. Ultrasensitive surface-enhanced Raman scattering detection in common fluids. Proc. Natl. Acad. Sci. USA 2016, 113, 268. [Google Scholar] [CrossRef]
- Ganbold, E.-O.; Park, J.-H.; Dembereldorj, U.; Ock, K.-S.; Joo, S.-W. Charge-dependent adsorption of rhodamine 6G on gold nanoparticle surfaces: Fluorescence and Raman study. J. Raman Spectrosc. 2011, 42, 1614–1619. [Google Scholar] [CrossRef]
- Kitching, H.; Kenyon, A.J.; Parkin, I.P. The interaction of gold and silver nanoparticles with a range of anionic and cationic dyes. Phys. Chem. Chem. Phys. 2014, 16, 6050. [Google Scholar] [CrossRef]
- Phuong, N.T.T.; Nguyen, T.-A.; Huong, V.T.; Tho, L.H.; Anh, D.T.; Ta, H.K.T.; Huy, T.H.; Trinh, K.T.L.; Tran, N.H.T. Sensors for Detection of the Synthetic Dye Rhodamine in Environmental Monitoring Based on SERS. Micromachines 2022, 13, 1840. [Google Scholar] [CrossRef] [PubMed]
- Pham, T.B.; Hoang, T.H.C.; Pham, V.H.; Nguyen, V.C.; Nguyen, T.V.; Vu, D.C.; Pham, V.H.; Bui, H. Detection of Permethrin pesticide using silver nano-dendrites SERS on optical fibre fabricated by laser-assisted photochemical method. Sci. Rep. 2019, 9, 12590. [Google Scholar] [CrossRef] [PubMed] [Green Version]


Disclaimer/Publisher’s Note: The statements, opinions and data contained in all publications are solely those of the individual author(s) and contributor(s) and not of MDPI and/or the editor(s). MDPI and/or the editor(s) disclaim responsibility for any injury to people or property resulting from any ideas, methods, instructions or products referred to in the content. |
© 2023 by the authors. Licensee MDPI, Basel, Switzerland. This article is an open access article distributed under the terms and conditions of the Creative Commons Attribution (CC BY) license (https://creativecommons.org/licenses/by/4.0/).
Share and Cite
Kochylas, I.; Dimitriou, A.; Apostolaki, M.-A.; Skoulikidou, M.-C.; Likodimos, V.; Gardelis, S.; Papanikolaou, N. Enhanced Photoluminescence of R6G Dyes from Metal Decorated Silicon Nanowires Fabricated through Metal Assisted Chemical Etching. Materials 2023, 16, 1386. https://doi.org/10.3390/ma16041386
Kochylas I, Dimitriou A, Apostolaki M-A, Skoulikidou M-C, Likodimos V, Gardelis S, Papanikolaou N. Enhanced Photoluminescence of R6G Dyes from Metal Decorated Silicon Nanowires Fabricated through Metal Assisted Chemical Etching. Materials. 2023; 16(4):1386. https://doi.org/10.3390/ma16041386
Chicago/Turabian StyleKochylas, Ioannis, Anastasios Dimitriou, Maria-Athina Apostolaki, Maria-Christina Skoulikidou, Vlassios Likodimos, Spiros Gardelis, and Nikolaos Papanikolaou. 2023. "Enhanced Photoluminescence of R6G Dyes from Metal Decorated Silicon Nanowires Fabricated through Metal Assisted Chemical Etching" Materials 16, no. 4: 1386. https://doi.org/10.3390/ma16041386