
A Fuzzy Logic Model for the Analysis of Ultrasonic Vibration Assisted Turning and Conventional Turning of Ti-Based Alloy


Mechanical Engineering Department, College of Engineering, University of Bahrain, Isa Town P.O. Box 32038, Bahrain
Materials 2021, 14(21), 6572; https://doi.org/10.3390/ma14216572
Submission received: 19 August 2021
/
Revised: 1 October 2021
/
Accepted: 13 October 2021
/
Published: 1 November 2021
(This article belongs to the Special Issue Advanced Designs of Materials, Machines and Processes in a Circular Economy)
Abstract
:Titanium and its alloys are largely used in various applications due its prominent mechanical properties. However, the machining of titanium alloys is associated with assured challenges, including high-strength, low thermal conductivity, and long chips produced in conventional machining processes, which result in its poor machinability. Advanced and new machining techniques have been used to improve the machinability of these alloys. Ultrasonic vibration assisted turning (UVAT) is one of these progressive machining techniques, where vibrations are imposed on the cutting insert, and this process has shown considerable improvement in terms of the machinability of hard-to-cut alloys. Therefore, selecting the right cutting parameters for conventional and assisted machining processes is critical for obtaining the anticipated dimensional accuracy and improved surface roughness of Ti-alloys. Hence, fuzzy-based algorithms were developed for the ultrasonic vibration assisted turning (UVAT) and conventional turning (CT) of the Ti-6Al7Zr3Nb4Mo0.9Nd alloy to predict the maximum process zone temperature, cutting forces, surface roughness, shear angle, and chip compression ratio for the selected range of input parameters (speed and depth-of-cut). The fuzzy-measured values were found to be in good agreement with the experimental values, indicating that the created models can be utilized to accurately predict the studied machining output parameters in CT and UVAT processes. The studied alloy resulted in discontinued chips in both the CT and UVAT processes. The achieved results also demonstrated a significant decline in the cutting forces and improvements in the surface quality in the UVAT process. Furthermore, the chip discontinuity is enhanced by the UVAT process due to the higher process zone temperature and the micro-impact imposed by the cutting tool on the workpiece.
1. Introduction
The balanced set of mechanical properties, lightweight, and corrosion to resistivity of titanium alloys make it an excellent choice for bellicose environment applications [1]. However, the high strength and low thermal conductivity causes severe challenges for mechanists in industries, resulting in poor surface quality, a high rejection rate, and tool wear [2]. Additionally, the spring back effect and continuous chip production of titanium alloys results time loss in production systems.
In the past, experiments and simulations have been used to study and improve the machinability of hard-to-cut alloys. These improvements were achieved by enhancing the machining capabilities [3,4,5,6], hybrid machining techniques [7], cryogenic coolant application [8], minimum lubricant quantity [9], and alloy modification without compromising the mechanical properties of the alloy [10]. The theory of ultrasonic machining has been successfully applied to face milling and drilling operations, and significant improvements in terms of the surface quality of the finished product has been achieved [11,12,13].
With these advancements in simulation tools, various studies have been conducted on the machining of titanium alloys [14]. Simulation tools allow readers to obtain the required results without spending time on costly and time-consuming experimental techniques. Many two- and three-dimensional finite element (FE) models have been developed for the orthogonal turning of Ti alloys to examine the outcomes of materials at several machining input parameters [15,16,17,18]. Similarly, with advances in computational facilities and software, three-dimensional FE simulation models have been established for conventional and assisted oblique turning processes [7,19].
With Industrial Revolution 4.0 and the advancement in CNC machines, most industries are moving toward the uninterrupted automatic machining of high-quality products. The long continuous chips produced in Ti alloys interrupt the machining time due to their entanglement with either the workpiece or cutting tool, affecting the surface quality of the finished product and the sharpness of the cutting tool, respectively. Therefore, artificial intelligence (AI) methods are becoming more desirable for the modeling of machining processes. Recently, a fuzzy-logic technique based on the combination of multivalued logic and the theory of probability to model complex engineering problems is gaining popularity in the research community [20]. Fuzzy-logic offers additional good judgment and concrete means to overcome the problem of commanding reasoning abilities confined by rules [21]. This method has been used by several investigators for the prediction of machining results based on the various input machining parameters as listed in Table 1.
Ultrasonic vibration-assisted turning (UVAT) is a machining technique in which vibrations are imposed on the cutting insert, resulting in the intermittent cutting of materials [38]. UVAT has shown significant improvements in surface quality and a decline in the cutting forces in hard-to-cut materials [19,39,40]. In the current work, a fuzzy logic technique is adopted for the simulation of UVAT and the conventional turning (CT) processes of Ti-6Al7Zr3Nb4Mo0.9Nd to predict the cutting forces, maximum process zone temperature, chip compression ratio (CCR), surface roughness, and shear angle (SA). The fuzzy model was validated with experimental results and was used for the comparative analysis of UVAT and CT.
2. Proposed Fuzzy Logic Algorithm
2.1. Fuzzy-Based Algorithms for UVAT and CT
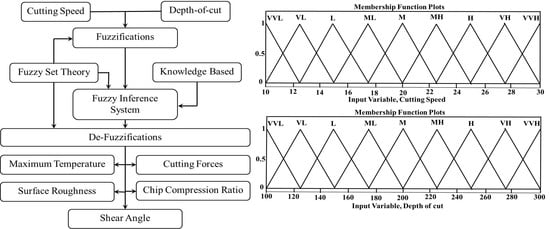
Figure 1 presents the conceptual illustration of the developed fuzzy inference systems for the calculation of the maximum process zone temperature, cutting forces, surface roughness, CCR, and SA in CT and UVAT at the selected range of input parameters.
The developed fuzzy inference systems are designed for two input variables, speed (V) and depth-of-cut (DoC), for the prediction of output variables such as maximum temperature, cutting forces, surface roughness, CCR, and SA during the CT and UVAT processes. The input variables are fed to the fuzzy plane, and the selected output variables are determined based on the defined fuzzy rules-based system. Moreover, in the developed algorithms, the output calculation of the scheme is established on the centroid-method, and de-fuzzification is accomplished using the Mamdani implication. The feed rate used in the current simulations were assumed to be constant at 0.1 mm/rev, whereas the axial force (Fa) component was also ignored due to its low level when compared to the radial force (Fr) and tangential force components (Ft). An amplitude of 10.0 µm and a frequency of 20.0 kHz were assumed in the developed UVAT process.
2.1.1. Fuzzy Membership Functions
A triangular membership function was used for the input (V and DoC) and output (tangential/radial forces, maximum process zone temperature, surface roughness, CCR, and SA) variables in the developed models based on the recommendation of Pedrycz [41]. The triangular function is mathematically represented in Equation (1):
where u, m, and v represent triangular membership function. Details can be found elsewhere [21].
2.1.2. Fuzzy Sets Used in Simulation
The two input variables V and DoC were divided into 9 fuzzy sets, which were represented as very-very-low (VVL), very-low (VL), low (L), medium-low (ML), medium (M), Medium-high (MH), high (H), very-high (VH), and very-very-high (VVH) in both the CT and UVAT in the developed fuzzy inference systems. The feed rate in the developed models was assumed to be constant at 0.1 mm/rev. Additionally, the output variables were distributed into 16 fuzzy-sets, i.e., extremely-low (EL), very-very-very-low (VVVL), very-very-low (VVL), very-low (VL), low (L), medium-low-low (MLL), medium-low (ML), medium (M), medium-high (MH), medium-high-high (MHH), high (H), very-high (VH), very-very-high (VVH), very-very-very-high (VVVH), and extremely-high (EH). The defined input variables with their related membership functions are given in Figure 2. The output variables for the UVAT and CT systems with their associated membership functions are presented in Figure 3 and Figure 4, respectively. Additionally, additional information and terminology considered for the defined input and output fuzzy sets used in the simulations of the CT and UVAT processes are listed in Table 2 and Table 3, respectively.
2.1.3. Proposed Rules
3. Experimental Work
A Ti-6Al-7Zr-3Nb-4Mo-0.9Nd designated as a T-6734-0.9Nd rod that had a length of 90 m and a diameter of 25 mm was received from the Technical University of Braunschweig, Germany. A thermosetting adhesive was used to join the received small piece of Ti-alloy to a mild steel specimen to be able to mount it in the chuck of a Lathe machine. DNMG 150608 MF1 CP500 inserts were used in the experiments, and details can be found elsewhere [3,7].
Three cutting speeds of 10, 20, and 30 m/min and three DoC levels (100, 200, and 300 µm) were selected for the experiments to validate the predicted simulation results. Each set of experiments was repeated three times, and no cutting fluid was used in the tests.
A modified universal Harrison M-300 Lathe machine was used to conduct the experiments on the as received alloys for the CT and UVAT process. The cutting forces were measured using a force sensor (KIAG-SWISS/Type9257A) made by Kistler. The axial force component was ignored during experimentation due to its low intensity compared to Ft and Fr. The frequency and amplitude were set to 20 kHz and 10 um, respectively, in the UVAT process. A calibrated FLIR (ThermaCAMTM SC-3000) thermal system was used for the measurement of the maximum process-zone temperature in CT and UVAT. The quick view specialized software was used for the analysis of the results.
The surface quality assessments of the machined samples were conducted on a Zygo®-newview-5000 interferometer. The Ra was assessed at the tested cutting conditions, and data were taken at various locations. The chips produced at various cutting conditions were collected and analyzed for CCR and SA in UVAT and CT. The chip collected at 100 µm and higher speeds were hard to mount in Bakelite resin and were excluded from experimentation. Additionally, the metallographic analysis of the alloy is not included in the current work.
4. Results and Discussion
4.1. Simulations Results
The commercially available simulation tool MATLAB 2014b was used for the developed algorithms based on the fuzzy logic inference system for UVAT and CT. The developed models were able to predict Fr, Ft, process zone temperature, surface roughness, CCR, and SA at various speed and depth-of-cut (DoCs) combinations as in input parameters.
The predicted Ft and Fr at selected cutting speeds and DoCs in CT and UVAT are presented in Figure 5 and Figure 6, respectively. The models predicted the cutting forces at various cutting parameters based on the rules defined and are consistent with the previously published work on UVAT and CT processes [3,10,38,42]. The model developed for UVAT process predicted a lower average value of Ft and Fr at various combinations of speed and DoCs when compared to the CT results.
A gradual increase in the predicted Ft and Fr was observed, with an increase in the speed and DoC during the UVAT process, as expected. Similarly, the model developed for CT foretold a gradual increase in the cutting forces, with a rise in the DoC. However, a minor variation in the Ft and Fr at selected cutting speeds was achieved in CT and was in good agreement with the findings of Muhammad et al. [3,7]. An average decline of approximately 60–70% in the cutting forces was described by the simulation of the UVAT process when compared to CT at lower tested cutting speeds.
The maximum temperature predicted in the UVAT and CT processes by the developed models is shown in Figure 7. A gradual increase in the maximum temperature with the cutting speed and DoC was measured in during the UVAT and CT processes [10,42]. However, the temperature level predicted in UVAT was slightly higher when compared to the temperature level predicted for CT due to the additional increase in the relative velocity due to vibration coupling on the cutting insert, which is in good agreement with Naseer et al. [43].
The developed simulation models were utilized to predict the surface roughness parameter (Ra) for the tested combinations of speed and DoC, as demonstrated in Figure 8. The model predicted a significant improvement in Ra due to the ironing effect of the cutting insert on the machine surface. Similarly, the models developed for the UVAT and CT processes predicted an improvement in the surface quality with a growth in cutting speed, which is in good agreement with work of Silberschmidt et al. [44].
The developed model was also used to predict the CCR and SA of the formed chips at various speed and DoC combinations. The predicted levels of CRR and SA are presented in Figure 9 and Figure 10, respectively. The models predicted a gradual increase in the CCR, showing growth in the speed and DoC in the studied processes [45]. However, the CCR in UVAT is significantly higher when matched to the CCR in CT.
A gradual rise in the SA was predicted in the CT and UVAT processes with DoC. However, with a growth in speed, a slight drop in the shear angle was noticed, which is in good agreement with [45].
4.2. Experimental Results
The experimental results demonstrate a significant decline of approximately 60–70% in the cutting forces in UVAT, as shown in Figure 11. At lower cutting speed of 10 m/min, the levels of Ft observed in CT at 100, 200, and 300 µm DoCs were 38, 72, and 101 N, respectively. Similarly, 23, 43, and 61 N forces in the radial direction were recorded for the same cutting conditions. On the other hand, a significantly lower level of Ft was measured in the UVAT process. The effect of vibrations on cutting forces is substantial at lower cutting speeds due to longer separation between the insert edge and chip [17].
The cutting forces were measured at various cutting speeds in CT, and it was found that speed has no significant effect on it (see Figure 12). However, in the UVAT process, a gradual increase in Ft and Fr was recorded with an increase in cutting speed. The Ft merely increased from 38 to 54 N when the speed was increased from 10 to 30 m/min and DoC = 300 µm. The same trend was also seen at lower DoCs.
The maximum temperatures recorded during the CT and UVAT processes are shown in Figure 13. A slightly higher temperature level was recorded in UVAT (408 °C) when matched to CT (327 °C) at the 30 m/min cutting speed and the 300 µm DoC. The same trend was observed in all of the tested cutting conditions. The increase in temperature can be linked with escalation in the relative velocity of the tool in one complete vibrational cycle and with the additional power provided to the cutting edge in the form of vibration [7,42,43]. The same trend was observed when the DoC was increased as well; however, the impact of speed is foremost, as expected [39,40,46].
The quality of the product is assessed through many factors, but one of the most prominent factors is the surface topography of a machined part. A substantial enhancement in the machine surface quality was achieved in the UVAT process when judged with CT in the same cutting conditions as those presented in Figure 14. The Ra value measured at 30 m/min in CT was still higher when compared to that obtained during the UVAT process at 10 m/min. The tool movement in one complete vibration cycle produced an ironing effect on the turned surface, and a reduction of approximately 36–50% in the Ra was achieved at all of the tested conditions in the UVAT process when matched to CT.
The studied alloys resulted in discontinuous chips in the CT and UVAT processes in all of the tested conditions. The chips were analyzed for CRR and SA calculations. The chip size produced during UVAT was substantially smaller when matched to the chip produced during CT in the same cutting conditions. The discontinuity of the chips resulted from the addition of Nd, which has a lower melting temperature. The chip samples from the UVAT and CT processes are presented in Figure 15.
The CCR was calculated using Equation (2), and SA was calculated using Equation (3) for the CT and UVAT processes [47].
where Hmax is the maximum height measured in serrated chips, the measured minimum height is denoted by Hmin, the net chip thickness is represented by dc, is the rake angle of the cutting insert, which is 14.6° for the CP-500 inserts, tf is the thickness of the chips after machining, and to is the initial chip thickness before machining.
The calculated CCR in the UVAT process was slightly higher than that of CT, as presented in Figure 16, and the possible reason for this is the vibration imposed on the cutting insert. A minor increase in the CCR was observed with an increase in cthe utting speed during both CT and UVAT, as expected
Similarly, the calculated SA for the CT and UVAT processes is shown in Figure 17. The results for the UVAT process showed a relatively higher magnitude of SA when compared to that of CT. An average SA of 86.2°, 81.2°, and 78.2° was measured at 10, 20, and 30 m/min, respectively, whereas in CT, the calculated SA was 84.8°, 78.9° and 73.6°, correspondingly. The increase of SA in the UVAT process can be attributed to the intermittent contact between the cutting insert and the chip. The vibro-impact phenomena resulted in more plastic deformation at the process zone when compared to CT. Additionally, the higher temperature level in the UVAT process also expedited the plastic deformation of the shear zone and resulted in a slight increase in SA. A minor decline in SA was noted with an increase in the cutting speed in the CT and UVAT processes.
4.3. Comparison of Simulated and Experimental Results
The data obtained from simulation of the developed algorithm are consistent with the experimental results for both of the studied processes. A comparative analysis of the simulation and experimental results is depicted in Table 6 and Table 7 for CT and UVAT, respectively. The predicted Ft and Fr in CT at 10 m/min velocity and DoC = 300 µm are 101.55 N and 60.25 N, respectively, whereas the tests led to an average value of approximately 101 N and 61 N, which are consistent with the simulation results. Similarly, the cutting forces predicted by the developed model for CT at all of the tested conditions are in good agreement with the experimental results (see Table 6).
Moreover, at DoC = 300 µm, the predicted maximum process zone temperature in CT was 257.74 °C at 10 m/min speed (see Table 6). The model predicted temperature levels of 333.00 °C and 366.66°C when the speed was increased to 20 m/min and 30 m/min, respectively. The experimental results showed temperatures of 262.00 °C, 325.00 °C, and 370.00 °C, correspondingly. The model predicted that the process zone temperature would have a maximum and minimum error of 3.11% and 0.71%, respectively, as shown in Figure 6.
Furthermore, the developed fuzzy model for CT predicted CCR values of 0.5838, 0.6464, and 0.7394 at 10 m/min speed studied DoC. The experimental results were measured, and the results showed that the model predicted the CCR with an accuracy of 99%. The simulations and experimental results of CCR are presented in Table 6.
The predicted and measured Ra value of the machined surface using CT is presented in Table 6. The fuzzy model for CT predicted the Ra value with a maximum error of 10%, which is still in the acceptable range. The developed model is a good alternative to predict the machine surface quality in CT. Furthermore, the SA predicted by the model is also in good agreement with the calculated results, and corresponding maximum and minimum errors of 8.5% and 0.05% were noted.
The developed fuzzy model for the UVAT process was used to predict the cutting forces, maximum process zone temperature, surface roughness, CCR, and SA, as presented in Table 7. At 10 m/min speed, the predicted Ft at 100, 200, and 300 µm DoCs were 12.8 N, 24.0 N, and 36.0 N, respectively. The experimental validation demonstrated an error of 6.25%, 4.16%, and 5.55%, correspondingly. Similarly, when the speed was increased, a gradual increase in the cutting forces was observed in UVAT both experimentally and through the fuzzy model. However, the overall error was less than 10% in the predicted forces and showed the acceptability of the developed model for cutting force estimations.
The predicted Fr by the simulations at all of the tested conditions awere5.76, 15.60, 26.20, 10.30, 20.89, 31.40, 18.24, 31.50, and 41.27 N, as presented in Table 7, whereas the measured Fr were 5, 14, 26, 10, 21, 35, 18, 32, and 42 N, correspondingly, and were shown to be in good agreement with the force level predicted by the fuzzy model.
The model was used for the prediction of the maximum process zone temperature during the UVAT process. The model predicted the temperature of the process zone at all of the tested cutting conditions, with a maximum difference of approximately 5 °C (Max 1.7% error) and are in good agreement with the experimental results.
The predicted Ra of 0.253 µm was obtained from the simulation model at 10 m/min speed and 100 µm DoC. A gradual increase of 0.132 µm and 0.171 µm in Ra was obtained at 200 µm and 300 µm DoCs, respectively, when compared to Ra achieved at 100 µm, and kept the speed intact, whereas the experiments resulted in Ra of 0.263 µm, 0.381 µm, and 0.424 µm, correspondingly. In addition, the fuzzy model is sensitive to cutting speed and showed surface roughness improvements with speed. The model also predicted significant improvements in the surface finish when compared to CT. The model results in a Ra of a machined surface with a minimum accuracy of approximately 96% in the UVAT process.
The collected chips at 10 m/min speed and the studied DoCs (100 µm, 200 µm and 300 µm) resulted in a CCR of 0.64, 0.72, and 0.74, respectively, while, the fuzzy model predicted a CCR 0.712, 0.724, and 0.749, correspondingly. Additionally, at 20 m/min, the CCR predicted by the simulation were 0.75 and 0.79, respectively, at 200 µm and 300 µm DoC. The experiments yielded 0.68 and 0.79 at the same cutting conditions. Likewise, at 30 m/min and 300 µm DoC, a minimal error of 0.5% and 0.25% was recorded between experimental and simulation results, respectively. The SA results predicted by the simulation model are in good agreement with the experimental results, and the model can be used to predict SA at the tested cutting conditions with an accuracy of 98.5% as presented in Table 7.
5. Conclusions
This paper reported the development of fuzzy-based simulation algorithms to predict the cutting forces, process zone temperature, surface quality of a machined specimen, CCR, and SA in the CT and UVAT processes. The algorithms were simulated effectively, and the results were in good agreement with the achieved experimental results. The simulation model for UVAT showed a significant reduction in the cutting forces and improvements in the surface quality when compared to the CT process. The developed model for the CT and UVAT processes can be used effectively to calculate the cutting forces, temperature of the process zone, surface quality, CCR, and SA of the studied alloys at various testing conditions within the acceptable range of accuracy (approximately 94%). Additionally, these models can be helpful to avoid the extensive and costly experimental methods needed to estimate output machining parameters. These algorithms may require expert knowledge but can be good alternative for future industries and for the selection of cutting parameters in current industries.
Funding
This research received no external funding. The APC was funded by University of Bahrain, Kingdom of Bahrain.
Acknowledgments
The author would like to acknowledge the support of the Technical University of Braunschweig Germany, and Loughborough University, UK, in the current work.
Conflicts of Interest
The authors declare no conflict of interest.
References
- Leyens, C.; Peters, M.; Hovsepian, P.; Lewis, D.; Luo, Q.; Münz, W.-D. Novel coating systems produced by the combined cathodic arc/unbalanced magnetron sputtering for environmental protection of titanium alloys. Surf. Coat. Technol. 2002, 155, 103–111. [Google Scholar] [CrossRef]
- Arrazola, P.-J.; Garay, A.; Iriarte, L.-M.; Armendia, M.; Marya, S.; Le Maître, F. Machinability of titanium alloys (Ti6Al4V and Ti555. 3). J. Mater. Process. Technol. 2009, 209, 2223–2230. [Google Scholar] [CrossRef] [Green Version]
- Maurotto, A.; Muhammad, R.; Roy, A.; Silberschmidt, V.V. Enhanced ultrasonically assisted turning of a β-titanium alloy. Ultrasonics 2013, 53, 1242–1250. [Google Scholar] [CrossRef] [Green Version]
- Celaya, A.; de Lacalle, L.N.L.; Campa, F.J.; Lamikiz, A. Ultrasonic Assisted Turning of mild steels. Int. J. Mater. Prod. Technol. 2010, 37, 60. [Google Scholar] [CrossRef]
- Celaya, A.; López de Lacalle, L.N.; Campa, F.J.; Lamikiz, A. Application of ultrasonics as assistance in machining operations. In Ultrasonics: Theory, Techniques and Practical Applications; Ayabito, H., Katsukawa, M., Eds.; Nova Science Publishers: New York, NY, USA, 2013; pp. 159–172. [Google Scholar]
- Airao, J.; Nirala, C.; Lacalle, L.; Khanna, N. Tool Wear Analysis during Ultrasonic Assisted Turning of Nimonic-90 under Dry and Wet Conditions. Metals 2021, 11, 1253. [Google Scholar] [CrossRef]
- Muhammad, R.; Ahmed, N.; Ullah, H.; Roy, A.; Silberschmidt, V.V. Hybrid machining process: Experimental and numerical analysis of hot ultrasonically assisted turning. Int. J. Adv. Manuf. Technol. 2018, 97, 2173–2192. [Google Scholar] [CrossRef] [Green Version]
- Agrawal, C.; Wadhwa, J.; Pitroda, A.; Pruncu, C.I.; Sarikaya, M.; Khanna, N. Comprehensive analysis of tool wear, tool life, surface roughness, costing and carbon emissions in turning Ti–6Al–4V titanium alloy: Cryogenic versus wet machining. Tribol. Int. 2021, 153, 106597. [Google Scholar] [CrossRef]
- Osman, K.A.; Yılmaz, V.; Ünver, H.Ö.; Şeker, U.; Kılıç, S.E. Slot milling of titanium alloy with hexagonal boron nitride and minimum quantity lubrication and multi-objective process optimization for energy efficiency. J. Clean. Prod. 2020, 258, 120739. [Google Scholar] [CrossRef]
- Muhammad, R.; Hussain, M.S.; Maurotto, A.; Siemers, C.; Roy, A.; Silberschmidt, V.V. Analysis of a free machining α+β titanium alloy using conventional and ultrasonically assisted turning. J. Mater. Process. Technol. 2014, 214, 906–915. [Google Scholar] [CrossRef] [Green Version]
- Suárez, A.; Veiga, F.; de Lacalle, L.N.L.; Polvorosa, R.; Lutze, S.; Wretland, A. Effects of Ultrasonics-Assisted Face Milling on Surface Integrity and Fatigue Life of Ni-Alloy 718. J. Mater. Eng. Perform. 2016, 25, 5076–5086. [Google Scholar] [CrossRef]
- Parandoush, P.; Fernando, P.; Zhang, H.; Ye, C.; Xiao, J.; Zhang, M.; Lin, D. A finishing process via ultrasonic drilling for additively manufactured carbon fiber composites. Rapid Prototyp. J. 2021, 27, 754–768. [Google Scholar] [CrossRef]
- Pujana, J.; Rivero, A.; Celaya, A.; de Lacalle, L.L. Analysis of ultrasonic-assisted drilling of Ti6Al4V. Int. J. Mach. Tools Manuf. 2009, 49, 500–508. [Google Scholar] [CrossRef]
- Lotfi, M.; Akbari, J. Finite element simulation of ultrasonic-assisted machining: A review. Int. J. Adv. Manuf. Technol. 2021, 1–20. [Google Scholar] [CrossRef]
- Lotfi, M.; Amini, S.; Akbari, J. Surface integrity and microstructure changes in 3D elliptical ultrasonic assisted turning of Ti–6Al–4V: FEM and experimental examination. Tribol. Int. 2020, 151, 106492. [Google Scholar] [CrossRef]
- Pei, L.; Shu, X. Investigation of the turning process of the TC21 titanium alloy: Experimental analysis and 3D simulation. Proc. Inst. Mech. Eng. Part E J. Process. Mech. Eng. 2020, 0954408920967777. [Google Scholar] [CrossRef]
- Muhammad, R.; Roy, A.; Silberschmidt, V.V. Finite Element Modelling of Conventional and Hybrid Oblique Turning Processes of Titanium Alloy. Procedia CIRP 2013, 8, 510–515. [Google Scholar] [CrossRef] [Green Version]
- Muhammad, R. Hot Ultrasonically Assisted Turning of Ti-15V3Al3Cr3Sn: Experimental and Numerical Analysis; Loughborough University: Loughborough, UK, 2013. [Google Scholar]
- Muhammad, R.; Ahmed, N.; Demiral, M.; Roy, A.; Silberschmidt, V.V. Computational Study of Ultrasonically-Assisted Turning of Ti Alloys. Adv. Mater. Res. 2011, 223, 30–36. [Google Scholar] [CrossRef] [Green Version]
- Aamir, M.; Tu, S.; Tolouei-Rad, M.; Giasin, K.; Vafadar, A. Optimization and Modeling of Process Parameters in Multi-Hole Simultaneous Drilling Using Taguchi Method and Fuzzy Logic Approach. Materials 2020, 13, 680. [Google Scholar] [CrossRef] [Green Version]
- Aamir, M.; Waqas, M.; Iqbal, M.; Hanif, M.I.; Muhammad, R. Fuzzy logic approach for investigation of microstructure and mechanical properties of Sn96.5-Ag3.0-Cu0.5 lead free solder alloy. Solder. Surf. Mt. Technol. 2017, 29, 191–198. [Google Scholar] [CrossRef]
- Ubaid, A.M.; Dweiri, F.T.; Aghdeab, S.H.; Al-Juboori, L.A. Optimization of Electro Discharge Machining Process Parameters With Fuzzy Logic for Stainless Steel 304 (ASTM A240). J. Manuf. Sci. Eng. 2017, 140, 011013. [Google Scholar] [CrossRef]
- Hossain, A.; Hossain, A.; Nukman, Y.; Hassan, M.; Harizam, M.; Sifullah, A.; Parandoush, P.J.M. A fuzzy logic-based pre-diction model for kerf width in laser beam machining. Mater. Manuf. Process. 2016, 31, 679–684. [Google Scholar] [CrossRef]
- Tseng, T.-L.; Konada, U.; Kwon, Y. A novel approach to predict surface roughness in machining operations using fuzzy set theory. J. Comput. Des. Eng. 2016, 3, 1–13. [Google Scholar] [CrossRef] [Green Version]
- Senthilkumar, N.; Sudha, J.; Muthukumar, V. A grey-fuzzy approach for optimizing machining parameters and the approach angle in turning AISI 1045 steel. Adv. Prod. Eng. Manag. 2015, 10, 195–208. [Google Scholar] [CrossRef]
- Ooi, M.E.; Sayuti, M.; Sarhan, A.A. Fuzzy logic-based approach to investigate the novel uses of nano suspended lubrication in precise machining of aerospace AL tempered grade 6061. J. Clean. Prod. 2015, 89, 286–295. [Google Scholar] [CrossRef] [Green Version]
- Barzani, M.M.; Zalnezhad, E.; Sarhan, A.A.; Farahany, S.; Ramesh, S. Fuzzy logic based model for predicting surface roughness of machined Al–Si–Cu–Fe die casting alloy using different additives-turning. Measurement 2015, 61, 150–161. [Google Scholar] [CrossRef]
- Vundavilli, P.R.; Parappagoudar, M.; Kodali, S.; Benguluri, S. Fuzzy logic-based expert system for prediction of depth of cut in abrasive water jet machining process. Knowl.-Based Syst. 2012, 27, 456–464. [Google Scholar] [CrossRef]
- Ramesh, S.; Karunamoorthy, L.; Palanikumar, K. Fuzzy Modeling and Analysis of Machining Parameters in Machining Titanium Alloy. Mater. Manuf. Process. 2008, 23, 439–447. [Google Scholar] [CrossRef]
- Kao, C.-C.; Shih, A.J.; Miller, S.F. Fuzzy Logic Control of Microhole Electrical Discharge Machining. J. Manuf. Sci. Eng. 2008, 130, 064502. [Google Scholar] [CrossRef]
- Lin, C.-T.; Chung, I.-F.; Huang, S.-Y. Improvement of machining accuracy by fuzzy logic at corner parts for wire-EDM. Fuzzy Sets Syst. 2001, 122, 499–511. [Google Scholar] [CrossRef]
- Lin, J.; Wang, K.; Yan, B.; Tarng, Y. Optimization of the electrical discharge machining process based on the Taguchi method with fuzzy logics. J. Mater. Process. Technol. 2000, 102, 48–55. [Google Scholar] [CrossRef]
- Tzeng, Y.-F.; Chen, F.-C. Multi-objective optimisation of high-speed electrical discharge machining process using a Taguchi fuzzy-based approach. Mater. Des. 2007, 28, 1159–1168. [Google Scholar] [CrossRef]
- Riaz, A.A.; Muhammad, R.; Ullah, N.; Hussain, G.; Alkahtani, M.; Akram, W. Fuzzy Logic-Based Prediction of Drill-ing-Induced Temperatures at Varying Cutting Conditions along with Analysis of Chips Morphology and Burrs Formation. Metals 2021, 11, 277. [Google Scholar] [CrossRef]
- Malik, A.; Sanghvi, N. Optimization of laser-assisted jet electrochemical machining parameters by grey relational analysis and fuzzy logic. World J. Eng. 2021. [Google Scholar] [CrossRef]
- Moganapriya, C.; Rajasekar, R.; Kumar, P.S.; Mohanraj, T.; Gobinath, V.; Saravanakumar, J. Achieving machining effec-tiveness for AISI 1015 structural steel through coated inserts and grey-fuzzy coupled Taguchi optimization approach. Struct. Multidiscip. Optim. 2021, 63, 1169–1186. [Google Scholar] [CrossRef]
- Vignesh, M.; Ramanujam, R.; Rajyalakshmi, G.; Bhattacharya, S. Application of Grey Theory and Fuzzy Logic to Optimize Machining Parameters of Zircon Sand Reinforced Aluminum Composites. In Lecture Notes in Mechanical Engineering; Gabler: Lakewood, CO, USA, 2020; pp. 653–662. [Google Scholar]
- Maurotto, A.; Siemers, C.; Muhammad, R.; Roy, A.; Silberschmidt, V.V. Ti Alloy with Enhanced Machinability in UAT Turning. Met. Mater. Trans. A 2014, 45, 2768–2775. [Google Scholar] [CrossRef] [Green Version]
- Muhammad, R.; Maurotto, A.; Roy, A.; Silberschmidt, V.V. Ultrasonically assisted turning of Ti-6Al-2Sn-4Zr-6Mo. J. Phys. Conf. Ser. 2012, 382, 012016. [Google Scholar] [CrossRef] [Green Version]
- Muhammad, R.; Maurotto, A.; Roy, A.; Silberschmidt, V.V. Analysis of Forces in Vibro-Impact and Hot Vibro-Impact Turning of Advanced Alloys. Appl. Mech. Mater. 2011, 70, 315–320. [Google Scholar] [CrossRef] [Green Version]
- Pedrycz, W. Why triangular membership functions? Fuzzy Sets Syst. 1994, 64, 21–30. [Google Scholar] [CrossRef]
- Ahmed, N.; Mitrofanov, A.V.; Babitsky, V.I.; Silberschmidt, V.V. Enhanced finite element model of ultrasonically assisted turning. Int. J. Mach. Mach. Mater. 2009, 6, 159. [Google Scholar] [CrossRef]
- Ahmed, N.; Mitrofanov, A.; Babitsky, V.; Silberschmidt, V.V. 3D finite element analysis of ultrasonically assisted turning. Comput. Mater. Sci. 2007, 39, 149–154. [Google Scholar] [CrossRef]
- Silberschmidt, V.V.; Mahdy, S.M.; Gouda, M.A.; Naseer, A.; Maurotto, A.; Roy, A. Surface-Roughness Improvement in Ul-Trasonically Assisted Turning. Procedia CIRP 2014, 13, 49–54. [Google Scholar] [CrossRef] [Green Version]
- Thakur, D.G.; Ramamoorthy, B.; Vijayaraghavan, L. Machinability investigation of Inconel 718 in high-speed turning. Int. J. Adv. Manuf. Technol. 2009, 45, 421–429. [Google Scholar] [CrossRef]
- Muhammad, R.; Ahmed, N.; Shariff, Y.M.; Silberschmidt, V.V. Effect of Cutting Conditions on Temperature Generated in Drilling Process: A FEA Approach. Adv. Mater. Res. 2011, 223, 240–246. [Google Scholar] [CrossRef] [Green Version]
- Groover, M.P. Fundamentals of Modern Manufacturing: Materials, Processes, and Systems; John Wiley & Sons: Hoboken, NJ, USA, 2020. [Google Scholar]
Figure 1.
Schematic illustration of developed fuzzy inference systems for CT and UVAT.

Figure 2.
Input variables with associated membership functions used in the simulation of UVAT and CT.
Figure 2.
Input variables with associated membership functions used in the simulation of UVAT and CT.

Figure 3.
Output variables with associated membership functions used in the simulation of UVAT.

Figure 4.
Output variables with associated membership functions used in the simulation of CT.

Figure 5.
The predicted Ft in CT and UVAT.

Figure 6.
The predicted Fr in CT and UVAT.

Figure 7.
The predicted maximum temperature results in UVAT and CT.

Figure 8.
The predicted Ra in UVAT and CT.

Figure 9.
Predicted level of CCR in UVAT and CT.

Figure 10.
The simulated SA variation with speed and DoC in UVAT and CT.

Figure 11.
Cutting forces at various DoCs and constant speed of 10 m/min.

Figure 12.
Experimentally measured cutting forces at various speeds and DoC = 300 µm.

Figure 13.
Measured temperature in CT and UVAT.

Figure 14.
Optical scans of machined surfaces.

Figure 15.
Chips of the studied alloy collected from the UVAT and CT processes.

Figure 16.
The calculated CCR at DoC = 300 µm.

Figure 17.
SEM image of the analyzed chip.


Table 1.
The contribution of researchers using fuzzy logic tools in machining processes in recent years.
Table 1.
The contribution of researchers using fuzzy logic tools in machining processes in recent years.
| Process | Workpiece | Machining Input Parameter | Investigation | Reference |
|---|---|---|---|---|
| DP | Al-5083 | V, FR | SQ, hole size | [20] |
| EDM | SS-304 | pulse-on/off times and current | MRR and EWR | [22] |
| LM | PMMA | V, power of laser, CO2 pressure, and stand-off distance | Width-kerf | [23] |
| MP | Al-6061 T6 | V, DoC, and FR | SQ | [24] |
| TP | AISI 1045 | V, DoC, and FR and approach angle | SQ, TW and, MRR | [25] |
| MP | Al-6061 T6 | Nozzle pressure, nozzle angle, and nanoparticle concentration | Cutting forces, cutting temperature, and SQ | [26] |
| TP | Al-Si-Cu-Fe and doped alloys | FR, V, and alloy type | SQ | [27] |
| AWJM | Brittle materials | Nozzle diameter, pressure of liquid, mass flow rate of abrasive jet traverse rate | DoC | [28] |
| TP | Ti64 | V, DoC, FR, | SQ, TW, and specific cutting pressure | [29] |
| EDM drilling | AISI-1010 Steel | Voltage gap, spark ratio deviation, and change in the deviation in spark-ratio | Current, voltage, and ignition delay time | [30] |
| Wire EDM | Die steel | Thickness, FR, and corner angle | Machining accuracy at corner parts | [31] |
| EDM | Die steel | Discharge current, the polarity of the workpiece, voltage at open discharge, pulse-on time, duty factor, | MRR and electrode wear ratio | [32] |
| EDM | Tool steel | Powder concentration, open-circuit voltage, duty cycle, pulsed duration, pulsed peak current, powder concentration, powder size | Dimensional accuracy and precision | [33] |
| DP | AISI-1018 steel | V and FR | Process zone temperature, burr formation, and chip morphology | [34] |
| LAJEM | WC-Co composite | Inter-electrode gap, supply voltage, electrolyte concentration, and duty cycle | Hole taper angle, MRR, and SQ | [35] |
| TP | AISI-1015 steel | V, DoC, FR, coolant flow rate | TW and SQ | [36] |
| TP | ZrSiO4-grade-LM25 matrix composites | Coolant, V, FR, DoC | Cutting forces, SQ, and TW | [37] |
Drilling process (DP), abrasive waterjet machining (AWJM), turning process (TP), electrical discharge machining (EDM), milling process (MP), laser machining (LM), speed (V), feed rate (FR), depth-of-cut (DoC), material removal rate (MRR), electrode wear rate (EWR), laser-assisted jet electro-chemical machining (LAJEM), surface quality (SQ), tool wear (TW).
Table 2.
Input and output parameters used in the CT fuzzy inference system.
| MF Type | Fuzzy Input Variables | Fuzzy Output Variables | ||||||||||||||||
|---|---|---|---|---|---|---|---|---|---|---|---|---|---|---|---|---|---|---|
| Variable | Speed (v) | Depth-of-Cut (DoC) | Variable | Tangential Cutting Forces (Ft) | Radial Force Component (Fr) | Temperature (T) | Surface Roughness (Ra) | Chip Compression ratio (CCR) | Shear Angle (SA) | |||||||||
| Parameter | Range | Parameter | Range | Parameter | Range | Parameter | Range | Parameters | Range | Parameter | Range | Parameter | Range | Parameter | Range | |||
| Triangular | VVL | [10 10 12.5] | [10 30] | [100 100 125] | [100 300] | EL | [33 33 38] | [33 103] | [23 23 25.71] | [23 61] | [195 195 207.5] | [195 370] | [0.297 0.297 0.3372] | [0.297 0.86] | [0.58 0.58 0.5933] | [0.58 0.766] | [48 48 50.57] | [48 84] |
| VL | [10 12.5 15] | [100 125 150] | VVVL | [33 38 43] | [23 25.71 28.43] | [195 207.5 220] | [0.297 0.3372 0.3774] | [0.58 0.5988 0.6066] | [48 50.57 53.14] | |||||||||
| L | [12.5 15 17.5] | [125 150 175] | VVL | [38 43 48] | [25.71 28.43 31.14] | [207.5 220 232.5] | [0.3372 0.3774 0.4176] | [0.5966 0.6066 0.6199] | [50.57 53.14 55.71] | |||||||||
| ML | [15 17.5 20] | [150 175 200] | VL | [43 48 53] | [28.43 31.14 33.86] | [220 232.5 245] | [0.3774 0.4176 0.4578] | [0.6066 0.6199 0.6332] | [53.14 55.71 58.28] | |||||||||
| M | [17.5 20 22.5] | [175 200 225] | L | [48 53 58] | [31.14 33.86 36.57] | [232.5 245 257.5] | [0.4176 0.4578 0.498] | [0.6199 0.6332 0.6465] | [55.71 58.28 60.85] | |||||||||
| MH | [20 22.5 25] | [200 225 250] | MLL | [53 58 63] | [33.86 36.57 39.28] | [245 257.5 270] | [0.4578 0.498 0.5382] | [0.6332 0.6465 0.6598] | [58.28 60.85 63.42] | |||||||||
| H | [22.5 25 27.5] | [225 250 275] | ML | [58 63 68] | [36.57 39.28 42] | [257.5 270 282.5] | [0.498 0.5382 0.5784] | [0.6465 0.6598 0.6731] | [60.85 63.42 66] | |||||||||
| VH | [25 27.5 30] | [250 275 300] | M | [63 68 73] | [39.28 42 44.71] | [270 282.5 295] | [0.5382 0.5784 0.6186] | [0.6598 0.6731 0.6864] | [63.42 66 68.57] | |||||||||
| VVH | [27.5 30 30] | [275 300 300] | MH | [68 73 78] | [42 44.71 47.43] | [282.5 295 307.5] | [0.5784 0.6186 0.6588] | [0.6731 0.6864 0.6997] | [66 68.57 71.13] | |||||||||
| MHH | [73 78 83] | [44.71 47.43 50.14] | [295 307.5 320] | [0.6186 0.6588 0.699] | [0.6864 0.6997 0.713] | [68.57 71.13 73.7] | ||||||||||||
| H | [78 83 88] | [47.43 50.14 52.85] | [307.5 320 332.5] | [0.6588 0.699 0.7392] | [0.6997 0.713 0.7263] | [71.13 73.7 76.27] | ||||||||||||
| VH | [83 88 93] | [50.14 52.85 55.57] | [320 332.5 345] | [0.699 0.7392 0.7794] | [0.713 0.7263 0.7396] | [73.7 76.27 78.84] | ||||||||||||
| VVH | [88 93 98] | [52.85 55.57 58.28] | [332.5 345 357.5] | [0.7392 0.7794 0.8196] | [0.7263 0.7396 0.7529] | [76.27 78.84 81.41] | ||||||||||||
| VVVH | [93 98 103] | [55.57 58.28 61] | [345 357.5 370] | [0.7794 0.8196 0.86] | [0.7396 0.7529 0.766] | [78.84 81.41 84] | ||||||||||||
| EH | [98 103 103] | [58.28 61 61] | [357.5 370 370] | [0.8196 0.86 0.86] | [0.7529 0.766 0.766] | [81.41 84 84] | ||||||||||||
Table 3.
Input and output parameters used in the UVAT fuzzy inference system.
| MF Type | Fuzzy Input Variables | Fuzzy Output Variables | ||||||||||||||||
|---|---|---|---|---|---|---|---|---|---|---|---|---|---|---|---|---|---|---|
| Variable | Speed (v) | Depth-of-Cut (DoC) | Variable | Tangential Cutting Forces (Ft) | Radial Force Component (Fr) | Temperature (T) | Surface Roughness (Ra) | Chip Compression ratio (CCR) | Shear Angle (SA) | |||||||||
| Parameter | Range | Parameter | Range | Parameter | Range | Parameter | Range | Parameters | Range | Parameter | Range | Parameter | Range | Parameter | Range | |||
| Triangular | VVL | [10 10 12.5] | [10 30] | [100 100 125] | [100 300] | EL | [12 12 15] | [12 54] | [5 5 7.65] | [5 42] | [224 224 237.2] | [224 408] | [0.121 0.121 0.143] | [0.121 0.429] | [0.71 0.71 0.7173] | [0.71 0.8122] | [64 64 65.57] | [64 86] |
| VL | [10 12.5 15] | [100 125 150] | VVVL | [12 15 18] | [5 7.65 10.3] | [224 237.2 250.4] | [0.121 0.143 0.165] | [0.70 0.7173 0.7246] | [64 65.57 67.14] | |||||||||
| L | [12.5 15 17.5] | [125 150 175] | VVL | 15 18 21] | [7.65 10.3 12.95] | [237.2 250.4 263.6] | [0.143 0. 165 0.187] | [0.7173 0.7246 0.7319] | [65.57 67.14 68.71] | |||||||||
| ML | [15 17.5 20] | [150 175 200] | VL | [18 21 24] | [10.3 12.95 15.6] | [250.4 263.6 276.8] | [0.165 0.187 0.209] | [0.7246 0.7319 0.7392] | [67.14 68.71 70.28] | |||||||||
| M | [17.5 20 22.5] | [175 200 225] | L | [21 24 27] | [12.95 15.6 18.25] | [263.6 276.8 290] | [0.187 0.209 0.231] | [0.7319 0.7392 0.7465] | [68.71 70.28 71.85] | |||||||||
| MH | [20 22.5 25] | [200 225 250] | MLL | [24 27 30] | [15.6 18.25 20.9] | [276.8 290 303.2] | [0.209 0.231 0.253] | [0.7392 0.7465 0.7538] | [70.28 71.85 73.42] | |||||||||
| H | [22.5 25 27.5] | [225 250 275] | ML | [27 30 33] | [18.25 20.9 23.55] | [290 303.2 316.4] | [0.231 0.253 0.275] | [0.7465 0.7538 0.7611] | [71.85 73.42 75] | |||||||||
| VH | [25 27.5 30] | [250 275 300] | M | [30 33 36] | [20.9 23.55 26.2] | [303.2 316.4 329.6] | [0.253 0.275 0.297] | [0.7538 0.7611 0.7684] | [73.42 75 76.57] | |||||||||
| VVH | [27.5 30 30] | [275 300 300] | MH | [33 36 39] | [23.55 26.2 28.85] | [316.4 329.6 342.8] | [0.275 0.297 0.319] | [0.7611 0.7684 0.7757] | [75 76.57 78.13] | |||||||||
| MHH | [36 39 42] | [26.2 28.85 31.5] | [329.6 342.8 356] | [0.297 0.319 0.341] | [0.7684 0.7757 0.783] | [76.57 78.13 79.7] | ||||||||||||
| H | [39 42 45] | [28.85 31.5 34.15] | [342.8 356 369.2] | [0.319 0.341 0.363] | [0.7757 0.783 0.7903] | [78.13 79.7 81.27] | ||||||||||||
| VH | [42 45 48] | [31.5 34.15 36.8] | [356 369.2 382.4] | [0.341 0.363 0.385] | [0.783 0.7903 0.7976] | [79.7 81.27 82.84] | ||||||||||||
| VVH | [45 48 51] | [34.15 36.8 39.45] | [369.2 382.4 395.6] | [0.363 0.385 0.407] | [0.7903 0.7976 0.8049] | [81.27 82.84 84.41] | ||||||||||||
| VVVH | [48 51 54] | [36.8 39.45 42] | [382.4 395.6 408] | [0.385 0.407 0.429] | [0.7976 0.8049 0.8122] | [82.84 84.41 86] | ||||||||||||
| EH | [51 54 54] | [39.45 42 42] | [395.6 408.8 408] | [0.407 0.429 0.429] | [0.8049 0.8122 0.8122] | [84.41 86 86] | ||||||||||||
Table 4.
The rules used in the UVAT simulation.
| Input | Output | Input | Output | ||||||||||||||
|---|---|---|---|---|---|---|---|---|---|---|---|---|---|---|---|---|---|
| Rules No | Speed | Depth-of-Cut | Tangential Cutting Force | Radial Cutting Force | Temperature | Surface Roughness | Chip Compression Ratio (CCR) | Shear Angle (SA) | Rules No | Speed | Depth-of-Cut | Tangential Cutting Force | Radial Cutting Force | Temperature | Surface Roughness | Chip Compression Ratio (CCR) | Shear Angle (SA) |
| R1 | VVL | VVL | EL | EL | EL | ML | EL | MH | R2 | VVL | VL | VVVL | VVVL | VVVL | M | EL | MHH |
| R3 | VVL | L | VVL | VVL | VVVL | MHH | VVVL | H | R4 | VVL | ML | VL | VL | VVL | VH | VVVL | VVH |
| R5 | VVL | M | L | L | VL | VVH | VVL | VVVH | R6 | VVL | MH | MLL | MLL | L | VVVH | VVL | VVVH |
| R7 | VVL | H | ML | ML | MLL | VVVH | L | VVVH | R8 | VVL | VH | M | M | MLL | EH | MLL | EH |
| R9 | VVL | VVH | MH | MH | ML | EH | MLL | EH | R10 | VL | VVL | VVVL | VVVL | VVVL | MLL | VVVL | MHH |
| R11 | VL | VL | VVL | VVL | VVVL | M | VVL | H | R12 | VL | L | VL | VL | VVL | MHH | VVL | VH |
| R13 | VL | ML | L | L | VL | VH | VL | VVH | R14 | VL | M | MLL | MLL | L | VH | VL | VVVH |
| R15 | VL | MH | ML | ML | MLL | VVH | VL | VVVH | R16 | ML | H | M | M | MLL | VVH | L | EH |
| R17 | VL | VH | MH | MH | ML | VVVH | MLL | EH | R18 | VL | VVH | MHH | MHH | M | EH | MLL | EH |
| R19 | L | VVL | VVL | VVL | VVL | MLL | VVL | H | R20 | L | VL | VL | VL | VVL | ML | VL | H |
| R21 | L | L | L | L | VL | M | VL | VH | R22 | L | ML | MLL | MLL | L | H | L | VVVH |
| R23 | L | M | ML | ML | MLL | H | L | VVVH | R24 | L | MH | M | M | ML | VH | MLL | VVVH |
| R25 | L | H | MH | M | M | VH | MLL | EH | R26 | L | VH | MHH | M | MH | VVVH | ML | EH |
| R27 | L | VVH | H | MHH | MH | EH | ML | EH | R28 | ML | VVL | VVL | VVL | VVL | L | EL | L |
| R29 | ML | VL | VL | VL | VL | M | VVVL | MLL | R30 | ML | L | VL | VL | L | MH | VVL | ML |
| R31 | ML | ML | L | L | MLL | MHH | VL | M | R32 | ML | M | MLL | MLL | MLL | H | L | MH |
| R33 | ML | MH | ML | ML | ML | H | ML | MH | R34 | ML | H | M | M | M | H | MH | MHH |
| R35 | ML | VH | M | MH | MH | VVH | MHH | H | R36 | ML | VVH | MHH | MHH | MHH | VVVH | H | H |
| R37 | M | VVL | VL | VVL | L | VL | EL | MLL | R38 | M | VL | L | VL | L | L | VVL | ML |
| R39 | M | L | MLL | L | MLL | ML | VL | M | R40 | M | ML | ML | MLL | MLL | M | L | MH |
| R41 | M | M | M | ML | ML | MHH | ML | MHH | R42 | M | MH | MH | M | M | H | M | MHH |
| R43 | M | H | MHH | MH | MH | H | MHH | H | R44 | M | VH | H | MHH | MHH | VH | H | VH |
| R45 | M | VVH | VH | H | H | VVH | VH | VH | R46 | MH | VVL | L | VL | L | VL | VVVL | ML |
| R47 | MH | VL | L | VL | MLL | L | VVL | M | R48 | MH | L | MLL | L | ML | L | VL | MH |
| R49 | MH | ML | ML | MLL | ML | ML | MLL | MHH | R50 | MH | M | M | ML | M | M | ML | H |
| R51 | MH | MH | MH | MH | MH | MH | MH | H | R52 | MH | H | MHH | MHH | MHH | MHH | H | VH |
| R53 | MH | VH | H | MHH | H | H | VH | VVH | R54 | MH | VVH | VH | VH | VH | VVH | VH | VVH |
| R55 | H | VVL | L | VL | L | VVL | VVVL | EL | R56 | H | VL | MLL | VL | L | VVL | VVL | VVVL |
| R57 | H | L | ML | L | MLL | VL | VL | VL | R58 | H | ML | M | MLL | ML | L | L | MLL |
| R59 | H | M | M | ML | M | MLL | L | ML | R60 | H | MH | MH | M | MH | M | ML | ML |
| R61 | H | H | MHH | MH | H | MH | M | M | R62 | H | VH | H | MHH | VH | MH | H | MH |
| R63 | H | VVH | VH | VH | VVH | VH | VH | MH | R64 | VH | VVL | L | L | ML | VVVL | VVL | VVVL |
| R65 | VH | VL | L | L | ML | VVVL | VL | VVL | R66 | VH | L | MLL | MLL | M | VVVL | L | MLL |
| R67 | VH | ML | M | ML | MH | VVL | L | ML | R68 | VH | M | MH | MH | MH | VL | MLL | M |
| R69 | VH | MH | MHH | MH | H | ML | M | MH | R70 | VH | H | H | H | VH | M | MH | MH |
| R71 | VH | VH | VH | VH | VVH | MHH | H | MHH | R72 | VH | VVH | VVH | VVH | VVVH | H | VVVH | MHH |
| R73 | VVH | VVL | MLL | MLL | ML | EL | VVL | EL | R74 | VVH | VL | ML | ML | M | VVVL | VL | VL |
| R75 | VVH | L | MH | M | MH | VVL | MLL | MLL | R76 | VVH | ML | MHH | MHH | MH | VL | M | M |
| R77 | VVH | M | H | H | MHH | L | MHH | MH | R78 | VVH | MH | VH | VH | VH | MLL | H | MH |
| R79 | VVH | H | VVH | VVH | VVH | M | VH | MHH | R80 | VVH | VH | VVVH | VVVH | VVVH | MH | VVH | H |
| R81 | VVH | VVH | EH | EH | EH | MHH | EH | H | |||||||||
Table 5.
The rules defined for the CT fuzzy inference system.
| Input | Output | Input | Output | ||||||||||||||
|---|---|---|---|---|---|---|---|---|---|---|---|---|---|---|---|---|---|
| Rules | Speed | Depth of Cut | Tangential Cutting Force | Radial Cutting Force | Temperature | Surface Roughness | Chip Compression Ratio | Shear Angle | Rules | Speed | Depth of Cut | Tangential Cutting Force | Radial Cutting Force | Temperature | Surface Roughness | Chip Compression Ratio | Shear Angle |
| R1 | VVL | VVL | VVVL | EL | EL | VL | EL | L | R2 | VVL | VL | VL | VVL | VVVL | MLL | VVL | ML |
| R3 | VVL | L | MLL | L | VVL | ML | L | MH | R4 | VVL | ML | M | ML | VVL | M | MLL | H |
| R5 | VVL | M | MH | M | VL | MH | ML | VH | R6 | VVL | MH | MHH | MHH | VL | H | MH | VH |
| R7 | VVL | H | VH | VH | L | VH | H | VVH | R8 | VVL | VH | VHHH | VVVH | MLL | VVVH | VH | VVVH |
| R9 | VVL | VVH | EH | EH | MLL | EH | VVH | EH | R10 | VL | VVL | EL | EL | VVVL | VVL | VVVL | MLL |
| R11 | VL | VL | VL | VVL | VVL | L | VVL | MH | R12 | VL | L | ML | L | VL | MLL | L | H |
| R13 | VL | ML | ML | ML | VL | ML | ML | VH | R14 | VL | M | MH | MH | L | M | M | VVH |
| R15 | VL | MH | MHH | MHH | L | MHH | MHH | VVH | R16 | ML | H | VH | VH | MLL | H | H | VVVH |
| R17 | VL | VH | VVVH | VVVH | ML | VVH | VH | VVVH | R18 | VL | VVH | EH | EH | ML | VVVH | VVH | EH |
| R19 | L | VVL | VVVL | VVVL | VVL | VVL | L | L | R20 | L | VL | VVL | VL | VL | VL | MLL | L |
| R21 | L | L | VL | MLL | VL | L | ML | MLL | R22 | L | ML | ML | M | L | ML | ML | ML |
| R23 | L | M | M | MH | MLL | M | M | M | R24 | L | MH | MHH | MHH | M | MH | MHH | MH |
| R25 | L | H | H | VH | MH | H | H | MHH | R26 | L | VH | VH | VVH | MHH | VH | VH | H |
| R27 | L | VVH | VVH | VVVH | H | VVH | VVH | VH | R28 | ML | VVL | VVVL | VVVL | VVL | VVL | ML | L |
| R29 | ML | VL | VVL | VL | VL | VL | ML | L | R30 | ML | L | VL | L | L | L | ML | MLL |
| R31 | ML | ML | ML | ML | MLL | ML | M | ML | R32 | ML | M | M | M | ML | M | M | M |
| R33 | ML | MH | MHH | MHH | M | MHH | MH | MH | R34 | ML | H | H | H | MH | H | MHH | MHH |
| R35 | ML | VH | VH | VHH | MHH | VVH | VH | H | R36 | ML | VVH | VVH | VVVH | H | VVVH | VVH | VH |
| R37 | M | VVL | VVVL | VVVL | VL | VL | M | VVL | R38 | M | VL | VL | VL | L | L | M | L |
| R39 | M | L | L | MLL | MLL | MLL | MH | ML | R40 | M | ML | ML | M | ML | ML | MH | M |
| R41 | M | M | M | MH | M | M | MH | MHH | R42 | M | MH | MHH | MH | MH | MH | MHH | MHH |
| R43 | M | H | VH | H | MHH | MHH | VH | H | R44 | M | VH | VVH | VVH | H | VH | VVH | VH |
| R45 | M | VVH | VVH | VVVH | VH | VVH | VVVH | VVH | R46 | MH | VVL | EL | EL | L | L | MH | VVVL |
| R47 | MH | VL | VVL | VVL | MLL | ML | MH | VL | R48 | MH | L | L | L | ML | M | MHH | MLL |
| R49 | MH | ML | ML | ML | M | MH | MHH | M | R50 | MH | M | M | M | MH | MHH | MHH | MH |
| R51 | MH | MH | MH | MH | MH | H | H | MHH | R52 | MH | H | VH | H | H | VH | VH | H |
| R53 | MH | VH | VVH | VVH | VH | VVH | VVH | H | R54 | MH | VVH | VVVH | VVVH | VH | VVVH | VVVH | VH |
| R55 | H | VVL | EL | EL | MLL | VVL | M | VVL | R56 | H | VL | VVVL | VL | ML | VL | M | L |
| R57 | H | L | L | L | M | L | MH | ML | R58 | H | ML | ML | ML | MHH | MLL | MH | M |
| R59 | H | M | M | M | MHH | ML | MH | MH | R60 | H | MH | MHH | MHH | H | ML | MHH | MHH |
| R61 | H | H | H | H | VH | M | H | H | R62 | H | VH | VVH | VVH | VVH | MH | VH | VH |
| R63 | H | VVH | VVVH | VVVH | VVH | MH | VVH | VVH | R64 | VH | VVL | VVVL | EL | MLL | VVVL | MH | VVVL |
| R65 | VH | VL | VL | VVL | M | VVL | MH | VL | R66 | VH | L | L | L | MH | VL | MH | L |
| R67 | VH | ML | ML | ML | MHH | L | MHH | ML | R68 | VH | M | M | ML | H | L | MHH | M |
| R69 | VH | MH | MHH | MH | VH | MLL | H | MH | R70 | VH | H | H | H | VVH | ML | VH | MHH |
| R71 | VH | VH | VH | VVH | VVH | M | VVH | H | R72 | VH | VVH | VVVH | EH | VVVH | M | VVVH | VH |
| R73 | VVH | VVL | EL | EL | ML | EL | MHH | EL | R74 | VVH | VL | VVL | VVL | M | VVVL | MHH | VVL |
| R75 | VVH | L | L | L | MHH | VVL | H | L | R76 | VVH | ML | MLL | ML | H | VL | H | MLL |
| R77 | VVH | M | ML | ML | VH | VL | H | ML | R78 | VVH | MH | MH | MH | VH | L | VH | M |
| R79 | VVH | H | H | H | VVH | MLL | VVH | MH | R80 | VVH | VH | VH | VVH | VVVH | M | VVVH | MHH |
| R81 | VVH | VVH | VVH | EH | EH | MH | EH | H | |||||||||
Table 6.
Comparative analysis of simulation and experimental results in CT.
| Cutting Conditions | Simulation Results | Experimental Results | |||||||||||
|---|---|---|---|---|---|---|---|---|---|---|---|---|---|
| Speed (m/min) | DOC (µm) | Ft (N) | Fr (N) | Tmax (°C) | Ra (µm) | CCR | SA (°) | Ft (N) | Fr (N) | Tmax (°C) | Ra (µm) | CCR | SA (°) |
| 10 | 100 | 38.00 | 23.78 | 198.00 | 0.419 | 0.5838 | 58.2 | 38 ± 5 | 23 ± 4 | 195 | 0.413 ± 0.036 | 0.58 ± 0.15 | 58.59 ± 10 |
| 10 | 200 | 68.00 | 39.32 | 220.14 | 0.583 | 0.6464 | 73.7 | 72 ± 7 | 43 ± 3 | 227 | 0.621 ± 0.038 | 0.65 ± 0.20 | 77.56 ± 08 |
| 10 | 300 | 101.55 | 60.25 | 257.74 | 0.851 | 0.7394 | 83.3 | 101 ± 6 | 61 ± 5 | 262 | 0.861 ± 0.050 | 0.735 ± 0.08 | 84.88 ± 07 |
| 20 | 100 | 38.00 | 25.72 | 232.66 | 0.419 | 0.6730 | 53.1 | 35 ± 4 | 24 ± 3 | 231 | 0.401 ± 0.050 | - | - |
| 20 | 200 | 63.00 | 42.00 | 270.34 | 0.542 | 0.6860 | 66.0 | 68 ± 5 | 45 ± 2 | 276 | 0.601 ± 0.040 | 0.68 ± 0.20 | 71.67 ± 09 |
| 20 | 300 | 93.00 | 58.38 | 333.00 | 0.787 | 0.7530 | 78.8 | 94 ± 6 | 58 ± 3 | 325 | 0.783 ± 0.050 | 0.75 ± 0.10 | 78.89 ± 06 |
| 30 | 100 | 34.44 | 23.78 | 270.34 | 0.308 | 0.6996 | 48.7 | 34 ± 3 | 23 ± 3 | 269 | 0.297 ± 0.060 | - | - |
| 30 | 200 | 63.00 | 39.32 | 333.00 | 0.419 | 0.7128 | 63.4 | 64 ± 3 | 40 ± 4 | 326 | 0.419 ± 0.047 | 0.71 ± 0.17 | 63.46 ± 12 |
| 30 | 300 | 93.00 | 60.25 | 366.60 | 0.624 | 0.7622 | 73.7 | 93 ± 5 | 59 ± 5 | 370 | 0.611 ± 0.046 | 0.77 ± 0.10 | 73.67 ± 05 |
Table 7.
Comparative analysis of experimental and simulation results in UVAT.
| Cutting Conditions | Simulation Results | Experimental Results | |||||||||||
|---|---|---|---|---|---|---|---|---|---|---|---|---|---|
| Speed (m/min) | DOC (µm) | Ft (N) | Fr (N) | Tmax (°C) | Ra (µm) | CCR | SA (°) | Ft (N) | Fr (N) | Tmax (°C) | Ra (µm) | CCR | SA (°) |
| 10 | 100 | 12.8 | 5.76 | 227.0 | 0.253 | 0.712 | 76.57 | 12 ± 3.7 | 05 ± 3.0 | 224 | 0.263 ± 0.02 | 0.65 ± 0.16 | 76.98 ± 8 |
| 10 | 200 | 24.0 | 15.60 | 263.5 | 0.385 | 0.724 | 84.42 | 23 ± 2.6 | 14 ± 4.0 | 261 | 0.381 ± 0.01 | 0.72 ± 0.15 | 85.46 ± 3 |
| 10 | 300 | 36.0 | 26.20 | 303.2 | 0.424 | 0.749 | 85.54 | 38 ± 2.4 | 26 ± 3.2 | 302 | 0.424 ± 0.02 | 0.74 ± 0.10 | 86.20 ± 4 |
| 20 | 100 | 21.0 | 10.30 | 263.6 | 0.188 | 0.712 | 71.85 | 20 ± 1.7 | 10 ± 3.0 | 261 | 0.195 ± 0.02 | - | - |
| 20 | 200 | 33.0 | 20.89 | 303.0 | 0.319 | 0.753 | 78.10 | 33 ± 2.2 | 21 ± 2.0 | 303 | 0.313 ± 0.01 | 0.68 ± 0.15 | 78.30 ± 6 |
| 20 | 300 | 45.0 | 31.40 | 355.9 | 0.385 | 0.796 | 81.28 | 46 ± 3.2 | 35 ± 4.0 | 355 | 0.392 ± 0.02 | 0.79 ± 0.14 | 81.20 ± 6 |
| 30 | 100 | 27.0 | 18.24 | 303.2 | 0.127 | 0.725 | 64.50 | 28 ± 4.2 | 18 ± 3.2 | 298 | 0.121 ± 0.02 | - | - |
| 30 | 200 | 42.0 | 31.50 | 342.8 | 0.209 | 0.774 | 76.60 | 41 ± 2.3 | 32 ± 2.0 | 340 | 0.219 ± 0.02 | 0.77 ± 0.12 | 76.70 ± 4 |
| 30 | 300 | 53.1 | 41.27 | 404.4 | 0.319 | 0.818 | 79.70 | 54 ± 3.1 | 42 ± 3.8 | 408 | 0.327 ± 0.02 | 0.82 ± 0.18 | 78.50 ± 6 |
Publisher’s Note: MDPI stays neutral with regard to jurisdictional claims in published maps and institutional affiliations. |
© 2021 by the author. Licensee MDPI, Basel, Switzerland. This article is an open access article distributed under the terms and conditions of the Creative Commons Attribution (CC BY) license (https://creativecommons.org/licenses/by/4.0/).
Share and Cite
MDPI and ACS Style
Muhammad, R. A Fuzzy Logic Model for the Analysis of Ultrasonic Vibration Assisted Turning and Conventional Turning of Ti-Based Alloy. Materials 2021, 14, 6572. https://doi.org/10.3390/ma14216572
AMA Style
Muhammad R. A Fuzzy Logic Model for the Analysis of Ultrasonic Vibration Assisted Turning and Conventional Turning of Ti-Based Alloy. Materials. 2021; 14(21):6572. https://doi.org/10.3390/ma14216572
Chicago/Turabian StyleMuhammad, Riaz. 2021. "A Fuzzy Logic Model for the Analysis of Ultrasonic Vibration Assisted Turning and Conventional Turning of Ti-Based Alloy" Materials 14, no. 21: 6572. https://doi.org/10.3390/ma14216572
Note that from the first issue of 2016, this journal uses article numbers instead of page numbers. See further details here.