
Statistically Optimized Production of Saccharides Stabilized Silver Nanoparticles Using Liquid–Plasma Reduction Approach for Antibacterial Treatment of Water

 , , , , , , , and
Abstract
:1. Introduction
2. Experimental Section
2.1. Materials
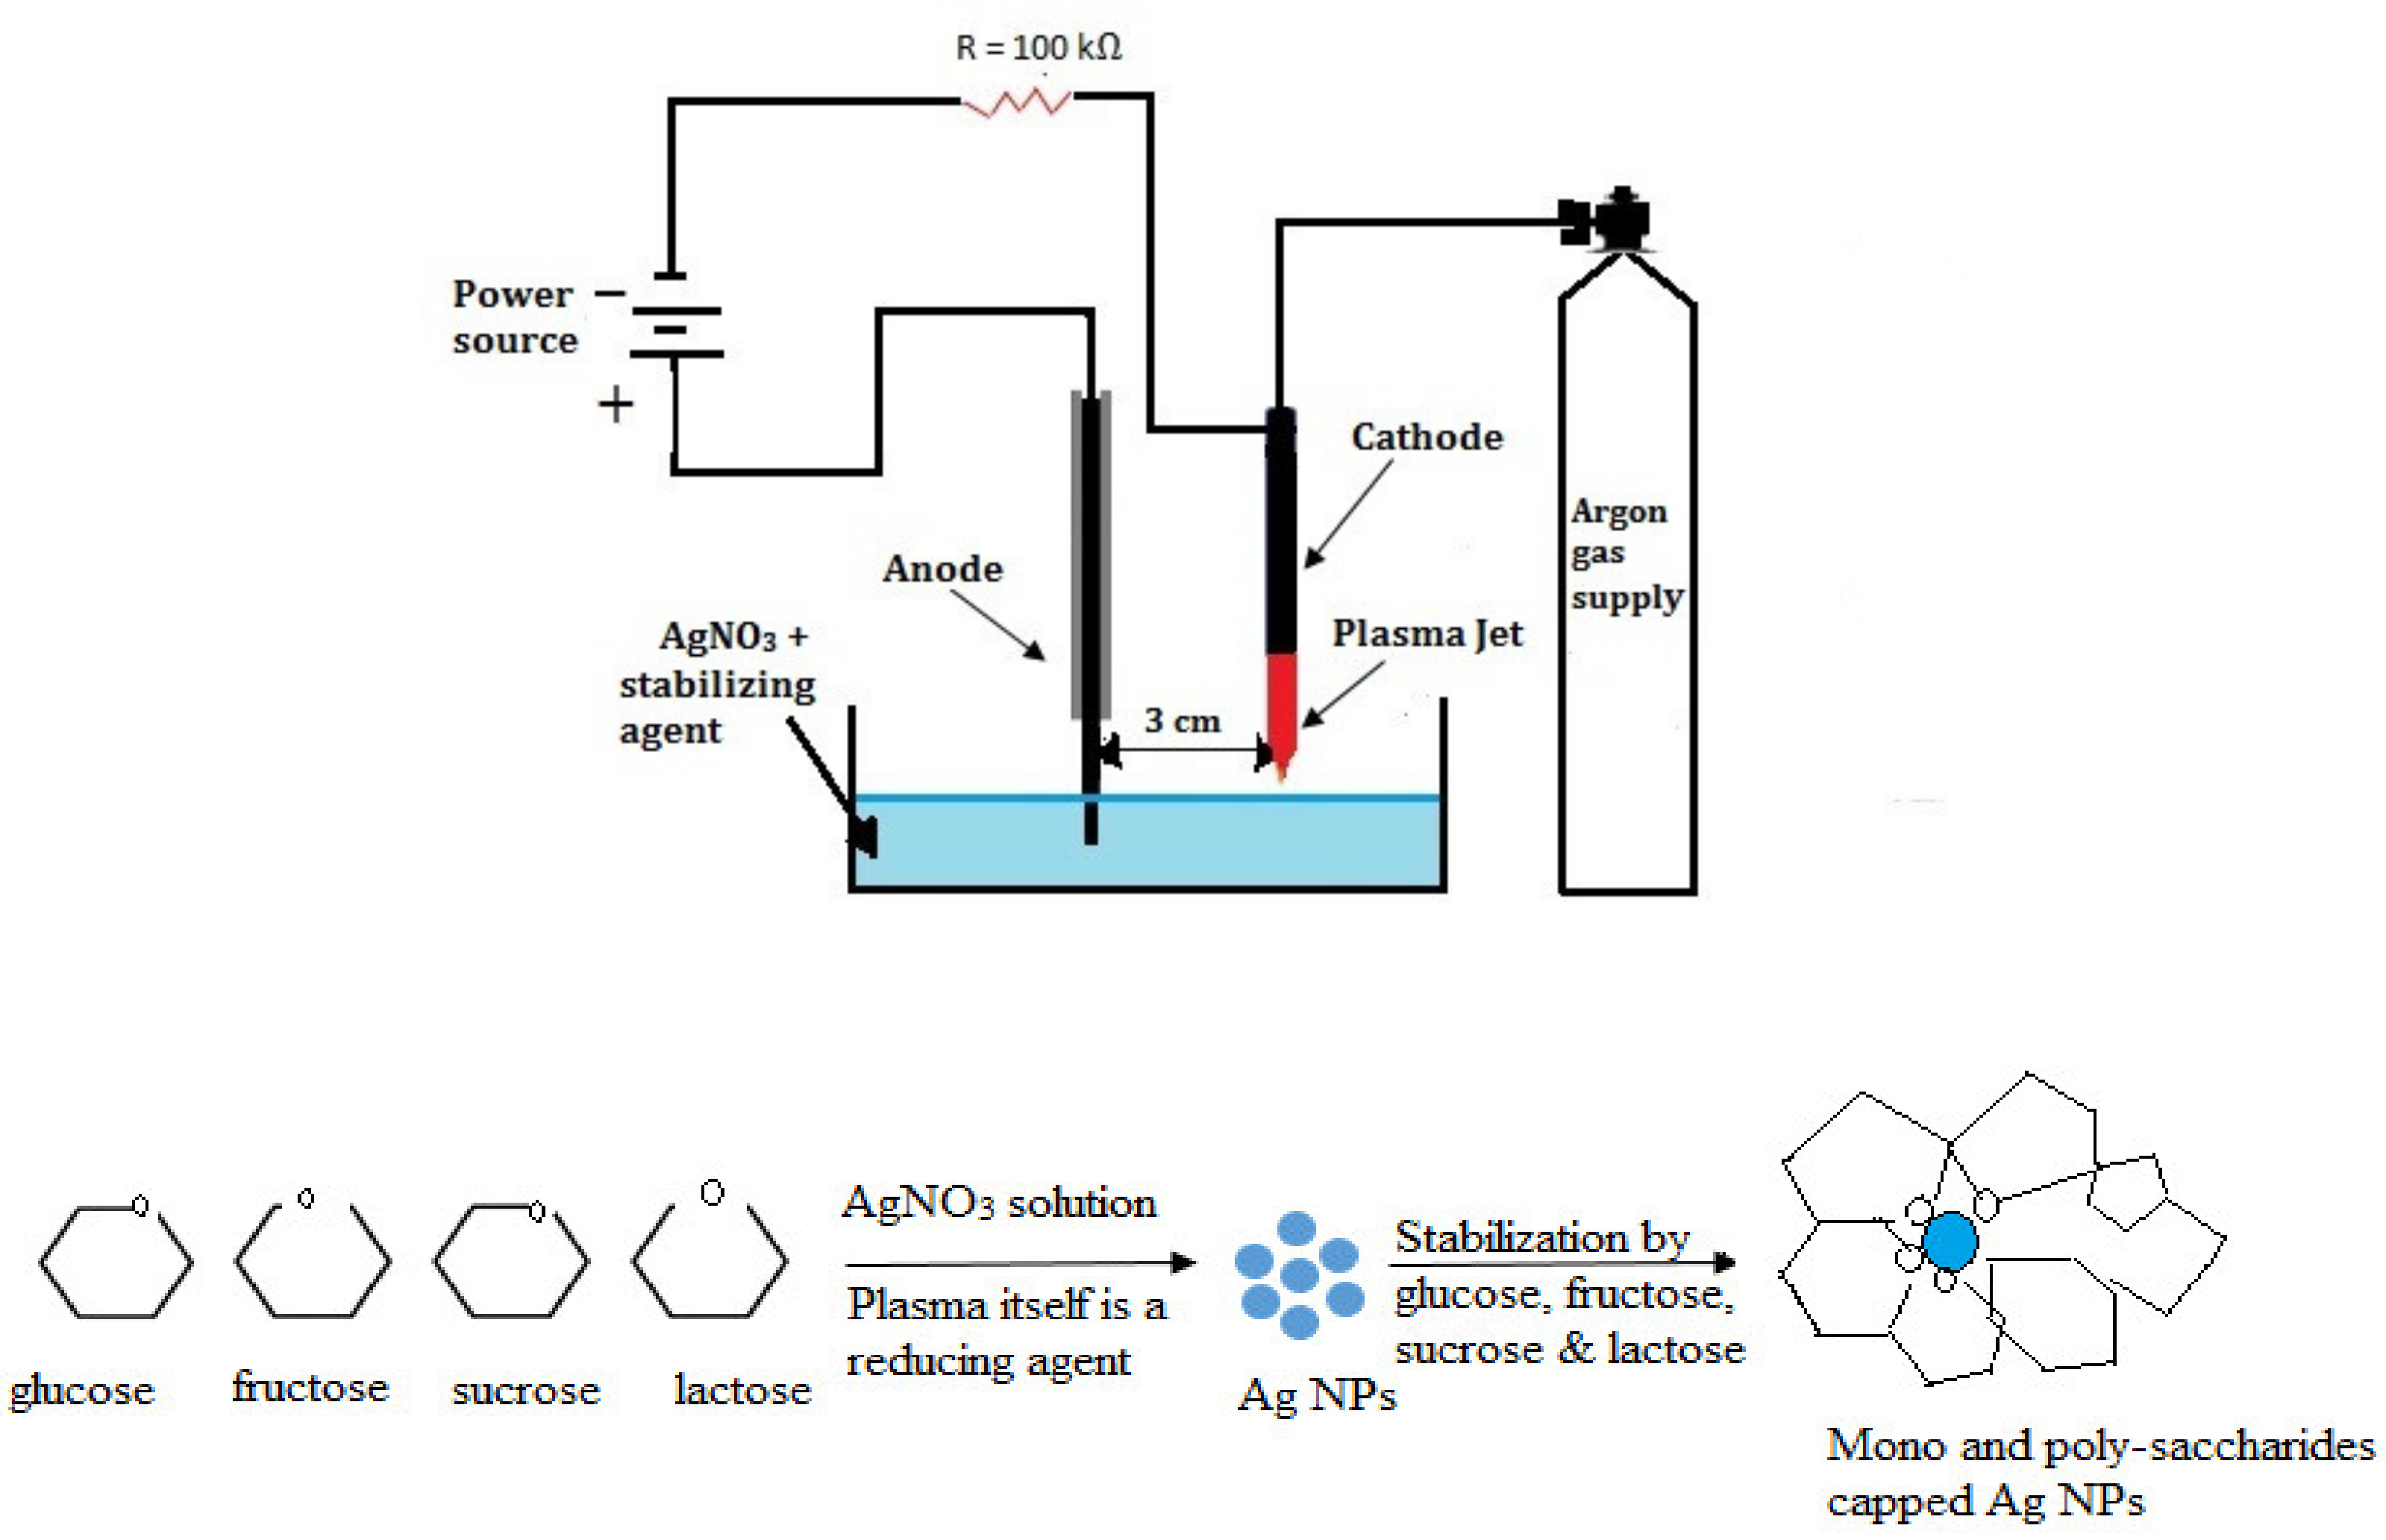
2.2. Synthesis of Silver Nanoparticles
2.3. Experimental Scheme in Simplex Centroid Design
2.4. Statistical Analysis
2.5. Antibacterial Activity
3. Results and Discussions
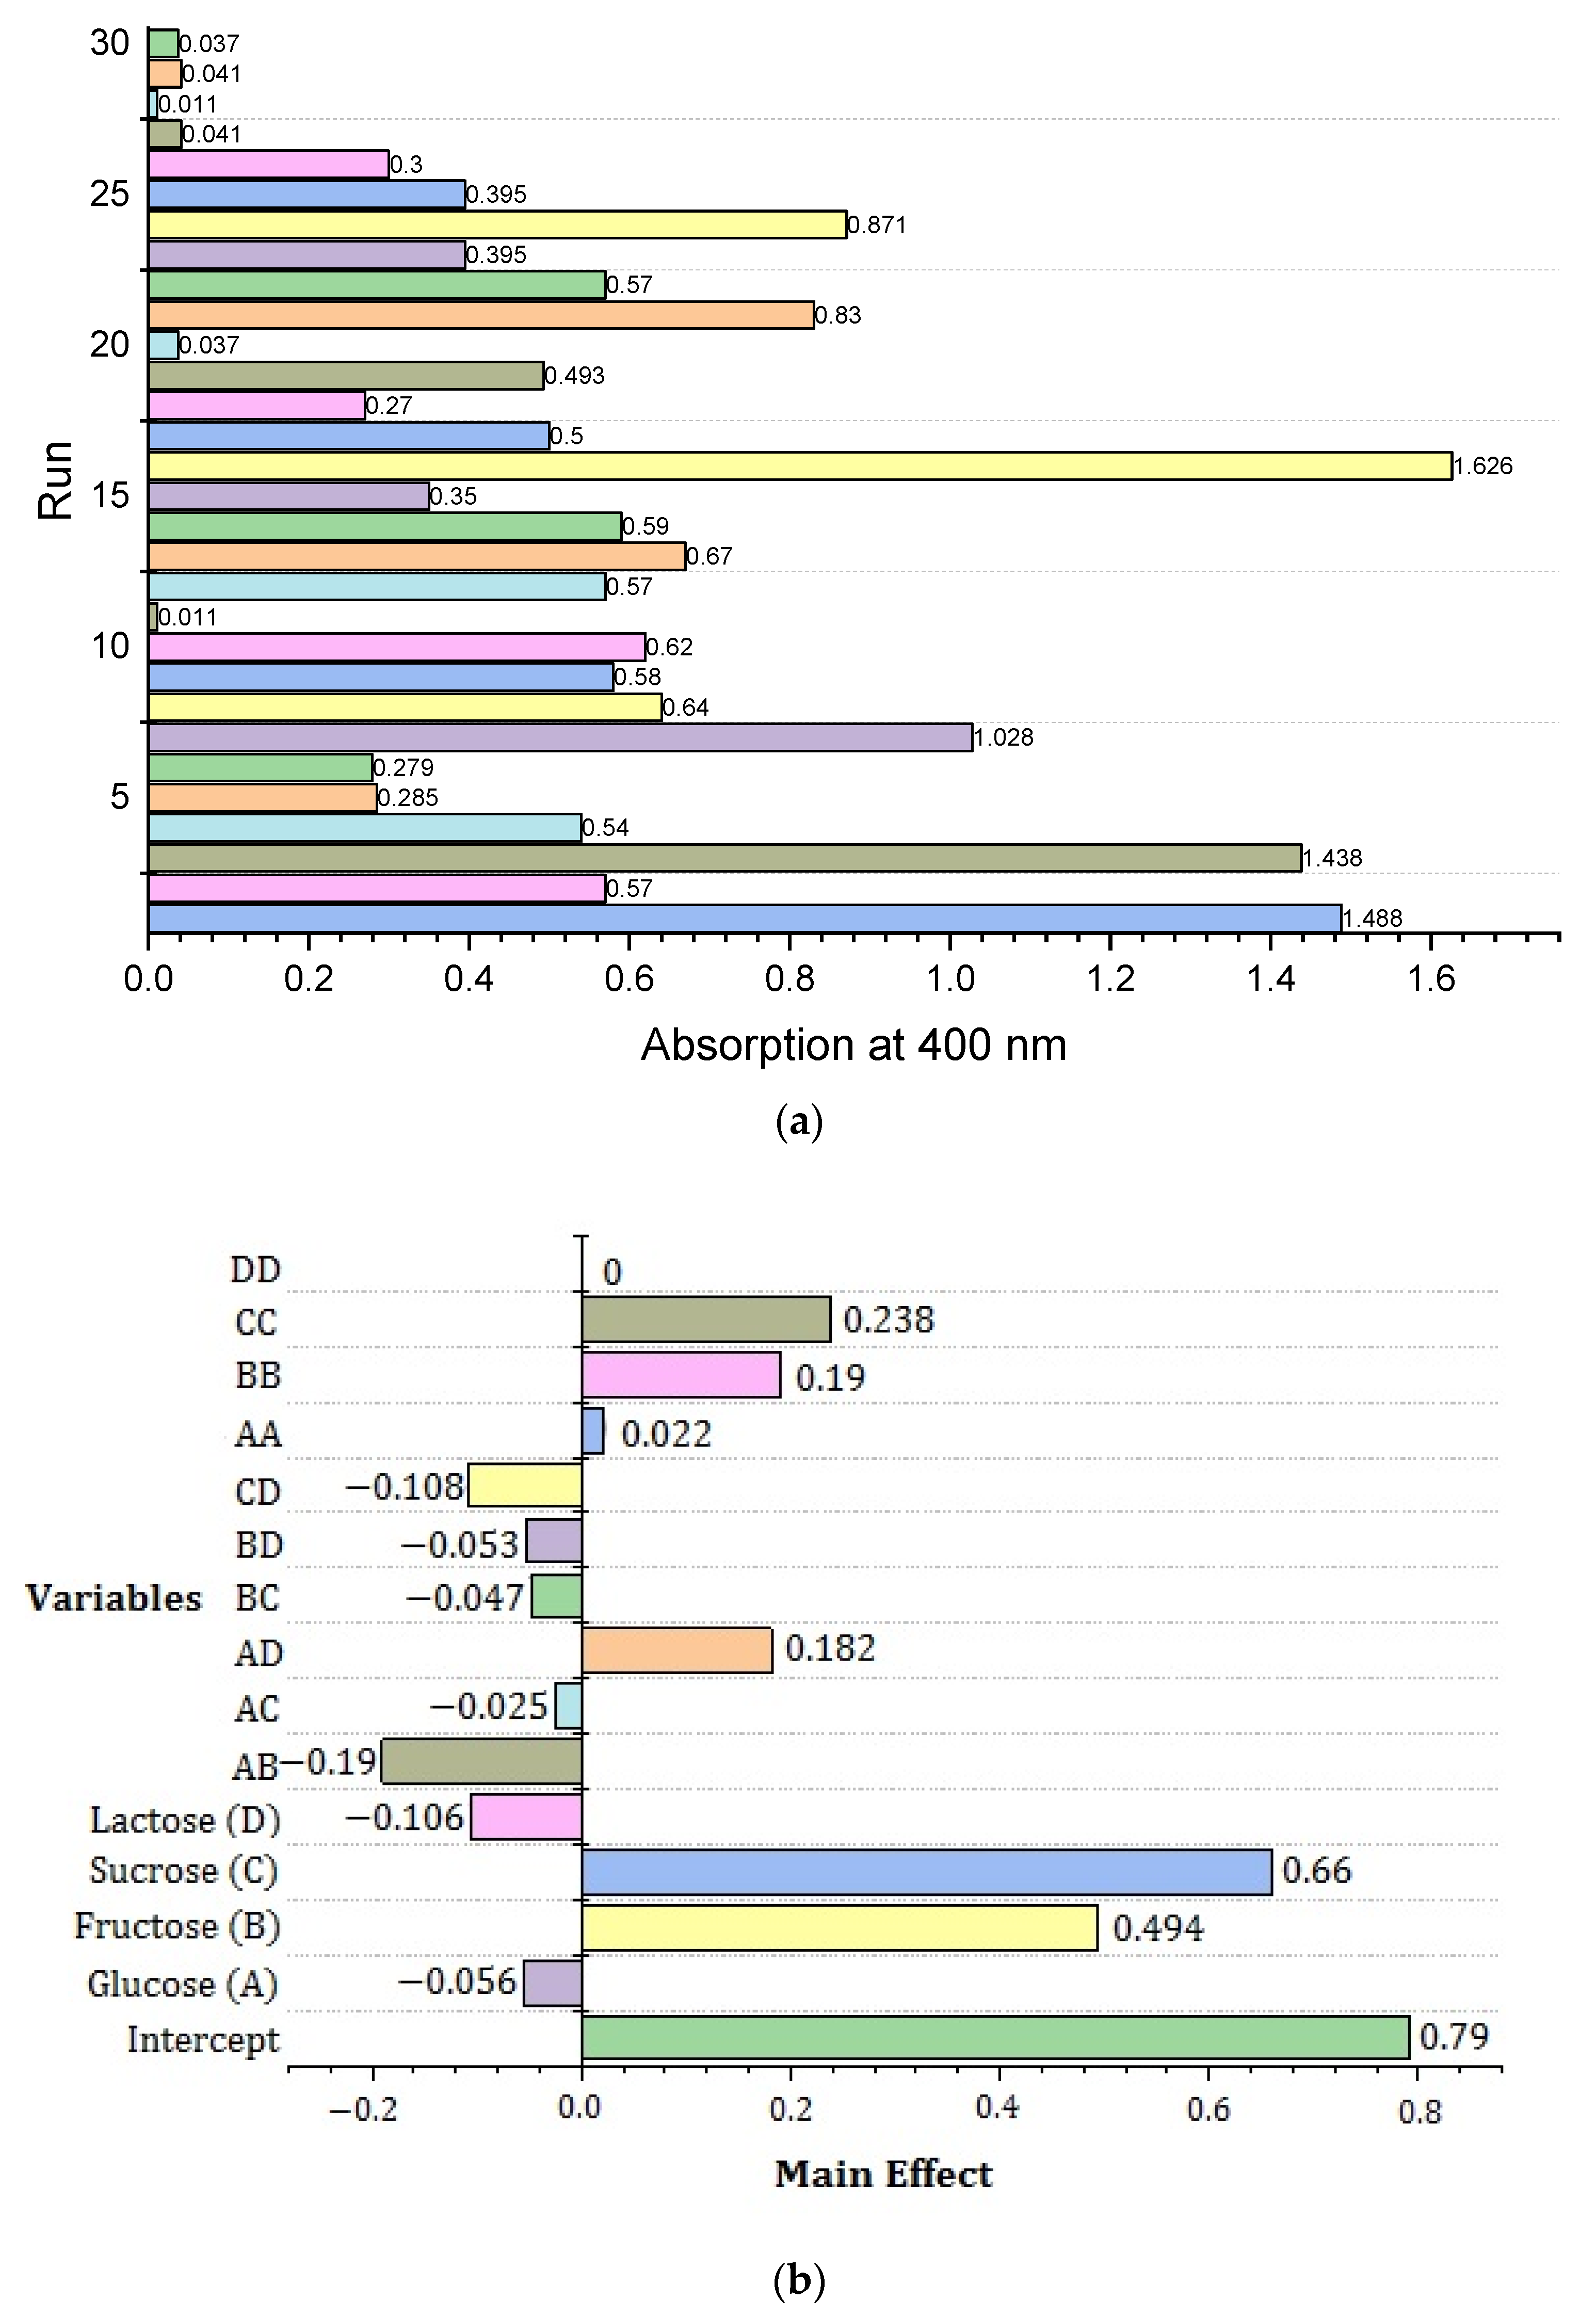
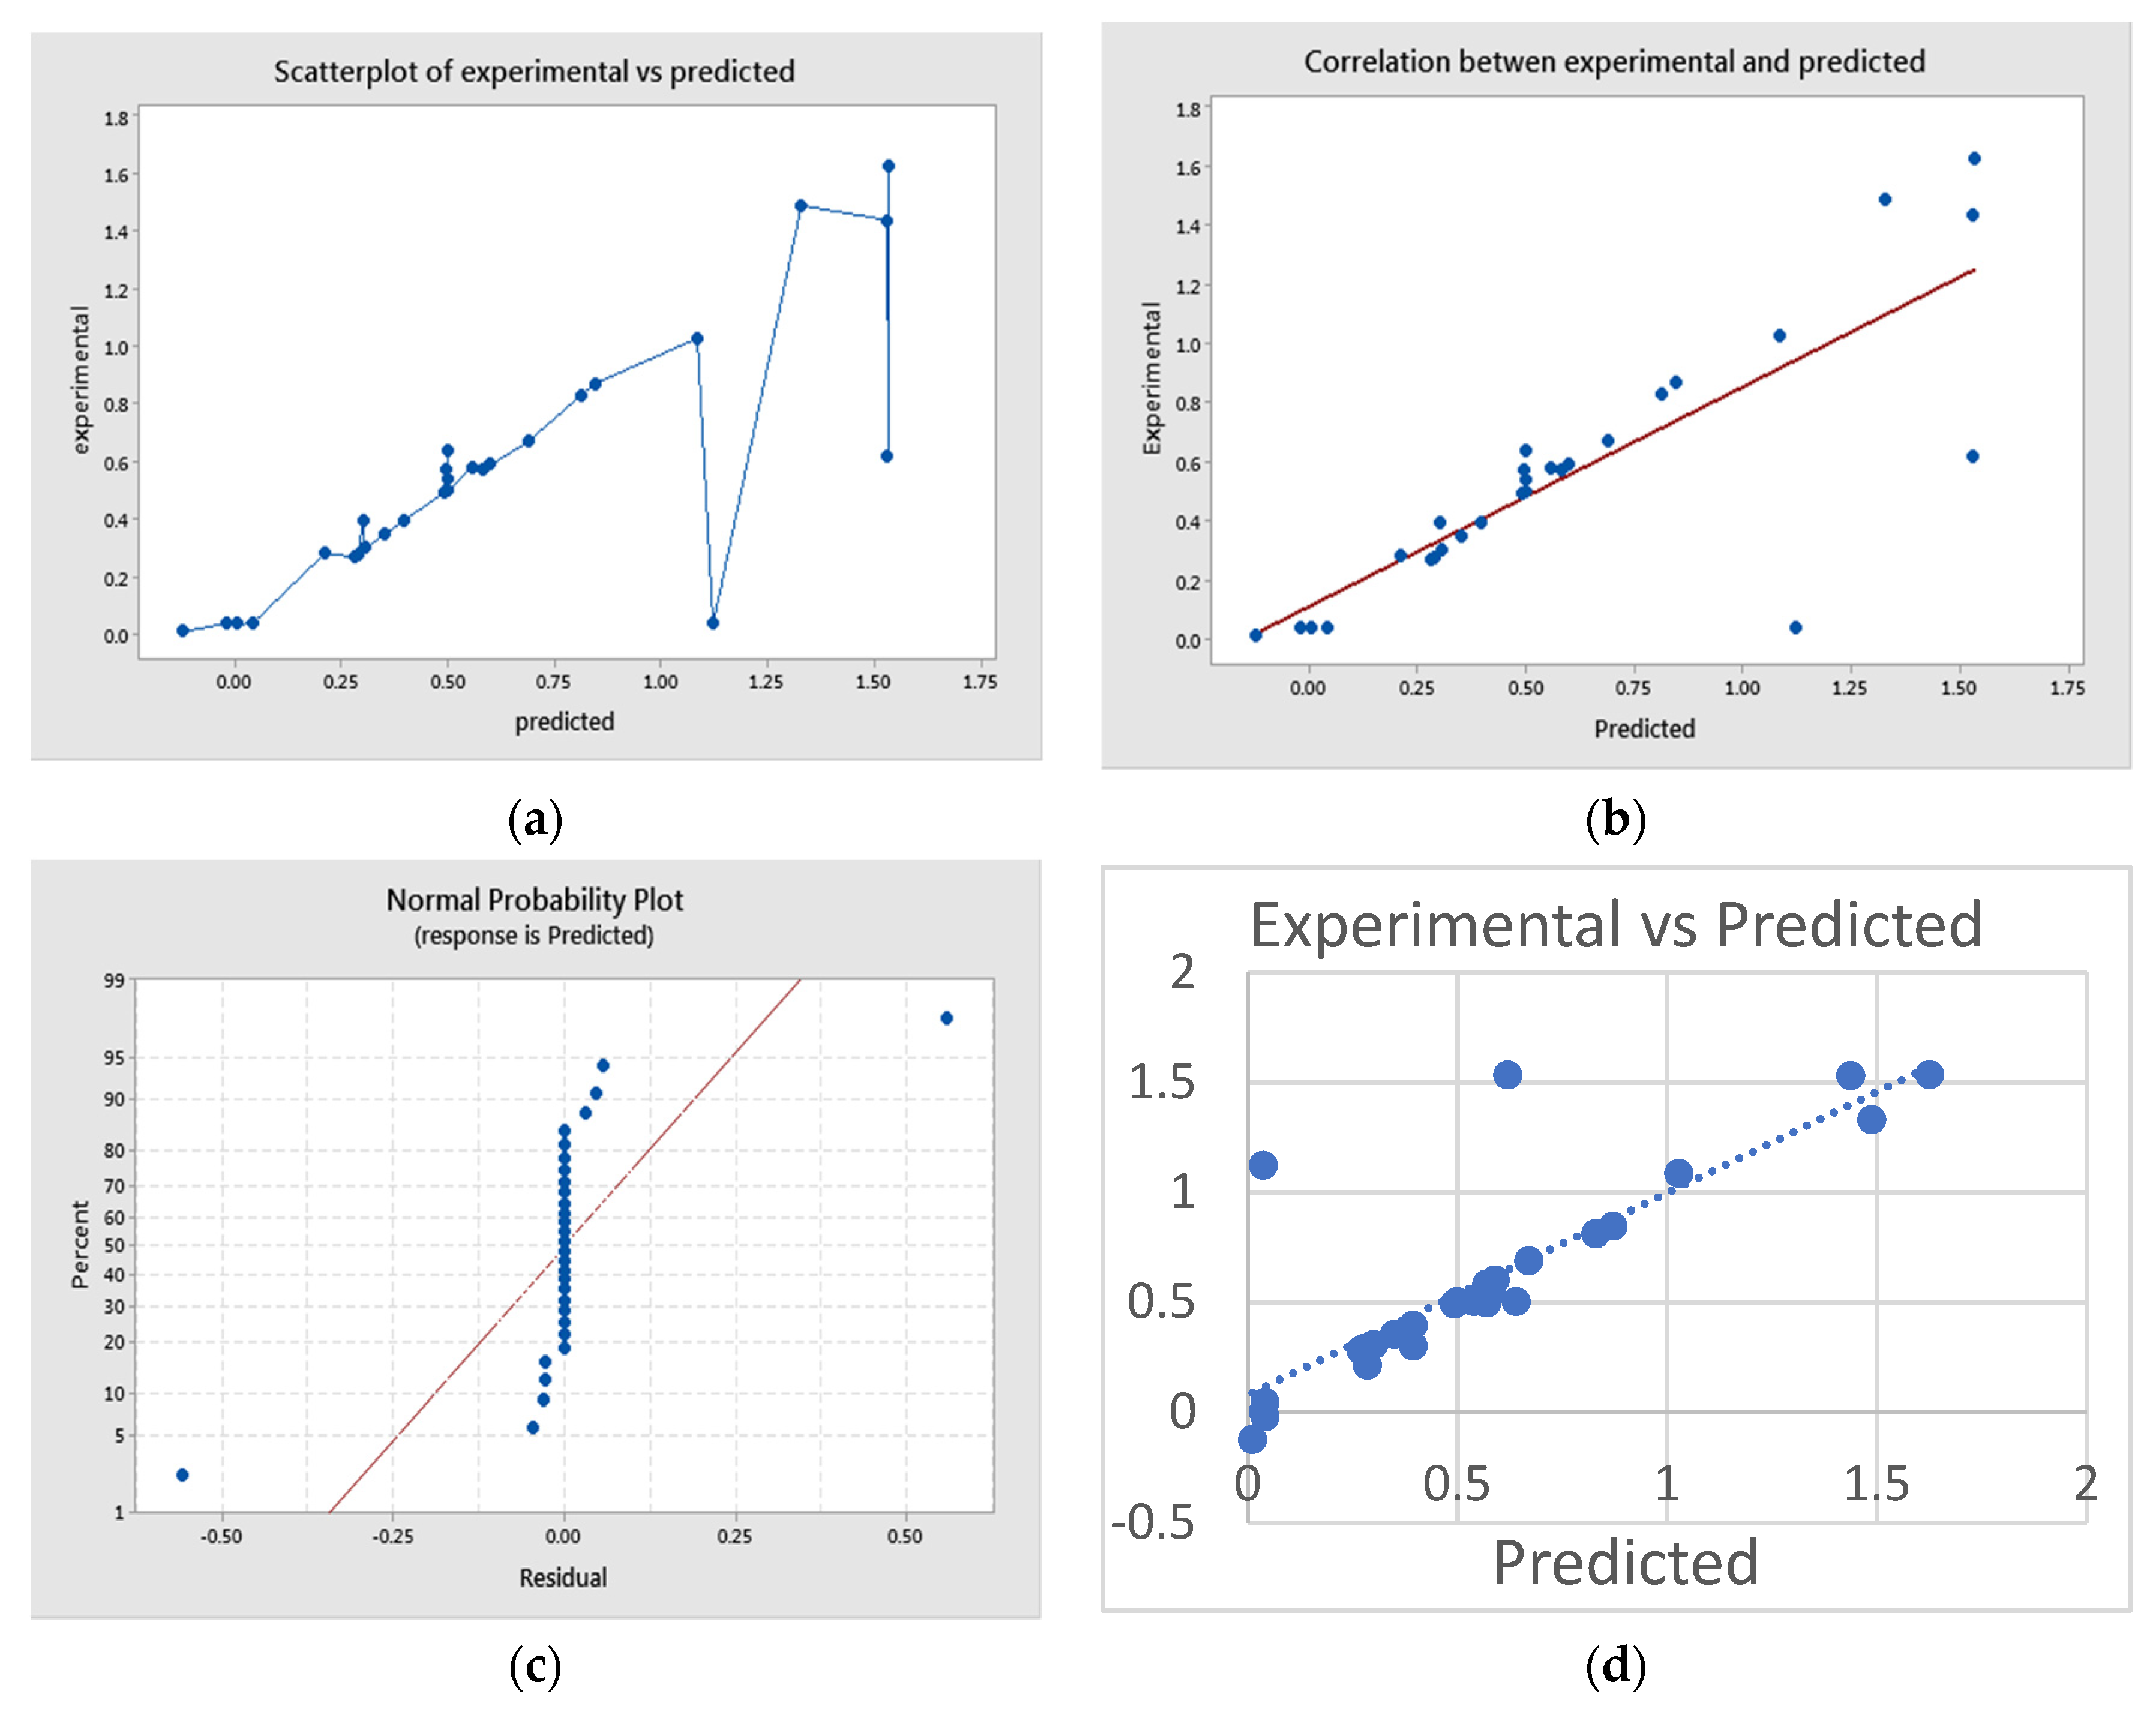
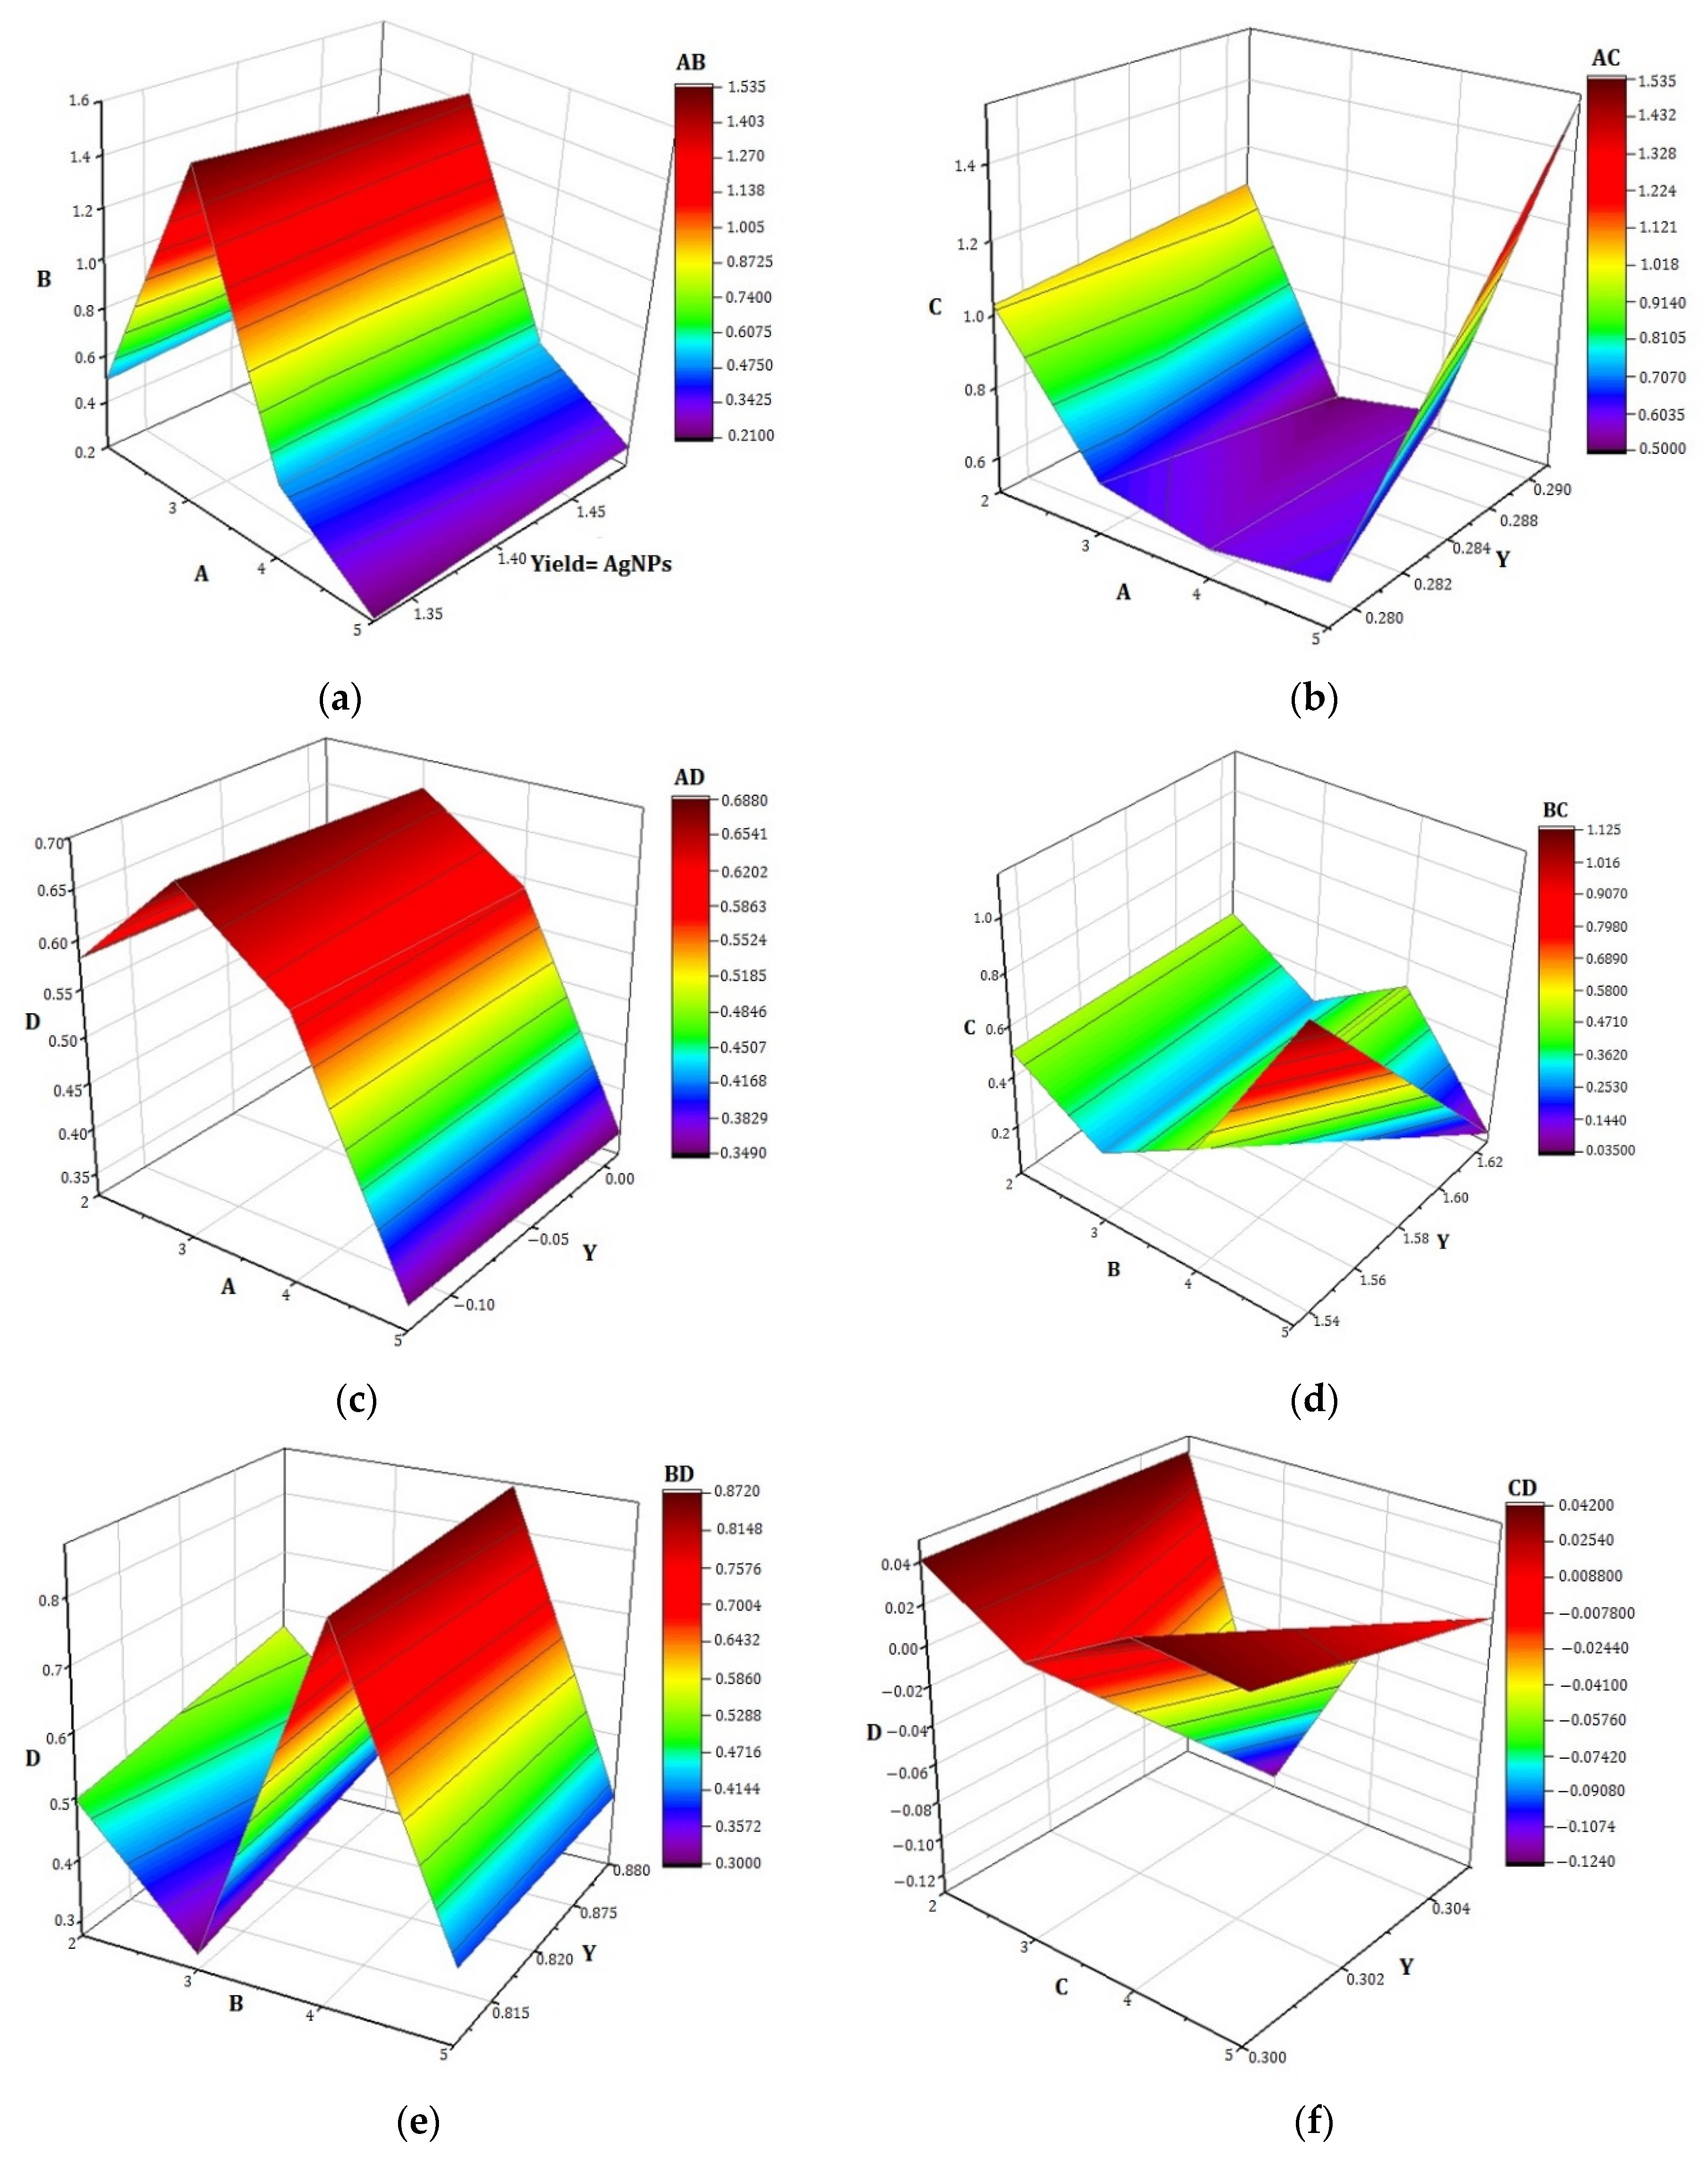
3.1. Optimization of Synthesis Process Using Response Surface Methodology
0.013AC + 0.091AD − 0.024BC − 0.026BD − 0.054CD + 0.011A2 + 0.095B2 +
0.119C2 + 0.000D2
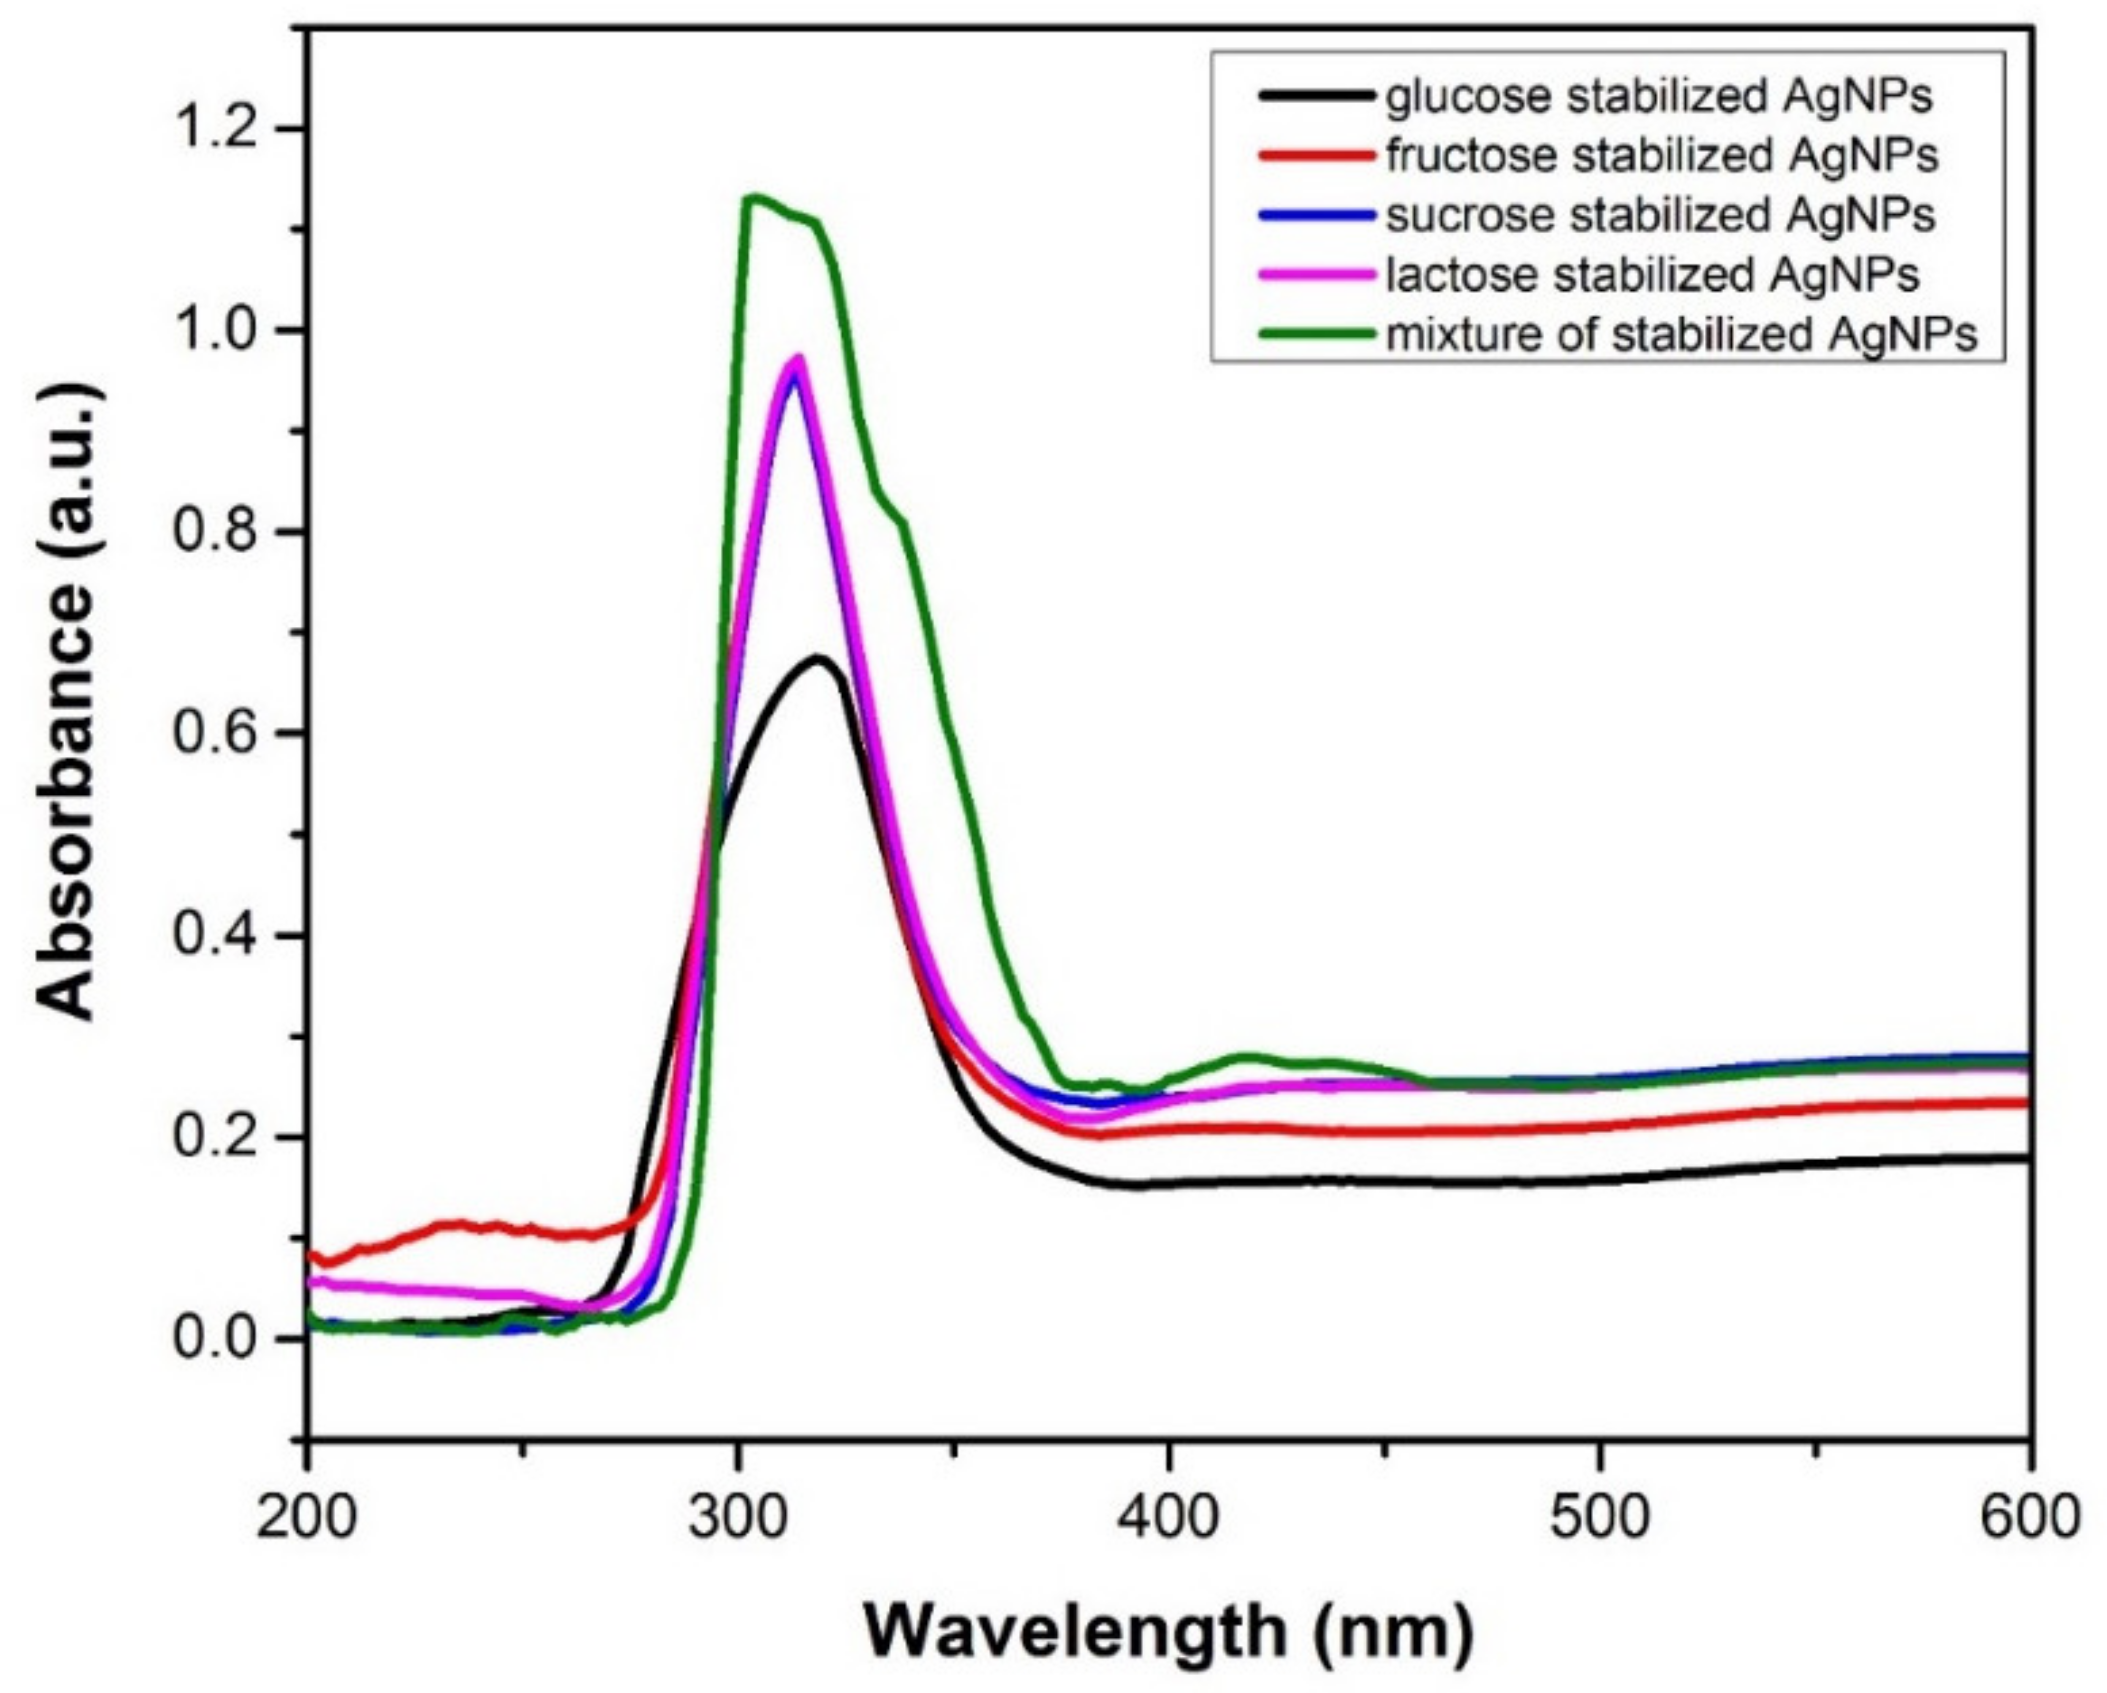
3.2. UV–Visible Spectroscopy Analysis
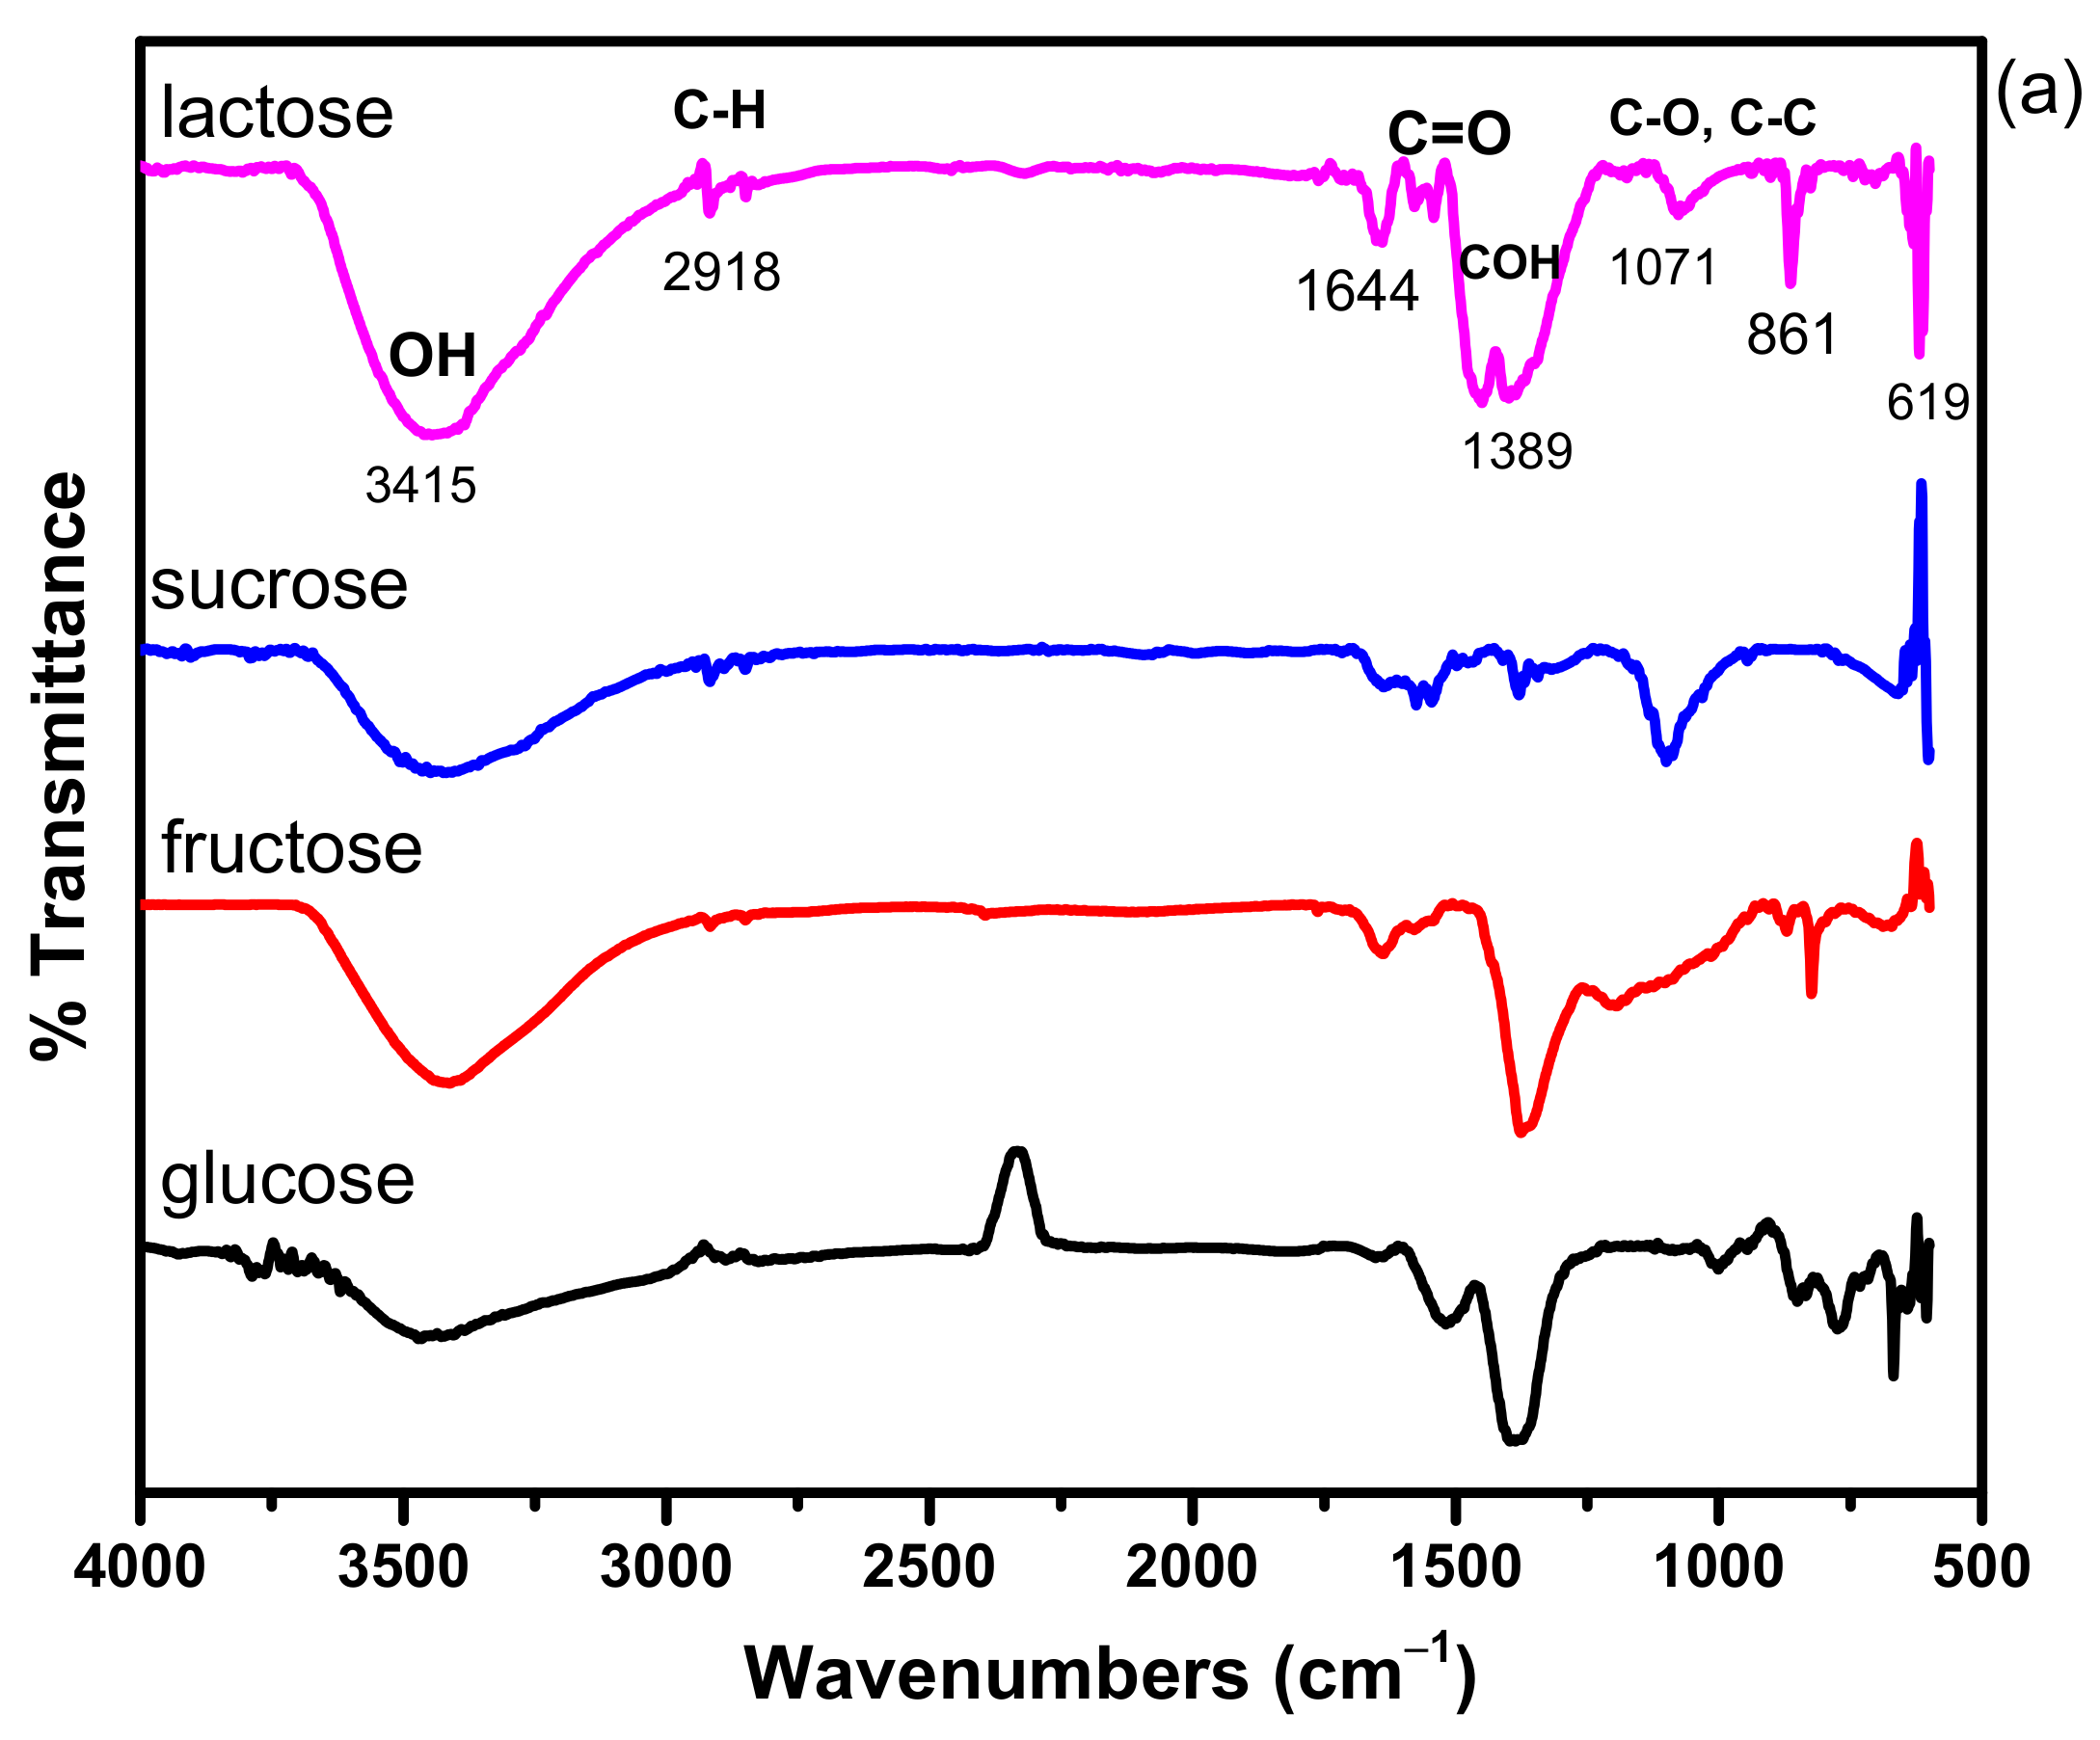
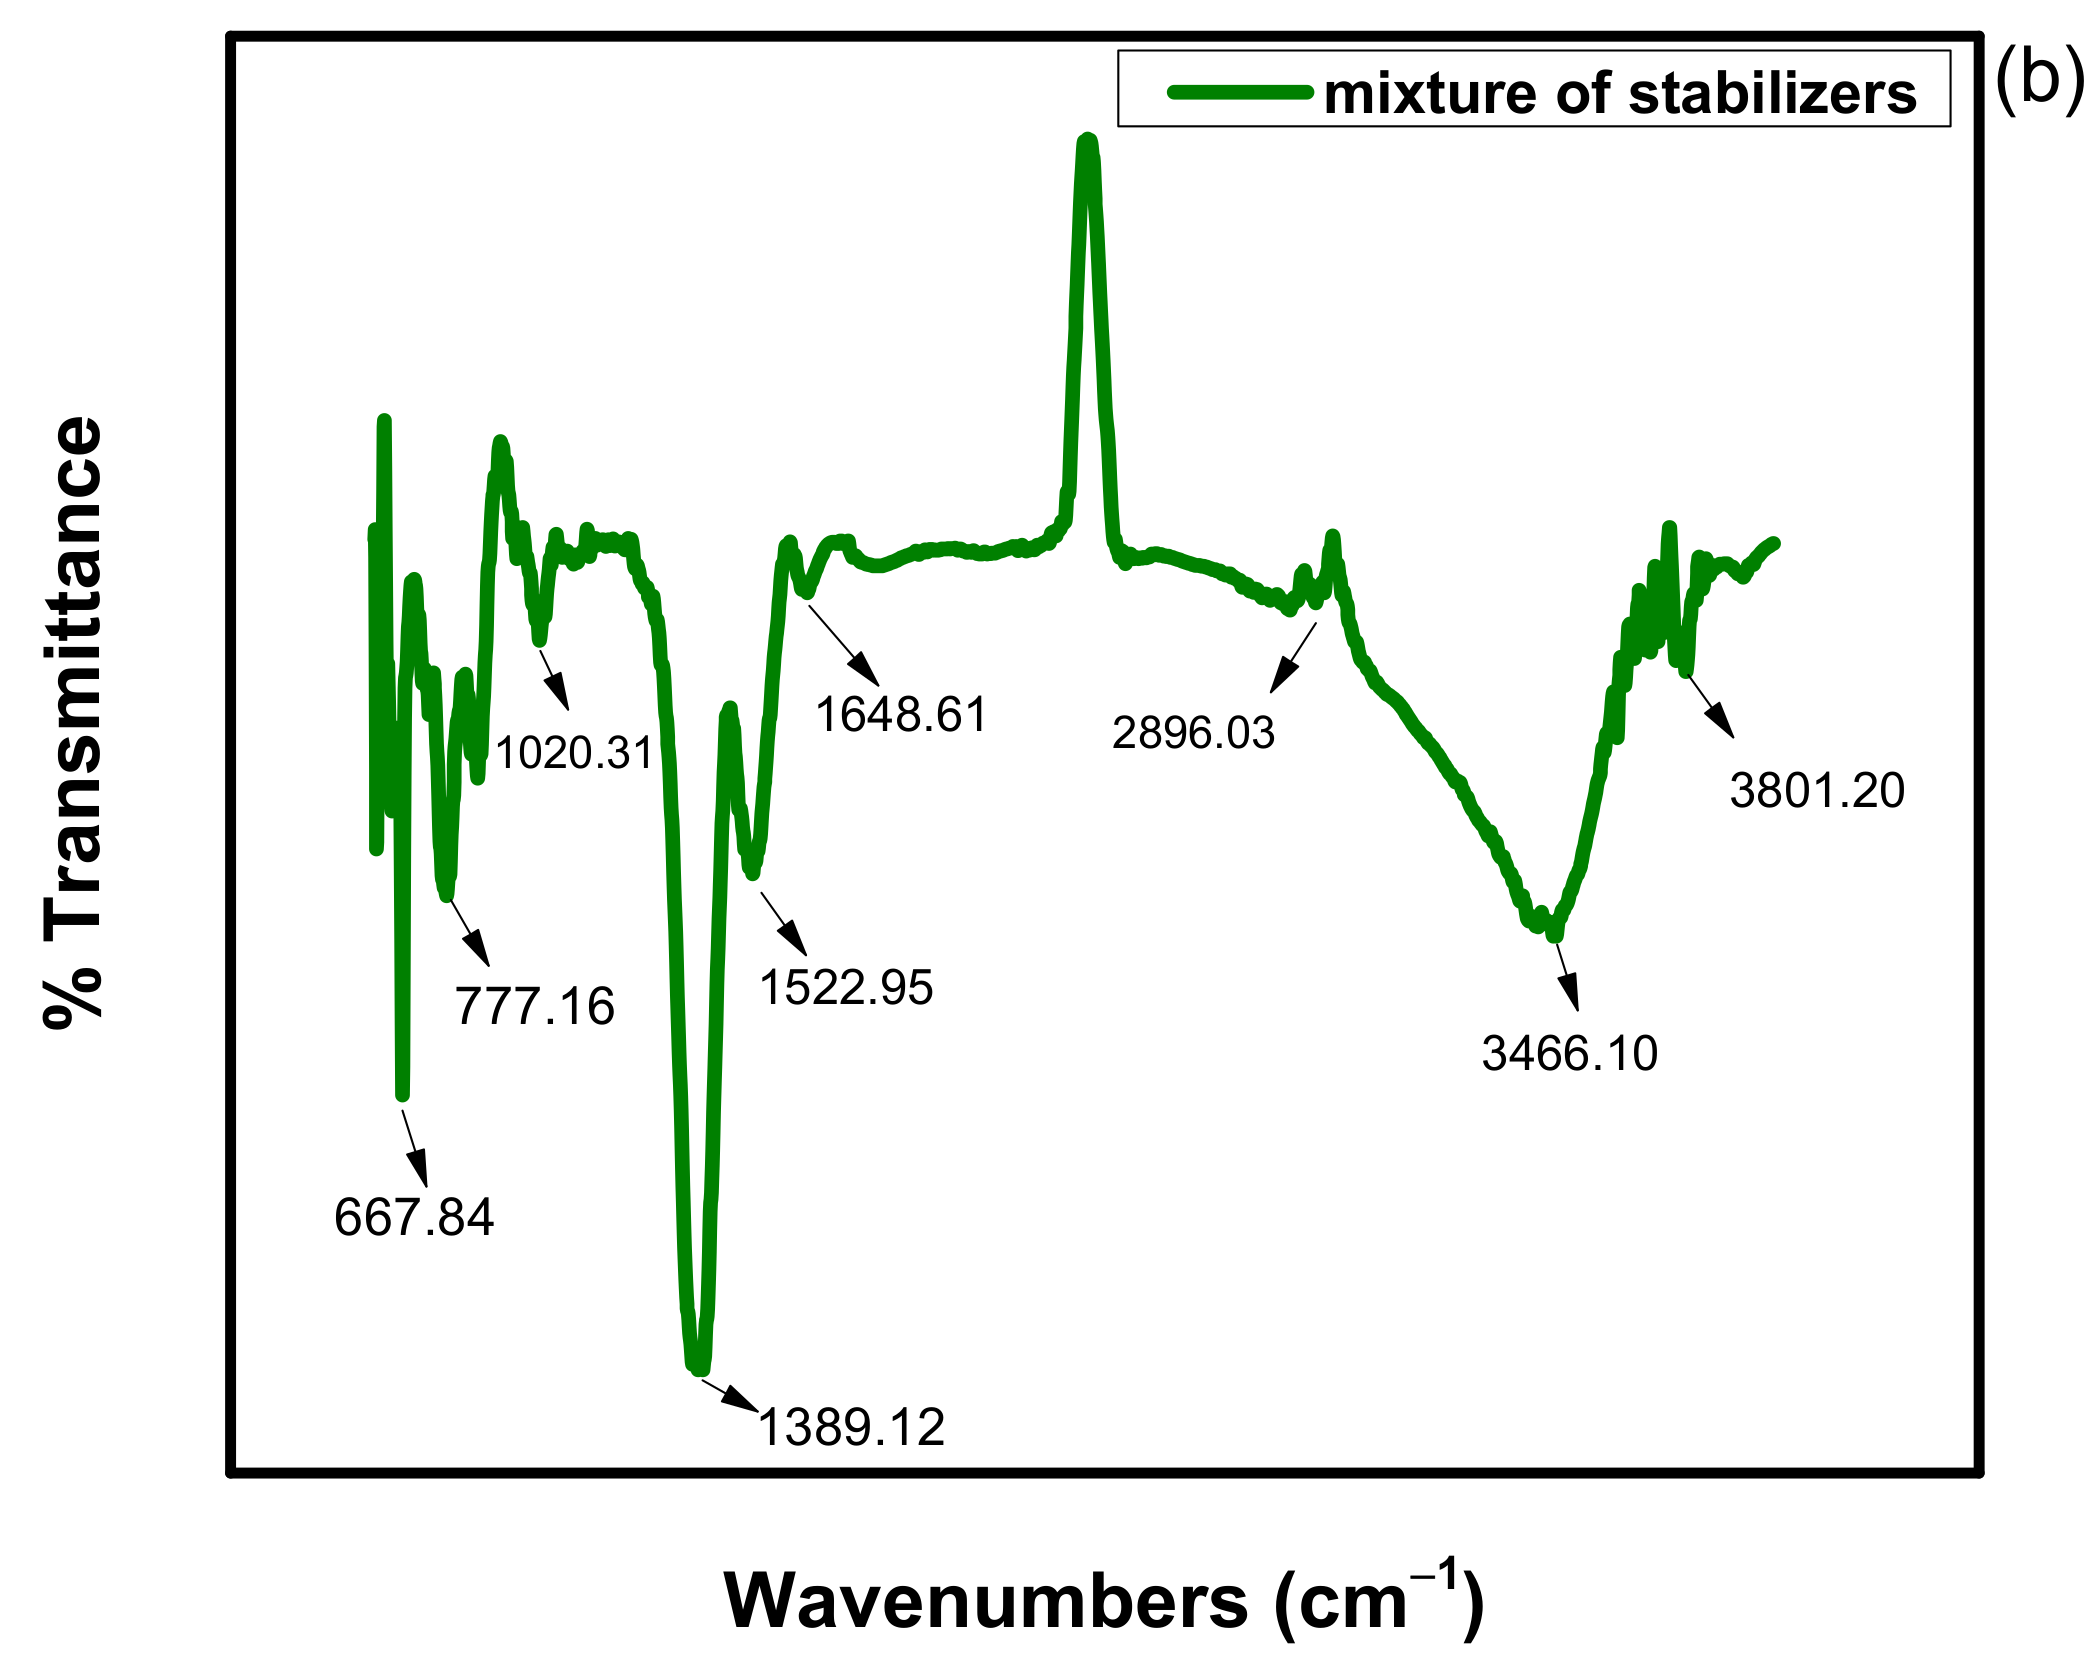
3.3. FT-IR Study
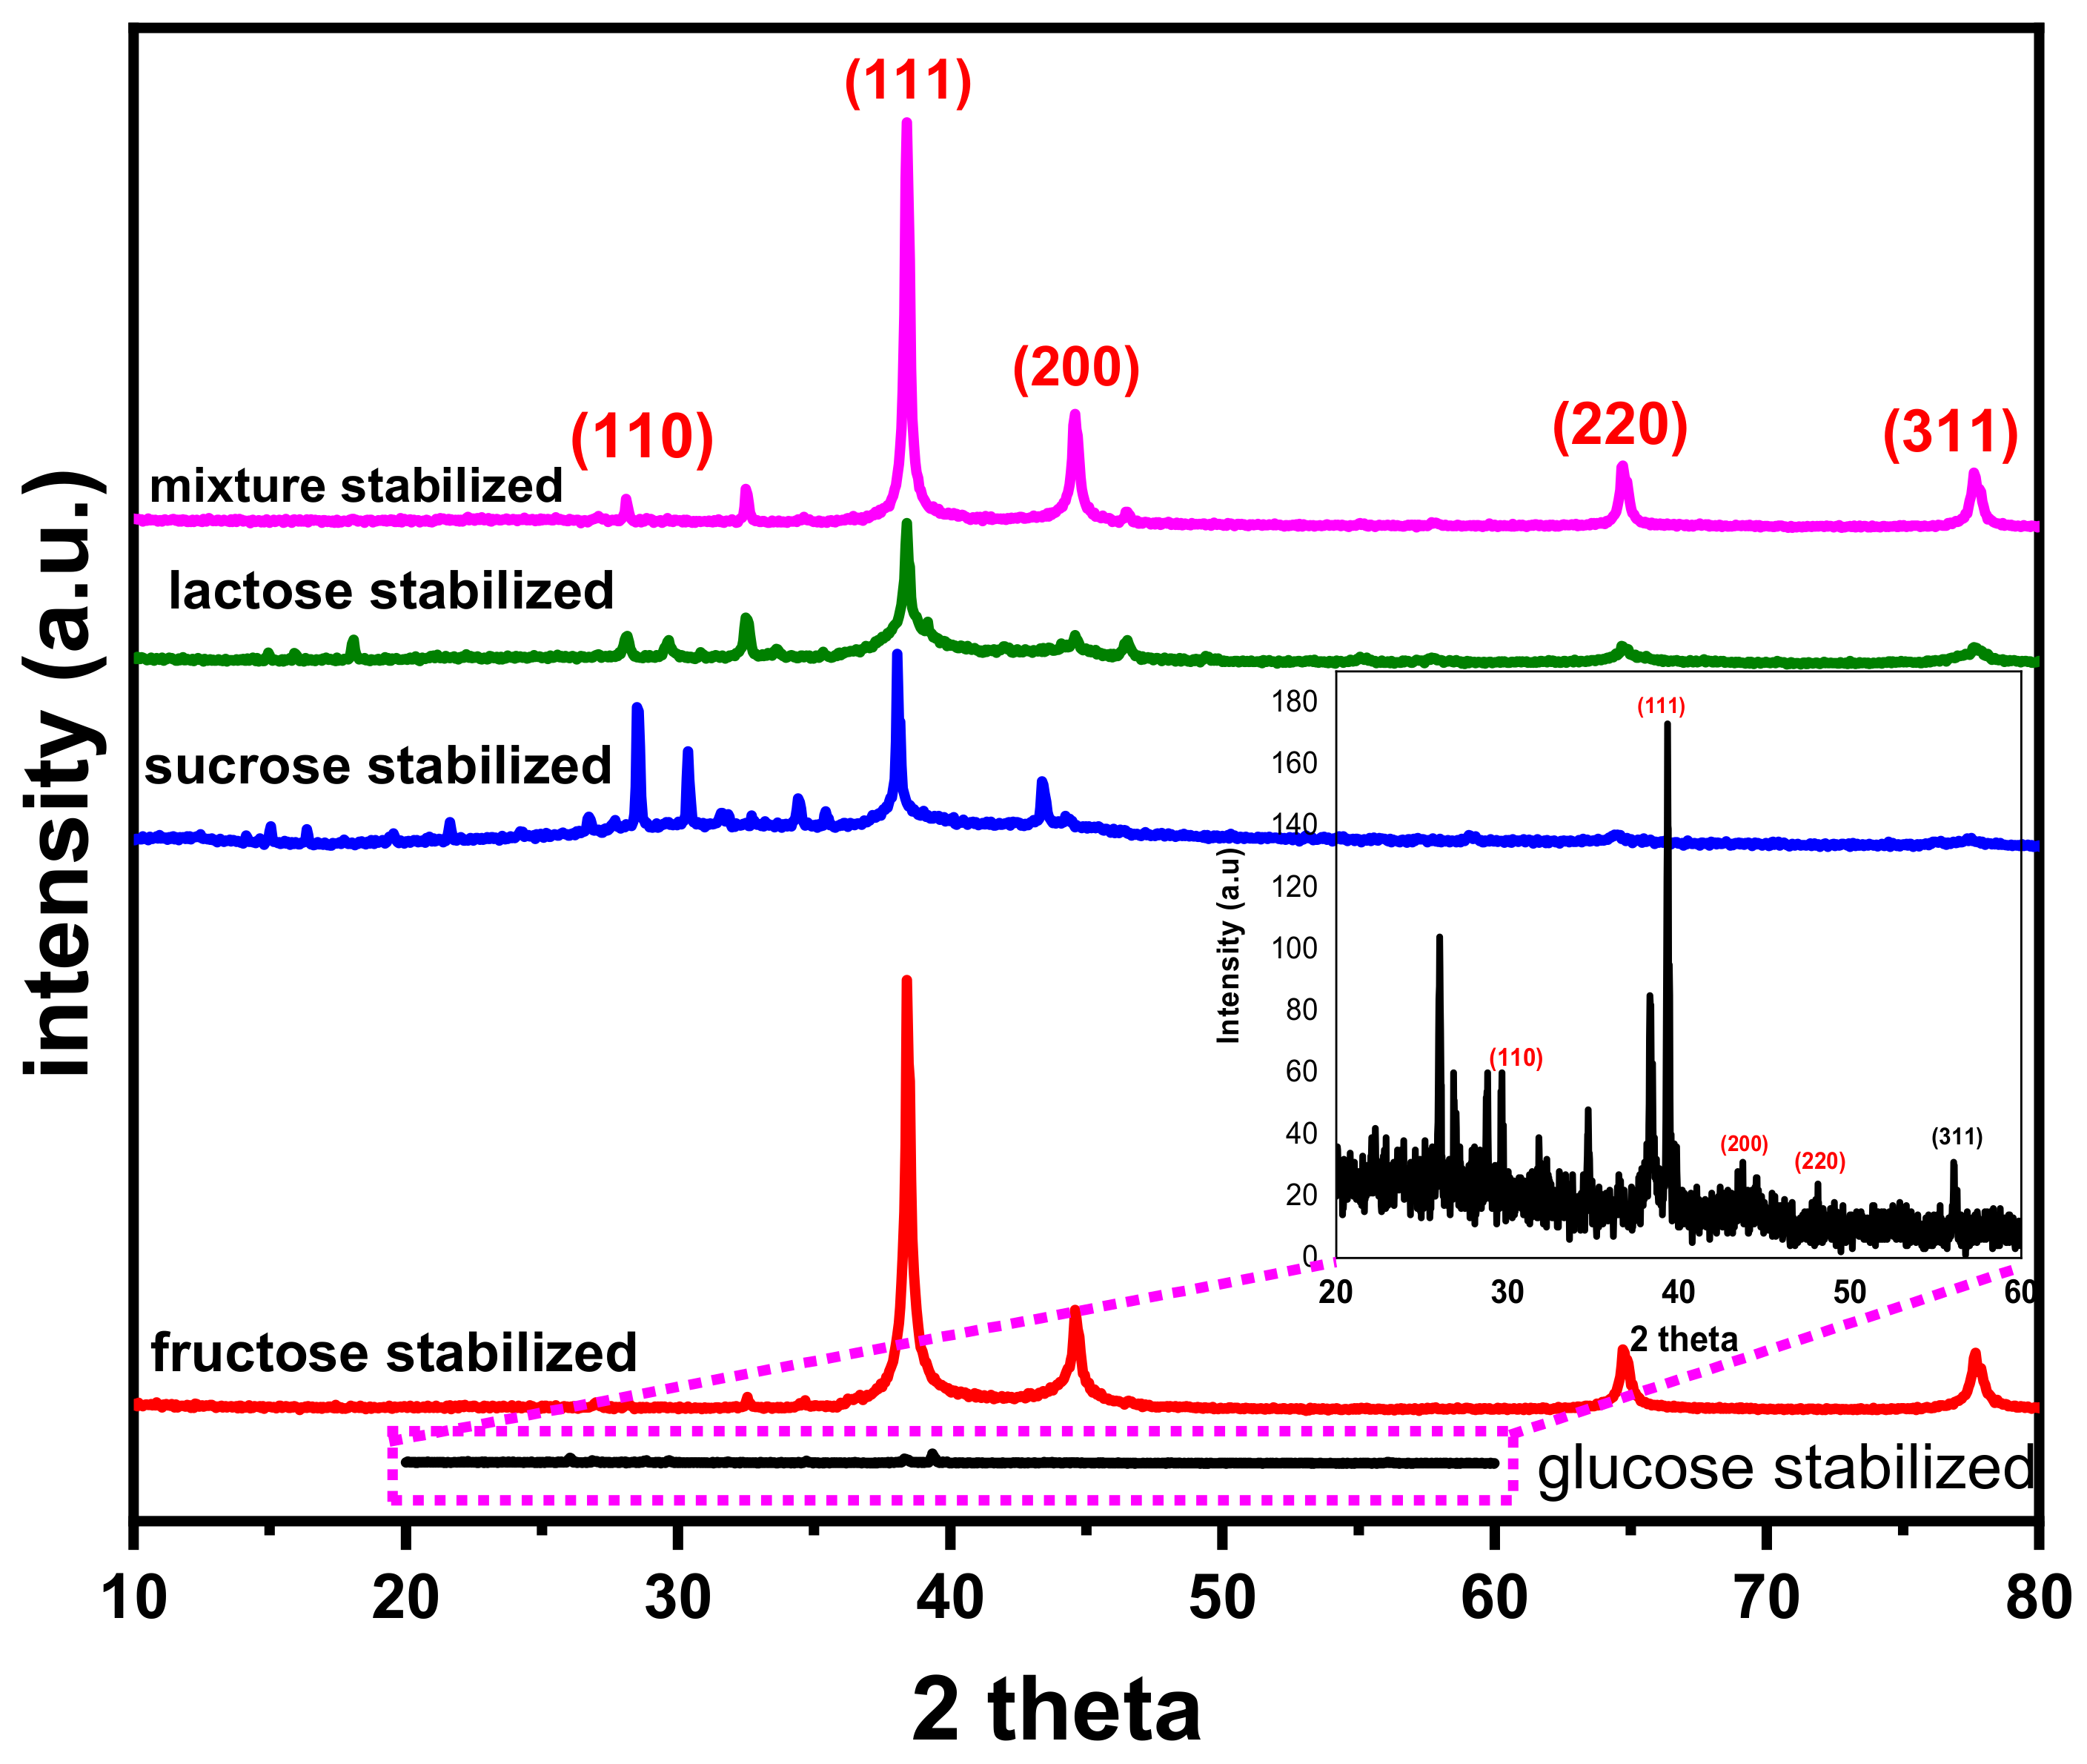
3.4. XRD Analysis
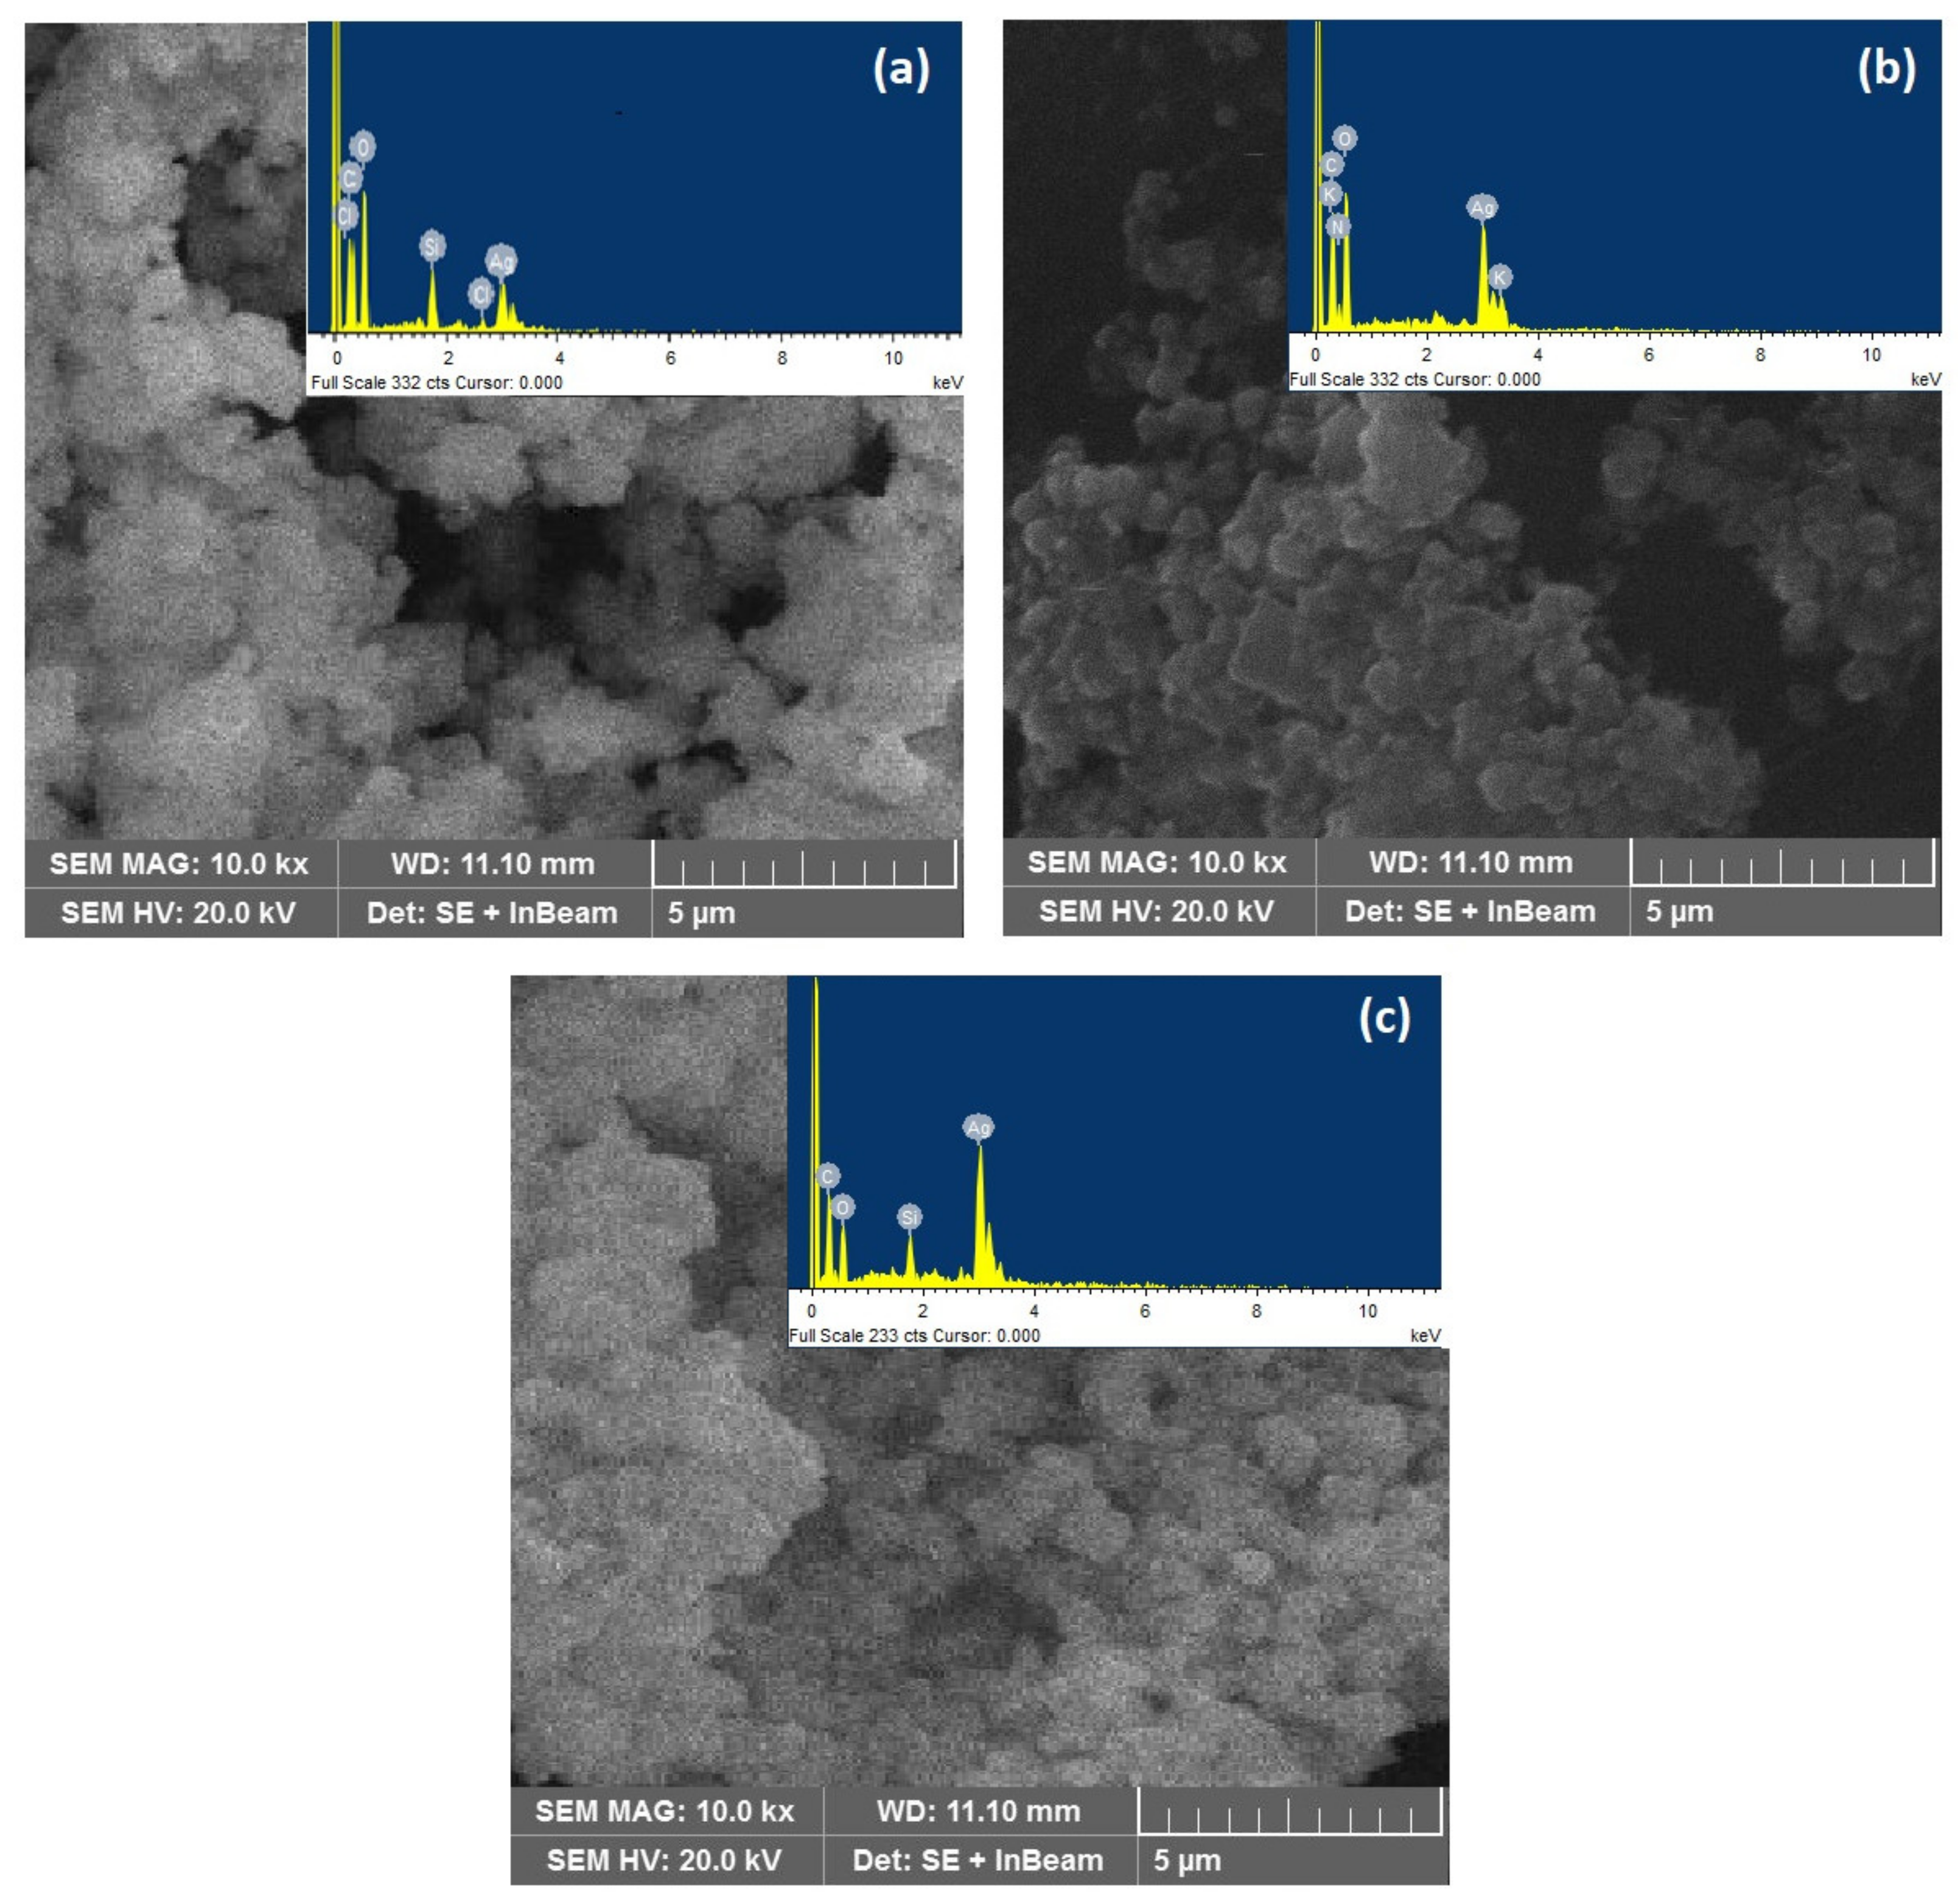
3.5. SEM and EDX Analysis
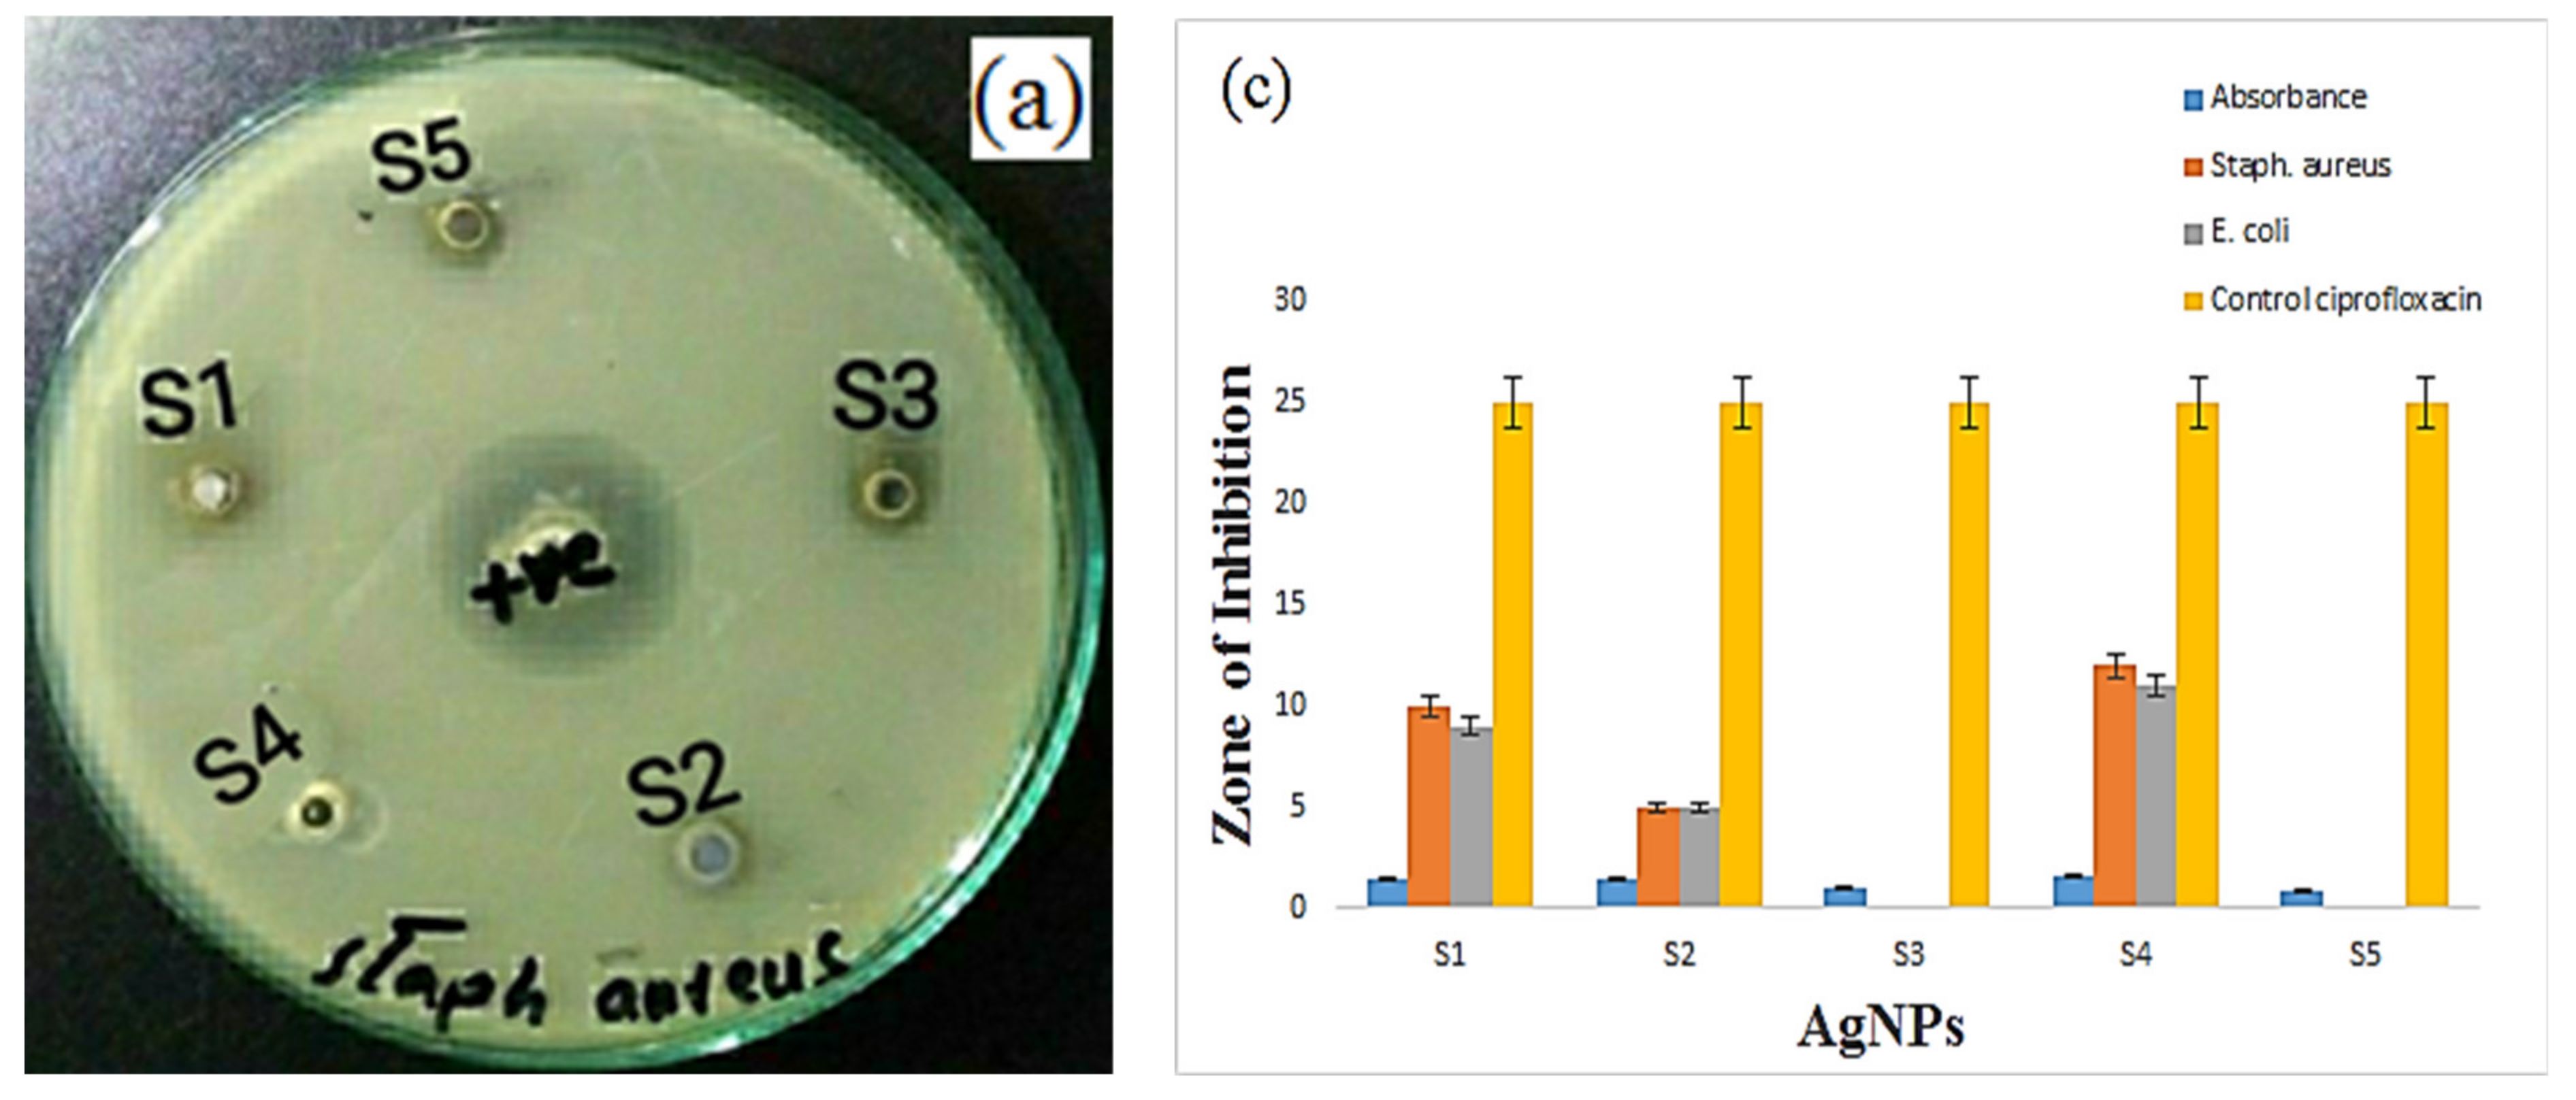
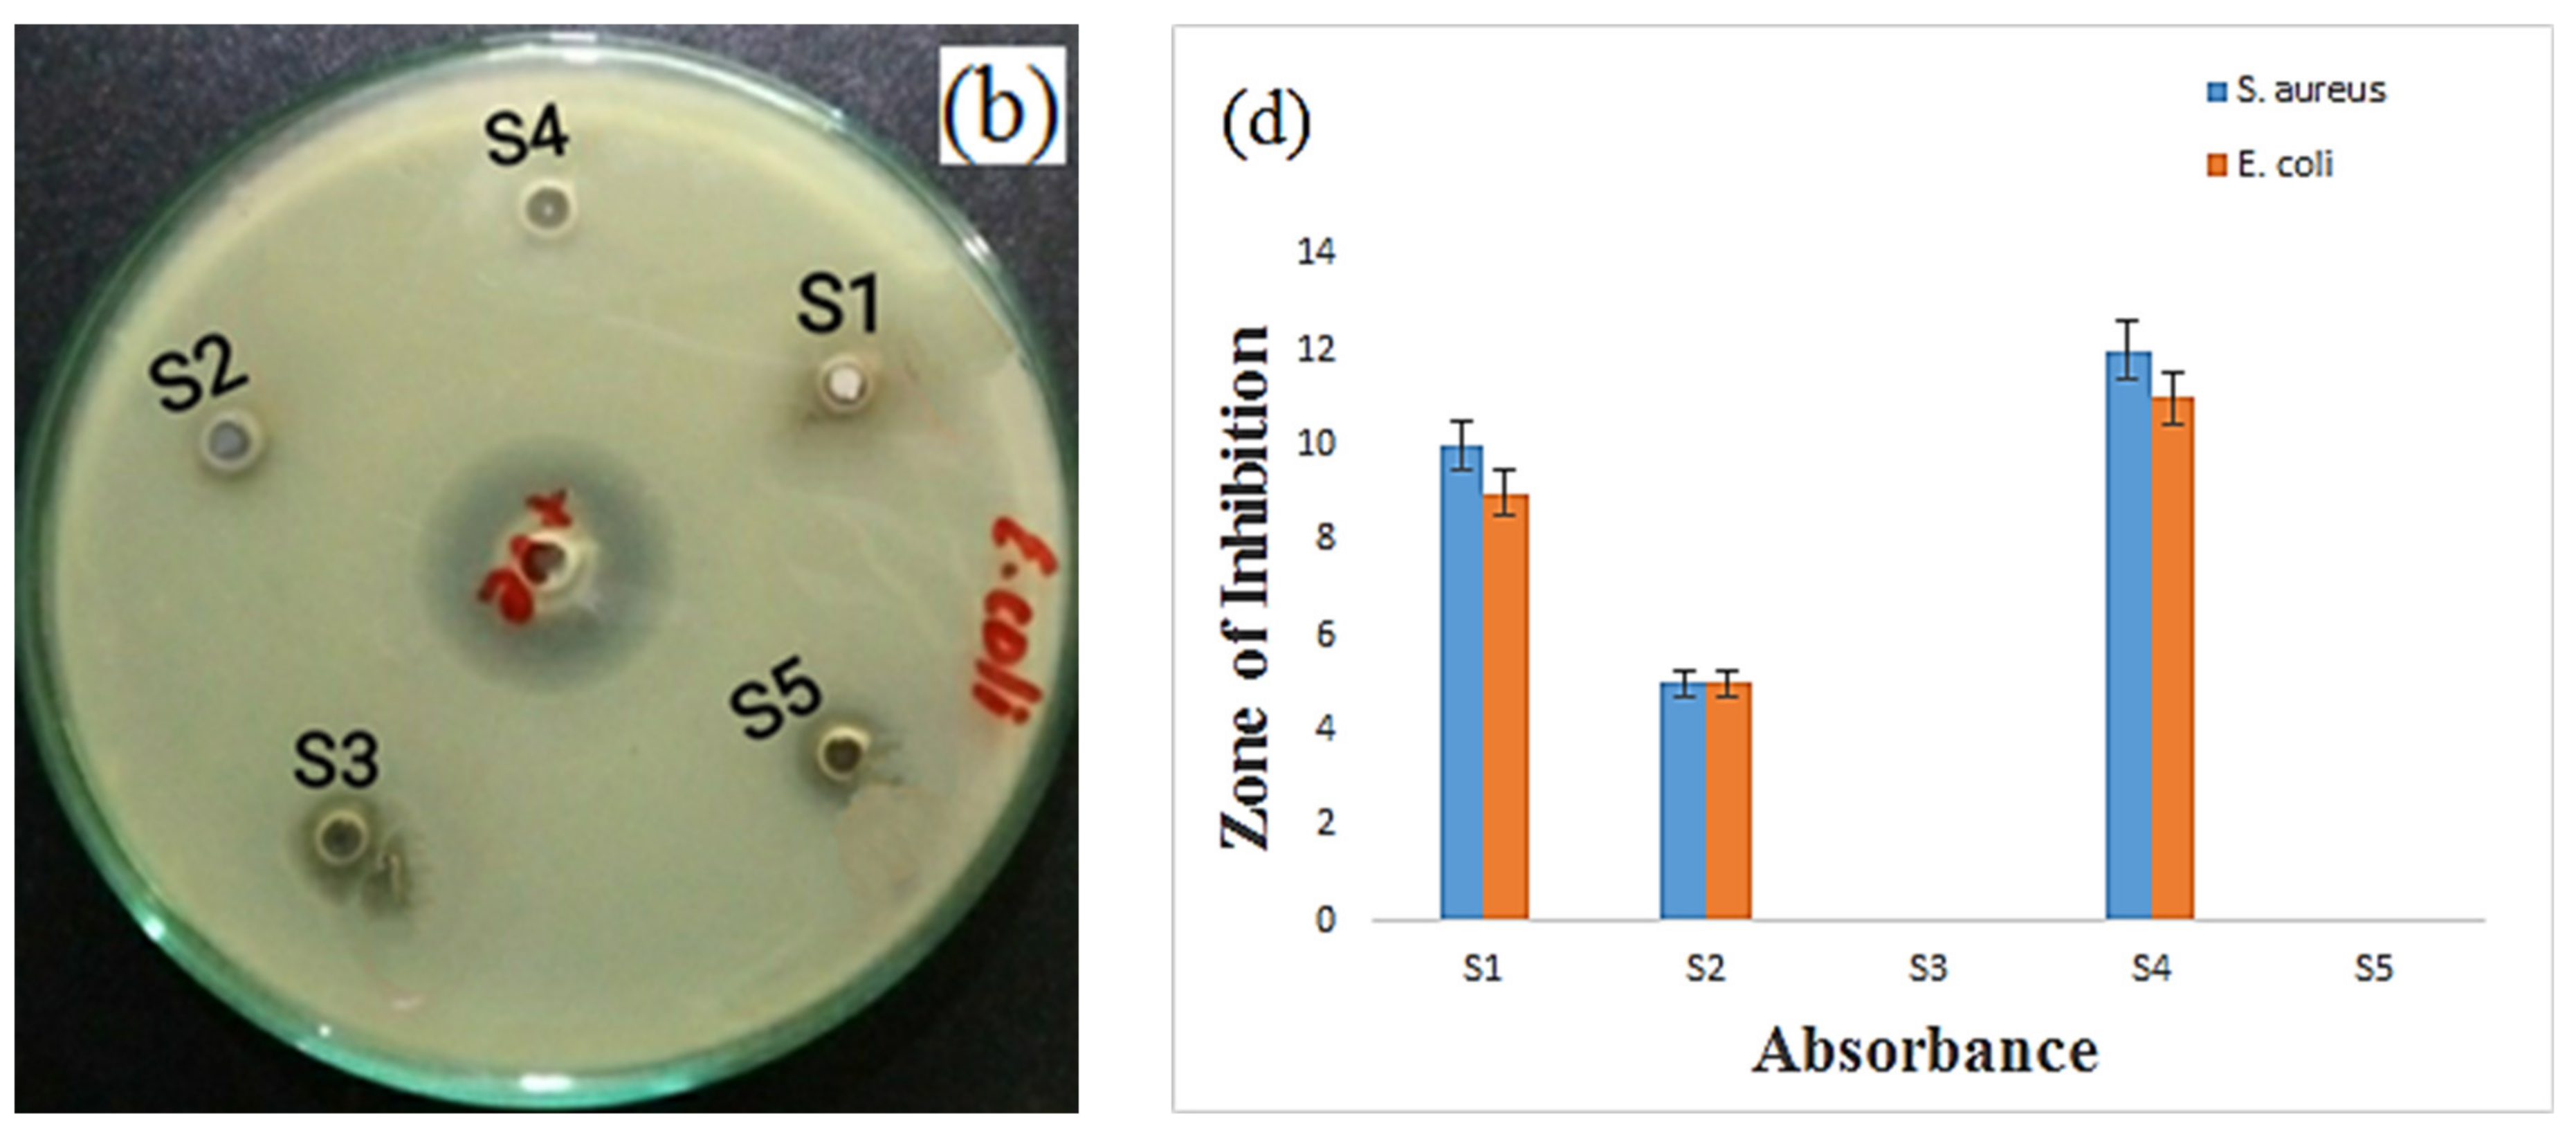
3.6. Antibacterial Activity
3.7. Future Prospects
4. Conclusions
Author Contributions
Funding
Institutional Review Board Statement
Informed Consent Statement
Data Availability Statement
Acknowledgments
Conflicts of Interest
References
- Behbudi, G. Effect of silver nanoparticles disinfectant on covid-19. Adv. Appl. NanoBio-Technol. 2021, 2, 63–67. [Google Scholar]
- Boateng, J.; Catanzano, O. Silver and silver nanoparticle-based antimicrobial dressings. Ther. Dress. Wound Heal. Appl. 2020, 157–184. [Google Scholar]
- Eid, A.M.; Fouda, A.; Niedbała, G.; Hassan, S.E.-D.; Salem, S.S.; Abdo, A.M.; Hetta, H.F.; Shaheen, T.I. Endophytic Streptomyces laurentii mediated green synthesis of Ag-NPs with antibacterial and anticancer properties for developing functional textile fabric properties. Antibiotics 2020, 9, 641. [Google Scholar] [CrossRef] [PubMed]
- LewisOscar, F.; Nithya, C.; Vismaya, S.; Arunkumar, M.; Pugazhendhi, A.; Nguyen-Tri, P.; Alharbi, S.A.; Alharbi, N.S.; Thajuddin, N. In vitro analysis of green fabricated silver nanoparticles (AgNPs) against Pseudomonas aeruginosa PA14 biofilm formation, their application on urinary catheter. Prog. Org. Coat. 2021, 151, 106058. [Google Scholar] [CrossRef]
- Hajji, S.; Salem, R.B.S.-B.; Hamdi, M.; Jellouli, K.; Ayadi, W.; Nasri, M.; Boufi, S. Nanocomposite films based on chitosan–poly (vinyl alcohol) and silver nanoparticles with high antibacterial and antioxidant activities. Process. Saf. Environ. Prot. 2017, 111, 112–121. [Google Scholar] [CrossRef]
- Wu, S.; Tan, N.; Lan, D.; Au, C.-T.; Yi, B. Hydrothermal Fabricated Ag Nanoparticles-decorated Reduced Graphene Oxide Composite for H2O2 Electrochemical Detection. Int. J. Electrochem. Sci. 2020, 15, 6155–6164. [Google Scholar] [CrossRef]
- Ayyaz, M.; Shukrullah, S.; Naz, M.Y.; AbdEl-Salam, N.M.; Ibrahim, K.A.; Mohamed, H.F. Microwave Plasma Assisted Sol-Gel Synthesis of TiO2 Photocatalyst for DC Plasma Jet Driven Degradation of Methylene Blue. ChemistrySelect 2021, 6, 3229–3239. [Google Scholar] [CrossRef]
- Korkmaz, N.; Akar, K.B.; İmamoğlu, R.; Kısa, D.; Karadağ, A. Synthesis of silver nanowires in a two-phase system for biological applications. Appl. Organomet. Chem. 2021, 35, e6213. [Google Scholar] [CrossRef]
- Nakamura, S.; Ando, N.; Sato, M.; Ishihara, M. Ultraviolet Irradiation Enhances the Microbicidal Activity of Silver Nanoparticles by Hydroxyl Radicals. Int. J. Mol. Sci. 2020, 21, 3204. [Google Scholar] [CrossRef]
- Tran, L.T.; Tran, H.V.; Dang, H.T.M.; Huynh, C.D.; Mai, T.A. Silver nanoparticles decorated polyaniline nanowires-based electrochemical DNA sensor: Two-step electrochemical synthesis. J. Electrochem. Soc. 2020, 167, 087508. [Google Scholar] [CrossRef]
- Erol, K.; Bolat, M.; Tatar, D.; Nigiz, C.; Köse, D.A. Synthesis, characterization and antibacterial application of silver nanoparticle embedded composite cryogels. J. Mol. Struct. 2019, 1200, 127060. [Google Scholar] [CrossRef]
- Ahmad, I.; Shukrullah, S.; Ahmad, M.; Ahmed, E.; Naz, M.Y.; Akhtar, M.S.; Khalid, N.; Hussain, A.; Hussain, I. Effect of Al doping on the photocatalytic activity of ZnO nanoparticles decorated on CNTs and graphene: Solvothermal synthesis and study of experimental parameters. Mater. Sci. Semicond. Process. 2020, 123, 105584. [Google Scholar] [CrossRef]
- Salem, J.K.; Draz, M.A. Synthesis and application of silver nanorods for the colorimetric detection of sulfate in water. Inorg. Chem. Commun. 2020, 116, 107900. [Google Scholar] [CrossRef]
- Ayyaz, M.; Naz, M.; Shukrullah, S.; Altaf, N. Microwave Plasma Assisted Sol-gel Technique for Synthesis of TiO2 Nanoparticles: A Recent Study. Newest Updates Phys. Sci. Res. 2021, 6, 67–77. [Google Scholar]
- Hemmati, S.; Harris, M.T.; Barkey, D.P. Polyol Silver Nanowire Synthesis and the Outlook for a Green Process. J. Nanomater. 2020, 2020, 1–25. [Google Scholar] [CrossRef]
- Saratale, R.G.; Saratale, G.D.; Cho, S.-K.; Ghodake, G.; Kadam, A.; Kumar, S.; Mulla, S.I.; Kim, D.S.; Jeon, B.H.; Chang, J.S.; et al. Phyto-fabrication of silver nanoparticles by Acacia nilotica leaves: Investigating their antineoplastic, free radical scavenging potential and application in H2O2 sensing. J. Taiwan Inst. Chem. Eng. 2019, 99, 239–249. [Google Scholar] [CrossRef]
- Saratale, R.G.; Shin, H.-S.; Kumar, G.; Benelli, G.; Ghodake, G.S.; Jiang, Y.Y.; Kim, D.S.; Saratale, G.D. Exploiting fruit byproducts for eco-friendly nanosynthesis: Citrus × clementina peel extract mediated fabrication of silver nanoparticles with high efficacy against microbial pathogens and rat glial tumor C6 cells. Environ. Sci. Pollut. Res. 2017, 25, 10250–10263. [Google Scholar] [CrossRef] [PubMed]
- Parham, S.; Kharazi, A.Z.; Bakhsheshi-Rad, H.R.; Ghayour, H.; Ismail, A.F.; Nur, H.; Berto, F. Electrospun Nano-Fibers for Biomedical and Tissue Engineering Applications: A Comprehensive Review. Materials 2020, 13, 2153. [Google Scholar] [CrossRef]
- Shukrullah, S.; Ayyaz, M.; Naz, M.Y.; Ibrahim, K.A.; AbdEl-Salam, N.M.; Mohamed, H.F. Post-synthesis plasma processing and activation of TiO2 photocatalyst for the removal of synthetic dyes from industrial wastewater. Appl. Phys. A 2021, 127, 1–10. [Google Scholar] [CrossRef]
- Kumar, S.V.; Bafana, A.P.; Pawar, P.; Rahman, A.; Dahoumane, S.A.; Jeffryes, C.S. High conversion synthesis of <10 nm starch-stabilized silver nanoparticles using microwave technology. Sci. Rep. 2018, 8, 1–10. [Google Scholar]
- Shukrullah, S.; Naz, M.Y.; Altaf, N.U.H.; Ali, A. Effect of DC voltage on morphology and size distribution of silver nanorods synthesized through plasma-liquid interaction method. Mater. Today Proc. 2020, 47, S46–S49. [Google Scholar]
- Kiran, G.S.; Selvin, J.; Manilal, A.; Sujith, S. Biosurfactants as green stabilizers for the biological synthesis of nanoparticles. Crit. Rev. Biotechnol. 2010, 31, 354–364. [Google Scholar] [CrossRef] [PubMed]
- BBrycki, B.; Szulc, A.; Babkova, M. Synthesis of Silver Nanoparticles with Gemini Surfactants as Efficient Capping and Stabilizing Agents. Appl. Sci. 2020, 11, 154. [Google Scholar] [CrossRef]
- Saravanakumar, K.; Hu, X.; Chelliah, R.; Oh, D.-H.; Kathiresan, K.; Wang, M.-H. Biogenic silver nanoparticles-polyvinylpyrrolidone based glycerosomes coating to expand the shelf life of fresh-cut bell pepper (Capsicum annuum L. var. grossum (L.) Sendt). Postharvest Biol. Technol. 2019, 160, 111039. [Google Scholar] [CrossRef]
- Ayyaz, M.; Huda, N.U.; Rasool, F.; Sami-Ur-Rehman, H.; Mehmood, A.; Naz, M.Y.; Shukrullah, S.; Ghaffar, A. Effects of pure and mixed stabilizers on opto-electrical properties and morphology of TiO2 nanoparticles synthesized by sol-gel method. IOP Conf. Series Mater. Sci. Eng. 2020, 863, 012029. [Google Scholar] [CrossRef]
- Hamouda, R.A.; El-Mongy, M.A.; Eid, K.F. Comparative study between two red algae for biosynthesis silver nanoparticles capping by SDS: Insights of characterization and antibacterial activity. Microb. Pathog. 2019, 129, 224–232. [Google Scholar] [CrossRef] [PubMed]
- Iqbal, M.; Zafar, H.; Mahmood, A.; Niazi, M.B.K.; Aslam, M.W. Starch-Capped Silver Nanoparticles Impregnated into Propylamine-Substituted PVA Films with Improved Antibacterial and Mechanical Properties for Wound-Bandage Applications. Polymers 2020, 12, 2112. [Google Scholar] [CrossRef]
- Squeo, G.; De Angelis, D.; Leardi, R.; Summo, C.; Caponio, F. Background, Applications and Issues of the Experimental Designs for Mixture in the Food Sector. Foods 2021, 10, 1128. [Google Scholar] [CrossRef]
- Nunes, N.D.S.; Carneiro, L.L.; De Menezes, L.H.S.; De Carvalho, M.S.; Pimentel, A.B.; Silva, T.P.; Pacheco, C.S.V.; Tavares, I.M.D.C.; Santos, P.H.; Das Chagas, T.P.; et al. Simplex-Centroid Design and Artificial Neural Network-Genetic Algorithm for the Optimization of Exoglucanase Production by Penicillium Roqueforti ATCC 10110 Through Solid-State Fermentation Using a Blend of Agroindustrial Wastes. BioEnergy Res. 2020, 13, 1130–1143. [Google Scholar] [CrossRef]
- Beg, S. Mixture Designs and Their Applications in Pharmaceutical Product Development. In Design of Experiments for Pharmaceutical Product Development; Springer: Singapore, 2021; pp. 87–96. [Google Scholar]
- Zhai, L.; Lu, Y.; Chen, D.; Chen, X.; Liu, L.; Li, C. Increase the rate of plasma-assisted synthesis of silver nanoparticles through additives. E3S Web Conf. 2021, 237, 01028. [Google Scholar] [CrossRef]
- Altaf, N.; Naz, M.; Shukrullah, S.; Bhatti, H. Testing of photocatalytic potential of silver nanoparticles produced through nonthermal plasma reduction reaction and stabilized with saccharides. Main Group Chem. Preprint 2021, 1–14. [Google Scholar] [CrossRef]
- Ibrahim, S.; Ahmad, Z.; Manzoor, M.Z.; Mujahid, M.; Faheem, Z.; Adnan, A. Optimization for biogenic microbial synthesis of silver nanoparticles through response surface methodology, characterization, their antimicrobial, antioxidant, and catalytic potential. Sci. Rep. 2021, 11, 1–18. [Google Scholar] [CrossRef] [PubMed]
- Azmi, S.N.H.; Al-Jassasi, B.M.H.; Al-Sawafi, H.M.S.; Al-Shukaili, S.H.G.; Rahman, N.; Nasir, M. Optimization for synthesis of silver nanoparticles through response surface methodology using leaf extract of Boswellia sacra and its application in antimicrobial activity. Environ. Monit. Assess. 2021, 193, 1–16. [Google Scholar] [CrossRef]
- Berkani, M.; Kadmi, Y.; Bouchareb, M.K.; Bouhelassa, M.; Bouzaza, A. Combinatıon of a Box-Behnken design technique with response surface methodology for optimization of the photocatalytic mineralization of C.I. Basic Red 46 dye from aqueous solution. Arab. J. Chem. 2020, 13, 8338–8346. [Google Scholar] [CrossRef]
- Mahmoud, G.A.-E.; Bashandy, S.R. Nitrogen, Amino Acids, and Carbon as Control Factors of Riboflavin Production by Novosphingobium panipatense-SR3 (MT002778). Curr. Microbiol. 2021, 78, 1577–1589. [Google Scholar] [CrossRef]
- Alkholief, M. Optimization of Lecithin-Chitosan nanoparticles for simultaneous encapsulation of doxorubicin and piperine. J. Drug Deliv. Sci. Technol. 2019, 52, 204–214. [Google Scholar]
- Barabadi, H.; Honary, S.; Ebrahimi, P.; Alizadeh, A.; Naghibi, F.; Saravanan, M. Optimization of myco-synthesized silver nanoparticles by response surface methodology employing Box-Behnken design. Inorg. Nano-Metal Chem. 2019, 49, 33–43. [Google Scholar]
- Sheng, Z.; Li, J.; Li, Y. Optimization of ultrasonic-assisted extraction of phillyrin from Forsythia suspensa using response surface methodology. J. Med. Plants Res. 2012, 6, 1633–1644. [Google Scholar]
- Aydin, I.; Ertekin, K.; Oncuoglu, S.; Hizliates, C.G. Manipulating spectral properties of the Hg (II) sensitive carbazole-oxadiazole derivative by silver nanoparticles: Two different sensing mechanisms for the same probe. Opt. Mater. 2021, 115, 111030. [Google Scholar] [CrossRef]
- Mirzaei, S.Z.; Lashgarian, H.E.; Karkhane, M.; Shahzamani, K.; Alhameedawi, A.K.; Marzban, A. Bio-inspired silver selenide nano-chalcogens using aqueous extract of Melilotus officinalis with biological activities. Bioresour. Bioprocess. 2021, 8, 1–11. [Google Scholar] [CrossRef]
- Kondeti, V.S.S.K.; Gangal, U.; Yatom, S.; Bruggeman, P. Ag+ reduction and silver nanoparticle synthesis at the plasma–liquid interface by an RF driven atmospheric pressure plasma jet: Mechanisms and the effect of surfactant. J. Vac. Sci. Technol. A 2017, 35, 061302. [Google Scholar] [CrossRef]
- Khan, A.; Khan, R.A.; Salmieri, S.; Le Tien, C.; Riedl, B.; Bouchard, J.; Chauve, G.; Tan, V.; Kamal, M.R.; Lacroix, M. Mechanical and barrier properties of nanocrystalline cellulose reinforced chitosan based nanocomposite films. Carbohydr. Polym. 2012, 90, 1601–1608. [Google Scholar] [CrossRef]
- Ansar, S.; Tabassum, H.; Aladwan, N.S.; Ali, M.N.; Almaarik, B.; AlMahrouqi, S.; Abudawood, M.; Banu, N.; Alsubki, R. Eco friendly silver nanoparticles synthesis by Brassica oleracea and its antibacterial, anticancer and antioxidant properties. Sci. Rep. 2020, 10, 1–12. [Google Scholar] [CrossRef]
- Burda, C.; Chen, X.; Narayanan, R.; El-Sayed, M.A. Chemistry and Properties of Nanocrystals of Different Shapes. Chem. Rev. 2005, 105, 1025–1102. [Google Scholar] [CrossRef] [PubMed]
- Lin, L.; Li, X.; Zhou, J.; Zou, J.; Lai, J.; Chen, Z.; Shen, J.; Xu, H. Plasma-aided green and controllable synthesis of silver nanoparticles and their compounding with gemini surfactant. J. Taiwan Inst. Chem. Eng. 2021, 122, 311–319. [Google Scholar] [CrossRef]
- Meshram, S.M.; Bonde, S.R.; Gupta, I.R.; Gade, A.K.; Rai, M.K. Green synthesis of silver nanoparticles using white sugar. IET Nanobiotechnol. 2013, 7, 28–32. [Google Scholar] [CrossRef] [PubMed]
- Wahab, S.; Khan, T.; Adil, M.; Khan, A. Mechanistic aspects of plant-based silver nanoparticles against multi-drug resistant bacteria. Heliyon 2021, 7, e07448. [Google Scholar] [CrossRef]
- Abdelsattar, A.; Nofal, R.; Makky, S.; Safwat, A.; Taha, A.; El-Shibiny, A. The Synergistic Effect of Biosynthesized Silver Nanoparticles and Phage ZCSE2 as a Novel Approach to Combat Multidrug-Resistant Salmonella enterica. Antibiotics 2021, 10, 678. [Google Scholar] [CrossRef]
- Ghramh, H.A.; Khan, K.A.; Ibrahim, E.H.; Ansari, M.J. Biogenic synthesis of silver nanoparticles using propolis extract, their characterization, and biological activities. Sci. Adv. Mater. 2019, 11, 876–883. [Google Scholar] [CrossRef]
- Sahoo, P.K.; Kamal, S.S.K.; Kumar, T.J.; Sreedhar, B.; Singh, A.K.; Srivastava, S.K. Synthesis of Silver Nanoparticles using Facile Wet Chemical Route. Def. Sci. J. 2009, 59, 447–455. [Google Scholar] [CrossRef]
- Hassanien, A.S.; Khatoon, U.T. Synthesis and characterization of stable silver nanoparticles, Ag-NPs: Discussion on the applications of Ag-NPs as antimicrobial agents. Phys. B Condens. Matter 2018, 554, 21–30. [Google Scholar] [CrossRef]
- Ashraf, S.; Abbasi, A.Z.; Pfeiffer, C.; Hussain, S.Z.; Khalid, Z.M.; Gil, P.R.; Parak, W.J.; Hussain, I. Protein-mediated synthesis, pH-induced reversible agglomeration, toxicity and cellular interaction of silver nanoparticles. Colloids Surf. B Biointerfaces 2013, 102, 511–518. [Google Scholar] [CrossRef]
- Bezza, F.A.; Tichapondwa, S.M.; Chirwa, E.M. Synthesis of biosurfactant stabilized silver nanoparticles, characterization and their potential application for bactericidal purposes. J. Hazard. Mater. 2020, 393, 122319. [Google Scholar] [CrossRef] [PubMed]
- Wang, J.; Jiu, J.; Zhang, S.; Sugahara, T.; Nagao, S.; Suganuma, K.; He, P. The comprehensive effects of visible light irradiation on silver nanowire transparent electrode. Nanotechnology 2018, 29, 435701. [Google Scholar] [CrossRef]
- Devanesan, S.; AlSalhi, M.S. Green Synthesis of Silver Nanoparticles Using the Flower Extract of Abelmoschus esculentus for Cytotoxicity and Antimicrobial Studies. Int. J. Nanomed. 2021, 16, 3343–3356. [Google Scholar] [CrossRef] [PubMed]


| Stabilizing/Capping Agents 5-Levels | Absorbance at 302 nm Experimental | Response | ||||
|---|---|---|---|---|---|---|
| Run | Glucose (A) | Fructose (B) | Sucrose (C) | Lactose (D) | Predicted | |
| 1 | 0 | 2 | 0 | 0 | 1.488 | 1.329 |
| 2 | −2 | 0 | 0 | 0 | 0.570 | 0.495 |
| 3 | 0 | −2 | 0 | 0 | 1.438 | 1.531 |
| 4 | 2 | 0 | 0 | 0 | 0.540 | 0.501 |
| 5 | 0 | 0 | 2 | 0 | 0.285 | 0.212 |
| 6 | 0 | 0 | 0 | 0 | 0.279 | 0.289 |
| 7 | 0 | 0 | −2 | 0 | 1.028 | 1.085 |
| 8 | 0 | 0 | 0 | 0 | 0.640 | 0.501 |
| 9 | 0 | 0 | 0 | −2 | 0.580 | 0.555 |
| 10 | 0 | 0 | 0 | 2 | 0.620 | 1.533 |
| 11 | 1 | 1 | −1 | −1 | 0.011 | −0.124 |
| 12 | 1 | −1 | 1 | −1 | 0.570 | 0.581 |
| 13 | 1 | 1 | −1 | 1 | 0.670 | 0.688 |
| 14 | 1 | 1 | 1 | −1 | 0.590 | 0.600 |
| 15 | 0 | 0 | 0 | 0 | 0.350 | 0.352 |
| 16 | −1 | −1 | −1 | −1 | 1.626 | 1.534 |
| 17 | 1 | −1 | −1 | 1 | 0.500 | 0.501 |
| 18 | 0 | 0 | 0 | 0 | 0.270 | 0.280 |
| 19 | −1 | 1 | 1 | 1 | 0.493 | 0.491 |
| 20 | −1 | −1 | 1 | 1 | 0.037 | 1.122 |
| 21 | 1 | −1 | 1 | 1 | 0.83 | 0.811 |
| 22 | −1 | −1 | −1 | 1 | 0.570 | 0.495 |
| 23 | −1 | 1 | −1 | 1 | 0.395 | 0.300 |
| 24 | −1 | 1 | −1 | −1 | 0.871 | 0.844 |
| 25 | 1 | 1 | 1 | 1 | 0.395 | 0.394 |
| 26 | −1 | 1 | 1 | −1 | 0.300 | 0.305 |
| 27 | 0 | 0 | 0 | 0 | 0.041 | 0.042 |
| 28 | 0 | 0 | 0 | 0 | 0.011 | −0.124 |
| 29 | 1 | −1 | −1 | −1 | 0.041 | −0.020 |
| 30 | 1 | −1 | 1 | −1 | 0.037 | 0.004 |
| Variables | Coefficients | Main Effect | t-Stat | p-Value | C.I (%) |
|---|---|---|---|---|---|
| Intercept | 0.395 | 0.790 | 8.816 | 0.000 | 100.000 |
| Glucose (A) | −0.028 | −0.056 | −1.260 | 0.032 | 96.754 |
| Fructose (B) | 0.247 | 0.494 | 11.024 | 0.000 | 100.000 |
| Sucrose (C) | 0.330 | 0.660 | 14.80 | 0.000 | 100.000 |
| Lactose (D) | −0.053 | −0.106 | −2.367 | 0.228 | 77.279 |
| AB | −0.095 | −0.190 | −3.469 | 0.003 | 99.657 |
| AC | −0.013 | −0.025 | −0.457 | 0.564 | 34.639 |
| AD | 0.091 | 0.182 | 3.324 | 0.005 | 99.538 |
| BC | −0.024 | −0.047 | −0.959 | 0.404 | 59.603 |
| BD | −0.026 | −0.053 | −0.859 | 0.343 | 65.724 |
| CD | −0.054 | −0.108 | −1.965 | 0.068 | 93.179 |
| AA = A2 | 0.011 | 0.022 | 0.525 | 0.000 | 99.960 |
| BB = B2 | 0.095 | 0.190 | 4.534 | 0.706 | 39.235 |
| CC = C2 | 0.199 | 0.238 | 5.694 | 0.000 | 99.996 |
| DD = D2 | 0.000 | 0.000 | 0.000 | 1.000 | 0.039 |
| Source | Degree of Freedom | Sum of Squares | Mean Sum of Squares | Level of Significance (p-Value) | F-Value |
|---|---|---|---|---|---|
| Regression | 14 | 5.094 | 0.364 | 0.000 | 30.201 |
| Residual | 15 | 0.081 | 0.013 | ||
| Total | 29 | 5.275 |
| Assays | Sample Description (AgNPs) | 2 Theta (°) | Particle Size (nm) |
|---|---|---|---|
| Run 1 | Sucrose stabilized | 43.85 | 12 nm |
| Run 3 | Glucose stabilized | 24.934 | 10 nm |
| Run 7 | Lactose stabilized | 22.983 | 9.45 nm |
| Run 16 | Mixture of four stabilizers | 48.66 | 15 nm |
| Run 24 | Fructose stabilized | 34.03 | 11 nm |
| Experimental Run | Silver (Ag) | Oxygen (O) | Carbon (C) | |||
|---|---|---|---|---|---|---|
| Weight (%) | Atomic (%) | Weight (%) | Atomic (%) | Weight (%) | Atomic (%) | |
| Run 3 | 33.34 | 6.67 | 39.00 | 52.57 | 19.27 | 34.60 |
| Run 24 | 43.74 | 9.79 | 29.74 | 44.87 | 14.89 | 29.92 |
| Run 1 | 45.40 | 10.63 | 29.18 | 46.05 | 17.88 | 37.58 |
| Run 7 | 36.39 | 6.78 | 31.66 | 39.77 | 31.95 | 53.45 |
| Run 16 | 69.81 | 24.45 | 16.48 | 38.91 | 10.11 | 31.80 |
| Sample | Runs | Absorbance | Staph aureus | E. coli | Control Ciprofloxacin |
|---|---|---|---|---|---|
| S1 | 1 | 1.488 | 10 mm | 9 mm | 25 mm |
| S2 | 3 | 1.438 | 5 mm | 5 mm | 25 mm |
| S3 | 7 | 1.028 | 4 mm | 2 mm | 25 mm |
| S4 | 16 | 1.626 | 12 mm | 11 mm | 25 mm |
| S5 | 24 | 0.871 | 5 mm | 4 mm | 25 mm |
Publisher’s Note: MDPI stays neutral with regard to jurisdictional claims in published maps and institutional affiliations. |
© 2021 by the authors. Licensee MDPI, Basel, Switzerland. This article is an open access article distributed under the terms and conditions of the Creative Commons Attribution (CC BY) license (https://creativecommons.org/licenses/by/4.0/).
Share and Cite
Altaf, N.U.H.; Naz, M.Y.; Shukrullah, S.; Bhatti, H.N.; Irfan, M.; Alsaiari, M.A.; Rahman, S.; Niazi, U.M.; Glowacz, A.; Proniewska, K.; et al. Statistically Optimized Production of Saccharides Stabilized Silver Nanoparticles Using Liquid–Plasma Reduction Approach for Antibacterial Treatment of Water. Materials 2021, 14, 5841. https://doi.org/10.3390/ma14195841
Altaf NUH, Naz MY, Shukrullah S, Bhatti HN, Irfan M, Alsaiari MA, Rahman S, Niazi UM, Glowacz A, Proniewska K, et al. Statistically Optimized Production of Saccharides Stabilized Silver Nanoparticles Using Liquid–Plasma Reduction Approach for Antibacterial Treatment of Water. Materials. 2021; 14(19):5841. https://doi.org/10.3390/ma14195841
Chicago/Turabian StyleAltaf, Noor Ul Huda, Muhammad Yasin Naz, Shazia Shukrullah, Haq Nawaz Bhatti, Muhammad Irfan, Mabkhoot A. Alsaiari, Saifur Rahman, Usama Muhammad Niazi, Adam Glowacz, Klaudia Proniewska, and et al. 2021. "Statistically Optimized Production of Saccharides Stabilized Silver Nanoparticles Using Liquid–Plasma Reduction Approach for Antibacterial Treatment of Water" Materials 14, no. 19: 5841. https://doi.org/10.3390/ma14195841